Development of chitosan-based microparticles for pulmonary ... · microparticles for pulmonary drug...
98
Renato Manuel Pereira Cabral Licenciado em Ciências de Engenharia Química e Bioquímica Development of chitosan-based microparticles for pulmonary drug delivery Dissertação para obtenção do Grau de Mestre em Engenharia Química e Bioquímica Orientadora: Prof. Doutora Ana Isabel Nobre Martins Aguiar de Oliveira Ricardo, FCT-UNL Co-Orientadora: Doutora Teresa Maria Alves Casimiro Ribeiro, FCT-UNL Júri: Presidente: Prof. Doutora Maria da Ascensão Carvalho Fernandes Miranda Reis Arguente: Doutor Márcio Milton Nunes Temtem Vogais: Prof. Doutora Ana Isabel Nobre Martins Aguiar de Oliveira Ricardo Doutora Teresa Maria Alves Casimiro Ribeiro Setembro 2013
Transcript of Development of chitosan-based microparticles for pulmonary ... · microparticles for pulmonary drug...

Renato Manuel Pereira Cabral
Licenciado em Ciências de Engenharia Química e Bioquímica
Development of chitosan-based microparticles for pulmonary drug
delivery
Dissertação para obtenção do Grau de Mestre em Engenharia Química e Bioquímica
Orientadora: Prof. Doutora Ana Isabel Nobre Martins Aguiar de Oliveira Ricardo, FCT-UNL
Co-Orientadora: Doutora Teresa Maria Alves Casimiro Ribeiro, FCT-UNL
Júri:
Presidente: Prof. Doutora Maria da Ascensão Carvalho Fernandes Miranda Reis Arguente: Doutor Márcio Milton Nunes Temtem Vogais: Prof. Doutora Ana Isabel Nobre Martins Aguiar de Oliveira Ricardo
Doutora Teresa Maria Alves Casimiro Ribeiro
Setembro 2013

ii
iii
Development of chitosan-based microparticles for pulmonary
drug delivery
Copyright© Renato Manuel Pereira Cabral, FCT/UNL, FCT
A Faculdade de Ciencias e Tecnologia e a Universidade Nova de Lisboa têm o direito, perpétuo
e sem limites geográficos, de arquivar e publicar esta dissertação através de exemplares
impressos reproduzidos em papel ou de forma digital, ou por qualquer outro meio conhecido ou
que venha a ser inventado, e de a divulgar através de repositórios cientificos e de admitir a sua
cópia e distribuição com objectivos educacionais ou de investigação, não comerciais, desde que
seja dado crédito ao autor e editor.

iv

v
Acknowledgments
The success of this work required a lot of guidance and support from many people. I am
extremely thankfully for having them with me along this journey.
First of all I would like to thank my supervisor, Professor Doctor Ana Aguiar-Ricardo for
giving me the opportunity to develop my MSc project in her laboratory and for all the support
and orientation she gave through this year. Also, to my co-supervisor, Doctor Teresa Casimiro,
for always supervising me with such sympathy and enthusiasm.
Funding from Fundação para a Ciência e Tecnologia (FC&T-Lisbon) through contracts PEst-
C/EQB/LA0006/2011, PTDC/EQU-EQU/116097/2009, Conselho de Reitores das
Universidades Portuguesas (CRUP) through Luso-German Agreement A - 13/ 10 and from
Fundação Calouste Gulbenkian is acknowledged.
I would like to thank to Ana Sousa, who worked directly with me in SAA, for all the friendship
and support.
To all my colleagues from 510 Group: Vanessa Correia, Patrícia Morgado, Telma Barroso, Rita
Restani, Raquel Viveiros, Tiago Reis, Anita Lourenço, Ana Silva and Vasco Bonifácio. Thank
you all for the support, companionship and for making the laboratory work much more relaxed
and fun!
I would like to thank Cláudia Moura for giving great advice and ideas and Ana Paninho for
teaching me the basic steps.
I would also like to thank Dr. Isabel Nogueira for the SEM images and Nuno Costa for the
XRD, DSC and porosimetry assays. Mrs. Maria José Carapinha, Mrs. Conceição and Mrs.
Idalina for all the help and assistance.
To my friends João Marum for keeping me in contact with current affairs, André Guerreiro for
the walks we do together, Tiago Ferreira and Andreia de Almeida for all those dinners and
movies we watched.
I would like to thank to my girlfriend Márcia for supporting me with all her goofiness during
this hard working year and for hearing what I have to say, even if it is a complete nonsense.
Thank you for making me see I was indeed too tired to keep writing and actually needed some
hours of sleep.
To finish I would like to thank all of my family for the joy they give when we are together, but
specially to my mom and dad, Luísa Cabral and Carlos Cabral, for always being present and for
supporting my options all these years, even though they might seem strange to them. Thank you
mom and dad for your love.

vi

vii
Abstract
In this work, novel chitosan (CHT) based microparticles were prepared using supercritical
assisted atomization (SAA) and evaluated as potential carriers for sustained pulmonary drug
delivery. CHT is a polysaccharide comprising of glucosamine and N-acetylglucosamine units, it
is biodegradable, biocompatible and non-toxic being an interesting choice to be used as a drug
carrier for inhalation therapy and belongs to the group of swellable polymers. By utilizing SAA,
spherical microparticles containing a sharp particle distribution were successfully produced.
Ibuprofen (IBP) and bovine serum albumin (BSA) were tested as a model small drug and as a
model protein, respectively, to assess the effect on particle size and morphology when co-
atomized with CHT on the SAA apparatus. The strategy developed in this work was to produce
drug loaded microparticles with suitable aerodynamic characteristics that attain large geometric
diameters when in contact with the lung physiological fluids by polymer swelling, reducing
macrophage clearance. The microparticles produced by this method were characterized by using
Morphologi G3 and Scanning electron microscopy (SEM) to assess their size distribution and
morphology. To characterize the solid state properties of the particles X-ray diffraction (XRD),
differential scanning calorimetry DSC and Fourier transform infrared (FTIR) were used.
Porosity and surface area were determined by mercury and nitrogen porosimetry. In vitro
aerosolization studies using an Andersen Cascade Impactor (ACI) were performed to determine
the average emitted fraction (EF%) and the fine particle fraction (FPF). Drug-release profiles
were determined by in vitro experiments at physiological pH and temperature conditions.
The results obtained in this work show that SAA can be successfully used to prepare chitosan
based formulations with adequate respirable fractions and sustained release of different
bioactive molecules to be administered to the deep lung using dry powder inhalers (DPI).
Keywords: Microparticles; Chitosan; Supercritical assisted atomization; Pulmonary delivery;
Dry powder formulations

viii

ix
Resumo
No presente trabalho desenvolveram-se micropartículas de quitosano (CHT) utilizando
atomização assistida por fluídos supercríticos (SAA). As propriedades das partículas
relativamente à sua aplicação para libertação controlada de fármacos, por administração via
pulmonar, foram avaliadas in vitro.
O CHT é um polissacárido composto por unidades de glucosamina e N-acetilglucosamina, é
biodegradável, biocompatível e não tóxico. Utilizando o SAA foi possível obter micropartículas
esféricas. Os compostos ibuprofeno (IBP) e albumina do soro bovino (BSA) foram testadas
como modelo de um fármaco de pequeno peso molecular e de uma proteína com elevado peso
molecular, respectivamente, de forma a determinar o seu efeito no tamanho de partícula e na sua
morfologia quando co-atomizadas com CHT. A estratégia desenvolvida neste trabalho foi a de
produção de micropartículas carregadas com um fármaco que possuem características
aerodinâmicas desejadas para inalação quando administradas utilizando inaladores de pós secos
(dry powder inhaler, DPI) e que atinjam maiores diâmetros por inchamento, quando em
contacto com os fluídos fisiológicos presentes no pulmão, reduzindo assim a sua eliminação por
acção dos macrófagos.
A morfologia das micropartículas produzidas neste trabalho foi estudada utilizando o
equipamento Morphologi G3 e por microscopia electrónica de varrimento (SEM). As
propriedades de estado sólido foram investigadas por difracção de raio-X (DRX), calorimetria
diferencial de varrimento (DSC) e por espectroscopia de infravermelho (FTIR). A porosidade e
a área superficial das partículas foram determinadas por porosimetria de mercúrio e
porosimetria de azoto.
Realizaram-se estudos in vitro de aerosolização usando o equipamento Andersen Cascade
Impactor (ACI) para determinar a fração média emitida (EF%) e a fração de partículas finas
(FPF). Os perfis de libertação dos fármacos foram determinados por experiências in vitro, ao pH
e temperatura fisiológicos.
Este trabalho mostra que o processo SAA pode ser usado com sucesso para preparar
formulações à base de quitosano com fracções respiráveis adequadas e libertação controlada de
diferentes moléculas bioactivas, para administração pulmonar utilizando inaladores de pó seco
(DPI).
Palavras-chave: Micropartículas; Quitosano; Atomização assistida por fluídos supercríticos;
Administração pulmonar; Formulações para inalação

x

xi
Contents
Acknowledgments .................................................................................................................................. v
Abstract................................................................................................................................................ vii
Resumo ................................................................................................................................................. ix
Contents ................................................................................................................................................ xi
Index of Figures ..................................................................................................................................xiii
Index of Tables ................................................................................................................................... xvii
List of abbreviations ............................................................................................................................ xix
Chapter 1. Introduction ....................................................................................................................... 1
1.1. Dry Powder Inhalers .............................................................................................................. 3
1.2. Powder physical properties .................................................................................................... 4
1.3. Andersen Cascade Impactor ................................................................................................... 7
1.4. Drug Release ......................................................................................................................... 9
1.5. Chitosan .............................................................................................................................. 10
1.6. Particle production ............................................................................................................... 12
1.7. Supercritical fluid technology............................................................................................... 13
1.8. Supercritical Assisted Atomization ....................................................................................... 16
Chapter 2. Experimental Section ....................................................................................................... 19
2.1. Particle Production ............................................................................................................... 19
2.1.1. Materials ..................................................................................................................... 19
2.1.2. SAA process and apparatus .......................................................................................... 19
2.2. Particle Characterization ...................................................................................................... 21
Chapter 3. Results and Discussion .................................................................................................... 27
3.1. Preliminary studies on chitosan microparticles ........................................................................... 27
3.1.1. Morphology and solid state properties of CHT microparticles ...................................... 27
3.1.2. Particle swelling .......................................................................................................... 37
3.1.3. In vitro biodegradation studies ..................................................................................... 38
3.2. Co-precipitation of chitosan and ibuprofen ........................................................................... 39
3.2.1 Morphology and solid state properties of CHT-IBP microparticles ....................................... 39
3.2.2 In vitro controlled release studies ......................................................................................... 48
3.3. Co-precipitation of chitosan and bovine serum albumin ........................................................ 50
3.3.1. Morphology and solid state properties of CHT-BSA microparticles .............................. 50

xii
3.3.2. In vitro controlled release studies ................................................................................. 57
3.4. Co-atomization of chitosan, ibuprofen and bovine serum albumin ......................................... 59
3.4.1. Morphology and solid state properties of CHT-IBP-BSA microparticles ....................... 59
3.5. Discussion ................................................................................................................................. 65
Chapter 4. Conclusions and Future Work .......................................................................................... 67
Bibliography ........................................................................................................................................ 69

xiii
Index of Figures
Figure 1.1: Schematic representation of (a) a person using an inhaler, adapted from the site of
Symbicort[10]; (b) representation of the lungs and alveoli, adapted from the site wikicell[11] and
gridclub[12]. .......................................................................................................................................... 2
Figure 1.2: Types of physisorption isotherms according to the IUPAC classification, adapted from F.
Rouquerol et al. [18]. .............................................................................................................................. 5
Figure 1.3: Cross section of a porous grain: (C) closed pore; (B) blind pore; (T) through pore; (I)
interconnected pore; (R) surface roughness, adapted from F. Rouquerol et al. [18]. .................................. 6
Figure 1.4: Schematic representation of the Andersen Cascade Impactor, adapted from the European
pharmacopoeia [26] ................................................................................................................................ 8
Figure 1.5: Schematic representation of polymer swelling, adapted from D. Arifin et al. [30]. .................. 9
Figure 1.6: Chitosan structure, where n is related to the DD % and m to (100 – DD %). Ideal chitosan
would have m=0 and chitin would have n=0. Adapted from M. Dash et al. [32] and J. Kumirska et al. [34]
............................................................................................................................................................ 11
Figure 1.7: Phase diagram of CO2, adapted from W. Leitner et al. [76] .................................................. 14
Figure 1.8: The density and solvent power of sc-CO2 as a function of temperature and pressure, adapted
from W. Leitner et al. [76]. ................................................................................................................... 15
Figure 1.9: Representation of the atomization mechanism, adapted from E. Reverchon et al. [101] ........ 17
Figure 1.10: VLE of water-CO2-ethanol system, adapted from C. Duarte et al. [103] ............................. 18
Figure 2.1: Schematic representation of SAA apparatus: (CB) cooling bath; (P1) CO2 pump; (HB) heating
bath; (PI) manometer; (Sol) liquid solution; (P2) liquid pump; (S) static mixer; (P) precipitator; (Gas)
discharged gases; (C) cyclone; (PC) precipitated powder; (F) filter bag; (FI) flowmeter; (TI) temperature
indicator; (TIC) temperature controller.................................................................................................. 20
Figure 2.2: Laboratory scale SAA apparatus used to produce microparticles. ......................................... 20
Figure 2.3: Morphologi G3 Essentials used to determine particle size distribution. ................................. 21
Figure 2.4: Schematic representation of the DUSA, adapted from Copley Scientific [111] ..................... 22
Figure 2.5: Andersen Cascade Impactor apparatus ................................................................................. 23
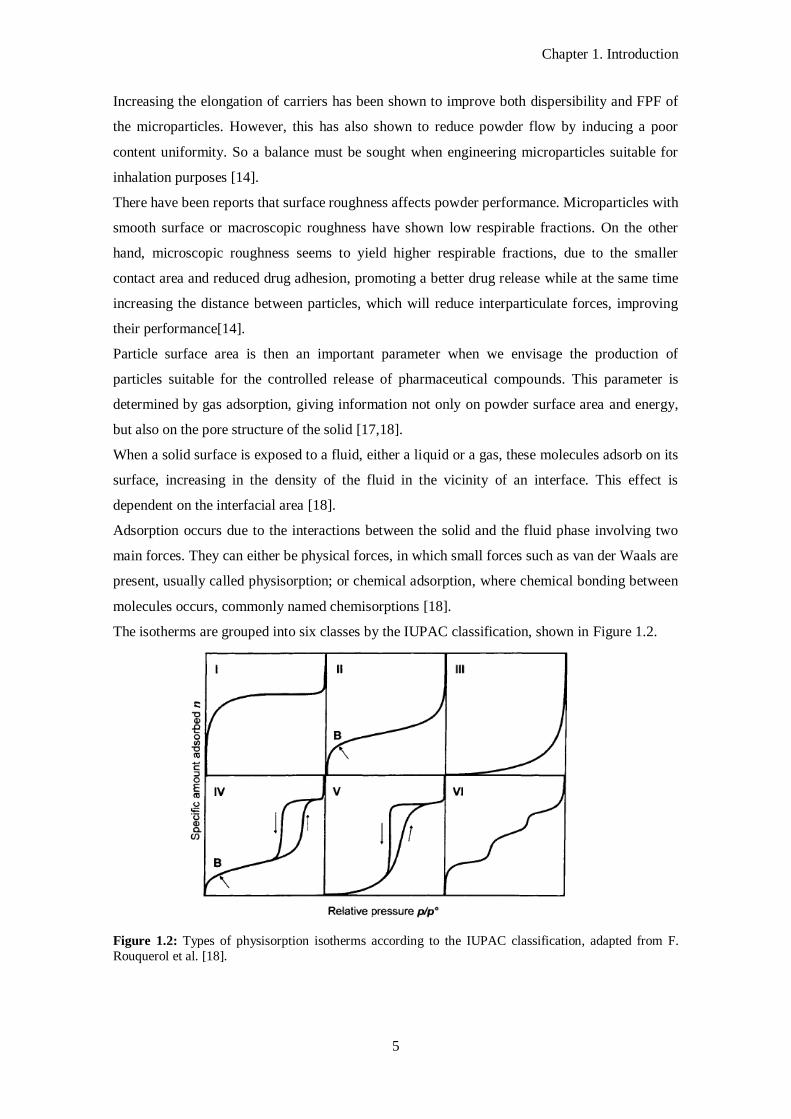
Figure 2.6: Malvern Morphologi G3 apparatus measuring particle swelling. .......................................... 24
Figure 3.1: Spray image of particle atomization using SAA. .................................................................. 28
Figure 3.2: ACI analysis for CHT microparticles produced by SAA. ..................................................... 30
Figure 3.3: Distribution of particles size from CHT microparticles with medium MW microparticles in a
150 μm diameter nozzle (black), medium MW microparticles in a 150 μm diameter nozzle with higher
concentration (green), medium MW in a 300 μm diameter nozzle (red) and low MW in a 150 μm
diameter nozzle (blue) obtained by Morphologi G3 analysis. ................................................................. 31
Figure 3.4: SEM images of CHT microparticles (a) medium MW atomized with a 150 μm diameter
nozzle and low concentration (assay 1), (b) medium MW atomized with a 150 μm diameter nozzle and
high concentration (assay 2), (c) medium MW atomized with a 300 μm diameter nozzle and low
concentration (assay 3), (d) low MW atomized with a 150 μm diameter nozzle and low concentration
(assay 4), the magnification used was 20,000 X..................................................................................... 31

xiv
Figure 3.5: Morphologi G3 images of CHT microparticles (a) medium MW atomized with a 150 μm
diameter nozzle and low concentration (assay 1), (b) medium MW atomized with a 150 μm diameter
nozzle and high concentration (assay 2), (c) medium MW atomized with a 3000 μm diameter nozzle and
low concentration (assay 3), (d) low MW atomized with a 150 μm diameter nozzle and low concentration
(assay 4), the magnification used was 20,000 X..................................................................................... 32
Figure 3.6: X-ray diffraction patterns of (a) raw CHT and (b) CHT microparticles. ............................... 33
Figure 3.7: First run of the DSC of (a) CHT processed by SAA; (b) raw CHT from 25 oC to 200 oC with a
flow rate of 10 oC/min. ......................................................................................................................... 33
Figure 3.8: Second run of the DSC of (a) CHT processed by SAA; (b) raw CHT from 25 oC to 300 oC
with a flow rate of 10 oC/min. ............................................................................................................... 33
Figure 3.9: Nitrogen adsorption isotherms of CHT microparticles.......................................................... 34
Figure 3.10: BET surface area plot for CHT microparticles produced by SAA. ...................................... 35
Figure 3.11: Pore area CHT microparticle processed by SAA. ............................................................... 36
Figure 3.12: FTIR analyses from (a) raw CHT and (b) CHT microparticles. .......................................... 36
Figure 3.13: Morphologi images of the swelling of CHT microparticles in PBS at temperatures (a) 25 oC;
(b) 37 oC; and (c)in pH=6.8 at 37 oC. Top: Dry particles, bottom: Wet particles. .................................... 37
Figure 3.14: Enzymatic degradation profiles of CHT microparticles in the presence of lysozyme. .......... 38
Figure 3.15: ACI analysis for CHT-IBP microparticles produced by SAA. ............................................ 41
Figure 3.16: Comparison of the distribution of particles size of CHT microparticles (black) and CHT-IBP
microparticles (red). ............................................................................................................................. 42
Figure 3.17: SEM images of CHT-IBP microparticles (a) assay 5, (b) assay 6. ....................................... 42
Figure 3.18: Morphologi G3 images of CHT-IBP microparticles (a) assay 5, (b) assay 6. ....................... 43
Figure 3.19: X-ray diffraction patterns of (a) raw IBP, (b) raw CHT, (c) CHT microparticles and (d)
CHT-IBP microparticles. ...................................................................................................................... 43
Figure 3.20: First run of the DSC of (a) raw IBP; (b) raw CHT and (c) CHT-IBP microparticles from 25
oC to 200 oC with a flow rate of 10 oC/min. ........................................................................................... 44
Figure 3.21: Second run of the DSC of (a) raw IBP; (b) raw CHT and (c) CHT-IBP microparticles from
25 oC to 300 oC with a flow rate of 10 oC/min. ...................................................................................... 44
Figure 3.22: Nitrogen adsportion isotherms of CHT-IBP microparticles................................................. 45
Figure 3.23: BET surface area plot for CHT-IBP microparticles produced by SAA. ............................... 46
Figure 3.24: Pore area of CHT-IBP microparticles processed by SAA. .................................................. 46
Figure 3.25: FTIR analyses from (a) raw CHT; (b) raw IBP; (c) CHT microparticles and (d) CHT-IBP
microparticles. ...................................................................................................................................... 47
Figure 3.26: Release profiles on the first 60% of (a) IBP at pH=7.4 and (b) IBP at pH=6.8 adjusted with
Korsmeyer and Peppas equation............................................................................................................ 48
Figure 3.27: Release profiles of (a) IBP at pH=7.4 and (b) IBP at pH=6.8 and adjusted with Peppas and
Sahlin equation. .................................................................................................................................... 48
Figure 3.28: ACI analysis for CHT-BSA microparticles produced by SAA. ........................................... 51
Figure 3.29: Comparison of the distribution of particles size of CHT microparticles (black) and CHT-
BSA microparticles (blue). ................................................................................................................... 52

xv
Figure 3.30: SEM images of CHT-BSA microparticles (a) assay 7 with a magnification of 10,000X; (b)
assay 8 with a magnification of 5,000X and (c) BSA microparticles (assay 9) with a magnification of
6.000X. ................................................................................................................................................ 53
Figure 3.31: Morphologi G3 images of CHT-BSA microparticles (a) assay 7, (b) assay 8 and (c) assay 9,
obtained with an objective of 50X. ........................................................................................................ 53
Figure 3.32: X-ray diffraction patterns of (a) CHT-BSA microparticles, (b) CHT microparticles, (c) raw
BSA and (d) BSA microparticles. ......................................................................................................... 54
Figure 3.33: First run of the DSC of (a) raw CHT; (b) raw BSA and (c) CHT-BSA microparticles from 25
oC to 200 oC with a flow rate of 10 oC/min. ........................................................................................... 55
Figure 3.34: Second run of the DSC of (a) raw BSA; (b) raw CHT and (c) CHT-BSA microparticles from
25 oC to 300 oC with a flow rate of 10 oC/min. ...................................................................................... 55
Figure 3.35: Pore area of CHT-BSA microparticles processed by SAA. ................................................. 56
Figure 3.36: FTIR analyses from (a) BSA microparticles; (b) CHT-BSA microparticles; (c) CHT
microparticles; (d) raw BSA and (e) raw CHT. ...................................................................................... 57
Figure 3.37: Release profiles on the first 60% of (a) BSA at pH=7.4 and (b) BSA at pH=6.8 adjusted with
Korsmeyer and Peppas equation............................................................................................................ 58
Figure 3.38: Release profiles of (a) BSA at pH=7.4 and (b) BSA at pH=6.8 adjusted with Peppas and
Sahlin equation. .................................................................................................................................... 58
Figure 3.39: ACI analysis for CHT-IBP-BSA microparticles produced by SAA. .................................... 61
Figure 3.40: Comparison of the distribution of particles size of CHT microparticles (black) and CHT-IBP-
BSA microparticles (green)................................................................................................................... 62
Figure 3.41: SEM images of CHT-IBP-BSA microparticles with a magnification of 10,000X. .............. 62
Figure 3.42: Morphologi G3 images of CHT-IBP-BSA microparticles................................................... 62
Figure 3.43: First run of the DSC of (a) raw CHT; (b) raw BSA; (c) CHT-BSA microparticles and (d)
CHT-IBP-BSA microparticles from 25 oC to 200 oC with a flow rate of 10 oC/min. ............................... 63
Figure 3.44: Second run of the DSC of (a) raw BSA; (b) raw CHT; (c) CHT-BSA microparticles and (d)
CHT-IBP-BSA microparticles from 25 oC to 300 oC with a flow rate of 10 oC/min. ............................... 63
Figure 3.45: Pore area of CHT-IBP-BSA microparticles processed by SAA. .......................................... 64
Figure 3.46: FTIR analyses from (a) CHT-IBP-BSA microparticles; (b) raw IBP; (c) raw BSA and (d)
raw CHT. ............................................................................................................................................. 64

xvi

xvii
Index of Tables
Table 1.1: Breath-Actuated DPIs, adapted from S. Newman and W. Busse [13]. ...................................... 3
Table 1.2: Pore classification according to their diameter. ....................................................................... 6
Table 1.3: Aerodynamic cut-off diameters for ACI at 28.3 L/min ............................................................ 8
Table 1.4: Relationship between structural characteristics and properties of CHT, adapted from M. Dash
et al. [32] .............................................................................................................................................. 11
Table 1.5: Typical order of magnitude of physical properties of gases, supercritical fluids and liquids,
adapted from W. Leitner et al. [77] ....................................................................................................... 14
Table 3.1: Operating parameters of SAA for different quantities of CHT (CHT %) in the liquid solution,
CHT molecular weight (MW), nozzle diameter and particle recovery. Also shown are the mean
volumetric diameter (Dv), span, shape, roughness and solid state. .......................................................... 28
Table 3.2: Properties of CHT microparticles produced by SAA in assay 1: BET specific surface area
(aBET), pore diameter (Dp), volume occupied in the monolayer (νm), porosity, apparent density, bulk
density, true density and tapped density. ............................................................................................... 29
Table 3.3: Particles’ Reynolds number calculated for CHT microparticles obtained in assay 1. .............. 29
Table 3.4: Aerodynamic diameters by Stokes equation and ACI, as well as FPF and GSD for CHT
microparticles produced by SAA. ......................................................................................................... 30
Table 3.5: Swelling degree and water uptake of CHT microparticles...................................................... 38
Table 3.6: Operating parameters of SAA for different quantities of IBP (IBP %) in the liquid solution co-
atomized with 0.60% m/v CHT. Also shown are the drug encapsulation (E), mean volumetric diameter
(Dv), span, shape, roughness and solid state. .......................................................................................... 39
Table 3.7: Properties of CHT-IBP microparticles produced by SAA in assay 5: BET specific surface area
(aBET), pore diameter (Dp), volume occupied in the monolayer (νm), porosity, apparent density, bulk
density, true density and tapped density. ............................................................................................... 39
Table 3.8: Particles’ Reynolds number calculated for CHT-IBP microparticles obtained in assay 5. ....... 40
Table 3.9: Aerodynamic diameters by Stokes equation and ACI, as well as FPF and GSD for CHT-IBP
microparticles produced by SAA. ......................................................................................................... 41
Table 3.10: Time values related to the 50% and 90% amount released of IBP. ....................................... 49
Table 3.11: Operating parameters of SAA for different quantities of BSA (BSA %) in the liquid solution
co-atomized with 0.60% m/v CHT. Also shown are the drug encapsulation (E), mean volumetric diameter
(Dv), span, shape, roughness and solid state. .......................................................................................... 50
Table 3.12: Properties of CHT-BSA microparticles produced by SAA in assay 8: pore diameter (Dp),
porosity, apparent density, bulk density, true density and tapped density. ............................................... 50
Table 3.13: Particles’ Reynolds number calculated for CHT-BSA microparticles obtained in assay 8. .... 51
Table 3.14: Aerodynamic diameters by Stokes equation and ACI, as well as FPF and GSD for CHT-BSA
microparticles produced by SAA. ......................................................................................................... 52
Table 3.15: Time values related to the 50% and 90% amount released of BSA. ...................................... 59
Table 3.16: Results shown for the co-atomization of a liquid solution of 0.60% m/v CHT, 0.09% g/mL
BSA and 0.09% g/mL IBP. Also shown are the mean volumetric diameter (Dv), span, shape, roughness
and solid state. ...................................................................................................................................... 59

xviii
Table 3.17: Properties of CHT-BSA microparticles produced by SAA in assay 10:, pore diameter (Dp),
porosity, apparent density, bulk density, true density and tapped density. ............................................... 60
Table 3.18: Particles’ Reynolds number calculated for CHT-IBP-BSA particles obtained in assay 10. .... 60
Table 3.19: Aerodynamic diameters by Stokes equation and ACI, as well as FPF and GSD for CHT-IBP-
BSA microparticles produced by SAA. ................................................................................................. 61

xix
List of abbreviations
ACI: Andersen cascade impactor.
API: Active pharmaceutical ingredient.
BSA: Bovine serum albumin.
CHT: Chitosan.
CHT-BSA: Chitosan co-atomized with bovine serum albumin.
CHT-IBP: Chitosan co-atomized with Ibuprofen.
CHT-IBP-BSA: Chitosan co-atomized with Ibuprofen and bovine serum albumin.
DA: Aerodynamic diameter.
Dp: Pore diameter.
Dv: Particle mean volumetric diameter.
DD: Degree of deacetylation.
DSC: Differential scanning calorimetry.
FPF: Fine particle fraction.
GSD: Geometric standard deviation.
IBP: Ibuprofen.
MMAD: Mass median aerodynamic distribution.
MW: Molecular weight.
νm: Volume adsorbed in the monolayer
PSD: Particle size distribution.
Rep: Particle Reynolds number.
RESS: Rapid expansion of supercritical solution.
SAA: Supercritical assisted atomization.
SAS: Supercritical antisolvent.
Sc-CO2: Supercritical carbon dioxide.
Tg: Glass transition temperature.

xx

Chapter 1. Introduction
1
Chapter 1. Introduction
The lungs are, probably, the most historic route for drug delivery. The ancient Egyptians used to
inhale vapors to treat a wide variety of diseases, as early as 1,500 BC. However the use of lungs
as a route for drug delivery was forgotten up until the 1950s with the introduction of metered
dose inhalers to deliver albuterol for asthma treatment [1].
The route of administration significantly influences the therapeutic income of a drug. A drug
delivery system should assure protection of a drug against degradation and ensure that the drug
reaches proper permeability properties to subsequently provide a complex transportation and
protection system against the natural barriers. Oral delivery remains dominant, however other
routes of administration are becoming more and more popular for targeted drug delivery [2].
Recently, there has been an increasing interest in developing systems for the controlled delivery
of therapeutic molecules to the lungs. This type of drug delivery to the lung evades primary
metabolism through the liver, has a large surface area and allows less amounts of drug to be
used.
The primary function of the lung is to exchange gas between the blood and the external
environment, where there are approximately 300 million alveoli. These alveoli contain type I
pneumocytes, which share a membrane with pulmonary capillaries, and type II pneumocytes
which secrete a surfactant to prevent alveolar collapse [1].
Microparticles were usually regarded simply as carriers deprived of any special attributes, and
the major concern with these particles were that they should have suitable sizes for inhalation
purposes and be dry. Recently there are more advanced therapeutic approaches, which created
more complex requirements that can only be met by particles designed for certain specific
functions such as transport of the drug, targeted delivery, sustained drug release and
stabilization of the drug [3].
There are many new inhalation products being studied, possessing new absorption mechanisms
and rapid action for systemic therapies, however their effectiveness is related to their efficiency
in drug delivery to the lungs [3].
The inhalation technology has two main areas: the development of inhalation devices, by
designing more sophisticated inhalers, improving the inhalation efficiency of a certain
compound; or by applying particle engineering, which is a discipline that combines knowledge
from many different areas, such as chemistry, microbiology, solid state physics, aerosol and
powder science. This quality by design must ensure drug efficacy, a stable formulation capable
of lasting through the intended shell life and providing a consistent delivery to the lung sites [3].
Fine particles deposited in the conducting airway will be cleared in a matter of hours. Those that
penetrate the lower respiratory tract may adhere to the epithelium membrane and be cleared
more slowly. Porous particles with a large volume diameter show better bioavailability than
nonporous particles with the same size because of their larger specific surface area.

Chapter 1. Introduction
2
A new focus is being done for swellable microparticles, having the desired aerodynamic
diameters when dry, but upon contact with an aqueous solution the particles will grow in size as
water enters in the polymeric matrix, evading the macrophage clearance in the deep lung while
at the same time providing a controlled release of the API. Many formulations have been tested,
microparticles comprised of only one polymer, microparticles comprised of co-polymers to
have good characteristics of both polymers and nanoparticles inside microparticles allowing a
better control over the drug release [4].
Recently, there have been increasing incidences of lung diseases, such as asthma, tuberculosis,
cystic fibrosis, chronic obstructive pulmonary disease and lung cancer decreasing the quality of
life of many people. Lung cancer is one of the most common cancers, along with colorectum,
breast and prostate, showing the highest mortality rate among them and constituting a major
public health problem in the world [5,6].
Controlled release of pharmaceutical drugs offer an effective way to optimize the bioavailability
of drugs, offering several advantages over conventional methods [7]. Also, advances in
inhalation therapy led to the development of novel technologies for the delivery of such
mechanisms via pulmonary routes, by using inhalers as in Figure 1.1 (a), for treatment of both
local or systemic diseases [3]. Delivery of drugs to the lungs, schematized in Figure 1.1 (b), has
many advantages, such as large alveolar surface area, thin and permeable epithelial barrier,
extensive vascularization and low enzymatic metabolic activity, providing an alternate route to
enter systemic circulation [8,9].
Figure 1.1: Schematic representation of (a) a person using an inhaler, adapted from the site of
Symbicort[10]; (b) representation of the lungs and alveoli, adapted from the site wikicell[11] and
gridclub[12].
(a) (b)

Chapter 1. Introduction
3
1.1. Dry Powder Inhalers
First generation of dry powder inhalers (DPI) exhibited low efficiency in fine particle fraction
(FPF), so pressurized metered dose inhalers (pMDI) are used more frequently these days.
However, pMDIs are more expensive and, since they are easier to develop, more generic pMDIs
can appear in the market. Also it is necessary to have a suspension of the drug on
hydrofluoralkanes in order for pMDIs to function properly, which may cause environmental
problems [3,13,14].
The incorrect use of inhalers by patients is still a common occurrence, reaching as high as 50%
of the patients due to many reasons and has been attributed to poor coordination. The incorrect
use of the inhalation device leads to a poor compliance of the treatment, and in some cases even
to failure, despite the API being successful for the treatment of the patient’s disease [13,15].
In order to bypass the problems posed through the incorrect use of inhalers, an appropriate
design of the inhaler must be made during its development that can improve the patients
comfort when using, leading to a more successful inhalation [13].
Despite exhibiting low efficiency, DPIs are also hard and expensive to develop, however they
have been the subject of recent improvement. These developments are mainly due to the
optimization of process technologies allowing better product consistency, dispersibility and
sustained release, while at the same time reducing manufacturing complexity and costs as well
as being environmentally friendly [3,13,14].
There are many types of DPIs, as shown in Table 1.1, and can be divided as “single-dose”
devices, where a single dose is provided in a capsule; “multiple unit dose” devices, which
contains a small amount of doses in capsules or blisters; or “multidose” devices; where the
powder is stored in a reservoir and the doses are metered [13,14].
Table 1.1: Breath-Actuated DPIs, adapted from S. Newman and W. Busse [13].
Single Dose Multiple Unit Dose Multidose
Spinhaler® Diskhaler® Turbuhaler®
Rotahaler® Diskus® Easyhaler®
AerolizerTM
Aerohaler® Novolizer®
Inhalator® Twincaps® Clickhaler®
Eclipse MicroDose DPI Pulvinal®
Turbospin Delsys DPI Ultrahaler®
AIRTM Inhaler Technohaler® Taifun®
MAGhaler
Cyclovent
The resistance to airflow in a DPI determines the flow rate of air through the inhaler and the
effort the patient needs to do in order to perform a successful inhalation. Each type of inhaler
poses a characteristic resistance. The peak inspiratory flow rate influences the efficiency of the

Chapter 1. Introduction
4
inhaler in lifting the particles from the chamber or capsule, fluidizing the powders from a static
state, turning them into an aerosol. In order for fluidization to occur, cohesive and adhesive
forces of the particles must be overcome, so it can be easily seen that the inspiratory flow rate
affects the efficiency of particle deagglomeration and the amount reaching the lung [13,14].
1.2. Powder physical properties
Particle interactions also have a significant effect in flowability, deaggregation and dispersion,
and are comprised by “long-range forces”, with forces weaker than chemical bonds but that
extend to a greater range; and “short-range” bonds such as chemical bonding. For particles with
sizes less than 10 μm, weaker forces, such as cohesion or adhesion forces, generally comprised
by van der Waals forces, electrostatic forces or capillary forces, become significant, since
gravitational forces lose their significance at such small sizes [14].
Since inter-particle interactions between the drug and excipient are not fully understood,
improving the dispersion of these particles has been more pragmatic than derived from a
theoretical model [14].
In order to successfully reach the deep lung, particles should have sizes ranging from 0.5-5 μm
aerodynamic diameters, to be able to pass through the mouth, throat, and conducting airways
and reach the deep lung. If the particles are larger than 5 μm they will be trapped in the upper
airawys. On the other way, if they are below 0.5 μm they are exhaled during the breathing cycle
[14,16].
However, even when in the inhalable range, the particles are subjected to high inter-particulate
forces lowering their flow properties. So many alternatives have been made in the ways of either
forming controlled aggregation or agglomeration of the particles, or adhesion to excipient
carrier particles [14].
Due to the efficiency of local clearance mechanisms, designing microparticles suitable for
sustained drug delivery to the lungs with adequate aerodynamic properties is one of the major
challenges in pulmonary drug delivery [16].
Microparticles with sizes suitable for inhalation are small enough to have rapid clearance from
lungs by alveolar macrophages. Increasing particle size reduces macrophage phagocytosis,
however this is an unpractical choice for pulmonary drug delivery. So a promising strategy has
been proposed by developing swellable microparticles that have aerodynamic sizes suitable for
inhalation when dry but, when deposited in the lungs, attain larger sizes by particle swelling,
bypassing macrophage clearance [4,16].
However, it has been shown that particles greater than 5 μm can block the blood capillaries on
the alveoli and cause chronic obstructive pulmonary emphysema, so it becomes necessary that
the swollen particles be degraded by the defense mechanism present in the lungs [8].
Chapter 1. Introduction
5
Increasing the elongation of carriers has been shown to improve both dispersibility and FPF of
the microparticles. However, this has also shown to reduce powder flow by inducing a poor
content uniformity. So a balance must be sought when engineering microparticles suitable for
inhalation purposes [14].
There have been reports that surface roughness affects powder performance. Microparticles with
smooth surface or macroscopic roughness have shown low respirable fractions. On the other
hand, microscopic roughness seems to yield higher respirable fractions, due to the smaller
contact area and reduced drug adhesion, promoting a better drug release while at the same time
increasing the distance between particles, which will reduce interparticulate forces, improving
their performance[14].
Particle surface area is then an important parameter when we envisage the production of
particles suitable for the controlled release of pharmaceutical compounds. This parameter is
determined by gas adsorption, giving information not only on powder surface area and energy,
but also on the pore structure of the solid [17,18].
When a solid surface is exposed to a fluid, either a liquid or a gas, these molecules adsorb on its
surface, increasing in the density of the fluid in the vicinity of an interface. This effect is
dependent on the interfacial area [18].
Adsorption occurs due to the interactions between the solid and the fluid phase involving two
main forces. They can either be physical forces, in which small forces such as van der Waals are
present, usually called physisorption; or chemical adsorption, where chemical bonding between
molecules occurs, commonly named chemisorptions [18].
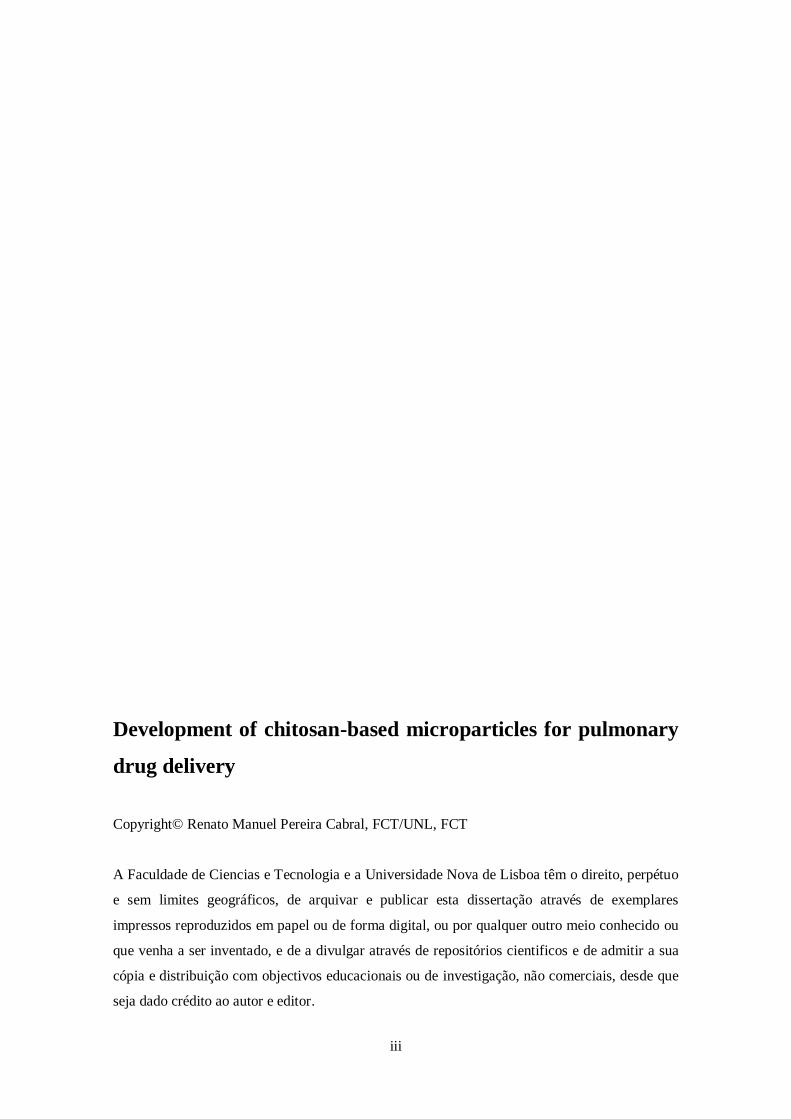
The isotherms are grouped into six classes by the IUPAC classification, shown in Figure 1.2.
Figure 1.2: Types of physisorption isotherms according to the IUPAC classification, adapted from F.
Rouquerol et al. [18].

Chapter 1. Introduction
6
The Brunauer – Emmett – Teller (BET) equation was obtained from the Langmuir mechanism,
which is only valid for monolayer adsorption, in order to include multilayer adsorption. In this
manner it became possible to explain Type II isotherms, common for multilayer adsorption [19].
According to the BET model, the molecules adsorbed in one layer can act as further adsorption
sites for molecules, which in turn will form the next layer. As long as saturation vapour pressure
po does not occur, many layers of randomly stacked adsorbed molecules can cover the solid
surface [19].
Pores can have a very big size distribution as well as various shapes even within the same
particle and are usually determined by mercury porosimetry [17,20,21]. A classification of pores
based on their size was proposed by B. Bering et al., as shown in Table 1.2, and is currently
adopted by the IUPAC [22].
Table 1.2: Pore classification according to their diameter.
Classification Width
Micropores < 1.5 nm
Mesopores 1.5 nm<d<50 nm
Macropores > 50 nm
Each range of pore size corresponds to the adsorption effects observed in the isotherm.
In micropores, the entire pore volume represents a space where adsorption can occur, having a
high interaction potential due to the proximity of the walls, and the amount adsorbed is
correspondingly enhanced; in mesopores, both monolayer and multilayer occurs in their surface,
and at certain relative pressures, capillary condensation takes place with a characteristic
hysteresis loop; in the macropore range, the pores are so big that the filling of these pores by
capillary condensation only occurs at relative pressures close to unity, being very difficult to
map out the isotherm in detail [17,22].
Besides their size, pores can also be classified due to their form, as shown in Figure 1.3.
Figure 1.3: Cross section of a porous grain: (C) closed pore; (B) blind pore; (T) through pore; (I)
interconnected pore; (R) surface roughness, adapted from F. Rouquerol et al. [18].
Porosity is defined as the ratio of pores and voids to the volume occupied by the solid. One must
bear in mind that the value of porosity depends upon the method used. The pore volume is
usually regarded as the volume of open pores, but it may also include closed pores [18].
R B
I
T
C

Chapter 1. Introduction
7
It is usually hard to distinguish between surface roughness and pores or voids, so conventionally
an irregularity is considered a pore if it is deeper than wide [18].
Although mercury porosimetry is a useful technique for determining particle porosity, it is also
able to give information on skeletal and apparent density of the particles [20,21]. The apparent
density is determined by the volume occupied by the particles obtained by liquid displacement.
Since the liquid does no enter all the pores it is necessary to report the liquid used in the
measurement, because different liquids yields different results, due to the different capacities of
penetrating smaller holes between different liquids [23]. Another method of determining particle
density is through the use of a pycnometer which, in this case, measures the true density of the
particles under the principle of gas displacement. True density only considers the volume
occupied by the solid material, neglecting the volume of void spaces [23].
The bulk density is an important parameter, as it affects aerodynamic diameter, being
characterized as the volume occupied by the solid and the voids for a given mass [3,23,24].
Electrostatic charge influences powder performance in the various stages of the process.
Triboelectrification is known to be inversely proportional to particle size; however this
parameter becomes more complex when the API is present [14].
Relative humidity has been shown to influence powder performance by reducing the
electrostatic charge and also by decreasing the stability of amorphous compounds. However,
this effect induces capillary forces which, at relatively high humidity (over 50%) dominates
particles’ adhesion forces that cannot be reversed by lowering the relative humidity [25].
Amorphous particles have many advantages, such as increased dissolution. However, it comes
with a big disadvantage in decreased chemical stability. Also, amorphous particles possess a
higher water adsorption capacity [14]. In order to maintain chemical stability, the API must be
in a crystalline form but so it will show a poor dissolution. So, in order to bypass these
limitations, an amorphous carrier, possessing good dissolution rates impregnated with
crystalline API, in order to maintain the product stability have been given attention [3]
1.3. Andersen Cascade Impactor
Andersen Cascade Impactor (ACI) is generally used for testing both the development and
quality control (QC) of inhaler products because both the differential pressure over the inhaler
and airflow rate can be controlled and, alongside with the Next Generation Impactor (NGI), is
recommended in both the European and United States pharmacopoeia [24,26,27]. In Figure 1.4
it can be seen the schematic representation of the ACI.

Chapter 1. Introduction
8
Figure 1.4: Schematic representation of the Andersen Cascade Impactor, adapted from the European
pharmacopoeia [26]
It is stated by both pharmacopoeias that the air flow rate through an inhaler must provide a
pressure drop of 4 kPa in a time consistent with the withdrawal of 4 liters of air, due to the
different resistances offered by different inhalers, however this can change due to limitations
imposed by the condition of the lungs [24,26,28].
Cascade impactors classify aerosol particles and droplets on the basis of their aerodynamic
diameters by separating the aerosolized particles from the airstream based on their inertia [27].
The aerosolized particles pass through decreasing orifices openings leading to the next stages
which, if possessing sufficient inertia, will impact on the collection plate and subsequently
deposited over the 8 stages of the ACI. In order to prevent bouncing of the particles, the stages
are usually coated with a viscous solution. Each stage provides a determined cut-off diameter, as
shown in Table 1.3 [24,29].
Table 1.3: Aerodynamic cut-off diameters for ACI at 28.3 L/min
Stage Cut-off diameter (μm)
0 9.00
1 5.80
2 4.70
3 3.30
4 2.10
5 1.10
6 0.65
7 0.43

Chapter 1. Introduction
9
Particle size is estimated based on the mass distribution determined by either UV or HPLC
analysis in order to discriminate between the API and the carrier. Another important parameter
measured is the FPF, which is the mass of particles below a cut-off diameter of 5 μm [24].
The aerodynamic diameter is a crucial parameter in any aerosol measurement, as well as
respiratory drug delivery, being defined as the diameter of spheres with unit density, able to
reach the same velocity in the air stream as particles of arbitrary shape and density. From this
measurement comes another important parameter, the MMAD, which is the particles’
aerodynamic diameter found at 50% of the cumulative PSD [24].
1.4. Drug Release
Sustainable drug release could reduce the frequency that patients use their inhalers, reducing in
this way the risk of damaging the lungs and developing pulmonary fibrosis [8].
In order to provide a better control over the drug release, many groups proposed the use of
swelling polymers, where water could be able to imbibe the polymeric matrix, causing polymer
disentanglement, while at the same time releasing the drug. The different phases of polymer
disentanglement for swelling devices can be observed in Figure 1.5 [30].
Figure 1.5: Schematic representation of polymer swelling, adapted from D. Arifin et al. [30].
Water entering the polymeric matrix decreases polymer concentration and raises polymer
disentanglement. At the same time, the polymeric disentanglement causes particle swelling and
the relaxation of the polymeric matrix, resulting in the rubbery region where drug mobility
increases. At the interface with the bulk solution there is also polymer dissolution due to the
decreased polymer concentration in this region. Since drug release is not only controlled by
diffusion, it is expected to observe a deviation from Fick’s diffusion model, as polymer swelling
has a huge influence in the release of the drug [30].
Center Dry Glossy
core Swollen
Glassy Layer Gel
Layer Diffusion
Layer
Bulk
Unhidrated
Regime
Very Strong
Entanglement
Strong
Entanglement
Weak
Entanglement

Chapter 1. Introduction
10
The swelling occurs to achieve thermodynamics equilibrium when water penetrates the
crosslinked region inside the polymer matrix due to a water concentration gradient. As water
penetrates and swelling takes place, the polymer changes from a glassy state into a rubbery
state, creating a gel layer which increases drug diffusivity. So, during particle swelling, two
states coexist in the polymer matrix, the glass core and gel layer. In this situation there are two
moving fronts, the glassy-rubbery front (GR) and the rubbery-solvent front (RS) [30].
During particle swelling, front GR moves inward, while at the same time front RS moves
outward, and drug diffuses out through interface RS due to a concentration gradient. When the
front RS reaches thermodynamic equilibrium with the medium, it will start to dissolve, and this
front starts to move inwards. At this stage both fronts will move inwards until front GR ceases
to exist as the glassy core disappears. Then only polymer dissolution controls the particles’
shrinking process [30].
If there is little or no water penetration, there is no polymer relaxation and drug is released by
Fickian diffusion through the glassy polymer. On the other hand, if water penetration is the
dominant step, a “Case-II transport” of drug release occurs, characterized by a sharp advancing
interface at constant velocity, resulting in a zero-order drug release [31].
Usually, drug release is encountered between these two cases, where “anomalous transport” is
defined. It is usually found where swelling controls drug delivery, since both diffusion and
relaxation transport are present and happening at the same time [30].
The most common excipient used is lactose, but since it has a sugar-reducing function, it is not
suitable for use with certain APIs. Many alternatives to lactose have been proposed, such as
fructose, galactose, raffinoze, trehalose, xylitol, sucrose, mannitol, maltodextrins, dextrans,
arginine, cyclodextrins, glycine, lysine, glutamic acid, aspartic acid, gelatin and human serum
albumin [14].
1.5. Chitosan
CHT is a cationic linear polysaccharide, illustrated in Figure 1.6. It is a co-polymer comprising
N-acetyl-2-amino-2-deoxy-ᴅ-glucopyranose and 2-amino-2-deoxy-ᴅ-glucopyranose, being
obtained by partial deacetylation of chitin and is already being used in cosmetics [8,32–34].
Many applications of CHT have been proposed for therapy and theranostics, such as for the
delivery of therapeutic agents [35–37], bioimaging [37], tissue engineering [36], wound healing
[38,39] and stimuli-responsive materials [40]. CHT has been proposed for other uses, such as
waste water treatment [41], heavy metal chelation [42], biosensors [43] and as natural
fungicides [44].
For the delivery of therapeutic agents, CHT has been successfully applied to gene delivery [45–
47], itraconazole [48], bleomycin [49], growth factor hormones [50], BSA [51–53], IBP [53],
doxorubicin [54], dopamine [55] and paclitaxel [56].

Chapter 1. Introduction
11
Chitin is the second most occurring polysaccharide in nature, next to cellulose and is present in
crustaceous shells. Several millions of tons of chitin are harvested each year as the shell waste
of crustaceans, making it a relatively cheap and readily available source [32,34].
Figure 1.6: Chitosan structure, where n is related to the DD % and m to (100 – DD %). Ideal chitosan
would have m=0 and chitin would have n=0. Adapted from M. Dash et al. [32] and J. Kumirska et al. [34]
CHT is obtained by thermochemical deacetylation of chitin in an alkaline solution, usually an
aqueous 40-45% w/v NaOH solution at 90-120 oC during 5 hours. The conditions used in this
process determine the degree of deacetylation (DD) of CHT [32].
CHT is soluble in acid solutions with pH below 6.2 because due to the protonation of their
amine groups, which have a pKa between 6.2 and 7.0. At pH higher than 6.0, the amines
become deprotonated, rendering CHT a neutral charge and water insoluble. It has been
suggested that the pKa of CHT is dependent on the DD, so the solubility of CHT is also
dependent on the DD [32,33,36].
Many factors are affected by the DD and MW of CHT, as can be seen on Table 1.4.
Table 1.4: Relationship between structural characteristics and properties of CHT, adapted from M. Dash
et al. [32]
Property Structural characteristics*
Solubility ↗DD
Crystallinity ↘DD
Biodegradability ↘DD, ↘MW
Viscosity ↗DD
Biocompatibility ↗DD
Mucoadhesion ↗DD, ↗MW
Analgesic ↗DD
Antimicrobial ↗DD, ↗MW
Permeation enhancing effect ↗DD
Antioxidant ↗DD, ↘MW
Hemostatic ↗DD
*↗-directional proportional to property; ↘-inversely proportional to property
CHT can be eliminated by renal clearance, unless its MW is too large. If that is the case, then
CHT must be degraded by enzymes capable to hydrolyze glucosamine-glucosamine,
glucosamine-N-acetyl-glucosamine and N-acetyl-glucosamine-N-acetyl-glucosamine linkages,
such as lysozyme, which is also present in the lung mucosa [1,16,32,36,57,58].
Since it is biodegradable, biocompatible and non-toxic, CHT is an interesting choice to be used
as a drug carrier, protecting the drug against enzymatic degradation. Also, clinical tests made on

Chapter 1. Introduction
12
CHT-based biomaterials show that there are no inflammatory or allergic reactions due to its
application and possesses a LD50 in laboratory mice similar to sugar and salt. It is characterized
by molecular attractive forces due to electrostatic interactions between positively charged CHT
and negatively charged mucosal surfaces, promoting drug transmucosal absorption
[7,16,32,36,58–60].
CHT microparticles can be used as carriers, the drug is released due to the gelling ability of
CHT because when it contacts with aqueous solutions, the polymeric chain begins to swell as
water enters the small holes between each chain. Also, it has recently been confirmed that CHT
has a drug adsorption-enhancing effect in pulmonary tissues by opening of the intercellular
junction of the lung epithelium, as well as improving drug targeting and dissolution rate of
drugs [7,16,32,59].
Since CHT is soluble in weak acidic solutions, the production of microparticles offers the
possibility of avoiding hazardous organic solvents. Also, CHT has a good ability to control the
release of APIs, making it a material of interest to produce and develop drug release
systems[32].
1.6. Particle production
The majority of currently commercially available inhalation products consist of a micronized
drug in either agglomerated or blended form. Generally, such particles are produced by batch
crystallization, which then are filtered, dried and finally micronized by applying pressure,
friction, attrition, impact or shear forces [3].
Common methods for manufacturing dry powders for inhalation are vibration milling, ball
milling and jet-milling. These techniques can be disruptive methods that may generate hot-spots
during micronization, reducing the stability of the particles by generating amorphous domains in
the particles, and in some cases must operate in cryogenic conditions [3].
In jet-milling process, the material suffers many impacts before achieving a suitable size, which
then are separated from the larger ones by inertial impaction. Although a suitable particle size
will eventually be obtained it is a time-consuming method, prone to induce many alterations
upon the micronized material, such as on its surface, solid-state properties and inducing
electrostatic charges. Even more, this method will not be able to produce porous or hollow
particles, composites nor encapsulated materials. This type of micronization may also produce
hot-spots, which will generate amorphous domains and reduce particle stability. However, this
particular problem may be overcome by milling the material suspended in a fluid propellant in a
cryostat, and later by the evaporation of the propellant [61–63].
Microparticles may also be produced by controlled crystallization of drugs, which can be
attained by an antisolvent precipitation technique using growth retarding additives, whose
concentration is inversely proportional to particle diameter. The main challenge in this

Chapter 1. Introduction
13
technique is particle size control, because small molecules tend to form large crystals. In order
to prevent this, high concentrations of growth retarding excipients must be used which must be
removed from the final material due to toxicity issues, and then a further drying process is
required. This drying process is complicated and may induce cake formation and reduced
powder dispersibility [3,64–66].
Spray drying technology has been widely applied, due to its simplicity, scale-up, ease of
operation and the ability to produce composite materials. This process comprises the
atomization of the feed solution into a spray, then the spray will contact with air at elevated
temperatures leading to particle drying, and finally, dry particles are separated from the air
through a cyclone and/or a filter bag. Particle atomization can be optimized by a choice of
several types of atomizers, such as rotary atomizers, pressure nozzles and two-fluid nozzles.
Particle recovery can be further optimized, by replacing the filter unit with a vacuum system,
allowing a better drying at lower operating temperatures, and by designing high efficiency
cyclones. Also, this technique allows the optimization of particle characteristic by changing the
operating parameters, such as atomization pressure, feed rate, drying temperature, feed
concentration and nozzle orifice diameter. This technique has been successfully used in
processing many types of drugs, excipients, biological compounds and producing porous
particles [3,67–72].
1.7. Supercritical fluid technology
The supercritical state of matter was first identified in 1822 by engineer and physicist baron
Charles Cagniard de La Tour in his cannon barrel experiments by the discontinuities of the
sounds made by a rolling ball inside cannon filled with various fluids [73].
Supercritical fluids are compressed gases or liquids above their critical temperature and pressure
but below the pressure required for solidification to occur, as shown in Figure 1.7. It provides
adjustable solvent selectivities based on temperature and pressure, also the possibility of
operating at mild conditions with reduced use of organic solvents what makes this technology
an alternative to conventional methods for pharmaceutical manufacturing [74–76].

Chapter 1. Introduction
14
Figure 1.7: Phase diagram of CO2, adapted from W. Leitner et al. [76]
Supercritical fluids have properties between those of liquids and gases, as seen in Table 1.5
[76,77].
Table 1.5: Typical order of magnitude of physical properties of gases, supercritical fluids and liquids,
adapted from W. Leitner et al. [77]
Property Gas Supercritical Fluid Liquid
Density (g.cm-1) 10-3 0.3 1
Viscosity (Pa.s) 10-5 10-4 10-3
Diffusivity (cm2.s) 0.1 10-3 10-6
At the “near-critical” region, the properties of the compound start to gradually change. In the
area around the critical point, the compressibility of the fluid is much greater that what is
predicted from the ideal gas law, approaching to infinity. Due to this effect the sound velocity in
the fluid becomes minimum, so this has been one way of determining the critical data of
mixtures[76–79].
In the supercritical region, the fluid density is a function of temperature and pressure, and
changes sharply with pressure in the compressible region and more gradually at higher
pressures, as can be seen in Figure 1.8 [76].

Chapter 1. Introduction
15
Figure 1.8: The density and solvent power of sc-CO2 as a function of temperature and pressure, adapted
from W. Leitner et al. [76].
There can be density fluctuations in the fluid, especially near the critical point due to the large
fluid compressibility. If the fluctuations have the same order of magnitude as the wavelength of
visible light it leads to opalescence due to light scattering, being this fact often used to
determine the critical point [76].
The solvent properties of the supercritical fluid are related to the fluid density and so are
dependent upon the operating pressure and temperature. Hildebrand and Scott have provided a
parameter to define the solvent power of supercritical fluids called the Hildebrand parameter,
which they found to be directly proportional to fluid density, also shown in Figure 1.8 [76].
Supercritical fluids provide a cleaner and a more environmentally friendly approach over
organic solvents, while also providing health and safety, process and chemical benefits. Also,
many processes can benefit of the physical properties of supercritical fluids, namely the high
diffusivity, low viscosity and density, making their use very interesting for continuous
processes. Since they have an adjustable solvating power, this also makes them very interesting
choices for use in extraction processes being able to separate products from by-products and
catalysts. Adding the possibility of avoiding solvent residues in the product, this makes
supercritical fluids a very interesting choice for pharmaceutical, food-processing and electronic
industries [77]. Having such appealing properties, supercritical fluids find uses in many areas,
such as chromatography [80], extraction [81,82], pharmaceutical compounds [3,24] and
polymer synthesis [83–87].

Chapter 1. Introduction
16
Carbon dioxide is the fluid of choice due to its low critical temperature (31.1 °C) and moderate
pressure (73.8 bar), being non toxic, readily available and inert [74,75]. The use of sc-CO2 as a
solvent is a very interesting approach, as it allows recycling waste CO2, reducing its emission to
the atmosphere while at the same time replacing other organic solvents which are
environmentally damaging [76]. Supercritical carbon dioxide (sc-CO2) offers an efficient
extraction and separation of organic solvents, enabling production of particles in a pure dry
form. Its high compressibility can be used to promote efficient atomization of solutions, while at
the same time reduce the manufacturing complexity, energy used and solvents requirements,
affording a more environment friendly process [3].
A common method for obtaining microparticles by using sc-CO2 is the Rapid Expansion of
Supercritical Solutions (RESS), which is comprised by two steps, first the solid material is
dissolved in sc-CO2, and then the solution is rapidly expanded by lowering the pressure,
promoting a rapid cooling rate and inducing supersaturation, which leads to microparticle
formation. The morphology of the materials depend on the operating temperature, pressure
drop, impact distance of the jet to a surface and nozzle diameter [88–92].
Another method commonly used for obtaining microparticles using sc-CO2 is supercritical
antisolvent (SAS), where particles are produced when a drug solution is brought into contact
with sc-CO2 in a semi-continuous method. This process has the advantage of controlling the
physical form of drug powders by varying the working conditions of temperature, pressure or
solution flow rate. A very important parameter in this process is the injector, which is designed
to break up the liquid jet, forming small droplets that expand in the precipitator. The major
drawback of SAS is that the solvent must be completely miscible in sc-CO2, which is a problem
when aqueous solvents are used, since water is not miscible with sc-CO2 [3,91–97].
1.8. Supercritical Assisted Atomization
Since CHT is not soluble in sc-CO2, a process based on its solvent effect cannot be used.
However, a process based on the anti-solvent effect of CO2 cannot also be applied, since a 1%
acetic acid aqueous solution is used [7,59,94–96].
Supercritical Assisted Atomization (SAA) is a process patented by E. Reverchon in US
7,276,190 B2, based on the solubilization of controlled quantities of sc-CO2 in liquid solutions.
SAA offers many advantages over conventional methods, the possibility of operating in a
continuous method in mild operating conditions and being able to use both organic and
inorganic solvents while at the same time providing a good control over particle size and
distribution [7,75,95,96,98,99].
The apparatus mainly consists of two pumps to deliver liquid CO2 and the liquid solution, a
saturator, a precipitator and a condenser. The pumps are used to deliver the liquid solution to the

Chapter 1. Introduction
17
saturator and to pump liquid CO2, attained through a cryostat. Liquid CO2 is then heated and the
pressure is raised until supercritical conditions are reached [98,99].
The mixing takes place in a saturator containing high-surface packing and ensuring long
residence times in order to achieve near-equilibrium conditions. The solution will then be
atomized through a nozzle by a two-step atomization: first primary droplets are obtained due to
pneumatic atomization at the nozzle exit; then a secondary atomization process takes place by
decompressive atomization due to CO2 expansion from inside the primary droplets, shown in
Figure 1.9. This implies that the smallest particle size that can be achieved is the size of the
smallest droplet achieved during the first atomization. The droplet size is determined by the
viscosity, surface tension and the amount of sc-CO2 dissolved in the liquid solution, while
temperature and chemical characteristics of the solute determines whether the particle is
crystalline or amorphous [7,75,95–100].
Figure 1.9: Representation of the atomization mechanism, adapted from E. Reverchon et al. [101]
The solubility of sc-CO2 depends on the properties of the solvent and on operating temperature
and pressure, being related to high-pressure vapor liquid equilibria (VLEs) of the system
[101,102].
The data on the solubility of acetic acid-water mixtures in sc-CO2 are only available in a limited
range of temperatures, being difficult to take into account the effect of acetic acid in the VLE.
On the case of ethanol-water, there is much more information available in the literature [103].
Since there are only small amounts of acetic acid (1 % v/v) it became convenient to see where
the operating conditions fall in the VLE for the ternary system water-ethanol-CO2. However, the
possibility that acetic acid can influence the VLE must be taken into account.
Fixing pressure and temperature, the mass flow ratio between CO2 and the solvent determines
the operating point the ternary system as depicted in Figure 1.10 [101].
Solution Sc-CO2
P>74 bar Pneumatic
atomization
P≈1 bar
Decompressive
atomization

Chapter 1. Introduction
18
Figure 1.10: VLE of water-CO2-ethanol system, adapted from C. Duarte et al. [103]
At relatively low pressures and temperatures, the solubility of CO2 in aqueous solutions is low,
and the operating point always falls in a two-phase gas-liquid region [101,104]. However, using
small amounts of ethanol as co-solvent may significantly improve the miscibility of sc-CO2 in
water increasing the process efficiency [102,105,106]. Although this improves the solubility of
sc-CO2 in aqueous solutions, the operating point still falls in a two-phase region, so there is no
effect of the gas to liquid ratio on the composition of the phases [101,104].
During particle formation, dissolved CO2 reduces the viscosity and surface tension of the
solution, while non-dissolved CO2 enhances the pneumatic effect, improving primary
atomization [74,107].
Many compounds have already been successfully atomized using SAA, such as cromolyn
sodium [108], BSA [74], asthma drug HMR1031 [75], gentamicin sulfate [109], lysozyme [96],
tetracycline [97], rifampicine [97], yttrium acetate [98], sodium chloride [98], zinc acetate [98],
aluminum sulfate [98], zirconyl nitrate hydrate [98], carbamazepine [98], ampicilin trihydrate
[98], triclabenzadol [98], dexamethasone [98], chitosan [7,101], PMMA and PLLA [110]
among others.
In this work it was used supercritical assisted atomization process in order to produce CHT
microparticles to be used as excipients of new formulations for the controlled delivery of drugs
to the lung. IBP and BSA were used as a small model drug and mode protein, respectively, in
order to assess the effects of co-precipitation in particle size, size distribution, morphology,
crystallinity and specific surface area. These effects were also assessed by varying operating
parameters, such as saturator pressure, precipitator temperature, mass flow rate and
concentration. Drug release profiles of particles loaded with IBP were also made in order to
assess the pharmaco-kinetic performance of loaded CHT-based microparticles.
C2H5OH
CO2 H2O

Chapter 2. Experimental Section
19
Chapter 2. Experimental Section
2.1. Particle Production
2.1.1. Materials
Chitosan (viscosity 5-20mPa.s, 0.5% in 0.5 acetic acid at 20 C) was purchased from Tokyo
Chemical Industry. (s)-(+)-Ibuprofen (99% purity) and bovine serum albumin (98% purity)
were purchased from Sigma Aldrich. Acetic acid glacial (99.7% purity) was purchased from
Carlo Erba Reagents. Ethanol absolute anhydrous (99.9% purity) was purchased from Scharlau.
Carbon dioxide UN1013 was obtained from Air Liquide. All components were used as received
without any further purification.
2.1.2. SAA process and apparatus
Before the atomization takes place, the formulations to be tested were dissolved in a 1% (v/v)
acetic acid solution prepared with Milli-Q water with stirring until dissolved. This solution was
fed to a laboratory scale SAA apparatus [99], schematically represented in Figure 2.1. After
liquefying in a cryogenic bath, liquid carbon dioxide is pumped through a high-pressure pump
(HPLC pump K-501, Knauer) into a heated bath and then mixed and solubilized within the
liquid solution in the static mixer. The polymeric liquid solution is pressurized through a high-
pressure pump (HPLC Pump 305 Gilson). The static mixer promotes the mixture between
supercritical carbon dioxide and the liquid solution at near-equilibrium conditions. A kinetics
static mixer 3/16, model 37-03-075 from Chemieer was used (internal diameter 4.8 mm, length
191 mm and 27 helical mixing elements). The mixture liquid solution-CO2 obtained is sprayed
through a spray nozzle (I.D. 150 μm) to produce atomization in the precipitator. The precipitator
is an aluminum vessel operating at near atmospheric conditions with two sapphire windows in
opposite sides to allow the operator to see the spray. Temperature control is assured by a set of
heating tapes that cover its external surface and are connected to a Isopad TD 2000 heat
controller (0.1 °C stability). The pressure of the precipitator is controlled for each assay and is
connected to Setra pressure indicator (0.1 psig stability). The temperature of static mixer is
assured by a set of heating tapes and is connected to an LDS temperature controller. A flow rate
of heated compressed air is delivered into the precipitator to assist the rapid liquid solvent
evaporation from particles. At the end of the precipitator a cyclone enables the separation of the
atomized particles from the flow stream, gases are discharged by ventilation and the powder is
collected at the bottom of the cyclone in a suitable container. In order to obtain higher particle
recovery, a filter (FSI, nylon mono-filament, 50 μm) was introduced after the cyclone.

Chapter 2. Experimental Section
20
Figure 2.1: Schematic representation of SAA apparatus: (CB) cooling bath; (P1) CO2 pump; (HB)
heating bath; (PI) manometer; (Sol) liquid solution; (P2) liquid pump; (S) static mixer; (P) precipitator;
(Gas) discharged gases; (C) cyclone; (PC) precipitated powder; (F) filter bag; (FI) flowmeter; (TI)
temperature indicator; (TIC) temperature controller
Calibrated thermocouples, manometers, check valves, high pressure tubing and connections
complete the apparatus as seen in Figure 2.2.
Figure 2.2: Laboratory scale SAA apparatus used to produce microparticles.

Chapter 2. Experimental Section
21
2.2. Particle Characterization
Particle size analysis was performed by a particle analyzer system (Morphologi G3 Essentials,
from Malvern Instruments Ltd) shown in Figure 2.3. More than 20000 particles were considered
in each particle size distribution calculation. The statistical analysis representing the particle
size distribution was performed using the software OriginPro 8.7. The span, a measurement of
the width of particle distribution was calculated as follows:
Where dV,90, dV,50 and dV,10 are the particle diameter in volume corresponding to 90, 50 and 10%
of the population, respectively.
Figure 2.3: Morphologi G3 Essentials used to determine particle size distribution.
The morphology of the atomized particles was investigated using Scanning Electron
Microscopy (SEM) equipment from Hitachi, S-2400 instrument, with an accelerating voltage set
to 15 kV and at various amplifications. All the samples were mounted on aluminum stubs using
carbon tape and were gold coated before analysis.
Particles specific surface area was determined in a Micromeritics ASAP 2010 – Physisorption
Analyzer in nitrogen using 50 mg of powder sample. The analysis was performed in two phases,
first by heating the sample up to 320 K for 42 h, in order to release all adsorbed gases in the
particle. Secondly, the temperature was lowered and maintained at 77.35 K during the time of
the analysis. The results were treated using the software OriginPro 8.7.
The pore size distribution and bulk density was determined in a Micromeritics Auto Pore IV
9500 mercury porosimeter using 3 to 5 cm3 for each analysis. These analyses were performed in
two steps, first by applying low pressure at 345 kPa and secondly by applying high pressure at
223 MPa. The results were treated using the software OriginPro 8.7.

Chapter 2. Experimental Section
22
True densities of microparticles were determined in a Micromeritics AccuPyc 1330 Pycnometer
apparatus by measuring the pressure change of helium in a calibrated volume. The assays were
performed at Faculty of Pharmacy, University of Lisbon.
Tapped density of microparticles was determined by compressing a known mass of powder in a
volumetric container, and measuring the final volume.
In order to determine the aerodynamic diameter of the particles an equation based on the
Newton’s general dynamic equation for non-spherical particles with volume-equivalent
diameter (dV) is used as follows:
Where ρ0 is the unit density (of spherical calibration spheres) and ρ is the particle density. CC is
the Cunningham slip correction. Cd is the particle drag coefficient which is generally a function
of particle sphericity and particle Reynolds number:
Where ρA and μ are the air density and viscosity, v is the particle velocity relative to the air
stream. ReA and ReV denote particles with diameters dA and dV respectively.
For the spherical particles in Stokes flow regime (Re<1), the drag coefficient assumes the well-
known relationship: Cd=24/Re. Therefore, the aerodynamic diameter is calculated by a
simplified expression for Stokes aerodynamic diameter:
Where χ is the dynamic shape factor, defined as the ratio of the drag force on a particle to the
drag force on the particle volume-equivalent sphere at the same velocity. Thus non-spherical
particles tend to have a smaller aerodynamic diameter.
To calculate the Shot Weight, which is the amount of particles that can be released from
capsule, it was used the Dosage Unit Sampling Apparatus (DUSA) (Copley), schematically
represented in Figure 2.4.
Figure 2.4: Schematic representation of the DUSA, adapted from Copley Scientific [111]
This apparatus also allowed calculating the delivered dose. During testing, air is drawn by using
a High Capacity Pump model HCP5 (Copley) through the sampling apparatus to simulate
inhalation. A number of ten capsules were tested for each formulation containing 30 mg of

Chapter 2. Experimental Section
23
powder in each HPMC capsules nº3 (Aerovaus) from an AerolizerTM
dry powder inhaler. Air
flow was regulated in a Critical Flow Controller model TPK (Copley) until a pressure drop of in
P1 was 4kPa was achieved, and the flow of air was measured using a flow meter model DFM3
(Copley) and the time for each run were determined by applying the following equation:
Where Qair is the flow of air measured from the flow meter. Critical flow must be guaranteed by
checking if the ration P3/P2 ≤ 0.5. Then each capsule was released from an AerolizerTM
inhaler
under the tested conditions for the duration determined as reported in the European
Pharmacopoeia[112].
The emitted fraction (EF%) corresponds to the total loaded powder exiting the capsule, and is
calculated as follows:
Where mfull and mempty are the weights (mg) of the capsule before and after simulating the
inhalation and mpowder is the initial weight (mg) of the powder in the capsule.
The aerodynamic assessment of fine particles was determined by using an aluminum Andersen
Cascade Impactor apparatus (ACI) (Copley), as shown in Figure 2.5, by using the same air flow
determined in the Shot Weight.
Figure 2.5: Andersen Cascade Impactor apparatus
The air was drawn by using a High Capacity Pump model HCP5 (Copley) and air flow was
regulated in a Critical Flow Controller model TPK (Copley). The capsules were prepared in the
same way as for the Shot Weight for the same amount of time determined previously following
the protocol of de European Pharmacopoeia [26]. The Fine Particle Fraction (FPF) was
determined by the interpolation of the percentage of the particles containing less than 5 μm. The
Mass Median Aerodynamic Diameter (MMAD) was determined as the particle diameter
corresponding to 50% of the cumulative distribution. The Geometric Standard Deviation (GSD)
was determined by the following equation:
Chapter 2. Experimental Section
24
Where d84 and d16 are the diameters corresponding to 84% and 16% of the cumulative
distribution, respectively.
The X-ray diffraction patterns were obtained by treating the samples in a RIGAKU X-ray
diffractometer, model Miniflex II. Samples were placed in a holder and analyzed through CuKα
radiation (30 KV/15 mA), with a 2θ angle ranging between 2o and 55
o with a scan rate of
1o/min.
The differential scanning calorimetry patterns were obtained by treating the samples in a
differential scanning calorimeter Setaram DSC 131. The samples were placed in a holder were
the temperature was raised from 25 oC to 300
oC in a heating rate of 10
oC/min.
FT-IR was performed in order to study the interactions between CHT and IBP, CHT and TAC-
β-CD. The FT-IR spectra of the materials were done using potassium bromide (KBr) tablets
(1% w/w of powder in KBr) with resolution of 1 cm-1
and 16 scans per sample on a Tensor 27
FTIR (Bruker) coupled with Opus Spectroscopy Software.
The swelling degree was measured in aqueous solution of PBS at pH=7.4 or at a solution of
pH=6.8 using Malvern Morphologi G3 equipment, Figure 2.6, at 25, 33 and 37 oC and was
evaluated using the following equation:
Where SD is the swelling degree, and Vs and Vd are the volumes of the swollen and the dry
polymer coatings, respectively. Since the swelling is directly related to the water uptake, it is
possible to determine the volume of water adsorbed in the particles.
Figure 2.6: Malvern Morphologi G3 apparatus measuring particle swelling.
CHT microparticles co-atomized with ibuprofen (IBP) and bovine serum albumin (BSA) (138
mg) were introduced in a dialysis membrane, SnakeSkin Dialysis Tubing (3,500 MWCO, 22
mm x 35 feet dry diameter, 34 mm dry flat width, 3.7 mL/cm, Thermo Scientific), and
suspended in 90 mL of PBS solution (pH 7.4) at 37 °C. One mL aliquots were withdrawn
periodically and the same volume of fresh medium was added to the suspension. The amount of
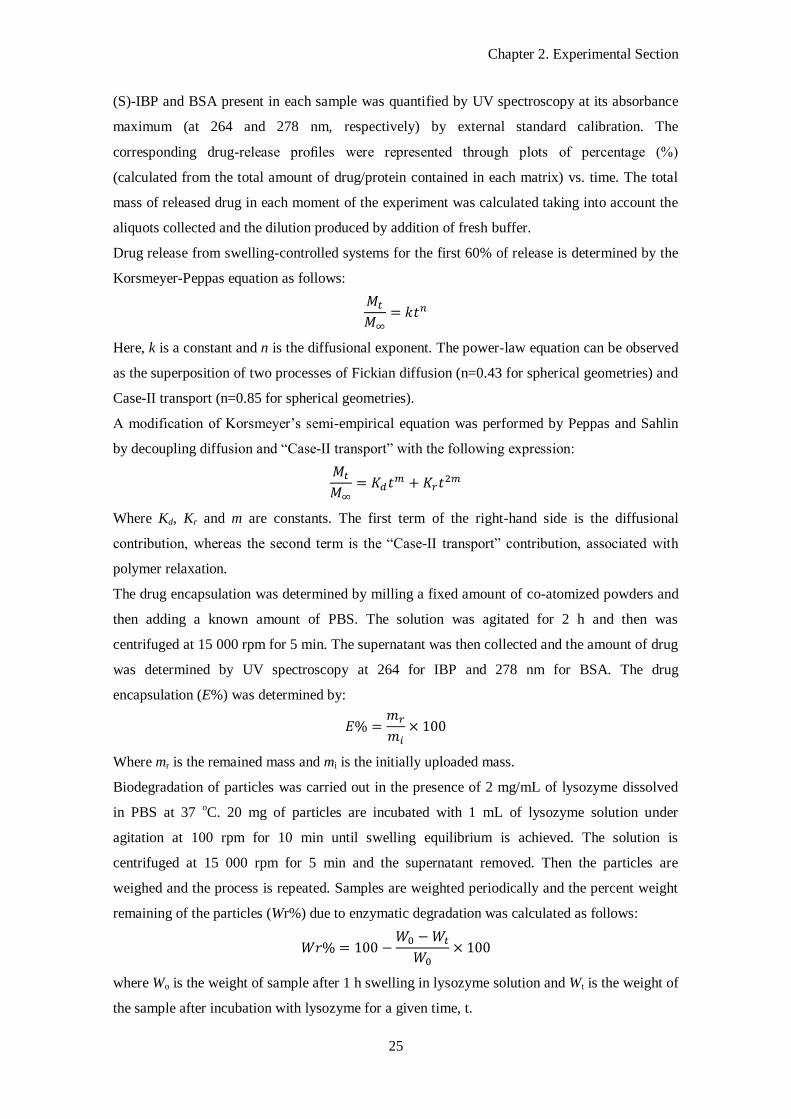
Chapter 2. Experimental Section
25
(S)-IBP and BSA present in each sample was quantified by UV spectroscopy at its absorbance
maximum (at 264 and 278 nm, respectively) by external standard calibration. The
corresponding drug-release profiles were represented through plots of percentage ( )
(calculated from the total amount of drug/protein contained in each matrix) vs. time. The total
mass of released drug in each moment of the experiment was calculated taking into account the
aliquots collected and the dilution produced by addition of fresh buffer.
Drug release from swelling-controlled systems for the first 60% of release is determined by the
Korsmeyer-Peppas equation as follows:
Here, k is a constant and n is the diffusional exponent. The power-law equation can be observed
as the superposition of two processes of Fickian diffusion (n=0.43 for spherical geometries) and
Case-II transport (n=0.85 for spherical geometries).
A modification of Korsmeyer’s semi-empirical equation was performed by Peppas and Sahlin
by decoupling diffusion and “Case-II transport” with the following expression:
Where Kd, Kr and m are constants. The first term of the right-hand side is the diffusional
contribution, whereas the second term is the “Case-II transport” contribution, associated with
polymer relaxation.
The drug encapsulation was determined by milling a fixed amount of co-atomized powders and
then adding a known amount of PBS. The solution was agitated for 2 h and then was
centrifuged at 15 000 rpm for 5 min. The supernatant was then collected and the amount of drug
was determined by UV spectroscopy at 264 for IBP and 278 nm for BSA. The drug
encapsulation (E%) was determined by:
Where mr is the remained mass and mi is the initially uploaded mass.
Biodegradation of particles was carried out in the presence of 2 mg/mL of lysozyme dissolved
in PBS at 37 oC. 20 mg of particles are incubated with 1 mL of lysozyme solution under
agitation at 100 rpm for 10 min until swelling equilibrium is achieved. The solution is
centrifuged at 15 000 rpm for 5 min and the supernatant removed. Then the particles are
weighed and the process is repeated. Samples are weighted periodically and the percent weight
remaining of the particles (Wr%) due to enzymatic degradation was calculated as follows:
where Wo is the weight of sample after 1 h swelling in lysozyme solution and Wt is the weight of
the sample after incubation with lysozyme for a given time, t.

Chapter 2. Experimental Section
26

Chapter 3. Results and Discussion
27
Chapter 3. Results and Discussion
Microparticles for use as DPIs in inhalation therapy were produced by supercritical assisted
atomization (SAA). Since CHT is only soluble in 1% v/v acetic acid aqueous solution, all
compounds were processed in this solution. IBP, a nonsteroidal anti-inflammatory drug, was
used as a model for a small drug to study the effect of its co-atomization with CHT. Also, one
must bear in mind that IBP solubility in aqueous solutions is very low due to its hydrophobicity,
so very small amounts of the drug was used in each assay. BSA is used as model protein, and it
was used also to study the effect of its co-atomization with CHT. Unlike IBP, BSA is soluble in
aqueous solutions and has also been classified as a natural surfactant, so it also became
interesting to study its co-atomization with both CHT and IBP.
3.1. Preliminary studies on chitosan microparticles
3.1.1. Morphology and solid state properties of CHT microparticles
Before proceeding to co-atomized microparticles, it was necessary to determine the best
operating conditions for the production of microparticles by changing one operating parameter
while maintaining the others unchanged.
The minimum operating temperature at the precipitator to successfully produce dry
microparticles was found to be 70 oC. Below this temperature the particles were still wet.
The best operating pressure was found to be 10 MPa. The operating pressure was varied from 9
MPa to 11 MPa, but no effect on particle size or morphology was observed in this range of
pressure, so the operating pressure was determined as 10 MPa.
The volumetric gas to liquid ratio (R=QCO2/Qsol) was also varied between 8 and 5. As expected,
no changes were observed in the particle size or morphology, as expected due to the reasons
explained previously in Chapter 1.
The ethanol content was also changed to test its impact on particle atomization and, since it is
soluble in sc-CO2, it would raise the affinity of water for sc-CO2 leading to a more efficient
drying. On the other hand, CHT is not soluble on ethanol, so if its concentration is raised too
high, CHT will start to precipitate. Ethanol content was successfully varied between 9.3 % v/v
and 18.6 % v/v, and it was found that above this point, CHT started to precipitate inside static
mixer. So, in order to provide a better particle drying while allowing operating at lower
temperatures, the ethanol content was fixed at 18.6 % v/v.
Under these conditions, CHT was successfully atomized, showing a well defined spray when
passing through the nozzle, seen in Figure 3.1, with a conical shape in the fully developed
atomization regime, where it is possible to see a spray core and clouds of atomized
particles[100,113,114].

Chapter 3. Results and Discussion
28
Figure 3.1: Spray image of particle atomization using SAA.
However, particle recovery was found to be very low (approximately 10% in mass). Initially
only the cyclone was used for particle recovery, and it was found that most of the particles
produced were being vented along with the gas stream. So it was introduced a filter bag after the
cyclone in order to raise particle recovery. With this conformation, it was possible to recover up
to 70 % in mass of particles produced.
The amount of solution to be processed by SAA was also modified, and it was found that as
greater amount of solution was used, higher particle recovery percentage was achieved. This
may be due to the fact that only a fixed amount of particles are lost to their adsorption to walls
of the apparatus, and once that threshold is reached, particles cease to adhere to the walls,
raising particle recovery [96,115].
Particles produced by SAA under the specified conditions have a white coloration and appear to
be in the form of dry powders when recovered from the equipment. If the particles are subject to
high moisture content, they become sticky and turn to a yellow coloration.
By fixing the aforementioned parameters, the influence of CHT concentration, MW and nozzle
diameter were also assessed. Table 3.1 and Table 3.2 show that it is possible to obtain spherical
CHT microparticles with geometric diameters between 3.5 and 5.5 μm.
Table 3.1: Operating parameters of SAA for different quantities of CHT (CHT %) in the liquid solution,
CHT molecular weight (MW), nozzle diameter and particle recovery. Also shown are the mean
volumetric diameter (Dv), span, shape, roughness and solid state.
Morphologi SEM XRD /
DSC
Assay
CHT
%
(g/mL)
MW
Nozzle
diameter
(μm)
Recovery
(%)
Dv, 50
(μm) Span Shape Surface Solid state
1 0.60 Medium 150 49.3 3.5 1.31 Spherical Smooth Amorphous
2 1.20 Medium 150 70.4 3.1 1.55 Spherical Smooth n.a.
3 0.60 Medium 300 48.7 5.5 0.81 Spherical Rough n.a.
4 0.60 Low 150 50.0 4.0 1.09 Spherical Smooth n.a.

Chapter 3. Results and Discussion
29
Table 3.2: Properties of CHT microparticles produced by SAA in assay 1: BET specific surface area
(aBET), pore diameter (Dp), volume occupied in the monolayer (νm), porosity, apparent density, bulk
density, true density and tapped density.
Nitrogen porosimetry Mercury porosimetry Helium
Pycnometer
Graduated
container
Assay aBET (m2/g)
Dp
(nm)
vm
(cm3/g)
Dp
(nm)
Porosity
(%)
Apparent
density
(g/mL)
Bulk
density
at 0.51
psia
(g/mL)
True
density
(g/mL)
Tapped
density
(g/mL)
1 15.58±0.80 6.31 4.15 137 69.4 0.969 0.296 1.444±0.012 ~0.4±0.05
By analyzing Table 3.1, it is possible to conclude that particles produced by this method have
mean volumetric diameters between 3.5 and 5.5 μm and are of spherical shape. Another
interesting thing to observe is that polymer concentration affects particle recovery, but not the
size, implying that more particles, in number, are produced. Also, using a larger nozzle diameter
to produce microparticles with these conditions appears to increase particle’s diameter.
Analyzing Table 3.2, it becomes apparent that by SAA process we can produce CHT
microparticles with macropores with a high degree of porosity (about 70%) with a bulk density
of 0.296 g/mL. It is also possible to determine the true density of the particle, which is the
density of the polymer without vacant spaces, indicating that CHT has a density of 1.444 g/mL.
It is also possible to confirm the presence of closed pores by comparing the apparent density
with the true density since helium can enter these closed pores while mercury cannot, making
the apparent density lower than the true density.
To calculate particles’ aerodynamic diameter and Stokes aerodynamic diameter, the bulk
densities obtained by mercury porosimetry were considered. However, in order to determine
which equation to use it becomes necessary to know the flow regime of the particles by
analyzing the particles’ Reynolds number. This calculation was performed for the range of 10%
to 90% particle diameter in volume, being the results presented in Table 3.3.
Table 3.3: Particles’ Reynolds number calculated for CHT microparticles obtained in assay 1.
Dv,10% (μm) Dv,90% (μm) Rep,10% Rep,90%
1.43 4.71 0.19 0.64
By looking at Table 3.3 we can conclude that the CHT microparticles are in stokes flow regime.
Hence, it is possible to use the Stokes equation to determine these particles’ aerodynamic
diameter.
As previously stated the most important diameter for inhalations purpose is the MMAD. To
obtain this diameter it was used the Andersen Cascade Impactor (ACI). But before doing an
ACI, it is necessary to determine the emitted fraction. In order to do that, a test named Shot

Chapter 3. Results and Discussion
30
Weight was performed, having obtained an emitted fraction of CHT microparticles of
98.1±0.1%, indicating that almost all of the powder is released from the capsule. So these
microparticles were analyzed by ACI under the same conditions as in the Shot Weight,
obtaining the results shown in Figure 3.2.
caps
ule
inha
ler
i. p.
9 um
5.8
um
4.7
um
3.3
um
2.1
um
1.1
um
0.7
um
0.4
um
0
10
20
30
40
CH
T %
Cut-off diameter
Figure 3.2: ACI analysis for CHT microparticles produced by SAA.
Analyzing Figure 3.2 it is possible to see that the majority of the powder is lost in the Induction
port, which simulates the upper airways. This may be due to the formation of turbulent eddies in
this zone. With these results it became possible to obtain not only MMAD but also the fine
particle fraction (FPF), as well as the Geometric Standard Deviation (GSD). These results are
compared with Stokes Aerodynamic diameter in Table 3.4.
Table 3.4: Aerodynamic diameters by Stokes equation and ACI, as well as FPF and GSD for CHT microparticles produced by SAA.
DA (Stokes)
particle (μm)
DA (Stokes) with
aggregates (μm)
MMAD
(μm) FPF GSD
1.41 3.8 2.9 26.2 2.7
Analyzing Table 3.4 it is clear that there is a big deviation between Stokes aerodynamic
diameter and MMAD for CHT microparticles. This implies that these particles form aggregates
that do not disaggregate when inhaled, leading to slightly larger particles’ diameter when tested
with an ACI. This seems a good explanation, especially because the MMAD is found between
Stokes diameter determined without aggregates and with aggregates. These results may also
indicate that some particles disaggregate due to the flow produced with inhalation.
Particles produced show a narrow size distribution predominantly between 1 and 6 μm, as can
be observed in Figure 3.3, showing no difference in the distribution by changing CHT
concentration.

Chapter 3. Results and Discussion
31
0 2 4 6 8 10
0,0
0,5
1,0
CE
Dia
mete
r N
um
ber
Dis
trib
ution
CE Diameter (µm)
Figure 3.3: Distribution of particles size from CHT microparticles with medium MW microparticles in a
150 μm diameter nozzle (black), medium MW microparticles in a 150 μm diameter nozzle with higher
concentration (green), medium MW in a 300 μm diameter nozzle (red) and low MW in a 150 μm
diameter nozzle (blue) obtained by Morphologi G3 analysis.
The most significant deviation from this result was the particle size distribution of CHT
microparticles processed by a nozzle with 300 μm diameter, characterized by a broad PSD,
although slightly larger particles were also seen with low MW CHT, implying atomization
problems.
Looking at the SEM images in Figure 3.4, it is possible to observe that all CHT microparticles
produced under the specified conditions are spherical with diameters between 0.5 and 6 μm.
While CHT particles from assays 1, 2 and 4 have a smooth surface, assay 3 appears to yield
slightly rougher surfaces, indicating that the nozzle diameter has influence in particle shape.
Figure 3.4: SEM images of CHT microparticles (a) medium MW atomized with a 150 μm diameter
nozzle and low concentration (assay 1), (b) medium MW atomized with a 150 μm diameter nozzle and
high concentration (assay 2), (c) medium MW atomized with a 300 μm diameter nozzle and low
concentration (assay 3), (d) low MW atomized with a 150 μm diameter nozzle and low concentration (assay 4), the magnification used was 20,000 X.
(a) (b)
(c) (d)

Chapter 3. Results and Discussion
32
From Morphologi G3 images, shown in Figure 3.5, it can be seen that the particles produced
have a tendency to form small aggregates. Also, it appears that this tendency is slightly higher
for particles atomized by a 300 μm nozzle and with lower MW. Also, the broader PSDs
observed for particles atomized by a 300 μm nozzle and with lower MW might be due to the
higher quantity of agglomerates present in these cases.
Figure 3.5: Morphologi G3 images of CHT microparticles (a) medium MW atomized with a 150 μm
diameter nozzle and low concentration (assay 1), (b) medium MW atomized with a 150 μm diameter
nozzle and high concentration (assay 2), (c) medium MW atomized with a 3000 μm diameter nozzle and
low concentration (assay 3), (d) low MW atomized with a 150 μm diameter nozzle and low concentration
(assay 4), the magnification used was 20,000 X.
In order to determine the effect of SAA on the solid-state of the components used in the
formulations, XRD analysis was performed for both raw and SAA processed CHT. Raw CHT,
Figure 3.6 (a), showed two broad peaks at about 10 o and 20
o, indicating a semi-crystalline
compound [7,104]. CHT processed by SAA, on the other hand, appears to be amorphous, as the
two peaks characteristic of raw CHT gave rise to a single broad peak in the pattern indicated in
Figure 3.6 (b) [7].
(a) (b)
(c) (d)

Chapter 3. Results and Discussion
33
0 5 10 15 20 25 30 35 40
2(º)
Figure 3.6: X-ray diffraction patterns of (a) raw CHT and (b) CHT microparticles.
From DSC analysis, shown in Figure 3.7 for the first run and Figure 3.8 for the second run, it is
possible to obtain several aspects regarding the particles’ properties, confirming or confuting the
results obtained from XRD. The first run was made to remove all the water adsorbed in the
polymers, without using too high temperatures that could damage the material.
50 100 150 200
Temperature (°C)
Figure 3.7: First run of the DSC of (a) CHT processed by SAA; (b) raw CHT from 25 oC to 200 oC with
a flow rate of 10 oC/min.
100 200 300
Temperature (°C)
Figure 3.8: Second run of the DSC of (a) CHT processed by SAA; (b) raw CHT from 25 oC to 300 oC
with a flow rate of 10 oC/min.
(a)
(b)
(a)
(b)
(b)
(a)
Exo
Exo

Chapter 3. Results and Discussion
34
Analyzing Figure 3.7 it is possible to observe that raw CHT has a peak around 140 oC due to
water evaporation.
Analysing Figure 3.8 it can be seen that CHT microparticles processed by SAA possess a broad
endothermic peak in the first run around 100 oC, attributed to water evaporation due to adsorbed
moisture, reflecting both physical and molecular changes of the polymer. Also, since this peak
has a much lower intensity, it implies that the microparticles are dryer than raw CHT, which
proves the good drying capabilities of SAA process [101,116].
CHT microparticles produced by SAA appear to have a small endothermic peak at 170 oC. This
peak appears due to the evaporation of bound water associated with hydrophilic groups in the
molecular chain [117]. Some authors state that the Tg of CHT is found from 150 to 203 oC
[116,118] while others state that the Tg is about 30 to 87 oC [119–121]. With such discrepancies
it becomes difficult to clearly determine the Tg of CHT. The results obtained in this work seem
to be in agreement with the first statement since a step characteristic of Tg in the DSC[122]
appears around 200 oC. At about 250
oC an exothermic peak appears until the end of the run.
This peak implies the decomposition of the glucosamine units of CHT [123]. The peak
appearing in formulations containing CHT at around 80 oC is due to enthalpy relaxation of the
polymeric chain, appearing when physical ageing of polymers occurs[117,124].
Duo to the aforementioned characteristics found in this analysis, the amorphous characteristic of
CHT also determined by XRD is confirmed.
From the analysis of BET isotherms, it is possible to determine particles’ specific surface area
in which other compounds can be adsorbed and the volume of pores that are present in the
sample.
0,0 0,5 1,0
0
5
10
15
20
25
30
35
40
45
50
Volu
me a
dsorb
ed (
cm
3/g
ST
P)
Relative Pressure (P/P0)
Figure 3.9: Nitrogen adsorption isotherms of CHT microparticles.
Looking at Figure 3.9 it is possible to conclude that CHT microparticles produced by SAA
follow a Type II isotherm, showing a large deviation from the Langmuir model. It indicates the
Point B

Chapter 3. Results and Discussion
35
formation of an adsorbed layer where the thickness increases with increasing relative pressure
until it equals the saturation vapor pressure, when the adsorbed layer becomes a bulk liquid. The
uptake at Point B represents the completion of the monolayer, and the ordinate of this point
gives an estimation of how much adsorbate is required to form a monolayer covering solid
surface. At this point begins a quasilinear section representing the formation of the
multilayer[18].
By plotting 1/[v*(Po/P-1)] vs. P/Po near point B (Figure 3.10) we can determine both the
monolayer adsorbed quantity vm by simultaneously solving the equations for both intercept and
the slope.
0,05 0,10 0,15 0,20
0,02
0,03
0,04
0,05
1/[v(p
o/p
-1)]
Relative Pressure (p/po)
Figure 3.10: BET surface area plot for CHT microparticles produced by SAA.
Analysing Figure 3.9, the data suggests that CHT microparticles are either non-porous or
macroporous as befits a Type II isotherm, which allows a multilayer adsorption to occur at high
relative pressures [18].
In order to determine if there are macropores present it was performed a mercury intrusion
porosimetry analysis, having obtained the results shown in Figure 3.11 [125].
y=0.00426+0.237x
R2=0.98

Chapter 3. Results and Discussion
36
100 10 1 0,1 0,01 1E-3
0
2
4
Cu
mu
lative
Po
re V
olu
me
(m
L/g
)
Mean Diameter (µm)
Figure 3.11: Pore area CHT microparticle processed by SAA.
Looking at Figure 3.11 it is encountered a step around 0.6 to 3 μm also appears in all
formulations, this may also belong to inter granular porosity, since it appears in the range of
particle size (ranging from 0.5 to 6 μm). The steps encountered from 0.08 to 0.6 μm indicate the
presence of macropores, which go in accordance with the Type II isotherm obtained by gas
adsorption [20].
The hysteresis encountered between intrusion and extrusion is due to the narrower connections
of the pores, which would trap some of the mercury inside the particles during the extrusion
[20].
FT-IR spectra of CHT microparticles were obtained to determine if there is any solvent residue
and if chitosan’s characteristic peaks are present. An overlapping with the spectra of raw CHT
was made to help in the identification. The FT-IR analysis (Figure 3.12) show the presence of
CHT, determined by the presence of its characteristics peaks.
4000 3500 3000 2500 2000 1500 1000 500 0
Tra
nsm
ittance
Wavenumber (cm-1)
Figure 3.12: FTIR analyses from (a) raw CHT and (b) CHT microparticles.
Extrusion
Intrusion
(a)
(b)

Chapter 3. Results and Discussion
37
Observing Figure 3.12 it is observed a broad transmission band around 3400 cm-1
related to an
overlapping of the stretching of -OH, -NH2 and–NH groups, suggesting presence of hydrogen
bonds present in both raw and processed CHT. The C-N stretching of amines, present in CHT is
also observed due to the transition bands at around 1150 and 1240 cm-1
[126–129].
The great broadening effect (beginning around 2500 cm-1
) may suggest the presence of residual
acetic acid in CHT microparticles [126–130].
The band observed around 2900 cm-1
in CHT indicates the presence of glucosamine, while the
band observed at around 1320 cm-1
demonstrates the presence of N-acetylglucosamine,
indicating that CHT is not completely deacetylated [131].
The presence of alkanes is indicated by the C-H stretching and bending, present in both raw and
processed CHT, observed due to the transmission band around 2900 cm-1
for the stretching and
around 1380 and 1410 cm-1
for the bending [126–129].
The presence of CO2 is characterized both by the asymmetrical stretching at around 2360 cm-1
,
and by its bending, visible around 650 cm-1
. This may be due to a small amount of carbon
dioxide trapped inside the polymeric matrix of CHT when atomized by SAA [126–129].
From 1450 to 600 cm-1
, we enter the fingerprint region, becoming harder to assign all the
transmission bands [126–129].
3.1.2. Particle swelling
The swelling degree of CHT microparticles in PBS at three temperatures was determined based
on experiments shown in Figure 3.13.
Figure 3.13: Morphologi images of the swelling of CHT microparticles in PBS at temperatures (a) 25 oC;
(b) 37 oC; and (c)in pH=6.8 at 37 oC. Top: Dry particles, bottom: Wet particles.
By looking at the Morphologi G3 while the swelling took place it was possible to conclude that
it occurred almost instantly when in contact with aqueous solutions. From the images shown in
Figure 3.13 it is possible to make Table 3.5.
(a) (b) (c)

Chapter 3. Results and Discussion
38
Table 3.5: Swelling degree and water uptake of CHT microparticles.
pH Temperature
(oC)
Dry Particle Wet Particle Water
uptake
(μm3)
SD (%) Diameter
(μm)
Volume
(μm3)
Diameter
(μm)
Volume
(μm3)
7.4 25 5.3±0.1 79.4 8.0±0.1 268.1 188.6 238
7.4 37 5.3±0.2 79.4 8.0±0.1 268.1 188.6 238
6.8 37 4.3±0.1 42.6 6.6±0.2 155.1 112.5 264
Observing Table 3.5 it becomes apparent that temperature does not affect the swelling degree of
CHT particles. Also, similar results were obtained for pH=6.8 at 37 oC, swelling degree of
264% and a water uptake of 112.5 μm3.
From this study we can conclude that the swelling of CHT microparticles do not seem affected
by the rise of temperature nor by the diminishing of the pH. Since the swelling is almost
instantaneous, it was also not possible to determine any difference in swelling rate between the
different conditions.
3.1.3. In vitro biodegradation studies
CHT microparticles were chosen for the biodegradation studies, because CHT is the carrier for
the API, to assess the stability of the particles in the presence of lysozyme. The remaining
weight, in percentage, of CHT microparticles was determined as a function of time and taken as
an indication of enzymatic degradation, as shown in Figure 3.14.
0 5 10 15 20 25 30
0
10
20
30
40
50
60
70
80
90
100
Wr
(%)
Time (hours)
Figure 3.14: Enzymatic degradation profiles of CHT microparticles in the presence of lysozyme.
CHT microparticles were affected by the incubation process, observed in Figure 3.14 due to
weight reduction as the incubation time increased. CHT microparticles appear to degrade almost
immediately upon contact with lysozyme solution. It is also possible to observe that after 6
hours only 30 in microparticles’ weight remained, implying that lysozyme is very efficient at

Chapter 3. Results and Discussion
39
degrading CHT. Also, since the weight of CHT remaining became a constant value, it appears
that the microparticles are not further degraded by lysozyme. It is possible to say that lysozyme
has a very fast activity concerning CHT microparticles degradation.
3.2. Co-precipitation of chitosan and ibuprofen
Now that the operating parameters have been optimized for the production of CHT
microparticle, it became interesting to study the effect of a small drug, like IBP, in the
microparticles when co-atomized with CHT.
3.2.1 Morphology and solid state properties of CHT-IBP microparticles
IBP content was tested between 0.09 and 0.17 % m/v and co-atomized with 0.60 % m/v medium
MW CHT using a 1% acetic acid aqueous solution with 18.6 % v/v of ethanol at 70 oC and 10
MPa in a 150 μm diameter nozzle. CHT-IBP microparticles were successfully produced under
these conditions and its morphological and physical-state properties were characterized,
obtaining Table 3.6.
Table 3.6: Operating parameters of SAA for different quantities of IBP (IBP %) in the liquid solution co-atomized with 0.60% m/v CHT. Also shown are the drug encapsulation (E), mean volumetric diameter
(Dv), span, shape, roughness and solid state.
Morphologi SEM XRD /
DSC
Assay IBP %
(g/mL)
Recovery
(%)
E (%) Dv, 50
(μm) Span Shape Surface Solid state
5 0.09 41.6 31.72±0.18 2.2 2.47 Spherical Smooth Amorphous
6 0.17 55.6 n.a. 2.0 1.74 Spherical Smooth n.a.
In assay 6, IBP precipitated in the solution before reaching the nozzle, so no characterization
besides that of Morphologi G3 and SEM was done. The properties of CHT-IBP microparticles
are summarized in Table 3.7.
Table 3.7: Properties of CHT-IBP microparticles produced by SAA in assay 5: BET specific surface area
(aBET), pore diameter (Dp), volume occupied in the monolayer (νm), porosity, apparent density, bulk
density, true density and tapped density.
Nitrogen porosimetry Mercury porosimetry Helium
Pycnometer
Graduated
container
Assay aBET
(m2/g)
Dp
(nm)
vm
(cm3/g)
Dp
(nm)
Porosity
(%)
Apparent
density
(g/mL)
Bulk
density at
0.51 psia
(g/mL)
True
density
(g/mL)
Tapped
density
(g/mL)
5 18.91±0.71 8.1 4.34 122 59.8 0.963 0.387 1.441±0.0 ~0.4±0.05
By analyzing Table 3.6, it is possible to conclude that particles produced by this method have
mean volumetric diameters between 2.0 and 2.2 μm, and are very similar to CHT
microparticles, having spherical shape and smooth surfaced. It is also possible to see that drug

Chapter 3. Results and Discussion
40
encapsulation was around 31.72±0.18 %, which implies that the remaining 68.28 % of IBP were
lost during particle formation, by leaving the system with the CO2 flow, or by degradation. This
may be due to the precipitation of some IBP in the starting solution while it is being pumped
and, since IBP has a high solubility in sc-CO2, it may have been vented along with CO2 during
the particle production.
Analyzing Table 3.7, it becomes apparent that SAA process can produce CHT-IBP
microparticles with macropores with a high degree of porosity (about 60%) with a bulk density
of 0.387 g/mL. Much like in the case of CHT microparticles, CHT-IBP microparticles have a
true density of 1.441 g/mL, indicating that it CHT is the most abundant compound. Also, the
presence of closed pores is detected because the apparent density is smaller than the true
density.
Interestingly, microparticles possessing IBP contain about 10% lower porosity than the other
formulations. This might indicate the presence of IBP trapped inside CHT microparticles,
preventing mercury from occupying that space, resulting in the observed porosity decrease.
Particles’ Reynolds number was again calculated in order to obtain the Stokes aerodynamic
diameter.
Table 3.8: Particles’ Reynolds number calculated for CHT-IBP microparticles obtained in assay 5.
Dv,10% (μm) Dv,90% (μm) Rep,10% Rep,90%
1.11 3.25 0.15 0.44
By looking at Table 3.8 we can conclude that the CHT-IBP microparticles are, like CHT
microparticles, in stokes flow regime, so it is possible to use the Stokes equation to determine
these particles’ aerodynamic diameter.
Shot Weight was performed on CHT-IBP microparticles, having obtained an emitted fraction of
CHT microparticles of 98.7±0.6%, indicating that almost all of the powder is released from the
capsule. So these microparticles were analysed by ACI under the same conditions as in the Shot
Weight, obtaining the results shown in Figure 3.15.
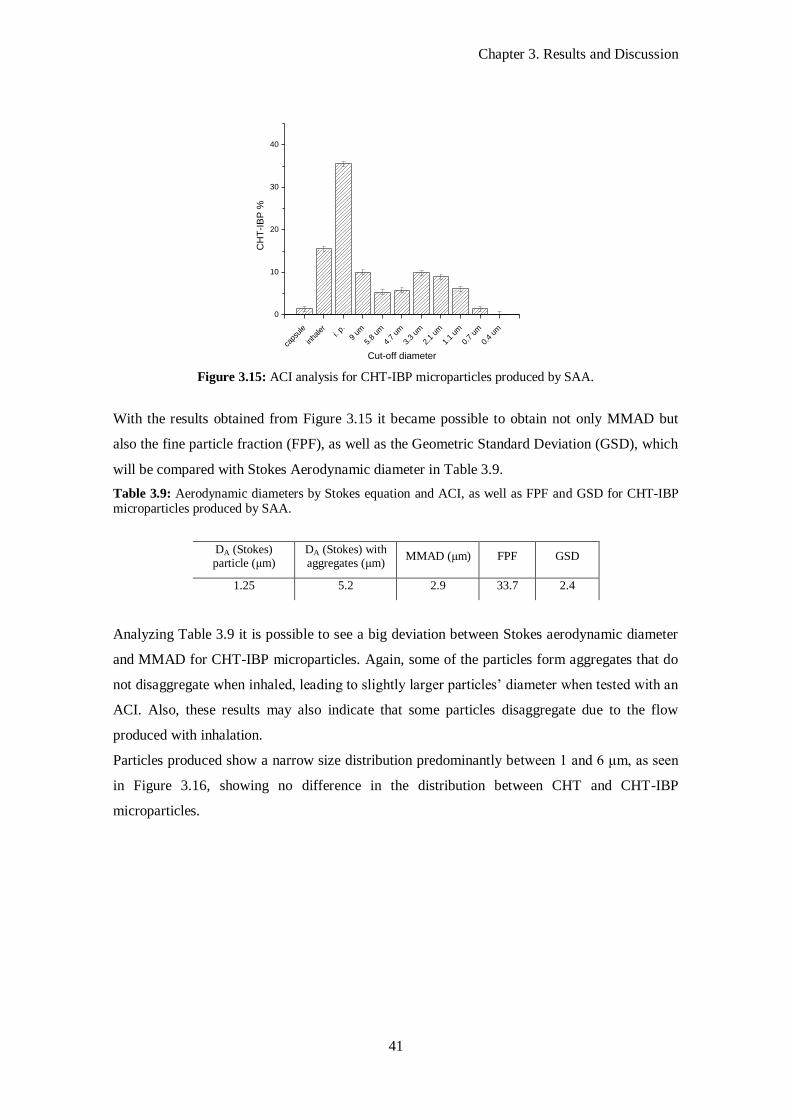
Chapter 3. Results and Discussion
41
caps
ule
inha
ler
i. p.
9 um
5.8
um
4.7
um
3.3
um
2.1
um
1.1
um
0.7
um
0.4
um
0
10
20
30
40
CH
T-I
BP
%
Cut-off diameter
Figure 3.15: ACI analysis for CHT-IBP microparticles produced by SAA.
With the results obtained from Figure 3.15 it became possible to obtain not only MMAD but
also the fine particle fraction (FPF), as well as the Geometric Standard Deviation (GSD), which
will be compared with Stokes Aerodynamic diameter in Table 3.9.
Table 3.9: Aerodynamic diameters by Stokes equation and ACI, as well as FPF and GSD for CHT-IBP microparticles produced by SAA.
DA (Stokes) particle (μm)
DA (Stokes) with aggregates (μm)
MMAD (μm) FPF GSD
1.25 5.2 2.9 33.7 2.4
Analyzing Table 3.9 it is possible to see a big deviation between Stokes aerodynamic diameter
and MMAD for CHT-IBP microparticles. Again, some of the particles form aggregates that do
not disaggregate when inhaled, leading to slightly larger particles’ diameter when tested with an
ACI. Also, these results may also indicate that some particles disaggregate due to the flow
produced with inhalation.
Particles produced show a narrow size distribution predominantly between 1 and 6 μm, as seen
in Figure 3.16, showing no difference in the distribution between CHT and CHT-IBP
microparticles.

Chapter 3. Results and Discussion
42
0 2 4 6 8 10
0,0
0,5
1,0
CE
Dia
mete
r N
um
ber
Dis
trib
ution
CE Diameter (µm)
Figure 3.16: Comparison of the distribution of particles size of CHT microparticles (black) and CHT-IBP
microparticles (red).
Looking at the SEM images in Figure 3.17, it is possible to observe that both CHT-IBP
microparticles produced under the specified conditions are spherical with smooth surface
possessing diameters between 0.5 and 6 μm. These formulations appear to have macropores in
the range of 100-200 nm, which corresponds to the range determined by MIP as seen in Table
3.7. It appears that when particles are being micronized, some CO2 dissolved in IBP entrapped
inside CHT microspheres would burst out originating the observed porous structure.
Figure 3.17: SEM images of CHT-IBP microparticles (a) assay 5, (b) assay 6.
From Morphologi G3 images, shown in Figure 3.18, it can be seen that the CHT-IBP particles
produced have a tendency to form small aggregates.
(a) (b)

Chapter 3. Results and Discussion
43
Figure 3.18: Morphologi G3 images of CHT-IBP microparticles (a) assay 5, (b) assay 6.
The solid-state characteristics of CHT-IBP were also characterised by XRD.
Analysing the diffraction pattern of IBP in Figure 3.19 (a), we can conclude that it has a
crystalline structure due to the presence of sharp peaks [132].
Interestingly, when we performed a co-atomized powder of CHT and IBP, no peaks
characteristic to crystalline IBP was observed in Figure 3.19 (d) but a single broad peak,
indicating that these particles have an amorfous structure, which will increase drug
bioavailability, but decrease its stability [7]. This might suggest that CHT polymeric chains
prevent the organization of IBP molecules into a crystaline structure.
0 10 20 30 40 50 600 10 20 30 40 50 60
2 (º)
Figure 3.19: X-ray diffraction patterns of (a) raw IBP, (b) raw CHT, (c) CHT microparticles and (d)
CHT-IBP microparticles.
(a) (b)
(a)
(b)
(c)
(d)

Chapter 3. Results and Discussion
44
In order to confirm the solid-state properties of CHT-IBP two runs were made in the DSC as
shown in Figure 3.20 and Figure 3.21.
50 100 150 200Temperature (ºC)
Figure 3.20: First run of the DSC of (a) raw IBP; (b) raw CHT and (c) CHT-IBP microparticles from 25 oC to 200 oC with a flow rate of 10 oC/min.
100 200 300Temperature (°C)
Figure 3.21: Second run of the DSC of (a) raw IBP; (b) raw CHT and (c) CHT-IBP microparticles from
25 oC to 300 oC with a flow rate of 10 oC/min.
Analyzing Figure 3.20 and Figure 3.21 it is once again possible to observe that all
microparticles have a broad endothermic peak in the first run around 100 oC, due to the same
reasons explained before [101,116].
(b)
(a)
(c)
(b)
(a)
(c)
Exo
Exo

Chapter 3. Results and Discussion
45
For unprocessed IBP, it is possible to observe a sharp endothermic peak around 57 oC in the first
run, attributed to the fusion of IBP [133], confirming the crystalline structure as obtained in
XRD. This peak is not detected in the second run, because the sample was completely degraded
in the first run.
Also for unprocessed IBP it was observed in the second run a broad endothermic peak starting
around 210 oC with a peak at 280
oC. This thermal phenomena has been attributed to the
evaporation of IBP [133].
When co-atomization occurs, there seems to be only the thermal events characteristic to
chitosan. This confirms the hypothesis that IBP is molecularly dispersed inside the CHT’s
polymeric matrix and that the microparticles are in an amorphous state [7,104]. However, there
seems to appear a small peak around 57 oC for CHT-IBP microparticles that clearly superposes
with raw CHT, this might indicate that some IBP is not trapped inside CHT’s polymeric matrix
when they are co-atomized.
These results also show that IBP entrapped inside CHT are more stable to thermal degradation
than the raw components, suggesting an interaction between CHT and IBP resulting in a
stabilization of either the drug or protein against thermal degradation [7].
Once again the specific surface area of the particles will be determined by analyzing the BET
isotherm.
0,0 0,5 1,0
0
5
10
15
20
25
30
35
40
45
50
Volu
me a
dsorb
ed (
cm
3/g
ST
P)
Relative Pressure (P/P0)
Figure 3.22: Nitrogen adsportion isotherms of CHT-IBP microparticles.
Looking at Figure 3.22 it is possible to conclude that CHT-IBP microparticles produced by
SAA follow a Type II isotherm, like CHT microparticles. The uptake at Point B represents the
completion of the monolayer [18].
The monolayer adsorbed quantity vm was determined by plotting 1/[v*(Po/P-1)] vs. P/Po near
point B, shown in Figure 3.23, and solving simultaneously solving the equations for both
intercept and the slope.
Point B

Chapter 3. Results and Discussion
46
0,05 0,10 0,15 0,20
0,02
0,03
0,04
0,05
1/[v(p
o/p
-1)]
Relative Pressure (p/po)
Figure 3.23: BET surface area plot for CHT-IBP microparticles produced by SAA.
Analyzing Figure 3.22, the data suggests that CHT-IBP microparticles are either non-porous or
macroporous as befits a Type II isotherm, which allows a multilayer adsorption to occur at high
relative pressures, which would make sense, since large pores were observed in SEM images in
Figure 3.17 [18].
In order to determine if there are macropores present it was performed a mercury intrusion
porosimetry analysis, having obtained the results shown in Figure 3.24 [125].
100 10 1 0,1 0,01 1E-3
0
2
4
Cu
mu
lative
Po
re V
olu
me
(m
L/g
)
Mean Diameter (µm)
Figure 3.24: Pore area of CHT-IBP microparticles processed by SAA.
Looking at Figure 3.24 it is encountered a step around 0.6 to 3 μm, this may also belong to inter
granular porosity, since it appears in the range of particle size (ranging from 0.5 to 6 μm). The
y=0.00809+0.222x
R2=0.99
Extrusion
Intrusion

Chapter 3. Results and Discussion
47
steps encountered from 0.08 to 0.6 μm indicate the presence of macropores, which go in
accordance with the Type II isotherm obtained by gas adsorption [20].
FT-IR spectra of CHT-IBP microparticles were obtained to determine if all the compounds and
present in the formulation. An overlapping with the spectra of raw CHT, raw IBP and CHT
microparticles was made to help in the identification. The FT-IR analysis (Figure 3.25) show
the presence of CHT, determined by the presence of its characteristics peaks.
4000 3500 3000 2500 2000 1500 1000 500 0
Tra
nsm
itta
nce
Wavenumber (cm-1)
Figure 3.25: FTIR analyses from (a) raw CHT; (b) raw IBP; (c) CHT microparticles and (d) CHT-IBP
microparticles.
All the characteristic peaks already discussed for CHT are seen in CHT-IBP microparticles,
Figure 3.25, confirming the presence of this compound.
The presence of alkanes is indicated by the C-H stretching and bending is also observed in
formulations containing IBP due to the transmission band around 2900 cm-1
for the stretching
and around 1380 and 1410 cm-1
for the bending [126–129].
C=O stretching of an acid compound, present in IBP with an intense band observed at around
1706 cm-1
[126–129].
From 1450 to 600 cm-1
, we enter the fingerprint region, becoming harder to assign all the
transmission bands, especially to IBP [126–129].
The presence of the aromatic ring in IBP is confirmed due to the characteristic stretching of its
C=C double bands shown by multiple transition bands between 1400 and 1509 cm-1
[126–129].
This analysis confirms that CHT-IBP processed by SAA contain both compounds in the
formulation.
(a)
(b)
(c)
(d)

Chapter 3. Results and Discussion
48
3.2.2 In vitro controlled release studies
Drug-release studies were performed and it was possible to conclude that IBP was co-atomized
with CHT. In Figure 3.26, it is possible to observe the release of 60% of IBP into the medium
with the best fit to Korsmeyer and Peppas equation.
0 10 20 30 40 500
20
40
60
80
100
ibupro
fen (
%)
t (h)
0 10 20 30 40 500
20
40
60
80
100
ibupro
fen (
%)
t (h)
Figure 3.26: Release profiles on the first 60% of (a) IBP at pH=7.4 and (b) IBP at pH=6.8 adjusted with
Korsmeyer and Peppas equation.
Looking at Figure 3.26 it is possible to conclude that both the release of IBP at pH=7.4 has an
anomalous transport, which means that both mechanisms (swelling and Fick’s diffusion) have a
contribution to the release rate. Also, since the diffusional exponent is closer to 0.85, the release
is more controlled by the swelling mechanism than the diffusion mechanism.
The release mechanism suffers a deviation at slightly acidic conditions. At pH=6.8 the release
of IBP is still anomalous, although now the diffusional exponent is closer to 0.45 implying a
greater contribution to the release from a diffusional mechanism than the swelling. This is due
to both the faster swelling and degradation of CHT at acidic conditions. Also, the lower the pH
value the lower IBP solubility.
In order to better understand the release mechanism, the Peppas and Sahlin equation was fitted
to the full range of the release as shown in Figure 3.27.
0 20 40 60 80 100 1200
20
40
60
80
100
Ibupro
fen (
%)
t (h)
0 20 40 60 80 100 1200
20
40
60
80
100
Ibupro
fen (
%)
t (h)
Figure 3.27: Release profiles of (a) IBP at pH=7.4 and (b) IBP at pH=6.8 and adjusted with Peppas and
Sahlin equation.
(a) (b)
(a) (b)
k=0.0070
n=0.7325
R2=0.9805
k=0.0021
n=0.5552
R2=0.9690
Kd=0.0334
Kr=-0.0003
m=0.47
R2=0.9426
Kd=0.0538
Kr=-0.0008
m=0.43
R2=0.9823

Chapter 3. Results and Discussion
49
In order to see if pH has any influence on the release rate of IBP from CHT microparticles, time
values for 50% and 90% of the amount of drug released, at both pH tested, were determined for
the full range of release and compared as shown in Table 3.10.
Table 3.10: Time values related to the 50% and 90% amount released of IBP.
pH IBP release
t50% (h) t90% (h)
7.4 5.5 56.5
6.8 4.7 34.6 *By using the Sahlin and Peppas model
From Table 3.10 it is possible to assert that IBP release is faster in acidic environments, as it
was expected, since the amine groups of CHT are protonated in acidic conditions the swelling
mechanism controls IBP release, as discussed previously.
From Figure 3.27 we can see that the kinetics of drug released is controlled by the thickness of
the swollen layer of the polymeric matrix. Initially, there is a faster water uptake by the
microparticles, decreasing the polymer concentration and changing the level of polymer
disentanglement [30,134]. When IBP comes into contact with water, it will diffuse, due to
gradient profiles, out of the matrix. Initially water uptake is faster than polymer
disentanglement, but as time passes, water uptake by the particles will reduce until it equals
polymer disentanglement. At this point drug release mechanism changes from the Fickian to a
non-Fickian transport [7,135]. Beyond this point, CHT degradation starts to take place. It is also
possible to assert that the pH has some influence in IBP release at both diffusion and relaxation
of the polymeric matrix.

Chapter 3. Results and Discussion
50
3.3. Co-precipitation of chitosan and bovine serum albumin
CHT particles co-atomized with a large compound, such as the protein BSA, was also studied.
3.3.1. Morphology and solid state properties of CHT-BSA microparticles
BSA content was tested between 0.09 and 0.17 % m/v and co-atomized with 0.60 % m/v
medium MW CHT using a 1% acetic acid aqueous solution with 18.6 % v/v of ethanol at 70 oC
and 10 MPa in a 150 μm diameter nozzle. CHT-BSA microparticles were successfully produced
under these conditions and its morphological and physical-state properties were characterized.
The operating parameters used in different assays are included in Table 3.11. Also, BSA alone
was atomized in order to see if there are any interactions between CHT and BSA during particle
atomization.
Table 3.11: Operating parameters of SAA for different quantities of BSA (BSA %) in the liquid solution
co-atomized with 0.60% m/v CHT. Also shown are the drug encapsulation (E), mean volumetric diameter
(Dv), span, shape, roughness and solid state.
Morphologi SEM XRD / DSC
Assay BSA %
(g/mL)
Recovery
(%)
E (%) Dv, 50
(μm) Span Shape Surface Solid state
7 0.09 50.0 n.a. 3.2 1.40 Spherical Rough n.a.
8 0.17 49.5 63.00±1.09 6.8 1.30 Spherical Rough Amorphous
9* 0.58 59.3 n.a. 11.6 1.37 Spherical Rough Semi-crystalline
*Only BSA was micronized in SAA
The best composition was found to be the one from assay 8, so all the tests were made for this
composition. The properties of CHT-BSA microparticles are summarized in Table 3.12.
Table 3.12: Properties of CHT-BSA microparticles produced by SAA in assay 8: pore diameter (Dp),
porosity, apparent density, bulk density, true density and tapped density.
Mercury porosimetry Helium
Pycnometer
Graduated
container
Assay Dp
(nm)
Porosity
(%)
Apparent
density (g/mL)
Bulk density
at 0.51 psia (g/mL)
True
density (g/mL)
Tapped
density (g/mL)
8 230 74.2 0.948 0.245 1.448±0.0 ~0.4±0.05
By analyzing Table 3.11, it is possible to conclude that particles produced by this method have
mean volumetric diameters between 3.2 and 6.8 μm, similar to the ones obtained for CHT
microparticles and have spherical shape and smooth surface. However, unlike CHT, these
particles seem to be affected by the concentration of BSA in the starting solution. It is also
possible to see that drug encapsulation was 63.00±1.09 %.
Analyzing Table 3.12, it becomes apparent that using SAA process we can produce CHT-BSA
microparticles with macropores with a high degree of porosity (about 74%) with a bulk density

Chapter 3. Results and Discussion
51
of 0.245 g/mL. Much like in the case of CHT and CHT-IBP microparticles, CHT-BSA
microparticles have a true density of 1.448 g/mL, indicating that CHT is the most abundant
compound. Also, the presence of closed pores is detected because the apparent density is
smaller than the true density.
Particles’ Reynolds number was calculated in order to obtain the Stokes aerodynamic diameter.
Table 3.13: Particles’ Reynolds number calculated for CHT-BSA microparticles obtained in assay 8.
Dv,10% (μm) Dv,90% (μm) Rep,10% Rep,90%
3.30 11.27 0.45 1.53
By looking at Table 3.13 we can conclude that the CHT-BSA microparticles are, unlike CHT
microparticles, almost out of the stokes flow regime. However, since there is only a slight
deviation, it can be admitted that these particles are also in a stokes flow regime. Hence, we can
use the Stokes equation to determine these particles’ aerodynamic diameter.
Shot Weight was performed on CHT-BSA microparticles, having obtained an emitted fraction
of 98.9±0.4%. So these microparticles were analyzed by ACI under the same conditions as in
the Shot Weight, obtaining the results shown in Figure 3.28.
caps
ule
inha
ler
i. p.
9 um
5.8
um
4.7
um
3.3
um
2.1
um
1.1
um
0.7
um
0.4
um
0
10
20
30
40
CH
T-B
SA
%
Cut-off diameter
Figure 3.28: ACI analysis for CHT-BSA microparticles produced by SAA.
Analyzing Figure 3.28 it is possible to see that less powder is lost in the Induction port than in
CHT and CHT-IBP formulations. So, despite resulting in larger particles, the aerodynamic
properties of formulations containing BSA appear to improve.
With these results it became possible to obtain not only MMAD but also the fine particle
fraction (FPF), as well as the Geometric Standard Deviation (GSD). These results are compared
with Stokes Aerodynamic diameter in Table 3.14.

Chapter 3. Results and Discussion
52
Table 3.14: Aerodynamic diameters by Stokes equation and ACI, as well as FPF and GSD for CHT-BSA
microparticles produced by SAA. DA (Stokes) particle (μm)
DA (Stokes) with aggregates (μm)
MMAD (μm) FPF GSD
3.3 4.6 3.8 44.1 2.2
Analyzing Table 3.14 it is possible to see a slight deviation between Stokes aerodynamic
diameter and MMAD for CHT-BSA microparticles. Again, some of the particles form
aggregates that do not disaggregate when inhaled, leading to slightly larger particles’ diameter
when tested with an ACI. Also, these results may also indicate that some particles disaggregate
due to the flow produced with inhalation.
Particles produced show a narrow size distribution predominantly between 1 and 7 μm, as seen
in Figure 3.29, showing no difference in the distribution between CHT microparticles, albeit
slightly larger particles are produced.
0 2 4 6 8 10
0,0
0,5
1,0
CE
Dia
mete
r N
um
ber
Dis
trib
ution
CE Diameter (µm)
Figure 3.29: Comparison of the distribution of particles size of CHT microparticles (black) and CHT-
BSA microparticles (blue).
Looking at the SEM images in Figure 3.30, it is possible to observe that both CHT-BSA
microparticles produced under the specified conditions are spherical possessing diameters
between 0.5 and 11 μm. When CHT was co-atomized with BSA, the particles appear to improve
in surface roughness. Since these are large molecules, they may promote some interactions with
CHT, which results in this rougher structure. When BSA alone is micronized by SAA under the
studied conditions, large broken particles with rough surface are also formed, further indicating
that there must be some interaction between CHT and BSA.

Chapter 3. Results and Discussion
53
Figure 3.30: SEM images of CHT-BSA microparticles (a) assay 7 with a magnification of 10,000X; (b)
assay 8 with a magnification of 5,000X and (c) BSA microparticles (assay 9) with a magnification of
6.000X.
From Morphologi G3 images, shown in Figure 3.31, it can be seen that the CHT-BSA particles
produced have a tendency to form small aggregates.
Figure 3.31: Morphologi G3 images of CHT-BSA microparticles (a) assay 7, (b) assay 8 and (c) assay 9,
obtained with an objective of 50X.
(a) (b)
(a) (b)
(c)
(c)

Chapter 3. Results and Discussion
54
From Figure 3.31, it is possible to see that the presence of BSA in the formulation seems to
promote particle agglomeration, indicating strong interactions between this compounds and
CHT. It is also possible to see small loose particles in the range of just a few micrometers. Also,
it is possible to see a very large particle unsuitable for inhalation therapy in Figure 3.31 (c),
where BSA was atomized alone. This proves that under the operating conditions used, BSA
alone cannot be successfully used in SAA to produce microparticles for inhalation.
The solid-state characteristics of CHT-BSA were also characterised by XRD.
Both raw BSA and BSA processed by SAA, Figure 3.32 (c) and (d) respectively, showed two
broad peaks at about 10 o and 20
o, indicating a semi-crystalline compound [7,104].
For CHT-BSA formulation it is also observed the broadening of the peak present at 20º,
however it is also possible to observe a slight contribution of the 10º peak [104]. Since BSA
semi-cristallinity isn’t affected when processed by the SAA, as seen in Figure 3.32 (d), it gives
the clear indication that BSA is indeed present in the formulation.
10 20 30 40
2 (º)
Figure 3.32: X-ray diffraction patterns of (a) CHT-BSA microparticles, (b) CHT microparticles, (c) raw
BSA and (d) BSA microparticles.
(a)
(b)
(c)
(d)

Chapter 3. Results and Discussion
55
The DSC profiles for the first and second runs are shown in Figure 3.33 and Figure 3.34.
50 100 150 200
50 100 150 200
Temperature (°C)
Figure 3.33: First run of the DSC of (a) raw CHT; (b) raw BSA and (c) CHT-BSA microparticles from
25 oC to 200
oC with a flow rate of 10
oC/min.
100 200 300
Temperature (°C)
Figure 3.34: Second run of the DSC of (a) raw BSA; (b) raw CHT and (c) CHT-BSA microparticles from
25 oC to 300 oC with a flow rate of 10 oC/min.
Analyzing Figure 3.33 and Figure 3.34 it is possible to observe that all microparticles processed
by SAA possess a broad endothermic peak in the first run around 100 oC, attributed to water
evaporation due to adsorbed moisture, reflecting both physical and molecular changes of the
polymer [101,116].
For unprocessed BSA, the broad endothermic peak observed around 120 oC is possibly due to
the reversible unfolding of protein chains. It is interesting to observe that in the second run, this
peak is less intense, suggesting that most of the BSA suffered an irreversible unfolding at this
temperature [136–138].
Unprocessed BSA also shows a sharp peak around 225 oC, which indicates the complete
denaturation of the protein, adopting a random coil configuration.
(b)
(a)
(c)
(b)
(a)
(c)
Exo
Exo

Chapter 3. Results and Discussion
56
These results also show that BSA entrapped inside CHT are more stable to thermal degradation
than BSA atomized alone, suggesting that the interaction between CHT and BSA results in a
stabilization of the protein against thermal degradation [7].
In order to determine if there are macropores present it was performed a mercury intrusion
porosimetry analysis, having obtained the results shown in Figure 3.35 [125].
100 10 1 0,1 0,01 1E-3
0
2
4C
um
ula
tive P
ore
Volu
me (
mL/g
)
Mean Diameter (µm)
Figure 3.35: Pore area of CHT-BSA microparticles processed by SAA.
Looking at Figure 3.35 it is encountered a step from 0.08 to 3 μm, indicating the presence of
macropores [20].
FT-IR spectra of CHT-BSA microparticles were obtained to determine if all the compounds are
present in the formulation. An overlapping with the spectra of raw CHT, raw BSA and CHT
microparticles was made to help in the identification. The FT-IR analysis (Figure 3.36) show
the presence of CHT-BSA, determined by the presence of its characteristics peaks.
Extrusion
Intrusion

Chapter 3. Results and Discussion
57
4000 3500 3000 2500 2000 1500 1000 500
Tra
nsm
itta
nce
wavenumber (cm-1)
Figure 3.36: FTIR analyses from (a) BSA microparticles; (b) CHT-BSA microparticles; (c) CHT
microparticles; (d) raw BSA and (e) raw CHT.
All the characteristic peaks already discussed for CHT are seen in CHT-BSA microparticles,
shown in Figure 3.36. It also shows a broad transmission band around 3400 cm-1
related to an
overlapping of -OH, -NH2 and –NH groups stretching, suggesting the presence of hydrogen
bonds in CHT compounds. The C-N stretching of amines, present in BSA, is also observed due
to the transition bands at around 1150 and 1240 cm-1
[126–129].
BSA spectrum show a band around 3200 cm-1
, that corresponds to the O-H stretching of the
carboxylic acid group [126–129].
The presence of alkanes is indicated by the C-H stretching and bending, present in all
compounds observed due to the transmission band around 2900 cm-1
for the stretching and
around 1380 and 1410 cm-1
for the bending [126–129].
This analysis confirms that CHT-BSA processed by SAA contain both compounds in the
formulation.
3.3.2. In vitro controlled release studies
In drug-release studies it is possible to conclude that BSA is present in particles comprised of
CHT co-atomized with BSA, showing a controlled release from the. In Figure 3.37, it is
possible to observe the release of 60% of BSA into the medium with the best fit to Korsmeyer
and Peppas equation.
(a)
(b)
(c)
(d)
(e)

Chapter 3. Results and Discussion
58
0 10 20 30 40 500
20
40
60
80
100
BS
A (
%)
t (h)
0 10 20 30 40 500
20
40
60
80
100
BS
A (
%)
t (h)
Figure 3.37: Release profiles on the first 60% of (a) BSA at pH=7.4 and (b) BSA at pH=6.8 adjusted
with Korsmeyer and Peppas equation.
Looking at Figure 3.37 it is possible to conclude that the release of BSA at pH=7.4 presents an
anomalous transport, which means that both mechanisms (swelling and Fick’s diffusion) have a
contribution to the release rate. Also, since the diffusional exponent is closer to 0.85, the release
is more controlled by the swelling mechanism than the diffusion mechanism.
Interestingly, at pH=6.8 the release mechanism of BSA become controlled by the swelling
mechanism. This may happen because the solution pH is above the isoelectric point (pI) of
BSA, which is 4.7, so at this point BSA is polar and as such highly soluble in aqueous solutions.
In order to better understand the release mechanism, the Peppas and Sahlin equation was
adjusted to the full range of the release as shown in Figure 3.38.
0 20 40 60 80 100 1200
20
40
60
80
100
BS
A (
%)
t (h)
0 20 40 60 80 100 1200
20
40
60
80
100
BS
A (
%)
t (h)
Figure 3.38: Release profiles of (a) BSA at pH=7.4 and (b) BSA at pH=6.8 adjusted with Peppas and
Sahlin equation.
In order to see if pH has any influence on the release rate of BSA from CHT microparticles, the
time for which 50% and 90% of the amount of protein released, at both pH tested, were
determined and compared as shown in Table 3.15.
(a) (b)
(a) (b)
k=0.0020
n=0.7519
R2=0.9906
k=0.0008
n=0.85
R2=0.9789
Kd=0.0093
Kr=-6.9E-7
m=0.5338
R2=0.9845
Kd=0.0037
Kr=-1E-7
m=0.6379
R2=0.9808

Chapter 3. Results and Discussion
59
Table 3.15: Time values related to the 50% and 90% amount released of BSA.
pH BSA release
t50% (h) t90% (h)
7.4 26 88.2
6.8 34.8 87.6* *By using the Sahlin and Peppas model
From Table 3.15 it is possible to assert that BSA release mechanism is controlled by diffusion,
as seen previously.
From Figure 3.38 we can see that the kinetics of drug released is controlled by the thickness of
the swollen layer of the polymeric matrix, and show that both water uptake and polymer
disentanglement, as well as polymer degradation, affect the drug release of BSA.
3.4. Co-atomization of chitosan, ibuprofen and bovine serum albumin
Albumin has been known to be a natural surfactant. Moreover, it has previously been assessed
in this study that the presence of BSA appears to increase the aerodynamic properties of CHT
microparticles, so it became interesting to study the effect of co-atomizing BSA with both CHT
and IBP.
3.4.1. Morphology and solid state properties of CHT-IBP-BSA microparticles
0.09 % m/v of BSA was co-atomized with 0.60 % m/v medium MW CHT and 0.09 % m/v IBP
using a 1% acetic acid aqueous solution with 18.6 % v/v of ethanol at 70 oC and 10 MPa in a
150 μm diameter nozzle. Co-atomization containing 0.18 % m/v of BSA in the system
containing CHT and IBP was also tested. However it was unsuccessful due to the formation of
bubbles in the liquid solution while it was being pumped, implying the surfactant properties of
BSA.
CHT-IBP-BSA microparticles were successfully produced under the first condition and its
morphological and physical-state properties were characterized, obtaining Table 3.16.
Table 3.16: Results shown for the co-atomization of a liquid solution of 0.60% m/v CHT, 0.09% g/mL BSA and 0.09% g/mL IBP. Also shown are the mean volumetric diameter (Dv), span, shape, roughness
and solid state.
Morphologi SEM XRD / DSC
Assay Recovery
(%)
Dv, 50
(μm) Span Shape Surface Solid state
10 51.9 2.9 1.30 Spherical Rough Amorphous
The best composition was found to be the one from assay 8, so all the tests were made for this
composition. The properties of CHT-IBP-BSA microparticles are summarized in Table 3.17.

Chapter 3. Results and Discussion
60
Table 3.17: Properties of CHT-BSA microparticles produced by SAA in assay 10:, pore diameter (Dp),
porosity, apparent density, bulk density, true density and tapped density.
Mercury porosimetry Helium
Pycnometer
Graduated
container
Assay Dp
(nm)
Porosity
(%)
Apparent
density
(g/mL)
Bulk density
at 0.51 psia
(g/mL)
True
density
(g/mL)
Tapped
density
(g/mL)
10 134 74.6 1.139 0.289 1.455±0.0 ~0.4±0.05
By analyzing Table 3.16, it is possible to conclude that particles produced by this method have
mean volumetric diameter around 2.9 μm, similar to the diameter of CHT microparticles
spherical shape and smooth surface.
Since the BET analysis is very similar both in CHT and CHT-IBP, and the porosity determined
by mercury intrusion porosimetry is characteristic of macropores.
Analyzing Table 3.17, it becomes apparent that by SAA process we can produce CHT-IBP-BSA
microparticles with macropores with a high degree of porosity (about 74%) with a bulk density
of 0.289 g/mL. Much like in the case of the other microparticles produced, CHT-IBP-BSA
microparticles have a true density of 1.455 g/mL, indicating that CHT is the most abundant
compound. Also, the presence of closed pores is detected because the apparent density is
smaller than the true density.
Particles’ Reynolds number was calculated in order to obtain the Stokes aerodynamic diameter.
Table 3.18: Particles’ Reynolds number calculated for CHT-IBP-BSA particles obtained in assay 10.
Dv,10% (μm) Dv,90% (μm) Rep,10% Rep,90%
1.43 4.71 0.19 0.64
By looking at Table 3.18 it can be concluded that the CHT-IBP-BSA microparticles are, like
CHT and CHT-IBP microparticles, in the stokes flow regime. So it is possible to use the Stokes
equation to determine these particles’ aerodynamic diameter.
Shot Weight was performed on CHT-BSA microparticles, having obtained an emitted fraction
of 98.0±0.1%, indicating that almost all of the powder is released from the capsule. So these
microparticles were analyzed by ACI under the same conditions as in the Shot Weight,
obtaining the results shown in Figure 3.39.

Chapter 3. Results and Discussion
61
caps
ule
inha
ler
i. p.
9 um
5.8
um
4.7
um
3.3
um
2.1
um
1.1
um
0.7
um
0.4
um
0
10
20
30
40
CH
T-I
BP
-BS
A %
Cut-off diameter
Figure 3.39: ACI analysis for CHT-IBP-BSA microparticles produced by SAA.
Analyzing Figure 3.39 it is possible to see that most of the powder is lost in the Induction port,
as in CHT and CHT-IBP formulations.
With the results obtained in ACI it is possible to obtain MMAD, FPF and GSD and compare the
results with the Stokes aerodynamic diameter, as shown in Figure 3.19.
Table 3.19: Aerodynamic diameters by Stokes equation and ACI, as well as FPF and GSD for CHT-IBP-
BSA microparticles produced by SAA. DA (Stokes) particle (μm)
DA (Stokes) with aggregates (μm)
MMAD (μm) FPF GSD
1.55 3.7 2.9 35.9 2.5
Analyzing Table 3.19 it is possible to see a small deviation between Stokes aerodynamic
diameter and MMAD for CHT-IBP-BSA microparticles. Again, some of the particles form
aggregates that do not disaggregate when inhaled, leading to slightly larger particles’ diameter
when tested with an ACI. These results may also indicate that some particles disaggregate due
to the flow produced with inhalation.
Particles produced show a narrow size distribution predominantly between 1 and 6 μm, as seen
in Figure 3.40, showing no difference in the distributions obtained for CHT and CHT-IBP
microparticles.

Chapter 3. Results and Discussion
62
0 2 4 6 8 10
CE Diameter (µm)
Figure 3.40: Comparison of the distribution of particles size of CHT microparticles (black) and CHT-
IBP-BSA microparticles (green).
Looking at the SEM images in Figure 3.41, it is possible to observe that CHT-IBP-BSA
microparticles produced under the specified conditions are spherical possessing diameters
between 0.5 and 6 μm. When BSA was co-atomized with CHT and IBP, the particles appear to
improve in surface roughness. It is also possible to see some hollow particles, which are only
found in this formulation.
Figure 3.41: SEM images of CHT-IBP-BSA microparticles with a magnification of 10,000X.
From Morphologi G3 images, shown in Figure 3.42, it can be seen that the CHT-IBP-BSA
particles produced have a tendency to form small aggregates.
Figure 3.42: Morphologi G3 images of CHT-IBP-BSA microparticles.

Chapter 3. Results and Discussion
63
From Figure 3.42 and, it is possible to see that CHT-IBP-BSA produces loose dispersions
although some agglomerates are still present.
The DSC analysis for CHT-IBP-BSA is shown in Figure 3.43 and Figure 3.44.
50 100 150 200
50 100 150 200
Temperature (°C)
Figure 3.43: First run of the DSC of (a) raw CHT; (b) raw BSA; (c) CHT-BSA microparticles and (d)
CHT-IBP-BSA microparticles from 25 oC to 200 oC with a flow rate of 10 oC/min.
100 200 300
Temperature (°C)
Figure 3.44: Second run of the DSC of (a) raw BSA; (b) raw CHT; (c) CHT-BSA microparticles and (d)
CHT-IBP-BSA microparticles from 25 oC to 300
oC with a flow rate of 10
oC/min.
Analyzing Figure 3.43 and Figure 3.44 it is possible to observe that CHT-IBP-BSA
microparticles processed by SAA have almost all the thermal events encountered for individual
compounds, implying that all of them are present in the formulation. Just as in the case of CHT-
BSA, the thermal event corresponding to the complete denaturation of BSA does not appear in
CHT-IBP-BSA formulation [7].
A mercury porosimetry analysis was performed to detect the presence of macropores in this
formulation and the results obtained are shown in Figure 3.45 [125].
(b)
(a)
(c)
(d)
(b)
(a)
(c)
(d)
Exo
Exo

Chapter 3. Results and Discussion
64
100 10 1 0,1 0,01 1E-3
0
2
4
Cum
ula
tive P
ore
Volu
me (
mL/g
)
Mean Diameter (µm)
Figure 3.45: Pore area of CHT-IBP-BSA microparticles processed by SAA.
A step encountered from 0.08 to 0.5 μm in Figure 3.45 show the presence of macropores in
CHT-IBP-BSA microparticles[20].
FT-IR spectra of CHT-IBP-BSA particles were also obtained and are shown in Figure 3.46.
4000 3500 3000 2500 2000 1500 1000 500
wavenumber (cm-1)
Figure 3.46: FTIR analyses from (a) CHT-IBP-BSA microparticles; (b) raw IBP; (c) raw BSA and (d)
raw CHT.
All the characteristic peaks already discussed for CHT, IBP and BSA are seen in CHT-IBP-
BSA microparticles, Figure 3.46, confirming the presence of these compounds in the
formulation.
Extrusion
Intrusion
(a)
(b)
(d)
(c)

Chapter 3. Results and Discussion
65
3.5. Discussion
All microparticles produced have mean volumetric diameters between 1.9 and 4 μm and show a
narrow PSD, with the exception of CHT microparticles processed with a 300 μm diameter
nozzle (assay 3), which has a mean volumetric diameter of 5.5 μm; CHT-BSA containing 0.17
% g/mL in BSA (assay 8) which possessed a mean volumetric diameter of 6.8 μm. Also, one
must note that when BSA is micronized alone, larger particles than with other formulations are
formed. So there appears to be an interaction between CHT and BSA resulting in the formation
of smaller particles under the conditions tested. CHT concentration did not affect particle size,
however a rise in BSA concentration yielded larger particles. The presence of IBP didn’t affect
particle size, but instead induced large pores on the microparticles that are possible to be
observed in SEM images. BSA however did not induce larger pores on the CHT microparticles,
but instead made the surface rough. From the images obtained by Morphologi G3 it can be
assessed that the presence of BSA in the formulation seems to promote particle aggregation,
indicating interactions between this compounds and CHT. BSA is shown to have better
encapsulation efficiency in CHT microparticles than IBP.
From the ACI results, it appears that BSA enhances the aerodynamic performance of the
particles. CHT-IBP, which possessed higher particle size than the other formulations tested,
showed less particle mass loss in the induction port. Indeed, when CHT-IBP-BSA formulation
was tested on the ACI, the amount of particle lost in the induction port decreased from around
35 % (CHT-IBP) to around 30 %, while CHT-BSA has only 14% losses this way. In this way,
IBP also seems to enhance particle aerodynamic performance, as it also has fewer particles lost
in the induction port than CHT microparticles alone (40 % lost to the induction port). Although
both IBP and BSA affect the aerodynamic performance of CHT microparticles, it appears that
BSA has a bigger impact.
From MIP analysis it is possible to ascertain that all formulations tested contain macropores.
The porosity of CHT, CHT-BSA and CHT-IBP-BSA microparticles was determined as being
around 70%. However, CHT-IBP microparticles contain about 10% lower porosity than the
other formulations. This might indicate the presence of IBP trapped inside CHT microparticles,
preventing mercury from occupying that space, resulting in the observed porosity decrease.
The true densities of the particles with different formulations are very similar, which is not
surprising since the particles are composed mainly of CHT, with only very small amounts of
IBP or BSA when present. Although the true densities of the particles are very similar to each
other, it is interesting to note that the bulk density actually increases when CHT microparticles
are co-atomized with IBP. This may further indicate the presence of IBP trapped inside the
particles.

Chapter 3. Results and Discussion
66
The drug release profile seems to be controlled by an anomalous transport, which means that
both mechanisms (swelling and Fick’s diffusion) have a contribution to the release rate with the
swelling mechanism having a larger influence over Fickian diffusion for both IBP and BSA
release at pH 7.4. The release mechanism suffers a deviation when in slightly acidic conditions.
At pH 6.8 the release of IBP is still anomalous, although now the diffusional exponent is closer
to 0.45 implying a greater contribution to the release from a diffusional mechanism than the
swelling. However, BSA release mechanism at this pH become controlled by the swelling
mechanism. Also, one must note that BSA release is slower than that of IBP.

Chapter 4. Conclusions and Future Work
67
Chapter 4. Conclusions and Future Work
Particles and powders for pulmonary delivery are a great tool of innovation by allowing not
only non-invasive administration routes for drugs commonly delivered by injection in systemic
diseases, but also direct delivery for local diseases in the lung.
The present work demonstrates that it is possible to co-atomize both low MW drugs and
proteins with CHT by SAA, obtaining dry powders with particle size and distribution ranging
from 0.5 to 6 μm well suitable for use in DPI for lung delivery therapy. Also microparticles
were produced with only a 1% acetic acid aqueous solution and some amounts of ethanol,
removing the need for hazardous organic solvents. By changing the amount of ethanol used in
the starting solution, it is possible to change the operating temperature in order to obtain dry
particles at lower temperatures.
The SAA process was successful in creating monodispersed CHT, CHT-IBP, CHT-BSA and
CHT-IBP-BSA microparticles. Moreover, the APIs have shown no signs of thermal degradation
due to the process conditions, implying that CHT can successfully protect thermolabile
compounds during particle formation, preventing the latter from thermal degradation when the
process of atomization occurs. Also, all the formulations processed by SAA were found to be
amorphous, as determined by XRD and DSC.
The addition of the tested APIs improves the aerodynamic performance of the particle by
inducing morphological changes and surface roughness by co-atomization of CHT with BSA,
and producing pores with higher diameters by co-precipitation of CHT with IBP. Indeed, the
fine particle fraction actually increased from circa 26 % to 35 % simply by the addition of an
API, further confirming the enhancement of particles aerodynamic performance. All particles
produced showed the presence of macropores with high porosity, which contributed to bulk
densities in the order of 0.3 g/mL which are also related to good aerodynamic properties. In fact,
the aerodynamic diameter determined for all the particles were found between 0.5 and 5 μm
tested for loose and aggregated particles, which guarantees that the particles can successfully
deposit in the deep lung. The MMAD, determined by ACI, was also found to be between the
aerodynamic diameter determined for loose particles and the one determined for aggregates,
confirming that some particles are disaggregated during inhalation due to the air flow, while
others remain aggregated, thus yielding the observed results.
CHT microparticles produced this way exhibited high swelling degrees much like a hydrogel.
So, when the particles come into contact with the lung aqueous environment, water uptake by
the particles will begin, and the API will then be released by both diffusion and swelling
mechanisms. Since particle swelling is about 200 %, macrophage uptake of the particles will be
hindered due to the higher sizes achieved during particle swelling as the particle geometric
diameter for some particles will become greater than 6 μm. Also the maximum swelling degree

Chapter 4. Conclusions and Future Work
68
of CHT microparticles is achieved almost instantly when the particles enter contact with an
aqueous solution.
However the presence of lysozyme in the lungs will start to degrade CHT’s polymeric chain
almost instantly when they come in contact with the microparticles. This implies that the release
of the API will become significantly faster, due to the faster rates of polymer decomposition.
In the future, drug release studies under the presence of lysozyme should be made in order to
determine how it affects the release mechanism of the API. Stability tests on the solid state of
the materials should also be determined. Macrophage uptake studies must also be made in order
to determine how the particles are affected by this parameter, yielding a greater insight on the
defense mechanism against CHT microparticles. In vivo studies in a murine model also could be
determined to provide a better understanding on the aerodynamic characteristics of the particles
produced, as well as on the drug release and polymer degradation.
Other formulations containing nanoparticles that can be used as a targeted delivery system and
for theragnosys can be developed using SAA. Also, antitumoral drugs, such as paclitaxel, for
local delivery can be processed by SAA. On the other hand, since the lungs are extremely
vascularized, it will be interesting to test other drugs for the treatment of systemic diseases.
The positive results obtained in this work indicate that CHT is a very promising polymer for use
in a DPI. Also, the method used has the possibility of impregnating the API inside the
polymeric matrix of CHT during particle formation, providing a good carrier system which will
protect the pharmaceutical compound against the defense mechanism of the respiratory system
and providing a sustained release at the same time.

Bibliography
69
Bibliography
1. Bailey MM, Berkland CJ (2009) Nanoparticle Formulations in Pulmonary Drug
Delivery. Medicinal Research Reviews 29: 196–212.
2. Buttini F, Colombo P, Rossi A, Sonvico F, Colombo G (2012) Particles and powders:
tools of innovation for non-invasive drug administration. Journal of Controlled Release
161: 693–702.
3. Chow AHL, Tong HHY, Chattopadhyay P, Shekunov BY (2007) Particle engineering
for pulmonary drug delivery. Pharmaceutical research 24: 411–437.
4. El-Sherbiny IM, Smyth HDC (2010) Biodegradable nano-micro carrier systems for
sustained pulmonary drug delivery: (I) self-assembled nanoparticles encapsulated in
respirable/swellable semi-IPN microspheres. International journal of pharmaceutics 395:
132–141.
5. Nokhodchi A, Larhrib H (2013) Overcoming the undesirable properties of dry-powder
inhalers with novel engineered mannitol particles. Therapeutic delivery 4: 879–882.
6. Siegel R, Naishadham D, Jemal A (2013) Cancer Statistics , 2013. CA: A Cancer Journal
for Clinicians 63: 11–30.
7. Reverchon E, Antonacci A, Chimica I (2007) Drug – Polymer Microparticles Produced
by Supercritical Assisted Atomization. Biotechnology and bioengineering 97: 1626–
1637.
8. Patel MP, Patel RR, Patel JK (2010) Chitosan mediated targeted drug delivery system: a
review. Journal of pharmacy & pharmaceutical sciences : a publication of the Canadian
Society for Pharmaceutical Sciences, Société canadienne des sciences pharmaceutiques
13: 536–557.
9. Kwok PCL, Chan H-K (2013) Pulmonary drug delivery. Therapeutic delivery 4: 877–
878.
10. Symbicort (2012) Symbicort for asthma. Available:
http://www.mysymbicort.com/asthma/symbicort-inhaler.aspx. Accessed 26 October
2013.
11. Wikicell (2012) Lung. Available: http://www.wikicell.org/index.php/Lung. Accessed 26
October 2013.
12. Grid Club (2012) Natural World; Human body: Organs. Available: http://www.gridclub.com/subscribers/info/fact_gadget_2009/1001/human_world/human
_body_organs/668.html. Accessed 26 October 2013.
13. Newman SP, Busse WW (2002) Evolution of dry powder inhaler design, formulation,
and performance. Respiratory Medicine 96: 293–304.
14. Smyth HDC, Hickey AJ (2005) Carriers in Drug Powder Delivery Implications for
Inhalation System Design. American Journal of Drug Delivery 3: 117–132.

Bibliography
70
15. Giraud V, Roche N (2002) Misuse of corticosteroid metered-dose inhaler is associated
with decreased asthma stability. European Respiratory Journal 19: 246–251.
16. El-sherbiny IM, Mcgill S, Smyth HDC (2010) Swellable Microparticles as Carriers for
Sustained Pulmonary Drug Delivery. Journal of Pharmaceutical Sciences 99: 2343–
2356.
17. Gregg SJ, Sing KSW (1982) Introduction. Adsorption, Surface Area and Porosity.
London: Academic Press. pp. 1–50.
18. Rouquerol F, Ruoquerol J, Sing K (1999) Introduction. Adsorption by Powders and
Porous Solids. London: Academic Press. pp. 1–26.
19. Rouquerol F, Ruoquerol J, Sing K (1999) Interpretation of Physisorption Isotherms at
the Gas-Solid Interface. Adsorption by Powders and Porous Solids. London: Academic
Press. pp. 93–115.
20. Giesche H (2006) Mercury Porosimetry: A General (Practical) Overview. Particle &
Particle Systems Characterization 23: 9–19.
21. Lowell S, Shields JE (1984) Interpretation of mercury porosimetry data. Powder Surface
Area and Porosity. London: Chapman and Hall. pp. 97–120.
22. Bering BP, Dubinin MM, Serpinsky V V. (1966) Theory of volume filling for vapor
adsorption. Journal of Colloid and Interface Science 21: 378–393.
23. Lowell S, Shields JE (1984) Density Measurement. Powder Surface Area and Porosity.
London: Chapman and Hall. pp. 217–231.
24. Shekunov BY, Chattopadhyay P, Tong HHY, Chow AHL (2007) Particle size analysis
in pharmaceutics: principles, methods and applications. Pharmaceutical research 24:
203–227.
25. Podczeck F, Newton JM, James MB (1997) Variations in the adhesion force between a
drug and carrier particles as a result of changes in the relative humidity of the air.
International Journal of Pharmaceutics 149: 151–160.
26. Council of Europe (2010) 2.9.18 Preparations for Inhalation: Aerodynamic Assessment
of Fine Particles. European Pharmacopoeia 7.0. Council of Europe. pp. 274–285.
27. United States Pharmacopeial Convention (2012) <601> Aerosols, Nasal Sprays,
Metered-Dose Inhalers, and Dry Powder Inhalers. U.S. Pharmacopeia & National
Formulary. United States Pharmacopeial Convention. p. 46.
28. Council of Europe (2004) Preparations for Inhalation: Aerodynamic Assessment of Fine
Particles. European Pharmacopoeia 5.0. Council of Europe. pp. 244–253.
29. Doub WH, Adams WP, Wokovich AM, Black JC, Shen M, et al. (2012) Measurement of
Drug in Small Particles from Aqueous Nasal Sprays by Andersen Cascade Impactor.
Pharmaceutical research m.

Bibliography
71
30. Arifin DY, Lee LY, Wang C-H (2006) Mathematical modeling and simulation of drug
release from microspheres: Implications to drug delivery systems. Advanced drug
delivery reviews 58: 1274–1325.
31. Alfrey T, Gurnee EF, Lloyd WG (2007) Diffusion in glassy polymers. Journal of
Polymer Science Part C: Polymer Symposia 12: 249–261.
32. Dash M, Chiellini F, Ottenbrite RM, Chiellini E (2011) Chitosan—A versatile semi-synthetic polymer in biomedical applications. Progress in Polymer Science 36: 981–
1014.
33. De Alvarenga ES (2011) Characterization and Properties of Chitosan. In: Elnashar M,
editor. Biotechnology of Biopolymers. InTech. pp. 1–19.
34. Kumirska J, Czerwicka M, Kaczyński Z, Bychowska A, Brzozowski K, et al. (2010) Application of spectroscopic methods for structural analysis of chitin and chitosan.
Marine drugs 8: 1567–1636.
35. Sharma K, Somavarapu S, Colombani A, Govind N, Taylor KMG (2012) Crosslinked
chitosan nanoparticle formulations for delivery from pressurized metered dose inhalers.
European Journal of Pharmaceutics and Biopharmaceutics 81: 74–81.
36. Riva R, Ragelle H, Rieux A, Duhem N, Jérôme C, et al. (2011) Chitosan and Chitosan Derivatives in Drug Delivery and Tissue Engineering. Chitosan for Biomaterials II.
Springer Berlin Heidelberg, Vol. 244. pp. 19–44.
37. Raveendran S, Poulose AC, Yoshida Y, Maekawa T, Kumar DS (2013) Bacterial
exopolysaccharide based nanoparticles for sustained drug delivery, cancer chemotherapy
and bioimaging. Carbohydrate polymers 91: 22–32.
38. Ito T, Yoshida C, Murakami Y (2013) Design of novel sheet-shaped chitosan hydrogel for wound healing: A hybrid biomaterial consisting of both PEG-grafted chitosan and
crosslinkable polymeric micelles acting as drug containers. Materials science &
engineering C, Materials for biological applications 33: 3697–3703.
39. Bai M-Y, Chou T-C, Tsai J-C, Yu W-C (2013) The effect of active ingredient-containing chitosan/polycaprolactone nonwoven mat on wound healing: in vitro and in vivo studies.
Journal of Biomedical Materials Research Part A, in press.
40. Van der Schueren L, De Meyer T, Steyaert I, Ceylan Ö, Hemelsoet K, et al. (2013)
Polycaprolactone and polycaprolactone/chitosan nanofibres functionalised with the pH-
sensitive dye Nitrazine Yellow. Carbohydrate polymers 91: 284–293.
41. Correia VG, Coelho M, Barroso T, Raje VP, Bonifácio VDB, et al. (2013) Anti-biofouling 3D porous systems: the blend effect of oxazoline-based oligomers on chitosan
scaffolds. Biofouling 29: 273–282.
42. Qin Y (1993) The chelating properties of chitosan fibers. Journal of Applied Polymer
Science 49: 727–731.
43. Cui X, Li CM, Zang J, Yu S (2007) Highly sensitive lactate biosensor by engineering chitosan/PVI-Os/CNT/LOD network nanocomposite. Biosensors & bioelectronics 22:
3288–3292.

Bibliography
72
44. Romanazzi G, Gabler FM, Margosan D, Mackey BE, Smilanick JL (2009) Effect of
chitosan dissolved in different acids on its ability to control postharvest gray mold of
table grape. Phytopathology 99: 1028–1036.
45. Okamoto H, Nishida S, Todo H, Sakakura Y, Iida K, et al. (2003) Pulmonary gene
delivery by chitosan-pDNA complex powder prepared by a supercritical carbon dioxide
process. Journal of Pharmaceutical Sciences 92: 371–380.
46. Luo Y, Zhai X, Ma C, Sun P, Fu Z, et al. (2012) An inhalable β2-adrenoceptor ligand-
directed guanidinylated chitosan carrier for targeted delivery of siRNA to lung. Journal
of Controlled Release 162: 28–36.
47. Okamoto H, Shiraki K, Yasuda R, Danjo K, Watanabe Y (2011) Chitosan-interferon-β gene complex powder for inhalation treatment of lung metastasis in mice. Journal of
Controlled Release 150: 187–195.
48. Jafarinejad S, Gilani K, Moazeni E, Ghazi-Khansari M, Najafabadi AR, et al. (2012)
Development of chitosan-based nanoparticles for pulmonary delivery of itraconazole as
dry powder formulation. Powder Technology 222: 65–70.
49. Uchegbu IF, Schätzlein a G, Tetley L, Gray a I, Sludden J, et al. (1998) Polymeric chitosan-based vesicles for drug delivery. The Journal of pharmacy and pharmacology
50: 453–458.
50. Kim SE, Park JH, Cho YW, Chung H, Jeong SY, et al. (2003) Porous chitosan scaffold
containing microspheres loaded with transforming growth factor-beta1: implications for
cartilage tissue engineering. Journal of Controlled Release 91: 365–374.
51. Wang L-Y, Ma G-H, Su Z-G (2005) Preparation of uniform sized chitosan microspheres by membrane emulsification technique and application as a carrier of protein drug.
Journal of Controlled Release 106: 62–75.
52. Zheng C-H, Gao J-Q, Zhang Y-P, Liang W-Q (2004) A protein delivery system:
biodegradable alginate-chitosan-poly(lactic-co-glycolic acid) composite microspheres.
Biochemical and biophysical research communications 323: 1321–1327.
53. Temtem M, Barroso T, Casimiro T, Mano JF, Aguiar-Ricardo A (2012) Dual stimuli
responsive poly(N-isopropylacrylamide) coated chitosan scaffolds for controlled release
prepared from a non residue technology. The Journal of Supercritical Fluids 66: 398–
404.
54. Hyung Park J, Kwon S, Lee M, Chung H, Kim J-H, et al. (2006) Self-assembled nanoparticles based on glycol chitosan bearing hydrophobic moieties as carriers for
doxorubicin: in vivo biodistribution and anti-tumor activity. Biomaterials 27: 119–126.
55. Trapani A, De Giglio E, Cafagna D, Denora N, Agrimi G, et al. (2011) Characterization
and evaluation of chitosan nanoparticles for dopamine brain delivery. International
journal of pharmaceutics 419: 296–307.
56. Yang R, Shim W-S, Cui F-D, Cheng G, Han X, et al. (2009) Enhanced electrostatic
interaction between chitosan-modified PLGA nanoparticle and tumor. International
Journal of Pharmaceutics 371: 142–147.

Bibliography
73
57. Roger P, Gascard JP, de Montpreville VT, Brink C (1999) Basal secretion of lysozyme
from human airways in vitro. Mediators of inflammation 8: 319–323.
58. Kean T, Thanou M (2010) Biodegradation, biodistribution and toxicity of chitosan.
Advanced drug delivery reviews 62: 3–11.
59. Rowe RC, Sheskey PJ, Quinn ME, editors (2009) Chitosan. Handbook of
Pharmaceutical Excipients. London: Pharmaceutical Press. pp. 159–161.
60. Peniche C, Argüelles-Monal W, Peniche H, Acosta N (2003) Chitosan: An Attractive Biocompatible Polymer for Microencapsulation. Macromolecular Bioscience 3: 511–
520.
61. Bérard V, Lesniewska E, Andrès C, Pertuy D, Laroche C, et al. (2002) Affinity scale
between a carrier and a drug in DPI studied by atomic force microscopy. International
journal of pharmaceutics 247: 127–137.
62. Rasenack N, Müller BW (2004) Micron-size drug particles: common and novel
micronization techniques. Pharmaceutical development and technology 9: 1–13.
63. Irngartinger M, Camuglia V, Damm M, Goede J, Frijlink HW (2004) Pulmonary
delivery of therapeutic peptides via dry powder inhalation: effects of micronisation and
manufacturing. European Journal of Pharmaceutics and Biopharmaceutics 58: 7–14.
64. Rasenack N, Steckel H, Muller BW (2003) Micronization of anti-inflammatory drugs for pulmonary delivery by a controlled crystallization process. Journal of pharmaceutical
sciences 92: 35–44.
65. Mathiowitz E, Thanos C, Liu Z (2004) U.S. Patent 6,824,791 B2. 2: 29.
66. Rasenack N, Steckel H, Müller BW (2004) Preparation of microcrystals by in situ
micronization. Powder Technology 143-144: 291–296.
67. Millqvist-Fureby A, Malmsten M, Bergenståhl B (1999) Spray-drying of trypsin -
surface characterization and activity preservation. International Journal of Pharmaceutics
188: 243–253.
68. Ozeki T, Beppu S, Mizoe T, Takashima Y, Yuasa H, et al. (2006) Preparation of
polymeric submicron particle-containing microparticles using a 4-fluid nozzle spray
drier. Pharmaceutical research 23: 177–183.
69. Maa YF, Nguyen P a, Sit K, Hsu CC (1998) Spray-drying performance of a bench-top
spray dryer for protein aerosol powder preparation. Biotechnology and bioengineering
60: 301–309.
70. Dunbar CA, Concessio NM, Hickey AJ (1998) Evaluation of Atomizer Performance in
Production of Respirable Spray-Dried Particles. Pharmaceutical Development and
Technology 3: 433–441.
71. Elversson J, Millqvist-Fureby A, Alderborn G, Elofsson U (2003) Droplet and particle size relationship and shell thickness of inhalable lactose particles during spray drying.
Journal of pharmaceutical sciences 92: 900–910.
Bibliography
74
72. Elversson J, Millqvist-Fureby A (2005) Particle size and density in spray drying-effects
of carbohydrate properties. Journal of pharmaceutical sciences 94: 2049–2060.
73. De La Tour CC (1822) Exposé de quelques résultats par l’action combinée de la chaleur
et de la compression sur certains liquides, tels que l'eau, l'alcool, l'éther sulfurique et
l'essence de pétrole rectifiée. Annales de Chimie et de Physique 21: 127–132.
74. Adami R, Liparoti S, Reverchon E (2011) A new supercritical assisted atomization configuration, for the micronization of thermolabile compounds. Chemical Engineering
Journal 173: 55–61.
75. Della Porta G, De Vittori C, Reverchon E (2005) Supercritical assisted atomization: a
novel technology for microparticles preparation of an asthma-controlling drug. AAPS
PharmSciTech 6: E421–8.
76. Leitner W, Jessop PG (2010) Introduction. In: Anastas PT, Leitner W, Jessop PG,
editors. Handbook of Green Chemistry, Volume 4: Green Solvents, Supercritical
Solvents. Weinheim: Wiley-VCH. pp. 1–30.
77. Foster NR, Lucien FP, Mammucari R (2010) Basic Physical Properties, Phase Behavior
and Solubility. In: Anastas PT, Leitner W, Jessop PG, editors. Handbook of Green Chemistry, Volume 4: Green Solvents, Supercritical Solvents. Weinheim: Wiley-VCH.
pp. 77–100.
78. Popov VK, Banister JA, Bagratashvili VN, Howdle SM, Poliakoff M (1994) Acoustic
and Photoacoustic Measurements in Supercritical Fluids ; A New Approach to
Determining the Critical Point of Mixtures. The Journal of Supercritical Fluids 7: 69–73.
79. Ribeiro N, Aguiar-ricardo A (2006) Can the Speed of Sound Be Used for Detecting
Critical States of Fluid Mixtures? Journal of Physical Chemistry B 110: 478–484.
80. McClain R, Hyun MH, Li Y, Welch CJ (2013) Design, synthesis and evaluation of
stationary phases for improved achiral supercritical fluid chromatography separations.
Journal of chromatography A 1302: 163–173.
81. Andrade KS, Gonc RT, Maraschin M, Ribeiro-do-valle RM, Martínez J, et al. (2012) Supercritical fluid extraction from spent coffee grounds and coffee husks : Antioxidant
activity and effect of operational variables on extract composition. Talanta 88: 544–552.
82. Herrero M, Mendiola JA, Cifuentes A, Ibá E (2010) Supercritical fluid extraction :
Recent advances and applications. Journal of Chromatography A 1217: 2495–2511.
83. Giles MR, Griffiths RMT, Aguiar-Ricardo A, Silva MMCG, Howdle SM (2001)
Fluorinated Graft Stabilizers for Polymerization in Supercritical Carbon Dioxide : The
Effect of Stabilizer Architecture. Macromolecules 34: 20–25.
84. Duarte ARC, Casimiro T, Aguiar-Ricardo A, Simplício AL, Duarte CMM (2006)
Supercritical fluid polymerisation and impregnation of molecularly imprinted polymers
for drug delivery. The Journal of Supercritical Fluids 39: 102–106.
85. Macedo CV De, da Silva MS, Casimiro T, Cabrita EJ, Aguiar-ricardo A (2007) Boron trifluoride catalyzed polymerisation of 2-substituted-2-oxazolines in supercritical carbon
dioxide. Green Chemistry 9: 948–953.

Bibliography
75
86. Da Silva MS, Nobrega FL, Aguiar-ricardo A, Cabrita EJ, Casimiro T (2011)
Development of molecularly imprinted co-polymeric devices for controlled delivery of
flufenamic acid using supercritical fluid technology. The Journal of Supercritical Fluids
58: 150–157.
87. Da Silva MS, Vão ER, Temtem M, Mafra L, Caldeira J, et al. (2010) Clean synthesis of molecular recognition polymeric materials with chiral sensing capability using
supercritical fluid technology. Application as HPLC stationary phases. Biosensors and
Bioelectronics 25: 1742–1747.
88. Reverchon E, Adami R (2006) Nanomaterials and supercritical fluids. Journal of
Supercritical Fluids 37: 1–22.
89. Sanli D, Bozbag SE, Erkey C (2011) Synthesis of nanostructured materials using
supercritical CO2: Part I. Physical transformations. Journal of Materials Science 47:
2995–3025.
90. Türk M (1999) Formation of small organic particles by RESS : experimental and
theoretical investigations. Journal of Supercritical Fluids 15: 79–89.
91. Martín a, Cocero MJ (2008) Micronization processes with supercritical fluids:
fundamentals and mechanisms. Advanced drug delivery reviews 60: 339–350.
92. Girotra P, Singh SK, Nagpal K (2013) Supercritical fluid technology: a promising
approach in pharmaceutical research. Pharmaceutical development and technology 18:
22–38.
93. Reverchon E (1999) Supercritical antisolvent precipitation of micro- and nano-particles.
Journal of Supercritical Fluids 15: 1–21.
94. Reverchon E, Caputo G, De Marco I (2003) Role of Phase Behavior and Atomization in the Supercritical Antisolvent Precipitation. Industrial & Engineering Chemistry Research
42: 6406–6414.
95. Reverchon E, Adami R, Caputo G (2006) Supercritical assisted atomization:
Performance comparison between laboratory and pilot scale. The Journal of Supercritical
Fluids 37: 298–306.
96. Adami R, Osséo LS, Reverchon E (2009) Micronization of lysozyme by supercritical
assisted atomization. Biotechnology and bioengineering 104: 1162–1170.
97. Reverchon E, Della Porta G (2003) Micronization of antibiotics by supercritical assisted
atomization. The Journal of Supercritical Fluids 26: 243–252.
98. Reverchon E (2002) Supercritical-Assisted Atomization To Produce Micro- and/or
Nanoparticles of Controlled Size and Distribution. Industrial & Engineering Chemistry
Research 41: 2405–2411.
99. Reverchon E (2007) U.S. Patent 7,276,190 B2: 10.
100. Caputo G, Adami R, Reverchon E (2010) Analysis of Dissolved-Gas Atomization:
Supercritical CO 2 Dissolved in Water. Industrial & Engineering Chemistry Research
49: 9454–9461.

Bibliography
76
101. Reverchon E, Antonacci A (2006) Chitosan Microparticles Production by Supercritical
Fluid Processing. Industrial & Engineering Chemistry Research 45: 5722–5728.
102. York P (1999) Strategies for particle design using supercritical fluid technologies.
Pharmaceutical science & technology today 2: 430–440.
103. Duarte C, Aguiar-Ricardo A, Ribeiro N, Casimiro T, da Ponte MN (2000) Correlation of
Vapor – Liquid Equilibrium for Carbon Dioxide + Ethanol + Water at Temperatures
from 35 to 70 ° C. Separation Science and Technology 35: 2187–2201.
104. Porta G Della, Adami R, Gaudio PDEL, Prota L, Aquino R, et al. (2010) Albumin /
Gentamicin Microspheres Produced by Supercritical Assisted Atomization :
Optimization of Size , Drug Loading and Release. Journal of Pharmaceutical Sciences
99: 4720–4729.
105. Li J, Rodrigues M, Matos HA, Azevedo EG De (2005) VLE of Carbon Dioxide /
Ethanol / Water : Applications to Volume Expansion Evaluation and Water Removal
Efficiency. Ind Eng Chem Res 44: 6751–6759.
106. Martín A, Bouchard A, Hofland GW, Witkamp G-J, Cocero MJ (2007) Mathematical
modeling of the mass transfer from aqueous solutions in a supercritical fluid during
particle formation. The Journal of Supercritical Fluids 41: 126–137.
107. Wang Q, Guan Y-X, Yao S-J, Zhu Z-Q (2012) The liquid volume expansion effect as a
simple thermodynamic criterion in cholesterol micronization by supercritical assisted
atomization. Chemical Engineering Science 75: 38–48.
108. Reverchon E, Adami R, Caputo G (2007) Production of cromolyn sodium microparticles
for aerosol delivery by supercritical assisted atomization. AAPS PharmSciTech 8: E1–
E9.
109. Aquino RP, Auriemma G, Mencherini T, Russo P, Porta A, et al. (2013) Design and
production of gentamicin/dextrans microparticles by supercritical assisted atomisation
for the treatment of wound bacterial infections. International Journal of Pharmaceutics
440: 188–194.
110. Reverchon E, Antonacci A (2007) Polymer microparticles production by supercritical
assisted atomization. The Journal of Supercritical Fluids 39: 444–452.
111. Copley Scientific (2012) Quality Solutions for Inhaler Testing: 108.
112. Council of Europe (2004) Preparations for Inhalation. European Pharmacopoeia 5.1.
Council of Europe. pp. 2843–2847.
113. Caputo G, Liparoti S, Adami R, Reverchon E (2012) Use of Supercritical CO 2 and N 2
as Dissolved Gases for the Atomization of Ethanol and Water. Industrial & Engineering
Chemistry Research 51: 11803–11808.
114. Huang Z, Xiao J, Qiao X, Jiang G, Shao Y, et al. (2012) Spray characteristics and
controlling mechanism of fuel containing CO2. Frontiers in Energy 6: 80–88.

Bibliography
77
115. Reverchon E, Adami R, Scognamiglio M, Fortunato G, Della Porta G (2010)
Beclomethasone Microparticles for Wet Inhalation, Produced by Supercritical Assisted
Atomization. Industrial & Engineering Chemistry Research 49: 12747–12755.
116. Dong Y, Ruan Y, Wang H, Zhao Y, Bi D (2004) Studies on glass transition temperature
of chitosan with four techniques. Journal of Applied Polymer Science 93: 1553–1558.
117. Kittur FS, Harish Prashanth KV, Udaya Sankar K, Tharanathan RN (2002) Characterization of chitin, chitosan and their carboxymethyl derivatives by differential
scanning calorimetry. Carbohydrate Polymers 49: 185–193.
118. Sakurai K, Maegawa T, Takahashi T (2000) Glass transition temperature of chitosan and
miscibility of chitosan/poly(N-vinyl pyrrolidone) blends. Polymer 41: 7051–7056.
119. Lazaridou A, Biliaderis CG (2002) Thermophysical properties of chitosan , chitosan-starch and chitosan-pullulan films near the glass transition. Carbohydrate Polymers 48:
179–190.
120. Ratto J, Hatakeyama T, Blumstein RB (1995) Differential scanning calorimetry
investigation of phase transitions in water/ chitosan systems. Polymer 36: 2915–2919.
121. Dhawade PP, Jagtap RN (2012) Characterization of the glass transition temperature of
chitosan and its oligomers by temperature modulated differential scanning calorimetry.
Advances in Applied Science Research 3: 1372–1382.
122. Mettler Toledo (2000) UserCOM: 28.
123. Guinesi LS, Cavalheiro ÉTG (2006) The use of DSC curves to determine the acetylation
degree of chitin/chitosan samples. Thermochimica Acta 444: 128–133.
124. Borde B, Bizot H, Vigier G, Bule A (2002) Calorimetric analysis of the structural
relaxation in partially hydrated amorphous polysaccharides . II . Phenomenological study
of physical ageing . Carbohydrate Polymers 48: 111–123.
125. Lubda D, Lindner W, Quaglia M, Hohenesche C du F von, Unger KK (2005) Comprehensive pore structure characterization of silica monoliths with controlled
mesopore size and macropore size by nitrogen sorption, mercury porosimetry,
transmission electron microscopy and inverse size exclusion chromatography. Journal of
Chromatography A 1083: 14–22.
126. Skoog DA, Holler FJ, Crouch SR (2007) Applications of Infrared Spectrometry. In:
Kiselica S, Broyer R, Short MA, editors. Principles of Instrumental Analysis. Belmont:
Brooks/Cole. pp. 455–480.
127. Silverstein RM, Webster FX, Kiemle DJ (2005) Infrared Spectrometry. In: Brennan D,
Yee J, Wolfman-Robichaud S, Rigby S, editors. Spectrometric Identification of Organic
Compounds. New York: John Wiley & Sons, Inc. pp. 72–126.
128. Hanson J (2012) Characteristic IR Absorption Frequencies of Organic Functional
Groups. Available:
http://www2.ups.edu/faculty/hanson/Spectroscopy/IR/IRfrequencies.html. Accessed 5
August 2013.
Bibliography
78
129. William Reusch (2013) Infrared Spectroscopy. Available:
http://www2.chemistry.msu.edu/faculty/reusch/VirtTxtJml/Spectrpy/InfraRed/infrared.ht
m. Accessed 5 August 2013.
130. De Giglio E, Trapani A, Cafagna D, Sabbatini L, Cometa S (2011) Dopamine-loaded
chitosan nanoparticles: formulation and analytical characterization. Analytical and
bioanalytical chemistry 400: 1997–2002.
131. Desbrie J, Brugnerotto J, Lizardi J, Goycoolea FM, Argu W (2001) An infrared
investigation in relation with chitin and chitosan characterization. Polymer 42: 3569–
3580.
132. Hasnain MS, Nayak AK (2012) Solubility and dissolution enhancement of ibuprofen by solid dispersion technique using PEG 6000-PVP K 30 combination carrier. Chemistry:
Bulgarian Journal of Science Education 21: 118–132.
133. Xu F, Sun L-X, Tan Z-C, Liang J-G, Li R-L (2004) Thermodynamic study of ibuprofen
by adiabatic calorimetry and thermal analysis. Thermochimica Acta 412: 33–57.
134. Siepmann J, Siepmann F (2008) Mathematical modeling of drug delivery. International
journal of pharmaceutics 364: 328–343.
135. Peppas NA, Sahlin JJ (1989) A simple equation for the description of solute release. III. Coupling of diffusion and relaxation. International Journal of Pharmaceutics 57: 169–
172.
136. Michnik A (2003) Thermal stability of bovine serum albumin DSC study. Journal of
Thermal Analysis and Calorimetry 71: 509–519.
137. Michnik A, Michalik K, Kluczewska A, Drzazga Z (2006) Comparative DSC study of
human and bovine serum albumin. Journal of Thermal Analysis and Calorimetry 84:
113–117.
138. Anfinsen CB (1973) Principles that Govern the Folding of Protein Chains. Science 181:
223–230.