development of blended cements for water proofing application
140
DEVELOPMENT OF BLENDED CEMENTS FOR WATER PROOFING APPLICATION (MEMBANGUNKAN SIMEN TERUBAHSUAI UNTUK KEGUNAAN SIMEN KALIS AIR) SALIHUDDINRADIN SUMADI LEE YEE LOON RESEARCH VOTE NO: 73309 Jabatan Struktur dan Bahan Fakulti Kejuruteraan Awam Universiti Teknologi Malaysia 2008
Transcript of development of blended cements for water proofing application
DEVELOPMENT OF BLENDED CEMENTS FOR WATER PROOFING
APPLICATION
(MEMBANGUNKAN SIMEN TERUBAHSUAI UNTUK KEGUNAAN
SIMEN KALIS AIR)
SALIHUDDINRADIN SUMADI
LEE YEE LOON
RESEARCH VOTE NO:
73309
Jabatan Struktur dan Bahan
Fakulti Kejuruteraan Awam
Universiti Teknologi Malaysia
2008
ii
ACKNOWLEDGEMENTS First and foremost the authors wish to invoke The All Mighty Allah for His forgiveness and thank Him for His Mercy and Blessings to enable the authors in completing this humble research. The authors wish to register their sincere gratitude to all those who have rendered their assistance especially the research assistants and students namely Lenny and Noor Ahmad Memon during this piece of research. Special thanks are due to all the technical staff of Materials and Structures Laboratory of Civil Engineering Faculty. A special acknowledgement is due to Construction Industry Development Baord, CIDB, and Research Management Centre, RMC of Universiti Teknologi Malaysia for the allocation of research grant, and the management and coordination of the research activities respectively.
iii
ABSTRACT
(Keywords: cement replacement, mineral admixtures, multi-blended pozzolan)
The application of mineral admixtures as partial cement replacement in concrete leads to a
reduction in construction cost. Usually single mixture has limitation and some have
contrasting influences on properties of concrete. The combination of more kinds of
mineral admixtures is postulated to improve concrete properties. Since RHA is highly
reactive pozzolan, it has led to the idea of focusing the study on the performance of Multi-
blended pozzolan as partial cement replacement in mortar. Over 8 different mixes were
produced in which four mixes contained varying percentages of admixtures (Multi
Blended Cement, MBC) and the remainders were single mix (Binary Blended Cement,
BBC) containing optimum percentages (based on literature study) of 20% PFA, 20%
RHA, 50% SLAG, and 10% POFA. Three samples for each mix, curing period and
parameter tests were prepared. This work initially deals with compressive strength
characteristics, water absorption, and total porosity on mortar cured (standard curing) for
7, 28, 60 and 90 days. The performance of optimum MBC mortar was studied in terms of
ultimate compressive strength, water absorption and total porosity. The strength properties
of the optimum mixes of MBC mortars was also examined at different curing regimes.
This research also focuses on studying some durability aspects of the optimum mix of
MBC mortars namely acid attack, and carbonation. Besides, the effects of saline seawater
were investigated for short term exposure. Finally attempt in brief study on suitability of
the optimum mixes of MBC mortars as face sheets to produce lightweight non-load
bearing sandwich block was conducted. From the results obtained, it was found that the
strength of control and BBC mortars at early age on average were 20% higher than MBC
mortars, and at final age both were comparable with MBC mortars. The strength of all
mortars at 90 days on average was 59MPa. However, the MBC system produced low
permeability mortar compared to control, and BBC mortars at all ages. The total porosity
and water absorption of control and BBC were 28% and 21%, and 9% and 14%,
respectively. The strength of MBC mortar after 45 cycles of wet and dry curing in
seawater exhibited 24% higher than control mortar. The initial water curing for 7 and 14
days and continuous air curing also exhibited 13% and 19%, and 21% and 26%, higher
early strength than continuous water and air curing, respectively. The strength and
durability properties of MBC mortar are more pronounced than control when it is

iv
provided with adequate curing. After exposure to chemical attack, the MBC mortar
exhibits better resistance than control mortar. With adequate curing the MBC mortar was
higher in durability than control mortar when subjected to chemical attack.
Key researchers :
Prof. Dr. Salihuddin Radin Sumasi (Head)
Lany Saryme Binti Jasmin
E-mail : [email protected]
Tel. No. : 07-5531967
Vote No. : 73309

v
ABSTRAK Prestasi mortar berasaskan pelbagai bahan tambah mineral dan sisa industri sebagai bahan
gantian separa simen merupakan fokus utama dalam kajian ini. Dalam kajian ini, terdapat
8 jenis campuran bahan tambah (terdiri daripada beberapa peratus campuran) untuk
dibandingkan prestasinya dengan mortar yang mengandungi 100 peratus simen (mortar
kawalan). Empat campuran daripadanya terdiri daripada pelbagai peratus campuran bahan
tambah dengan simen (pelbagai bahan tambah, PBT). Manakala empat jenis campuran
lagi adalah campuran simen dengan satu jenis bahan tambah (satu bahan tambah, SBT), di
mana peratus kandungan PFA, RHA, SLAG dan POFA yang optimum digunakan dalam
kajian ini (berdasarkan kajian ilmiah terdahulu). Bahan buangan ini adalah diperolehi dari
sumber tempatan. Pada peringkat awalnya, kajian ini menumpukan kepada ciri-ciri
kekuatan bahan, kadar penyerapan air dan jumlah peratus keliangan sesuatu campuran
mortar. Mortar diawet dengan air selama 7, 28, 60 dan 90 hari dan diuji bagi mendapatkan
campuran PBT yang optimum. Mortar PBT juga diuji kekuatannya dengan pelbagi jenis
pengawetan. Kajian juga mengambilkira aspek kebolehtahanlasakan mortar PBT seperti
serangan asid, pengkarbonatan, dan kesan terhadap air laut (perubahan tercepat) pada
tempoh dedahan yang singkat. Kajian secara umum kesesuaian penggunaan mortar PBT
sebagai lapisan yang mengapit blok ringan juga dikaji. Hasil daripada keputusan ujikaji,
kekuatan mortar SBT dan kawalan adalah lebih tinggi dari mortar PBT pada awal umur,
tetapi kekuatan semua mortar adalah setara pada peringkat akhir umur. Namun, mortar
PBT menghasilkan peratus kadar penyerapan air dan jumlah keliangan yang lebih rendah
berbanding mortar SBT dan kawalan. Mortar PBT menghasilkan kebolehlasakan yang
tinggi sekiranya diawet dengan sempurna. Mortar PBT yang diawet dengan permulaan 7
atau 14 hari di dalam air dan kemudian di udara menghasilkan kekuatan mortar yang tinggi
pada awal umur berbanding dengan awetan secara terus di dalam air mahupun udara. Blok

vi
konkrit ringan berudara terapit dengan lapisan mortar PBT lebih berprestasi berbanding
dengan blok sediada di pasaran dan blok konkrit ringan berudara.
CONTENTS
CHAPTER TITLE PAGE
1 INTRODUCTION 5
2 LITERATURE REVIEW 10
3 RESEARCH METHODOLOGY 59
4 RESULTS AND DISSCUSIONS OF THE DEVELOPMENT OF MBC MORTARS 81
5 RESULTS AND DISCUSSIONS OF THE
REMAINING PROPERTIES AND APPLICATION
OF THE OPTIMUM MBC MORTAR 109
6 CONCLUSIONS AND RECOMMENDATIONS 127
REFERENCES 129
CHAPTER 1
INTRODUCTION
1.1 Introduction Pozzolanic materials are widely used in concrete and mortars for various reasons,
particularly for reducing the amount of cement required for making concrete and mortar
which lead to a reduction in construction cost. Moreover most pozzolanic materials are by-
product materials and the use of these materials leads to reduction in waste and save in
energy consumption to produce cement. Most recently blended and multi-blended cement
by incorporating industrial by-products/pozzolanic materials is becoming an active area of
research because of their improved properties such as workability, long-term strength and
durability. The common blending agents used are fly ash (PFA), rice husk ash (RHA),
palm oil fuel ash (POFA), Slag, silica fume (SF), calcined clay etc. The improved
properties such as rheology and cohesiveness, lower heat of hydration, lower permeability
and higher resistance to chemical attack are reported in the literature (Khan et al., 2000;
and Mehta P.K., 1989).
In general, each of these materials possesses different properties and reacts
differently in the presence of water (Toutanji et al., 2004) and usually has limitations while
some have contrasting influences on properties of concrete and mortar (Khan et al., 2000).
The combination of two or more kinds of mineral admixtures has emerged as a superior
choice over single admixture to improve concrete and mortar properties (Bagel, 1998;
Khan et al., 2000; and Pandey et al., 2000). The development of ternary (containing two
types of pozzolans) and quaternary (containing three types of pozzolans) blended cement is
relatively rare. Though the binary blended cements BBC (containing one type of
pozzolans) are commonly nowadays in use and further studies to investigate and improve
the performance of BBC are in progress but even then those are not used at larger scale.
Whereas, the research to develop the multi-blended cement containing three or more
pozzolanic materials to replace cement partially is rather rare.
PFA normally results in lower early strength but improved workability, whereas SF
causes downturn in workability due to high specific surface but higher reactivity than PFA.
The effect on combination of SF and PFA showed increase in early strength due to the

2
balancing effect in reactivity and water demand. Incorporation of Slag and PFA in OPC
remains a common practice (Bagel, 1998) because Slag is widely applied in high
performance concrete (Huiwen et al., 2004). A few researches have demonstrated the
suitability of the use of combination of Slag and SF as pozzolanic material by replacing
cement partially. The combination of SF, Slag and PFA is reported to produce high
strength and resistance to wet-dry exposures and freeze-thaw as experimentally
demonstrated by Toutanji et al. (2004).
Since RHA is similar to SF in terms of pozzolanic activity because the former also
contains significant amount of Silicon dioxide and a highly reactive pozzolanic material
(Paya et al., 2001; and Qijun et al., 1999), thus the replacement of SF with RHA is one of
the potential options to be considered. Also the research findings show POFA, as another
pozzolanic material to be added in mortar to achieve its better performance (Salihuddin,
1993).
Recently there has been a growing trend towards the use of supplementary
cementitious materials, whether natural, waste or by-products, in the production of blended
cements because of ecological, economical and diversified product quality reasons (Noor et
al., 2006). One of the major options adopted for economic reason is to utilize local
resources especially waste materials that would provide cost effectiveness and also a
potential utilization of hazardous waste which would other wise causes environmental
pollution.
Since Malaysia is the largest producer of Palm Oil in the world and also has a large
milling paddy capacity, hence the agricultural fly ash is locally available in huge quantity
as waste material. This has led to the idea to investigate the suitability of these materials to
be incorporated in MBC as partial cement replacement. Also this may lead to resolve the
open burning issue in the disposal of these waste materials which causes hazardous effects
on the country’s environmental conditions.
1.2 Research problems
In Malaysia the pace of development and construction activity achieved since last
three decades was beyond expectations. It has spurred the demand for fast, cost-effective
and quality residential buildings. Cement is an expensive constituent of construction
materials. Thus to reduce the cost of the construction material thereby reducing the over all
cost of the project is becoming an active area of research and the need of the present time
in almost all countries in general and in developing countries like Malaysia in particular.

3
Various strategies are being adopted to achieve the cost effectiveness. Nevertheless, the
application of agricultural and industrial by-products and wastages to replace expensive
conventional materials fully or partially is being considered as major technique in this
regard.
The utilization of agricultural and industrial by-products offer triple benefits
namely: conservation of fast declined natural resources, planned gainful exploration of
waste materials, and release of valuable land for more profitable used. As the performance
of mortars depends upon the admixtures added as cement replacement whereas the
properties of these cement replacement admixtures are dependent on the sources from
where those are obtained. It is therefore recommended that experimental studies to be
carried out to examine the performance of blended or multi-blended mortars containing
agricultural and industrial wastes/by products.
This is why the present study is aimed at investigating the suitability of local
agricultural and industrial by products as partial replacement of cements in order to
produce MBC which is not only potentially cost effective but also exhibits high
performance against aggressive environmental conditions.
1.3 Aim and objectives
The main aim of this study is to produce MBC mortar of adequate strength and
durability which can sustain the internal and external effects of aggressive environment of
a tropical region like Malaysia. The relative objectives to achieved the aim of study are as
follows:
1. To establish the optimum binder to sand ratio of mortar mix.
2. To establish the optimum mix proportion of Multi Blended Cement in a mortar
regarding strength, porosity and water absorption.
3. To determine the durability performance of the mortar with MBC in terms of chemical
attack such as carbonation, acid attack, and the effect of seawater.
4. Ultimately, to brief study on the application of the MBC mortar as the face sheets to
produce lightweight non-load bearing sandwich block.
1.4 Research hypothesis
The MBC system can be utilized to produce high performance mortar. The low
early strength of PFA and Slag in MBC mixes can be improved by the incorporation of

4
high reactivity of RHA and POFA. On the other hand, incorporation of RHA and Slag
generally will cause a downturn in workability. Whilst, incorporation of PFA in the
system can enhance workability hence reduced the water binder ratio. Subsequently low
water binder ratio (wbr) of MBC system would achieve low porosity and low absorption
mortar compared with control OPC and BBC mortar. Therefore, MBC systems can
potentially reduce or eliminate limitations inherent in individual materials (BBC systems).
This MBC system is low in alkalinity that contain less amount of CH and also more
homogenous and dense mortar, which can potentially withstand chemical attack when
exposed to hostile environment compared to control OPC mortar.
1.5 Scope of research
The study is fully experimental in nature and focuses on the development of multi-
blended cement (MBC) mortar of optimum mix (sand: binder). The study specially
emphasizes to investigate the appropriate proportion of constituents of MBC. The
constituents adopted as partial replacement of cement to produce MBC were GGBFS
(slag), PFA, RHA, and POFA along with the principal constituent, cement. The content of
cement, slag, and POFA was kept constant through out the experimental study. The
performance of optimum MBC mortar was studied in terms of ultimate compressive
strength, water absorption, total porosity and durability.
The durability of MBC mortar produced was tested in terms of its resistance to acid
attack, carbonation, and the saline water from sea. Finally attempt in limited extent was
made to investigate the suitability of MBC mortar developed, as the face sheets to produce
lightweight non-load bearing sandwich masonry unit with lightweight aerated concrete as
core. The thickness of the face sheet provided was kept constant at 10 ± 2mm. The
performance of the sandwich masonry unit was examined in terms of its ultimate
compressive strength, physical failure pattern, and the apparent composite behavior of the
two materials at their interface.
1.6 Significance of Research
The study is significant to produce high performance MBC mortar by using the
agricultural and industrial waste/by-products. The MBC mortar exhibited the compressive
strength of at least at par with the OPC mortar and also better performance in aggressive
environment of Malaysia by withstanding the internal and external effects of both short
term and long term as well. This is expected due to the low permeability and low porosity
5
of MBC mortar mixes. The ultimate product of MBC mortars would be economical. The
study is also important in the effort to resolve the burning issue with regard to the disposal
of the huge quantity of waste material from Palm Oil and Paddy industry in Malaysia.
MBC mortar can be applied as face sheets to produce lightweight sandwich masonry units
in order to reduce over all weight and cost of the building and also a step towards
industrialization of the building system.
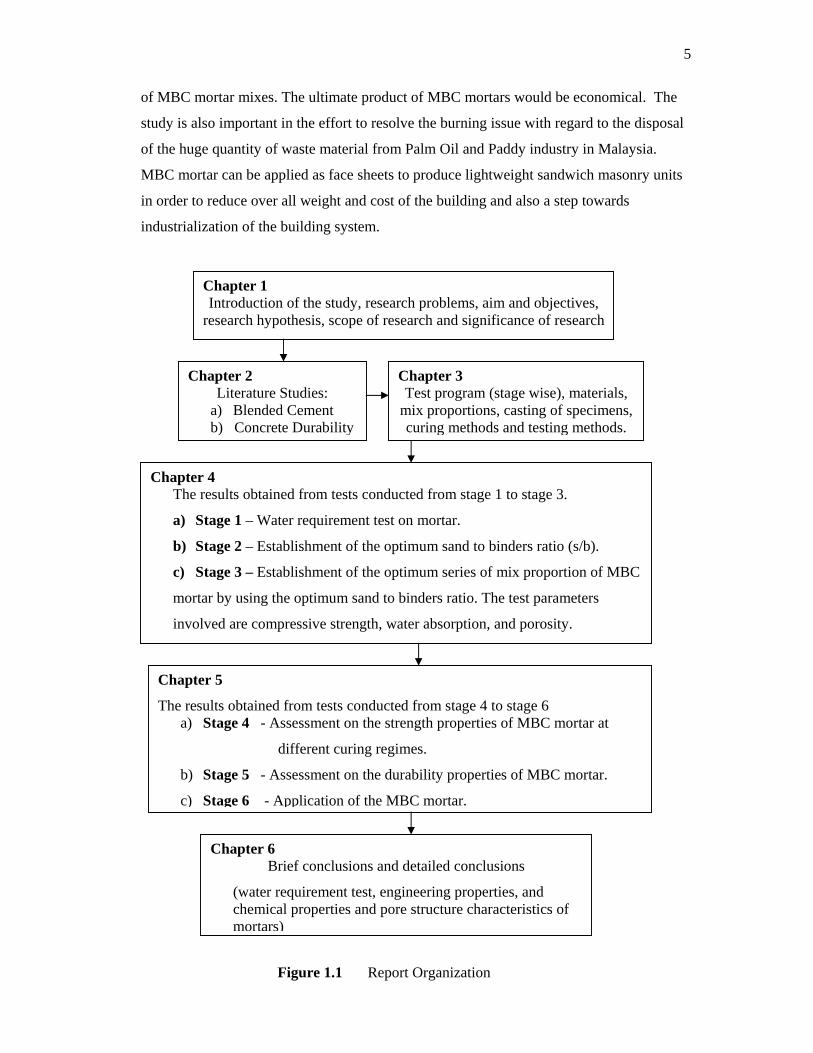
Chapter 1 Introduction of the study, research problems, aim and objectives,
research hypothesis, scope of research and significance of research
Chapter 2 Literature Studies:
a) Blended Cement b) Concrete Durability
Chapter 3 Test program (stage wise), materials,
mix proportions, casting of specimens, curing methods and testing methods.
Chapter 4 The results obtained from tests conducted from stage 1 to stage 3.
a) Stage 1 – Water requirement test on mortar.
b) Stage 2 – Establishment of the optimum sand to binders ratio (s/b).
c) Stage 3 – Establishment of the optimum series of mix proportion of MBC
mortar by using the optimum sand to binders ratio. The test parameters
involved are compressive strength, water absorption, and porosity.
Chapter 5
The results obtained from tests conducted from stage 4 to stage 6 a) Stage 4 - Assessment on the strength properties of MBC mortar at
different curing regimes.
b) Stage 5 - Assessment on the durability properties of MBC mortar.
c) Stage 6 - Application of the MBC mortar.
Chapter 6 Brief conclusions and detailed conclusions
(water requirement test, engineering properties, and chemical properties and pore structure characteristics of mortars)
Figure 1.1 Report Organization

6
CHAPTER 2
LITERATURE REVIEW
2.1 Introduction
The consumption of cement according to CEMBUREAU started to increase during
the second half of the 20th century at a very rapid pace as seen in Figure 2.1. Although
Malaysian apparently is coping with the demand of cement and the cement supply is
considered abundant, nevertheless recently the cost of cement has increased. On the one
hand, cement is the most expensive constituent in the concrete therefore it exerts pressure
on contractors and other parties involved in the construction industry. Like wise, the
process for manufacturing of cement also leads to the emission of large quantity of CO2
and NOx to the environment due to the large quantity of limestone used as a raw material,
which required to be burnt at high temperature. The production of every tonne of Portland
cement releases approximately one tonne of carbon dioxide, which is the major contributor
to the greenhouse effect, which is responsible for global warming (Mehta, 1994). The
cement industry is required to restructure into an environmentally compatible industry by
utilizing industrial waste as cement replacement. Otherwise, the time is over when
concrete could be considered a low-priced commodity product.
The idea to introduce industrial and agricultural by-products in the making of
concrete is not new in itself. It has been standardized in Italy since 1929 and has been
manufactured in Europe for over five decades. Asian countries are also producing blended
cements for quite sometime. Recently, the emphasis has shifted to the development of
ternary and quaternary blended cement but the information pertaining to the use of multi-
blended cement is still relatively scarce.
There is considerable volume of literature on the use of Silica Fume (SF) in binary
and ternary cement in producing concrete. SF due to its high pozzolanicity and its extreme
fineness is very effective in producing low permeability and high strength concrete but,
generally has the drawback of low workability as a result of its high specific surface area
(Bagel, 1998; and Khan et al., 2000). In one hand, for SF concrete the incorporation of
Superplasticizer (Sp) is essential for maintaining high workability but this normally results
in an increase in the cost of production. On the other hand, due to high cost and superfine
particles of SF (median size 0.1µm), field applications are limited to a maximum dosage of

7
15% SF by weight of cement (Mehta, 1994). That is consuming another 85% of OPC
constituents, thus hardly helpful in the reduction of cost and environmental pollution.
Rice Husk, an agricultural waste, constitutes about one fifth of the 500 million
metric tons of rice produced annually in the world (Mehta, 1992). The pozzolanic effect of
RHA has been reported by several researcher (Cook, 1986; Zahairi, 1990; Mehta, 1992;
and Salihuddin, 1993). At present, Malaysia produces more than half of the world’s total
output of palm oil. There are more than 300 palm oil mill plants operating in the country
(Tan, 2000). In Malaysia it has been estimated that the total waste generated by the
industry is more than 8.1 million tons a year as reported in 1993 (Awal and Hussin, 1996a).
Although it is a hazardous material, it has been identified that POFA has pozzolanic
properties and highly reactive and can be used as a unique cement replacement for the
production of construction materials (Tay, 1990; Zahairi, 1990; Salihuddin, 1993; and
Awal and Hussin, 1996a).
Agricultural waste can be used as low cost construction material such as cement
replacement materials, in fibre-reinforced concrete as well as aggregate for concrete
production. The exponential growth rate of population, development of industry and
technology, and the growth of social civilization can be considered as the underlying
factors that have caused the increase in waste production in the recent years, which has
impact upon environment. This agricultural fly ash is locally available in huge quantity as
waste material and the application as cement replacement material have engineering
potential and economic advantage.
POFA and RHA have potential to be used in multi-blended cement (MBC) by
incorporation of PFA and Slag. PFA normally results in lower early strength but improved
significantly in workability and bleeding (Ravindra, 1986; and Khan et al., 2000). Whilst,
Slag has advantages like low heat of hydration, high sulfate and acid resistance (Hanifi and
Orhan, 2006) and widely applied in repairing material (Sobolev and Yeginobali, 2005) and
high performance concrete due to an active additive (Huiwen et al., 2004).
2.2 Blended cement
Blended cement is defined as Portland cement containing other finely divided
particles in different but well-defined proportions (Shondeep and Bonen, 1994). Most
recently blended cement based on industrial and agricultural waste, are well known for
their improved long-term strength and durability. The blending agents are such as fly ash
(PFA), ground granulated blast furnace Slag (Slags), rice husk ash (RHA), palm oil fuel
8
ash (POFA), SF (SF), calcined clay etc. It is reported to improve rheology and
cohesiveness, lower heat of hydration, lower permeability and higher resistance to
chemical attack (Khan et al., 2000). In some cases, a boost in early strength becomes
apparent, while in others, an increase in late strength occurs (Toutanji et al., 2004).
In recent years, the applications of blended cements have been further extended to
the manufacture of building elements and the production of concrete pipes and precast
products (Sagoe and Mak, 1994). In general, each of these blending materials possesses
different properties and reacts differently in the presence of water (Toutanji et al., 2004)
and usually has limitations and some have contrasting influences on properties of concrete
and mortar (Khan et al., 2000). The combination of two or three kinds of mineral
admixtures has emerged as a superior choice over single admixture to improve concrete
and mortar properties (Zhang et al., 1996; Jones et al., 1997; Bagel, 1998, Khan et al.,
2000; Isaia et al., 2003; Pandey et al., 2003; Toutanji et al., 2004; and, Sobolev and
Yeginobali, 2005). The details information pertaining the multiple binder combinations
will be discussed later in this chapter.
2.2.1 Pozzolanic materials
The use of industrial and agricultural by-products as mineral admixture is known to
possess pozzolanic properties. The word pozzolan is derived from Romans civilization,
when volcanic soil in Italy was found to be suitable for producing hydraulic mortar.
American standard, ASTM C 618-94 (1994) defines pozzolans as “siliceous or siliceous
and aluminous materials which on themselves posses little or no cementitious value but
will in finely divided form and in the presence of moisture, chemically react with calcium
hydroxide at ordinary temperatures to form compound possessing cementitious properties”.
Slag content hydraulic properties and can also be defined as pozzolan but in countries like
United Kingdom (U.K) and United States (U.S), it is normally specified under a stand
alone standard such as BS 146:1991 and BS 4246:1991 in UK and ASTM C989-89 in U.S.
To confirm other materials either they possess pozzolanic properties or not, a series
of the tests as per the standards are required to analyses and determine the chemical
composition and physical properties as recommended in ASTM C618-94.
2.2.2 Pozzolanic reaction
A pozzolanic reaction takes place when a siliceous, or siliceous and aluminous material
is in contact with calcium hydroxide in the presence of moisture to form compounds
possessing cementitious properties. Silica of amorphous form react with lime more readily

9
than those of crystalline form. In the cement hydration process, the calcium silicate
hydrate (C-S-H) and calcium hydroxide (Ca (OH)2, which is also written as CH) is released
in the hydration of two major compounds of cement namely tricalcium silicate (C3S) and
dicalcium silicate (C2S). So as a pozzolanic material in mortar or concrete mix, the
pozzolanic reaction will only take place when CH is released. As a result from this
reaction the pozzolanic material will produce a C-S-H altogether with calcium aluminate
hydrate (C-A-H) which are so called cement gels, that form the hardened cement paste.
Qijun et al. (1999), who studied the reaction between RHA and CH, observed that
the amount of CH by 30% RHA in cement paste begins to decrease after 3 days, and by 91
days it reaches nearly zero, whereas in the control paste, it significantly increased with
hydration time as viewed in Figure 2.2. This phenomenon reveals that the reaction
between RHA and CH, could also occur in blended cement containing other pozzolanic
materials. The lowering effect of CH indicates that there exists the CSH gel formed in the
pozzolanic reaction. El Aziz et al. (2004) investigated the hydration and durability of
sulphate-resistance and slag cement blends in Caron’s Lake water as the aggressive
medium. It also found the same trend in the XRD patterns of the blended cements
containing Volcanic Ash hydrated at 12 months which shows that the amount of CH
decreased with curing time increases due to hydration process, as presented in Figure 2.3.
Pozzolan can accelerate the early hydration rate within one hour, by stimulating the
dissolution of C3S by the absorption of Ca2+ ions on the surface of the pozzolanic particles
and also by providing increased sites for the precipitation of C-S hydrates. Hence, the
surface of pozzolan acts as a precipitation sites that is preferable to the precipitation of
hydrates and secondly can lower the concentration of Ca2+ ions that can accelerate the rate
of dissolution of C3S. The primary pozzolanic reaction during the early curing is with
alkali hydroxides.
Secondly, the main and long-term reaction is with calcium hydroxide. The
behaviour of the delay in pozzolanic reaction will result in more permeable concrete at
early age and gradually becomes denser than plain concrete with time. This behaviour is
due to two reasons, firstly as mention before, PFA or pozzolan particles become the
precipitation sites for the early hydration C-S-H and CH that hinders pozzolanic reaction.
Secondly, the strong dependency of the breaking down of glass phase on the alkalinity of
the pore water which could only attain the high pH after some days of hydration. Pozzolan
can partially replace cement in mortar or concrete mix without affecting strength
10
development. The effect of the pozzolanic reaction will produce more cement gel which is
the C-S-H and C-A-H, reducing the pore size, blocks the capillary and produces denser
concrete thus making it stronger and more durable.
The small particles of pozzolans are less reactive than Portland cements (Mehta and
Aitcin, 1990). Nevertheless they generate a large number of nucleation cites for the
precipitation of the hydration products when it dispersed in cement pastes. Thus, this
mechanism makes the paste more homogenous and dense as for the distribution of the finer
pores due to the pozzolanic reactions between the amorphous silica of the mineral addition
and the CH (Isaia et al., 2003). According to Mehta (1987), the finer particles of PFA and
RHA compared to Portland cement will cause a segmentation of larger pores and increased
the number of nucleation sites and will accelerate the reactions and form smaller CH
crystal. Berry (1994) discovered that high volume of PFA particles in the cement paste
that are not completely reacted may fill the voids and increase paste density.
2.2.3 Types of pozzolans
Pozzolans can be classified into two types, may be natural or artificial types. The
natural pozzolans are formed from volcanic activity. While artificial pozzolans are
produced by the combustion of traditional materials such as calcined clay and shale, silica
stone, fly ash and agricultural ashes. During this research study two types of fly ashes
namely pulverized fuel ash (PFA) and agricultural ashes, which consist of rice husk ash
(RHA) and palm oil-fuel ash (POFA) and also by-product of steel industry namely ground
granulated blast furnace slag (Slag), are applied as pozzolans.
a) Rice Husk Ash (RHA)
Rice Husk is an external covering of rice, which is generated during dehusking of
paddy rice. The rice husk accounts for 20% weight of the paddy (Asavapisit and Ruengrit,
2005). The residue itself cannot be used as a cement replacement and it is the ash obtained
from preprocessing the residue (Cook, 1986). The RHA is rich in silica content, obtained
by burning rice husk to remove volatile organic carbon such as cellulose and lignin. It is
estimated that, one tonne of rice yields 200kg of husk and about 40kg of ash (Cook, 1986).
As an agricultural product RHA contains considerable amount of silicon dioxide, which
contains about 90% silica by mass similar to SF (Qijun et al., 1999). The silica present in
the ash can be amorphous or crystalline and its reactivity depends primarily on burning
conditions. The burning method and the fineness of the particles are two major factors that
primarily affect the reactivity of RHA (Cook, 1986). The fineness of ash with most of its
11
silica in an amorphous will significantly affect the reactivity of RHA in mortar or concrete
mix.
According to Mehta (1979), the totally amorphous silica can be produced by
maintaining the combustion temperature below 500ºC, under oxidizing conditions up to
680ºC provided the hold time is less than one minute will results in an amorphous and with
a porous structure. Thus, the specific surface can be high as 50 000 m2/kg. Weight loss
occurs up to 100ºC due to evaporation of absorpted water. From 400 to 500ºC, the residue
carbon oxidizes, and majority of the weight loss occurs in this period. The silica in the ash
still remains in the form of amorphous form.
Above 600ºC, probably it may detect formation of quartz. As the temperature
increased, the conversion to other forms of crystalline silica will occur, which is first as the
crystobalite and at higher temperatures, trydimite. Prolonged heating at temperature
beyond 800ºC produces essentially, crystalline silica (Cook, 1986). The lower temperature
ashes gave higher reactivity with peak value around 500ºC because the amorphous form
could only be obtained at low temperature burning. According to Mehta (1979), the
amorphous silica powders with high surface area are more reactive than the crystalline
form of silica. In fact, the lower temperatures and retention times resulted in higher
specific surface and the pore structure is less damaged. As the temperature of processing
becomes higher, the ashes become progressively white. The ash gradually loses its
pozzolanicity as the temperature of incinerator is increased at a given fineness.
Kapur (1981) has studied the influence of temperature on husk incinerated for 12
hours, which is the X-Ray diffraction analysis as presented in Figure 2.4. Up to 1000ºC
burnt temperature showed that the ash was mostly crystobalite and trydimite in silica,
which is indicated that the ash is crystalline silica. Even at 15 hours heating at temperature
300ºC also was detected formation of quartz. The XRD pattern shown in Figure 2.5
indicates that the ash is completely crystalline in silica (Cook, 1986). Whilst, the study
conducted by Coutinho (2003) showed RHA as mainly amorphous in silica as shown in
Figure 2.6. Thus the burning temperature and duration affects greatly the ash product.
The fineness of ash will significantly affect the reactivity of RHA in lime, mortar or
concrete mix. Grinding of ash is a necessary because the raw ash immediately recovered
from furnace are coarse in nature. These ashes should be complying with the standard for
PFA such as ASTM C 618-84 (1994). The ash has to achieve a maximum of 34% retained
on 45µm sieve, when wet sieve analysis is done as per specifications of ASTM C 618-84
12
1994. Table 2.1 shows the physical and chemical analysis of RHA. It is clearly seen that
the major component of RHA is silica. The silica content is higher than 80%, which is
similar with SF. Meanwhile the content of CaO is less than 10% and it is classified into
class F pozzolan. Unlike SF, the particles of RHA possess a cellular structure that
responsible for the high surface area even the particles are not very small in size. An
example of RHA particle shape is shown in Figure 2.7.
b) Palm Oil Fuel Ash (POFA)
Malaysia and Indonesia are the biggest producers of palm oil and palm products in
the world. It has been estimated that more than 8.1 millions of total waste generated from
this industry is in Malaysia as reported in 1993. The palm oil is not grown in many parts
of the world. POFA is a by-product of palm oil industry. The ash is produced as a result
of the burning of palm oil shell and husk (in equal volume) as fuel in palm oil mill boiler to
produce steam for electricity generation and palm oil extraction process. POFA is
hazardous materials and is simply disposed without any commercial returns. The literature
study about POFA is relatively limited contrasting with RHA. Various researchers
reported that POFA has pozzolanic properties and highly reactive and can be used as a
unique cement replacement for building construction materials (Tay, 1990; Zahairi, 1990;
Salihuddin, 1993; and, Awal and Hussin, 1997).
POFA is greyish in colour that becomes darker with increasing proportion of
unburned carbon. The quality is highly dependent on the efficiency of the mill boiler
system. The whitish grey ash is produced with well maintained boiler up to complete
combustion of the fuel. The fine ashes are obtained at the foot of the flue tower as trapped
after escaping from the burning chamber of the boiler (Zahairi, 1990; and Salihuddin,
1993). The ash produced is rather coarse with approximately 30% passing 45µm sieve.
Further grinding is necessary to act in accordance with the fineness of the ASTM C 618-84
standard. The chemical and physical properties of POFA are shown in Table 2.1. It shows
that the sum of three significant oxides namely SiO2, Al2O3 and Fe22O3 are slightly above
70% while CaO content is low.
c) Pulverized-Fuel Ash (PFA) or Fly Ash
PFA is a by-product of burning pulverized (finely ground) coal to generate electric
power. Temperature are usually around 1500°C on entry furnace, the carbonaceous
content of the coal suspension is burnt immediately. The shales and clays (contents of
silica, alumina and iron oxide) and the other matters in coal, melt whilst in suspension, and
13
then with rapid cooling they are carried out by the flue gases and form into fine spherical
particles. Only 80% of the coal ash is carried out of the furnace with the flue gases is
called the PFA and must be removed before the flue gases are discharged to the
atmosphere. Whilst, the remainder of the coal ash is called furnace bottom ash (coarser
material), which falls to the bottom of the furnace.
The method to remove PFA from the flue gases can affect the quality of PFA being
produced at power stations. PFA obtained from cyclone separators is comparatively coarse
and contains a large proportion of unburned fuel. While PFA that obtained from
electrostatic precipitators is relatively fine having a specific surface of about 3500 cm2/g or
as high as 5000 cm2/g. The shape is generally of spherical particles and some of which
may be like glass and hollow and irregularly shaped of unburned fuel or carbon. The
colours may vary from light grey to dark grey or even brown.
PFA can be divided into two distinct categories that are generally associated with
type of coal used at the power station. The categories namely are low-lime and high lime
PFA (Ravindra, 1986). Low lime PFA contains CaO content less than 10% and usually
produced from anthracite and bituminous coals, classified into class F fly ash. Whereas
high lime PFA with CaO content greater than 10% and are usually produced from sub-
bituminous and lignite coals, roughly corresponds to ASTM class C fly ash. The sum of
three significant oxides namely SiO2, Al2O3 and Fe2O3 for class F have a minimum value
of 70% and 50% for class C fly ash. Class F should be defined as truly pozzolanic and
Class C as having some cementitious properties itself. In UK references for specification
is given by BS 3892: Part1 (1982) whilst the similar document produced by the American
as ASTM C 618-94 (1994).
The chemical and physical properties of PFA are as in Table 2.1. In the low lime
PFA, the glass is siliceous or alumino-silicate composition, whilst in high lime PFA is
calcium aluminate composition. The low-lime PFA generally conforms to ASTM class F
due to high portions of silica and alumina, consists principally aluminosilicate glasses.
This will convert in the crystalline aluminosilicates if the molten glass do not get cooled
rapidly, sillimanite and mullite may crystallize as slender needled in the interior of the
glass sphere, becoming non-reactive at ordinary temperature it tends to reduce the
reactivity of the PFA.
The high lime PFA is more reactive because it contains most of calcium in the form
of reactive crystalline compounds such as C3A, CS and C4A3S. The evidence is also there

14
that the principal constituents contain enough calcium ions to enhance the reactivity of the
aluminosilicate glass.
The reactivity of PFA depends on the nature and proportion of the glass phase. The
major range of phase is illustrated in Figure 2.8. In general, the greater fineness and lower
LOI of PFA have been found to be a great potential to enhance the performance of PFA
concrete. PFA normally results in lower early strength but improved workability. The
reduction in water requirement incorporation PFA in cement is due to the spherical shaped
particles and their smooth surface which also roll in fresh paste thereby reduce the fraction
resistance of cement particles and improve the fluidity of the mixture (Sun et al., 2003).
Figure 2.9 illustrates the difference between the shape of PFA and OPC particles.
d) Ground granulated blast furnace slags (Slag)
Slag is a by-product from the manufacture of iron in a blast furnace. A blast
furnace slag is a molten material that rises to the top of the pig iron at the bottom of the
blast furnace. The temperature close to that iron is between 1400°and 1600°C. A slow
cooling of slag melts leads to a stable solid, which consists of Ca-Al-Mg silicates. A
granulated glassy material can be formed if they are quenched from the melt. These slags
possess latent hydraulic properties. Rapid cooling by spraying large quantities of water jet
during the cooling between 900° and 800°C can prevent the crystallization of slag. The
water content of slag can be eliminated in dryer mills after the treatment.
The chemical and physical properties of blast furnace slag are shown in Table 2.1.
Blast furnace slag is only hydraulic when cooled under conditions that it solidifies as a
glass as mentioned earlier. When allowed to crystallize, it has no cementitious properties.
Chemical composition influences both the glass-forming properties and the hydraulicity of
the slag. Slag neither contain C3S, which is the phase contributing most to the early
strength of Portland cements, hence slag cements develop their strength at a slower rate.
Nor does slag contain C3A, which is the phase of Portland cement having the greatest heat
of hydration.
The early rate of reaction between slag and water is slower than that of Portland
cement and water. This indicates that the strength development will also be slower.
However, both react at early ages (Regourd, 1986). When slag Portland cement is mixed
with water, the Portland cement component begins to hydrate first and there is also small
amount of immediate reaction of slag that it releases calcium and aluminium ions in
solution. The slag then reacts with alkali hydroxide and followed by reaction with

15
Ca(OH)2 to form more CSH gel (Neville, 1995). Slag develops its cementitious properties
far too slowly to be practical use unless its hydration is activated by the addition of calcium
compound. In slag Portland cements, two slag hydration activators are present; the
gypsum (sulphate activator) and the portlandite Ca(OH)2 liberated by the hydration of
clinker silicates C3S and C2S (lime activation).
e) Silica Fume (SF)
SF is a by-product of the manufacture of silicon and ferrosilicon alloys from high
purity quartz and coal in a submerged-arc electric furnace. Microsilica or condensed silica
fume are also be referred as SF, but the term most accepted is SF. SF is the gaseous SiO
oxidizes and condensates in the form of extremely fine spherical particles of amorphous
silica (SiO2). The amorphous silica is highly reactive, and the smallest of the particles
speeds up the reaction with CH, which the compound of cement hydrates. The very small
particles of SF be able to go through the void between the particles of cement hence
improve packing.
The efficient heat recovery system in furnace produce SF virtually free from carbon
and is light in colour. On the other hand, the SF may become dark in colour if the furnace
without full heat recovery system. The usual ferrosilicon alloys have nominal silicon
contents of 50, 75, and 90 percent, which influences the silica content in the resulting SF.
The specific gravity of SF is 2.20, but may become higher when the silica content is
lower. The particles are extremely fine and having diameter ranging between 0.03 and
0.3µm. The specific surface of SF determine by nitrogen adsorption is 20,000m2/kg that is
13 to 20 times higher than other pozzolans. It also has a very low bulk density (200 to 300
kg/m3 ) (Neville, 1995). Handling the light powder is difficult and can be added that SF is
expensive. The maximum of 3 to 5 percent of SF is used in cement replacement because
of its very high reactivity. The high surface area of SF would increase the water demand.
Superplasticizer is required when the low wbr is concern in making concrete. The use of
SF can reduced bleeding and improved cohesion of the mix. The voids caused by trapped
bleed water are also absent. The cohesive of concrete containing SF is good for pumping
and for underwater concrete and also for use as flowing concrete.
2.2.4 Binary Blended Cement (BBC)

16
BBC system is Portland cement blended with single mineral admixture in
producing cementitious material in well-defined proportions. This system was firstly
approached as the basic strategies to restructure the cement industry into environmentally
compatible. This section will discuss the influences of BBC system in fresh and hardened
concrete and mortar.
a) RHA / OPC
The grain particles of RHA are irregular in shape, which is in contrast with PFA
thus required a higher wbr to produce the paste of same flow (workability). Accordance to
Zahairi (1990), RHA cement mortar requires a higher water binder ratio (wbr) than OPC
mortar mix to achieve its maximum strength. RHA is cellular and porous in nature, and
high specific surface and its addition to a concrete mix will increase its water demand to
produce a workable concrete (Cook, 1986). The very fine particles of RHA fill the spaces
between the cement grains, thus stabilizing and improving the cohesiveness of the concrete
mix but adversely affecting its workability (Mahmud et al., 1996). Therefore, an increase
in water demand is expected with increasing RHA content because of the water absorbing
characteristics of RHA.
The RHA is highly pozzolanic and suitable to use as cement replacement when it is
burnt under controlled conditions. Mehta and Folliard (1995) reported that except RHA,
no other pozzolanic additions including SF has ability to contribute to the strength of
Portland cement concrete at the early ages of 1 and 3 days. Mahmud et al. (1996) found
that the optimum level for maximum strength gain of RHA concrete was 15%. The
optimum level for high strength RHA concrete was 5%. The RHA contributes to strength
development much earlier age than SF and OPC, which was similar to the findings of
Mehta (1992). High strength concrete (HSC) of 80MPa can easily be obtained by the use
of RHA and Sp in combination at 14 days and upward. It concluded that the RHA is a
viable alternative material to SF in the production of HSC. Zhang et al. (1996) found that
the strength of (10% level) RHA concrete exhibited higher than control OPC at all ages but
had similar strength at one-day strengths. However, the strength was lower than the
strength of (10% level) SF concrete up to 28 days, but similar at 90 and 180 days.
Salihuddin (1993) concluded that the replacement level RHA up to 40% is possible
without affecting the strength. However, an optimum replacement of RHA is seen to be
lying at about 20% level. It also reported that the RHA replacement up to 30% in mortar
produced maximum strength superior than control OPC and 30% PFA mortar.

17
Nonetheless, the strength at 40% level is comparable to the control strength results.
Salihuddin (1993) found that the pozzolanic activity of RHA is to be higher than PFA as
confirmed by the TG analysis. The similar results showed by Zahairi (1990) that at 20%
cement replacement with RHA at 0.55 wbr gives a better compressive strength compared
to OPC. Accordance to Zahairi (1990), RHA cement mortar requires a higher wbr than
OPC mortar mix to achieve its maximum strength as mentioned before. However at very
high wbr of 0.65 and 0.75 the negative effect is more obvious.
Nevertheless, there is also contrary behavior of both Lime and OPC mixes
containing RHA mortar studied by Cook and Suwanvitaya (1981). The strength initially
increased rapidly but essentially ceases after 28 days. The strength does not increase
significantly beyond 28 days as shown in Figure 2.10. It reported that was probably related
to the high reactivity of the RHA and the early completion of the lime-silica reaction.
The pore structure of RHA (30% replacement) mortar is denser than control OPC and
PFA (30% replacement level) mortar as confirmed by the mercury porosity analysis
(Salihuddin, 1993). Zhang et al. (1996) reported that, the higher compressive strength gain
and reduction of permeability in concrete incorporating RHA is probably due to the
reduced porosity, reduced calcium hydroxide content and reduced width of the interfacial
zone between the paste and the aggregate. The formation of more CSH gel and less
portlandite in concrete with RHA may improve the concrete properties due to the reaction
between RHA and calcium hydroxide in hydrating cement (Qijun et al., 1999).
However, Ho (1998) studied 30% replacement of RHA, and PFA in concrete and
reported that the porous and high surface area of RHA performed worst than OPC and PFA
concrete in terms of absorption however less permeable and showed better results in
chloride penetration than OPC concrete. The results on corrosion studied by Singh et al.
(2002) reveals that the 10% RHA-blended cement is more resistant to the corrosive
atmosphere of N/60 H2SO4. Nehdi et al. (2003) reported that RHA reduced the rapid
chloride penetrability of concrete from a moderated rating to low or very low ratings as
increased the RHA contents (7.5%, 10% and 12.5% replacement level).
It is evident from the literature that mostly RHA blended cement compared to OPC
cement exhibited high early strength than OPC. Mehta (1992), Zhang et al. (1996), and
Mahmud et al. (1996), and others all agreed that the performance of RHA blended cement
has similarity with SF blended cement due to its considerable silicon dioxide content like
SF. RHA is a viable alternative material to SF. But the optimum replacement level of
RHA is reported different by the various researchers like, Mahmud et al. (1996) concluded
18
with 15% as optimum whereas, Salihuddin (1993) and Zahairi (1990) reported that an
optimum replacement of RHA is seen to be lying at about 20% level, whilst, the others
recommended ranging between 10% to 30% as optimum replacement of RHA. All these
replacement levels of RHA are in percentage by weight of the total binder material.
b) POFA / OPC
The workability of POFA concrete according to Awal and Hussin (1996a) was
found to be slightly lower than control OPC, but the bleeding in POFA concrete was much
less than in OPC concrete. Zahairi (1990) reported that at fixed wbr 0.55 the workability
would increase with addition of POFA up to 35%. However, the workability reduced with
addition of more than that percentage. Whilst, at higher wbr (0.65 and 0.75) addition of
POFA up to 35% did not show significant effect on workability but at higher percentage
than that, the workability started to decrease.
Zahairi (1990) found that the POFA mortar up to 35% replacement is possible to
produce mix having equivalent strength compared to the OPC mortar mix. It also reported
that the higher the POFA content the lower the strength than OPC mortar at lower wbr
(0.40). At 0.50 wbr, only mix with 35% POFA achieved equivalent strength as OPC
mortar. However at high wbr 0.6 the strength of all POFA content was lower than OPC
mortar. Salihuddin (1993) reported that the replacement level up to about 20% is possible
for POFA mortar without adverse effects on strength. However the optimum replacement
of POFA is clearly seen to be lying at about 10% to 15% level. POFA mortar strength is
comparable to PFA mortar but both are lower than OPC mortar by approximately 9%.
Awal and Hussin (1996b) investigated that the strength concrete made with 40%
POFA is possible to replace without any adverse effect on compressive strength. However,
the maximum strength gain occurred at the replacement level of 30% as shown in Figure
2.11. The strength of POFA concrete at early ages was lower than OPC concrete. But
during the third week of hydration, the strength of both concrete seems to be equal.
However, the strength at 28 days was relatively 10% higher than OPC concrete. As they
argued that, this is not unlikely, and is in well agreements with the strength behaviour of
other pozzolanic materials like RHA, SF and other class C pozzolans. It was also found
that finer ash produced higher strength than the coarser ash as shown in Figure 2.12. This
lower development of strength in concrete with coarse ash was possibly due to its lower
surface area of the particles that affected the pozzolanic activity and hence its strength.
19
The pore structure of POFA mortar is more dense than the OPC mortar as
confirmed by the mercury porosity analysis. However, POFA samples exhibited a
comparable performance in permeability compared to the OPC mortar samples
(Salihuddin, 1993). Awal and Hussin (1997) investigated some aspect of durability
performances of POFA concrete. They found that POFA concrete exhibited better
resistance against acid attack than OPC concrete due to its low CaO content and less
amount of Ca(OH)2. The test on resistance to sulphate attack suggests that expansion of
mortar bars of POFA concrete are significantly lower than OPC concrete. It was also
found that a reduction in expansion due to alkali-silica reaction occurred with the increase
in amount of ash content.
From the above findings, it seems that the strength of POFA samples was lower
than OPC samples mainly at early ages. The optimum replacement level achieved by
Zahairi (1990), and Awal and Hussin (1996b) was 30% whereas, 10% replacement level
achieved by Salihuddin (1993). Nevertheless, all researchers have identified POFA as
pozzolanic material, which is highly reactive and can be used as a unique cement
replacement for building construction materials.
c) PFA / OPC
It is well documented that the use of PFA increase workability for given water
content because of lubrication effect of its spherical particles. The use of PFA can
physically disperse the cement flocs, thus freeing more paste to lubricate aggregates and
improving workability (Ravindra, 1986). PFA also improves cohesion and plasticity. PFA
can restrict the movement of free water in the plastic concrete thus reduces bleeding better
than OPC.
However, it is also known that the use of PFA causes delay in the early age strength
development. But on later ages PFA concrete goes on progressively to develop higher
strength value. This is caused by the delayed pozzolanic reaction. Ho (1998) studied the
incorporation of 30% PFA in concrete reported that the 7 days strength of PFA concrete is
lower than OPC concrete but at 28 days it achieved higher strength. The results indicated
that the early age strength of PFA concrete is contributed by the cement hydration, and at
later ages the PFA concrete gained higher strength values than OPC concrete (Ho, 1998).
Naik and Ramme (1989) found the optimum cement replacement levels for PFA
less than 40% in terms of strength development when they investigated it with replacement
ranging from 0 to 60%. PFA replacements of 35% to 40% have attained 28 days strength
20
of 45-55 MPa and one-year strength about 60-80 MPa (Ravindra, 1986). Besides that, if
early strength is not a major aspect, PFA as high as 60% can be used (Naik and Ramme,
1989).
As the strength contributed by the Portland cement slows down, the pozzolanic
activity of fly ash contributes the development of the strength at later ages provided that
the concrete is properly cured. PFA mixes required longer periods of time to develop
strength, which is in contrast with SF. According to Fraay et al. (1989), the glass materials
in PFA is broken down only when the pH value of the pore water is at least 13.2, and the
increase in alkalinity of the pore water requires that a certain amount of hydration of OPC
in the mix has been taken place (Neville, 1995). PFA mixes made without additives
exhibited outstanding performance at 91 days. However, PFA mixes with too much
dosage of Superplasticizer may cause segregation, resulting in lower strength (Toutanji et
al., 2004).
Generally, total porosity of blended cement is higher than plain cement paste
however, their permeability is less than plain cement paste. It is because, in blended
cement, the continuity of large pore is less than plain cement and after 28 days of hydration
these large pores were essentially isolated. The radial growth of Portland cement products
in PFA particles would have a pore refinement effect hence reduce the interconnected
between pores (Cook and Cao, 1987). Ho (1998) found that the PFA concrete performed
best among RHA and OPC concrete in terms of water absorption, lower absorption rate at
covercrete and chloride penetration test. The phenomenon can be linked to improvement
on the interfacial transition zones between the cement matrix and aggregate (Toutanji et
al., 2004). Based on the findings and recommendations of earlier researchers, it is found
that replacement level up to 30% by weight was proven to be satisfactory.
d) Slag / OPC
Slag normally is of greater fineness confers resistance to bleeding in the fresh state
and lower permeability when hardened. The glassy surface of the slag may give slightly
reduced water requirement, however it depends upon the fineness of grind (Day, 1995).
Slag makes the mix more mobile because improves workability but cohesive. This is
because of the surface characteristics and better dispersion of slag particles, which are
smooth and absorb little water during mixing (ACI 226,1994). There is also reported that
slag exhibited an early loss of slump and low rate of slump loss (ACI 226,1994).

21
High-slag-cements have low strength at early ages. The early strength of slag
concrete is likely to be lower than OPC concrete, however at later ages to be higher as
shown in Figure 2.13. The initial hydration of slag is very slow because it depends upon
the breakdown of the glass by the hydroxyl ions. Generally, the higher the slag contents
the slower the development, but the higher the long-term gain (Wrainwright, 1986). The
progressive release of alkalies by slag and together with the formation of calcium
hydroxide by Portland cement resulting a continuous reaction of slag over a long period.
However, the later rate of hydration is accelerated.
A 50% slag replacement in the cementitious material is the highest medium-term
strength but gives lower early strength than OPC (Dubovoy et al., 1986). Roy and Idorn
(1982) also suggested that the optimum slag content is about 50% from a strength point of
view as shown in Figure 2.14. Sivasundaram and Malhotra (1992) reported that a
remarkable strength development of 50% to 75% of slag with a total content of
cementitious material between 300 and 420kg/m3. However Bagel (1998) found that the
replacement of 50% cement by slag caused significant reduction in the 90 days strength of
mortar regarding to OPC mortar.
Bagel (1998) also discovered that the use of slag as the partial cement replacement
in mortars results in a material with a slightly higher water permeability than OPC mortar
by the same workability. Nevertheless Bagel (1998) concluded that the low and medium
strength slag mortars cast without water reducing admixture is possible to produce with
relatively high density and acceptable permeability, even when the slag activity is very
low.
Pigeon and Regourd (1983) reported that with increasing slag percentage the pores
become much smaller, which is at 66% slag they found most pores to be less than 20x10-
3µm. Smolczyk (1980) also reports comparable results, which is the hydrated slag paste
contains more gel pores and fewer capillary than OPC paste. Bakker (1980) reported that
in addition to the hydrate formation around the slag and clinker particles there are
additional (identical) hydrate precipitations in the “gap” between adjacent particles as
shown in Figure 2.15. Slag normally has a greater resistance to chemical attack thus
suitable for marine works.

22
e) Silica fume/OPC
SF due to its high pozzolanicity and its extreme fineness is very effective in
producing low permeability and high strength concrete but, generally has the drawback of
low workability as a result of its high specific surface area (Bagel, 1998; and Khan et al.,
2000). The action as a filler through improvement in packing and interface effects
probably contributes the early strength development (up to 7 days) of SF (Neville, 1995).
The strength of concrete containing SF at 28 days increase with an increase of SF content
in the mix (up to certain limit). Strength development of concrete containing SF end much
earlier than OPC alone as shown in Table 2.2, which there was no increase in strength
beyond 56 days. However, the concrete containing SF increase in strength higher than
OPC alone in early strength. The optimum field applications are limited to a maximum
dosage of 15% SF by weight of cement (Mehta, 1994).
The continuity of pozzolanic activity of SF results in reduction in the pore size in
the hydrated cement paste. Table 2.3 shows that the concrete containing SF small
reduction in total porosity of hydrated cement paste as compared with sulfate-resisting
(Type V) cement. However, the main effect of SF is to reduce the permeability. 10
percent of SF content in the mix has large effect on the pore system. Whereas, there is no
beneficial effect of further increase of SF content in the mix (Neville, 1995). Concrete
containing SF is good in sulphate, magnesium, sodium and calcium chloride resistance
partly because of a lower permeability and lower CH content. The presence of SF in
concrete also has beneficial effect upon resistance to abrasion due to a better bond between
the hydrated cement paste and the aggregates.
Usually in the BBC system, some has limitations and contrasting influences on
properties of concrete such as workability, and early strength however at later ages possess
remarkable strength and durability characteristics because of the additional hydrate
precipitations in the “gap” between adjacent particles between the clinkers and pozzolans.
Enhancement of workability, strength and durability are among the major benefits
associated with the use of multi-blended mineral admixtures in OPC concrete. Many
researchers found that the use of agricultural by-product is a viable alternative material to
SF in cement replacement due to their engineering potential and economic advantage. It is
now a common practice to use agricultural and industrial wastes into OPC.

23
2.2.5 Multi blended cement
a) Introduction
Over the years extensive research have been carried out and the relative literature
reveals the BBC system. It has become increasingly conventional application in hostile
environment structures due to improve in strength and durability of concrete (Khan et al.,
2000). As mentioned earlier, the combination of two or three kinds of mineral admixtures
has emerged as a superior choice over single admixture to improve concrete properties.
Currently, the information pertaining to the multi and ternary blended systems and their
practical used is rather limited. However, according to Jones et al. (1997), the multiple
binder combinations is now an option which can be seriously considered for conventional
structural concrete.
The use of ternary binder concrete has been implemented in major infrastructure
project such as the Stoerbelt bridge/tunnel in Denmark and the Chek Lap Kok bridge,
linking to the new Hong Kong airport (Jones et al., 1997). The common additional binder
materials such as PFA, SF, slag, and RHA are now well established. Usually these
individual pozzolanic materials possess different properties and reacts differently in the
presence of water (Toutanji et al., 2004). Each of these materials has limitations and some
have contrasting influences on properties of concrete (Khan et al., 2000) as discussed
before.
b) The incorporation of PFA / SF into OPC
It is known that the incorporation of PFA causes delay in the early age strength
development but improve the workability. SF possess a highly reactive pozzolan,
increases the early-age strength but downturn in workability. Khan et al. (2000)
investigated the use of binary and ternary blended cementitious systems for the
development of high performance mortar based on OPC, PFA and SF. Incorporation of 8-
12% SF as cement replacement showed the optimum performance, resulting in the highest
compressive strength and the lowest permeability and the lowest porosity values for all
levels of PFA. However, PFA on its own did not show significant improvement in
permeability and porosity of mortar. The results also showed that the slow early-age
strength development of PFA can be compensated with the inclusion of SF but restricted to
low level of PFA. The inclusion of 35% of PFA and above, with or without SF were not
able to achieve the strength equal to that of OPC as control.

24
c) The incorporation of Slag / SF into OPC.
Incorporation of PFA and slag into OPC is a common practice (Bagel, 1998)
because slag is an active additive and widely used in high performance concrete (Huiwen
et al., 2004). Nonetheless, the incorporation of slag and SF into OPC has shown
suitability, which have demonstrated as contributions from several researchers. Sobolev
and Yeginobali (2005) studied to improve a slag cement binders for used as repairing
material in the chemical industry when high thermal or acid resistance is required. It was
found that the enhancement of slag cement binders could be achieved with addition of SF
and superplasticizer.
Bagel (1998) found that the obtained results in binary system of slag showed
slightly higher water permeability and reduced strength than OPC mortar mainly in 50%
replacement. However, the incorporation of high portion of SF in binary system leads to
increase in considerable water requirement thus affected the strength in the system. But
significantly a finer pores structure exists in blends with SF. Whereas, the behaviour and
properties of ternary binding systems with high portion of slag and SF of mortar provided
further impermeability and durability improvement whilst reached relatively satisfactory
level of compressive strength. The addition of SF into OPC/slag mixes in mortar leads to
formation of finer and discontinuous pores or to increase in the fraction of the fines pores
(Bagel, 1998).
Jones et al. (1997) studied the properties of ternary binder systems in concrete with
inclusion of PFA and SF, PFA and slag, as well as slag and SF into OPC. The obtained
results showed that the chloride resistance of all the ternary binder systems is significantly
higher than corresponding OPC and OPC/PFA mixes. Carbonation depths however were
generally greater in the ternary systems. The degree to which this occurred was found to
relate to the amount of OPC replaced. Whilst, McGrath and Hootan (1997) studied the
chloride ingress resistance of concrete containing SF, slag, PFA class C, and PFA class F
cements and also blends of OPC/slag/SF and OPC/slag/PFA. Of all these concrete, the
ternary blends yielded the best results.
d) The incorporation of PFA / RHA in OPC
According to Isaia et al. (2003), when less reactive pozzolan is employed in ternary
mixtures together with another more reactive such as SF or RHA, there is a synergy
between these pozzolans, thus the obtained results are higher than those verified in the
25
respective binary mixture. It was found that the binary mixtures of RHA showed better
performance than PFA materials, however the ternary mixtures have exhibited overall
better results. RHA was also similar to SF, which contains considerable amount of silicone
dioxide and highly reactive pozzolanic materials (Paya et al., 2001).
e) The incorporation of SF / Slag / PFA into OPC
Collins and Grace (1997) reported on using quaternary blend of OPC/PFA/slag/SF
to build a concrete structure exposed to seawater. Chloride diffusion coefficients ranging
from 4x10-13 to 6x10-13 m2/s were reached. Soeda et al. (1997) studied the properties of
high flowing concrete also containing OPC/PFA/slag/SF. When water-cured provided, this
concrete exhibited good resistance to freeze-thaw cycles. Toutanji et al. (2004) focussed
on studying the strength and durability of concrete cured for short period of time using the
binary system containing different percentage of OPC/SF, OPC/PFA, and OPC/slag as well
as three mixes made of combination of SF, slag and PFA. The combination of 10% SF,
25% slag, and 15% PFA produced high strength and high resistance to freeze-thaw and
wet-dry exposures as compared to other mixes.
Amjad and Salihuddin (1999) investigated the strength, porosity and oxygen
permeability between OPC/PFA/SF and OPC/PFA/SF/Slag with respect to OPC concrete.
Both blended cements achieved strength values of 60MPa. However both mixes achieved
low early strength (1 and 3 days) than OPC. At 7 days all these mixes achieved a
comparable magnitude of strength. At 28 days, mix without Slag content achieved 23%
higher than OPC, whereas mix with Slag achieved 10% higher than OPC. They reported
that at all ages up to 364 days mix without Slag content obtained higher strength than mix
with Slag followed by OPC mix.
They found that the both blended cements contributed to produce additional
hydration products to fill up the voids, hence produced more dense structure. The total
porosity of OPC/PFA/SF and OPC/PFA/SF/Slag reduced significantly that is 2.9 and 3.8
times larger reduction than OPC concrete, respectively from 63 to 182 days. They also
found that both systems showed 40% and 50% lower permeability than OPC concrete at
182 days and one-year hydration respectively. They reported that both systems showed
similar trend in all parameters when subjected to seawater curing exposed to tidal zone
with respect to OPC concrete.

26
f) The incorporation of POFA / Timber Industrial Ash (TIA) into OPC
Nisyurman (2002) investigated the strength, water absorption and total porosity of
OPC/POFA/TIA concrete. The strength at early ages was lower than OPC control.
However the strength improved at 28 days and beyond that was comparable with OPC
strength. Although, the water absorption and total porosity showed significant
improvement, which is remarkably, lower than OPC even at early ages. The absorption of
the blended cement at early ages was 2%, whereas for OPC that was 7% absorption.
Nevertheless at 7 and 28 days the absorption of OPC concrete was reduced significantly
that was within 2.5% to 4% water absorption, whilst the blended cement achieved within
1% to 2% absorption.
The blended cement showed 13.5% total porosity, whereas OPC concrete has
15.4% at 28 days. The used of POFA/TIA as cement replacement is possible to produce
mix having equivalent strength compared to the OPC mix. The delayed pozzolanic
reaction contributed to produce additional hydration products to fill up the voids and
segmented the capillary pores, hence produced more dense structure.
2.2.3 Concrete durability
According to ACI Committee 201 (1991), durability of hydraulic cement concrete
is defined as its ability to resist weathering action, chemical attack, abrasion, or any other
process of deterioration. The concrete should be designed, without deterioration, over a
period of years. High performance concrete is characterized by its excellent durability
rather than high strength concrete. It is known that not only the strength of concrete, but
also its durability is important to increase the service life of the structure (Chindaprasirt et
al., 2004). Two ways to obtain the high performance are; to reduce the flocculation of
cement grains and widen the range of grain size (Malier, 1992). As a matter of fact
porosity and permeability are the governing parameters, which account for the concrete
performance (Pliskin, 1992).
Durability of concrete largely depends on the ease with which, fluids and gases can
enter and move through are referred as permeability of concrete. The movement of various
fluids through concrete take place not only by flow through the porous system but also by
diffusion and absorption (Neville, 1995). Deterioration of concrete is directly related to
presence of aggressive solutions in water and the porosity and permeability of the concrete
as well as the presence of cracks. Higher early strength can be achieved in some modern
cements due to more Ca(OH)2 formation, but this may adversely effect the durability and

27
cost of concrete (Chan and Wu, 2000). By the use of cement replacement of siliceous by-
product such as fly ash, agricultural ash, slag, SF in making mortar or concrete may
improve durability of the concrete to various types of chemical attack, mainly due to its
reduced permeability arising from a pore refining process (Mehta, 1989; Cook, 1987;
Salihuddin, 1993; Zhang et al., 1996; Bagel, 1998; Khan et al., 2000; and Amjad and
Salihuddin, 1999).
2.3 Pore Structure
Porosity is one of the major components of the microstructure of the cement paste.
The pore structure development in the cement pastes tends to reduce in the volume of large
pores during the initial stage of hydration. This reduction in large pores is due to the
hydration products to fill the space of least resistance and also to the increase in the volume
of small pores. The increase of small pore volumes has been attributed to the formation of
hydration products around the large pore necks. Pore structure of blended cement is
different to that of plain cement paste as referred by Mehta and Manmohan (1980).
Generally total porosity of blended cement is higher than plain cement paste, but
their permeability is significantly less than plain cement paste. In plain cement, although
the total porosity is less than blended cement, however the pore structure tends to be
continuous (Feldman, 1983). According to Feldman, 1981, the continuous nature of plain
cement paste has been attributed to the high CH content present, mainly as large crystal.
Different with blended cement in which the continuity of large pore is lower than plain
cement and after 28 days of hydration these large pores are essentially isolated. The rate of
reduction in total porosity of blended cement is less, but the rate of large pores (>0.05um)
reduction was higher than plain cement paste and contained mainly finer pores. (Cook and
Cao, 1987).
2.4.1 Definition of Porosity
According to Concrete Society Technical Report 31 (1988), porosity is defined as,
the volume property that represents the content of pores, which are not necessarily inter-
connected and may not therefore allow the passage of a fluid. Pore structure appears to
consist basically of two classes of voids, the capillary pores and gel pores as follows.
a) Capillary pores
It is generally larger in size in which the formation depends on the evaporation of
the water used in the pastes. The volume of the capillary system will reduce with the
28
progress of hydration. In any stage of hydration the capillary pores filled the part of the
gross volume, which has not been filled by the products of hydration. The average volume
and size of the pores decreases, and the network progressively breaks down (segmentation
of the capillaries). Figure 2.16 illustrates capillary and gel pores, where as the voids as
those marked as C in the space are called the capillary pores and the solid dots represent
gel particles but within the gel itself there exist interstitial voids called gel pores.
b) Gel pores
Gel pores basically are smaller in size and numerous, created by existing cavities in
the hydration products of the cement. The gel pores are really interconnected interstitial
spaces between gel particles. Although the gel pores constitute a network of
communicating pores, it seems that the permeability of this network, by calculation of
Power’s Law, it is very low: 7.10-16 m/s (Perraton and Aitcin, 1992). The gel pores are
very small between 15 and 20Å and much smaller than capillary pores. The gels are
formed in all stages and the continuous does not affect the products already in existence.
The actual value of pore gel is largely independent of water cement ratio and the
progress of hydration. The total volume of gel and gel pores increase with the progress of
hydration. It is in contrast with the capillary pores that the volume decreases with the
progress of hydration. The gel pores occupy about 28% of the total volume of gel. The
particles are mostly fibrous, and bundles of such fibrous from a cross-linked network
containing some more or less amorphous interstitial material. The gel practically the same
specific surface (approximately 200,000m2/kg) is formed throughout the progress of
hydration and do not grow in size.
2.4.2 Porosity governed by wbr
Wbr significantly affects the microstructure of the hardened cement paste. The
initial wbr and the degree of hydration govern the capillary volume. The wbr actually
determines the porosity of the hardened concrete at any stage of hydration. As the time of
hydration increased, the capillaries may become blocked by gel and segmented so that they
turn into capillary pores connected only by the gel pores. Concretes with low porosities
must therefore have a low wbr such as equal or less than 0.5 (Loedolff, 1987). Excess of
water can cause internal or external bleeding as well as increased porosity. Excess of water
held in concrete or which has collected due to internal bleeding will left the concrete by
process of evaporation that can forming voids and remains porous and also increased
shrinkage (Loedolff, 1987). The addition of superplasticizer can reduce the wbr as they

29
make concrete more flowable and easier compacted hence allow the capillary porosity to
be reduced.
2.4.3 Pore Structure Measurement Techniques
The measurement techniques of determination of porosity do not always give the
same value mainly if it involves removal or addition of water that affects the structure of
the hydrated cements (Neville, 1995). The results from Nitrogen adsorption technique
could determine the pore size distribution (PSD) for pore size less than 200nm radius, and
more suitable than mercury porosimetry for pores of this size. Mercury intrusion
porosimetry (MIP) involves forcing the mercury by pressure into porous sample. The
force pressure can be converted to equivalent pore size using Washburn equation. MIP
also could provide relative patterns of PSD for various specimens. Helium porosity could
give an estimate of the amount of pore structure that is interconnected, which employs the
gas law to determine solid volume by displacement principles.
There are a few reasons that impossibility of obtaining reliable results by MIP and
nitrogen adsorption according to Costa and Massazza (1987). The value of the contact
angle between mercury and pore walls, used in calculations for the PSD, can be inexact,
the MIP damages and alters the sample microstructure, the hot drying of the samples
before the porosimetric analysis can modify the cement hydrates phases, the rapid free
water evaporation when the sample is dried under vacuum can break the thinner walls of
capillaries (Costa and Massazza, 1987). However, this damage as mentioned above could
otherwise blocked by hydration products (Salihuddin, 1993). Only very fine pore structure
(less than 200A) will be affected. Nonetheless, the large PSD (> 500A) such as the
capillary pores will not be affected.
Evaporable water content, vacuum saturation porosities and Solvent Exchange
porosities could only provide approximate porosity of materials due to the associated
limitation (Salihuddin, 1993). The PSD patterns of the samples could not be determined.
It will be an overestimate of the volume of water-filled pores due to the hydrate water,
which is lost when it is heated up to 105ºC. Some solvent may react with calcium
hydroxide since from the termogravimetri data obtained for samples using methanol
solvent that give more marked compared to Propanol-2-o1 solvent (Salihuddin, 1993).
From the above it seems that the MIP and Nitrogen adsorption are the suitable pore
structure measurement techniques since more reliable data can be obtained, which could
provide the PSD patterns. However, lately in our lab those machines have some device

30
and software problems require repairing and maintaining. So in this study, the vacuum
saturation technique is available in the lab used to determine the total porosity of the
material investigate. However, this method is also widely used since it is relatively cheap
and easy, furthermore also could provide an aid in speculating the nature of pore structure
of hardened cement paste (Salihuddin, 1993).
2.5 Permeability and Water Absorption
As mentioned earlier, the movements of various fluids through concrete take place
not only by flow through the porous system but also by diffusion and absorption. The
permeability of the concrete is perhaps more important than its strength (Orchard, 1958).
Penetration of concrete attack by aggressive liquid, gasses or when calcium hydroxide
leached out may adversely affect its durability. This penetration is largely dependent on
the permeability of concrete. The more impermeable the concrete, the greater will be its
resistance to deterioration. The higher permeability permits the ingress of liquids, ions and
gases or removal of dissolved reaction products out of concrete. The permeability will
decrease rapidly with the progress of the hydration. It is important to assess this water
transport mechanism in offshore structure. The water absorption is a major source of
damages in structure through its affects on durability of the reinforcement embedded in the
concrete and also because of risk of alkali aggregate reactions (Ithuralde, 1992)
2.5.1 Definitions of Permeability
Accordance to Concrete Society Technical Report 31 (1988), permeability is a flow
property and defined as, that flow property of a porous medium, which characterizes the
ease with which a fluid will pass through it, under the action of a pressure differential
(Concrete Society Technical Report 31, 1988). Water absorption is defined as, the process
where by the concrete takes in a fluid to fill spaces within the materials (Concrete Society
Technical Report 31, 1988).
2.5.2 Permeability dependency on continuity of pores, and pore size distribution
Porosity in itself does not lead to it being permeable to fluid even though the
concrete is porous material. It is permeable to the extent it has interconnecting void
spaces. Figure 2.17 shows an illustration on porosity and permeability. Although the
cement gel has a porosity of 28% its permeability is only about 7 x 10-16m/s. The pores are
very small and numerous. While, although in capillaries pore are fewer in number, are
much large than gel pores and leads to a higher permeability. Water can flow more easily

31
through the capillary pores than through the much smaller gel pores. It does pursue that;
the permeability of cement paste is controlled by the capillary porosity of the paste.
The volume of large pores and the continuity of pore structure affect the
permeability of cement paste. The permeability and absorption of mature blended pastes is
expected to be low due to the discontinuous nature of pores. The time of curing required in
capillary segmented is dependent upon the initial wbr as shown in Table 2.4. Wbr less
than 0.5, the cement hydrate in concrete has potential to overgrow and to close capillaries
in concrete since the volume of the hydration products is approximately 120% higher than
the original cement grains (Loedolff, 1987). For wbr above 0.7, even complete hydration
would not produce enough gel to block all the capillaries.
2.6 Influence of Pozzolans on Permeability and Porosity
A numerous researchers agreed that the substitution of pozzolans for part of the
cement reduces both parameters in concrete. At 28 days pozzolans concrete may be three
times as permeable as ordinary concrete but that after 6 months it may be less than one
quarter as permeable. (Information supplied by the Central Electricity Authority of Great
Britain. (Orchard, 1958). The amount of reduction is depends on the reactivity of the
pozzolans. The pozzolanic materials is used as cement replacement due to produce more
identical products of hydration, which can potentially contribute to the filling and
segmentation of the capillary voids, thus can be produced dense and impermeable concrete
and ultimately more durable concrete.
The pore structure of blended cements is relatively discontinuous after
approximately 28 day of curing. The continuous nature of pores in ordinary Portland
cement pastes continues with age, which is discussed earlier. Continued moist curing can
also reduce permeability because of it promotes and continues the cement hydration. The
addition of pozzolan such as PFA in concrete should help to reduce the permeability of
concrete judging from the influence of PFA in hydration concrete such as reduction of
water content, the dense packing, the increased hydration of cement, as well as its pozzolan
reactions.
The presence of pozzolan leads to a greater precipitation of cement gel products
than occurs in Portland cement alone, which more effectively block the pores more
effectively and therefore helping to reduce permeability. The water-soluble calcium
hydroxide liberated by hydrating cement may leach out of hardened concrete and leave

32
voids for the ingress of water. In the pozzolanic reaction, by combining with the Calcium
hydroxide (CH) directly reduces the amount of CH, which can reduce the leaching of CH.
The additional products by pozzolanic reaction, C-S-H will close the voids, which result in
more dense concrete, and consequently reduce the permeability of concrete arising from a
pore refining process.
2.7 Chemical Attack
It is necessary to understand the phenomena involved in the chemical processes of
concrete deterioration. Chemical attack of concrete occurs by way of decomposition of the
products of hydration to forms a new compounds which, if soluble it may be leached out
and may disruptive in situ if not soluble. Beside CH, the CSH gel can also be attacked but
the most vulnerable cement hydrate is CH. The chemical attack occurs mainly through the
action of aggressive ions such as chlorides, sulphates, carbon dioxide as well as industrial
liquids and gasses through the open pores and cracks available in concrete, which are
explained in detail as follows.
2.7.1 Acid attack
Concrete containing Portland cement is not resistant to acid attack because cement
is highly alkaline that when the cement are attack by strong acids or compounds, it may
convert to acids. Concrete can be attacked by liquids with pH value below 6.5 and it may
very severe when the pH is below 4.5. However, it is not only pH but also the ability of
aggressive ions to be transported that influence the progress of the attack. The rate of
attack decreased when the exposed surface is smaller and the aggregates may become
exposed thus the attacking substance has to travel around the particles. Table 2.5 shows the
list of some materials, which may cause severe chemical attack of concrete.
Acid rain may cause surface weathering of exposed concrete due to its contents of
sulfuric and nitric acid which has pH value between 4.0 and 4.5. Sulfuric acid is
predominantly aggressive because besides to the sulfate attack of the aluminate phase, the
acid attack on CH and CSH gel also can takes place. The microbiological attack is high
pH but does not encourage the acids to attack. However, under certain environment such
as in tropical conditions like Malaysia, some algae, fungi and bacteria can use atmospheric
nitrogen to form nitric acid that can attacks exposed concrete.
Such in domestic sewage which containing high alkaline, when sulfur compounds
become reduced by anaerobic bacteria to form H2S, which itself is not a destructive agent
but will dissolve in moisture films in exposed surface of the concrete and undergoes
33
oxidation by aerobic bacteria and ultimately to produce sulfuric acid. The acid attack can
also exists when the lubricating oils and hydraulic fluid sometimes split on concrete, break
down when heated by exhaust gases and react with CH thus causing leaching. There is no
standard procedure to test on the resistance of concrete to acids. In this research, the test
method on acid attack by Awal and Hussin (1996b and 1997) is adopted.
Use of blended cements provided by good curing is advantageous in reducing the
ingress of aggressive ions. In blended cement, the pozzolanics reaction takes place when
CH is released which can potentially lowering the alkalinity in cement paste thus exhibit
good resistance to acid attack. In addition, the results of pozzolanics reaction with CH
produced more CSH gel thus, the pores become filled and the resistance of the concrete to
acid attack is also increased probably due to the formation of more CSH gel. The
inadequate curing in blended cements can results in less dense microstructure hence more
area in contact of acid attack. Its can lead to progressive neutralization of the alkaline
nature of cement paste (Huang et al., 2005). The elimination of alkalies and dissolving of
portlandite and CSH gel may increase in porosity and permeability.
2.7.2 Carbonation
Air contains CO2, which, in presence of moisture, reacts with hydrated cement.
Actually the actual agent is carbonic acid because the gasses CO2 is not reactive. The rate
of carbonation of concrete increases with an increase in the concentration of CO2, especially in high w/c ratio concrete. The most hydrated product that reacts readily with
CO2 is CH, which produce Ca CO3 on reaction but other hydrates are decomposed such as
hydrated silica, alumina, and ferric oxide.
The carbonation can reduce the pH of the pore water in hardened Portland cement
paste from between 12.6 to 13.5. The value can be reduced to 8.3 when all CH has become
carbonated. When the low pH reaches the surface of the reinforcing steel, the protective
oxide film is removed and corrosion can take place providing the presence of oxygen and
moisture. So, the depth of carbonation is the important factor to know whether it has reach
the surface of embedded steel. Even in presence of cracks in the surface concrete, the
carbonation can ingress through cracks by penetration.
The rate of carbonation is slow, if the pores in hydrated cement are filled with
water because the diffusion of CO2 in water is four times slower than in air. Carbonation is
controlled by the diffusivity of the hardened cement paste, which is function of the pore
system of hardened cement paste during the period when the diffusion of CO2 takes place.

34
The types of cement, the w/c, and the degree of hydration and curing conditions are also
the relevant factors influencing the carbonation. The high w/c ratio could produce high
porosity and late capillaries segmentation as discussed before. The open pores could
potentially influence the diffusion of CO2.
Concrete containing blended cements providing an adequate curing can potentially
improve the depth carbonation attack through the pore system in concrete. Firstly, the
pozzolan reacts with CH resulting from the hydration of Portland, which leads to lower CH
content in the hardened cement so that a smaller amount of CO2 is required to remove all
the CH by producing CaCO3. The pozzolanics reaction resulting in a denser structure of
hardened cements paste as mentioned earlier. Hence, that may reduce and slow down the
diffusivity of carbonation into concrete. Concrete containing blended cements is more
sensitive to inadequate curing. It is necessary to apply water curing to the concrete
containing blended cements at least 7 days to expose the delayed pozzolanic activity.
The continuation of hydration is important to ensure that the hydrated compound
contribute to filling and segmentation of the capillary voids. Figure 2.18 shows the effect
of curing on carbonation of concrete. The carbonation is more pronouns in samples with
absence of wet curing, due to result in high porosity. Other researchers reported that
increasing the period of wet curing from 1 day to 3 days reduces the depth of carbonation
by about 40% (Neville, 1995).
2.7.3 Effects of seawater on concrete
Salts in seawater represent 77% of dissolved salts that leads to various chemical
actions of seawater on concrete such as salt weathering, chloride induced, abrasion by sand
in suspension and by ice. The chemical reaction of seawater on concrete due to presence
of MgSO4, MgCl2 with NaCl and other dissolved salt are common. Table 2.6 shows the ion
concentrations for the individual salts. Seawater contains also some dissolved CO2, which
can react with CH to form CaCO3 in the form of aragonite (Neville, 1995).
Ion sulphate as well as chloride in seawater are the most aggressive ions, which on
reaction between cement constituent can lead to dissolution of CH and the formation of
Sulphoaluminate and chloroaluminate hydrates thus causing expansion and softening of
concrete respectively (El Aziz et al., 2004). The results of Calcium Chloride (CaCl2) from
the reaction of MgCl2 with liberated lime can increase the solubility of CH that can allow
leaching. Thus the Mg(OH)2 dissociates CSH and produces Ca(OH)2 and silica gel (El

35
Aziz et al., 2004). The latter may react with Mg(OH)2 to form Magnesium Silicate
hydrates. While, the CSH are also decomposed by magnesium sulphate in aggressive
solutions to give gypsum, hydrated silica and magnesium silicate hydrates, which have
little or no binding power properties like CSH gel. All the reactions mentioned above
contribute to the decrease in strength.
However the chemical reaction of seawater on concrete shown below has good
advantage to concrete properties.
MgSO4 + Ca(OH)2 CaSO4 + Mg(OH)285..
The magnesium ion present in the seawater substitutes from the calcium ions. The
Mg(OH)2 is also known as brucite, which precipitates in the pores at the surface of the
concrete, thus forming a protective surface layer at about 20 to 50µm thick formed rapidly
as observed in a number of fully submerged sea structures. The layer can potentially
obstruct further reaction. However, the blocking nature of brucite is in limited extent, that
if abrasion can remove the surface deposit, then the reaction by the magnesium ion freely
existing in the seawater continues.
The synergistic wave action enhances the chemical attack, by way of forming and
crystallization of salts, thus make the concrete more exposed to erosion by wave action and
to abrasion by sand suspended in seawater. When concrete is repeated wet and drying
periods, while the pure water evaporates, the dissolved salts in seawater are left behind in
the forms of crystal mainly sulfates. It will re-hydrate and grow upon following wetting
and therefore exert an expansive force on the surrounding hardened cement paste, which is
known as salt weathering. Chloride can ingress into concrete by diffusion, adsorption and
transportation. Thus results in higher concentration if the ingress is prolonged or repeated
with time.
There will be no corrosion when concrete permanently submerge in seawater,
unless oxygen is present at the cathode. The ingress of chlorides is progressive when the
concrete is alternately exposed to seawater and sometimes dry. However, the movement of
salt depends on the length of the wetting and drying periods. The water in the outer zone
of the concrete evaporates and while the remaining water in the interior will become
saturated with salt and the excess salt will precipitate out as crystal.
Blended cements are known to produce concrete with a dense microstructure. The
diffusivity of chloride through concrete depends on the microstructure of the concrete. The
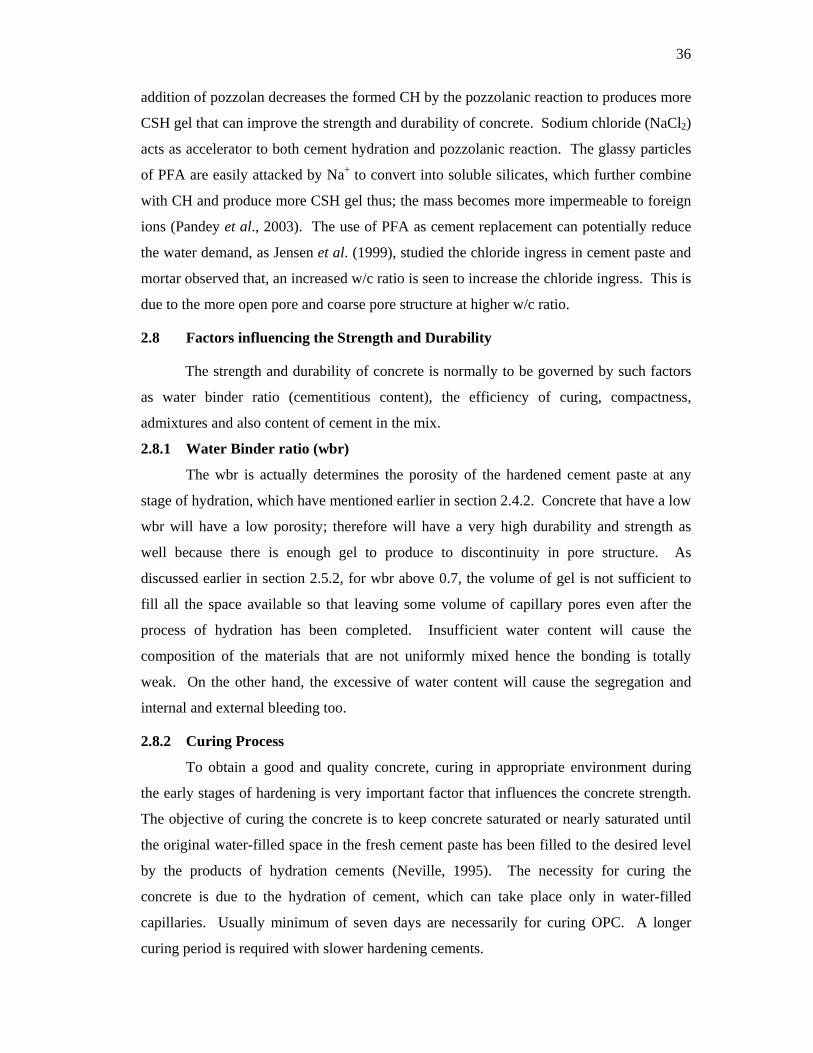
36
addition of pozzolan decreases the formed CH by the pozzolanic reaction to produces more
CSH gel that can improve the strength and durability of concrete. Sodium chloride (NaCl2)
acts as accelerator to both cement hydration and pozzolanic reaction. The glassy particles
of PFA are easily attacked by Na+ to convert into soluble silicates, which further combine
with CH and produce more CSH gel thus; the mass becomes more impermeable to foreign
ions (Pandey et al., 2003). The use of PFA as cement replacement can potentially reduce
the water demand, as Jensen et al. (1999), studied the chloride ingress in cement paste and
mortar observed that, an increased w/c ratio is seen to increase the chloride ingress. This is
due to the more open pore and coarse pore structure at higher w/c ratio.
2.8 Factors influencing the Strength and Durability
The strength and durability of concrete is normally to be governed by such factors
as water binder ratio (cementitious content), the efficiency of curing, compactness,
admixtures and also content of cement in the mix.
2.8.1 Water Binder ratio (wbr)
The wbr is actually determines the porosity of the hardened cement paste at any
stage of hydration, which have mentioned earlier in section 2.4.2. Concrete that have a low
wbr will have a low porosity; therefore will have a very high durability and strength as
well because there is enough gel to produce to discontinuity in pore structure. As
discussed earlier in section 2.5.2, for wbr above 0.7, the volume of gel is not sufficient to
fill all the space available so that leaving some volume of capillary pores even after the
process of hydration has been completed. Insufficient water content will cause the
composition of the materials that are not uniformly mixed hence the bonding is totally
weak. On the other hand, the excessive of water content will cause the segregation and
internal and external bleeding too.
2.8.2 Curing Process
To obtain a good and quality concrete, curing in appropriate environment during
the early stages of hardening is very important factor that influences the concrete strength.
The objective of curing the concrete is to keep concrete saturated or nearly saturated until
the original water-filled space in the fresh cement paste has been filled to the desired level
by the products of hydration cements (Neville, 1995). The necessity for curing the
concrete is due to the hydration of cement, which can take place only in water-filled
capillaries. Usually minimum of seven days are necessarily for curing OPC. A longer
curing period is required with slower hardening cements.

37
High strength concrete should be cured at an early age as partial hydration may
make the capillaries discontinuous and the renewal of curing water would not be able to
enter the interior of the concrete and no further hydration would result. For Pozzolan
concrete, at least initial of seven days water curing is necessary to allow the pozzolanic
activity and reaction. The strength of OPC concrete that cured varying initial water curing
period is lower than pozzolan concrete. For mortar 7 and 14 days initial water-cured
specimen exhibited higher strength than the corresponding continuously water-cured
specimens. The higher strength of partly dried specimens with respect to continuous wet
ones was attributed to the increase in the secondary forces between the surface of cement
gel and also the reduction in the disjoining pressure due to the drying (Ozer and Ozkul,
2004).
In contrast, OPC concrete has higher rate of strength than pozzolan concrete in air
curing. According to Feldman, it is known that drying evaporates the pore solution and
shrinkage results in cracks that change the microstructure. Drying the cement paste would
increase the permeability, possibly because shrinkage may rupture some of the gel between
the capillaries and therefore will open new passages to the water.
2.8.3 Compactness
The presence of voids can reduce the strength of concrete. Voids in concrete are in
fact either bubbles of entrapped air or spaces left after excess water has been removed.
The volume of the later is largely dependent on the w/c of the mix. The need to compact
the concrete is essential to eliminate the entrapped air. Besides that, it provides a good and
strong bonding between the cement paste and aggregate. 5% of voids can lower the
strength by as much as 30% and even 2% voids can drop the strength more than 10%
(Neville, 1995).
2.8.4 Water reducing agent (Superplasticizer, Sp)
The quality and properties of concrete are governed by its flow behaviour, which is
controlled by the dispersion of cement particles. The additions of Sp provide the
possibility of a better dispersion of cement particles, thereby producing paste of higher
fluidity. The Sps becoming essential due to their contribution to the development of
strength concrete remarkably larger than that of cement. The Sps are absorbed by cement
particles, which deflocculates and separate, releasing trapped water from cement flocks.
The deflocculation of cement grains by Sp can be seen as in Figure 2.19. For a given w/c,
this dispersion will increase the concrete workability.

38
A variety of Sps have been developed belongings to different basic group, namely
lignosulfonic (LS), melamine formaldehyde sulfonic acid (SMF), naphthalene
formaldehyde sulfonic acid (SNF) and Polycarboxylic acid (CE). SNF may be more
effective than the others Sp in dispersion of cement particles. Figure 2.20 shows the
schematic representation of SNF.
One effect of dispersion is to expose a greater surface area of cement to hydration,
which progresses at a higher rate in the earlier stages. For this reason, there is an increase
in the strength of concrete, compared with a mix of the same w/c but without the
admixture. The use of Sp is also to produce concrete at normal workability nevertheless
having a high strength concrete due to high reduction in w/c. The use of Sp in concrete has
no significant effect in long-term strength as reported from 13 years of study. Generally,
the Sp with a given workability can facilitate the reduction in water content up to 25 to
35% and increase strength up to 24 hours, which will increase up to 50 to 75%. Beside
that, the high increment of strength can be achieved at early age of the concrete. The Sp
can be used with cement replacement material such as Fly Ash or Slag when the early
strength is the matter of great concern due to delayed pozzolanic reaction. The reaction of
Sp happens in short period approximately 10 minutes after mixing the water and just after
30 to 90 minutes the workability of concrete paste turn back to be normal.
2.8.5 Influence of richness of the mix on strength
An extremely rich mix that is high cement content (above 530 kg/m3) with a very
low w/c showed retrogression of strength, mainly when large size of aggregate is used.
Therefore, at later ages, in this type of mix, a lower w/c would not lead to a higher
strength. This behaviour is due to the stress induced by shrinkage, whose restraint by
aggregate particles causes cracking of cement paste or loss of the cement aggregate bond.
High aggregate/cement ratio for a constant w/c, leads to a higher strength (Neville, 1995).
High cement content will causing the high early temperature developed from the heat of
hydration that can have detrimental effects on the performance of concrete. It can cause
the differential expansion due to the large tensile stresses on the surface and leading to
cracking. Thus leads to reduction in strength and durability at the later ages.
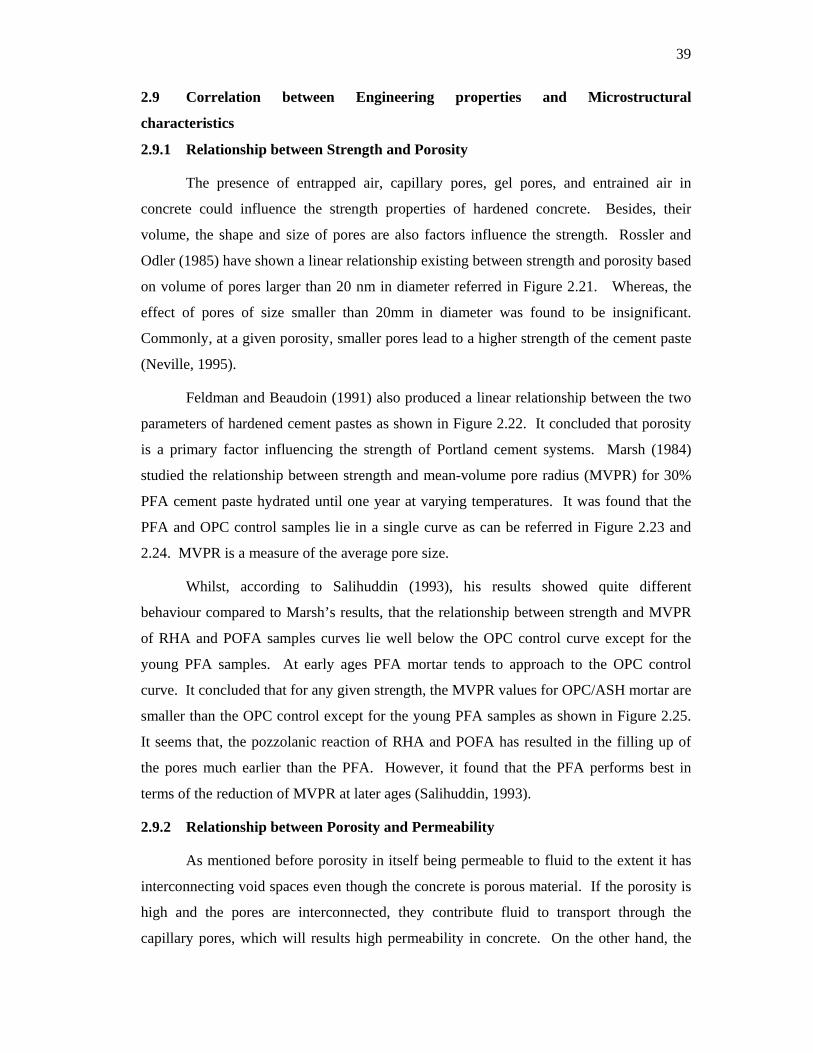
39
2.9 Correlation between Engineering properties and Microstructural
characteristics
2.9.1 Relationship between Strength and Porosity
The presence of entrapped air, capillary pores, gel pores, and entrained air in
concrete could influence the strength properties of hardened concrete. Besides, their
volume, the shape and size of pores are also factors influence the strength. Rossler and
Odler (1985) have shown a linear relationship existing between strength and porosity based
on volume of pores larger than 20 nm in diameter referred in Figure 2.21. Whereas, the
effect of pores of size smaller than 20mm in diameter was found to be insignificant.
Commonly, at a given porosity, smaller pores lead to a higher strength of the cement paste
(Neville, 1995).
Feldman and Beaudoin (1991) also produced a linear relationship between the two
parameters of hardened cement pastes as shown in Figure 2.22. It concluded that porosity
is a primary factor influencing the strength of Portland cement systems. Marsh (1984)
studied the relationship between strength and mean-volume pore radius (MVPR) for 30%
PFA cement paste hydrated until one year at varying temperatures. It was found that the
PFA and OPC control samples lie in a single curve as can be referred in Figure 2.23 and
2.24. MVPR is a measure of the average pore size.
Whilst, according to Salihuddin (1993), his results showed quite different
behaviour compared to Marsh’s results, that the relationship between strength and MVPR
of RHA and POFA samples curves lie well below the OPC control curve except for the
young PFA samples. At early ages PFA mortar tends to approach to the OPC control
curve. It concluded that for any given strength, the MVPR values for OPC/ASH mortar are
smaller than the OPC control except for the young PFA samples as shown in Figure 2.25.
It seems that, the pozzolanic reaction of RHA and POFA has resulted in the filling up of
the pores much earlier than the PFA. However, it found that the PFA performs best in
terms of the reduction of MVPR at later ages (Salihuddin, 1993).
2.9.2 Relationship between Porosity and Permeability
As mentioned before porosity in itself being permeable to fluid to the extent it has
interconnecting void spaces even though the concrete is porous material. If the porosity is
high and the pores are interconnected, they contribute fluid to transport through the
capillary pores, which will results high permeability in concrete. On the other hand, the

40
discontinuous pores structure in concrete will results in low permeability due to the fluid
will ineffectively able to transport even its porosity is high. The permeability of hardened
concrete is controlled by its capillary porosity. Powers (1958) has shown the relation
between both quantities referred in Figure 2.26. Small pores carry very little permeability
water compared to the maximum continuous pore radius. Marsh (1984) found that a
significantly reduction in permeability in PFA cement paste. It explained the reduction in
permeability as the results of pore blockage due to the pozzolanic reaction of the PFA.
Salihuddin (1993) also studied the relationship between the permeability and the
volume of pore radius greater than 200Å of RHA and POFA mortar. It found that almost
all OPC/RHA samples tested show permeability results within the low permeability region
as shown in Figure 2.27. However, OPC/POFA has five high permeability mortars
compared to only one for OPC/RHA specimens as can be referred in Figure 2.28.
However, it found the direct relationship between two parameters but very poor in nature.
The lines drawn are just indication of general trends.
The trends show a general rise in permeability as percentage of volume of pores of
radius greater than 200A increased (Salihuddin, 1993). It suggested that for OPC
containing pozzolan mortar, there is a critical volume of large pores, which they show high
permeability that lies between 10 and 11% of specimen volume. It defined the large pores
as those of radius greater than 200A. However, It found that the OPC control mortar did
not show the similar trend to that of OPC/ASH mortar. The volume of pores greater than
200A for OPC control mortar varies from about 8 to 13% of the specimen value, but the
permeability is defined as lying within low permeability regions.
2.10 Conclusions
From literatures covered in this chapter the use of multi blended systems exploiting
the potential synergy between these pozzolanic materials provided by constituents of
amorphous in silica or glass content and sufficient curing time. Each of these materials
operates in a different but co-operative way (Isaia et al., 2003). Recently from the
literature point of view it seems that a number of researchers had studied the use of SF into
OPC/PFA/Slag in MBC system. RHA is a highly reactive pozzolanic material, which
contains considerable amount of silicon dioxide that is similar with SF. Several
researchers also have studied RHA by incorporating it in binary and ternary system.
However the application of this material in the construction industry is non existence.
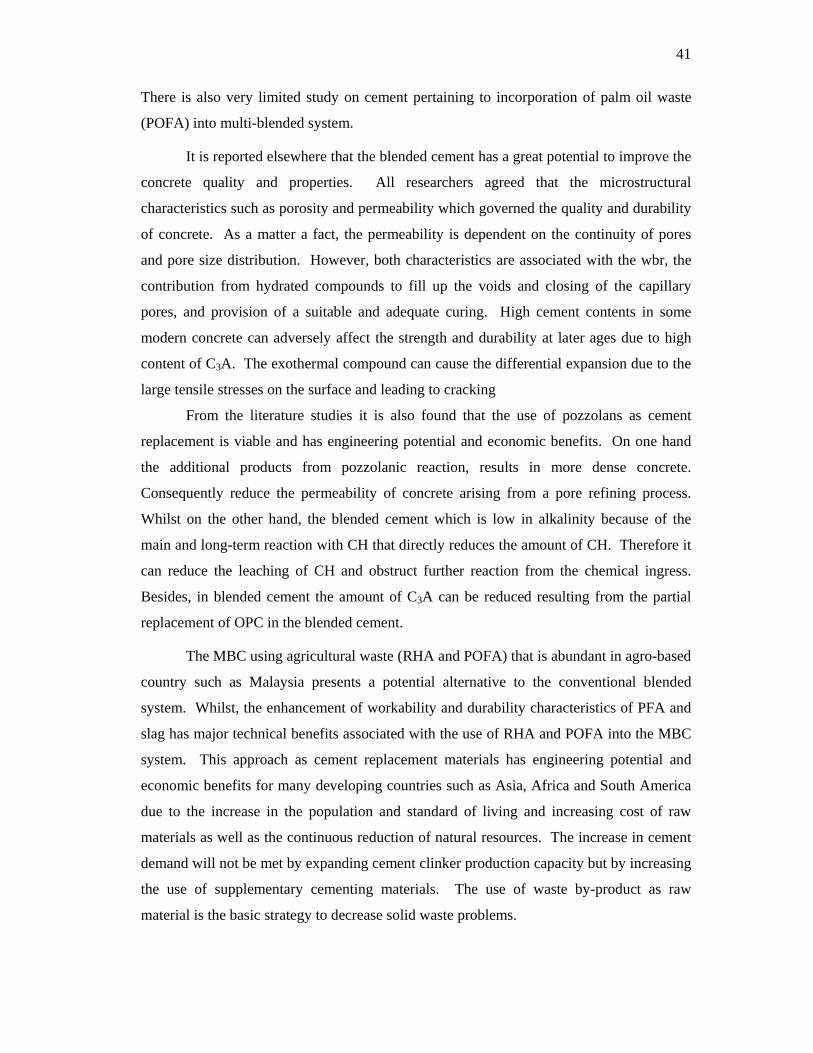
41
There is also very limited study on cement pertaining to incorporation of palm oil waste
(POFA) into multi-blended system.
It is reported elsewhere that the blended cement has a great potential to improve the
concrete quality and properties. All researchers agreed that the microstructural
characteristics such as porosity and permeability which governed the quality and durability
of concrete. As a matter a fact, the permeability is dependent on the continuity of pores
and pore size distribution. However, both characteristics are associated with the wbr, the
contribution from hydrated compounds to fill up the voids and closing of the capillary
pores, and provision of a suitable and adequate curing. High cement contents in some
modern concrete can adversely affect the strength and durability at later ages due to high
content of C3A. The exothermal compound can cause the differential expansion due to the
large tensile stresses on the surface and leading to cracking
From the literature studies it is also found that the use of pozzolans as cement
replacement is viable and has engineering potential and economic benefits. On one hand
the additional products from pozzolanic reaction, results in more dense concrete.
Consequently reduce the permeability of concrete arising from a pore refining process.
Whilst on the other hand, the blended cement which is low in alkalinity because of the
main and long-term reaction with CH that directly reduces the amount of CH. Therefore it
can reduce the leaching of CH and obstruct further reaction from the chemical ingress.
Besides, in blended cement the amount of C3A can be reduced resulting from the partial
replacement of OPC in the blended cement.
The MBC using agricultural waste (RHA and POFA) that is abundant in agro-based
country such as Malaysia presents a potential alternative to the conventional blended
system. Whilst, the enhancement of workability and durability characteristics of PFA and
slag has major technical benefits associated with the use of RHA and POFA into the MBC
system. This approach as cement replacement materials has engineering potential and
economic benefits for many developing countries such as Asia, Africa and South America
due to the increase in the population and standard of living and increasing cost of raw
materials as well as the continuous reduction of natural resources. The increase in cement
demand will not be met by expanding cement clinker production capacity but by increasing
the use of supplementary cementing materials. The use of waste by-product as raw
material is the basic strategy to decrease solid waste problems.

42
POFA and RHA has vast potential to be used in MBC by incorporation of PFA and
Slag with the aim of exploiting the potential synergy between these materials, thus
reducing or eliminating limitations inherent in individual materials. If these agro wastes
(RHA and POFA) could be used as cement replacement in Portland cement rather than the
use of high cost and extreme fineness of SF, it can leads to considerable cost savings to the
manufacturer and also reducing environmental impact and landfill use. Limited effort had
been carried out in the past to exploit the economic benefits from these wastes as
construction materials in concrete. Contractors and owners have to realize that what is
important is not the cost of 1m3 of concrete but rather the cost of 1 MPa or 1 year of life
cycle of a structure (Aitcin, 2000). The behavior and synergic effect of MBC should be
emphasized and more efforts are needed for rapid implementation in adopting this
technology to date. In order to save resources and energy, it is now a common practice in
the use of industrial wastes into OPC but not the case yet with agricultural wastes and by-
products. To realize this vision and objective the current research was undertaken to enrich
the literatures and enhance the developing and advancement of knowledge in this field.
Table 2.1 : Chemical constituents and physical properties of OPC, PFA, Slag, RHA and POFA
Chemical constituents
OPC
(%)
PFA
(%)
Slag
(%)
RHA
(%)
POFA
(%)
Requirements of ASTM C
618-84 Class F
Silicon dioxide (SiO2) 20.1 48.7 28.2 87.2 NA Aluminium oxide 4.9 27.8 10.0 0.2 NA Ferric oxide (Fe2O3) 2.5 9.2 1.8 0.2 NA (SiO2 +Al2O3 + Fe2O3) 27.5 85.7 40.0 89.4 75.9 70 Calcium oxide (CaO) 65 3.0 50.4 0.6 NA Magnesium oxide (MgO) 3.1 1.9 4.6 0.4 NA Sulphur oxide (SO3) 2.3 0.9 2.2 0.2 1.0 5.0 Sodium oxide (Na2O) 0.2 1.3 0.1 1.1 NA Potassium oxide (K2O) 0.4 2.4 0.6 3.7 NA Titanium oxide (TiO2) 0.2 1.1 - <0.1 NA Phosphorous oxide <0.9 0.3 - <0.1 NA Loss on ignition (LOI) 2.4 3.9 0.2 5.9 3.7 6.0 Fineness: Specific Gravity 3.2 2.7 2.1 2.1 5.0
OPC, PFA, RHA : after Ho (1999) POFA : after Salihuddin (1993) Slag : from YTL Cement Sdn. Bhd

43
Table 2.2: Strength development of test cylinders of concretes containing Silica Fume (Hooton, 1993)
Compressive strength (MPa) of mixes with a Silica Fume content of
(percent)
Age
0 10 15 20
1 day 7 days 28 days 56 days 91 days 182 days
1 year 2 years 3 years 5 years
26 45 56 64 63 73 79 86 88 86
25 60 71 74 78 73 77 82 90 80
28 63 75 76 73 71 70 71 85 67
27 65 74 73 74 78 80 82 88 70
Table 2.3: Pore characteristics of mortars containing Sulfate-Resisting Cement and Silica Fume (Hooton, 1993)
Total porosity, percent of mixes with a Silica Fume content of (percent)
Period of moist curing,
days 0 10 15 20 7 28 91 182 365
16.0 14.7 14.3 10.8 10.7
14.3 13.4 13.3 10.8 9.5
13.7 12.9 11.7 9.6 10.5
13.0 11.7 10.6 8.6 9.1
Volume of pores with a diameter smaller than 0.05um, percent
7 28 91 182 365
8.5 6.3 7.5 5.3 5.1
3.0 2.8 2.8 3.2 2.1
2.7 2.2 1.8 2.4 2.5
2.0 2.3 1.7 2.3 2.0
Table 2.4: Time required for capillaries to segmented (Neville, 1995)
Water to cement ratio by weight Required age
0.40 0.45 0.50 0.60 0.70
0ver than 0.70
3 days
7 days
14 days
6 months
1 years

44
Table 2.5: List of some substances that cause severe chemical attack of concrete (Neville, 1995)
AcidsInorganic Organic
Carbonic Acetic
Hydrochloric CitricHydrofluoric Formic
NitricHumic
Phosphoric LacticSulfuric Tannic
Other substances Aluminium Chloride Vegetable and animal fats
Ammonium salts Vegetable oilsHydrogen Sulfide Sulfates
Table 2.6: Ion concentration of individual salts (Neville, 1995)
Figure 2.1 : World production of cement according to CEMBUREAU (Aitcin, 2000)
Ions %
Chloride 2.0
Sulfate 2.8
Sodium 1.11
Magnesium 0.14
Calcium 0.05
Potassium 0.04

45
Figure 2.2: XRD patterns of pastes OPC, Wo and 30% RHA, W3 at w/c ratio 0.55 and hydrated at 20 ± 1ºC for different ages. (Qijun et al., 1999)
Figure 2.3: XRD patterns of various mixes at 12 months (El Aziz et al., 2004)
Figure 2.4: XRD pattern for RHA burnt at different temperatures (Kapur, 1981)

46
Figure 2.5: XRD pattern for RHA containing crystalline silica (Cook,1986)
Figure 2.6: XRD pattern for RHA mainly amorphous silica (Coutinho, 2003)
Figure 2.7: Skeletal structure of RHA particle
47
Figure 2.8: Phase composition of UK PFA
Figure 2.9: Photomicrographs of PFA (left) and OPC (right)
Figure 2.10: Strength development of RHA mixes (Cook and Suwanvitaya, 1981)

48
Figure 2.10: (cont.)
Figure 2.11: Effect of POFA content on compressive strength of concrete (Awal and
Hussin, 1996b)
Figure 2.12: Effect of fineness of ash on compressive strength of concrete (Awal and Hussin, 1996b)

49
Figure 2.13: Strength development of various Slag content (Hogan and Muesel, 1981)
Figure 2.14 : Strength development of various Slag content (Roy and Idorn, 1982)
Figure 2.15: Hydrates between adjacent particles in Slag (Bakker, 1980)

50
Figure 2.16: Simplified model of paste structure (Powers, 1958)
Figure 2.17: Illustration of Permeability and Porosity (From Concrete Society Technical Report no.31, 1988)
Figure 2.18: Relation between the depth of carbonation and compressive strength of concrete after 2 years (Neville, 1995)

51
Figure 2.19: Deflocculation of cement grains by superplasticizer (Uchikawa, 1986)
Figure 2.20 Schematic representation of molecules of naphthalene sulfonate condensate
(Aitchin, 1992)
Figure 2.21 Relation between compressive strength of mortar and porosity calculated
from the volume of pores larger than 20nm in diameter (Sersale et al., 1991)

52
Figure 2.22: Relationship between compressive strength and porosity (Feldman &
Beaudoin, 1991)
Figure 2.23: The relationship between compressive strength and Mercury Porosity of OPC
and OPC/PFA pastes. (Marsh, 1984)
Figure 2.24: The relationship between compressive strength and mean-volume pore radius (Marsh, 1984)

53
Figure 2.25: The relationship between compressive strength and mean-volume pore radius of control OPC and 30% replacement OPC/ASH mortar pastes (Salihuddin, 1993)
Figure 2.26: Relation between permeability and capillary porosity of cement paste (Power, 1958)
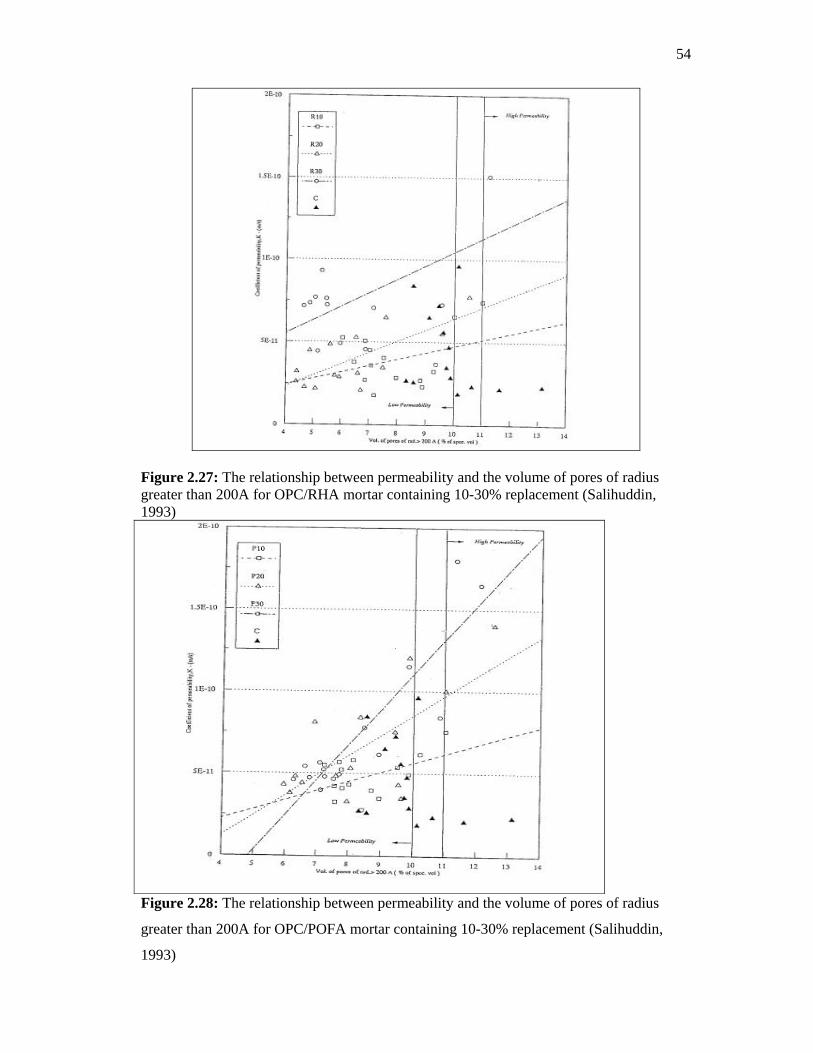
54
Figure 2.27: The relationship between permeability and the volume of pores of radius greater than 200A for OPC/RHA mortar containing 10-30% replacement (Salihuddin, 1993)
Figure 2.28: The relationship between permeability and the volume of pores of radius
greater than 200A for OPC/POFA mortar containing 10-30% replacement (Salihuddin,
1993)
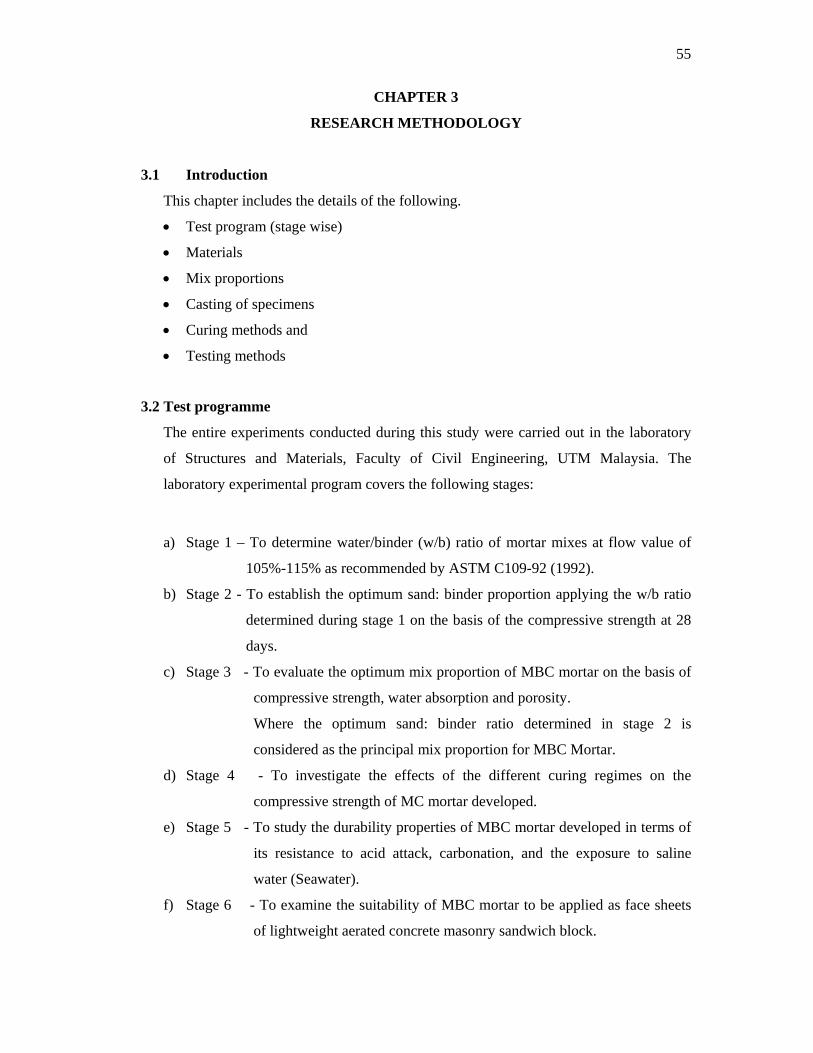
55
CHAPTER 3
RESEARCH METHODOLOGY
3.1 Introduction
This chapter includes the details of the following.
• Test program (stage wise)
• Materials
• Mix proportions
• Casting of specimens
• Curing methods and
• Testing methods
3.2 Test programme
The entire experiments conducted during this study were carried out in the laboratory
of Structures and Materials, Faculty of Civil Engineering, UTM Malaysia. The
laboratory experimental program covers the following stages:
a) Stage 1 – To determine water/binder (w/b) ratio of mortar mixes at flow value of
105%-115% as recommended by ASTM C109-92 (1992).
b) Stage 2 - To establish the optimum sand: binder proportion applying the w/b ratio
determined during stage 1 on the basis of the compressive strength at 28
days.
c) Stage 3 - To evaluate the optimum mix proportion of MBC mortar on the basis of
compressive strength, water absorption and porosity.
Where the optimum sand: binder ratio determined in stage 2 is
considered as the principal mix proportion for MBC Mortar.
d) Stage 4 - To investigate the effects of the different curing regimes on the
compressive strength of MC mortar developed.
e) Stage 5 - To study the durability properties of MBC mortar developed in terms of
its resistance to acid attack, carbonation, and the exposure to saline
water (Seawater).
f) Stage 6 - To examine the suitability of MBC mortar to be applied as face sheets
of lightweight aerated concrete masonry sandwich block.
56
Figures 3.1 and 3.2 show the flow chart of the test programme and the
supplementary tests conducted during the entire experimental program of this study. Table
3.1 shows the test parameters covered during the experimental program. Table 3.2 shows
the category of tests.
3.3.1 Materials
Materials used during this experimental study comply with the standard
specifications of various standards like ASTM, BS, and MS. The details of the materials
are as follows:
a) Cement
Ordinary Portland Cement (OPC) of ‘SELADANG’ brand from Holcim Cement
Manufacturing Sdn. Bhd. in Pasir Gudang, Johor was used. The OPC used complies with
the Type I Portland Cement as in ASTM C150 (1994) specifications. The chemical and
physical composition of the cement used are presented in Table 3.3.
b) GGBFS (Slag)
Ground Granulated blast furnace slag was obtained from YTL Sdn. Bhd. located at
Pasir Gudang, Johor. It was kept in airtight container before its use. The GGBFS used
complies with the specifications of ASTM C989 (1993). The slag activity index is 100.
The chemical composition of slag as compared with OPC is shown in Table 3.3. The
composition of silica, alumina and iron oxide of slag is 40%, which is the lowest content
among the pozzolanic materials. But it has high content in CaO, approximately 50.4%.
Thus, the slag is considered as cementitious material instead of a pure pozzolan.
c) PFA
The PFA used throughout the study was obtained from MAJU PERKASA Sdn.
Bhd. The source of PFA used is a coal-power station located in Sepang, Selangor,
Malaysia. It was supplied in the bags of 50 Kg. Table 3.3 shows the chemical composition
of PFA used. The oxide content (silica, alumina and iron oxide) is approximately 97.8% of
the total composition. This content is somewhat comparable with RHA but higher than
POFA. Whereas the content of CaO is less than 10% that classifies the PFA used as Class
F in accordance with ASTM C 618-84(1992). The fineness of PFA complies with the
specifications of ASTM C 618-84(1992), which is less than 34% retained in the 45µm
sieve as shown in Table 3.7.

57
d) RHA
The RHA used was obtained from a rice mill located in Kedah and supplied by
Maju Perkasa Sdn. Bhd. It was packed in 20 kg bags. The chemical composition of RHA
is given in Table 3.3. The combined oxides content (silica, alumina and iron oxides) is
approximately 97.7% of the total composition. The content of CaO in case of RHA is also
less than 10% which places itself in Class F. The ashes obtained undergone a grinding
process to achieve their fineness as per the specifications of ASTM C 618-84. It is
mentioned that the pozzolanic materials ought to have fineness of at least 66% of the ash
passes through the 45µm sieve. While the percentage of fineness of RHA reported in the
literature is referred in Table 3.3. In fact, the fineness of the ashes significantly affects the
reactivity of the ash in mortar or concrete (Cook, 1986). Hence the RHA obtained was
ground until the required fineness was achieved. Los Angelas Abrasion test (LAAT)
equipment as shown in Figure 3.3 was used for the grinding purpose. Initially the material
was sieved in 300µm sieve to remove the coarse and foreign particles (if any) form the
material.
Before grinding it was observed that the percentage of passing of RHA through
45µm was found to be 12% of the total material. The references used to determine the %
of fineness for RHA can be referred in Table 3.4. The grinding time for RHA and the wet
sieve analysis test results are given in Table 3.5 while Figure 3.4 presents the pictorial
view. Based on the test results, the optimum grinding time for RHA to achieve the specific
fineness was determined as about one and half-hours by using 15 numbers of 12mm
diameter and 800mm long stainless steel bars as grinding media. This is in coincidence
with the recommended time reported in the literature. The grinding media is depicted in
Figure 3.5.
e) POFA
POFA was also supplied by MAJU PERKASA Sdn. Bhd, in the bags of 50 kg per
bag. The chemical composition is shown in Table 3.3. The oxides analysis shows the 93%
combined oxides content (silica, alumina and iron oxides). The content of CaO of POFA
was found to be less than 10%, hence it is also classified as class F. According to Awal
and Hussin (1996b), the finer the POFA, the greater is the strength development. Initially
the percentage passing of the POFA through 45micron sieve achieved was only 2%. Hence
the POFA was also ground by adopting the similar method used for RHA. After grinding
the percentage passing through 45 micron sieve obtained is 94%. The optimum time to
58
grind the POFA is observed to be two and half hours. Table 3.6 and Figure 3.6 present the
grinding time and wet sieve analysis test results of POFA.
It is important to mention here that in common practice generally OPC is not
ground to achieve more fineness than the fineness at its manufacture. Hence during this
study OPC was not ground. Whereas the Slag and PFA used were also in ground form and
hence both materials required no grinding. The samples of OPC, Slag and PFA were tested
for the fineness, the results of which are presented in Table 3.7. From the table it is evident
that the ashes are finer than that of the OPC. After grinding, the ashes were kept in airtight
plastic bags and placed in a suitable container to avoid any atmospheric effect on the ashes.
f) Fine aggregates (Sand)
Quarry sand used was in this study. The sand was dried in a large size oven at
105°C temperature for 24 hours to remove the moisture. It was sieved from the set of
sieves according to BS 410: (1986). Figure 3.7 depicts the grading curve of the sand used
and it clearly shows that the grading curve is enclosed within the fine aggregate envelope.
g) Water
Water is one of the most important materials required to produce mortar paste. In
general the water acceptable for drinking purpose is suitable for the manufacture of mortar.
Impurities in water may influence the setting time of the cement and also can adversely
affect the strength of concrete or cause staining of its surface (Neville, 1995). Therefore,
tap water was used to cast the specimens during this study.
h) Water reducing agents (Superplasticizer)
Water reducing admixtures were added to reduce the water/binder ratio of the
concrete and mortars by maintaining the workability in order to reduce the voids ratio
thereby increasing the strength and decreasing the porosity of the mortar. The addition of
superplasticizer also plays significant role to reduce the flocculation of cement grains
(Malier, 1992). The superplasticizer of trade name SIKAMENT NN was used as the
chemical admixture during this study. It is type F high range water reducing admixture
according to ASTM C 494-92 (1992). All the physical requirements of superplasticizer are
in accordance with Table 1 of ASTM C 494-92. It is from group Sulphonated Naphthalene
Formaldehyde condensates (SNF) in dry powder form.

59
3.4 Mix proportion
In all, nine types of mixes including one control mix without replacement of
cement were casted for this study. Two series of the mortar mixes were considered. Four
mixes were designed with the binary blended cement as binder material during first series.
Binary blended cement (BBC) was prepared by replacing partially with one of the blending
constituents in each mix. The blending constituents considered for this series are Slag,
PFA, RHA and POFA. Whereas the percentages of partial replacement applied for each
blending constituent is the optimum value as reported by the various researchers as refer in
the literature review in this thesis. The details of the BBC mortars are given in Table 3.8a.
The second series of the mortars was designed by replacing cement with the
combination of all the four blending constituents and the mortars developed are known as
Multi-Blended Cement (MBC) mortars. Four mixes were prepared for this series. The
replacement level of OPC was fixed at 50% of total binder by weight. Whereas, the
content of Slag, and POFA was also fixed at 20% and 5% of the total binder by weight
respectively. The remaining 25% replacement of cement was adjusted between the various
percentages of RHA and PFA. The details of the MBC mortars are shown in Table 3.8b.
Figure 3.8 depicts the pictorial view of all the constituents including fine sand used to
produce mortars for this study.
3.5 Casting process
All materials including water were weighed prior to mixing of the materials.
Initially binders were mixed in an electrically operated mortar mixer at 285 ± 10 rpm for
about 2 minutes to ensure proper blending of the OPC and all the blending constituents.
Figure 3.9 shows the mixer used. Then sand, and superplasiticizers were added in the
blended binder and were mixed in mixer for 1-2 minutes again. Finally, water was added
slowly into the dry mix and mixing of the mortar mix continued for about 3 minutes in
order to achieve the uniform mix. Then cube specimens of standard size were cast. The
moulds and the table vibrator used for the specimen casting are presented in Figure 3.10
and 3.11, respectively. The moulds were covered in a plastic sheet with wet gunnysacks at
the top to provide humidity during the hardening process. After 24 hours the specimens
were demoulded and cured accordingly.
3.6 Curing process
Curing is generally the procedures employed to promote hydration of cement, and
consists of a control temperature and the moisture movement from and into concrete or

60
mortar as well (Neville, 1995). The curing procedures adopted for this study were as per
the recommendations of the standard methods reported in literatures. Initially the
specimens were cured in water for 7, 28, 60 and 90 days and tested accordingly in order to
establish the optimum sand: binders proportion and also to select optimum mix proportion
for MBC mortars. The specimens prepared from MBC mortars were cured in three curing
regimes namely continuous water, air curing, and initial water curing for 7 and 14 days
followed by the air curing up to 28, 60 and 90 days to examine the effect of curing
regimes.
As per the objectives, the strength of MBC mortars subjected to chloride attack was
examined. For this purpose the cube specimens of MBC mortars were subjected to
accelerated cyclic curing in seawater by immersing the specimens in seawater for 24 hours
and then dried in oven for 24 hours. Prior to the accelerated cyclic curing specimens were
cured in water for 7 and 28 days. Seawater was collected and stored in a fibre tank and the
specimens were immersed for required time in the tank as per the standard procedures of
the curing the specimens in water. It has been reported in a literature that one cycle of the
accelerated treatment may roughly correspond to immersion in seawater for 50 to 60 days
(Nishibiyashi et al., 1990). To investigate the acid attack the specimens were initially
cured in water for 7 and 28 days and then immersed in distilled water containing 5%
solution of Hydrochloric acid (HCl) till the specific age, a total period of 600 hours of
immersion. However, to determine the carbonation, the cube specimens were cured in
water, air, natural weather, and the sea water for 7, 28 and 90 days.
3.7 Testing Procedures
The laboratory experimental programme was carried out stage wise as mentioned in
Section 3.2. The testing methods and procedures adopted are as per the standard
procedures reported in the codes and literatures. Details of the testing procedures are
described as follows:
3.7.1 Stage 1: Water requirements test on mortar
Flow table in compliance with the specifications of ASTM C230-90 (1990) was
used to determine the w/b ratio of the entire mixes. The test was conducted in accordance
with the procedure described in ASTM C 109-92 (1992). The flow is defined as the
resulting increase in the base diameter of a mortar mass expressed as a percentage of the
original base diameter after being vibrated on a flow table. The flow value of the mortar
specimens is maintained at 105-115% that is to be considered as the application for MBC

61
mortar as the face sheet of Aerated lightweight concrete block. The MBC mortar is
designed in such way, which is it can be stick or plastered on the aerated block. The
constant flow of the mortar paste will be produced varies wbr for each mortars. Figure
3.12 shows the flow table.
As per procedure of the test, mortar mix is filled in the standard mould placed on
the base plate of the flow table in 2 layers. Each layer was compacted with a 25mm
diameter mild steel bar by adopting 20 numbers of blows. The tamping pressure should be
just sufficient to ensure uniform filling of the mould. Then after, the mould was removed
and the flow table was vibrated by dropping it from standard height of 12.5mm at the rate
of 25 drops in 15 seconds. Finally, the resulted increase in the base diameter of mortar mix
was measured and divided by the original diameter to obtain the flow value. The test
procedure was repeated for three times for each mortar mix to obtain the average value.
3.7.2 Stage 2: Establishment of sand and binders ratio (s/b)
Only compressive strength test was carried during this stage of the test programme.
Initially four mix proportions 1:1, 2:1, 2.5:1 and 3:1(sand: binder) were considered. The
details of the mix proportions are given in Table 3.8a, 3.8b and 3.9. Cube specimens of
standard size70.6mmx70.6mmx70.6mm were cast and tested at 7 and 28 days to determine
the compressive strength. The specimens were cured in water up to the testing age. The
compressive strength test was carried as per the test procedure detailed in BS 1881 Part
116 (1983). TONIPAC 3000 testing machine of 3000kN loading capacity, available in the
structures and materials laboratory, Faculty of Civil Engineering at UTM was used to
conduct the compressive strength test. Figure 3.13 depicts the testing of a cube specimen.
The specimens were wiped to a surface-dry condition upon removal from the curing tank
just before the test. The specimens were loaded gradually without shock and the loading
rate was set at a constant rate of 0.1 N/(mm2)s until ultimate failure of the specimen. The
ultimate failure load was recorded and the compressive strength was calculated
accordingly.
3.7.3 Stage 3: Establishment of the optimum series of mix proportion of MBC
mortar by using the optimum sand and binder’s ratio.
In order to establish the optimum mix proportion of MBC mortars, three tests were
conducted during this stage of the study. The three tests conducted were compressive
strength test, porosity test, and water absorption test. The details of the procedures are
given below.

62
a) Compressive strength test
Cube specimens of standard size (70x70x70mm) were casted and tested as per the
procedure described earlier in section 3.7.2.
b) Porosity test
The objective of this test was to determine the effect of the blending constituents on
the total porosity compared to that of the OPC and BBC mortars. The low value of the
total porosity would imply the potential high durability and high density of the mortars.
The porosity is generally measured with Mercury Intrusion Porosity and the Nitrogen
absorption equipments. However, for this research the test was performed using Vacuum
Saturation method. The testing procedure adopted in this study is similar to the one used
by Vanisha (2003). Figure 3.14 shows the photograph of the equipment used. The cube
specimens of standard size 50x50x50mm (as in Figure 3.15) cut from 100x100x100mm
cubes and tested at their ages of 7, 28, 60 and 90 days after curing accordingly. The
specimens for this stage of study were cured in water. The stepwise testing procedure is
described below.
1. The specimens at their specific age were removed from the curing tank and dried in
oven for 24 hours by maintaining the temperature at 105°C.
2. The specimens were removed from oven and put in vacuum flask (Desiccator) and
closed tightly to avoid the specimens from absorbing air and moisture. The specimens
were left to cool in the vacuum flask for 24 hours as in Figure 3.16.
3. Then after the vacuum pump is set on to suck the entire air from the flask and the
specimens. This process was continued for 3 hours.
4. The vacuum pump was then switched off and distilled water channel was opened
directly to the vacuum flask until the specimens were totally immersed in the water with
water level 10mm over the top of the specimen. Subsequently the vacuum pump was
restarted to suck the air inside (if any) in order to achieve complete saturation of the
specimens for 3 hours, meanwhile the specimens remained submerged in the water.
5. Again the vacuum pump was switched off followed by the opening the air channel
so that the pressure in the vacuum flask was in equilibrium with the atmospheric pressure
and the specimens were left submerged in water for further 24 hours. This was to ensure
that the specimens were saturated with the distilled water.
63
6. After 24 hours, the specimens were removed from the flask and weighed by placing
in the water (Wsw) and air with surface condition (Wssd). The weight of the specimens
were recorded carefully.
7. Finally the specimens were dried in oven at a temperature of 105°C for 24 hours in
order to ensure complete drying. The completely dry specimens were weighed to
determine the dry weight (Wd) followed by the calculation of the percentage of total
porosity using following formula:
PT = Wssd - Wd x 100% (3.1)
Wssd – Wsw
Where,
PT = percentage of total porosity
Wd = weight of dry specimen
Wsw = weight of specimen in water
Wssd = weight of saturated specimen in air
c) Water absorption test
The objective of this test was to determine the percentage of water absorbed into
the interconnectivity capillary pores in mortar pore structure, This test was conducted as
per the specifications of BS 1881: Part 122 (1983). This test method is known as ‘water
immersion method’. The size of cube specimens used was 70x70x70mm. The test was
carried on three specimens to achieve average value, taken from each mix and cured in
water for 7, 28, 60 and 90 days; the age of the testing. Figure 3.17 depicts the pictorial
view of the specimens immersed in water. Accordance to Concrete Society Technical
Report No. 31 (1988), the typical values of the water absorption of concretes rating the
type of concrete cured in water and tested at 28 days as per the recommendations and test
procedures of BS 1881 BS 1881: Part 122 (1983), are defined as:
Low absorption concrete < 3%
Average absorption concrete 3 – 4%
High absorption concrete > 4%
The stepwise testing procedure is as follows:

64
1. The specimens were taken out from the curing tank at their specific age of testing
and weighed to record the initial weight. Then the specimens were dried in oven at a
temperature of 105°C for 72 ±2 hours.
2. Then after the specimens were placed in a an airtight desiccator for 24 ± 0.5 hours in
order to cool the specimens followed by weighing the specimen to determine dry weight
(Wd).
3. Immediately after weighing, the specimens were immersed in a water tank with a
water level 30 ± 5 mm above the top of the immersed specimens. The specimen were left
immersed for 30 ± 0.5 min before their removal from the tank. The surface of the
specimens was wiped with clean cloth and were weighed again to obtain the wet weight
(Ww) of the specimens.
4. The percentage of water absorption (WA) is calculated as follow:
WA = Ww-Wd x 100% (3.2)
Wd
Where,
WA= percentage of water absorption
Wd = weight of dry sample
Ww = weight of wet sample
3.7.4 Stage 4: Assessment on the strength properties of the optimum MBC mortar
at different curing regimes
This phase of study was conducted to investigate the effect of the curing regimes at
various ages on the strength properties of MBC mortars. Cube specimens of the standard
size (70x70x70mm) were cast and cured under different curing regimes as mentioned
before. For wet-dry cyclic curing in seawater, the number of cycles was fixed at 15, 30 and
45 cycle. The specimens were tested for compressive strength at their appropriate age of
testing as per the procedure described earlier in section 3.7.2. Three specimens in each
case were tested to obtain the average value.
3.7.5 Stage 5: Assessment on the durability properties of the optimum MBC mortar
Durability of mortars is considered to be related to porosity and permeability
characteristics. Chemical attack occurs mainly through the action of aggressive ions, such

65
as chlorides, sulfates, carbon dioxide, and sometimes because of industrial liquids and
gases as well. The movement of water in concrete and mortar takes place not only by flow
through the pores of the concrete and mortar but also by diffusion and adsorption.
However, it depends on the interconnectivity of the pores within the concrete and mortar
mass. Two types of tests namely carbonation test and acid attack test, were conducted
during this phase of the study to examine the durability of the MBC mortars. The
procedures of the test conducted is described below:
a) Carbonation test
Carbonation attack is assessed in terms of depth of carbonation in mortars. The test
was performed as per the procedure recommended by RILEM (RILEM Committee CPC-
18). The depth of carbonation is easily visualised in mortar by spraying a solution of
phenolphthalein in alcohol and water on the fresh surface obtained by breaking the
specimen in two parts. This solution is preferred to be used due to its alkalinity and
colourless regions.
After spaying the solution, the surface being sprayed changes in colour to purple.
The depth of carbonation could simply be measured by observing the area which has
changed in colour. When the alkalinity of the concrete/mortar is unaffected, a purple
colour is observed. But, the surface which is colourless or its colour is not changed, is
considered to be affected by carbonation. The depth of colourless area hence indicates the
depth of the carbonation occurred in mortar. According to RILEM, the carbonation process
can only occur at about 2 mm to 3 mm depth when solution is sprayed over the surface of
broken specimen.
b) Acid attack
The test for resistance to acid attack of mortar cube specimens was carried out by
measuring the loss of weight of the specimens caused by continuously submerged in a 5%
of hydrochloric acid (HCL) solution. The time of submergence depends upon the
percentage of Hydrochloric acid (HCL) solution. The time period to submerge the
specimens in HCL solution to measure the weight loss was fixed at 100, 200, 300, 400, 500
and 600 hours during this study. This was based on the time period considered by Awal
and Hussin (1996b). Concrete and mortar that are highly alkaline is less resistant to attack
by strong acids or compounds that may convert to acids (Neville, 1995).

66
3.7.6 Stage 6: Application of the optimum MBC mortar established in stage 3 as
face sheets of lightweight aerated concrete sandwich block.
a) Introduction
On the basis of the experimental study, one MBC mortar was to be selected which
exhibited high performance in terms of compressive strength, water absorption, porosity,
and the other durability criteria. This MBC mortar may have various applications in
construction industry. However, MBC mortar can also be applied as face sheets to produce
lightweight sandwich element by having lightweight and medium strength and low density
material like aerated concrete as core material. The attempt has been made in limited
extent to investigate the suitability of the MBC mortar selected as optimum mix to produce
lightweight sandwich masonry block in terms of compressive strength, failure mode and
the apparent composite behaviour.
One of the applications of MBC mortar is its use as materials for low water
absorption. The aerated lightweight concrete is a high porosity concrete due to its foamed
and porous nature. The optimum MBC mortar showed only 2-3% water absorption, while
the aerated lightweight concrete exhibits values in the ranges of 16-20% depending upon
its density. Hence it is expected that the overall water absorption of the block could be
decreased significantly if this MBC mortar is adopted as face sheets separated by thick
layer of lightweight aerated concrete as core to produce lightweight sandwich block. The
enhancement in the overall strength of sandwich block is also expected compared to the
block solely made of aerated concrete.
To check the suitability of the MBC mortar mix developed as the face sheets
sandwiched with aerated lightweight concrete to produce a lightweight sandwich block in
terms of compressive strength is also part and the last phase of this experimental study.
The significance of the production of this sandwich block is a step towards the
development of precast lightweight sandwich structural panels with sustainable
performance to industrialize the building system in Malaysia.
b) Lightweight masonry sandwich
Lightweight masonry sandwich block was produced by using two 10mm ± 2mm
(thick) layer of the optimum MBC mortar mix as external skin layer and 75± 1mm (thick)
of Aerated lightweight concrete layer as core which can be referred in Table 3.10. The
total thickness of the block is 100mm. However, the aerated concrete design is not part of
this study. Nevertheless the mix design was established with slight modifications made in

67
the aerated concrete produced by previous researchers at UTM (Noor et al. 2006; and
Areshvinna, 2002).
c) Casting of core (Aerated concrete)
Six constituents namely sand, cement, slag, water, aluminium powder and
superplasticizer were used to produce core. The specifications of cement, slag, water and
superplasticizer are the same as described for the preparation of the mortars. However, the
sand passing from 600µm sieve was used as fine sand and aluminium powder was added as
the aerating agent to produce aerated concrete. The specifications and the chemical
composition of the aluminium powder are presented in Table 3.11.
Cement, slag, sand, aluminium powder, and superplasticizer were weighed and
mixed for approximately 2 minutes until all the materials were mixed uniformly followed
by the addition of water and further mixing of the mix constituents for 2 minutes. Upon
achieving consistent flow, the mix was poured into the mould immediately before the
reaction of aluminium powder with cement started to expand the volume. Wooden mould
was used with inner sides covered by aluminium sheets in order to avoid water absorption
by the wood surface. The mix of aerated concrete was prepared and poured in the mould
up to 80% of its volume and trimmed after 3 hours when expansion was completed and the
core has hardened enough to be trimmed. The specimens were demoulded after 24 hours
and were ready to apply face sheets to produce sandwich blocks. The Aerated mix design
is as in Table 3.12.
d) Casting of sandwich block
The size and dimension of the block was based on the typical size of non-load
bearing wall including the clear spacing for the services area. Immediately after
demoulding of the aerated concrete core, one side of the core was plastered with MBC
mortar mix while the other side was plastered on the next day. Approximately after one
hour of the casting of each layer, specimen was covered with wet gunny and plastic sheet
to conserve humidity for 24 hours. The sandwich blocks were then cured in water for 14
days and subsequently cured in air up to 28 days; the age of the testing. Figure 3.18 show
the mould used. Whilst Figure 3.19 presents the sandwich block produced.
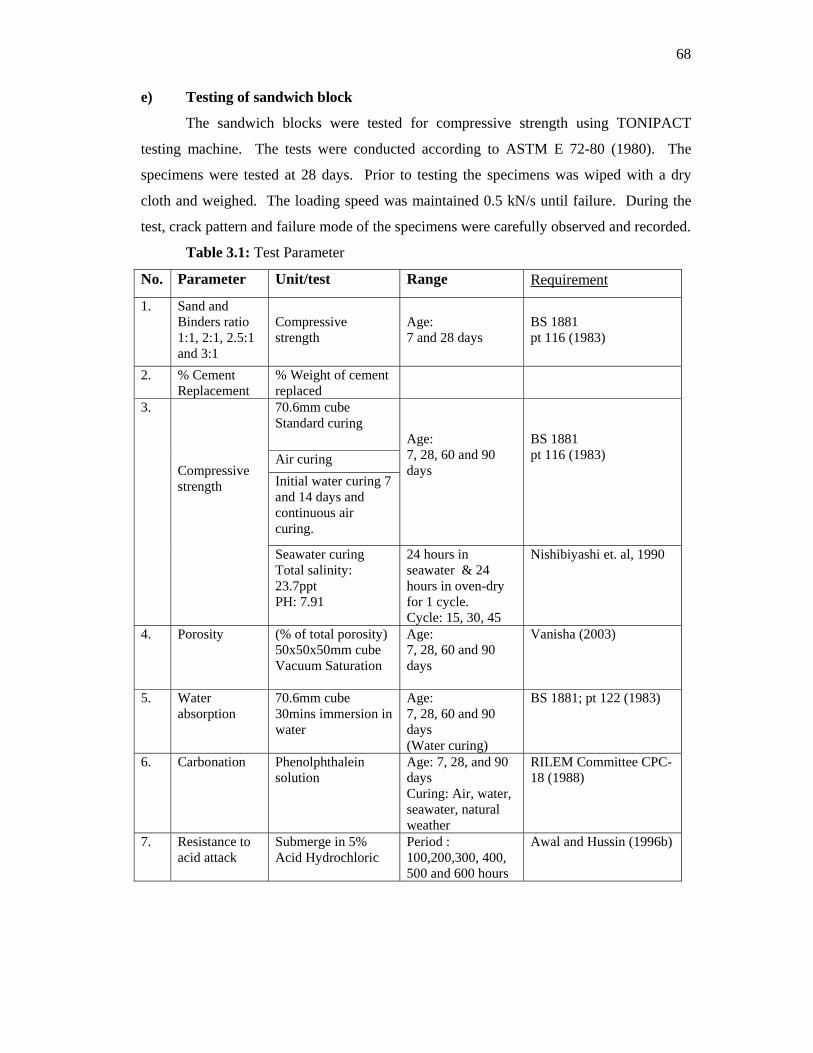
68
e) Testing of sandwich block
The sandwich blocks were tested for compressive strength using TONIPACT
testing machine. The tests were conducted according to ASTM E 72-80 (1980). The
specimens were tested at 28 days. Prior to testing the specimens was wiped with a dry
cloth and weighed. The loading speed was maintained 0.5 kN/s until failure. During the
test, crack pattern and failure mode of the specimens were carefully observed and recorded.
Table 3.1: Test Parameter
No. Parameter Unit/test Range Requirement
1. Sand and Binders ratio 1:1, 2:1, 2.5:1 and 3:1
Compressive strength
Age: 7 and 28 days
BS 1881 pt 116 (1983)
2. % Cement Replacement
% Weight of cement replaced
70.6mm cube Standard curing
Air curing Initial water curing 7 and 14 days and continuous air curing.
Age: 7, 28, 60 and 90 days
BS 1881 pt 116 (1983)
3. Compressive strength
Seawater curing Total salinity: 23.7ppt PH: 7.91
24 hours in seawater & 24 hours in oven-dry for 1 cycle. Cycle: 15, 30, 45
Nishibiyashi et. al, 1990
4. Porosity (% of total porosity) 50x50x50mm cube Vacuum Saturation
Age: 7, 28, 60 and 90 days
Vanisha (2003)
5. Water absorption
70.6mm cube 30mins immersion in water
Age: 7, 28, 60 and 90 days (Water curing)
BS 1881; pt 122 (1983)
6. Carbonation Phenolphthalein solution
Age: 7, 28, and 90 days Curing: Air, water, seawater, natural weather
RILEM Committee CPC-18 (1988)
7. Resistance to acid attack
Submerge in 5% Acid Hydrochloric
Period : 100,200,300, 400, 500 and 600 hours
Awal and Hussin (1996b)

69
Table 3.2 : Category of tests
Category Test
Engineering properties Compressive strength
Pore structure characteristics Porosity (Vacuum Saturation)
Chemical characteristics Carbonation
Table 3.3 : Chemical and physical properties
Chemical constituents
OPC
(%)
PFA
(%)
SLAG
(%)
RHA
(%)
POFA
(%)
Requirements of
ASTM C 618-84
Class F Silicon dioxide (SiO2) 20.1 91.2 28.2 97.5 91.1
Aluminium oxide 4.9 5.84 10.0 0.02 0.73
Ferric oxide (Fe2O3) 2.5 0.76 1.8 0.13 1.18
(SiO2 +Al2O3 + Fe2O3) 27.5 97.8 97.7 93.0 70
Calcium oxide (CaO) 65 0.34 50.4 0.18 1.66
Magnesium oxide 3.1 4.6
Sulphur oxide (SO3) 2.3 0.35 2.2 0.49 1.11 5.0
Sodium oxide (Na2O) 0.2 0.24 0.1 0.1 0.16
Potassium oxide (K2O) 0.4 1.21 0.6 1.39 3.47
Titanium oxide (TiO2) 0.2 -
Phosphorous oxide <0.9 -
Loss on ignition (LOI) 2.4 0.2 6.0
Physical properties
Fineness:
Pozzolanic activity index - with OPC, min % - with lime, 7D (kPa-min)
- -
- -
- -
- -
75.0 5500
Water requirement Max % of control
-
105
Specific Gravity 3.2 1.18 1.30 0.90 1.18 5.0

70
Table 3.4: The references used to determine the % of fineness of RHA Reference % Fineness passing 45micron
ASTM C618 – 84, 1984 66BS 3892, 1982 87.5Zahairi Abu, 1990 94 – 95Islam, 1981 85Smith and Freda, 1979 90
Table 3.5 : The time grinding and the % of RHA fineness
Weight of ash: 2kg
Sieve: 45 micron (No. 325)
Grinding Media : 15 numbers of mild steel bars in LAAT machine
Table 3.6 : The time grinding and the % of POFA fineness
Weight of ash : 2kg
Sieve : 45 micron (No. 325)
Grinding Media : 15 numbers of mild steel bars in LAAT machine
Time grinding, hr % Retained % Passing
0 98 21.0 46 541.5 28 722.0 12 882.5 6 943.0 5.6 94.4
Table 3.7 : The summary and comparison of % of ashes fineness
Materials % Retained 45 micron % Passing 45 micron
OPC 30 70SLAG 6 94PFA 8 92RHA 4 96POFA 6 94
Time grinding, hr % Retained % Passing
0 88 121.0 12 881.5 4 962.0 1.1 98.92.5 0.7 99.3

71
Table 3.8: Series of mix proportion a) BBC mortar
Series OPC
(%)
(%)
Replacement
wbr SP
(%)
SLAG 50 50 0.53PFA 70 30 0.43RHA 80 20 0.52POFA 90 10 0.51
0.1
b) MBC mortar Mix OPC
(%)
SLAG
(%)
PFA
(%)
RHA
(%)
POFA
(%)
wbr Sp
(%)
MA 50 20 5 20 5 0.54MB 50 20 10 15 5 0.49MC 50 20 15 10 5 0.48MD 50 20 20 5 5 0.46
0.1
Table 3.9 : Sand and Binders contents for 1m3
Mix ratio
BindersKg/m3
Sand
Kg/m3
1:1 1100 11002:1 700 1400
2.5:1 600 15003:1 525 1575
Table 3.10 : Specification of the Sandwich Block
Size 400 x 200 x 100 mm
Thickness for Aerated lightweight concrete
75± 1mm
Thickness for MBC mortar 10 ± 2mm
Table 3.11: Specification of the Aluminium powder
Specification No. 300
Colour SilverParticle size Mesh 220Chemical composition (%)
Aluminium Min 99.3Copper Max 0.1Iron Max 0.4Silica Max 0.2

72
Table 3.12: Aerated lightweight concrete mix design
Density 1000 – 1100 kg/m3
Cement: Sand 50:50 Slag replacement 50% Aluminium Powder 0.1% Superplasticizer 0.55% Water of dry-mix 0.23

73
Figure 3.1: The flow of test program
Establishment of Sand and Binders ratio
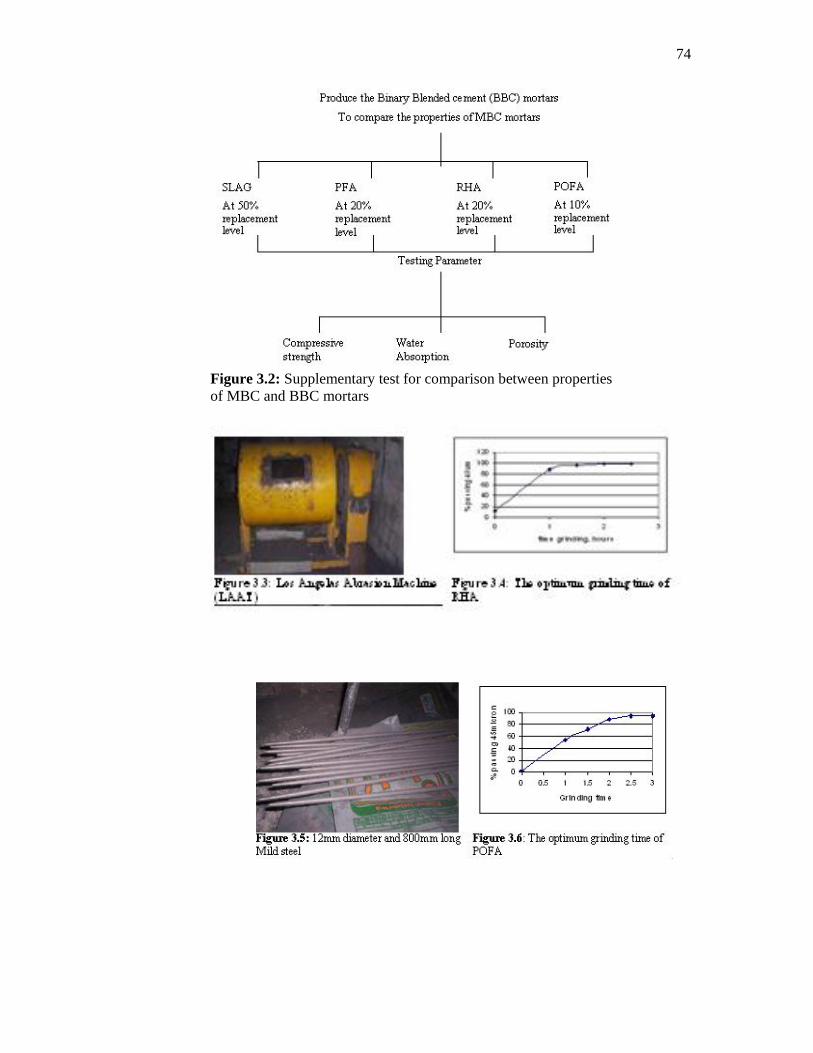
74
Figure 3.2: Supplementary test for comparison between properties of MBC and BBC mortars

75
SIEVE ANALYSIS FOR FINE AGGREGATE
0102030405060708090
100
0.1 1 10Sieve size (mm)
Pass
ed P
erce
ntag
e (%
)
fine aggregate fine aggregate envelope
Figure 3.7: Sieve analysis
Figure 3.8: Materials used
OPC
SLAG
RHA
POFA PFA
Sp

76
Figure 3.19: Sandwich Block

77
CHAPTER 4
RESULTS AND DISSCUSIONS OF THE DEVELOPMENT OF MBC MORTARS
4.1 Introduction
This chapter discusses mainly on the results obtained from tests conducted from
stage 1 to stage 3, which focussed on the development of MBC mortars. Whilst, the
remaining test results from stage 4 to 6 are discussed in Chapter 5. The three stages
discussed here are:
Stage 1 – Water requirement test on mortar.
Stage 2 – Establishment of the optimum sand to binders ratio (s/b).
Stage 3 – Establishment of the optimum series of mix proportion of MBC mortar by
using the optimum sand to binders ratio. The test parameters involved are compressive
strength, water absorption, and porosity.
4.2 Stage 1 - Water requirement test
4.2.1 Effects of wbr on various sand to binders ratio (s/b) of MBC mixes
This section discuses on the trend of water requirement of all MBC mixes whilst section 4.3 concentrates on the discussion of the optimum sand to binders ratio.
Table 4.1 : List of various sand to binders ratio to be investigated
Table 4.2: Series of mix proportion
a) MBC mortar Series OPC
(%)
SLAG
(%)
PFA
(%)
RHA
(%)
POFA
(%)
MA 50 20 5 20 5MB 50 20 10 15 5MC 50 20 15 10 5MD 50 20 20 5 5
Sand to binders ratio
1:1 2:1
2.5:1 3:1
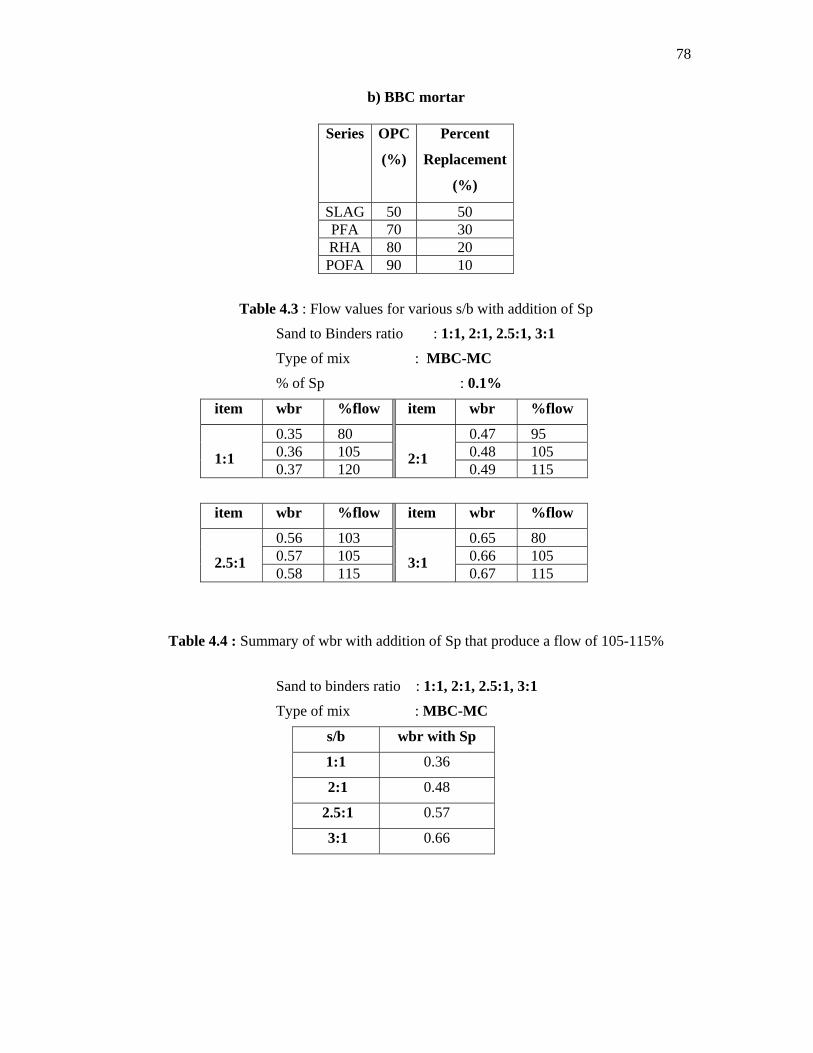
78
b) BBC mortar
Table 4.3 : Flow values for various s/b with addition of Sp
Sand to Binders ratio : 1:1, 2:1, 2.5:1, 3:1
Type of mix : MBC-MC
% of Sp : 0.1%
item wbr %flow item wbr %flow
0.35 80 0.47 950.36 105 0.48 105
1:1 0.37 120
2:1 0.49 115
item wbr %flow item wbr %flow
0.56 103 0.65 800.57 105 0.66 105
2.5:1 0.58 115
3:1 0.67 115
Table 4.4 : Summary of wbr with addition of Sp that produce a flow of 105-115%
Sand to binders ratio : 1:1, 2:1, 2.5:1, 3:1
Type of mix : MBC-MC
s/b wbr with Sp
1:1 0.36
2:1 0.48
2.5:1 0.57
3:1 0.66
Series OPC
(%)
Percent
Replacement
(%)
SLAG 50 50PFA 70 30RHA 80 20POFA 90 10
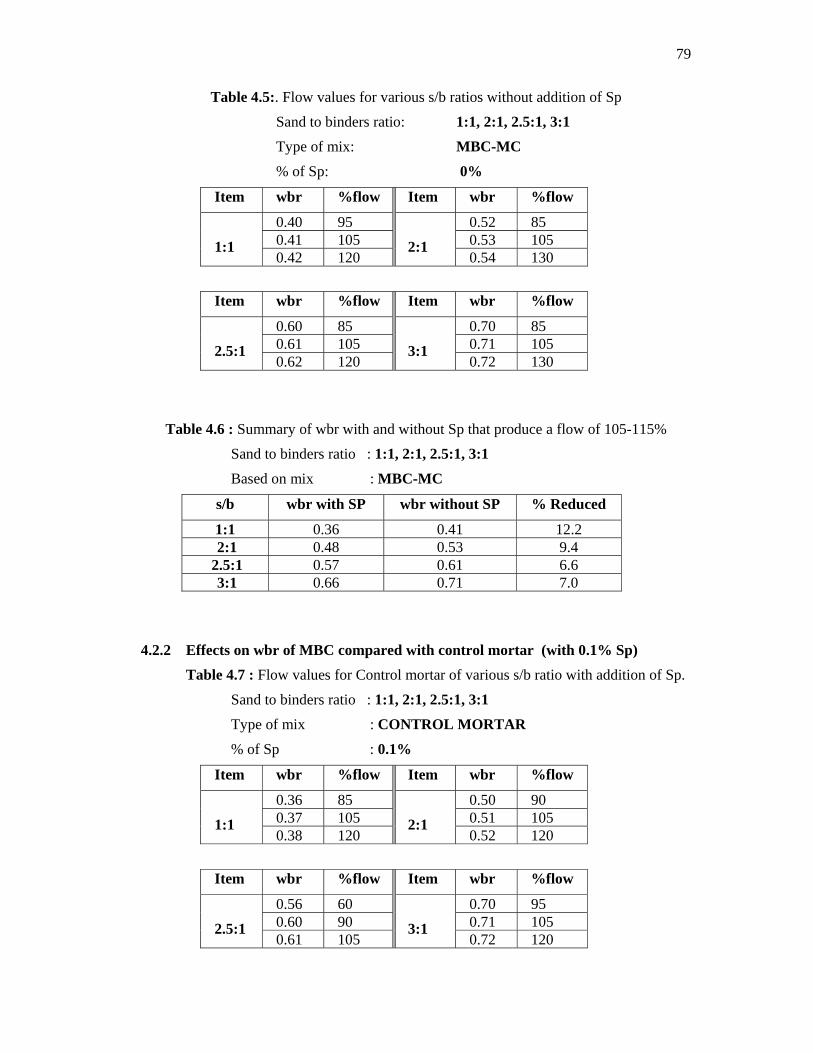
79
Table 4.5:. Flow values for various s/b ratios without addition of Sp
Sand to binders ratio: 1:1, 2:1, 2.5:1, 3:1
Type of mix: MBC-MC
% of Sp: 0%
Item wbr %flow Item wbr %flow
0.40 95 0.52 850.41 105 0.53 105
1:1 0.42 120
2:1 0.54 130
Item wbr %flow Item wbr %flow
0.60 85 0.70 850.61 105 0.71 105
2.5:1 0.62 120
3:1 0.72 130
Table 4.6 : Summary of wbr with and without Sp that produce a flow of 105-115%
Sand to binders ratio : 1:1, 2:1, 2.5:1, 3:1
Based on mix : MBC-MC
s/b wbr with SP wbr without SP % Reduced
1:1 0.36 0.41 12.2 2:1 0.48 0.53 9.4
2.5:1 0.57 0.61 6.6 3:1 0.66 0.71 7.0
4.2.2 Effects on wbr of MBC compared with control mortar (with 0.1% Sp)
Table 4.7 : Flow values for Control mortar of various s/b ratio with addition of Sp.
Sand to binders ratio : 1:1, 2:1, 2.5:1, 3:1
Type of mix : CONTROL MORTAR
% of Sp : 0.1%
Item wbr %flow Item wbr %flow
0.36 85 0.50 900.37 105 0.51 105
1:1 0.38 120
2:1 0.52 120
Item wbr %flow Item wbr %flow
0.56 60 0.70 950.60 90 0.71 105
2.5:1 0.61 105
3:1 0.72 120

80
Table 4.8 : Summary of wbr of MBC-MC mortar compare with Control mortar
Sand to binders ratio : 1:1, 2:1, 2.5:1, 3:1
Type of mix : MBC-MC & Control mortar
% of Sp : 0.1%
s/b wbr of MBC-MC Wbr of Control
1:1 0.36 0.37 2:1 0.48 0.51
2.5:1 0.57 0.61 3:1 0.66 0.71
4.2.3 Effects of wbr on MBC mortar compared to BBC mortar
Table 4.9: Flow values for MBC mortars
Sand to binders ratio : 2:1
Type of mix : MBC
% of Sp : 0.1%
item wbr %flow item wbr %flow
0.52 90 0.48 900.53 105 0.49 105
MA 0.54 125
MB 0.53 125
item wbr %flow item wbr %flow
0.47 95 0.44 800.48 105 0.46 105
MC 0.49 115
MD 0.47 120
Table 4.10 : Summary of wbr for MBC mortars that produce flow of 105-115%
Sand to binders ratio : 2:1
Type of mix : MBC
% of Superplasticizer : 0.1%
MBC wbr
MA 0.54MB 0.49MC 0.48MD 0.46

81
Table 4.11 : Flow values for BBC mortars
Sand to binders ratio : 2:1
Type of mix : BBC
% of Superplasticizer : 0.1%
Item wbr %flow Item wbr %flow
0.52 105 0.48 850.53 120 0.50 105
RHA 0.54 130
POFA 0.52 140
Item wbr %flow Item wbr %flow
0.52 95 0.42 950.53 105 0.43 105
SLAG 0.54 140
PFA 0.44 110
Table 4.12: Summary of wbr for MBC mortars compared to BBC mortars producing flow of 105-115%
Sand to binders ratio : 2:1
Type of mixes : BBC & MBC
% of Sp : 0.1%
Mixes wbr
BBC (PFA) 0.43
MBC (MD) 0.45
MBC (MC) 0.48
MBC (MB) 0.49
BBC (POFA) 0.50
CONTROL 0.51
BBC (RHA) 0.52
BBC (SLAG) 0.53
MBC (MA) 0.53
item wbr %flow
0.50 900.51 105
Control 0.52 120

82
4.3 Stage 2 - Establishment of optimum sand to binders ratio (s/b) in terms of
strength and wbr
Table 4.13: The wbr and the compressive strength of mortar for all s/b at constant flow of 105-115%
Compressive strength (MPa)
Ratio
Binders content (kg/m3)
OPC content
(kg/m3) (50% cement replacement)
wbr
7 days
28 days
1:1 1100 550 0.36 41.3 56.8 2:1 700 350 0.48 30.6 44.7
2.5:1 600 300 0.57 27.0 39.6 3:1 525 262.5 0.66 18.7 28.1
4.4 Stage 3 – Establishment of the optimum mix proportion of MBC mortar in
terms of Strength, Water Absorption and Total Porosity test results by using
the optimum sand to binders ratio (s/b).
During this stage, the optimum mix proportion of MBC mortar was analysed and
selected based on three parameters, mentioned earlier namely the strength development,
total porosity, and water absorption. The properties of MBC mortars in all parameters
studied were also compared with control and BBC mortars. All parameters are discussed
in the following sections.
4.4.1 Strength development
Table 4.14 : The wbr and the compressive strength of mortar without Sp at constant flow of 105-115%
Compressive Strength (MPa)
Mix Wbr 7days 28days 60days 90days
OPC MA MB MC MD RHA POFA PFA SLAG
0.53 0.57 0.54 0.53 0.50 0.55 0.53 0.47 0.57
34.1 19.3 26.7 28.1 28.3 31.3 37.5 33.3 26.1
49.2 38.2 42.7 42.1 46.1 41.3 47.2 50.8 41.1
53.6 48.2 49.2 50.2 54.4 55.3 53.0 63.1 49.7
58.1 56.3 58.8 59.1 60.3 57.1 60.5 68.9
56.5
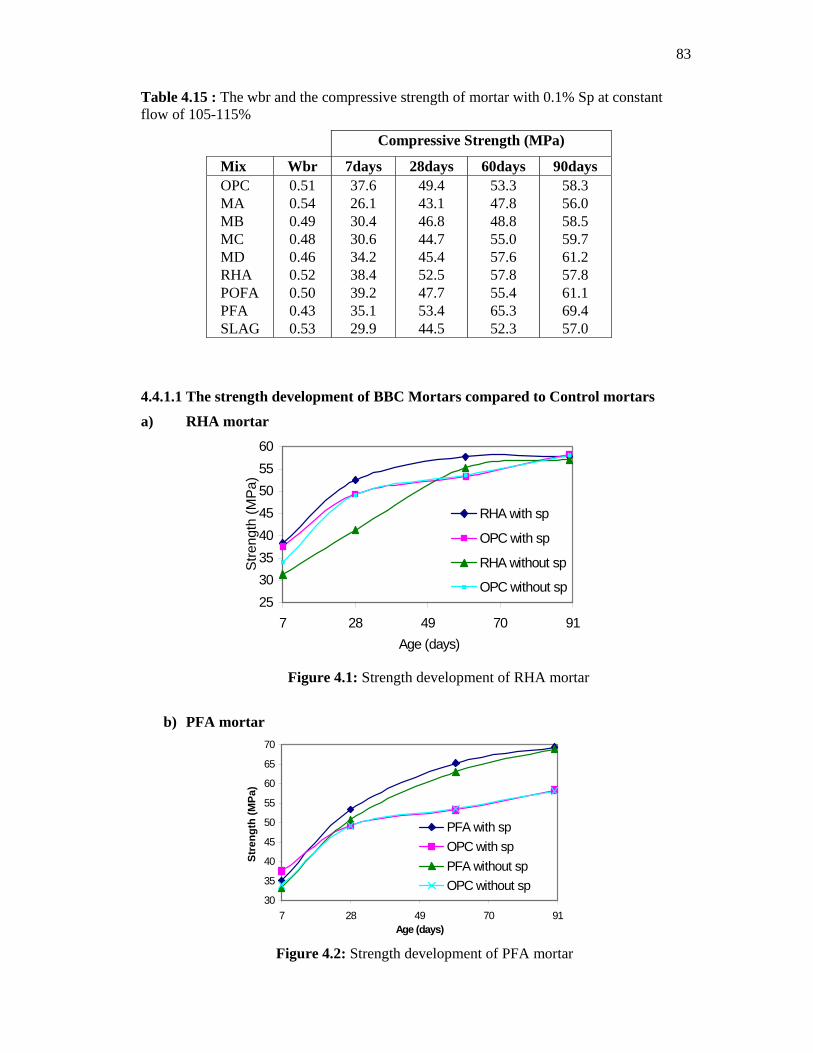
83
Table 4.15 : The wbr and the compressive strength of mortar with 0.1% Sp at constant flow of 105-115%
Compressive Strength (MPa)
Mix Wbr 7days 28days 60days 90days OPC MA MB MC MD RHA POFA PFA SLAG
0.51 0.54 0.49 0.48 0.46 0.52 0.50 0.43 0.53
37.6 26.1 30.4 30.6 34.2 38.4 39.2 35.1 29.9
49.4 43.1 46.8 44.7 45.4 52.5 47.7 53.4 44.5
53.3 47.8 48.8 55.0 57.6 57.8 55.4 65.3 52.3
58.3 56.0 58.5 59.7 61.2 57.8 61.1 69.4 57.0
4.4.1.1 The strength development of BBC Mortars compared to Control mortars
a) RHA mortar
2530354045505560
7 28 49 70 91Age (days)
Stre
ngth
(MP
a)
RHA with sp
OPC with sp
RHA without sp
OPC without sp
Figure 4.1: Strength development of RHA mortar
b) PFA mortar
30
35
40
45
50
55
60
65
70
7 28 49 70 91Age (days)
Stre
ngth
(MPa
)
PFA with spOPC with spPFA without spOPC without sp
Figure 4.2: Strength development of PFA mortar
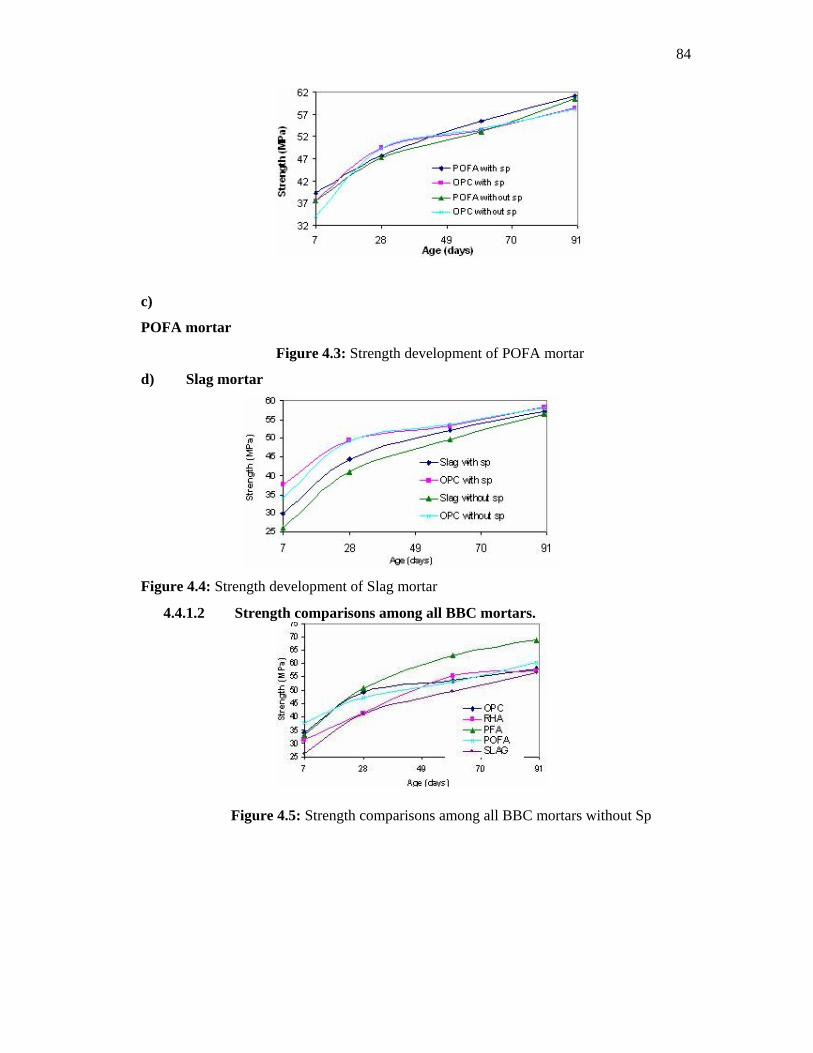
84
c)
POFA mortar
Figure 4.3: Strength development of POFA mortar
d) Slag mortar
Figure 4.4: Strength development of Slag mortar
4.4.1.2 Strength comparisons among all BBC mortars.
Figure 4.5: Strength comparisons among all BBC mortars without Sp

85
Figure 4.6: Strength comparisons among all BBC mortars with Sp
4.4.1.3 Strength development of MBC compared to Control mortar.
a) MA mortar
Figure 4.7: Strength
development of MA mortar
b) MB mortar
Figure 4.8: Strength development of MB mortar

86
c) MC mortar
Figure 4.9: Strength development of MC mortar
d) MD mortar
Figure 4.10: Strength development of MD mortar
4.4.1.4 Strength comparisons among all MBC mortars.
Figure 4.11: Strength of MBC mortars with different wbr

87
Figure 4.12: Strength comparisons among all MBC mortars without Sp
Figure 4.13: Strength comparisons among all MBC mortars with Sp
Figure 4.14: Total porosity of MBC mortars with different wbr
4.4.1.5 Strength comparisons between Control, MBC, and BBC mortars.

88
Figure 4.16: Strength comparisons between Control, MA and BBC mortars with Sp
Figure 4.17: Strength comparisons between Control, MB and BBC mortars without Sp Figure 4.18: Strength comparisons between Control, MB and BBC mortars with Sp
Figure 4.15: Strength comparisons between Control, MA and BBC mortars without Sp
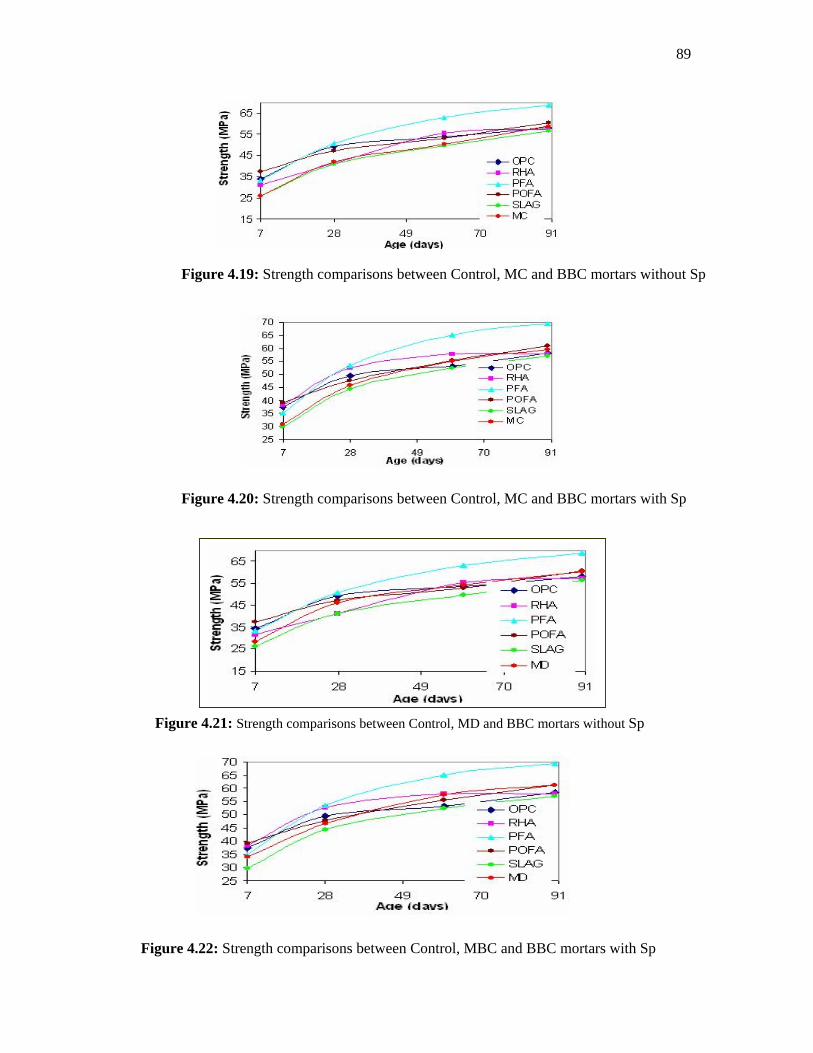
89
Figure 4.19: Strength comparisons between Control, MC and BBC mortars without Sp
Figure 4.20: Strength comparisons between Control, MC and BBC mortars with Sp
Figure 4.21: Strength comparisons between Control, MD and BBC mortars without Sp
Figure 4.22: Strength comparisons between Control, MBC and BBC mortars with Sp

90
Figure 4.23a: Strength comparisons of all mortars at 90 days (generally)
Figure 4.23b: Strength comparisons of all mortars at 90 days (precisely)
4.4.1.6 Conclusions
This section concludes the performance of mortar mixes on the strength
development. From the findings, it can be concluded that there are many factors
influencing the strength development of MBC mortars. For the MBC mortar series, it is
observed that at the fixed content of Slag and POFA, it seems that the reduction in wbr
positively influenced the strength development of MBC mortars. Where as, if seen in the
overall performance that is in all systems, the strength of MBC mortars were also
influenced by the low reactivity of Slag, and RHA and also enhanced by the physical and
chemical characteristics of PFA in the multi-blended mixes.
The strength of BBC mortars significantly depends on the degree of hydration and
its chemical properties. The strength values of MBC mortars were lower than Control and
BBC mortars at early ages of hydration. PFA mortar showed the highest strength value
after 28 days. Whilst, MD and POFA also produced the highest strength besides PFA
compared to the rest of mortars. MA, and Slag mortars exhibited the lowest strength
values at final ages.
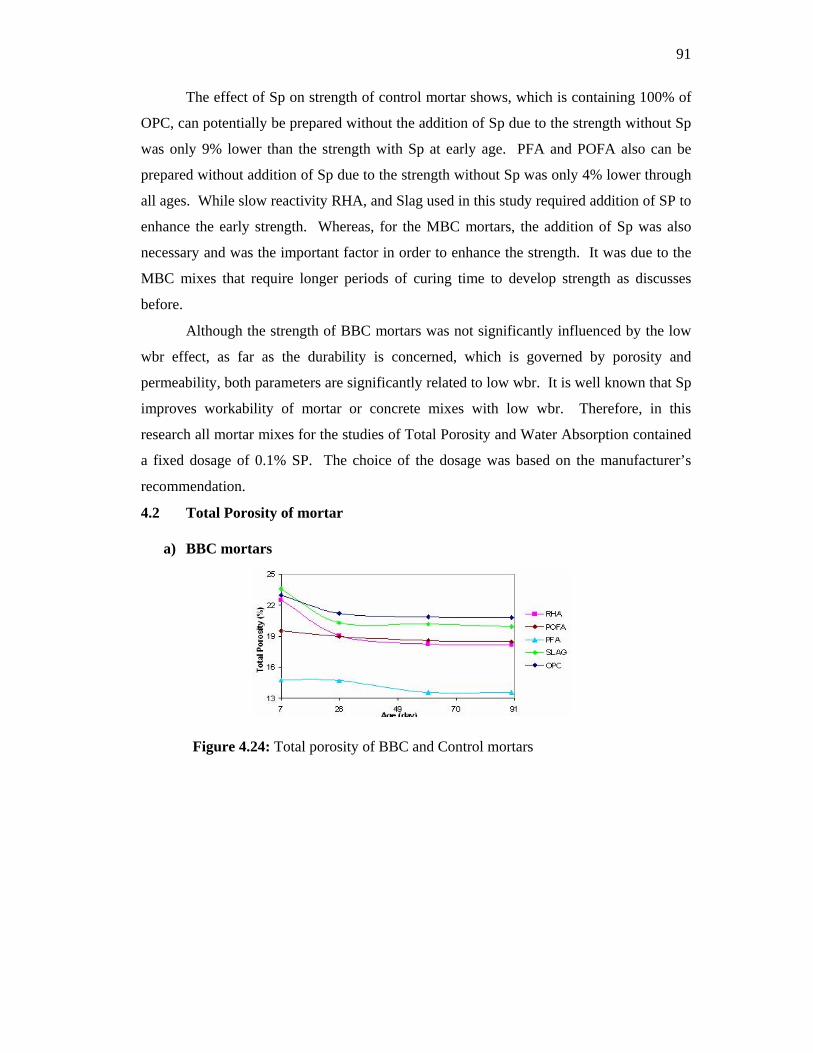
91
The effect of Sp on strength of control mortar shows, which is containing 100% of
OPC, can potentially be prepared without the addition of Sp due to the strength without Sp
was only 9% lower than the strength with Sp at early age. PFA and POFA also can be
prepared without addition of Sp due to the strength without Sp was only 4% lower through
all ages. While slow reactivity RHA, and Slag used in this study required addition of SP to
enhance the early strength. Whereas, for the MBC mortars, the addition of Sp was also
necessary and was the important factor in order to enhance the strength. It was due to the
MBC mixes that require longer periods of curing time to develop strength as discusses
before.
Although the strength of BBC mortars was not significantly influenced by the low
wbr effect, as far as the durability is concerned, which is governed by porosity and
permeability, both parameters are significantly related to low wbr. It is well known that Sp
improves workability of mortar or concrete mixes with low wbr. Therefore, in this
research all mortar mixes for the studies of Total Porosity and Water Absorption contained
a fixed dosage of 0.1% SP. The choice of the dosage was based on the manufacturer’s
recommendation.
4.2 Total Porosity of mortar
a) BBC mortars
Figure 4.24: Total porosity of BBC and Control mortars

92
b) MBC mortars
Figure 4.25: Total porosity of MBC and Control mortars Figure 4.26: Influences of PFA and RHA in porosity of MBC mortars
From the test results it can be deduced that the total porosity of MA and MB was
affected by the physical properties of RHA. While MC and MD was affected by the
physical properties of PFA.
c) Control, MBC and BBC mortars
Figure 4.27: Porosity of MA, Control and BBC mortars
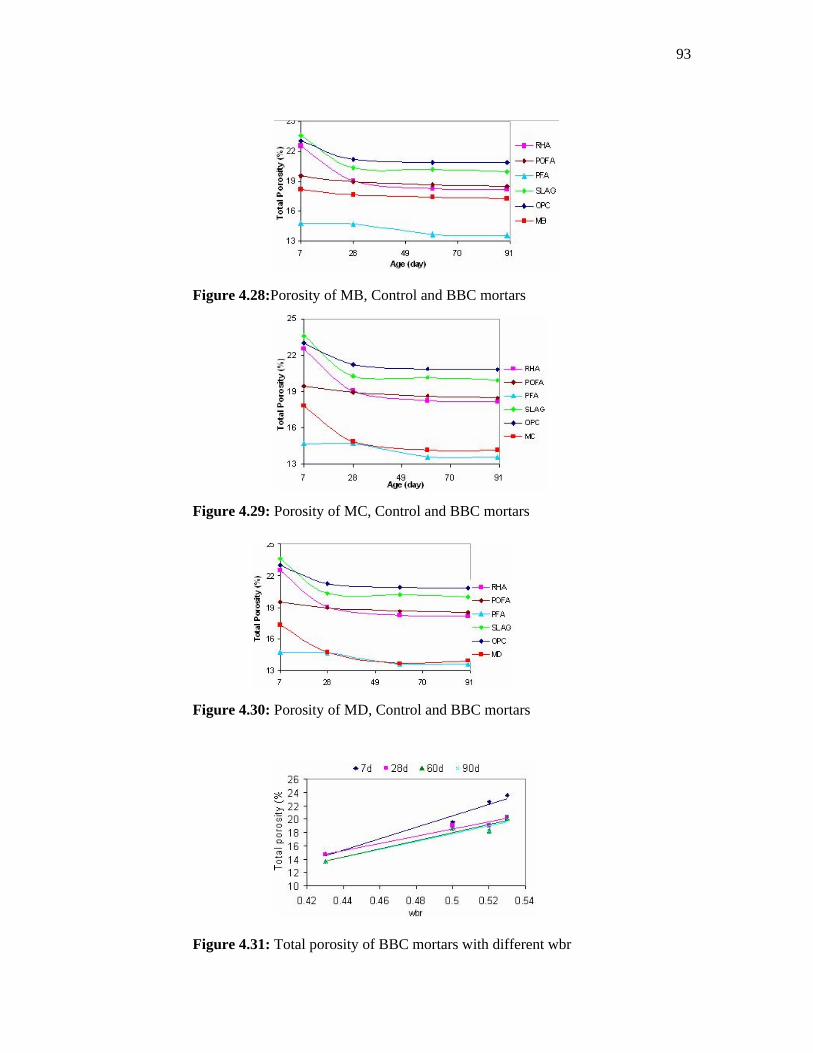
93
Figure 4.28:Porosity of MB, Control and BBC mortars Figure 4.29: Porosity of MC, Control and BBC mortars
Figure 4.30: Porosity of MD, Control and BBC mortars
Figure 4.31: Total porosity of BBC mortars with different wbr

94
Figure 4.32: Total porosity of MBC mortars with different wbr
Figure 4.33: Strength of BBC mortars with different wbr
Figure 4.34: Percentage of reduction in porosity by age
Figure 4.35: Percentage reduction in porosity between 7 and 90 days

95
It can be concluded that the low wbr content of MBC mortars produced
considerably lower porosity beside PFA mortars, whilst control, Slag, POFA and RHA
mortars (highest wbr) show the highest porosity mortars. It does indicate that the lower
content of wbr significantly governed the porosity in hardened mortar. As the wbr
increases, the total porosity also increases.
4.4.3 Water absorption test results Water mobility in hardened mortar and concrete is governed by capillary pore. In
other words water can flow and be absorbed more easily through the volume of large pores
or capillary pores and the continuity of microstructural than through the much smaller
pores. Detailed results are as follows:
a) BBC mortars
Figure 4.36: Water absorption of BBC and Control mortars
Figure 4.37: Water absorption of BBC mortars with different wbr b) MBC mortars

96
Figure 4.38: Water absorption of MBC mortars with different wbr
Figure 4.39: Water absorption of MBC and Control mortars c) Control, MBC and BBC mortars
Figure 4.40: Water absorption of Control, BBC and MA mortars
Figure 4.41: Water absorption of Control

97
Figure 4.42: Water absorption of Control
Figure 4.43: Water absorption of Control
The low wbr effect was observed to contribute great influence to produce lower
water absorption. It was proven by the results of MBC mortars that produced low
absorption beside PFA mortar than the rest of BBC and control mortars.
4.4.4 Strength and Total porosity relationship
a) BBC mortars
Figure 4.44 : The Relationship Between Compressive Strength and Total Porosity of Control OPC and BBC mortars

98
b) MBC mortars
Figure 4.45: The Relationship Between Compressive Strength and Total Porosity of Control OPC and MBC mortars
4.4.5 The relationships between compressive strength and water absorption
a) BBC mortars
Figure 4.46: The Relationship Between Compressive Strength and Water Absorption of Control OPC and BBC mortars
b) MBC mortars
Figure 4.47: The Relationship Between Compressive Strength and Water Absorption of Control OPC and MBC mortars

99
4.4.6 Relationships between total porosity and water absorption
a) BBC mortars
Figure 4.48: The Relationship Between Water Absorption and Total Porosity of Control OPC and BBC mortars
b) MBC mortars
Figure 4.49: The Relationship Between Water Absorption and Total Porosity of Control OPC and MBC mortars
4.4.7 X-Ray Diffraction analyses (XRD)
All samples of all the mixes were analysed by the XRD to check the reaction with
calcium hydroxide (CH), where the decreased amount of CH indicates the existence of the
pozzolanic activity. The pozzolanic reaction depends on the CH released by the hydration
reactions of calcium silicates (Isaia et al., 2003). Nevertheless, the analysis was in terms of
qualitative not quantitative values. The analysis was based on the intensity of the peak
corresponding to CH in the samples. Figures 4.50 and 4.51, illustrate the XRD patterns of
the control, BBC and MBC pastes which were hydrated for 90 days with water curing.
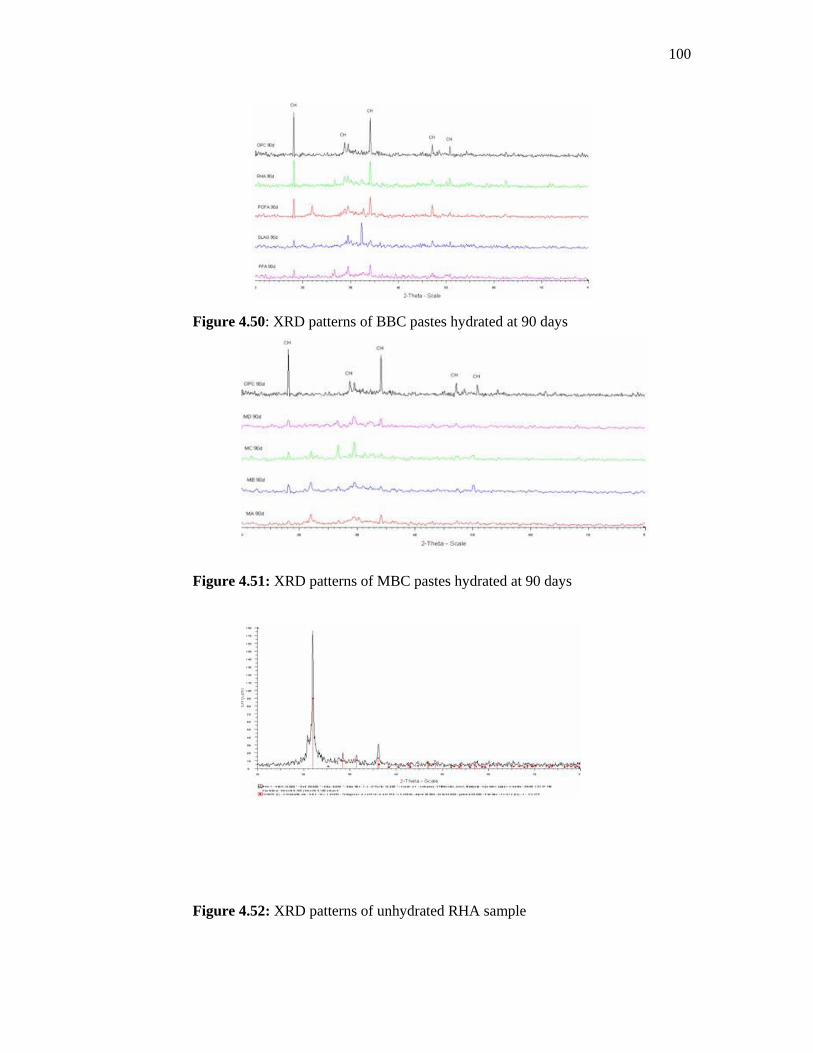
100
Figure 4.50: XRD patterns of BBC pastes hydrated at 90 days Figure 4.51: XRD patterns of MBC pastes hydrated at 90 days
Figure 4.52: XRD patterns of unhydrated RHA sample

101
Figure 4.53: XRD patterns of MD hydrated at 7, 28, 60 and 90 days Figure 4.54: XRD patterns of OPC hydrated at 7, 28, 60 and 90 days
From the XRD patterns of all pastes, it can be deduced that cement containing multi-
blended pozzolanic materials possesses better properties due to its low alkalinity which
also contains less amount of CH rather than binary blended cements mainly POFA and
RHA, as well as cement containing 100% Portland cement. Concrete having high alkalinity
is generally less well resistance to chemical attack. It generally occurs by way of
decomposition of the products of hydration and the formation of new compounds, which
may leach out or disruptive in situ. The CH is the most vulnerable compound being
attacked. The low alkalinity of MBC paste can potentially impedes further reaction of the
chemical ingress with CH. Nonetheless, PFA, and Slag also show low alkalinity because
of the less amount of CH content.

102
4.4.8 Overall performance of MBC mortars to select the optimum mix
a) MA mix
MA mix, which contains higher replacement of RHA produced the highest wbr,
exhibited the lowest strength compared to other MBC mixes through all ages. However,
the strength at final age was comparable with control mortar with only 3% less than the
control. The highest wbr of MA mixes also affected the total porosity in hardened MA
mortar, which produced the highest total porosity compared to the rest of MBC mortars.
However the total porosity of MA mortars was comparable with MB mortars at the final
ages. It was also observed that the total porosity of MA mortars tends to approach RHA
mortars mainly at early ages. MA mortars showed lower porosity than control, RHA,
POFA and Slag at final ages.
MA mix also showed the highest water absorption compared to all MBC mixes at
all ages. It also exhibited the highest absorption compared to BBC mixes mainly after 7
days. The linear correlation between strength and total porosity for MA mixes lie below
the control line. It shows that MA mixes were able to reduce porosity compared to control
even at early ages. The linear correlation between strength and water absorption for MA
mixes was below the control line. However, at final age MA mixes tend to over cross
control mix. MA was identified as high permeability mortar that was proven from the
linear relationship between water absorption and total porosity, which resulted within the
high permeability region. The control mortar could also be placed in the same regions.
Although MA mixes resulted in high permeability mortar, it produced average porosity
mortar at final ages.
b) MB mix
The strength values of MB mixes were higher than MA mixes but were lower than
MD mixes through all ages. The strength values were comparable with MC mixes.
However, the strength at final ages was comparable with control mortar and slightly higher
than Slag and RHA and lower than POFA mortar. The total porosity of MB mortar was
higher than MC, and MD mortars. MB mortars produced lower porosity than MA mortar
but at final ages it was comparable. However, the total porosity was lower than control
and BBC and higher than PFA mortars at all ages. The water absorption of MB mortar
also results in similar trend with total porosity. However the absorption of MB mortars at
final ages was comparable with control, and POFA mortars and higher than Slag, and PFA
mortars.

103
The linear correlation between strength and porosity of MB mixes lie far below
control mortars. It showed that MB mixes were able to reduce porosity compared to
control mortars. The linear correlation between strength and water absorption is also
below than the line of control mortar. However the sample tends to approach the control
mortar at final ages. For the linear correlation between water absorption and porosity at
early ages, the MB samples tend to approach in the outermost part in high permeability
regions. Nevertheless, the samples at final ages resulted in outermost part in low regions.
MB mixes were identified as average permeability with average porosity mortar.
c) MC mix
As mentioned above the strength of MB, and MC mortars is comparable through all
ages. The strength of MC was higher than MA but lower than MD mortar at all ages of
hydration. The strength of MC mortars is comparable with control mortars. Its strength is
higher than RHA, and Slag but lower than POFA, and PFA mortars. The total porosity of
MC mortars tends to approach MD mortars through all ages. However, it was lower than
MA, MB and BBC mortars, and higher than PFA mortar. The absorption of MC mortars
also showed similar trend with MD mortar mainly after 7 days of hydration. It was also
lower than MA, and MB mortars through all ages. The absorption of MC mortars was
lower than control, POFA, and RHA mortars but higher than PFA mortar. It was also
observed that the absorption of MC mortar was slightly lower than Slag mortar at the final
ages.
The linear correlation between strength and porosity of MC mortar slightly
approaches to that of the MD mortar line that was far below the control curve. MC mixes
were able to perform better in terms of reduction of porosity than control mortar even at
early ages. MC mixes also perform in similar trends for the relationship between strength
and absorption. The linear correlation between water absorption and total porosity of MC
mortars was also below control line, which was placed it into the low permeability regions.
However, at early ages it was outside the regions but not in the high permeability regions.
MC mixes were identified as low permeable and low porosity mortar.
d) MD mix
The strength of MD mortars was found to be higher than all MBC mortars through
every age of hydration. The strength showed low early strength than BBC mortars, except
for slag mortar, which improved at final ages, which is higher than control, RHA, and Slag
mortars. The strength was comparable with POFA but lower than PFA mortar at this age.
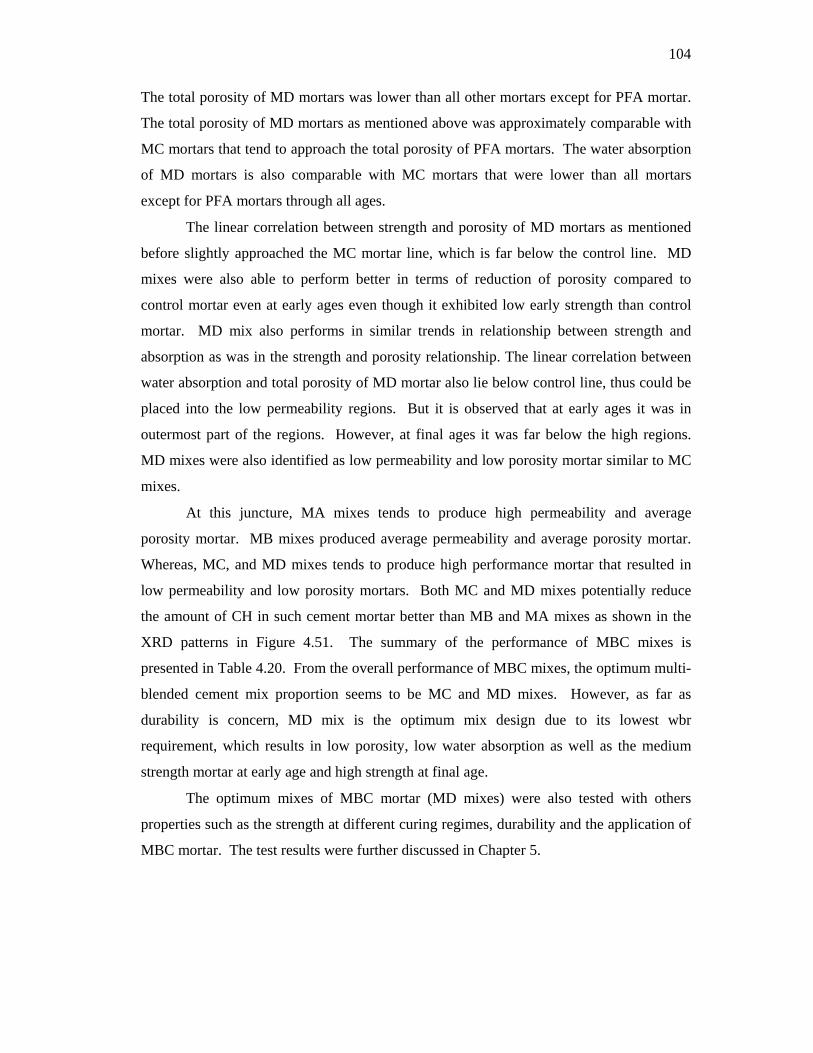
104
The total porosity of MD mortars was lower than all other mortars except for PFA mortar.
The total porosity of MD mortars as mentioned above was approximately comparable with
MC mortars that tend to approach the total porosity of PFA mortars. The water absorption
of MD mortars is also comparable with MC mortars that were lower than all mortars
except for PFA mortars through all ages.
The linear correlation between strength and porosity of MD mortars as mentioned
before slightly approached the MC mortar line, which is far below the control line. MD
mixes were also able to perform better in terms of reduction of porosity compared to
control mortar even at early ages even though it exhibited low early strength than control
mortar. MD mix also performs in similar trends in relationship between strength and
absorption as was in the strength and porosity relationship. The linear correlation between
water absorption and total porosity of MD mortar also lie below control line, thus could be
placed into the low permeability regions. But it is observed that at early ages it was in
outermost part of the regions. However, at final ages it was far below the high regions.
MD mixes were also identified as low permeability and low porosity mortar similar to MC
mixes.
At this juncture, MA mixes tends to produce high permeability and average
porosity mortar. MB mixes produced average permeability and average porosity mortar.
Whereas, MC, and MD mixes tends to produce high performance mortar that resulted in
low permeability and low porosity mortars. Both MC and MD mixes potentially reduce
the amount of CH in such cement mortar better than MB and MA mixes as shown in the
XRD patterns in Figure 4.51. The summary of the performance of MBC mixes is
presented in Table 4.20. From the overall performance of MBC mixes, the optimum multi-
blended cement mix proportion seems to be MC and MD mixes. However, as far as
durability is concern, MD mix is the optimum mix design due to its lowest wbr
requirement, which results in low porosity, low water absorption as well as the medium
strength mortar at early age and high strength at final age.
The optimum mixes of MBC mortar (MD mixes) were also tested with others
properties such as the strength at different curing regimes, durability and the application of
MBC mortar. The test results were further discussed in Chapter 5.

105
CHAPTER 5
RESULTS AND DISCUSSIONS OF THE REMAINING PROPERTIES AND APPLICATION OF THE OPTIMUM MBC MORTAR
5.1 Introduction
This chapter discusses mainly on the results obtained from tests conducted from
stage 4 until stage 6, which focused on the other properties and the application using the
optimum MBC mix. The three stages to be focused in this chapter will be as follows.
g) Stage 4 - Assessment on the strength properties of MBC mortar at different curing
regimes.
h) Stage 5 - Assessment on the durability properties of MBC mortar.
i) Stage 6 - Application of the MBC mortar.
5.2 Stage 4 : Assessment on the strength properties of the optimum MBC mortar
mixes at different curing regimes.
5.2.1 Results on the strength of MBC mortars at different curing regimes.
Table 5.1 : Strength under different curing regimes Strength (MPa)
Curing 7days 28days 60days 90days
Water 34.2 46.7 57.6 61.2
Air 31.0 42.6 49.4 49.6
Initial 7days water curing 35.3 53.8 66.0 60.2
and continuous air curing
Initial 14days water curing 35.3 57.9 66.8 62.6
and continuous air curing

106
Figure 5.1: Strength development of MBC mortar at different curing regimes.
Figure 5.2: The strength different on effect of different curing regimes.
5.2.2 Results on compressive strength after the wet and dry cycle curing in seawater
The results of the strength of MBC and control mortars after wet and dry cycle
curing in seawater after 7 and 28 days of pre-curing (curing in plain water) are given in
Table 5.2.

107
Table 5.2 : Results on strength after wet and dry curing in seawater
5.2.2.1 Strength of Control mortar subjected to 7 and 28 days pre-curing
Figure 5.3: Effect on periods of pre-curing on Control mortar
5.2.2.2 Strength of MBC mortar subjected to 7 and 28 days pre-curing
Figure 5.4: Effect on periods of pre-curing on MBC mortar
5.2.2.3 Strength of MBC vs Control mortar subjected to wet and dry curing
Pre-curing No. of cycle Compressive strength (MPa)
MD OPC
0 34.2 37.67days 15 49.4 52.0 30 54.2 32.1 45 62.2 39.9 0 46.7 49.428days 15 55.0 62.2 30 55.0 43.3 45 49.2 37.5
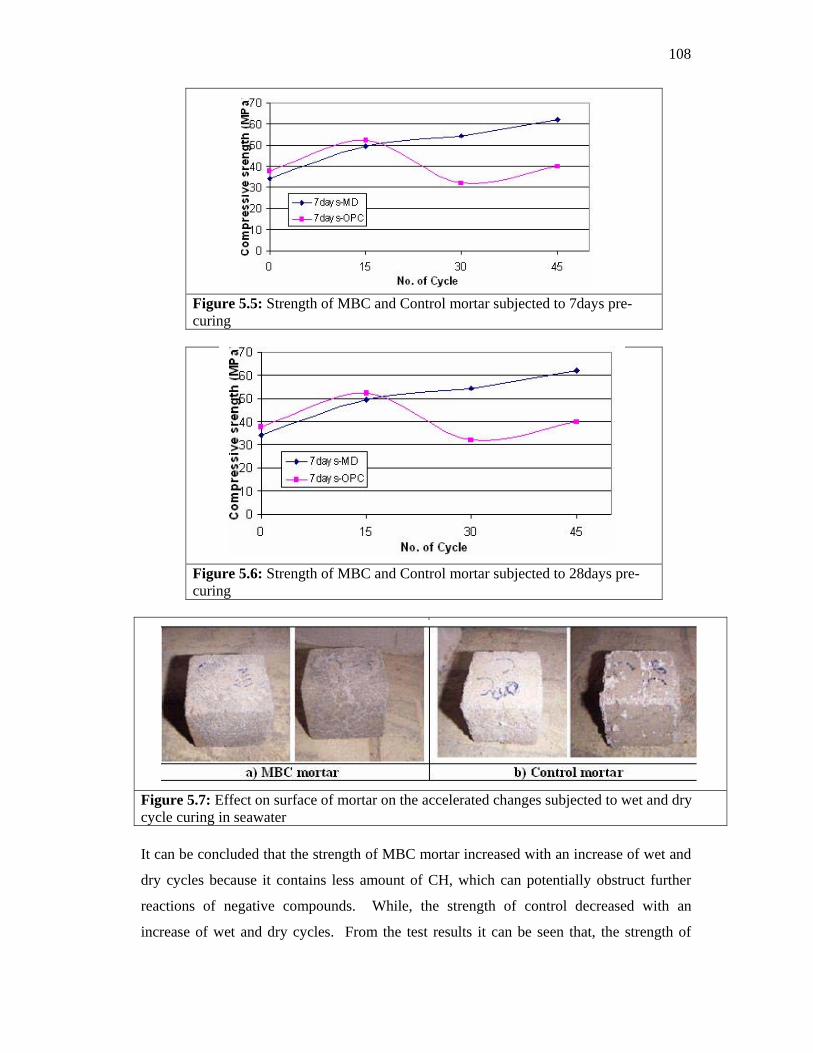
108
Figure 5.5: Strength of MBC and Control mortar subjected to 7days pre-curing
Figure 5.6: Strength of MBC and Control mortar subjected to 28days pre-curing
Figure 5.7: Effect on surface of mortar on the accelerated changes subjected to wet and dry cycle curing in seawater
It can be concluded that the strength of MBC mortar increased with an increase of wet and
dry cycles because it contains less amount of CH, which can potentially obstruct further
reactions of negative compounds. While, the strength of control decreased with an
increase of wet and dry cycles. From the test results it can be seen that, the strength of

109
MBC mortar after wet and dry curing are significantly improved and better resistance
against chloride environment was observed. It is also possible to prepare MBC, which
shows better performance than the ordinary Portland cement in terms of compressive
strength retention in chloride or corrosive environment.
5.3 Stage 5 : Assessment on the durability properties of mortar.
5.3.1 Results on carbonation of mortar.
In this study it was found that, both the investigated and control mortar were less
affected by carbonation when subjected to air, water, seawater and natural weather curing,
where the depth of carbonation was less than 2mm in all tested ages. Table 5.3 and Figures
5.8 to 5.11 show the results obtained for the carbonation test. While, Figures 5.12 to 5.15
present the conditions of the broken specimens. The specimens were tested using
phenolphthalein, which the purple colour in the figures indicates that the specimens have
not been affected by carbonation. Whereas, the transparent colour around the outmost
depth of specimen, indicates the region was affected by the carbonation.
Table 5.3 : Depth of carbonation of MBC and Control mortar at different curing regimes
Depth of Carbonation (mm)
Water curing Seawater Air curing Natural weather
Age
(days)
7 28 90 7 28 90 7 28 90 7 28 90
MD - - - - - - - 0.75 1.75 - 1.25 1.85
Control - - - - - - - 0.50 1.50 - 1.20 1.60

110
Figure 5.8: Depth of Carbonation of MBC mortar at different curing regimes
Figure 5.9: Depth of Carbonation of Control mortar at different curing regimes
Figure 5.10: Depth of Carbonation of MBC-MD and Control mortar in air curing
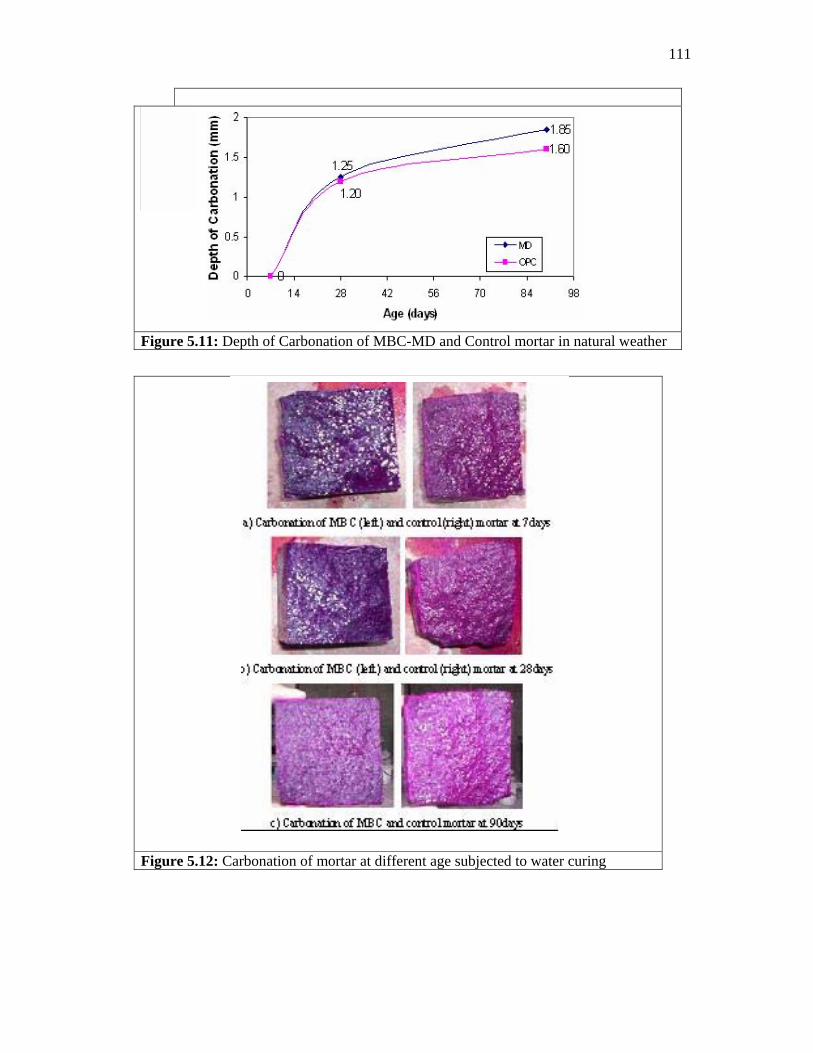
111
Figure 5.11: Depth of Carbonation of MBC-MD and Control mortar in natural weather
Figure 5.12: Carbonation of mortar at different age subjected to water curing
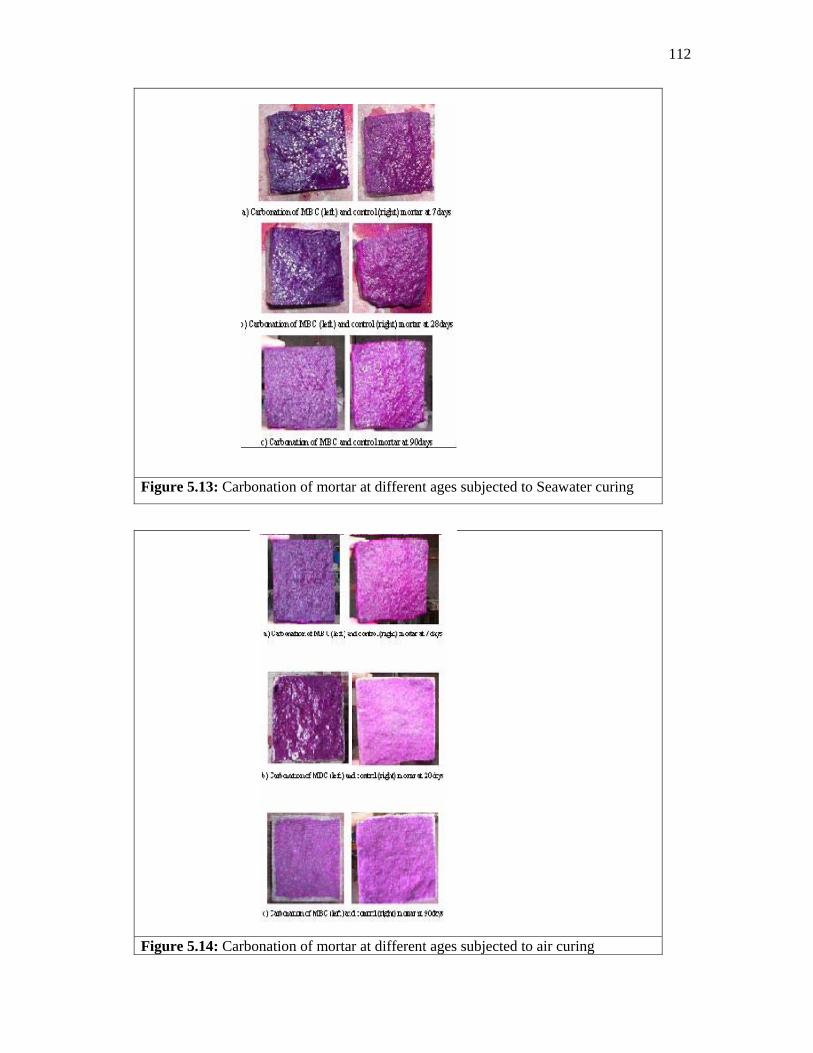
112
Figure 5.13: Carbonation of mortar at different ages subjected to Seawater curing
Figure 5.14: Carbonation of mortar at different ages subjected to air curing

113
Figure 5.15: Carbonation of mortar at different ages subjected to natural weather
5.3.2 Acid Attack
The results of the weight loss of mortar specimens subjected to 5% hydrochloric
(HCL) acid solution is presented in Table 5.4 and Figure 5.16. All the specimens were pre
cured in plain water for 7 and 28 days before being immersed into the acid.

114
Table 5.4: Percentage of weight loss after immersed in 5% HCL solution
0123456789
10
0 100 200 300 400 500 600 700
Immersion time (hr)
Wei
ght L
oss
(%)
MBC 7day pre-curing
OPC 7day pre-curing
MBC 28day pre-curing
OPC 28day pre-curing28da
7days
Figure 5.16: Comparative weight loss of Control and MBC mortar continuously immersed in 5% HCL solution
5.3.2.1 Performance of MBC vs control mortar on acid attack.
Figure 5.17: Strength of mortar after 600hrs immersed in 5% HCL solution
% Weight loss after immersed in Strength at 600hrs
Acid Hydrochloric (hours) Immersed in 5% HCL
Period of hydration 0 100 200 300 400 500 600
7day MBC 0 3.5 4.2 4.8 5.2 7.0 7.2 24.1 7.5%
OPC 0 3.4 4.6 4.9 5.5 8.4 9.1 22.3
28day MBC 0 2.2 2.4 2.5 4.0 4.7 4.8 38.3 15.7% OPC 0 2.0 2.2 2.4 4.5 4.9 5.2 32.3

115
From the test results it is deduced that concrete properly cured can potentially
improve the engineering properties and reducing the ingress of aggressive substances. It
clearly shows that the strength and microstructure of the mortar before exposure is
important in order to withstand the chemical attack. Figures 5.18 and 5.19 show the effect
on mortars when exposed to HCl solution after 600 hours of immersion. The control mortar
is more adversely affected compared to MBC mortar. The MBC mortar can be potentially
better resistant to acid attack provided it is adequately cured.
Figure 5.18: Effect on MBC (left) and control (right) mortar subjected to acid attack after 600hours of immersion
Figure 5.19: Effect penetration of acid HCL into mortar after 600hours of immersion 5.4 Stage 6 : Application of the MBC mortar
5.4.1 Introduction
This stage discusses the suitability of MBC mortar mix developed as face sheets
covering a layer of lightweight aerated concrete as core to produce lightweight sandwich
block. All the parameters of study namely strength, density, and mode of failure were

116
compared to block solely made of aerated lightweight concrete and also a typical
commercial block.
5.4.2 Manufacturing of product
a) Aerated Lightweight concrete
Figure 5.20: The expansion of 0.1% aluminium powder for both methods
b) MBC mortar – as the face sheet of the Sandwich Block (SB)
The MBC mortar paste was prepared using the technique to produce mortar as in
previous stages. The vertical casting was also found to be inappropriate method for
producing the face sheet of the SB. It is mainly because of the difficulty in pouring the
MBC mortar paste into the thin thickness of the mould, which is 10 ± 2mm thick. It also
required more materials to cast into the mould with prolonged vibration, which ultimately
increased the density and the segregration as well as bleeding of the specimens. The MBC
mortar design here is considered to be applicable for plaster or such application. Hence,
the flow of MBC mortar was maintained at 105 ± 10%, which gave the optimum
workability.
It is suggested that for ease of pouring into thin layer, the paste has to be designed
at flow value of 130 ± 10%. Nevertheless, it leads to increase in wbr, which could affect
the overall properties and performance of MBC mortar mainly in porosity and
permeability, which govern the durability of the mortar. Therefore, the samples were cast
horizontally for easy pouring and plaster the MBC mortar on the top surface of the core
material and besides to maintain the properties of MBC mortar. Figure 5.21 presents the
complexion of the sandwich panel.

117
Figure 5.21: The surface of sandwich block
5.4.3 Strength performance of sandwich block (SB)
As mentioned before, the sandwich block (SB) produced in stage of preliminary studies,
the strength performance was only evaluated at the age of 28 days. Three samples were
used and an average value was recorded as the compressive strength of the SB compared to
Aerated Lightweight block (AB), having the same dimension and method of casting as the
SB. Besides that, both specimens were also compared to commercial block (CB). CB is
commonly used as construction material for internal and external wall that is commonly
available in market. Even though the size of CB is slightly different from SB and AB, the
CB was tested for a comparison purpose because of the block is currently and practically
used in the construction industry. The results on the strength performance of all blocks are
presented in Table 5.5. The load applied to the block was perpendicular to 400mm length
of the block.
Table 5.5 : Strength of Investigated blocks
a) The strength of SB compared to AB
The strength of SB was expected to be higher than AB that by 41%. The strength
of the composite block and AB was 14.13 MPa and 8.29 MPa, respectively. According to
Areshvinna (2002), the strength of Aerated lightweight concrete was approximately at
grade 8, which is similar with the strength results of AB obtained in this research. Whilst,
the strength of the material used (MBC mortar) as for the face sheet of the SB was grade
Sample Strength (MPa)
SB 14.13
AB 8.29
CB 5.23
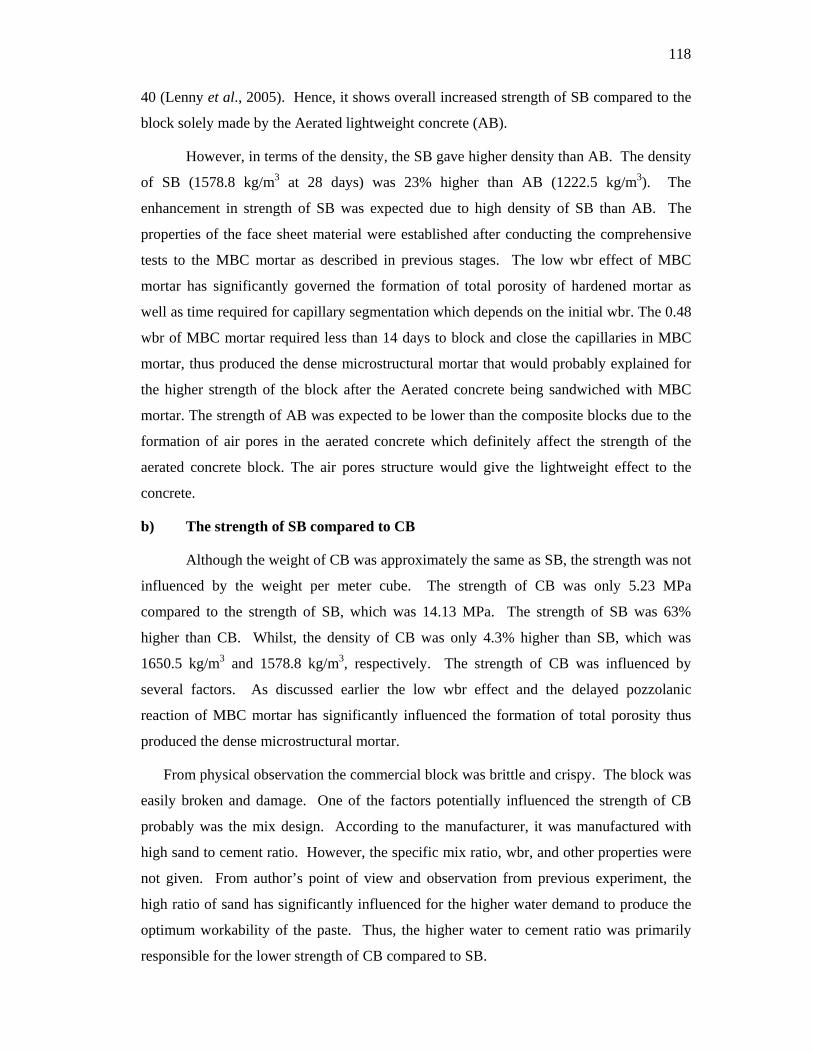
118
40 (Lenny et al., 2005). Hence, it shows overall increased strength of SB compared to the
block solely made by the Aerated lightweight concrete (AB).
However, in terms of the density, the SB gave higher density than AB. The density
of SB (1578.8 kg/m3 at 28 days) was 23% higher than AB (1222.5 kg/m3). The
enhancement in strength of SB was expected due to high density of SB than AB. The
properties of the face sheet material were established after conducting the comprehensive
tests to the MBC mortar as described in previous stages. The low wbr effect of MBC
mortar has significantly governed the formation of total porosity of hardened mortar as
well as time required for capillary segmentation which depends on the initial wbr. The 0.48
wbr of MBC mortar required less than 14 days to block and close the capillaries in MBC
mortar, thus produced the dense microstructural mortar that would probably explained for
the higher strength of the block after the Aerated concrete being sandwiched with MBC
mortar. The strength of AB was expected to be lower than the composite blocks due to the
formation of air pores in the aerated concrete which definitely affect the strength of the
aerated concrete block. The air pores structure would give the lightweight effect to the
concrete.
b) The strength of SB compared to CB
Although the weight of CB was approximately the same as SB, the strength was not
influenced by the weight per meter cube. The strength of CB was only 5.23 MPa
compared to the strength of SB, which was 14.13 MPa. The strength of SB was 63%
higher than CB. Whilst, the density of CB was only 4.3% higher than SB, which was
1650.5 kg/m3 and 1578.8 kg/m3, respectively. The strength of CB was influenced by
several factors. As discussed earlier the low wbr effect and the delayed pozzolanic
reaction of MBC mortar has significantly influenced the formation of total porosity thus
produced the dense microstructural mortar.
From physical observation the commercial block was brittle and crispy. The block was
easily broken and damage. One of the factors potentially influenced the strength of CB
probably was the mix design. According to the manufacturer, it was manufactured with
high sand to cement ratio. However, the specific mix ratio, wbr, and other properties were
not given. From author’s point of view and observation from previous experiment, the
high ratio of sand has significantly influenced for the higher water demand to produce the
optimum workability of the paste. Thus, the higher water to cement ratio was primarily
responsible for the lower strength of CB compared to SB.
119
c) The strength of AB compared to CB
The strength of AB was also higher than CB by approximately 37%. The density
and weight of CB was 25.9% higher and heavier than AB. Although the AB produced air
pores thus gave more lightweight than CB, nevertheless AB was stronger than CB. As
discussed earlier the lower strength of CB was probably due to the poor mix design.
Generally the strength of all specimens (SB, AB and CB) were well matched with
the standard requirement as referred to ASTM C129-85 (1990), which the strength required
for non-load bearing units is 3.45 MPa at the 28 days. Specifically, the CB produced lower
strength and more dense than AB and SB. AB produced more lightweight and medium
strength materials, whilst SB gave stronger and medium weight. However, the strength
obtained for all specimens indicate that the blocks can be used as a precast lightweight
component for non-load bearing units, which produced the strength and density of
lightweight materials ranging from 5 to 14 MPa and 1200 to 1600 kg/m3, respectively.
Nevertheless, the sandwich block was designed for low absorption material and low
alkalinity that gave better resistance to chemical attack. It can potentially be applied in
aggressive and severe environment such as in seawater or beach area, industrial building,
and also in the area exposed to lubricating oils or hydraulic fluids.
5.4.4 Effect of curing on density of the blocks
This section discusses the effect of curing on density of SB compared to AB. CB
was not compared because of the block was not produced in laboratory. The blocks were
bought from supplier and as mentioned earlier the specifications of CB were unknown.
As discussed earlier in chapter three of the thesis, all the samples were cured by an
initial of 14 days water curing and followed by 14 days of air curing. The purpose of the
curing method applied was discussed earlier in chapter three. It was observed that the
weight and density of SB after demoulding were 12.05kg and 1506.3 kg/m3, respectively,
and after subjected to 14 days water curing and 14 days air curing, both parameters
increased by 4.8% at the age of 28 days. Meanwhile, the aerated block showed an increase
of 10% for both weight and density as seen in Table 5.6. It was expected that the MBC
mortar as for the face sheets of the block would give low water absorption compared to the
macro pores formed in aerated lightweight concrete. However, the density of the SB after
demoulding and after curing process was 27% and 23% higher than AB, respectively.
Nevertheless, both blocks are considered as lightweight concrete since the density of
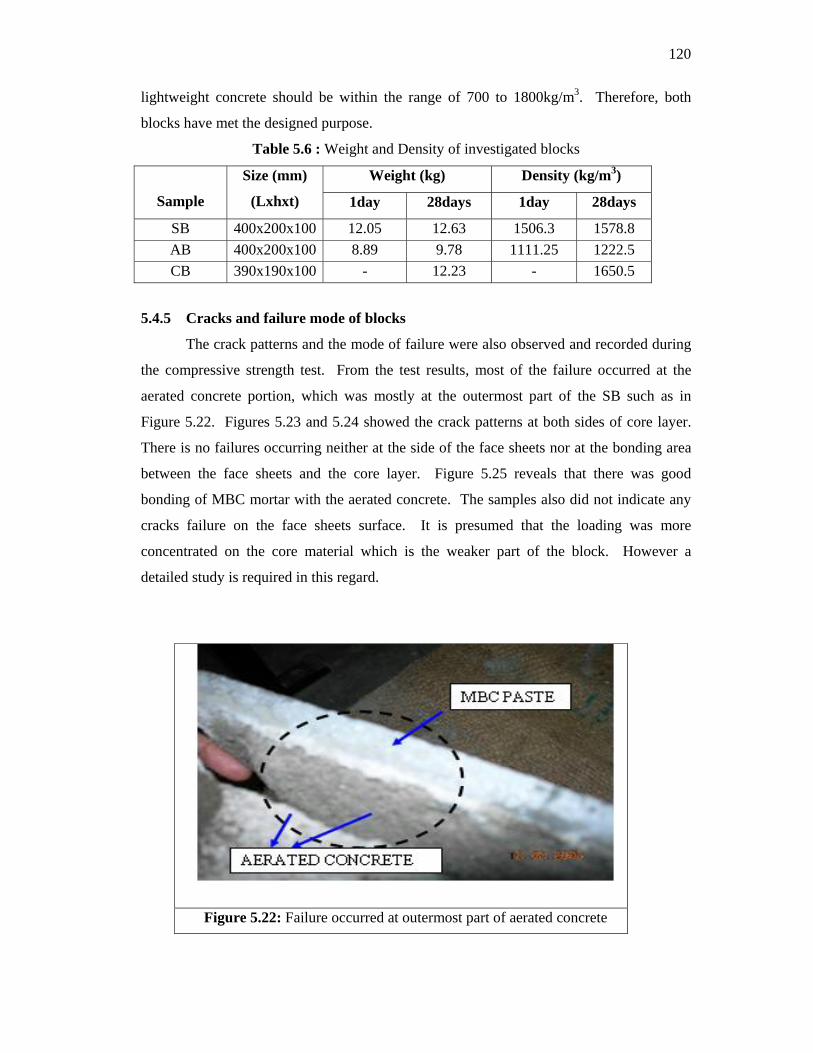
120
lightweight concrete should be within the range of 700 to 1800kg/m3. Therefore, both
blocks have met the designed purpose.
Table 5.6 : Weight and Density of investigated blocks
Weight (kg) Density (kg/m3)
Sample
Size (mm)
(Lxhxt) 1day 28days 1day 28days
SB 400x200x100 12.05 12.63 1506.3 1578.8 AB 400x200x100 8.89 9.78 1111.25 1222.5 CB 390x190x100 - 12.23 - 1650.5
5.4.5 Cracks and failure mode of blocks
The crack patterns and the mode of failure were also observed and recorded during
the compressive strength test. From the test results, most of the failure occurred at the
aerated concrete portion, which was mostly at the outermost part of the SB such as in
Figure 5.22. Figures 5.23 and 5.24 showed the crack patterns at both sides of core layer.
There is no failures occurring neither at the side of the face sheets nor at the bonding area
between the face sheets and the core layer. Figure 5.25 reveals that there was good
bonding of MBC mortar with the aerated concrete. The samples also did not indicate any
cracks failure on the face sheets surface. It is presumed that the loading was more
concentrated on the core material which is the weaker part of the block. However a
detailed study is required in this regard.
Figure 5.22: Failure occurred at outermost part of aerated concrete
MBC PASTE

121
Figure 5.23: Crack pattern at aerated concrete Figure 5.24: Cracks at the side of
aerated concrete
Figure 5.24: Good bonding between face sheet and core layer
5.5 Conclusions
From the discussions covered in this chapter, the continuity of progress of
hydration is an important factor, which relates to adequate curing particularly for concrete
containing pozzolanic materials to enhance the concrete performances. It was observed
that MBC mortar provided with initial 14 days water curing and continuous for 14 days air
curing achieved high early strength than continuous water curing. It is suggested that the
strength and microstructure of concrete before being exposed to severe environment ought
to be properly taken care of.
The low alkalinity of MBC mortar gives better performance towards chemical
attacks compared to highly alkaline OPC. It is also observed that MBC mortar exposed to
saline water was found to be sufficient with 7 days or extended to 14 days rather than 28
days pre-curing. It is because the NaCl2 acts as accelerator to pozzolanic reaction. The
sodium ions convert to soluble silicates and easily attacked the pozzolanic particles, which
further combined with CH, hence increased the CSH gel. The formation of protective

122
layer of brucite impedes further reactions. Thus the MBC mortar improved significantly
against the chemical reaction of seawater. Concrete should be designed in such a way that
it has to be compatible with the conditions of the environments. Hence, the sandwich
block was designed for better resistance to chemical attack that can potentially be applied
in aggressive environments.

123
CHAPTER 6
CONCLUSIONS AND RECOMMENDATIONS
6.1 Conclusions
Detailed conclusions have been discussed in the end of Chapter 4 and 5. Therefore,
in this chapter, the author will be summarized the finding conclusion and its significance.
The Chapter 4 is mainly focused on the development of the MBC mortar. From the
results, it observed that the MD mortars achieved the highest strength value, and lowest
percentage of total porosity and water absorption compared to control and other MBC
mortars. Whilst, in the BBC system, PFA mortars exhibited the highest strength value, and
lowest percentage of total porosity and water absorption among all BBC and control as
well MBC mortars. The MBC mortars mainly MD and MC mix were higher strength
value than control and BBC mortars such as RHA and Slag mortar. MBC system was also
exhibited greatly lower percentage of total porosity and water absorption than BBC system
and control mortar. Based on the results obtained, The MBC system has reduced
limitations inherent in individual materials (BBC system). From the overall performance
of MBC mortar, MD mixes (which contains 5% of RHA, 20% of PFA, 5% POFA and 20%
of Slag) achieved the objectives of study to establish the optimum mix proportion of MBC
mortar.
Whilst, Chapter 5 studied the other properties and application using the optimum
MBC mixes. The strength values of MBC mortar when subjected to initial 7 days and 14
days water curing and continuous air curing until age of 28 days showed higher early
strength values than continuous water and air curing. The strength values of MBC mortars
for both 7 days and 28 days pre-curing increased after 30 cycles after wet and dry curing,
which was higher than control mortar. After 200-300 hours until total 600 hours immersed
in HCL acid, the MBC mortar showed better performance than control mortar. Poor curing
of MBC mortars exhibited bad performance on effect of carbonation when exposed to air
curing and natural weather condition. Application of the MBC mortar as the face sheet of
sandwich block exhibited higher strength than aerated lightweight block and commercial
block. Whilst, the density of sandwich block was found higher than aerated block but
much lower than the commercial block.

124
Based on the test results obtained in Chapter 5, it can be summarized that the
strength and durability properties of MBC mortar are more pronounce when it is provided
with an adequate curing. After certain of time of exposure to chemical attack, the MBC
mortar performs better resistance than OPC mortar. The main objective of the study to
produce MBC mortar of adequate strength and durability is achieved. The production of
MBC mortar as face sheet of sandwich block can be used in aggressive environment. It
can be utilized as low cost construction materials and reduce the volume of waste
generated. POFA and RHA potentially to be used in MBC by incorporation of PFA and
Slag.
1% reduction in OPC causes 0.16% strength reduction, however, 0.62% lower in
porosity and 0.76% lower in absorption in the MBC system. The multiple binder
combinations will have twice over benefit of reduction in the cost of construction material
and also as a mean of disposal of waste. Material recovery from the alteration of
agricultural wastes and industrial wastes into constructive materials has not just
environmental achieves, but may also conserve natural resources.
6.2 Recommendations for further studies.
6.2.1 Materials
a) The studies on the strength, pore structure and durability characteristics of MBC
mortars by using the quality and reactive RHA (amorphous silica)
b) Detail properties of production of RHA in terms of burning method and fineness
of the particles must be properly taken care in order to enable better performance of MBC
mortars and help to improve the early strength of MBC mortars.
6.2.2 Engineering and chemical / microstructural characteristics.
a) Concentrating on varies the dosage of superplasticizer into MBC mixes (with
fixed wbr) and choose the optimum dosage that exhibit better properties especially to
improve the early strength as the same time the cost of production ought to be economical.
b) Further studies on the similar durability test as the current research but the MBC
specimens should be provided by initial water curing and continuous air curing before
exposed to the severe condition as to enhance the current findings.
c) Further studies on others durability aspect such as alkali silica resistance,
shrinkage and sulphate resistance.

125
d) Studies on the mechanical properties of MBC mortar such as the flexural and
modulus of elasticity.
e) Focus on the microstructural studies such as the pores size distribution and
termogravimetri and permeability test.
REFERENCES
ASTM C 109-92 (1992) Standard Test Method for Compressive Strength of Hydraulic
Cement Mortars (Using 2-in. or 50mm Cube Specimens)
ASTM C 129-85 (1990) Standard Specification for Non-Load Bearing Concrete Masonry
Units.
ASTM C 150-94 (1994) Specification for Portland Cement.
ASTM C 230-90 (1990) Specification for Flow Table for Use in Tests of Hydraulic
Cement.
ASTM C 494-92 (1992) Specification for Chemical Admixtures for Concrete.
ASTM C 618-94 (1994) Standard Specification for Fly Ash and Raw or Calcined Natural
Pozzolan for Use as Mineral Admixture in Portland Cement Concrete.
ASTM C 989-93 (1993) Specification for Ground Granulated Blast-Furnace Slag for Use
in Concrete and Mortars.
ASTM E 72-80 (1980) Standard Methods of Conducting Strength Tests of Panels for
Building Construction.
Abdul Awal A.S.M and Hussin M.W. (1996a). Influence of Palm oil Fuel Ash on Strength
and Durability of Concrete. In: Sjostrom C. (ed.). Durability of Buliding Materials
and Components 7 (Vol. 1). London.
Abdul Awal A.S.M and Hussin M.W. (1996b). Properties of Fresh and Hardened Concrete
Containing Palm Oil Fuel Ash. 3rd Asia-Pacific Conference On Structural
Engineering and Construction. 17-19 June 1996.
Abdul Awal A.S.M. and Hussin M.W. (1997). Some Aspects of Durability Performances
of Concrete Incorporation Palm Oil Fuel Ash. Fifth International Conference on
Structural Failure, Durability and Retrofitting. Singapore, 27-28 November.
126
ACI 226.1R-87. (1994). Ground Granulated Blast-Furnace Slag As A Cementitious
Constituent in Concrete, ACI Manual of Concrete Practice, Part 1: Materials and
General Properties of Concrete, Detroit, Michigan, 16pp.
ACI Committee 201, (1991). Proposed revision of: Guide to Durable Concrete. ACI
Materials Journal, Sept-Oct., 544-576.
Aitcin P.C. (2000). Cements of Yesterday and Today Concrete of Tomorrow. Cement and
Concrete Research. 30: 1349-1359.
Aitchin P.C. (1992). The Use of Sps in High Performance Concrete, In: Malier Y. ed. High
Performance Concrete, From Material to Structure. London: .
Amjad H.M and Salihuddin R.S. (1999). Influence Of Fly Ash, GGBF Slag and Silica
Fume on Porosity and Oxygen Permeability in High Performance Concrete. World
Engineering Congres’99, Kuala Lumpur. 97-102.
Arreshvhinna (2002). Application of Slag Cement Based Aerated Lightweight Concrete
and Non-Load Bearing Wall Panel. Universiti Teknologi Malaysia, . M. Eng.
Thesis (Structural and Material).
Asavapisit S. and Ruengrit N. (2005). The Role of RHA-Blended Cement in Stabilizing
Metal-Containing Wastes. Cement and Concrete Composites. 27: 782-787.
Bagel L. (1998). Strength and Pore Structure of Ternary Blended Cement Mortars
Containing Blast Furnace Slag and Silica Fume. Cement and Concrete Research.
28: 1011-1020.
Bakker R. (1980). On The Cause Of Increased Resistance Of Concrete Made From Blast
Furnace Cement To The Alkali-Silica Reaction And To Sulphate Corrosion.
Dissertation to the Mining and Metallurgy Faculty of the R.W.T.H. Aachen, for
Doctor of Science degree: Holland.
Berry E. et al. (1994). Hydration in High-Volume Fly Ash Concrete Binders. ACI Mater
Journal. 91: 382-389.
Bonavetti V., Donza H., Rahhal V., Irassal E., (2000). Influence of Initial Curing on the
Properties of Concrete Containning Limestone Blended Cement. Cement and
Concrete Research, 30: 703-708.
BS 410 (1986) Specification for Test Sieves, British Standards Institution, London.
BS 1881 : Part 116 (1983) Method for Determination of Compressive Strength of Concrete
Cubes, British Standards Institution, London.

127
BS 1881: Part 122 (1983) Method for Determination of Water Absorption, British
Standards Institution, London.
BS 3892: Part 1 (1982) Specification for Pulverized-Fuel Ash for Use with Concrete
Cement, British Standards Institution, London.
Chindaprasirt P., Homwuttiwong S., and Sirivivatnanon V. (2004). Influence of Fly Ash
Fineness on Strength, Drying Shrinkage and Sulfate Resistance of Blended Cement
Mortar. Cement and Concrete Research. 34: 1087-1092.
Collins F.G. and Grace W.R. (1997). Specifications and Testing For Corrosion Durability
of Marine Concrete: The Australian Perspective, Fourth CANMET/ACI
International Conference On Durability of Concrete, SP 170-39. 757-776.
Concrete Society Technical Report No. 31 (1988). Permeability Testing of Site Concrete-
A Review of Methods and Experience. London. The Concrete Society.
Cook D.J. (1986) Rice Husk Ash. In: Swamy R.N. ed. Concrete Technology and Design,
Cement Replacement Materials, Vol. 3, Surrey University Press, London, 171-196.
Cook D.J and Cao H.T. (1987). An Investigation of the Pore Structure in Fly Ash/OPC
Blends. Proceeding of the 1st International RILEM Congress on From Materials
Science to Construction Materials Engineering, Vol. 1, Pore Structure and
Materials Properties. September 7-11, Versailles, France: 69-76.
Cook D.J. and Suwanvitaya P. (1981). Properties and Behaviour of Lime-Rice Husk Ash
Cements. Fly Ash, Silica Fume, Slag and Other Mineral By-Products. ACI Spec.
Pub. SP-79, 831-845.
Costa U. and Massazza F. (1987). Remarks on the Determination of the Pore Size
Distribution of Portland and Pozzolanic Cement Pastes. Proceeding of the 1st
International RILEM Congress on From Materials Science to Construction
Materials Engineering, Vol. 1, Pore Structure and Materials Properties. September
7-11, Versailles, France: 159-166.
Coutinho J.S. (2003). The Combined Benefits of CPF and RHA in Improving The
Durability of Concrete Structures. Cement and Concrete Composites. 25: 51-59.
Day K.W. (1995). Concrete Mix Design, Quality Control and Specification. London: E &
FN Spon.
128
Dubovoy V.S. et al. (1986). Effects of Ground Granulated Blast-Furnace Slags on Some
Properties of Pastes, Mortars, and Concretes, Blended Cements. Frohnsdorff G.
(ed.), ASTM Sp. Tech. No. 897, 29-48.
El Aziz M.A et al. (2004). Hydration and Durability of Sulphate-Resisting and Slag
Cement Blends in Caron’s Lake Water. Cement and Concrete Research. (article in
press).
Fadhadly Z. and Hussin M.W. (1996) Malaysia Natural Weather and Its Effect on
Carbonation of Slag Cement Mortar. 3rd Asia-Pacific Conference on Structural
Engineering and Construction, June 17-19.
Feldman R.F and Beaudoin R.F. (1991). Pretreatment of Hardened Hydrated Cement
Pastes for Mercury Intrusion Measurements. Cement and Concrete Research.
21:297-308.
Feldman R.F. (1981). Pore Structure Formation During Hydration of Fly Ash and Slag
Cement Blends, In Effects of Fly Ash Incorporation in Cement and Concrete. (ed.
S. Diamond), University Park, PA,MRS,124.
Feldman R.F. (1983). Significant of Porosity Measurements on Blended Cement
Performance, ACI SP 79-22.
Fraay A.L.A, Bijen J.M, and Haan Y.M. (1989). The Reaction of Fly Ash in Concrete: A
Critical Examination. Cement and Concrete Research. 19: 235-246.
Hanifi B. and Orhan A. (2006). Sulfate Resistance of Plain and Blended Cement. Cement
and Concrete Composites. 28: 39-46.
Ho Lih Sun (1998). Corrosion Protection of Reinforcement in Concrete Using Galvanized
Steel Bar and Blended Cements. Universiti Teknologi Malaysia, M. Eng.
(Structure and Material)
Hogan F.J. and Meusel J.W. (1981). Evaluation for Durability and Strength Development
of a Ground Granulated Blast Furnace Slag. Cement, Concrete and Aggregate. 3:
40-52.
Hooton R.D. (1993). Influence of Silica Fume Replacement of Cement on Physical
Properties and Resistance to Sulphate Attack, Freezing and Thawing, and Alkali-
Silica Reactivity. ACI Materials Journal, 90, 143-151

129
Huang P., Bao Y. and Yao Y. (2005). Influence of HCL Corrosion on the Mechanical
Properties of Concrete. Cement and Concrete Research. 35: 584-589.
Huiwen W., Zhonghe S. and Zongshou L. (2004). Analysis of Geometric Characteristics of
GGBS Particles and Their Influences on Cement Properties. Cement and Concrete
Research. 34:133-137.
Isaia G.C, Gastaldini A.L.G. and Moraes R. (2003). Physical and Pozzolanic Action of
Mineral Additions on the Mechanical Strength of High-Performance Concrete.
Cement and Concrete Composites. 25: 69-76.
Islam M.D. Sirazul (1981). Grinding Methods and Their Effects on Reactivity of RHA. M.
Eng. Thesis, Asian Institute of Technology, Bangkok , Thailand.
Ithuralde G. (1992). Permeability: The Owner’s Viewpoint. In: Mailer Y. ed. High
Performance Concrete From Material to Structure. London: 276-294.
Jensen O.M. et al. (1999). Chloride Ingress In Cement Paste and Mortar. Cement and
Concrete Research. 29: 1497-1504.
Jones M.R, Dhir R.K and Magee B.J. (1997). Concrete Containing Ternary Blended
Binders: Resistance To Chloride Ingress and Carbonation. Cement and Concrete
Research. 27: 825-831.
Kapur P.C. (1981). TiB: Tube-in-Basket Rice-Husk Burner For Producing Energy and
Reactive Rice-Husk Ash. Proceeding ESCAP/RCTT Workshop on Rice-husk Ash
Cement, New Delhi.
Khan M.I, Lyndsdale C.J and Waldron P. (2000). Porosity and Strength of PFA/SF/OPC/
Ternary Blended Paste. Cement and Concrete Research. 30: 1225-1229.
Kolias S. and Georgiou C. (2005) The Effect of Paste Volume and of Water Content on the
Strength and Water Absorption of Concrete. Cement and Concrete Composites. 27:
211-216.
Loedolff G.F. (1987). Low Porosity Concrete. Proceeding of the 1st International RILEM
Congress on From Materials Science to Construction Materials Engineering, Vol. 1,
Pore Structure and Materials Properties. September 7-11, Versailles, France: 1-8.
Lenny S.J., Salihuddin R.S. and Lee Y.L. (2005). The Development of Multi-Blended
Cement (MBC) Mortar on Strength, Water Absorption and Total Porosity.
Prosiding Seminar Kebangsaan Penyelidikan Kejuruteraan Awam (SEPKA 2005),
July 5-6, Johor, Malaysia: 498-506.

130
Mahmud H.B, Hamid N.B.A.A., and Chia B.S. (1996). High Strength Rice Husk Ash – A
preliminary Investigation. 3rd Asia Pacific Conferences on Structural Engineering
and Construction, 1996, 383-389.
Malier Y. (1992). High Performance Concrete, From Material to Structure. London:
Marsh B.K. (1984). Relationships Between Engineering Properties and Microstructural
Characteristics of Hardened Cement Paste Containing Pulverized-Fuel Ash as A
Partial Cement Replacement., Hatfield Polytechnic, England, UK, PhD. Thesis.
McGrath P.F. and Hootan R.D. (1997). Influence of Binder Composition on Chloride
Penetration Resistance of Concrete. Fourth CANMET/ACI International
Conference On Durability of Concrete, SP 170-16. 331-347.
Mehta P.K and Aitcin P.C. (1990). Principles Underlying Production of High-Performance
Concrete. Cement and Concrete Aggregate. 12: 70-8
Mehta P.K and Folliard K.J. (1995). Rice-Husk Ash- A Unique Supplementary Cementing
Material: Durability Aspects, Advance Concrete Technology. ACI-SP 154-28
(1995) 531.
Mehta P.K, (1992). Rice Husk Ash- A unique supplementary cementing material
Proceeding International Symposium On Advances in Concrete Technology, ed.
V.M. Malhotra, Athens, Greece, 1992, 407-430.
Mehta P.K. (1979). The Chemistry and Technology of Cements Made From Rice Husk
Ash. Proceeding UNIDO/ESCAP/RCTT Workshop on Rice-Husk Ash Cement,
Peshawar, Pakistan. 113-122.
Mehta P.K. (1987). Studies on the Mechanisms By Which Condensed Silica Fume
Improves the Properties of Concrete: Durability Aspect. In: International Workshop
on Condensed Silica Fume in Concrete, Ottawa, 1987, Proceedings. 1-17.
Mehta P.K. (1989) Pozzolanic and Cementitious by-products in Concrete Another Look, In
V.M. Malhotra ed. Fly Ash, Silica Fume, Slag, and Natural Pozzolans in Concrete,
Sp 114, Vol. 1, ACI, Detroit: 1-45.
Mehta P.K. (1994). Mineral Admixtures for Concrete- An Overview of Recent
Developments. In Advances in Cement and Concrete, Proceedings of an
Engineering Foundation, July, Durham: 243-256.

131
Mehta P.K. and Manmohan D. (1980). Pore Size Distribution and Permeability of
Hardened Cement Paste. 7th International Congress on the Chemistry of Cement, 3,
VII 1-5.
Mohd. Nisyurman Mohamad (2002). Konkrit Berkekuatan Tinggi: Penggunaan Habuk
Kayu Industri (TIA). Universiti Teknologi Malaysia: B. Eng. (Structural and
Material) Thesis.
Monosi S. and Collepardi M. (1987). Low Porosity and Early Durability of Concrete.
Proceeding of the 1st International RILEM Congress on From Materials Science to
Construction Materials Engineering, Vol. 1, Pore Structure and Materials
Properties. September 7-11, Versailles, France: 9-16.
Naik T.R and Ramme B.W. (1989). High Strength Concrete Containing Large Quantities
of Fly Ash, ACI Mater. Journal 86(2). 111-116.
Nehdi M., Duquette J. and El Damatty A. (2003). Performance of Rice Husk Ash Produced
Using A New Technology As A Mineral Admixture In Concrete. Cement and
Concrete Research. 33: 1203-1210.
Neville A.M. (1995) Properties of Concrete. Fourth and Final Edition. Longman.
Nisyibayashi S., Yamura K., Inoue S. (1990). Durability of Concrete in Seawater: Method
of Accelerated Testing and Evaluation. International Conference on Performance
of Concrete in Marine Environment. V.M. Malhotra ed. ACI SP65-20: 351-378.
Noor Ahmed M., Salihuddin R. S., and Mahyuddin R. (2006) Performance of High
Workability Slag-Cement Mortar for Ferrocement. Building and Environment,
Article in Press available online on www.sciencedirect.com
Orchard D.F. (1958). Concrete Technology, Vol. 1, London, Prentice Hall.
Ozer B. and Ozkul M.H. (2004). The Influence of Initial Water Curing on the Strength
Development of Ordinary Portland and Pozzolanic Cement Concretes. Cement and
Concrete Research. 34: 13-18.
Pandey S.P et al. (2003). Studies on High-Performance Blended/Multiblended Cements
and Their Durability Characteristics. Cement and Concrete Research. 33: 1433-
1436.
Pandey S.P. and Sharma R.L (2000). The Influence of Mineral Additives on the Strength
and Porosity of OPC Mortar, Cement and Concrete Research, 30:19-23.

132
Paya J. et al. (2001). Determination of Amorphous Silica in Rice Husk Ash By A Rapid
Analytical Method. Cement and Concrete Research. 31: 227-231.
Perraton D., and Aitcin P.C. (1992). Permeability, As Seen By The Researcher. In: Malier
Y. ed. High Performance Concrete, From Material to Structure. London: 252-275.
Pigeon M. and Regourd M. (1983) Freezing and Thawing Durability of Three Cements
with Various Granulated Blast Furnace Slag Contents, Proceeding CANMET/ACI
Conference. ACI Publication SP-79. Vol. 2, Montebello, Canada, 1983, 979-989.
Pliskin L. (1992). High Performance Concrete-Engineering Properties and Code Aspects.
In: Malier Y. ed. High Performance Concrete, From Material to Structure.
London: 186-195.
Powers T.C. (1958). Structure and Physical Properties of Hardened Portland Cement Paste.
Journal American Ceramic Society. 41: 1-6.
Qijun Y. et al. (1999). The Reaction Between Rice Husk Ash and Ca(OH)2 Solution and
the Nature of Its Product. Cement and Concrete Research. 29: 37-43.
Ravindra K.D (1986). Pulverized- Fuel Ash. In: Swamy R.N. ed. Concrete Technology
and Design V3 Cement Replacement Materials. London: Surrey University Press.
197-248.
Regourd M. (1986). Slags and Slag Cement. In: Swamy R.N. ed. Concrete Technology and
Design V3 Cement Replacement Materials. London: Surrey University Press. 73-
98.
RILEM Technical Recommendations for the Testing and Use of Materials (1988),
Measurement of Hardened Concrete Carbonation Depth, Great Britain, CPC 18
Rossler M. and Odler I. (1985). Investigations on the Relationship between Porosity,
Structure and Strength of Hydrated Portland Cement Pastes. I. Effect of Porosity.
Cement and Concrete Research. 15: 401-410.
Roy D.M. and Idorn G.M. (1982) Hydration, Structure and Properties of Blast Furnace
Slag Cements, Mortars and Concrete, ACI Journal 11/12, 1982, 444-457.
Sagoe K.K and Mak S.L. (1994). Blended Cements Cured at elevated Temperatures. 2nd
Symposium on Blended Cements, Malaysia, 1994, 95-99.
Salihuddin bin Radin Sumadi (1993). Relationships Between Engineering Properties and
Microstructural Characteristics of Mortar Containing Agricultural Ash, Universiti
Teknologi Malaysia, . PhD. Thesis (Structural and Material).
133
Sersale R., Cioffi R., Frigione G. and Zenone F. (1991). Relationship between Gypsum
content, porosity, and strength of concrete. Cement and Concrete Research. 21:
120-126.
Shondeep L S and Bonen D. (1994). Non-ferrous Lead-Smelting Slag Waste as a Potential
Constituent in the Production of Blended Cement. 2nd Symposium on Blended
Cements, Malaysia. 108-113.
Singh N.B et al. (2002). Effect of Lignosulfate, Calcium Chloride and Their Mixture on the
Hydration of RHA-Blended Portland Cement. Cement and Concrete Research. 32:
387-392.
Smolczyk H.G. (1980) Slag Structure and Identification of Slag. Proceeding 7th
International Congress on the Chemistry of Cements v.1, III Paris 1980, 1-17.
Smith M. and Freda H. (1979). The Application of the BS 4550 Test for Pozzolanic
Cements to Cements containing Pulverised Fuel Ash. Magazine of Concrete
Research, 31: 108
Sivasundaram V. and Malhotra V.M. (1992). Properties of Concrete Incorporating Low
Quantity of Cement and High Volume of Ground Granulated Slag, ACI Materials
Journal, 89, No.6. 554-563.
Sobolev K. and Yeginobali A. (2005). The Development of High-Strength Mortars with
Improved Thermal and Acid Resistance. Cement and Concrete Research. 35: 578-
583.
Soeda M., Yamato T. and Emoto Y. (1997). Freezing and Thawing Durability of High
Flowing Concrete Using Different Cementitious Materials. Fourth CANMET/ACI
International Conference On Durability of Concrete, SP 170-48. 939-948.
Sun W., Handong Y. and Binggen Z. (2003). Analysis of Mechanism on Water-Reducing
Effect of Fine Ground Slag, High-Calcium Fly Ash, and Low-Calcium Fly Ash.
Cement and Concrete Research. 33: 1119-1125.
Tan B.W. (2000). Crude Palm Oil Milling Management and operating in 2000-Re-
engineering for New Challenges. Proceeding of the 2000 National Seminar on
Palm Oil Milling, refining Technology, Quality and Environment, July 3-4.
Malaysia, 3-11.
Tay J.H. (1990). Ash from Palm-Oil Waste as Concrete Material. Journal of Material in
Civil Engineering, Vol 2, No.2, ASCE. 94-105.

134
Toutanji H. et al. (2004). Effect of Supplementary Cementitious Materials on the
Compressive Strength and Durability of Short-Term Cured Concrete. Cement and
Concrete Research. 34: 311-319.
Uchikawa H. (1986). Effect of Blending Component on Hydration and Structure
Formation, 8th International Congress on Chemistry of Cement, Rio de Janeiro,
Brazil: 77.
Vanisha Mary A/P J. Daniel Rajiah (2003). Performance Characteristics of Electric Arc
Furnace Slag Concrete. Universiti Teknologi Malaysia: M. Eng. (Structural and
Material) Thesis.
Wainwright P.J. (1986). Properties of Fresh and Hardened Concrete Incorporating Slag
Cements. In: Swamy R.N. Concrete Technology and Design V3 Cement
Replacement Materials. London: Surrey University Press. 100-129.
Zahairi bin Abu (1990). The Pozzolanicity of Some Agricultural Fly Ash and Their Use in
Cement Mortar and Concrete. Universiti Teknologi Malaysia: M. Eng. (Structural
and Material) Thesis.
Zhang M.H., Lastra R. and Malhotra V.M. (1996). Rice-Husk Ash Paste and Concrete:
Some Aspects of Hydration and The Microstructure of The Interfacial Zone
Between The Aggregate and Paste. Cement and Concrete Research. 26: 963-977.