Development of an Indicator Approach to Assessing ...
23
ORNL is managed by UT-Battelle for the US Department of Energy Development of an Indicator Approach to Assessing Bioenergy Sustainability This presentation does not contain any proprietary, confidential, or otherwise restricted information. Esther S. Parish ([email protected]) Research Staff Environmental Sciences Division Oak Ridge National Laboratory (ORNL) Oak Ridge, Tennessee FEWSTERN Workshop US-China Joint Symposium on the Nexus of Food, Energy, and Water Systems Franklin/Nashville, Tennessee December 7, 2017
Transcript of Development of an Indicator Approach to Assessing ...
1 4.2.2.40 Dale: BETO Review 3/ 6/17 ORNL is managed by UT-Battelle
for the US Department of Energy
Development of an Indicator Approach to Assessing Bioenergy Sustainability
This presentation does not contain any proprietary,
confidential, or otherwise restricted information.
Esther S. Parish ([email protected]) Research Staff
Environmental Sciences Division
Oak Ridge National Laboratory (ORNL)
Oak Ridge, Tennessee
FEWSTERN Workshop
US-China Joint Symposium on the Nexus of
Food, Energy, and Water Systems
Franklin/Nashville, Tennessee
December 7, 2017
2 4.2.2.40 Dale: BETO Review 3/ 6/17
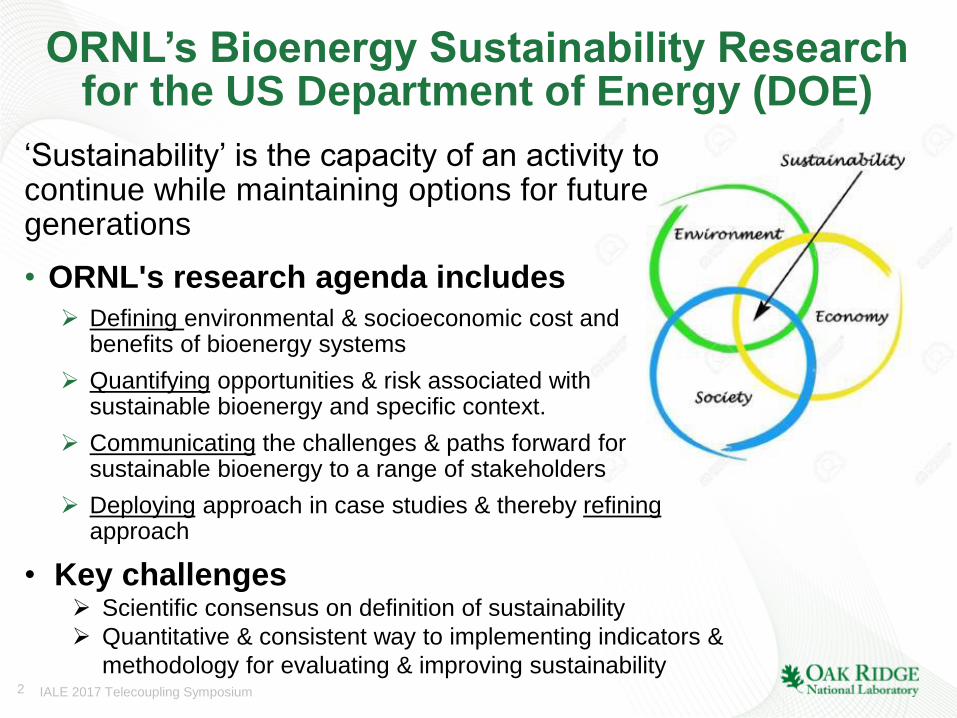
ORNL’s Bioenergy Sustainability Research for the US Department of Energy (DOE)
‘Sustainability’ is the capacity of an activity to continue while maintaining options for future generations
• ORNL's research agenda includes
Defining environmental & socioeconomic cost and benefits of bioenergy systems
Quantifying opportunities & risk associated with sustainable bioenergy and specific context.
Communicating the challenges & paths forward for sustainable bioenergy to a range of stakeholders
Deploying approach in case studies & thereby refining approach
• Key challenges Scientific consensus on definition of sustainability
Quantitative & consistent way to implementing indicators &
methodology for evaluating & improving sustainability IALE 2017 Telecoupling Symposium
3 4.2.2.40 Dale: BETO Review 3/ 6/17
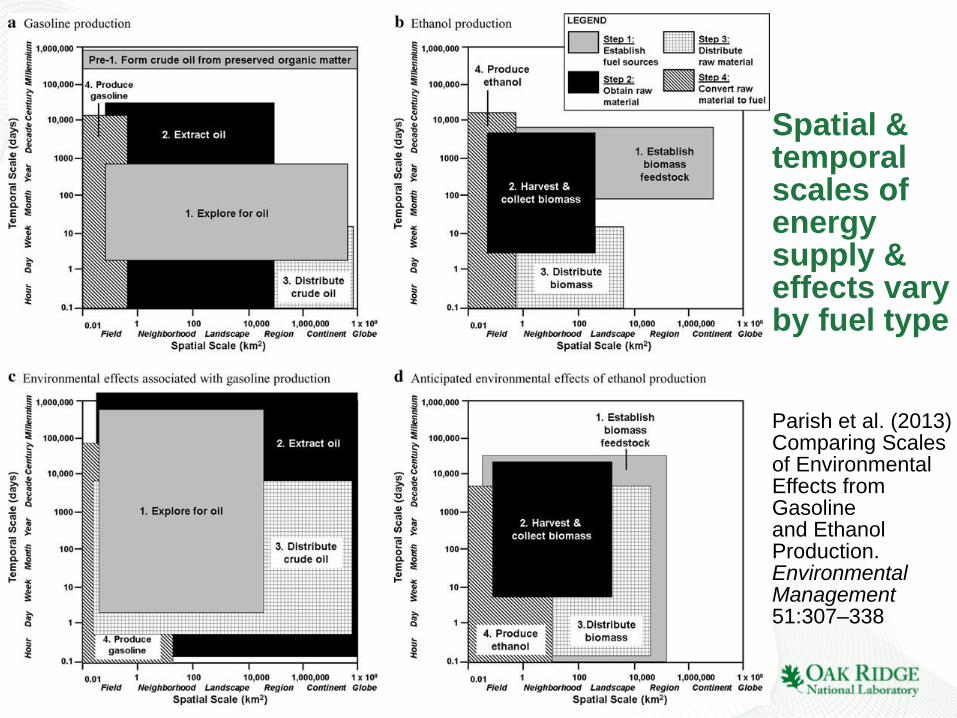
Spatial & temporal scales of energy supply & effects vary by fuel type Parish et al. (2013) Comparing Scales of Environmental Effects from Gasoline and Ethanol Production. Environmental Management 51:307–338
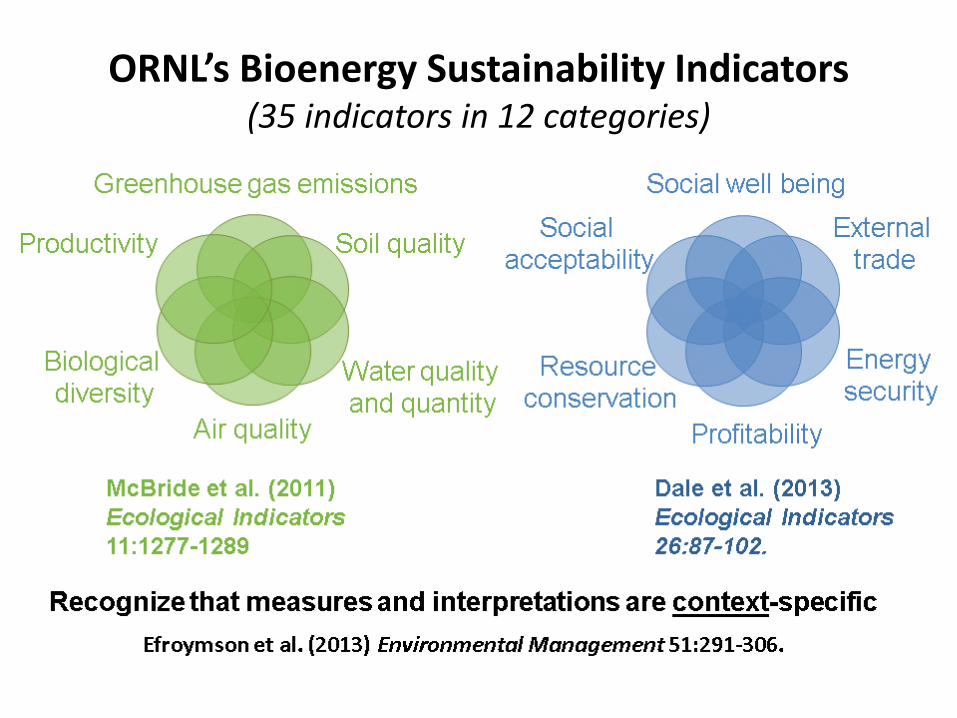
ORNL’s Bioenergy Sustainability Indicators (35 indicators in 12 categories)
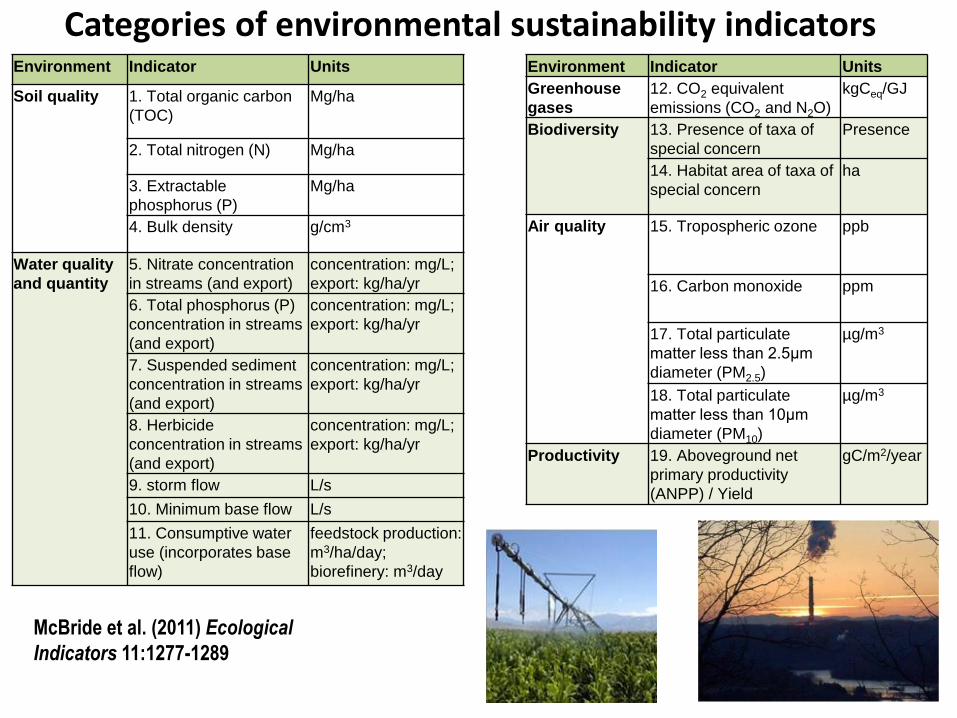
Categories of environmental sustainability indicators Environment Indicator Units
Soil quality
1. Total organic carbon
(TOC)
Mg/ha
2. Total nitrogen (N) Mg/ha
3. Extractable
phosphorus (P)
Mg/ha
4. Bulk density g/cm3
Water quality
and quantity
5. Nitrate concentration
in streams (and export)
concentration: mg/L;
export: kg/ha/yr
6. Total phosphorus (P)
concentration in streams
(and export)
concentration: mg/L;
export: kg/ha/yr
7. Suspended sediment
concentration in streams
(and export)
concentration: mg/L;
export: kg/ha/yr
8. Herbicide
concentration in streams
(and export)
concentration: mg/L;
export: kg/ha/yr
9. storm flow L/s
10. Minimum base flow L/s
11. Consumptive water
use (incorporates base
flow)
feedstock production:
m3/ha/day;
biorefinery: m3/day
Environment Indicator Units
Greenhouse
gases
12. CO2 equivalent
emissions (CO2 and N2O)
kgCeq/GJ
Biodiversity
13. Presence of taxa of
special concern
Presence
14. Habitat area of taxa of
special concern
ha
Air quality
15. Tropospheric ozone ppb
16. Carbon monoxide ppm
17. Total particulate
matter less than 2.5μm
diameter (PM2.5)
µg/m3
18. Total particulate
matter less than 10μm
diameter (PM10)
µg/m3
Productivity 19. Aboveground net
primary productivity
(ANPP) / Yield
gC/m2/year
McBride et al. (2011) Ecological
Indicators 11:1277-1289
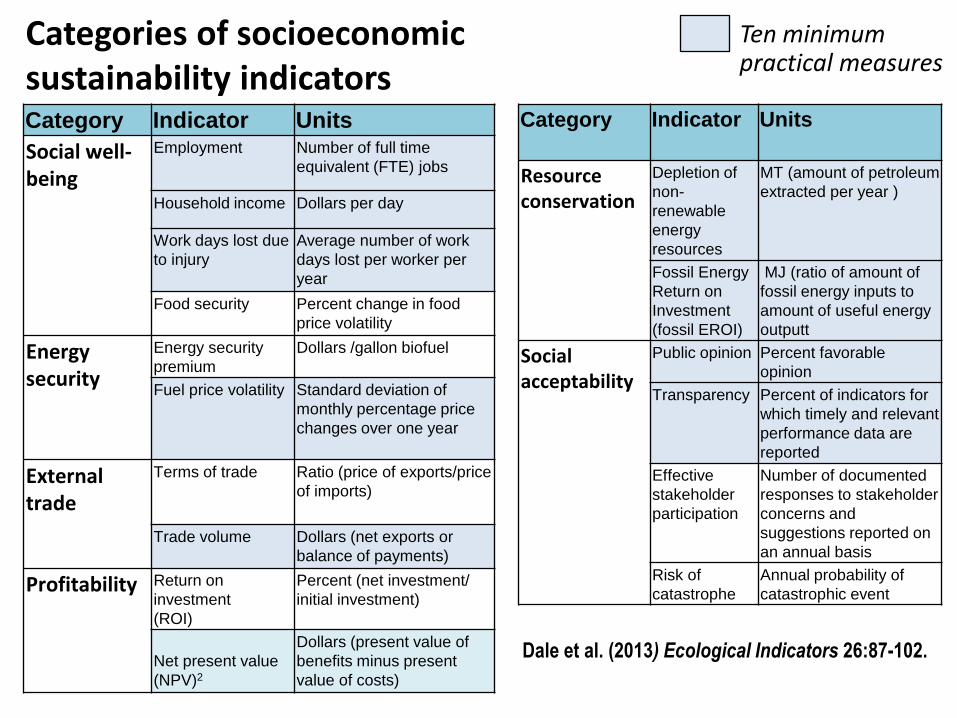
Categories of socioeconomic sustainability indicators Category Indicator Units
Social well- being
Employment Number of full time
equivalent (FTE) jobs
Household income Dollars per day
Work days lost due
to injury
Average number of work
days lost per worker per
year
Food security Percent change in food
price volatility
Energy security
Energy security
premium
Dollars /gallon biofuel
Fuel price volatility Standard deviation of
monthly percentage price
changes over one year
External trade
Terms of trade Ratio (price of exports/price
of imports)
Trade volume Dollars (net exports or
balance of payments)
Profitability Return on
investment
(ROI)
Percent (net investment/
initial investment)
Net present value
(NPV)2
Dollars (present value of
benefits minus present
value of costs)
Category Indicator Units
Resource conservation
Depletion of
non-
renewable
energy
resources
MT (amount of petroleum
extracted per year )
Fossil Energy
Return on
Investment
(fossil EROI)
MJ (ratio of amount of
fossil energy inputs to
amount of useful energy
outputt
Social acceptability
Public opinion Percent favorable
opinion
Transparency Percent of indicators for
which timely and relevant
performance data are
reported
Effective
stakeholder
participation
Number of documented
responses to stakeholder
concerns and
suggestions reported on
an annual basis
Risk of
catastrophe
Annual probability of
catastrophic event
Dale et al. (2013) Ecological Indicators 26:87-102.
Ten minimum practical measures
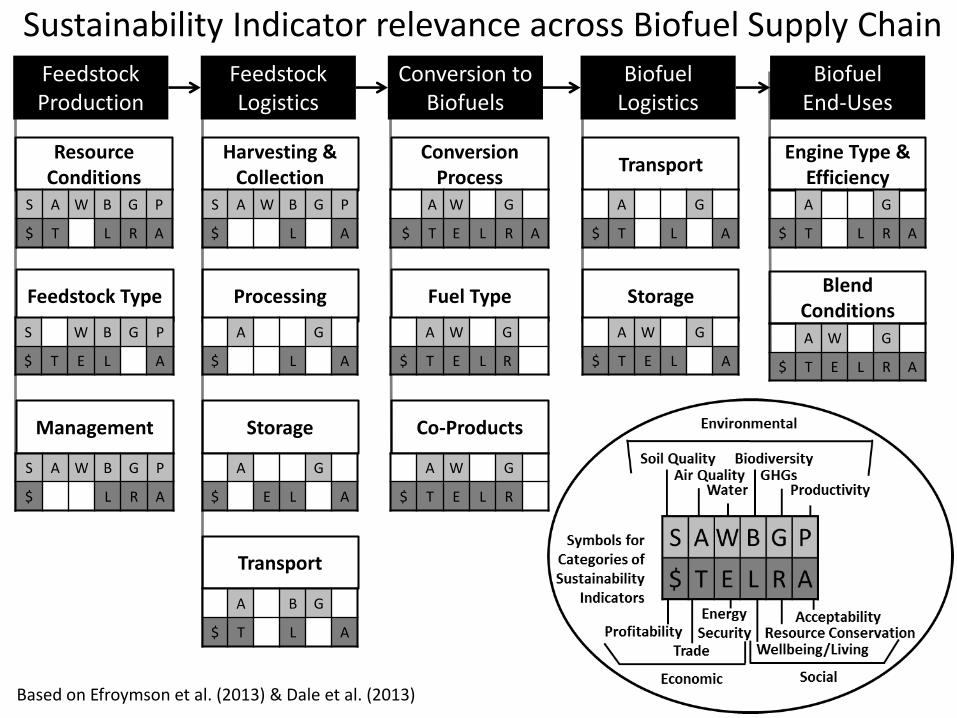
Sustainability Indicator relevance across Biofuel Supply Chain Feedstock Production
Feedstock Logistics
Conversion to Biofuels
Biofuel Logistics
Biofuel End-Uses
Resource Conditions
Feedstock Type
Management
Harvesting & Collection
Processing
Storage
Transport
Conversion Process
Fuel Type
Co-Products
Transport
Storage
Engine Type & Efficiency
Blend Conditions
S A W B G P
$ T L R A
S W B G P
$ T E L A
S A W B G P
$ L R A
A G
$ T L R A
A W G
$ T E L R A
A G
$ T L A
A W G
$ T E L A
A W G
$ T E L R
A W G
$ T E L R
A W G
$ T E L R A
S A W B G P
$ L A
A G
$ L A
A G
$ E L A
A B G
$ T L A
Based on Efroymson et al. (2013) & Dale et al. (2013)

First case study: Switchgrass in east TN
• Dale et al. (2011) Ecological Applications 21(4):1039-1054. • Parish et al. (2012) Bioprod. Bioref. 6(1):58-72. • Parish (2016) Auburn Speaks: On Biofuels in the Southeast • Parish et al.(2016) Ecosphere 7(2):1-18.
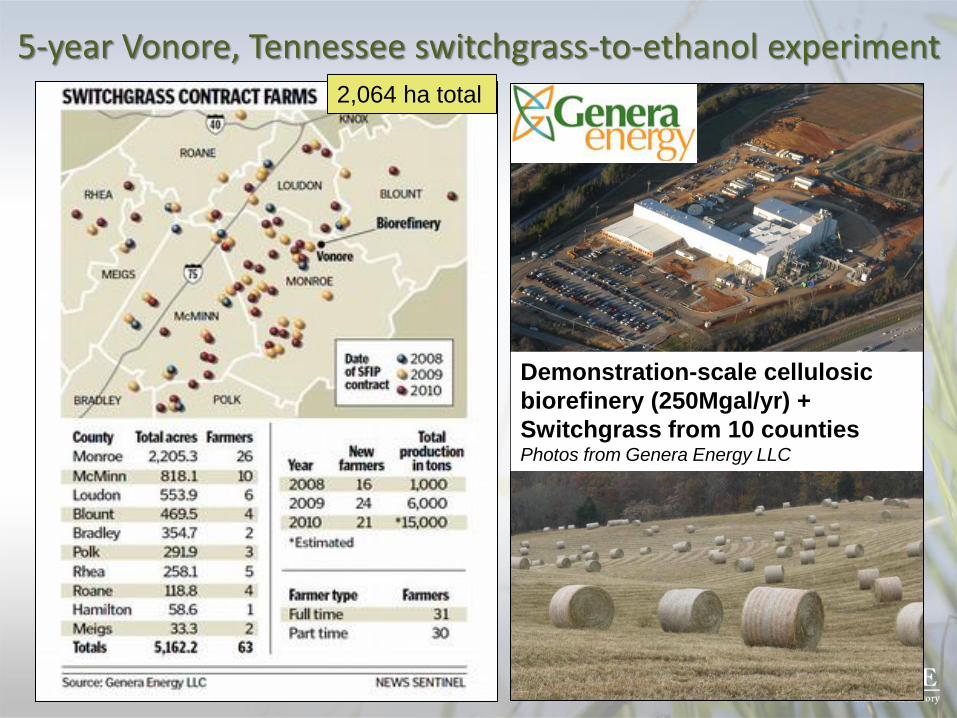
5-year Vonore, Tennessee switchgrass-to-ethanol experiment
Demonstration-scale cellulosic
biorefinery (250Mgal/yr) +
Switchgrass from 10 counties Photos from Genera Energy LLC
2,064 ha total
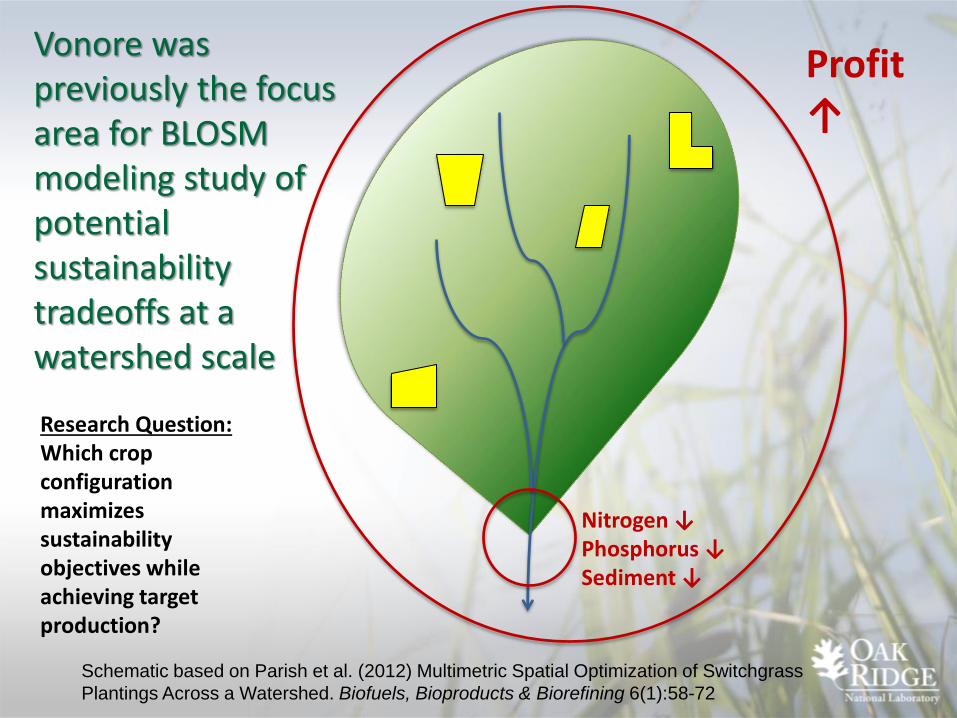
Vonore was previously the focus area for BLOSM modeling study of potential sustainability tradeoffs at a watershed scale
Nitrogen ↓ Phosphorus ↓ Sediment ↓
Profit ↑
Research Question: Which crop configuration maximizes sustainability objectives while achieving target production?
Schematic based on Parish et al. (2012) Multimetric Spatial Optimization of Switchgrass
Plantings Across a Watershed. Biofuels, Bioproducts & Biorefining 6(1):58-72
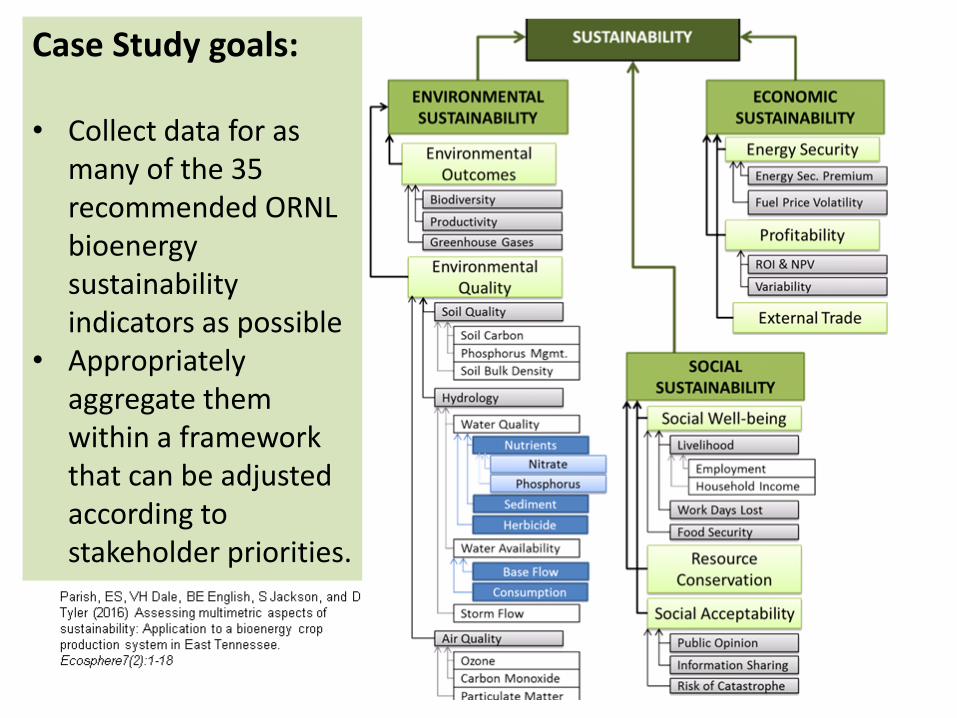
Case Study goals: • Collect data for as
many of the 35 recommended ORNL bioenergy sustainability indicators as possible
• Appropriately aggregate them within a framework that can be adjusted according to stakeholder priorities.
12 Managed by UT-Battelle for the U.S. Department of Energy
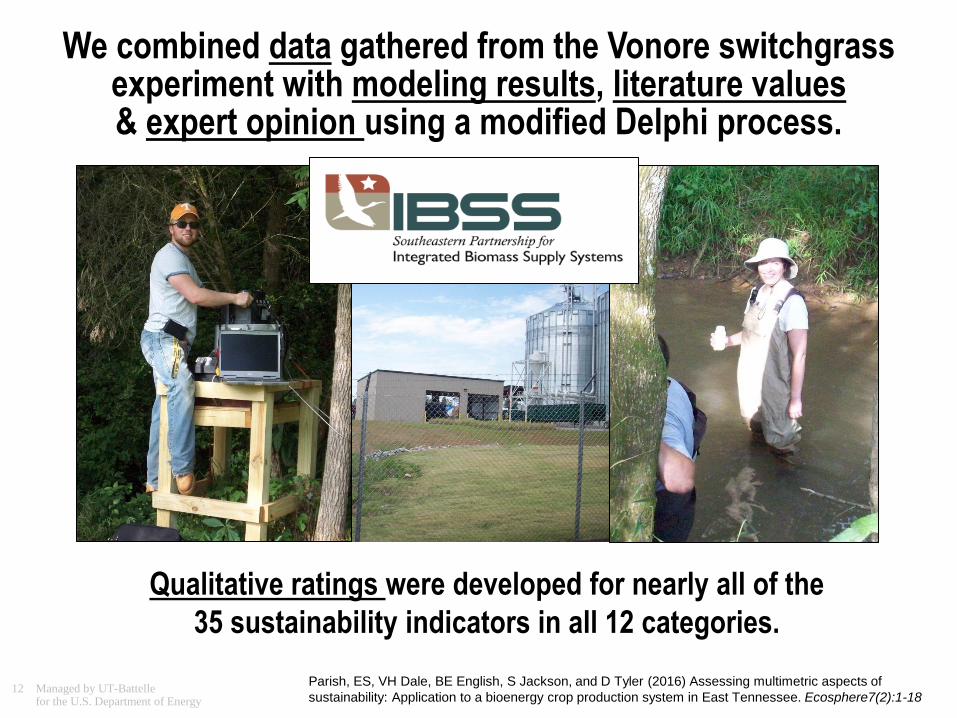
We combined data gathered from the Vonore switchgrass experiment with modeling results, literature values & expert opinion using a modified Delphi process.
Qualitative ratings were developed for nearly all of the
35 sustainability indicators in all 12 categories.
Parish, ES, VH Dale, BE English, S Jackson, and D Tyler (2016) Assessing multimetric aspects of
sustainability: Application to a bioenergy crop production system in East Tennessee. Ecosphere7(2):1-18

13 Parish_ASA_Nov2014
We compared 3 agricultural scenarios
Parameter NO-TILL SWITCHGRASS TILLED CORN UNMANAGED PASTURE
Time of planting Establish once in spring; no
replanting
Plant annually Already established
Tillage Type No-till method with a drill is
preferred
Planted conventionally No need for replanting
Harvesting
equipment
Conventional hay equipment Combine Harvest by cows (1.5
acres/cow)
Harvest Frequency Once per year (after Nov. 1 or first
killing frost)
Once a year (October) Continuous
Storage Round bale tarped Trucked off farm None
Herbicide
Application
1-3 applications of glyphosate
herbicide prior to planting
Annual application of
glyphosate herbicide
No herbicide used
Fertilizer
Application
Apply 40 lbs/acre when soil test is
“Low” for P and K
Apply 100-160 lbs/acre
when soil test is “Medium”
No fertilizer used
Typical Yield 6-8 tons/year after 3rd year 114.5 bushels/acre
(average for 2007-2013)
2.1 tons/acre (estimated as
mixed hay)
Price information $450/acre actual contract price;
estimated delivered price=
$71.23/ton ($3.25/ton storage)
$5.04/bushel
(2007-2013 average)
$90.79/ton
(2007-2013 average)
Final Destination 50 million gallon/year Biorefinery
within a one-hour’s drive
Multiple uses of corn grain
throughout the region
On-site cattle roughage
Parish, ES, VH Dale, BE English, S Jackson, and D Tyler (2016) Assessing multimetric aspects of
sustainability: Application to a bioenergy crop production system in East Tennessee. Ecosphere7(2):1-18
14 Parish_ASA_Nov2014
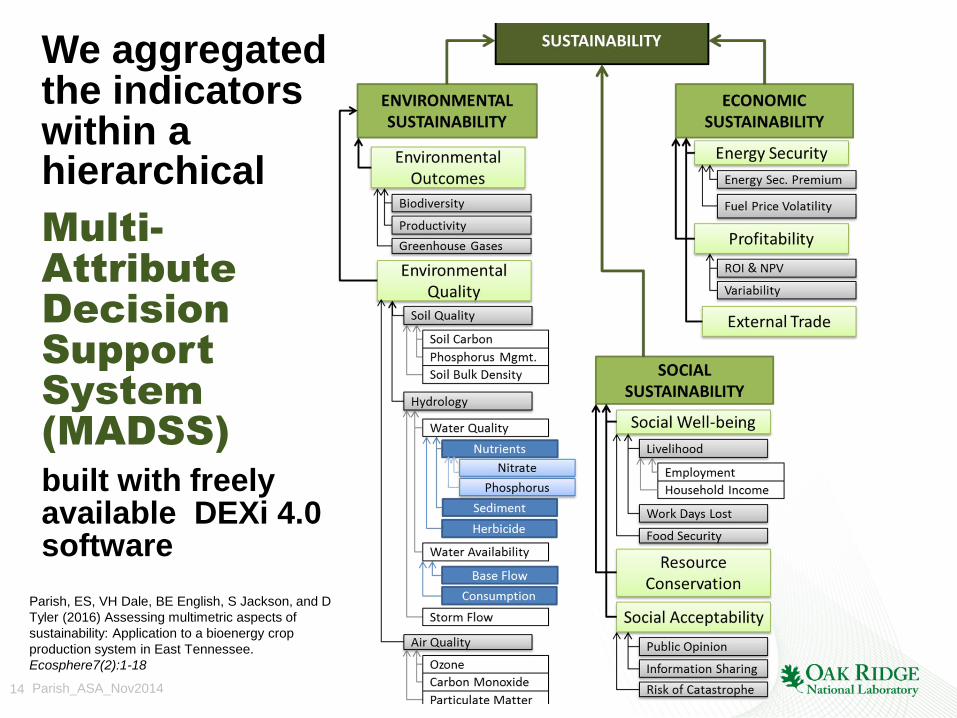
We aggregated the indicators within a hierarchical
Multi-
Attribute
Decision
Support
System
(MADSS)
built with freely available DEXi 4.0 software
Parish, ES, VH Dale, BE English, S Jackson, and D
Tyler (2016) Assessing multimetric aspects of
sustainability: Application to a bioenergy crop
production system in East Tennessee.
Ecosphere7(2):1-18
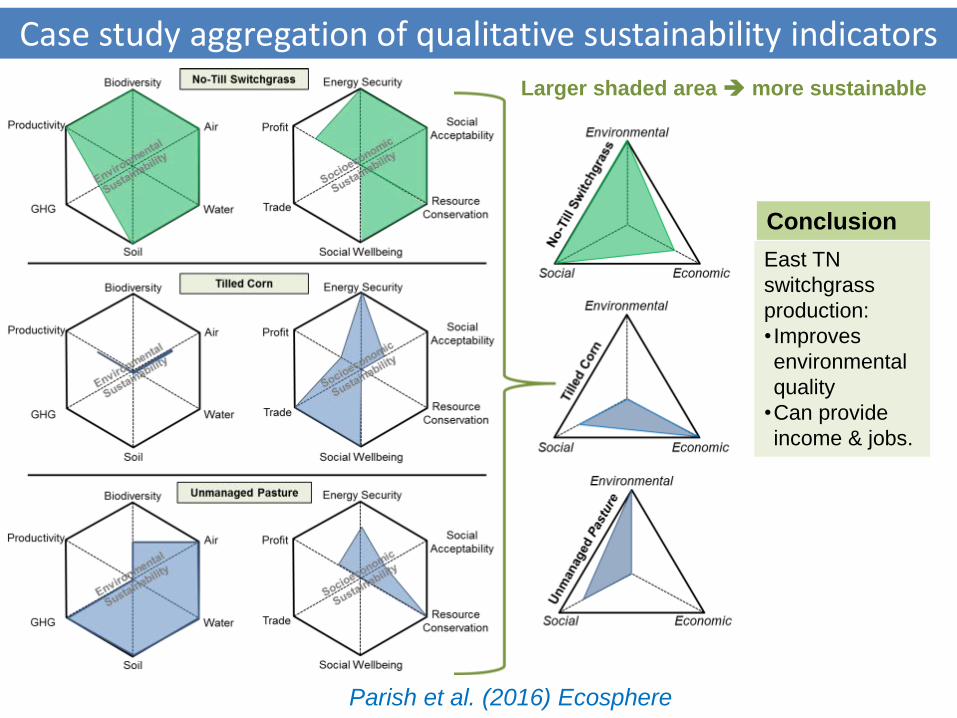
Case study aggregation of qualitative sustainability indicators
Parish et al. (2016) Ecosphere
Conclusion
East TN
switchgrass
production:
• Improves
environmental
quality
•Can provide
income & jobs.
Larger shaded area more sustainable
16 4.2.2.40 Dale: BETO Review 3/ 6/17
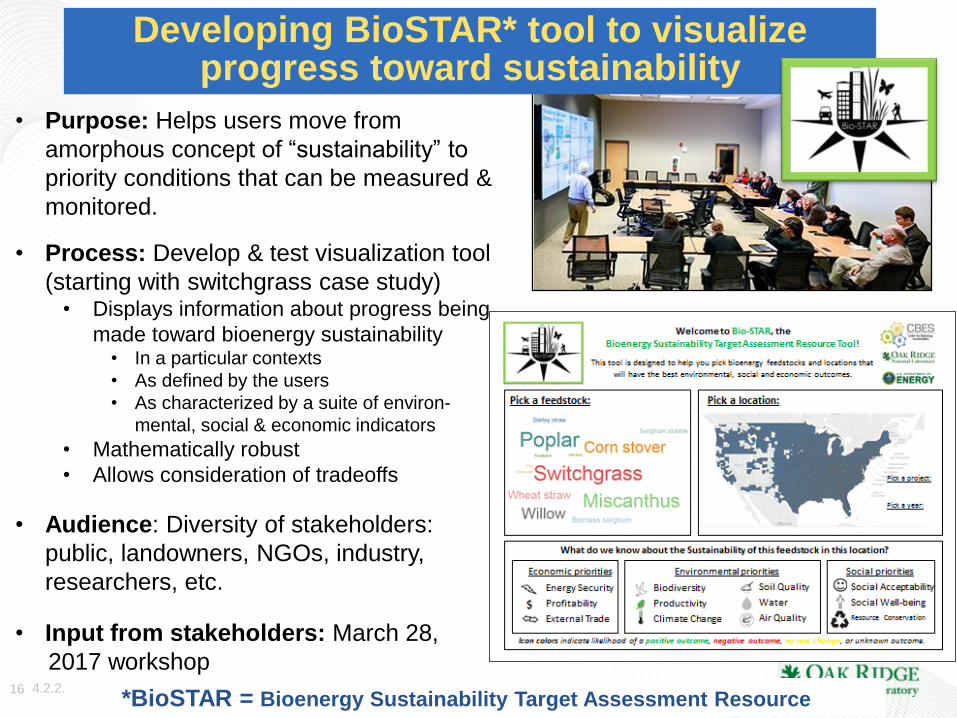
Developing BioSTAR* tool to visualize progress toward sustainability
• Purpose: Helps users move from
amorphous concept of “sustainability” to
priority conditions that can be measured &
monitored.
• Process: Develop & test visualization tool
(starting with switchgrass case study) • Displays information about progress being
made toward bioenergy sustainability • In a particular contexts
• As defined by the users
• As characterized by a suite of environ-
mental, social & economic indicators
• Mathematically robust
• Allows consideration of tradeoffs
• Audience: Diversity of stakeholders:
public, landowners, NGOs, industry,
researchers, etc.
• Input from stakeholders: March 28,
2017 workshop
*BioSTAR = Bioenergy Sustainability Target Assessment Resource
17 4.2.2.40 Dale: BETO Review 3/ 6/17
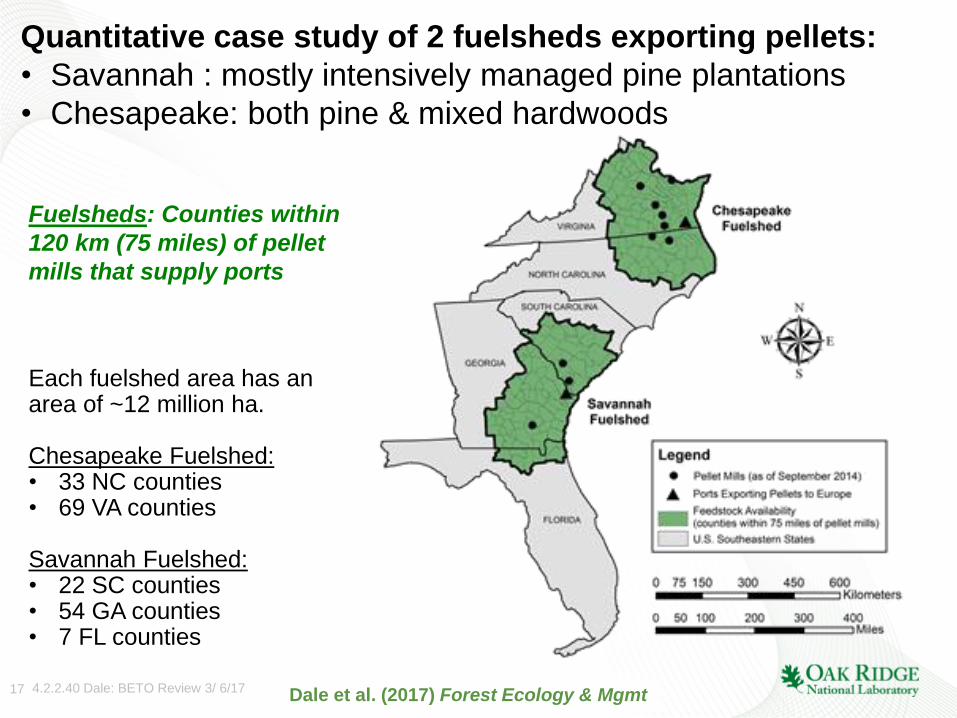
Fuelsheds: Counties within
120 km (75 miles) of pellet
mills that supply ports
Quantitative case study of 2 fuelsheds exporting pellets:
• Savannah : mostly intensively managed pine plantations
• Chesapeake: both pine & mixed hardwoods
Each fuelshed area has an area of ~12 million ha. Chesapeake Fuelshed: • 33 NC counties • 69 VA counties
Savannah Fuelshed: • 22 SC counties • 54 GA counties • 7 FL counties
Dale et al. (2017) Forest Ecology & Mgmt
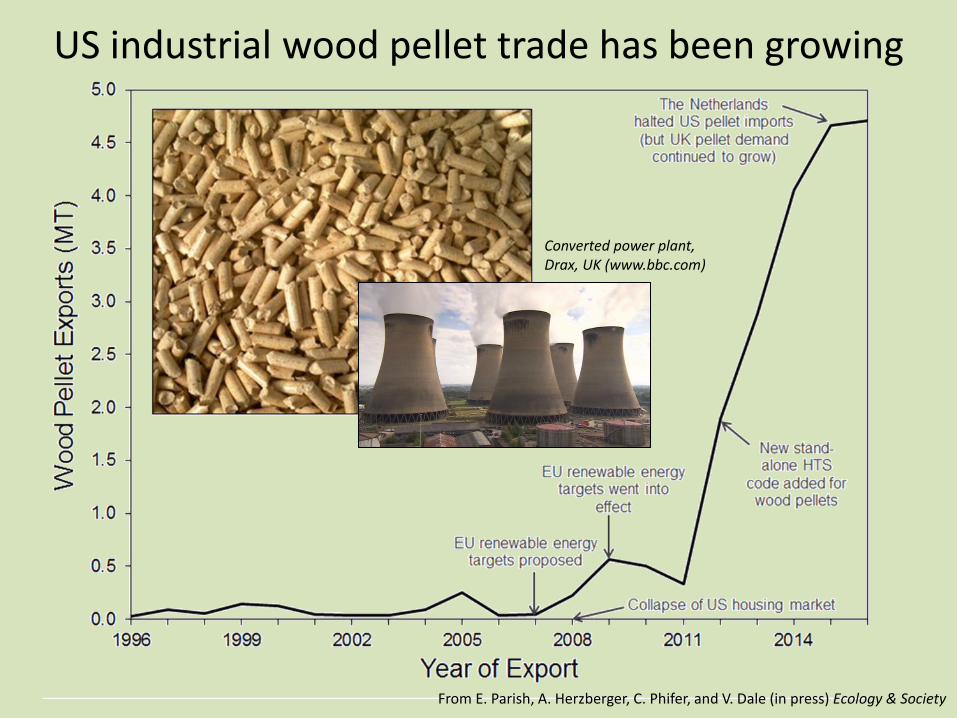
US industrial wood pellet trade has been growing
Converted power plant, Drax, UK (www.bbc.com)
From E. Parish, A. Herzberger, C. Phifer, and V. Dale (in press) Ecology & Society
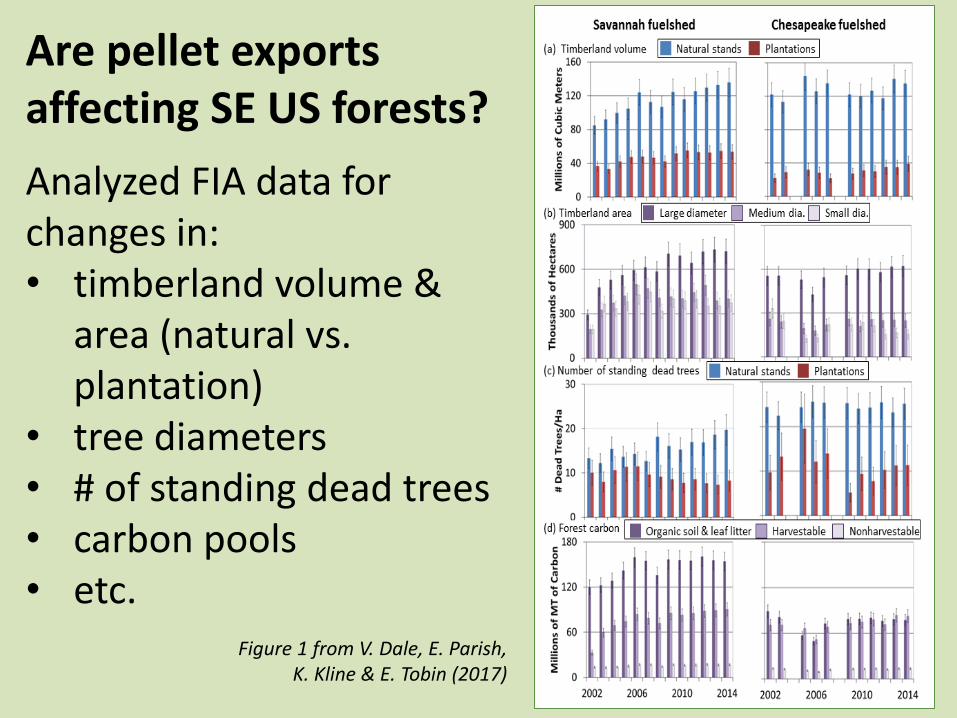
Are pellet exports affecting SE US forests?
Analyzed FIA data for changes in: • timberland volume &
area (natural vs. plantation)
• tree diameters • # of standing dead trees • carbon pools • etc.
Figure 1 from V. Dale, E. Parish, K. Kline & E. Tobin (2017)
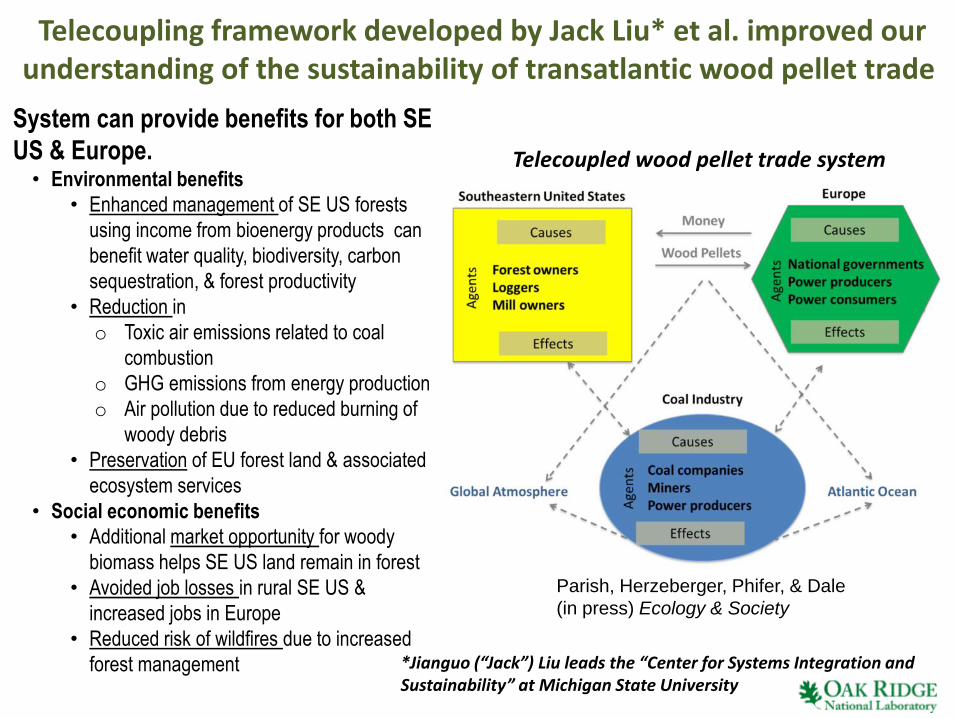
Telecoupling framework developed by Jack Liu* et al. improved our understanding of the sustainability of transatlantic wood pellet trade
System can provide benefits for both SE
US & Europe. • Environmental benefits
• Enhanced management of SE US forests
using income from bioenergy products can
benefit water quality, biodiversity, carbon
sequestration, & forest productivity
• Reduction in
o Toxic air emissions related to coal
combustion
o GHG emissions from energy production
o Air pollution due to reduced burning of
woody debris
• Preservation of EU forest land & associated
ecosystem services
• Social economic benefits
• Additional market opportunity for woody
biomass helps SE US land remain in forest
• Avoided job losses in rural SE US &
increased jobs in Europe
• Reduced risk of wildfires due to increased
forest management
Parish, Herzeberger, Phifer, & Dale
(in press) Ecology & Society
Telecoupled wood pellet trade system
*Jianguo (“Jack”) Liu leads the “Center for Systems Integration and Sustainability” at Michigan State University
21 4.2.2.40 Dale: BETO Review 3/ 6/17
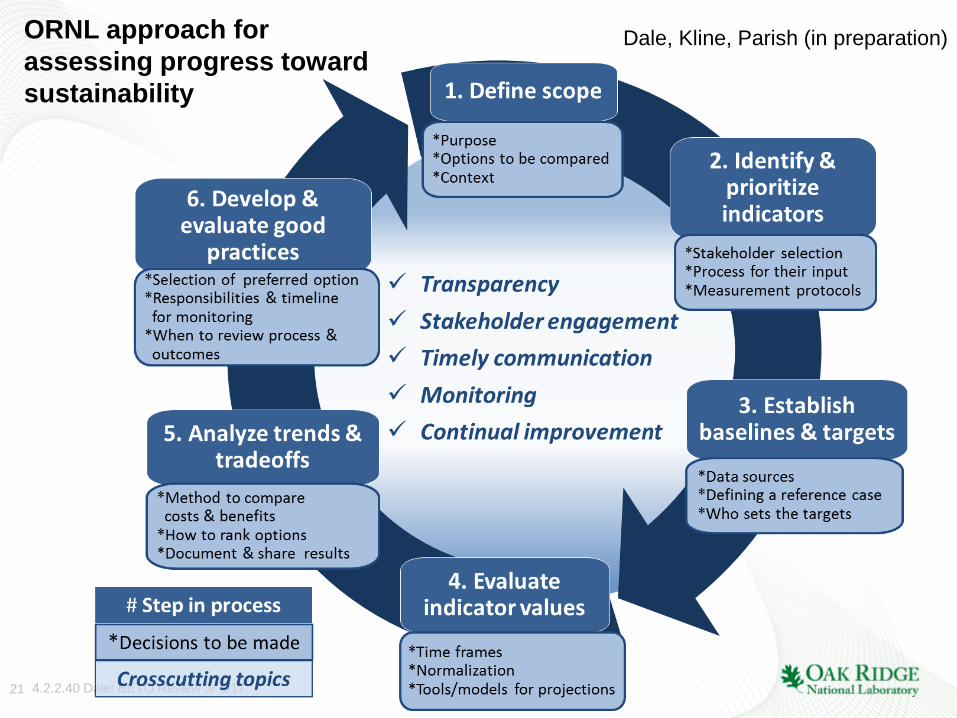
ORNL approach for
assessing progress toward
sustainability
Dale, Kline, Parish (in preparation)
22 4.2.2.40 Dale: BETO Review 3/ 6/17
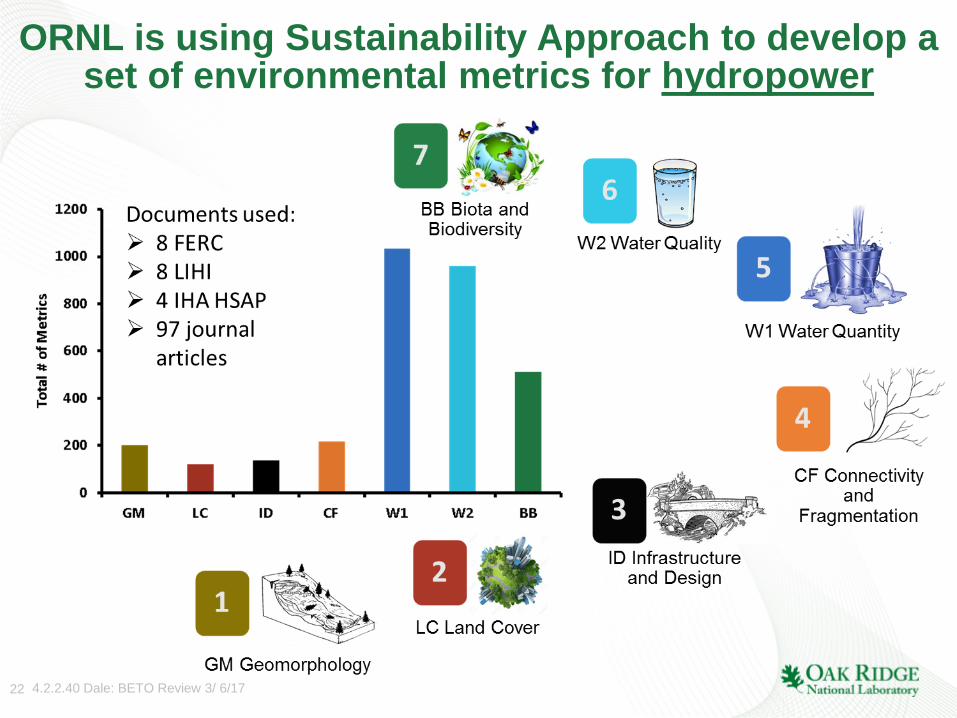
ORNL is using Sustainability Approach to develop a set of environmental metrics for hydropower
23 4.2.2.40 Dale: BETO Review 3/ 6/17
https://cbes.ornl.gov/
Thank you! Questions?
ACKNOWLEDGMENTS
Funding for a portion of this research was provided by the US Department of
Energy (DOE) under the Bioenergy Technologies Office (BETO). Oak Ridge
National Laboratory (ORNL) is managed by UT-Battelle, LLC, for DOE under
contract DE-AC05-00OR22725. Co-authors include Virginia Dale & Keith Kline.
Publications and factsheets related
to ORNL’s Bioenergy Sustainability
research