Development of a Test Bench to Study Self-Loosening of...
139
Development of a Test Bench to Study Self-Loosening of Bolted Joints by Amir HASRAK THESIS PRESENTED TO ÉCOLE DE TECHNOLOGIE SUPÉRIEURE IN PARTIAL FULFILLMENT FOR A MASTER’S DEGREE WITH THESIS IN MECHANICAL ENGINEERING M.A.Sc. MONTREAL, SEPTEMBER 25 2018 ÉCOLE DE TECHNOLOGIE SUPÉRIEURE UNIVERSITÉ DU QUÉBEC
Transcript of Development of a Test Bench to Study Self-Loosening of...

Development of a Test Bench to Study Self-Loosening of Bolted Joints
by
Amir HASRAK
THESIS PRESENTED TO ÉCOLE DE TECHNOLOGIE SUPÉRIEURE IN PARTIAL FULFILLMENT FOR A MASTER’S DEGREE
WITH THESIS IN MECHANICAL ENGINEERING M.A.Sc.
MONTREAL, SEPTEMBER 25 2018
ÉCOLE DE TECHNOLOGIE SUPÉRIEURE UNIVERSITÉ DU QUÉBEC

This Creative Commons licence allows readers to download this work and share it with others as long as the
author is credited. The content of this work can’t be modified in any way or used commercially.

BOARD OF EXAMINERS
THIS THESIS HAS BEEN EVALUATED
BY THE FOLLOWING BOARD OF EXAMINERS Prof. Hakim Bouzid, Thesis Supervisor Mechanical Engineering Department at École de Technologie Supérieure Prof. Anh Dung Ngo, President of the Board of Examiners Mechanical Engineering Department at École de Technologie Supérieure Prof. Mohammad Jahazi, Member of the jury Mechanical Engineering Department at École de Technologie Supérieure
THIS THESIS WAS PRENSENTED AND DEFENDED
IN THE PRESENCE OF A BOARD OF EXAMINERS AND PUBLIC
SEPTEMBER 7th, 2018
AT ÉCOLE DE TECHNOLOGIE SUPÉRIEURE


ACKNOWLEDGMENT
I would like to thank my thesis supervisor, Hakim Bouzid, for his technical, financial, and
moral support throughout these years. His great experience in experimental and analytical
research was always a trustable reference and his attitude to share his experience with his
students was always encouraging.
My special thanks go to Mr. Ngo and Mr. Jahazi for their participation to the board of
examiners.
I would like to thank my wife for her patience, support, and encouragement during my study
and my parents who inspired me with their guidance and open mind. Finally, I would like to
thank my son, Rodmehr, for giving me motivation to overcome my hard days of work and his
patience when I am away for work.
This research was enabled in part by support provided by Calcul Quebec
(www.calculquebec.ca) and Compute Canada (www.computecanada.ca)


DÉVELOPPEMENT D'UN BANC D'ESSAI POUR ÉTUDIER L'AUTO-DESSERAGE DES JOINTS BOULONNÉS
Amir HASRAK
RÉSUMÉ
Les méthodes courantes pour étudier l'auto-desserrage des assemblages boulonnés sont la théorie, les simulations numériques et l'expérimentation. Les méthodes théorique et numérique, utilisant principalement la méthode des éléments finis, sont utilisées pour comprendre, évaluer et quantifier ce phénomène, tandis que la méthode expérimentale est surtout utilisée à des fins de validation et de vérification. La plupart des études expérimentales précédentes sur l'auto-desserrage des assemblages boulonnés ont été réalisées avec une machine d'essai connue sous le nom de Machine Junker qui utilise une cellule de charge conventionnelle et un capteur de rotation qui modifient la géométrie de l’assemblage et les conditions de charge. L'insertion d'un capteur de force ou d'un capteur de rotation modifie la longueur de serrage et la rigidité de l’assemblage, qui sont tous deux des facteurs importants pour l'intégrité du système et le comportement d'auto-desserrage. La non-utilisation de ces capteurs peut grandement simplifier l'étude des assemblages boulonnés et des principaux paramètres. Il est important de ne pas modifier la longueur de serrage et la rigidité de l’assemblage lorsqu'elles sont le sujet principal de l'étude. Dans la conception du banc d'essai actuel, la géométrie de l'assemblage boulonné est exactement la même que dans l'application réelle et dans l'analyse par éléments finis utilisée pour la validation. Le banc d'essai conçu offre la possibilité d'étudier des assemblages boulonnés de différentes épaisseurs de pièces de serrage en combinaison avec différentes pré-charges et déplacements latéraux imposés. Un système de collecte de données numériques est mis en place pour fournir la possibilité de mesurer et d'enregistrer la charge axiale du boulon (précharge), le déplacement latéral imposé et la force latérale résultante, la rotation relative de la vis par rapport à l’écrou, la température, le temps et le nombre de cycles. Dans un premier temps, un dispositif de serrage a été conçu pour recevoir l’assemblage boulonné et son instrumentation. Une articulation a été fixée à la plaque inférieure pour minimiser les forces et les moments de flexion indésirables. Une analyse par éléments finis de la nouvelle conception a été effectuée pour s’assurer de l'intégrité structurelle des éléments permettant l’assemblage et l’installation des plaques, qui sont le point le plus faible du mécanisme. Les capacités maximales de toutes les autres pièces mécaniques standards sont définies par leurs fabricants respectifs et sont comparées aux résultats de l’analyse par éléments finis. Dans la deuxième étape, les engrenages d'entraînement du système bielle-manivelle ont été modifiés afin d'améliorer leurs performances pour s'adapter aux nouvelles connexions. Dans la troisième étape, deux ensembles de pièces ont été conçus pour recevoir le capteur de déplacement latéral et le capteur de rotation. Les deux ensembles ont été conçus pour s'adapter à différents contextes d'essai en utilisant des calles simples et peu coûteux. Un compteur magnétique numérique est ajouté au système pour enregistrer le nombre de cycles.

VIII
Un thermocouple a également été envisagé pour mesurer la température des plaques dans le cadre d'études ultérieures. Comme dernière étape, tous les capteurs ont été connecté à un ordinateur par l'intermédiaire d'une carte d’acquisition et de control de données et une carte PCB. Le système de collecte de données est visualisé et contrôlé par le logiciel LabView. Pour des fins de validation et des essais préliminaires, une analyse complète 3D par éléments finis de l’assemblage a été réalisée et les résultats ont été comparés à des essais expérimentaux. Dans cette étape, un assemble composé de deux plaques d'acier (d'une épaisseur de 10 mm), de deux rondelles d'acier, d'un boulon et d'un écrou a été évalué. Les résultats montrent que la machine développée est fonctionnelle et peut être utilisée pour la prochaine étape de la recherche. Mots-Clés: Auto-desserrage, analyse par éléments finis, pré-charges, force latérale, déplacements latérale.

DEVELOPMENT OF A TEST BENCH TO STUDY SELF-LOOSENING OF BOLTED JOINTS
Amir Hasrak
ABSTRACT
Common methodologies to study self-loosening of bolted joint are analytical, finite element, and experimental. Analytical and finite element methods are used to find, evaluate, and quantify this phenomenon while the experimental method is mostly used for validation and verification purposes. Most of the previous experimental studies on self-loosening of bolted joints have been performed with a test machine known as Junker Machine which uses a conventional load cell and a rotation sensor which change the geometry of the joint and loading condition. Inserting a load cell or a rotation sensor changes the clamping length and joint stiffness, which both are important factors in joint integrity and self-loosening behavior. Their non-use of load cell can greatly simplify the study of bolted joints and the investigation of other parameters. It is important to not alter the clamping length and stiffness of the joint when they are the main subject of study. In the design of the current test rig, the geometry of the bolted joint is maintained exactly the same as in the real application and in the finite element analysis used for validation. The designed test bench provides the possibility of studying bolted joints with different thicknesses of clamping parts in combination with different preloads and lateral imposed displacements. A digital data gathering system is put in place to provide the possibility of measuring and recording of bolt axial load (preload), imposed lateral displacement and resulting force, relevant rotation of the bolt and nut, temperature, time and number of cycles. In the first step, a clamping device was designed to accommodate the test plate clamping joints and its instrumentation. A universal joint has been attached to the lower plate to minimize undesirable bending force and moments. A finite element analysis of the new design has been carried out to ensure the integrity of the plate attachments which are the weakest point in the mechanism. The maximum capacity of all other standard mechanical parts is defined by their respective manufacturers and are compared with results from the analysis. In the second step, the driving gears and crank system have been repaired and modified to improve their performance to adapt with the new connections. In the third step, two mounting assemblies have been designed to hold the lateral displacement sensor and the rotation sensor. Both assemblies have been designed to accommodate different test settings using simple and low cost inserts. A digital magnetic counter is added to the system to record the number of cycles. A thermocouple has also been considered to measure temperature of plates in further studies. As the last step, all sensors have been connected and synchronized to a computer via a PCB. Data gathering system is visualized and controlled by LabView software. As the first phase of the project, a full 3D FE analysis of the joint has been performed and results have been compared to experimental test. In this step, a clamping joint consisting of

X
two steel plates (with 10 mm thickness), two steel washers, a bolt and a nut has been evaluated. The results show that the developed machine is functional and can be used for the next step of the research. Keywords: Self-loosening, FE analysis, preload, lateral force, lateral displacement.

TABLE OF CONTENTS
Page
INTRODUCTION .....................................................................................................................1
CHAPTER 1 LITERATURE REVIEW ............................................................................7 1.1 Introduction to previous work studies............................................................................7 1.2 Analytical modeling .......................................................................................................9 1.3 Experimental studies ....................................................................................................16 1.4 Finite Element ..............................................................................................................20 1.5 Objectives of the current study ....................................................................................24
CHAPTER 2 EXPERIMENTAL TEST RIG ..................................................................27 2.1 General description of the developed test rig ..............................................................27 2.2 Requirements and limitations ......................................................................................30 2.3 Preload sensor ..............................................................................................................32 2.4 Rotation sensor .............................................................................................................41 2.5 Lateral load cell............................................................................................................47 2.6 LVDT displacement sensor ..........................................................................................54 2.7 Cycle counter ...............................................................................................................58 2.8 Test plates ....................................................................................................................59 2.9 Data acquisition system ...............................................................................................61
CHAPTER 3 FINITE ELEMENT ANALYSIS ..............................................................65 3.1 Description of general model simulation .....................................................................65 3.2 Material description .....................................................................................................65 3.3 Geometry......................................................................................................................66 3.4 Meshing........................................................................................................................70 3.5 Mesh convergence criteria ...........................................................................................76 3.6 Boundary conditions ....................................................................................................76 3.7 High-Performance Computing of Calcul Quebec. .......................................................80 3.8 Post-Processing ............................................................................................................81
CHAPTER 4 DISCUSSION OF RESULTS....................................................................83 4.1 Introduction ..................................................................................................................83 4.2 Experimental results.....................................................................................................83 4.3 Finite element results ...................................................................................................94
CONCLUSION ..................................................................................................................105
FUTURE STUDIES...............................................................................................................109
APPENDIX I ..................................................................................................................111
LIST OF BIBLIOGRAPHICAL REFERENCES ..................................................................113


LIST OF TABLES
Page
Table 2-1 Boundary condition reaction- relative displacement of plates ................................52
Table 4-1 Effect of preload on self-loosening .........................................................................91


LIST OF FIGURES
Page
Figure 1-1 Self-loosening process (Jiang, Zhang, & Lee, 2006) ...................................7
Figure 1-2 Theoretical and experimental comparison of the self-loosening behavior for the bolt-nut assembly for five wedge angles under a preload of 12000 N (Yang & Nassar, 2011a) .........................................10
Figure 1-3 Effect of the hole clearance on loosening behavior (Yang & Nassar, 2011b) ............................................................................11
Figure 1-4 Effect of bolt grip length on the threshold preload for ½”-13 fasteners at 0.365 mm excitation (A. M. Zaki et al., 2011). ......................12
Figure 1-5 Effect of Young’s modulus of bolt material on the threshold preload (Yang et al., 2010) ........................................................................12
Figure 1-6 Effect of under head conical angle on the self-loosening behavior (A. M. Zaki et al., 2012) .............................................................14
Figure 1-7 Free body diagram of bolt and nut thread contact (Zhang et al., 2007) .....15
Figure 1-8 Effect of friction combination on the rate of self-loosening (A. Zaki et al., 2010) ..................................................................................15
Figure 1-9 Experimental Setup (Jiang et al., 2006) .....................................................17
Figure 1-10 Test setup developed by Nassar & Housari (Nassar & Housari, 2007) .....18
Figure 1-11 Section view of test machine used by (Eccles et al., 2010) .......................19
Figure 1-12 section view of test machine (Sawa et al., 2012) .......................................20
Figure 1-13 Simplified model of thread’s contact (Zhang et al., 2007) ........................21
Figure 1-14 Finite element result of studied joints (Sawa et al., 2012) .........................22
Figure 1-15 FEA model of the eccentric nut (Sawa et al., 2010) ..................................23
Figure 1-16 Comparison of loosening in joints with hexagon and eccentric nut (Sawa et al., 2010) .....................................................................................24

XVI
Figure 2-1 Fatigue and endurance testing machine (Systems Integrators LLC, 2011) ...............................................................28
Figure 2-2 Main board and electrical kit assembly .....................................................29
Figure 2-3 Grip length before inserting load cell ........................................................32
Figure 2-4 Grip length after inserting load cell ...........................................................33
Figure 2-5 Strain gage (KYOWA Catalog, See APPENDIX I) ..................................34
Figure 2-6 Cylinder with and without hole ..................................................................35
Figure 2-7 Preload sensor position in the bolt .............................................................35
Figure 2-8 Effect of tolerance on inclination angle .....................................................36
Figure 2-9 Installation fixture ......................................................................................38
Figure 2-10 Adapter, Part A .........................................................................................38
Figure 2-11 Adapter, Part B...........................................................................................39
Figure 2-12 Adapter set with bolt ..................................................................................39
Figure 2-13 Bolt calibration results ...............................................................................40
Figure 2-14 Bolt strain stability results .........................................................................40
Figure 2-15 Strain gage installed in the bolt ..................................................................41
Figure 2-16 Rotation sensor (MIDORI_PRECISIONS, 2009) .....................................42
Figure 2-17 Sensor’s support .........................................................................................42
Figure 2-18 Nut holder ..................................................................................................43
Figure 2-19 Spacer - M12 bolt and 10mm plates assembly ..........................................44
Figure 2-20 Fixture of rotation sensor ...........................................................................45
Figure 2-21 Section of rotation fixture ..........................................................................46
Figure 2-22 Bolt model with notch on the end ..............................................................46
Figure 2-23 Calibration of rotation sensor .....................................................................47
Figure 2-24 Test set-up ..................................................................................................48

XVII
Figure 2-25 Plate section in transducer connection area ...............................................49
Figure 2-26 Boundary Conditions .................................................................................50
Figure 2-27 Coordinate system used in FEA results .....................................................50
Figure 2-28 Equivalent stress in axial (Z) direction ......................................................51
Figure 2-29 Equivalent stress around the hole ..............................................................51
Figure 2-30 Equivalent stress distribution through plate thicknesses ...........................52
Figure 2-31 Results of load cell calibration ...................................................................53
Figure 2-32 Macro sensor, CD 375 (TE_Connectivity_Corporation, 2017) .................55
Figure 2-33 Concept of LVDT performance (TE_Connectivity_Corporation, 2017) ......................................................55
Figure 2-34 LVDT fixture .............................................................................................56
Figure 2-35 LVDT holders, position and details ...........................................................57
Figure 2-36 Dimensions of LVDT holders ....................................................................57
Figure 2-37 Results of LVDT calibration ......................................................................58
Figure 2-38 Cycle counter position ...............................................................................59
Figure 2-39 Bolted joint set-up ......................................................................................60
Figure 2-40 Test plate geometry ....................................................................................61
Figure 2-41 A part of the main vi program of LabView ...............................................62
Figure 2-42 Data acquisition user interface ...................................................................63
Figure 3-1 Material definition .....................................................................................66
Figure 3-2 Actual geometry of the bolt’s thread (ASME, 2001) .................................67
Figure 3-3 Simplified geometry of the bolt thread. .....................................................67
Figure 3-4 Actual geometry of the bolt head ...............................................................68
Figure 3-5 Bolt Geometry ............................................................................................68
Figure 3-6 Nut’s geometry...........................................................................................69

XVIII
Figure 3-7 Washer geometry .......................................................................................70
Figure 3-8 Plate geometry ...........................................................................................70
Figure 3-9 Consistant bodies of the nut cylinder and thread .......................................71
Figure 3-10 Meshing of the nut thread and bonded area ...............................................72
Figure 3-11 Meshing of the nut cylinder .......................................................................72
Figure 3-12 Meshing of the plate ...................................................................................72
Figure 3-13 Meshing of the washer ...............................................................................73
Figure 3-14 Bonded area of the washer to the plate .....................................................73
Figure 3-15 Bolt stem, consisting bodies and meshing .................................................74
Figure 3-16 Meshing of the bolt threads........................................................................75
Figure 3-17 Bonding surfaces of the bolt threads and stem ..........................................75
Figure 3-18 Lateral displacement vs. load time .............................................................76
Figure 3-19 Boundary conditions ..................................................................................77
Figure 3-20 Contact between threads ............................................................................78
Figure 3-21 Contact surface between the bolt cap and plate .........................................78
Figure 3-22 Nut to plate contact surface ........................................................................79
Figure 3-23 Plate-to-plate contact surface .....................................................................79
Figure 4-1 Preload vs. Cycles (8.1 KN & 0.025mm) ..................................................84
Figure 4-2 Lateral force vs. Cycles (8.1 KN & 0.025mm) ..........................................85
Figure 4-3 Rotation vs. Cycles (8.1 KN & 0.025mm).................................................85
Figure 4-4 Preload vs. Cycles (7.7 KN & 0.025mm) ..................................................86
Figure 4-5 Lateral force vs. Cycles (7.7 KN & 0.025mm) ..........................................87
Figure 4-6 Rotation vs. Cycles (7.7 KN & 0.025mm).................................................87
Figure 4-7 Preload vs. Cycles (3.2 KN & 0.075mm) ..................................................88

XIX
Figure 4-8 Lateral force vs. Cycles (3.2 KN & 0.075mm) ..........................................88
Figure 4-9 Preload vs. time (Eccles et al., 2010) .........................................................89
Figure 4-10 Rotation vs. Cycles (3.2 KN & 0.075mm).................................................89
Figure 4-11 Preload vs. Cycles (3.9 KN & 0.06mm) ....................................................90
Figure 4-12 Lateral force vs. Cycles (3.9 KN & 0.06mm) ............................................90
Figure 4-13 Rotation vs. Cycles (3.9 KN & 0.06mm)...................................................91
Figure 4-14 Preload vs. Cycles (4.1 & 4.2 KN & 0.005mm) ........................................92
Figure 4-15 Lateral force vs. Cycles (4.1 & 4.2 KN & 0.005mm) ...............................93
Figure 4-16 Rotation vs. Cycles (4.1 & 4.2 KN & 0.005mm) ......................................94
Figure 4-17 Preload (15 KN and 0.44mm) ....................................................................95
Figure 4-18 Lateral force (15 KN and 0.44mm) ............................................................96
Figure 4-19 Rotation (accumulated) (15 KN and 0.44mm) ..........................................96
Figure 4-20 Rotation per cycle (15 KN and 0.44mm) ...................................................97
Figure 4-21 Transverse displacement between threads (15 KN and 0.44mm) in actuation direction ......................................................................................97
Figure 4-22 FE Rotation vs. rotation proposed by (Zhang et al., 2007) ........................98
Figure 4-23 Transverse displacement and rotation per cycle ........................................99
Figure 4-24 Preload drop comparison .........................................................................101
Figure 4-25 Preload drop in 20 cycles (8.1kN and 0.02mm displacement) ................102
Figure 4-26 Lateral force in 20 cycles (8.1kN and 0.02mm displacement) ................102
Figure 4-27 Rotation in 20 cycles (8.1kN and 0.02mm displacement) .......................103


LIST OF ABREVIATIONS 3D Three Dimensional
ANSI American National Standards Institute
APDL ANSYS Parametric Design Language
ASME American Society of Mechanical Engineers
B.C. Boundary Condition
CNC Computer Numerical Control
CPU Central Processing Unit
Deg. Degree
ETS École de Technologie Supérieure
FEA Finite element analysis
GHz Giga Hertz
HPC Hi-performance calculation
ID Identification
IDLH Immediately Dangerous to Life and Health
LVDT Linear Variable Differential Transformer
MAZ Mettre à Zero (set to zero)
MB Mega Byte
NIOSH National Institute for Occupational Safety and Health
OSHA Occupational Safety and Health Administration
PCB Printed Circuit Board
Ppm Parts-Per Notation
R&D Research and Development
TB Tera Byte
UNF Unified National Thread - Fine series
USD United States Dollar
Vs Versus


LIST OF SYMBOLS Kt Total stiffness
Kj Joint stiffness
Kb bolt stiffness,
Kn nut stiffness
Km Member stiffness
Kw washer stiffness
Kp plate stiffness
Ad section areas of the unthreaded portion of bolt
At section areas of the threaded portion,
Lt effective threaded length
Ld length of the unthreaded portion
E Young Modulus
A area
Sy Yield strength
dx Deformation in axial direction
Rotation vector
L Length
PL Preload
D Applied displacement
d Circumferential displacement
β Pitch angle
α Half-apex angle
μ Friction coefficient
t Transverse displacement


INTRODUCTION
0.1 Description of a bolted joint
Bolted joints are the most common non-permanent clamping method in the world because of
their short assembling and dissembling time and low fabrication and maintenance costs. They
are widely used in many industries like automobile, petroleum, power and energy and
construction. The demand for bolted joints and fasteners use in equipment is growing all the
time. According to Shish “The global industrial fastener demand will grow 30% to USD 93.8
billion by 2018, among which global automotive fastener demand accounts for 27.8% (USD
26 billion)” (Shih, 2015).
A basic bolted joint includes at least two mating parts or clamping plates, one bolt and one
nut. In the tightening process of a bolted joint, the helical geometry of the threads converts
the relative angular movement of the bolt and nut to an axial elongation in the bolt. The
elongation in the bolt creates a force in the bolt called preload or axial load. This force is
responsible for the integrity of the joint assembly. Designers might decide to add other
elements to the design of the joint to improve its performance (e.g. washer, spring washer,
lock-washer and lock-nut), but the general behaviour of the joint will remain the same.
Several factors affect preload, such as thread pitch, thread friction, thread angle, stiffness of
the joint, etc. Many studies have been conducted to identify and improve these factors to
increase the efficiency and endurance of bolted joints but there are still many unknown
factors.
0.2 Problems associated to bolted joints
The most important problem associated with bolted joints is the loss of preload. “The key
issue as far as bolt life and integrity are concerned is, however, the tension in it” (Bickford,
2008). In order to keep the integrity of the joint, minimum preload has to be maintained in
the bolt. Problems associated with bolted joints are divided into two categories; a) problems
causing material failure or fracture and b) problems causing loss of preload without material
failure.

2
Fatigue, creep, and over-load are the most important causes of material failure in bolted
joints. Many studies have been conducted to increase bolt life in vibration and high
temperature applications. Although transverse lateral movement can cause fatigue and self-
loosening, the failure process is quite different in each case. Even though mechanical rupture
is a severe failure in a system, self-loosening is, statistically, the most considerable and major
problem in bolted joints. The sources of such problems will not be studied throughout this
research.
When a joint is subjected to transverse lateral movement, depending on the preload
magnitude and other joint parameters, preload might drop with or without relative rotation of
bolt and nut. This phenomenon is called self-loosening. “Self-loosening is the gradual loss of
the clamping force in the bolted connections under cyclic external loading, especially
transverse loading” (Zhang, Jiang, & Lee, 2007). This problem is pervasive in automobile,
aerospace, petroleum, and energy industries. A significant portion of customer service claims
in the automobile industry are caused by the loosening of bolted connections which come at a
significant financial cost to the industry. The most important bolted joint in the petroleum
and energy industries are flanged connections. Any preload drop in flanges increases the
chance of leakage which is problematic in sour, flammable, and explosive services. The
importance of sealing performance is greater when 20ppm of Hydrogen Sulfide (H2S) is
present as the general industry ceiling limit and 100ppm as NIOSH IDLH (Immediately
Dangerous to Life and Health) (OSHA, 2013).
Many parameters can affect preload loss and despite the many pieces of research conducted
to discover and quantify them, there are still many unknown factors in self-loosening.
Friction between threads, between the nut/bolt head and mating parts, and between mating
parts are of the most important factors in self-loosening. The pitch and angle of the threads
also play a large role in the self-loosening of bolted joints. The friction of pitch and angle of
the threads are the determinant factors in self-locking of bolts. The effective factors for self-
loosening will be enumerated in the literature review chapter in greater details.

3
Some solutions, like adding a nut-lock, spring-nut, or spring washer have been suggested and
evaluated to prevent self-loosening. However, no definitive solution has been found up to
now. Some researchers have found and suggested a safe design zone to avoid self-loosening,
but it does not cover all types of bolted joints and as such, the design of joints out of this
range remain in the danger zone.
0.3 Overall aim of the present study
The overall aim of this study is to develop a test rig to evaluate the effect of joint stiffness on
the self-loosening of bolted joints. Stiffness is a dependent variable which depends on the
thickness of plates and material modulus of elasticity of the clamping parts. Both variables
have been studied separately before but their effects have not been studied in term of
stiffness.
The first important study in self-loosening was carried out in 1969 by Junker who invented a
machine to test joints under transverse loads. Some modifications have been applied to his
original design of the machine, known as a Junker machine, to improve its performance, but
the concept remains the same. The basic concept of all self-loosening test machines is the
same; a power source and a linkage mechanism, which serves to convert and transfer power,
usually from an electrical motor, exert lateral movement on the tested bolted joint.
Because commercial self-loosening machines are expensive, which does not fit in this project
budget, and do not fulfill the required conditions, an in-house instrumented bolted joint
system (designed and installed in the lab) is mounted on a simple tensile machine to make a
self-loosening test bench.
The overall aim of the first phase of this research is to develop an instrumented test bench
that can be mounted on a tensile machine which provides cyclic movement to test samples
with different thicknesses. This machine must be able to test a bolted joint consisting of a
bolt, a nut, two plates, and two washers. Studying a bolted joint with different plate
thicknesses will allow us to evaluate the effect of joint stiffness and joint clamping length.

4
In order to study the self-loosening phenomenon, a machine with the following capabilities is
needed:
- Measuring the relative rotation of bolt and nut;
- Measuring the preload;
- Measuring lateral force in mating parts;
- Measuring the relative movement of plates;
- Measuring the test time;
- Counting the number of cycles during the test time;
- Integrating and correlating the above-mentioned parameters.
Most of vibration and repeated loads in nature and in industry are displacement control; this
point obliges all designs to be conducted based on a displacement control. To do so, lateral
displacement can be provided by an electrical motor and displacement amplitude can be
adjusted via a gearbox or variable linkage mechanism. These systems are easier to drive, but
are high in integrity failure risk and stress level control. As a small displacement can cause
high stress, it is very important to find and evaluate the most critical point of the system in
test rig design to avoid any risk of rupture and danger. To make sure that the test bench
works well and the measuring devices are accurate enough, one bolted joint has been
analyzed with FE and the results have been compared to experimental tests done by test
bench.
0.4 Description of the thesis content
In the second chapter, previous research on self-loosening will be reviewed to clarify
problems and methodologies. Different methods and their advantages and disadvantages are
reviewed and discussed and their results are compared.
The steps taken in test bench design are discussed and explained in detail in chapter three.
The general overview of the system, requirements, simplifications, and limitations in the
design process are mentioned. Some of the detailed calculations used in the design and
fabrication of parts are also shown. Detailed drawings of all parts are given in the related
appendices and their functionality is discussed.

5
In chapter four, the performed finite element analysis is explained in detail. The
simplifications and assumptions of the geometry and boundary conditions are also detailed
and the meshing and high-performance calculation information is presented. The tools used
for post-processing and the mesh convergence criteria are discussed as the last subjects in
this chapter.
Chapter five contains all results from the experimental and finite element analysis. The
experimental results are compared to their finite element counterpart and all disparities are
discussed. The experimental and finite element comparison is used to justify the accuracy
and suitability of the test rig.
Chapter six gives the overall conclusion of the performed study and chapter seven presents
some recommendation to improve the rig and future work to be conducted on the study of
self-loosening.


CHAPTER 1
LITERATURE REVIEW
1.1 Introduction to previous work studies
The self-loosening phenomenon is related to bolt load drop and has been identified to happen
in two stages. Stage I involves the gradual clamping force reduction with no relative rotation
of nut and bolt. Cyclic plastic deformation and the resulted stress redistribution and
ratcheting deformation in the bolt are responsible for this first stage of self-loosening (Figure
1-1). Stage II is related to the backing-off of the nut and is associated to the relative motion
of the nut and bolt causing drastic clamp force reduction. Researchers have studied these two
stages using different methods that can be categorised into finite element, analytical, and
experimental studies. Each method has advantages and disadvantages depending on the
parameters of interest.
Figure 1-1 Self-loosening process (Jiang, Zhang, & Lee, 2006)
Analytical methods to treat self-loosening involve complex mathematical equations. The
bolted joint is a statically indeterminate structure that requires the development of a system
of complex equations based on the free body diagrams of the individual joint members and

8
the compatibility equations of the displacements and rotations that exist between them.
Assumptions must be made to simplify the system geometry and equations in order to solve
the problem. A lot of time is required to solve the problem because of the many iterations
involves, but once completed, all the considered variables can be evaluated with reasonable
accuracy. The analytical method is time-consuming and a high-performance computer HPC
should be considered for most cases to solve the differential equations. However, the
analytical model can easily be extended to cover many different applications and other bolted
joint cases by changing the geometry, boundary conditions and loads. The basic differential
equation formulation is determined by the joint parameters; therefore, new mathematical
models must be elaborated for each independent case. Some researchers focused on this
method to develop models for different types of bolts and nuts. Parameters such as preload,
bolt/nut friction with joint members, friction between nut and bolt threads have been
previously studied. Conversely, there have been few theoretical studies about the effect of the
different joint element stiffness’s on the self-loosening of bolted joints which is one of the
purpose for which the rig has been developed.
The finite element method is widely used in all industries. FE modeling of bolted joints is a
relatively a simple task to do nowadays, however the simulation of the self-loosening
mechanism is not a straight forward task to be conducted by even an experienced design
engineer. The modeling is complex and tedious and HPC is still needed. The simplification
of the geometry and the boundary conditions causes some deviation from realistic conditions.
Due to complicated helical geometry and non-linear contact surface behaviour in bolted
joints, special modeling techniques should be used to yield accurate results. Different
material behaviors can be studied more easily with FE when compared to analytical methods.
Researchers in different universities and R&D institutions are using FEA to study different
combination of joint members, materials, material models, and loadings to see how they
affect self-loosening behaviour. In previous studies, stage I and II of self-loosening were
studied and different parameters were covered, but there has not been a study that combines
both stages and the effect of joint stiffness on the self-loosening.

9
The experimental method is the most realistic and preferred mean to study the behavior of
structures in general and the self-loosening of bolted joints in particular. Valuable data can be
obtained by using controlled realistic test conditions; however, cost, measurement limitations
and equipment capacity are some restraints to name a few. It is almost impractical to simulate
certain load cases or joint combinations with laboratory facilities. Experiments are usually
used to verify results derived from other methods such as analytical and numerical
simulations. Most of experimental tests are conducted using a Junker machine used in
conjunction with instruments that may affect the results like the presence of a load cell in a
joint. Indeed, a load cell affects joint stiffness and grip length. In order to avoid such
interference new settings are required to maintain acceptable conditions to study the effect of
joint stiffness. The distinguishing feature of the test rig that was developed for this project is
its faithful representation of the physical behavior of a bolted joint. In this chapter, previous
studies are grouped and reviewed based on the method of analysis used.
1.2 Analytical modeling
Yang et al. (Yang & Nassar, 2012) developed an analytical model to study different
parameters leading to self-loosening of bolted joints. Bolt and nut differential rotational
angle, friction and local slippage behaviour, bolt bending deflection and transverse
displacement, and clamping force are to name a few the results have been compared with
experimental ones. Their results confirm that higher preload leads to a higher self-loosening
resistance.
Yang et al. (Yang & Nassar, 2011a) have also studied the effect of wedge angle on self-
loosening both analytically and experimentally. They proposed a model to predict the self-
loosening and validated their model experimentally using tests on a modified Junker
machine. This model shows that a sufficiently large wedge angle of the nut under head
surface can reduce considerably self-loosening as shown in Figure 1-2.

10
Figure 1-2 Theoretical and experimental comparison of the self-loosening behavior for the bolt-nut assembly for five wedge angles under a preload of
12000 N (Yang & Nassar, 2011a)
The effect of thread profile angle and the clearance of the thread and hole have been studied
using an analytical method (Yang & Nassar, 2011b). They have concluded that increasing the
thread and hole clearance reduces the self-loosening resistance of the joint Figure 1-3. It is
also concluded that increasing the thread profile angle increases the self-loosening resistance
significantly.
A formula to find a preload threshold (minimum initial preload) for self-loosening of
countersunk bolts, depending on their bearing friction, thread pitch, and excitation amplitude
have been developed (Zaki, Nassar, & Yang, 2011). The authors discussed the effect of grip
length, which is an independent factor that joint stiffness depends on. Their results show that
decreasing grip length increases the preload threshold non-linearly, such that a joint with a
grip length 8% shorter needs a 40% bigger preload in order to not be affected by self-
loosening (Figure 1-4). They also confirmed that bearing friction and thread clearance,

11
respectively, have positive and negative effects on self-loosening. The experimental
validation was also conducted on the same machine.
Figure 1-3 Effect of the hole clearance on loosening behavior (Yang & Nassar, 2011b)
Yang et al. proposed a novel criterion for the self-loosening of threaded fasteners. They
developed a new approach to investigate the effect of “bearing and thread friction
coefficients, bolt grip length, thread pitch, material, and the cyclic amplitude of the
transverse excitation” (Yang, Nassar, & Wu, 2010). The new approach illustrates the true
behaviour of the joint in the presence of transversal excitation.
Their results conformed to other research results and confirmed that using fine thread
fasteners improves self-loosening resistance, increasing bearing friction and thread friction
also increases self-loosing resistance significantly, and excitation amplitude is linearly
related to the threshold preload. As illustrated in Figure 1-5, increasing Young modulus
decreases self-loosening resistance, and points to the fact that higher preload is required to
prevent self-loosening.

12
Figure 1-4 Effect of bolt grip length on the threshold preload for ½”-13 fasteners at 0.365 mm excitation
(A. M. Zaki et al., 2011).
Figure 1-5 Effect of Young’s modulus of bolt material on the threshold preload (Yang et al., 2010)

13
Nassar and his research team focused on the analytical method and have performed a number
of studies to investigate other factors and joint types. They studied the effect of thread fit and
hole clearance using analytical and experimental methods (Nassar & Housari, 2007). It was
illustrated that preload drops faster and that less cycles are needed for a complete loosening
when the hole clearance is increased and the applied displacement is significant enough to
slide the bolt all the way through the hole clearance. Thread fit was found to have the same
effect on self-loosening resistance, where a tighter thread fit results in a higher loosening
resistance. A modified Junker machine was used to perform the experimental test. The
experimental and analytical results match well and the deviation between them is justified by
the nominal clearance used in the analytical calculations. Clearance has an exact and distinct
value for each thread designation in the analytical method whereas it can be defined within a
range in the experiment with a max and a min values defined by the standard designation.
In another piece of research, Zaki et al. studied the effects of conical angle and thread pitch
on the self-loosening of a bolted joint in the presence of transverse cyclic displacement (A.
M. Zaki, Nassar, & Yang, 2012). The different steps for the analytical method including the
free body diagram, the compatibility and equilibrium equations, and final solutions are
explained and presented. The pitch, which is defined as the distance between the tips of two
adjacent threads is found to have an important effect on the loosening. However, increasing
conical angle has a direct effect on self-loosening resistance. As illustrated in Figure 1-6,
increasing the conical angle improves the loosening resistance of the joint. Like in other
studies, a modified Junker machine was used for the experimental tests and preload was
measured using a load cell.
Zaki et al. investigated the effect of thread and bearing friction on the self-loosening of
countersunk bolts (A. Zaki, Nassar, & Yang, 2010). As the friction coefficient is directly
influenced by the coating type and thickness, this study helps predicting the effect of coating
on self-loosening. The analytical model they developed was solved using a MATLAB code
and the resulting data showed a good correlation with the experimental results. They defined
different zones of loosening and no-loosening based on thread and bearing friction. The

14
bordered zones define the combinations of thread and bearing friction with excitation
amplitude, so that a loosening life cycle can be estimated. Alternatively, a desired thread and
bearing friction can be found to improve self-loosening resistant in a bolted joint (Figure
1-8). As with the other studies conducted by this research team, the Junker machine was used
to perform the experimental tests.
Figure 1-6 Effect of under head conical angle on the self-loosening behavior (A. M. Zaki et al., 2012)
Zhang et al. performed an analytical study to clarify the self-loosening mechanism. Their
proposed model is based on a simple block sliding in a double inclined plane (Figure
1-7)(Zhang et al., 2007). This model shows that the back-off of the nut, which is the main
reason for preload drop in stage II of self-loosening, is caused by “repeated micro slip
between the contact surfaces of the engaged threads and the reversed bending moment
exerted on the bolt and the nut” (Zhang et al., 2007).
Many different types of self-loosening resistant bolts and nuts have been invented and are
being used in industry. Any combination of bolt and nut makes a different bolted joint that
behaves differently when subjected to lateral vibration. The prevailing torque nut (locknut) is
currently one of the most popular nuts used in industries to enhance loosening resistance.

15
Figure 1-7 Free body diagram of bolt and nut thread contact (Zhang et al., 2007)
Figure 1-8 Effect of friction combination on the rate of self-loosening (A. Zaki et al., 2010)
Eccles et al. investigated the self-loosening behavior of joints with a locknut. Their study
showed that although prevailing torque nuts improves self-loosening resistance, they increase
the chance of complete detachment of the joint when axial load and transverse movement are

16
applied simultaneously (Eccles, Sherrington, & Arnell, 2010). In joints with regular nuts, the
rotation of the nut stops when the axial load of the bolt reaches zero, nevertheless the axial
load provided by the elastic deformation of a locknut presumes the loosening process to the
complete detachment of the nut. The analytical model used in this study is similar to the one
used by Zhang et al. A simplified free body diagram of the bolt and nut thread contact is used
to explain the loosening mechanism based on slippage.
1.3 Experimental studies
Junker performed one of the earliest experimental studies on the self-loosening of bolted
joints. He discussed the theory of loosening and conducted experimental tests with a
machine that laid the groundwork for many future experimental studies (Junker, 1969). The
basic components of his machine are an electrical motor to provide excitation displacement, a
gear and linkage system to control and transfer the displacement, clamps, and sensors to
gather information during the test. He used rollers to reduce friction between the mating
plates and consequently reduces the required lateral force; however, this creates an
unrealistic condition. The displacement control is far from the joint centerline and the
displacement values are influenced by the deformation of other parts. Adding a rotation
measurement device might be the most important modification to study stage II of self-
loosening. This machine is the basic concept for most test rigs although it has been modified
to study different cases. Altogether, he is the founder of self-loosening experimental study.
The finite element and analytical investigations from the following studies are discussed in
the analytical and finite element sections, therefore, only the experimental test rigs are
reviewed in this section.
Zhang et al. performed an experimental study using a hydraulic material testing system to
evaluate the effect of the thickness of the mating parts and the applied load direction in an
M12 bolted joint (Jiang et al., 2006). A load cell is used between the clamp part and the bolt
head to measure axial load. It is important to note that the grip length is one of the two main
factors studied in this research and that using a load cell to measure axial load changes the

17
grip length of the joint and deviates the results from realistic conditions (Figure 1-9). On the
other hand, because joint stiffness is changed by the load cell, the axial force will be also
affected. The investigated joint consists of two plates and two insert plates that serve to
change the thickness of the mating parts. An extensometer is installed on the plates to
measure the relative displacement between the two mating parts. Unfortunately the captured
displacement does not include slippage or the relative displacement of the insert plates and
nut/bolt. A rotation sensor is supported on the nut using a fixture in a way that the tip of the
sensor touches the end of the bolt. The captured rotation is the exact relative rotation of the
bolt and nut. The authors conclude that increasing clamp length and loading angle enhances
self-loosening resistance. This research team used the same machine as (Jiang, Zhang, &
Lee, 2003) to study the effect of preload and excitation.
Figure 1-9 Experimental Setup (Jiang et al., 2006)
Nassar and Housari developed the test setup demonstrated in
Figure 1-10 to study the effects of hole clearance and thread fit using a modified version of
the Junker machine.
An electrical motor with a set of pulleys is used to supply the required displacement to the
mobile plate using an eccentric mechanism. As in other studies, a load cell is used to measure
the axial load of a ½ -13 bolt (equivalent of M14x2). A rotation sensor captures bolt head

18
rotation via a short belt that is connected to a mounted socket cap on the bolt head. Slippage
between the belt and cap and the belt and sensor pulley can be a source of error for the
rotation measurement. In the current study, the rotation sensor is connected to the bolt
directly to avoid such a problem. The eccentric mechanism gives the capability to provide
different excitation amplitudes. As previously discussed in section 1.2, the authors concluded
that a tighter tolerance in both plate holes and threads increases self-loosening resistance
(Nassar & Housari, 2007).
Figure 1-10 Test setup developed by Nassar & Housari (Nassar & Housari, 2007)
Zaki et al. used the same Junker machine to study self-loosening (A. M. Zaki et al., 2012).
Lateral cyclic displacement is applied to the upper plate and a load cell is used to monitor
preload changes in a ½ -13 bolt (equivalent of M14x2). The same machine is used by Zaki et
al. to study the effect of thread pitch, excitation amplitude, and bearing friction (A. M. Zaki
et al., 2011) and also to study the effects of thread and bearing friction (A. Zaki et al., 2010)
on the self-loosening of countersunk bolts.
Eccles et al. modified the Junker machine (Figure 1-11) to be able to transmit axial load and
transverse displacement simultaneously to study the effect of a prevailing torque nut in
bolted joints (Eccles et al., 2010). A hydraulic jack is used to provide an independent
regulated axial load. Excitation is applied to the upper plate which is in contact with the

19
lower mating plate via needle bearings to minimize friction between the two parts. A
combination of an electric motor and an eccentric cam system is used in this design to
generate and adjust the excitation displacement with the axial load of the bolt (M8) that is
measured by a load cell. Unfortunately, the complicated joint design and the multiple
inserted elements alter the experimental results from actual values. This special design is
used to simulate the behaviour of a prevailing torque nut in bolted joints.
Sawa et al. designed a fixture based on the Junker machine to study the effects of the
utilization of a double nut, spring plate washer, and hexagon nut with a flange on self-
loosening (Sawa, Ishimura, & Nagao, 2012). They studied a joint fastened with an M10 bolt
with a load cell inserted underneath the fixed plate. A dial gauge is supported on the far side
of the fixed plate while its tip touches the end of the mobile part (Figure 1-12). As the
installation point of the gauge is far from the joint centerline, measured values are affected by
deformation of the part. Steel bars are used as bearings between the mating parts. Although
they decrease the friction and lateral force, they change the grip length and joint stiffness.
Valuable information could have been extracted from the test rig had a lateral force and a
rotation sensors been incorporated. This machine is also used by Sawa et al. to study the
effect of the mating parts inclined bearing surface (Sawa, Ishimura, & Karami, 2010).
Figure 1-11 Section view of test machine used by (Eccles et al., 2010)

20
Figure 1-12 section view of test machine (Sawa et al., 2012)
1.4 Finite Element
Zhang et al. performed a three-dimensional elastic-plastic finite element analysis to study the
first stage of self-loosening (Jiang et al., 2003). As rotation is negligible in stage I of self-
loosening, they did not consider it and used a symmetric model. The bolt and nut thread
connection is modeled as a circumferential groove. These simplifications enhance the CPU
performance but unfortunately affect considerably stress distribution on the threads. Local
mesh refinement is applied in the first engaged thread with all thread contacts being
frictionless, and only sticking behavior is modeled as a restrain with a high critical shear
stress. Thermal expansion of the upper mating plate is used to simulate the preload in the
bolt. They concluded that “the localized cyclic plastic deformation caused the stresses to
redistribute in the bolt, and the result was the gradual loss of clamping force with loading
cycles” (Jiang et al., 2003, p. 1). Their results show that lateral displacement is a determinant
factor for the preload drop in the first stage of self-loosening whereas friction between the
clamping parts does not play an important role.

21
Zhang et al. conducted another study in 2007 on the second stage of self-loosening using
finite the element method (Zhang et al., 2007). Unlike their previous study, due to the
importance of the relative rotation of the thread of the nut and bolt the helical geometry of
the threads is considered. Because plastic deformation is not a dominant factor in stage II,
only the elastic behavior of the material is considered. Due to deformation and displacement
occurring in all directions, the researchers were forced to use a full 3D model to study the
second stage of self-loosening. An isotropic frictional and infinitesimal-sliding contact is
defined in the thread contacts. All other contacts are defined in the same way as the thread
contacts with a different friction factor. The thermal expansion method is again used to
simulate the preload of the bolt. The plate adjacent to the bolt is fixed and a transverse
displacement is applied in four stages to the other mating plate. They concluded that
“microslip between the engaged threads and the variation of the contact pressure were
identified to be the major mechanisms responsible for the self-loosening of a bolted joint”.
They also used a simplified FE model of the thread contact to prove their suggested
mechanism (Figure 1-13).
Figure 1-13 Simplified model of thread’s contact (Zhang et al., 2007)
Sawa et al. conducted a FE analysis to study conventional methods (e.g. double nut, sprig
plate washer and flanged nut) used to reduce the loosening of bolted joints (Sawa et al.,

22
2012). 8-noded hexahedral elements are used in the analysis with the penalty method for the
contact behaviour of the thread contacts (male and female) and the nut and plate contact area.
In this research study, just one plate is modeled and the effect of frictional contact between
the bolt head and the two mating plates is neglected. All contacts are considered to have
maximum possible realistic conditions. Preload is modeled using forced displacement in the
axial direction of the bolt which is restrained in all other directions. Transverse displacement
is applied to the plate which is constrained in all directions. They concluded that joints with a
flanged nut have the highest rate of loosening and that a spring washer improves joint
performance the most among the studied methods (Figure 1-14).
Figure 1-14 Finite element result of studied joints (Sawa et al., 2012)
Yang and Nassar conducted a study using the FE and analytical methods (Yang & Nassar,
2012). Material behaviour is considered as fully elastic and the frictional contacts are defined
in the following connections: bolt to plate, plate to plate, nut to plate, and thread-to-thread.
They used the preload feature of the ABAQUS software as in the current study to facilitate
and accelerate preload modeling. One side of the lower plate is restrained in one direction
and a triangular displacement excitation with time is applied to the opposite side of upper

23
plate. The FE model is not explained in detail nevertheless it was used to validate a proposed
analytical equation to prevent self-loosening of bolted joints.
Sawa and Ishimura conducted a study to research the effect of inclined bearing surfaces and
eccentric nuts on loosening, using the FE method (Sawa et al., 2010). Like in their previous
research, only one plate is considered in the FE model and the contact between the bolt head
and the two mating parts is neglected. 8-noded hexahedral elements are used in the analysis
and the penalty method is used for contact behaviour, which is located at the thread contact
area (male and female) and the nut and plate contact area. Contact between the convex
surface of the lower nut and the concave surface of the upper nut is neither mentioned nor
described. The tightening procedure and the inclined surface effect is explained as “After
tightening the lower nut, the upper nut is tightened. At this time, a gap and continuously
applied lateral clamping force which prevent loosening is occurring” (Sawa et al., 2010).
Preload is modeled using a forced displacement in the axial direction of the bolt which is
restrained in all directions. Transverse displacement is applied to one of the plates and it is
constrained in the other directions. Figure 1-15 shows the described FE model. Different
inclined plate angles of 0, 2, and 3 degrees are evaluated with this FE model.
Figure 1-15 FEA model of the eccentric nut (Sawa et al., 2010)

24
Material behaviour is considered as elasto-plastic. Sawa and Ishimura concluded that “the
reduction in axial bolt force with large angle of the incline is larger than that with small angle
of the incline” (Sawa et al., 2010).
Figure 1-16 Comparison of loosening in
joints with hexagon and eccentric nut
(Sawa et al., 2010)
1.5 Objectives of the current study
The objective of the current study is to develop a test machine to study the effect of plate
stiffness and thickness on self-loosening. As mentioned before, very little research has been
conducted with experimentally representative test rig. One of the general targets defined in
the beginning of the project was the improvement of the measurement systems to avoid
problems and disadvantages that test machines used in previous researches suffered from.
Reviewing papers and reports from different researchers gives us a good idea about the
requirements and expectations of the target test rig. The final machine must be able to test a
bolted joint with different plate thicknesses and materials. It should also be able to measure
bolt preload, lateral load, lateral displacements, number of cycles, temperature, time, and nut
rotation continuously while the real bolted joint geometry and stiffness is not altered. A finite

25
element analysis will be conducted to unsure that the design of feasible and that the measured
parameters are realistic.
With the developed test rig, bolted joint behavior will be studied under different load cases
and the experimental results will ultimately be compared with finite element and theoretical
results. The results will be also compared with results from previous studies.
The specific objectives are:
1- Design a test fixture to be used with a tensile compression machine to study the self-
loosening of bolted joints.
2- Design the clamping plates with variable thickness and bolts with variable length and
their adaptors to be able to study the effect of assembly stiffness on the self-
loosening.
3- Incorporate all necessary instrumentation to measure bolt load, transverse load,
displacement, rotation, temperature, number of cycles and time.
4- Write an interface program in Labview to monitor and record the data in a computer
through a data acquisition system.
Conduct preliminary testing of self-loosening of a bolted joint and compare the result using
numerical FEM.


CHAPTER 2
EXPERIMENTAL TEST RIG
2.1 General description of the developed test rig
As discussed previously, the general and essential requirements for a self-loosening machine
are providing cyclic lateral displacement and the ability to measure preload and the studied
parameters. Development of a test rig to study the effect of stiffness and grip length is the
ultimate objective of the test rig. The stiffness of a bolted joint is a function of the material
and the geometry of the bolt, mating parts, washers, and nut. Any changes in the material of
the mating parts only change the stiffness whereas changes to thickness change stiffness and
clamping parts simultaneously. Hence, the machine should be designed to also be able to
measure other parameters so that they can be compared to the parameters that are influenced
by grip length. To do so, the target machine should be able to measure at least rotation,
lateral force, lateral displacement, and the number of cycles.
The design is based on an existing fatigue machine as the source of power to minimize the
time and cost of the project. The original machine includes the following parts
(See Figure 2-1):
- Holding structure,
- Electrical motor,
- Adjustable crank system,
- Basic control panel for start-stop and frequency adjustment,
- Cycle mechanical counter with precision of 10 cycles,
- Lever with three loading point and spring end fulcrum,
- Mobile mounting structure,
- Grips and universal joint,
- Adjustable stem.
The holding structure, electrical motor, lever, mobile mounting structure, and adjustable stem
are unmodifiable. The adjustable crank system is repaired and the cycle counter is bypassed

28
and replaced by a magnetic digital counter. A basic control panel is connected to the
designed control system and its outputs are transferred to the control and monitoring
program. Speed control is directly connected to the electrical motor and the frequency can be
adjusted manually.
Figure 2-1 Fatigue and endurance testing machine (Systems Integrators LLC, 2011)
The grips and universal joint section has been completely replaced with a new design that
will be explained in next sections.

29
The lever of the test rig is essentially a “class 2 lever”. The displacement provided by the
electrical motor and crank system is applied to one end of the lever to produce the load and
the test specimens can be installed between the universal joint and the load cell. According to
work and energy law, with a certain amount of effort, the maximum load can be reached with
the lowest displacement; hence, the closest point to the fulcrum point of the machine is used
to install the test specimens in order to have the highest load capacity. The developed test rig
is able to apply a lateral displacement from zero to 0.25 (inches) with a maximum frequency
of 5000 cycles per minute. The maximum lateral force is 2000 lbs, which is a function of
lateral displacement and stiffness of the joint in the lateral direction.
Instrumentation has been centralized via a PCB that is used as the main board to connect all
of the measuring devices to a computer. (See Figure 2-2)
Figure 2-2 Main board and electrical kit assembly

30
The control program is written in Lab View (Laboratory Virtual Instrument Engineering
Workbench). This control and monitoring program can continuously display and record
lateral displacement, lateral force, axial force, rotation, number of cycles, time and
temperature. For safety reasons, the machine can be switched off via software or the control
panel on the machine, but it can only be switched on from the control panel.
2.2 Requirements and limitations
Like in all experimental researches, measuring essential variables is the basic requirement of
a test rig. Axial force, displacement, and rotation are the essential variables for the self-
loosening test. Besides precision and measurement range being crucial factors for sensor
selection, compatibility with the control system and measurement devices can be a limiting
factor. Finding a feasible combination of available sensors is a challenge in the design of the
measurement and control step.
The ability to test different plate thicknesses and bolt sizes is one of the desired specifications
of the final test machine, which is limited by machine capacity. Increasing bolt size requires
a higher transverse load to reach the same lateral to axial force ratio at the same bolt
tightening stress ratio. Matching measurement accessories with different diameters and
thicknesses limits the machine design with regards to feasibility, cost, and fabrication
equipment. Limitations and their applied solutions are discussed in detail in each section.
In order to have realistic results, the joint geometry has to be kept, as much as possible, in
conditions close to industrial applications. This requirement renders many measurement
methods and devices ineffectual. As mentioned in the previous chapter, using a load cell to
measure axial load affects grip length and joint stiffness directly and creates significant
changes in the results when studying joint stiffness. In the current study, the bolted joint is
subjected to transverse load conditions, hence, the test rig has to be designed to avoid
undesirable loads, such as bending while keeping pure transverse excitation.

31
When the stiffness of the joint is the subject of a study, it is very important to minimize the
modifications made to the parts. Any excessive weakening or reinforcement will affect the
properties of the joint and the test results. To meet this requirement, the coaxiality of the
plates (mating parts), the fixed point, and the excitation point are considered as determinant
factors. These geometrical restraints must be respected in all design modes (different plate
thicknesses and their combinations).
The instrumentation fixtures, the maximum capacity of machine, the possibility of
performing tests with different frequencies, and the above mentioned geometrical restraints
form the major challenges for the design of the grips.
The test rig must be designed and fabricated in such a way that all load cases can be
performed safely to both protect the operator and to insure the durability and performance of
the machine. The applied safety provisions in the design and programing are as below:
- “General force limit”; Because the maximum force capacity of the machine is defined
in the manufacturer manual as 8000 lbs, the program is set to terminate the test if the
lateral force is higher than 7000 lbs.
- “Adjustable force limit”; In each test, a value smaller than “General force limit”,
which is dependent on the load case condition, can be set in the interface panel to
terminate the test.
- “Number of cycles limit”; an adjustable limit can be set for each test in the interface
panel.
- “Mechanical cycle counter limit”; the count down cycle counter can be set to a value
close to the limit entered in interface panel as a backup safety parameter in case of a
program malfunction or error.
- “Excitation amplitude limit”; this can be set for each test in the interface panel to
control the displacement.
As with all other projects, the available fabrication equipment should be considered in the
feasibility of the design to minimize the budget.

32
2.3 Preload sensor
Preload keeps the mating parts together and decreases in preload can lead to serious
problems, such as structural integrity and leakage failures; hence, the integrity of a bolted
joint is usually assessed by its capacity to maintain the bolt axial load.
The objective of all research on self-loosening is to evaluate and quantify the effects of
different parameters that prevent self-loosening or to estimate the number of cycles before
self-loosening occurs in order to help create a safe and effective maintenance program.
Hence, finding an accurate measurement method that matches the whole design and causes
the least possible deviation from the actual joint properties (standard industrial set up) is one
of the most important points of the design.
Figure 2-3 Grip length before inserting load cell

33
Figure 2-4 Grip length after inserting load cell
As mentioned above, in most previous studies researchers used load cells to measure preload.
The advantages of using a load cell are easy replacement, maintenance, and set-up. However,
the biggest disadvantage of this is a significant change in the geometry of the joint. To
measure preload, a load cell must be inserted between the bolt head and plate or between the
nut and plate. In doing so changes the grip length and stiffness of the joint. (See
Figure 2-3).
Grip length is a dominant parameter for both bending moment and stiffness. Yang et al. have
shown that a reduction of bending stiffness of the bolt, which is inversely proportional to
length, increases resistance to self-loosening. (Yang et al., 2010)
Total joint stiffness before inserting load cell is (Adapted from Budynas & Nisbett, 2008,
page 413): = + + + + + (2-1)
and after inserting load cell will be: = + + + + + + (2-2) = (2-3)

34
= (2-4)
Where , , and are section areas of the unthreaded portion, section areas of the
threaded portion, effective threaded length, and length of the unthreaded portion,
respectively. Therefore, adding a load cell to the joint changes joint stiffness directly by
adding stiffness to the system and changing bolt stiffness.
Accordingly, when the effect of self-loosening is the objective of the study, using a load cell
is not an acceptable method for preload measurement.
To resolve this problem in the current study, a strain gauge that can be installed in the bolt is
used as the preload sensor to keep the grip length and bolt’s stiffness unchanged. As shown
in Figure 2-5, a KYOWA KFG-3-120-C20-11 strain gauge with a cylindrical shape is
specifically designed and fabricated to measure bolt strain.
Figure 2-5 Strain gage (KYOWA Catalog, See APPENDIX I)
A 2mm diameter hole in the bolt is required to install this gauge (KYOWA Catalog, See
APPENDIX I, Strain gage catalog, KYOWA). To compare the stiffness of the bolt before
and after installation of the gauge, a simplified calculation for a cylinder with an equal
diameter to the bolt is presented below.

35
Figure 2-6 Cylinder with and without hole
= , ′ = → = = = = 0.97
Even if the hole is considered as a thru-hole, it can only change the stiffness of the bolt by
about 3%. In order to measure the force more accurately, the strain gauge should be installed
as far as possible from the bolt head and nut. Therefore, it has been installed at a depth equal
to the average distance of the plate contact surface (14mm from bolt head, see Figure 2-7).
The actual length of the hole is about 25mm. As a result, the change in the stiffness of the
bolt will be much less than 3% in real conditions for an M12 bolt, which is quite acceptable.
Figure 2-7 Preload sensor position in the bolt
The strain gauge is installed according to the manufacturer manual, using epoxy glue. To
make sure that the strain gauge returns correct values, it must be coaxial with the bolt.

36
Increasing this gap will lead to have an excessive thickness of the glue film and can increase
the possible inclination angle (see Figure 2-8).
An automatic CNC machine was used to drill the bolts to achieve a 0.1 mm tolerance. The
maximum possible inclination for this sensor will be 0.5°, which is completely negligible.
Figure 2-8 Effect of tolerance on inclination angle
Max inclination angle = = . 0.5
Essentially, a strain gauge is a sensitive electrical resistor inserted into a very thin, flexible,
non-conductive sheet. Usually, the resistor portion is called the grip or coil. The non-
conductive sheet is attached to the surface of the object using a suitable adhesive (depending
on base material). As the object deforms, it moves the coil and changes its electrical
resistance. These changes are translated to strain values using a constant value called “gauge
factor”. When the adhesive film between strain gage and the object surface is too thick, the
measured data is a combination of object strain and shear deformation of the adhesive layer.
Hence, it is very important that the layer between the gauge and object surface be as thin as
possible. For the strain gauge used in the current design, the hole tolerance affects the glue

37
layer thickness. The abovementioned effects show the importance of fabrication tolerance
and installation accuracy.
To improve the rig performance and to ensure the straightness of the gauge being installed, a
vertical rod is used as an installation guide (See Figure 2-9). When the gap between the
gauge and the rod is small, the whole fixture works like a sliding guide and does not allow
the gauge to tilt. In the installation process, after the positioning of the bolt and guiding rod,
the adhesive is applied to the internal surface of the hole. To ensure a successful installation,
it is very important to control the movements of the strain gage. If the strain gauge sticks to
the wall surface before its final position, it must be removed. If this is repeated many times,
the adhesive needs to be removed from the hole surface and the gauge needs to be replaced
as it might have eventually be deformed. It is also very important to ensure that the adhesive
covers the entire surface of the hole and that it is distributed evenly to maximize the contact
surface of the gauge and the bolt. According to the installation manual, the gauge must be
dried out at room temperature for 24 hours prior to use. A strain gauge is installed in every of
four M12 bolts which are directly calibrated to measure force. The calibration is performed
with an MTS 810 tensile machine. Figure 2-13 shows one of the calibration curves as an
example. All four SFC Grade 8.8 bolts are calibrated up to 50% of the yield.
For M12 bolt, the max yield force will be: F= Sy × A = 640 (MPa) × 84.3 (mm2) = 26976 N.
Figure 2-13 and Figure 2-14 show the results of calibration for one of the bolts. As the grips
of the tensile machine are designed to hold parts with standard sections, they cannot hold a
bolt directly. Therefore, an adapter must be used to perform the calibration on the MTS 810
tensile machine. As shown in Figure 2-12, the adapter consists of two parts. Part A has, on
one end, a notch with a diameter bigger than the bolt stem and smaller than the head width
and has a cylindrical shape on the other end. The cylindrical part is made according to the
standard specimen dimensions for the tensile machine. The dimension of the notch limits the
application range. The adapter is designed to avoid excessive bending at the bolt head. It is
not recommended to use Part A for bolts that are more than one size smaller than the
nominal size it is designed for. Part B has a standard section for the tensile machine on one

38
end and a female threaded connection on the other end. The female thread is unique for each
size and therefore a special adapter is needed for each size. All parts have been machined at
the ETS machinery workshop.
Figure 2-9 Installation fixture
Figure 2-10 Adapter, Part A

39
Figure 2-11 Adapter, Part B
Figure 2-12 Adapter set with bolt

40
Figure 2-13 Bolt calibration results
Figure 2-14 Bolt strain stability results
Loadingy = -207 921,3151x + 85 669,0656
R² = 0,9993Unloading
y = -206 505,2831x + 85 902,9462R² = 0,9994
-5000
0
5000
10000
15000
20000
25000
-0,02 0 0,02 0,04 0,06 0,08 0,1 0,12
New
ton
V/V
Loading
Unloading
Linéaire (Loading)
Linéaire (Unloading)
0,306
0,308
0,31
0,312
0,314
0,316
0,318
0,32
0 10 20 30 40 50
V/V
Time, minutes
Stabilité

41
Figure 2-15 Strain gage installed in the bolt
2.4 Rotation sensor
The relative rotation of the bolt and nut is one of the indicators of when stage II commences
and is an important factor in the study of self-loosening. The relative rotation is the
difference between the global rotation of two objects. When one of the object’s global
rotation is zero, global rotation of the other object will be equal to the relative rotation.
R = 1 – 2 R = 1 2-5
A CP-2UT LVRT Linear Velocity Rotation Transformer from MIDORI PRECISIONS is
used as the rotation measuring devise (Figure 2-16). This sensor measures the rotation
directly and the part under measurement must be connected to its shaft. The general idea of
the rotation measurement system is to fix the nut and measure the rotation of the bolt. The
rotation measurement assembly consists of a sensor support, nut holder, spacer, and holding
bolts (Figure 2-20).
Figure 2-17 shows the sensor support. The rotation sensor is installed on the fixture with two
jam nuts; these nuts allow for a slight adjustment of the sensor axial position.

42
Figure 2-16 Rotation sensor (MIDORI_PRECISIONS, 2009)
To constrain nuts with different sizes, the nut holder shown in Figure 2-18 is used. The three
surfaces of the nut (one in between) are fixed with three M3 bolts in the nut holder. As
shown in Figure 2-20, the nut holder is fixed to the rotation sensor support via three M3
bolts. The resulting structure forms a rigid body that includes the nut holder, sensor, and
sensor support. As the bolt and the nut are free to rotate, their relative rotation can be directly
measured.
Figure 2-17 Sensor’s support

43
The sensor support can be used for all combinations of bolts and plates in the design range
but each bolt size needs a specific nut holder.
In order to be able to use the rotation measurement assembly for all thicknesses in the design
range, the distance between the sensor shaft head and the far side surface of the plates has to
be fixed. As shown in Figure 2-21, when the plate thickness (L2) changes, the distance
between the sensor shaft and the far side plate surface (L1) changes and the bolt cannot touch
the sensor shaft. This problem was resolved by making the sensor fixture, nut holders, and
bolts of different lengths. Alternatively a spacer with different length is used to adjust this
distance. The nut holder and sensor fixture are made for an assembly with two 14mm plates
and the thickness of the different spacers is accordingly. Inserting the spacer between the nut
holder and the sensor fixture keeps the length L1 fixed. The three bolts that connect the nut
holder to the sensor fixture pass through the coincident holes of the spacer. The nut holder
and the spacer for the 10mm plates are illustrated in Figure 2-18 and Figure 2-19
respectively.
Figure 2-18 Nut holder

44
The sensor shaft is provided with a slot to create a better contact with the object and reduce
sliding between the sensor and the object (See Figure 2-16). As shown in Figure 2-22, the
bolt end surface is machined with a recess which goes into the sensor slot to transmit
rotation. The less clearance there is between the slot and notch, the more accurate the rotation
measurement will be.
Figure 2-19 Spacer - M12 bolt and 10mm plates assembly
The rotation sensor is calibrated according to the manufacturer’s instructions and the results
of the calibration are shown in Figure 2-23.

45
Figure 2-20 Fixture of rotation sensor

46
Figure 2-21 Section of rotation fixture
Figure 2-22 Bolt model with notch on the end

47
Figure 2-23 Calibration of rotation sensor
2.5 Lateral load cell
Self-loosening tests are performed under force or displacement control. Either the test is
performed with a displacement control system or a force control system. Measuring lateral
force is very important for the results analysis and safety.
A GSE load cell 5410-8k is used to measure the lateral force. This sensor has a female
threaded connection on both ends. As shown in Figure 2-24, the force transducer is
connected to the male threaded part of the stem on one side and to the test plate on the other
side.
y = 63,088581x + 23,083102R² = 0,999866
0
20
40
60
80
100
120
140
160
0 0,5 1 1,5 2 2,5
Angl
e of
rota
ion(
°)
Voltages(V)
Deg vsVoltage

48
Figure 2-24 Test set-up
In the current design, one of the clamping plates is connected to the actuator and the other
one is connected to the lateral force actuator. A male threaded connector is required to
connect the plate to the transducer but as the connection size of the transducer is ½”, it is not
easy to make a male connector for all plates. The design range includes plates with a
thickness smaller than ½” but connecting a ½” rod to a thinner plate causes many fabrication
problems.
To make a female thread in the plate, a thickness bigger than the major diameter of thread is
required. The remaining wall of the threaded area (T1 and T2) must be thick enough to sustain
stresses caused by the lateral displacement (Figure 2-25). These conditions end up requiring a
thickness larger than the thickness of the plates to be used in the study. The transition from a

49
thicker section to a thinner one while also simultaneously respecting the coaxial angles of the
plate contact surface and of the axis of the machine, is the resulting challenge of the
abovementioned conditions. A sudden change of thickness causes high residual stress and
reduces the fatigue life of the plates. Adding a fillet has a notable effect on the stress
intensification factor. The fillet radius is limited by the plate dimensions because the contact
surface of the plates must be flat and any slope on this surface changes the clamping load
during the test.
Figure 2-25 Plate section in transducer connection area
A simplified finite element analysis with no thread in the bolt and nut was performed to
ensure that the plates are not overstressed. The model includes two plates of 12mm thick
each, an M14 bolt, and a nut. A symmetry boundary condition is used to reduce the analysis
time (Figure 2-26). Frictional contact is applied between the bolt head, the nut surface, and
the corresponding plate surface. However, there remains a gap between the bolt stem and the
internal surface of the hole, so a frictionless contact is considered to occur between them to
simulate the possible contact. The maximum load capacity of the test machine is 8.9 kN. As
explained before, safety measures have been implemented to cut off power in case of an
overload (over 6 kN) to protect the actuator and electrical motor. Hence, the assembly is
analyzed for three load cases:
- 9 kN of preload, 0.35mm displacement at the pivot point;
- 9 kN of preload , 6 kN force at the pivot point;

50
- 9 kN of preload, 7.2KN force at the pivot point.
The plates are made from structural carbon steel with Sy=250MPa and the bolt is grade 8.8
with Sy=600MPa.
Figure 2-26 Boundary Conditions
Figure 2-27 Coordinate system used in FEA results

51
Figure 2-28 Equivalent stress in axial (Z) direction
Figure 2-29 Equivalent stress around the hole
0
50
100
150
200
250
300
350
0 10 20 30 40 50 60 70
Equ.
Str
ess M
Pa
Position (mm)
Disp=0.35mm
F=6000N
F=7200N
0
50
100
150
200
250
0 50 100 150 200
Equ.
Str
ess M
Pa
Position (Deg.)
Disp=0.35mm
F=6000N
F=7200

52
Figure 2-30 Equivalent stress distribution through plate thicknesses
Table 2-1 Boundary condition reaction- relative displacement of plates
Load Case
Reaction in
Displacement B.C.
(N)
Displacement
in Force B.C.
(mm)
Relative
displacement
of plates (mm)
Disp.=0.35mm 2874.8 - 0.0036
F=6000N - 0.8350 0.0123
F=7200N - 0.8480 0.0164
The stress at all points, except at the sharp edges which are singularity points, are below Sy,
which indicates that the plate design is safe.
As it is shown in Figure 2-24, there are three threaded pieces connected from the lower plate
to the actuator lever. If a regular threaded joint were used in all pieces, they could not be
fastened together and be adjusted with the upper plate, which is tightened and fixed to the
0
50
100
150
200
250
300
350
400
0 5 10 15 20 25 30
Equ.
Str
ess M
Pa
Position (mm)
Disp=0.35mm
F=6000N
F=7200N

53
lateral load cell. When the parts are tightened, their final angular position may be different.
The ball and socket joint in the universal joint, which is used to connect lower plate to the
actuator, allows this part to rotate in all directions independently. Therefore, the test set-up
parts can be tightened and adjusted easily. The ball and socket joint in the universal joint
allows free rotation and blocks translation; essentially, it eliminates bending moments on the
plates and provides pure lateral displacement.
The transducer calibration results are shown in Figure 2-31.
Figure 2-31 Results of load cell calibration
y = 42212x - 21568R² = 1
0
5000
10000
15000
20000
25000
0 0,5 1 1,5
Forc
e (k
N)
Voltages (V/V)

54
2.6 LVDT displacement sensor
A displacement control system is the most popular method to run self-loosening tests and is
the method used in the current study. Therefore, it is very important to have a device to
measure the displacement between two plates accurately. The test machine has a
displacement adjustment system that provides the displacement on the actuator lever, but it is
not accurate enough for a self-loosening test. In addition, the displacement at the bolt
location is different from the pure relative displacement of the two plates at their free ends.
The axial displacement is the sum of the deformation in the universal joint connecting bolts
and the axial deformation of the plates. The closer the measuring point is to the bolt, the
more accurate the measurement will be. Table 2-1 shows the difference between the
displacement at the actuator connection point and the actual relative displacement of the
plates and the importance of the displacement sensor location. A 0.835mm displacement of
the actuator results in 0.0123mm of relative displacement.
The order of lateral displacement applied to the plates in self-loosening tests is a fraction of a
millimeter. Therefore, the displacement sensor (LVDT, Linear Variable Differential
Transformer) should be accurate to at least 0.001 of millimeter to be able to measure the
displacement during a cycle.
An Macro CD 375-025 LVDT with a nominal range of ±0.63 mm was the selected, which is
a magnetic contactless (frictionless) sensor. It consists of two parts: the fixed part is called
casing and the mobile part is called the core. This LVDT measures displacement by
measuring the electrical current changes caused by magnetic field alternation. Figure 2-32
and Figure 2-33 show the structure of the LVDT and illustrates how it functions. The primary
coil (primary winding) is energized with constant amplitude AC current. When the core is in
its primary position (midway point), the magnetic flux is coupled equally to both secondary
coils and consequently the induced voltage in both coils is the same. When the core moves
toward a secondary coil, more magnetic flux will be coupled to that coil and consequently,

55
more voltage will be generated in it. The difference between the voltage in the secondary
coils indicates the core position. (TE_Connectivity_Corporation, 2017)
The manufacturer claims an infinitesimal accuracy. “Since an LVDT operates on
electromagnetic coupling principles in a friction-free structure, it can measure infinitesimally
small changes in core position. This infinite resolution capability is limited only by the noise
in an LVDT signal conditioner and the output display's resolution.”
(TE_Connectivity_Corporation, 2017). It is very light and does not affect lateral load and as
it is a contactless LVDT, it has an unlimited mechanical life.
Figure 2-32 Macro sensor, CD 375 (TE_Connectivity_Corporation, 2017)
Figure 2-33 Concept of LVDT performance (TE_Connectivity_Corporation, 2017)

56
To have the best possible measurement of displacement, the LVDT holder is installed on the
plates. Because the LVDT wires are connected to the casing, it is better that it is installed on
a fixed part. As shown in Figure 2-34, a U-shape holder has been designed for installation on
the upper plate (fixed plate) to hold the casing. To make sure that the casing does not move, a
hole is made at the centerline of the casing position in the U-shaped holder, which is then
fixed in position by an M3 bolt.
Figure 2-34 LVDT fixture
The core is held with a support on the lower plate (mobile plate). Both holders are connected
to the plates with M3 bolts. The core has 1-72 UNF female threads on both ends and is
connected to its support with a 1-72 bolt. There are two nuts on both sides of the support to
adjust the position of the core in the casing. Figure 2-35 and Figure 2-36 show the position,
details, and dimensions of the LVDT holder.
The results of the LVDT calibration are shown in Figure 2-37.

57
Figure 2-35 LVDT holders, position and details
Figure 2-36 Dimensions of LVDT holders

58
Figure 2-37 Results of LVDT calibration
2.7 Cycle counter
The test machine was originally equipped with a mechanical counter, as shown in Figure 2-1.
This counter consists of a set of gears that connects the motor shaft to the counter. This
counter controls the system with a countdown rule, where the desired number of cycles must
be set at the beginning of the test. When the counter reaches zero, it stops the motor. The
biggest disadvantage of this counter is that it can only count every ten cycles and cannot
show nor detect each individual cycle. One issue with this system is connecting and matching
the output signal of the counter to the data gathering system. This system does not generate
any signal until it reaches zero and shuts down the motor.
For the self-loosening test, especially in the beginning of the test (stage I), it is very
important to monitor and record cycles accurately as the self-loosening takes place and find a
relationship between cycles and other measured parameters. To solve this problem, a
magnetic cycle counter was added to the system. This sensor consists of a fixed and a mobile
y = 0,3004x + 2,3487R² = 1
2
2,5
3
3,5
4
4,5
0 1 2 3 4 5 6
Disp
lace
men
t (m
m)
Voltage

59
part. The mobile part is a permanent magnet which when it passes the fixed part after each
cycle inducts the internal coil in the fixed part and generates a signal.
The fixed part is installed on the body of the machine, facing the actuator lever, and the
mobile part is installed on the actuator (Figure 2-38).
Figure 2-38 Cycle counter position
When the sensor coil enters the magnetic field of the mobile part, it generates a signal; hence
their relative position should be set in such a way that the mobile part actuates the coil once
per cycle. If not, the number of signals needs to be divided by two by the LabView program.
In the current design, the fixed part is installed at an elevation equal to the max displacement
that could be applied to ensure that the counter sensor always returns the exact number of
cycles.
2.8 Test plates
As shown in Figure 2-39, the joint under study consists of a bolt, nut, washers on both side,
and two plates. As mentioned before, the test plates must be designed such that the contact
surface is kept in line with the axis of the lateral load sensor and the pivot point. The joint
set-up shown in figure 2-39 guarantees the coaxiality of the joint and other parts.

60
Figure 2-39 Bolted joint set-up
The geometry of the test specimen, which has a thickness of 10 mm, is shown in Figure
2-40.The diameter of the bolt hole is dependant on the size of the bolt. In this case, the
diameter of the hole is 12.5mm to accommodate the M12 bolt. The test plate and its
connections are machined using an automatic CNC machine so as to form a solid part that
minimizes the relative displacement between parts.
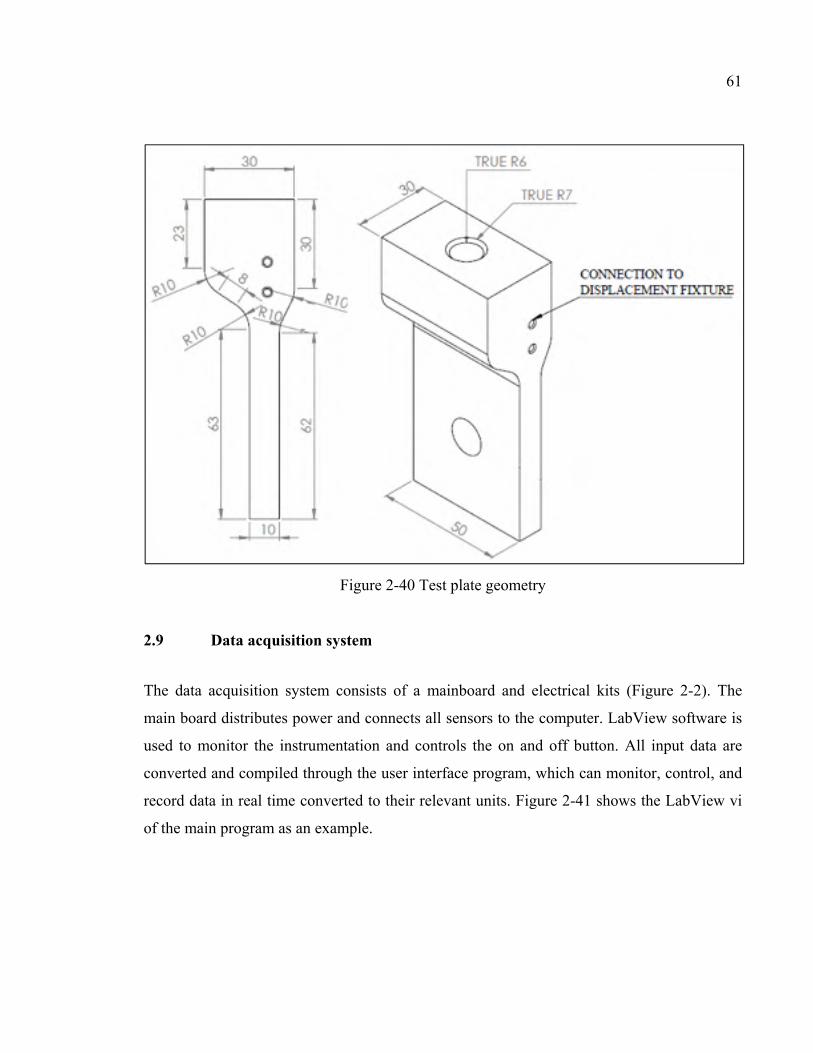
61
Figure 2-40 Test plate geometry
2.9 Data acquisition system
The data acquisition system consists of a mainboard and electrical kits (Figure 2-2). The
main board distributes power and connects all sensors to the computer. LabView software is
used to monitor the instrumentation and controls the on and off button. All input data are
converted and compiled through the user interface program, which can monitor, control, and
record data in real time converted to their relevant units. Figure 2-41 shows the LabView vi
of the main program as an example.

62
Figure 2-41 A part of the main vi program of LabView
The input data in LabView consists of voltages, TC’s and frequency from different ports on
the main board. The program is used to convert such data to real values or on and off
commands.
The final interface of the program is shown in Figure 2-42.:
- A1, B1, C1 and E1 show the boxes used to input the calibration factors for the lateral
force sensor, preload sensor, LVDT, and rotation sensor respectively.
- A2, B2, C2, D, E2 and F2 show the actual reading values of the lateral force, preload,
lateral displacement, temperature, and number of cycles respectively.
- M shows the activation and deactivation buttons and motor status (On/Off). For
safety reasons, the motor can also be turned on and off via the interface panel.
- N shows the start button.
- P shows the path where the result file will be saved (.txt format). The file location can
be set by the user for each test.
- T shows the time.

63
- S is the emergency shut-off button. This button cuts the main power to the test rig in
emergency cases.
- In the chart area, by selecting each tab, a chart for the relevant parameter versus time
is shown. Charts can also be exported. To better illustrate each chart, the upper and
lower limit of the vertical axis can be set by the user to adjust the chart to the
appropriate range of measured parameter.
- MAZ sets the parameters value to zero.
- A3 and F1 are safety values for the lateral force and the number of cycles
respectively. When the system reaches one of these limiting value the test stops.
Figure 2-42 Data acquisition user interface


CHAPTER 3
FINITE ELEMENT ANALYSIS
3.1 Description of general model simulation
The F.E analysis of self-loosening in Stage I can be done using a simplified 2D model
because there is no displacement or rotation in the third axis. However, when stage II is
included in the analysis, rotation around the bolt axis and the helical geometry of the threads
necessitates a full 3D finite element analysis. Friction between the threads, contact surfaces
of the bolts and nuts with the plates, and friction between plates are important factors that
must be included in the F.E. modeling.
The model for this study consists of an M12 (8.8) bolt with an hexagonal cap, an hexagonal
nut, two washers, and two plates with a 10mm thickness functioning as the clamping parts.
The actual geometry and dimensions of the threads of the bolt and nuts are considered in the
3D model.
The bolt preload is the main parameter to be investigated in this study. To simplify the
analysis and reduce the run-time only limited areas around the plates are considered (20 mm
on each side). The friction contact elements are used to simulate the contact surfaces of the
mating parts, bolt, and nut.
One of the plates is fixed on one end and a lateral displacement is applied to the other plate.
The geometry, boundary conditions, and meshing will be explained in further details in the
following sections.
3.2 Material description
An Elasto-Plastic material with the following properties is used in the material definition.

66
Figure 3-1 Material definition
3.3 Geometry
Generally, using a detailed model for a finite analysis provides more realistic results but
subsequently increases the run-time and, in some cases, causes difficulties in convergence.
Therefore, accuracy, convergence, and run-time should be balanced for an optimized
analysis.
The dimensions of the bolt are based on “ANSI B18.2.3.5M, Metric Hex Bolts” (ASME,
1989a) and its threads are modeled on “ANSI B.1.13M, Metric Screw Threads” (ASME,
2001). The actual geometry of the bolt threads is shown in Figure 3-2. The fillets and
chamfers of the threads are not considered in the model to avoid edges with very short length
and singularity points and provide a better mesh quality. The final section of the bolt threads
is shown in Figure 3-3.
0
100
200
300
400
500
600
700
0 0,001 0,002 0,003 0,004 0,005 0,006
Stre
ss (M
Pa)
Strain (mm^-1)
Sy 640MPa
Su 800MPa
Young’sModulus 2e5 MPa
Poissoins’s ratio 0.3
Tangent Modulus 4000 MPa
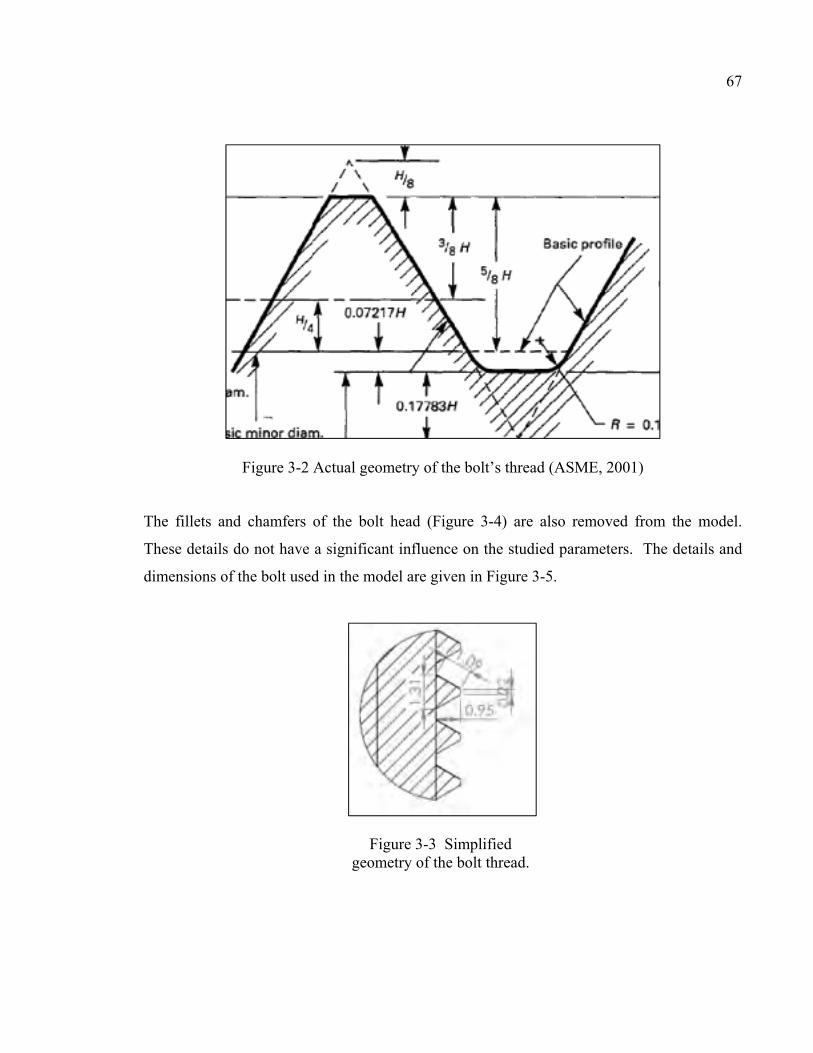
67
Figure 3-2 Actual geometry of the bolt’s thread (ASME, 2001)
The fillets and chamfers of the bolt head (Figure 3-4) are also removed from the model.
These details do not have a significant influence on the studied parameters. The details and
dimensions of the bolt used in the model are given in Figure 3-5.
Figure 3-3 Simplified geometry of the bolt thread.

68
Figure 3-4 Actual geometry of the bolt head
Figure 3-5 Bolt Geometry
The dimensions of the nuts are based on “ANSI B18.2.4.1M-1979 (R1989) Metric Hex Nuts”
(ASME, 1989b). In reality, the nut threads merge with its body. However, this geometry
leads to a zero-length element meshing; hence, the threads are continued to the point where
this section begins to distort. The neglected portion is less than a quarter of a thread and does
not affect the results. The same simplification is applied to the nut threads. The geometry and
dimensions of the nut are given in Figure 3-6.

69
Figure 3-6 Nut’s geometry
The dimensions of the washer are based on “ANSI B18.22M-1981 Metric Plain Washer”
(ASME, 1981), as illustrated in Figure 3-7. The geometry of the plates is shown in Figure
3-8.
In order to obtain a better mesh quality, the various parts must be cut into smaller pieces. In
the Ansys software, a “Part” can consist of one or more “Body”. Different mesh type and
refinement can be applied to the bodies that make up a part. Ansys automatically adjust the
bonds between all bodies and the common nodes in meshing. Dividing a model into
appropriate parts and bodies requires both experience and trial-error between the meshing
and geometry modeling steps.

70
Figure 3-7 Washer geometry
Figure 3-8 Plate geometry
3.4 Meshing
The nut is divided into two parts: a cylinder and a thread. The cylinder part consists of six
bodies (Figure 3-9). The “Hexagon Dominant” and “Sweep” mesh methods are used for the
cylinder and thread, respectively. The thread is divided into 40 bodies to reduce the torsion
from “Sweep Section” (Figure 3-9). Images used courtesy of ANSYS, Inc.

71
Figure 3-9 Consistant bodies of the nut cylinder and thread
One of the dominant factors in meshing is the ratio between the largest and smallest
dimensions of the mesh. The tip of the thread is 0.2mm wide while its length is about 220
mm. This ratio requires a very high number of elements to obtain an acceptable aspect ratio.
The nut threads have 5601 elements and 30544 nodes. The threads are bonded to the cylinder
to form a single solid part (Figure 3-10). The nut cylinder has 540 elements and 3030 nodes.
The meshing of the nut cylinder is shown in Figure 3-11.
The geometry of the plates is simpler than that of other parts and thus is easier to mesh. The
hole in the plate does not allow for hexagonal meshing of all areas of the plate. To minimize
mesh irregularity caused by the hole, the plates are sliced into eight bodies. Each plate forms
a part with 960 elements and 4960 nodes. The “Hexagonal Dominant” method is used for the
meshing of the plates.
The washers are located between the plates and bolt cap and nut. In reality, these parts are all
affected by the relative displacement. However, if the relative displacement of the bolt, nut,
washers, and plates was considered, achieving convergence with finite element analysis
would be practically impossible. Therefore, the washers are bonded to the plates to avoid this
problem (Figure 3-14). Each washer is divided into 6 bodies and has 240 elements and 1560
nodes. The meshing of the washers is shown in Figure 3-13.

72
Figure 3-10 Meshing of the nut thread and bonded area
Figure 3-11 Meshing of the nut cylinder
Figure 3-12 Meshing of the plate

73
Figure 3-13 Meshing of the washer
Figure 3-14 Bonded area of the washer to the plate
The bolt is divided into two parts, the body and thread. The body includes the cap and stem.
The bolt cap has a hexagonal shape and is connected to the cylindrical stem. Meshing these
parts as two different bodies does not result in good quality as the transition from the
hexagonal to cylindrical shape causes distortion of the meshes. To solve this problem, the
bolt cap is sliced into 14 bodies and the cylindrical stem into 22 bodies (Figure 3-15). These
36 bodies form one part in the model with 4010 elements and 17975 nodes. The “Hexagonal
Dominant” and “Sweep” meshing methods are used in the meshing of this part. The meshed
part is shown in Figure 3-15.

74
Figure 3-15 Bolt stem, consisting bodies and meshing
Meshing the bolt threads presents a similar problem as the meshing of the nut thread.
Because of this, it is divided into 43 bodies and is meshed with the “Sweep” method,
resulting in 9612 elements and 56922 nodes. The threads and the stem are bonded at the
contact surfaces (Figure 3-17). The washer on the side of the bolt cap is the same as the other
washer and both are bonded to the plate.
The model has a total of 22163 elements and 121511 of nodes.
SOLID186 (3-D 20-Node Structural Solid) elements which can support plasticity, large
deflection, and large strain are used in this model.

75
Figure 3-16 Meshing of the bolt threads
Figure 3-17 Bonding surfaces of the
bolt threads and stem

76
3.5 Mesh convergence criteria
The load in the bolt is used as the mesh convergence criterion. The mesh was refined
gradually from 22163 elements and 121511 nodes to 57194 elements and 2913251nodes till
the difference on the preload of less than 1% is achieved.
3.6 Boundary conditions
In the real test, one plate is connected to the load cell and is fixed and the other plate is
connected to the actuator. Preload keeps the bolt, nut, and washers connected to the plates.
To simulate these conditions, the boundary conditions shown in Figure 3-19 are applied.
A: Displacement in Z direction of two points is fixed;
B: Displacement in X and Z direction of two points is fixed;
C: Displacement in Y direction is fixed;
D: Displacement in X direction of two points is fixed;
E: Displacement in X direction of two points is fixed;
F: Applying displacement in Y direction to simulate applied lateral force (Figure 3-18);
G: Bolt pre-tension.
Frictional contact is defined by CONTA174 and TARGE170 for the contact surfaces of the
bolt and nut threads respectively (Figure 3-20). The same contact definition is used for the
contact surfaces of the bolt cap to the plate (Figure 3-21), nut to plate, (Figure 3-22) and
plate-to-plate (Figure 3-23).
Figure 3-18 Lateral displacement vs. load time

77
Each quarter of load cycle is defined by 0.5 seconds.
Figure 3-19 Boundary conditions

78
Figure 3-20 Contact between threads
Figure 3-21 Contact surface between the bolt cap and plate
“Bolt Pretension” is used to simulate preload tension in the bolt, a feature which facilitates
the modeling of bolts. In previous versions of the Ansys Workbench, the user had to select
two nodes inside the bolt on which to apply force or displacement. This was problematic to
set up for different load steps. The same concept applies to this simulation feature, but the
selection of the nodes and the application of load are done automatically and the user has
simply to select a “body” of bolt stem. The user can define a coordinate system within the

79
selected body to adjust the exact point where pretension is applied. Preload is applied at the
origin of the defined coordinate system and in its Z direction. The user then has to define the
coordinate system so that the Z-axis is in line with the bolt centerline.
Figure 3-22 Nut to plate contact surface
Figure 3-23 Plate-to-plate contact surface

80
The options available for “Bolt Pretension” are as follow:
- Load, to apply force,
- Adjustment, to apply adjustment in length units,
- Lock, to fix all displacement after tension,
- Open, to remove preload,
- Increment, to apply a length as an incremental adjustment.
Preload is applied in the first load step (0-0.5 s). This preload causes deformation in all joint
elements. In load step 2, preload is defined as “Lock,” which fixes the deformations caused
by the preload and removes the force, allowing the user to combine preload with other loads.
The preload definition for all load cases is “lock”, except the first load step.
As shown in Figure 3-18, lateral displacement is applied to the mobile plate with amplitude
of 0.2 mm. The displacement remains at zero in the first step where preload is applied. The
next four steps simulate a full cycle with duration of 2 seconds.
The Ansys Workbench is more user-friendly than the Classic version. The graphical interface
for geometry modeling, boundary conditions and others accelerates modeling and post-
processing. However not all features and settings are provided in the graphical interface. A
“Command Line” can be added to any step of the analysis to solve this problem. APDL
commands can be used to make all options used in the Classic version available.
The default value of equilibrium iterations per solution step is 25 in Workbench. The model
used in the current study cannot converge with the default settings, so APDL commands are
used to change it to the desired value.
3.7 High-Performance Computing of Calcul Quebec.
High Performance Computing (HPC) is a general term used for processing information with
aggregate computing power. One of the common methods is parallel processing. In HPC, the
main problem is divided into smaller problems which are then assigned to different CPUs,

81
which solve the equations simultaneously. The software then assembles the results to give the
final solution to the problem posed.
For computer performance, the CPU time is a determinant factor in reducing the run-time.
The large capacity computing server of Calcul Quebec is used to run the finite element
analysis. The Guillimin phase I has 1200 nodes with 12 cores per node, 6 x CPU of 2.67 GHz
per core and 24~72 MB of memory per node and phase II has 382 nodes with 16 cores per
node, 8 x CPU of 2.67 GHz per core and 64~512 MB of memory per node. The nodes can be
reserved and assigned to a specific calculation through specific operating system commands.
Like most computing services, Guillimin’s server operating system is Linux and therefore
users must have basic knowledge of Linux. There is no graphical interface in the installed
version of Linux and users must work via the command line.
Two storage spaces are available for users: 50 GB and 2 TB. The 50 GB space has a larger
bandwidth and is used to keep the input files. The 2 TB space has a lower bandwidth and is
used to keep the result files. To run a file on the Linux server, the ID of the reserved CPUs,
the file path, solver path and the destination where the results will be stored, need to be
defined.
As mentioned above, the nodes can be reserved via command line and they will be assigned
to the user based on the availability of nodes and reservation priority. Once the nodes are
assigned to the user the model can be launched. Depending on the number of reserved nodes,
the run-time can be reduced from 5 days for local computing to 9 to 12 hours. The results for
20 cycles are about 160 GB in size. Once processing is finished, the files have to be
downloaded to a local computer for post-processing.
3.8 Post-Processing
Post-processing is done using the Ansys Workbench and Microsoft Excel. The workbench
provides a “User defined” feature, which allows the user to combine Ansys Classic

82
commands with its geometrical interface. The results are then exported to Excel format to
create the desired graphs.

CHAPTER 4
DISCUSSION OF RESULTS
4.1 Introduction
In the following chapter, experimental, finite element, and analytical results will be
compared and discussed.
The results of a finite element analysis with 15 kN preload and 0.44 mm lateral displacement
are compared with the theory proposed by Zhang et al. and analytical calculations. The
experimental tests with different preloads and lateral displacements are performed and the
results are also discussed. Finally, the results from finite element analysis and an
experimental test with a lateral displacement of 0.02 mm and a preload of 8.1 kN are
compared and discussed for the validation of the test bench.
4.2 Experimental results
After conducting a rig shake down preliminary test at different load cases, the first real test is
performed with a preload PL=8100N and a relative lateral displacement between the two
plates D=0.025mm for 50 cycles.
As mentioned before, the combination of stage I and II is obtained after few cycles.
Therefore, one can expect a substantial drop of load that can occur even after few cycles. As
illustrated in Figure 4-1, the preload drop in first step shows the greatest change among all
cycles. The rotation in the first and second cycle is 0.04 degrees, but the preload drop in each
cycle is 260 N and 40 N respectively. The difference between these two load drops while the
rotation is the same is an evidence of the presence of stage I.
As the preload drops, lateral force drops accordingly. The largest lateral force drop also
occurs in the first cycle, followed by smaller changes per subsequent cycles.
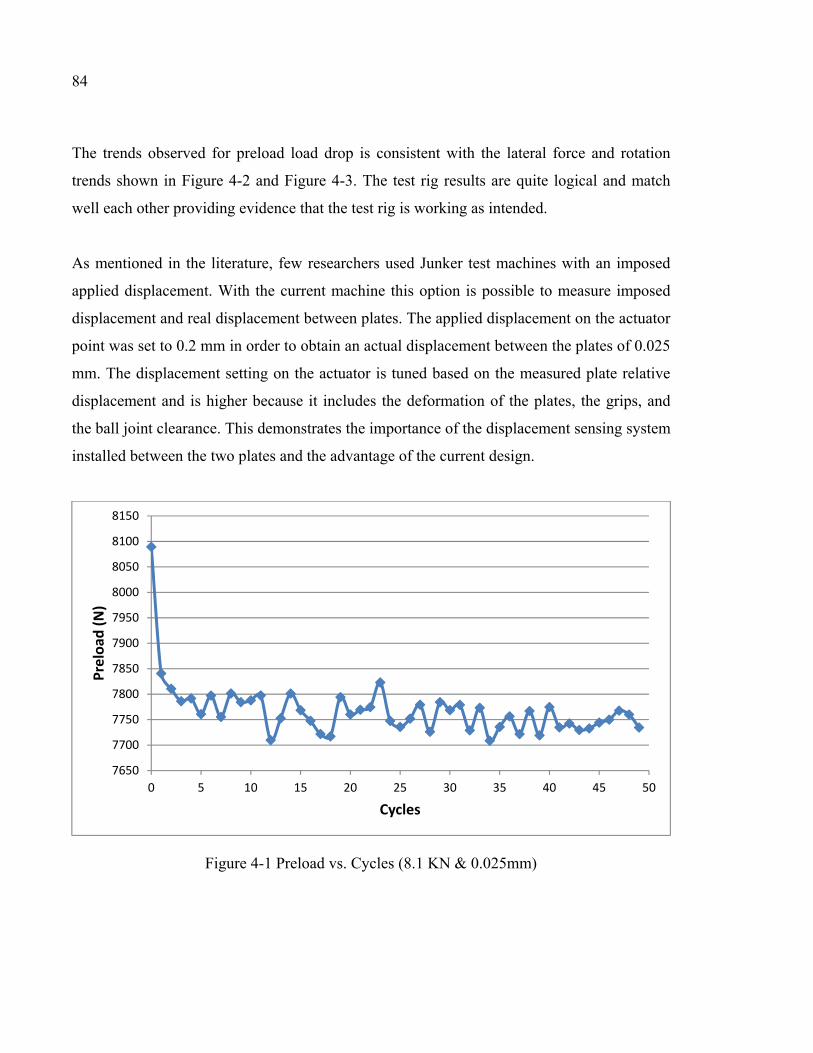
84
The trends observed for preload load drop is consistent with the lateral force and rotation
trends shown in Figure 4-2 and Figure 4-3. The test rig results are quite logical and match
well each other providing evidence that the test rig is working as intended.
As mentioned in the literature, few researchers used Junker test machines with an imposed
applied displacement. With the current machine this option is possible to measure imposed
displacement and real displacement between plates. The applied displacement on the actuator
point was set to 0.2 mm in order to obtain an actual displacement between the plates of 0.025
mm. The displacement setting on the actuator is tuned based on the measured plate relative
displacement and is higher because it includes the deformation of the plates, the grips, and
the ball joint clearance. This demonstrates the importance of the displacement sensing system
installed between the two plates and the advantage of the current design.
Figure 4-1 Preload vs. Cycles (8.1 KN & 0.025mm)
7650
7700
7750
7800
7850
7900
7950
8000
8050
8100
8150
0 5 10 15 20 25 30 35 40 45 50
Prel
oad
(N)
Cycles

85
Figure 4-2 Lateral force vs. Cycles (8.1 KN & 0.025mm)
Figure 4-3 Rotation vs. Cycles (8.1 KN & 0.025mm)
0
500
1000
1500
2000
2500
3000
3500
4000
0 10 20 30 40 50
Late
ral F
orce
(N)
Cycles
0
0,02
0,04
0,06
0,08
0,1
0,12
0,14
0,16
0,18
0,2
0 10 20 30 40 50
Rot
atio
n (
Deg
.)
Cycles

86
The second test is performed with PL=7771 N and D=0.025mm for 50 cycles. The general
trends of the preload drop, lateral force, and rotation are the same as the previous test. The
results of this test are shown in Figure 4-4 to Figure 4-6.
Figure 4-4 Preload vs. Cycles (7.7 KN & 0.025mm)
The third test is performed with PL=3100N and D=0.075mm for 194 cycles. The preload in
this load case is low and accordingly, the stresses on the bolt threads are low. When the stress
level is low, the local yield deformation in the thread contact surfaces is less evident and
consequently stage I is less likely to occur. In this case the preload drop is caused only by
rotation. As it can be observed in Figure 4-7 and Figure 4-10, the preload drop in each cycle
is proportional to the corresponding rotation. As previous studies illustrate (Eccles et al.,
2010), the preload drop and bolt rotation reaches a plateau and saturate after a certain number
of cycles. Such behaviour can be observed in Figure 4-7 and Figure 4-10. The plateau is
dependent on various factors such as bolt size, friction, and preload.
7350
7400
7450
7500
7550
7600
7650
7700
7750
7800
0 10 20 30 40 50
Pre
load
(N
)
Cycle

87
Figure 4-5 Lateral force vs. Cycles (7.7 KN & 0.025mm)
Figure 4-6 Rotation vs. Cycles (7.7 KN & 0.025mm)
500
1000
1500
2000
2500
3000
0 10 20 30 40 50
Lat
eral
For
ce (
N)
Cycle
0
0,02
0,04
0,06
0,08
0,1
0,12
0 10 20 30 40 50
Rot
atio
n (
Deg
.)
Cycle

88
Figure 4-7 Preload vs. Cycles (3.2 KN & 0.075mm)
Figure 4-8 Lateral force vs. Cycles (3.2 KN & 0.075mm)
2000
2200
2400
2600
2800
3000
3200
3400
1 11 21 31 41 51 61 71 81 91 101 111 121 131 141 151 161 171 181 191
Prel
oad
(N)
Number of cycles
1400
1500
1600
1700
1800
1900
2000
2100
2200
2300
2400
1 11 21 31 41 51 61 71 81 91 101 111 121 131 141 151 161 171 181 191
Late
ral F
orce
(N)
Number of cycles

89
Figure 4-9 Preload vs. time (Eccles et al., 2010)
Figure 4-10 Rotation vs. Cycles (3.2 KN & 0.075mm)
0
0,1
0,2
0,3
0,4
0,5
0,6
0,7
0,8
1 11 21 31 41 51 61 71 81 91 101 111 121 131 141 151 161 171 181 191
Rota
tion
(Deg
.)
Cycles

90
Figure 4-11 Preload vs. Cycles (3.9 KN & 0.06mm)
Figure 4-12 Lateral force vs. Cycles (3.9 KN & 0.06mm)
2000
2200
2400
2600
2800
3000
3200
3400
3600
3800
4000
0 5 10 15 20 25 30 35 40
Pre
load
(N
)
Cycles
1200
1400
1600
1800
2000
2200
2400
0 5 10 15 20 25 30 35 40
Lat
eral
For
ce (
N)
Cycles

91
Figure 4-13 Rotation vs. Cycles (3.9 KN & 0.06mm)
Another test is performed with PL=3900N and D=0.06mm for 35 cycles. The trends for
preload drop, lateral force changes, and rotation remain the same as in the previous tests. A
comparison of the four tests confirms that the increase of preload has a significant effect on
the self-loosening resistance of the bolted joint. The following table illustrates the effect of
preload.
Table 4-1 Effect of preload on self-loosening
Preload
(KN)
Displacement
(mm)
Preload drop after
35 cycles (%)
Preload drop after
50 cycles (%)
8.1 0.025 4.34 4.3
7.7 0.025 4.38 4.9
3.9 0.06 19.13 -
3.2 0.075 21.23 -
0
0,05
0,1
0,15
0,2
0,25
1 6 11 16 21 26 31 36
Rot
atio
n (
Deg
.)
Cycles

92
Figure 4-14 Preload vs. Cycles (4.1 & 4.2 KN & 0.005mm)
The effect of preload has been studied in previous research and matches the current results. It
was stated that “Clearly, a larger preload enhances the self-loosening resistance of the bolted
joint” (Zhang et al., 2007).
Two tests, with near identical preloads, are performed to verify the performance of the test
rig and its repeatability of testing. These results are shown in Figure 4-14 through Figure
4-16. The preload drop in cases 1 and 2 is 2.4% and 1.51% respectively. The results are close
enough to conclude that the repeatability of the tests is achieved with the current test rig.
3950
4000
4050
4100
4150
4200
4250
3950
4000
4050
4100
4150
4200
4250
1 21 41 61 81 101 121 141 161 181 201
Pre
load
2
Pre
load
1
Cycles
Preload 1
Preload 2

93
Figure 4-15 Lateral force vs. Cycles (4.1 & 4.2 KN & 0.005mm)
100
200
300
400
500
600
700
100
200
300
400
500
600
700
1 11 21 31 41 51 61 71 81 91 101 111 121 131 141 151 161 171 181 191
Lat
eral
For
ce 2
Lat
eral
For
ce 1
Cycles
Lateral Force 1
Lateral Force 2

94
Figure 4-16 Rotation vs. Cycles (4.1 & 4.2 KN & 0.005mm)
4.3 Finite element results
A Finite element run is performed with PL=15000N and D=0.44mm as the applied
displacement on the actuator point.
Preload drop for the different cycles are as shown below:
15000-14380=620, 4.13% equal to 8.7% of total drop (0-1).
14380-13982=398, 2.65% equal to 5.6% of total drop (1-2).
10861-10528=333, 2.2% equal to 4.6% of total drop (10-11).
8168-7904=264, 1.76% equal to 3.7% of total drop (19-20).
Total preload drop 7096N = 48%.
0
0,05
0,1
0,15
0,2
0,25
0,3
0,35
0
0,05
0,1
0,15
0,2
0,25
0,3
0,35
1 11 21 31 41 51 61 71 81 91 101 111 121 131 141 151 161 171 181 191 201
Rot
atio
n 2
(D
eg.)
Rot
atio
n 1
(D
eg.)
Cycles
Rotation 1
Rotation 2

95
Figure 4-17 Preload (15 KN and 0.44mm)
The preload drop and the nut rotation in the first and second cycles are 620N - 0.12 degree
and 398N – 0.264 degree, respectively. The preload drop in the first cycle is greater than in
the second cycle even though it has a smaller rotation. As mentioned previously, the main
mechanism for preload drop in stage I is plastic deformation without rotation between
threads. This theory can be clearly justified through the results of this FEA.
As it is illustrated in Figure 4-18, the decrease in lateral force is proportional to the
consequent preload drop.
Zhang et al. propose a theory to justify the rotation mechanism. They conclude that the
displacement in the circumferential direction can be calculated with the relative radial
(transverse) displacement of the bolt and nut, thread angle, and pitch angle. Equation (4-1)
shows the proposed equation where d is the circumferential displacement, β is the pitch
angle, μ is the friction coefficiant, and t is transverse displacement. (Taken from (Zhang et
al., 2007)):
d = t (4-1).
60007000
80009000
1000011000
1200013000
1400015000
16000
0 2 4 6 8 10 12 14 16 18 20
Prel
aod
(N)
Cycles

96
Figure 4-18 Lateral force (15 KN and 0.44mm)
Figure 4-19 Rotation (accumulated) (15 KN and 0.44mm)
2000
2500
3000
3500
4000
4500
5000
0 2 4 6 8 10 12 14 16 18 20
Late
ral f
orce
(N)
Time (S)
0
0,5
1
1,5
2
2,5
3
3,5
4
4,5
5
0 5 10 15 20 25
Rota
tion
(Deg
.)
Cycles

97
Figure 4-20 Rotation per cycle (15 KN and 0.44mm)
Figure 4-21 Transverse displacement between threads (15 KN and 0.44mm) in actuation direction
0
0,05
0,1
0,15
0,2
0,25
0,3
1 2 3 4 5 6 7 8 9 10 11 12 13 14 15 16 17 18 19 20
Rot
atio
n p
er c
ycle
Cycles
-0,10
0,00
0,10
0,20
0,30
0,40
0,50
0,60
0 5 10 15 20 25 30 35 40 45
Rela
tive
disp
lace
men
t (m
m)
Time (s)

98
Figure 4-21 shows the transverse displacement of the bolt and nut thread which is used to
calculate rotation as per the equation suggested by Zhang et al. Figure 4-22 shows the result
of that rotation versus the rotation from the FE analysis, which are in agreement.
Figure 4-23 shows the transverse displacement and rotation in each cycle. The reduction of
transverse displacement and rotation from second cycle to the last cycle results in a
descending trend. The first cycle has the highest transverse displacement with the lowest
rotation. The transverse displacement in the first cycle causes plastic deformation in the
threads, which is the major mechanism for load drop in first cycle.
Figure 4-22 FE Rotation vs. rotation proposed by (Zhang et al., 2007)
0
0,5
1
1,5
2
2,5
3
3,5
4
4,5
5
0 5 10 15 20
Rota
tion
(Deg
.)
Cycle
Rotation According to Zhang et al.
Rotation from FE results

99
Figure 4-23 Transverse displacement and rotation per cycle
The FE results are verified with theoretical calculations and compared with proposed
calculation method by Zhang et al.
For the theoretical evaluation, the rotation from the FE is used to calculate the axial
displacement of the bolt and its relevant load drop. The stiffness of the joint is calculated
according the following equations:
Kb = 4-2
Where Kb, Ad, At, E, lt and ld are bolt stiffness, major-diameter area of the bolt, tensile-stress
area, Young’s modulus, length of threaded portion of the bolt, and length of unthreaded
portion of the bolt, respectively. (Taken from (Budynas & Nisbett, 2008) page 413.)
0,08
0,09
0,1
0,11
0,12
0,13
0,14
0,1
0,12
0,14
0,16
0,18
0,2
0,22
0,24
0,26
0,28
1 2 3 4 5 6 7 8 9 10 11 12 13 14 15 16 17 18 19 20
Tra
nsv
erse
Dis
p. p
er c
ycle
(m
m)
Rota
tion
per c
ycle
(deg
.)
Cycle
Rotation per cycle
Transverse Disp. Per cycle

100
Km = . . .. . 4-3
Where Km, E, l and d are members stiffness, Young’s modulus, grip length, and hole
diameter in the plate, respectively. The frustum is considered as a cone with a half-apex
angle of 30°. (Taken from (Budynas & Nisbett, 2008) page 415.
= + 4-4
Where Kj is the joint stiffness.
Then load drop can be obtained as:
Preload drop = Kj × dx 4-5
dx = × Bolts pitch 4-6
FE results are compared with theoretical calculations and Zhang’s method in Figure 4-24.
The difference between the theoretical results and the FE results can be attributed to the fact
that the calculation of stiffness is an approximation given by Budyna and Nisbett 2008. The
theory based on a frustum with a 30° angle is used in the theoretical method, which considers
the stiffness of the part in the cone area whereas FE considers the parts beyond this area
which affects the results considerably. This comparison validates the FE results.
Another finite element analysis is performed with the loading conditions of one of the
experimental tests. In this analysis, the preload and the lateral displacement are 8.1 kN and
0.12 mm, respectively. The applied lateral displacement results with a relative displacement
of 0.02 mm between the rigid plates is close enough to the previous experimental test
conducted with 8.1 kN of preload and 0.025 mm of relative displacement.
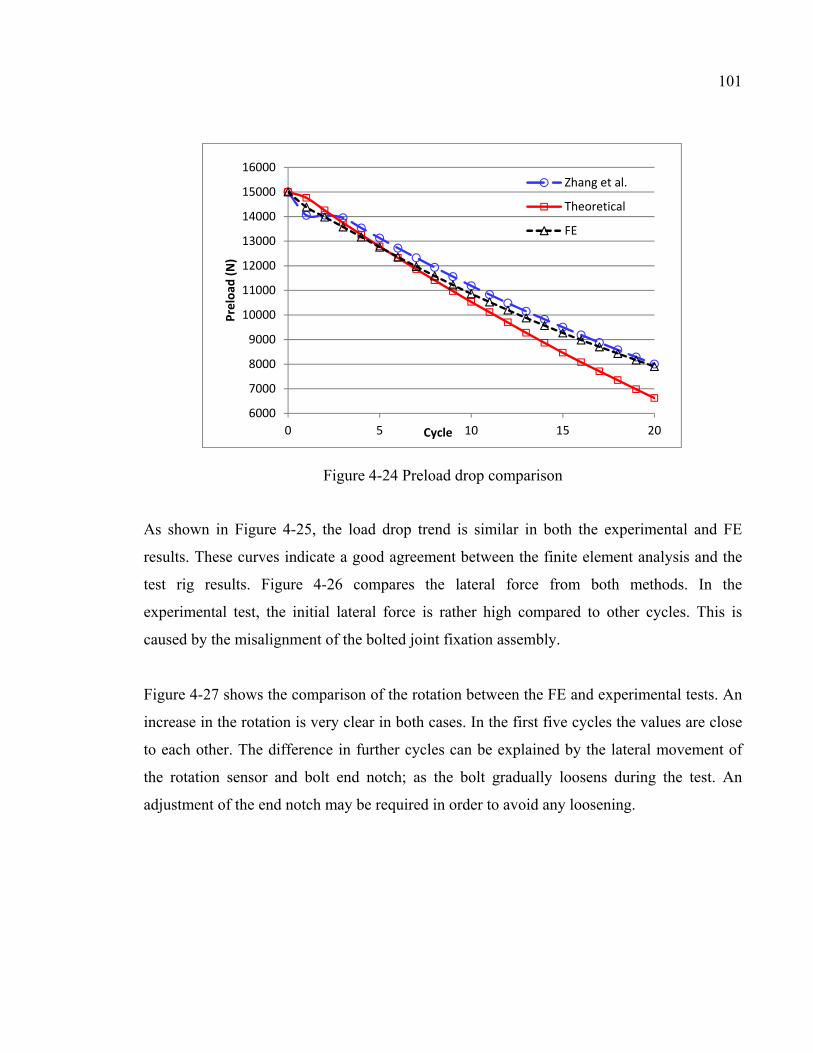
101
Figure 4-24 Preload drop comparison
As shown in Figure 4-25, the load drop trend is similar in both the experimental and FE
results. These curves indicate a good agreement between the finite element analysis and the
test rig results. Figure 4-26 compares the lateral force from both methods. In the
experimental test, the initial lateral force is rather high compared to other cycles. This is
caused by the misalignment of the bolted joint fixation assembly.
Figure 4-27 shows the comparison of the rotation between the FE and experimental tests. An
increase in the rotation is very clear in both cases. In the first five cycles the values are close
to each other. The difference in further cycles can be explained by the lateral movement of
the rotation sensor and bolt end notch; as the bolt gradually loosens during the test. An
adjustment of the end notch may be required in order to avoid any loosening.
6000
7000
8000
9000
10000
11000
12000
13000
14000
15000
16000
0 5 10 15 20
Prel
oad
(N)
Cycle
Zhang et al.
Theoretical
FE

102
Figure 4-25 Preload drop in 20 cycles (8.1kN and 0.02mm displacement)
Figure 4-26 Lateral force in 20 cycles (8.1kN and 0.02mm displacement)
7400
7500
7600
7700
7800
7900
8000
8100
8200
1 2 3 4 5 6 7 8 9 10 11 12 13 14 15 16 17 18 19 20 21
Prel
oad
(N)
Cycles
Experimental
FE
0
500
1000
1500
2000
2500
3000
3500
4000
1 2 3 4 5 6 7 8 9 10 11 12 13 14 15 16 17 18 19 20 21
Late
ral f
orce
(N)
Cycles
Experimental
FE

103
Figure 4-27 Rotation in 20 cycles (8.1kN and 0.02mm displacement)
In general, the FE and experimental results show good agreement. Some adjustments are
needed in order to have reliable results. The data acquisition system is not appropriate for this
kind of study. Due to the dynamic nature of the problem and the presence of cyclic
displacement, the frequency of sampling must be higher in order to pick up all the
measurements during a displacement or load cycle. The recorded data is not taken at the
same point during the cycle and therefore fluctuations are shown in all recorded data.
In addition, the rig requires some adjustment at the attachments level in order to avoid
clearance and loosening. The shake down of the test rig needs to be pursued further for the
purpose of consolidating the test results and produce accurate and reliable performance of the
test rig.
0
0,02
0,04
0,06
0,08
0,1
0,12
0,14
0,16
0,18
0,2
0 1 2 3 4 5 6 7 8 9 10 11 12 13 14 15 16 17 18 19 20
Rota
ion
(Deg
.)
Cycles
ExperimentalFE


CONCLUSION
Performance of the test rig
To ensure the integrity of a structure, it is crucial to retain preload in its bolted joints. The
first step in doing this requires knowing and quantifying the determinant factors for self-
loosening. Experimental tests are widely used to study bolted joints and validate analytical
and finite element studies. The basic requirement for any experimental test is a reliable test
machine. In the current study, a fatigue test machine is used in conjunction with a bolted joint
clamping fixture to study the effects of geometry, material and stiffness on the self-loosening
of clamped joints. Test machines used in previous studies are reviewed to find disadvantages
of different measurement methods to develop a high-performing test rig.
Inserting a load cell into the bolt joint, which is a very common measurement method,
directly affects the stiffness of the joint (see paragraph 2.3). In the current study, the load cell
is replaced by a strain gauge inside the bolt, which does not alter the grip length and the
stiffness of the joint. A strain gauge is calibrated to directly measure the force. The
conclusion related to the success of the test rig to reproduce the results are very promising.
Indeed, the preload measured in the load case with 8.1 kN and 0.02 mm displacement shows
6.5% load drop in the experimental test the finite element gives 4.4% which give confidence
in the test rig and accuracy of measurement system.
Based on the FEM results, to capture the real relative displacement of the plates, it is
important to do the measurement as closer as possible near the bolt location. As presented in
chapter 4, measuring lateral displacement at vicinity of bolt location is quite different from
measured displacement at the actuator point, as is the case in other studies. In previous
experimental studies described in the literature, the displacement of the actuator of the Junker
machine is considered to be as the relative displacement that causes self-loosening, which
have led to unrealistic results in some cases. This is because the displacement at the actuation
point includes the resultant deformations of the connecting parts including the clamping

106
parts. Therefore, the comparison with the actual industrial applications are not realistic and
the self-loosening and its time duration in bolted joints become unpredictable. To overcome
this difficulty, the displacement sensor is installed on the test plate adjacent to the bolt hole
with a rigid support to measure the actual relative displacement of the clamped plates. The
displacement ratio at the actuator to the plate hole location in the first experimental test was
found to be 8 which justifies the design system location.
As demonstrated in previous studies, the rotation in stage I is ignored, while stage II shows
considerable rotation. This fact is used to indicate the transition point between two stages
during the experiment. Hence, to study accurately both stages of self-loosening in bolted
joints, it is essential to measure rotation continuously. While most test machines are not
equipped with rotation sensor, the proposed test rig measures rotation continuously. In
addition, rotation measurement can be linked to the drop of load when stage II takes place.
Bearing in mind that temperature changes joint dimensions and material properties when it is
important, its effect on self-loosening of bolted joints could shed some light. Hence, the
proposed test rig set-up is equipped with a thermocouple to give an indication on the
variation of the room temperature. Nevertheless, the effect of high temperature is not part of
the objectives of the short-term research plan.
In order to simulate the real behaviour of a bolted joint, it is essential to model both stages,
while most of previous studies simulate the second stage only. This rig offers the possibility
to study both stages I and II. The FE simulation led to accurate numerical results which are
close to experimental findings as presented in chapter 4.
To study the real behavior of bolted joints, it is important to use 3D model which considers
rotation, instead of 2D modelling. A 2D simulation can be used to model stage I of self-
loosening which is due to an elasto-plastic deformation of the threads and the local
deformation at the asperity level. As presented in chapter 3, the current study uses a full 3D

107
model with the real 3D bolted joint geometry to simulate the real behavior giving results
close to experimental findings.
Contribution
The main contributions of the current study are as the followings:
1- Proposing a new flexible test set-up to be installed on a tensile compression machine
to study the self-loosening of bolted joints. This set-up measures rotation, lateral
displacement, axial force, lateral force and temperature while capturing the real
bolted joint behaviour. This contribution meets the objectives one to four of the
current study.
2- Developing a 3D FE model using an elastic-plastic material behavior that simulates
the real behaviour of bolted joint. It serves as a mean to validate the overall design
and the test rig ability to experimentally reproduce the self-loosening mechanism.
This model can be used in future studies to investigate parameters that cannot be
measured experimentally such as contact pressure, stresses and deformations at
critical locations. This contribution meets the last objective of the current study.


FUTURE STUDIES
Test rig improvement
The performance of few instruments is questionable. The calibration of few instruments is
conducted with elementary means and proper calibration tools are needed. The rotation
sensor is calibrated with an angle indicator A more precise calibration device is needed. In
addition, the rotation sensor fixation can be improved by finding a solution that will
eliminate or account for the relative lateral displacement of the nut and the bolt which causes
self-loosening. The reducing of the variation in the captured rotation during each cycle would
increase the accuracy of the system.
Frequency of the test in the first and second cycles is lower than the rest. Coefficient of static
friction is higher than kinematic, so bigger force is required to start the cyclic motion. The
test rig motor is not powerful enough to overcome start-up inertia and static friction. Using a
motor with higher starting torque would be an excellent improvement to do to the current rig.
Preload should be measured at the start of the test however its variation and the cyclic lateral
force should be recorded at all time and in particular when the displacement is at its
maximum. The current control program requires higher sampling frequency to pick up the
maximum and the minimum values of the measured cyclic parameters. The Labview vi could
be modified to take more data points during each cycle to solve this problem.
A circular oven around the test plates could be added to the test rig to study the effect of
temperature on the self-loosening of bolted joint. A temperature sensor is already installed
and is connected to the data acquisition system, although the temperature of the joint due to
friction generated by the speed of transverse load or displacement cycling cannot be
controlled. However, a temperature PID controller would be required. Studying the effect of
temperature is very important for high temperature applications, especially in power and oil
and gas industries where many clamped plates and bolted joints are exposed to self-loosening

110
at high temperature. Quantifying the effects of initial load, materials, joint stiffness,
temperature and creep are few research challenges that could be the subject of future studies
to be conducted with the designed rig.
FE model to study self-loosening
The developed finite element model is validated and can be used to study the effects of
different parameters on the self-loosening of bolted joints. The stiffness of the joint, initial
load, lateral displacement and force, temperature, friction, materials and threads geometry
and clearance are to name a few. Performing FE analysis with different geometry, materials
and loading conditions can be done quite easily. The effects of stiffness and grip length along
with other parameters could show interesting results. Experimental tests with a possible
variation of certain of the above-mentioned parameters conducted on the present designed
test rig can be performed to validate some aspects of FE modeling.

APPENDIX I
Strain gage catalog, KYOWA

112

LIST OF BIBLIOGRAPHICAL REFERENCES
ASME. (1981). B18.22M Metric Plain Washer. New York: ASME. ASME. (1989a). B18.2.3.5M Metric Hex Bolts New York: ASME. ASME. (1989b). B18.2.4.1M Metric Hex Nuts New York: ASME. ASME. (2001). B1.13M Metric Screw Threads New York: ASME. Bickford, J. H. (2008). Introduction to the Design and Behavior of Bolted Joints (4 éd.).
Boca Raton: CRC Press. Budynas, R. G., & Nisbett, J. K. (2008). Shigley's mechanical engineering design (Vol. 9).
McGraw-Hill New York. Eccles, W., Sherrington, I., & Arnell, R. D. (2010). Towards an understanding of the
loosening characteristics of prevailing torque nuts. Proceedings of the Institution of Mechanical Engineers, Part C: Journal of Mechanical Engineering Science, 224(2), 483-495.
Jiang, Y., Zhang, M., & Lee, C.-H. (2003). A study of early stage self-loosening of bolted
joints. Journal of Mechanical Design, 125(3), 518-526. Jiang, Y., Zhang, M., & Lee, C.-H. (2006). An experimental investigation of the effects of
clamped length and loading direction on self-loosening of bolted joints. Journal of pressure vessel technology, 128(3), 388-393.
Junker, G. H. (1969). New Criteria for Self-Loosening of Fasteners Under Vibration. doi:
10.4271/690055. Repéré à http://dx.doi.org/10.4271/690055 MIDORI_PRECISIONS. (2009). CP-2UN/CP-2UTN Repéré à http://www.midori.co.jp/cp-
2un-e.html Nassar, S. A., & Housari, B. A. (2007). Study of the effect of hole clearance and thread fit on
the self-loosening of threaded fasteners. Journal of Mechanical Design, 129(6), 586-594.
OSHA. (2013). Hydrogen Sulfide. Repéré à
https://www.osha.gov/SLTC/hydrogensulfide/hazards.html Sawa, T., Ishimura, M., & Karami, A. (2010). A Bolt-nut Loosening Mechanism in Bolted
Connections under Repeated Transverse Loadings (Effect of inclined bearing surfaces

114
on the loosening). Dans ASME 2010 Pressure Vessels and Piping Division/K-PVP Conference (pp. 397-403). American Society of Mechanical Engineers.
Sawa, T., Ishimura, M., & Nagao, T. (2012). A Loosening Mechanism of Bolted Joints under
Repeated Transverse Displacements. Dans ASME 2012 Pressure Vessels and Piping Conference (pp. 333-341). American Society of Mechanical Engineers.
Shih, T. (2015, May/June). Global Automative Fastener Import & Export Statistics & Trend
Analysis. Fastener World, 152, 182-192. Systems Integrators LLC. (2011). LFE 150 Owner’s Manual (pp. 23). 23630 N 35th Drive,
Suite one Glendale, AZ 85310: Systems Integrators LLC. TE_Connectivity_Corporation. (2017). LVDT Tutorial. Repéré à http://www.te.com/usa-
en/industries/sensor-solutions/insights/lvdt-tutorial.html Yang, X., Nassar, S., & Wu, Z. (2010). Formulation of a Criterion for Preventing Self-
Loosening of Threaded Fasteners Due to Cyclic Transverse Loading. Dans ASME 2010 Pressure Vessels and Piping Division/K-PVP Conference (pp. 415-425). American Society of Mechanical Engineers.
Yang, X., & Nassar, S. A. (2011a). Effect of Non-Parallel Wedged Surface Contact on
Loosening Performance of Preloaded Bolts Under Transverse Excitation. Dans ASME 2011 Pressure Vessels and Piping Conference (pp. 405-415). American Society of Mechanical Engineers.
Yang, X., & Nassar, S. A. (2011b). Effect of thread profile angle and geometry clearance on
the loosening performance of a preloaded bolt-nut system under harmonic transverse excitation. Dans ASME 2011 Pressure Vessels and Piping Conference (pp. 393-404). American Society of Mechanical Engineers.
Yang, X., & Nassar, S. A. (2012). Deformation and Slippage Modeling for Investigating Bolt
Loosening Under Harmonic Transverse Excitation. Dans ASME 2012 Pressure Vessels and Piping Conference (pp. 321-332). American Society of Mechanical Engineers.
Zaki, A., Nassar, S., & Yang, X. (2010). Vibration Loosening Model for Preloaded
Countersunk-Head Bolts. Dans ASME 2010 Pressure Vessels and Piping Division/K-PVP Conference (pp. 361-371). American Society of Mechanical Engineers.
Zaki, A. M., Nassar, S. A., & Yang, X. (2011). Criterion for Preventing Self-Loosening of
Preloaded Countersunk Head Threaded Fasteners. Dans ASME 2011 Pressure Vessels and Piping Conference (pp. 369-380). American Society of Mechanical Engineers.

115
Zaki, A. M., Nassar, S. A., & Yang, X. (2012). Effect of conical angle and thread pitch on the self-loosening performance of preloaded countersunk-head bolts. Journal of pressure vessel technology, 134(2), 021210.
Zhang, M., Jiang, Y., & Lee, C.-H. (2007). Finite element modeling of self-loosening of
bolted joints. Journal of Mechanical Design, 129(2), 218-226. Ansys Inc. (2015), Ansys Academic Research Mechanical (Version 15) [Computer software]. Canonsburg, Pennsylvania: Ansys Inc.