Development of a Quantitative Model for the Mechanism of Raveling Failure...
18
Development of a Quantitative Model for the Mechanism of Raveling Failure in Highway Rock Slopes using LIDAR by Norbert Maerz A National University Transportation Center NUTC R274
Transcript of Development of a Quantitative Model for the Mechanism of Raveling Failure...

Development of a Quantitative Model for the Mechanism of Raveling Failure in Highway Rock Slopes using LIDAR
by
Norbert Maerz
A National University Transportation Center
NUTC R274

Disclaimer
The contents of this report reflect the views of the author(s), who are responsible for the facts and the
accuracy of information presented herein. This document is disseminated under the sponsorship of
the Department of Transportation, University Transportation Centers Program and the Center for
Transportation Infrastructure and Safety NUTC program at the Missouri University of Science and
Technology, in the interest of information exchange. The U.S. Government and Center for
Transportation Infrastructure and Safety assumes no liability for the contents or use thereof.
NUTC ###
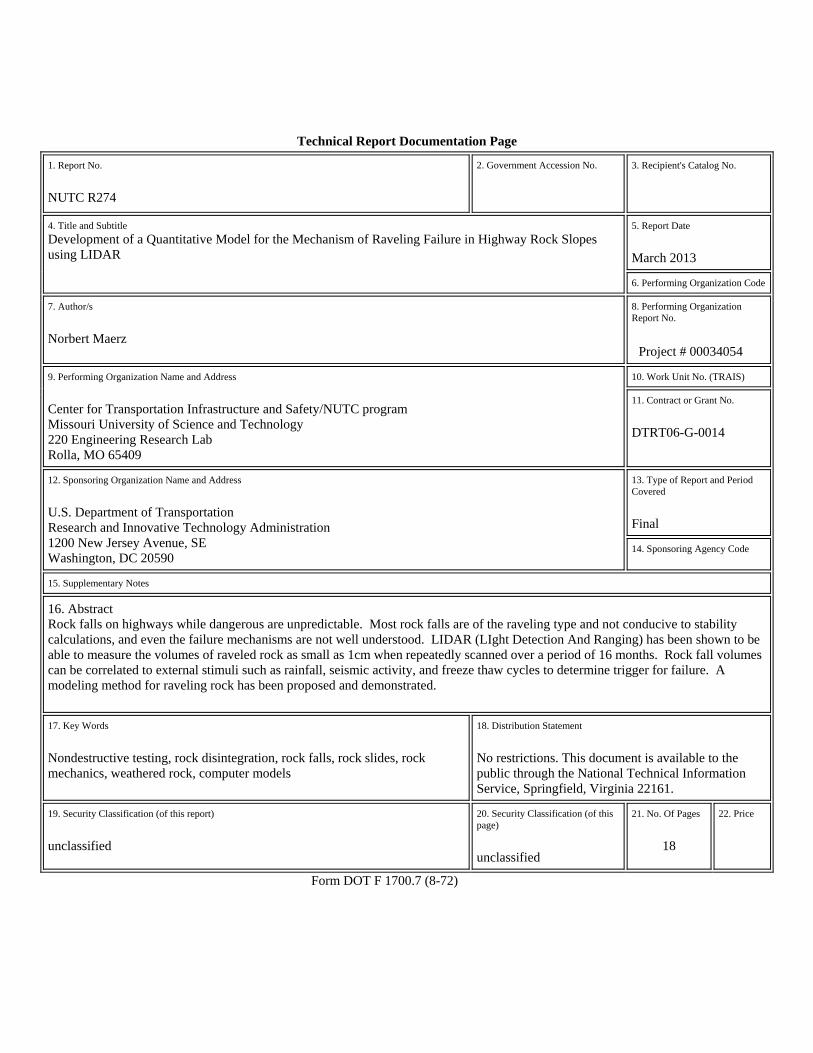
Technical Report Documentation Page
1. Report No.
NUTC R274
2. Government Accession No. 3. Recipient's Catalog No.
4. Title and Subtitle
Development of a Quantitative Model for the Mechanism of Raveling Failure in Highway Rock Slopes using LIDAR
5. Report Date
March 2013
6. Performing Organization Code
7. Author/s
Norbert Maerz
8. Performing Organization Report No.
Project # 00034054
9. Performing Organization Name and Address
Center for Transportation Infrastructure and Safety/NUTC program Missouri University of Science and Technology 220 Engineering Research Lab Rolla, MO 65409
10. Work Unit No. (TRAIS)
11. Contract or Grant No.
DTRT06-G-0014
12. Sponsoring Organization Name and Address
U.S. Department of Transportation Research and Innovative Technology Administration 1200 New Jersey Avenue, SE Washington, DC 20590
13. Type of Report and Period Covered
Final
14. Sponsoring Agency Code
15. Supplementary Notes
16. Abstract Rock falls on highways while dangerous are unpredictable. Most rock falls are of the raveling type and not conducive to stability calculations, and even the failure mechanisms are not well understood. LIDAR (LIght Detection And Ranging) has been shown to be able to measure the volumes of raveled rock as small as 1cm when repeatedly scanned over a period of 16 months. Rock fall volumes can be correlated to external stimuli such as rainfall, seismic activity, and freeze thaw cycles to determine trigger for failure. A modeling method for raveling rock has been proposed and demonstrated.
17. Key Words
Nondestructive testing, rock disintegration, rock falls, rock slides, rock mechanics, weathered rock, computer models
18. Distribution Statement
No restrictions. This document is available to the public through the National Technical Information Service, Springfield, Virginia 22161.
19. Security Classification (of this report)
unclassified
20. Security Classification (of this page)
unclassified
21. No. Of Pages
18
22. Price
Form DOT F 1700.7 (8-72)

1
Development of a Quantitative Model for the Mechanism of Raveling Failure in Highway Rock Slopes using LIDAR
Abstract Rock falls on highways while dangerous are unpredictable. Most rock falls are of the raveling type and not conducive to stability calculations, and even the failure mechanisms are not well understood. LIDAR (LIght Detection And Ranging) has been shown to be able to measure the volumes of raveled rock as small as 1cm when repeatedly scanned over a period of 16 months. Rock fall volumes can be correlated to external stimuli such as rainfall, seismic activity, and freeze thaw cycles to determine trigger for failure. A modeling method for raveling rock has been proposed and demonstrated.
1. Background Rock falls are a major geological hazard in many states with mountainous or hilly terrain. Catastrophic failures of rock cuts can result in property damage, injury, and even death. Rock fall hazard assessment in the USA has traditionally been a reactive process. This is because the most common form of rock fall, raveling, is poorly understood and difficult to predict.
In many terrains the discontinuities are oriented in such a way that they contribute to create wedge, planar sliding, or toppling failures (Figure 1) which are easy to analyze. Franklin and Senior (1997b) report that of 415 analyzed cases of failure in Northern Ontario, only 33% of failures involved these mechanisms (23% toppling, 8% planar sliding, 2% wedge sliding). Analysis methods for these failures are well known, and can range from limiting equilibrium analysis to numerical modeling (Hoek and Bray, 1981; Piteau, 1979c; Piteau, 1979d). The mapping of discontinuity orientations is a requirement, before or after the cut has been exposed (Piteau, 1979a; Piteau, 1979b; Piteau 1979g). Rock determined to be loose with the potential for failure must be removed or restrained in some way (Piteau, 1979e). Prescribed designs for remediation and/or mitigation are easy to find (Brawner, 1994; Konya and Walter, 1991; Piteau, 1979f; Franklin and Senior, 1997a). In the Northern Ontario study, 65% of the failures were of the “raveling” type (Figure 2). These included raveling (25%), overhang/undercutting failure (15%), ice jacking (14%), and rolling blocks (11%). In other terrains, most notably flat lying sedimentary rock, such as is found in much of the US, the predominant failure mechanism of the raveling type is even greater.
These raveling failures, defined as time dependent regressive displacement failures, are more problematic. There are no analysis techniques for prediction, and remediation designs are typically based on engineering judgment, balancing the risk in terms of probability of failure and consequence of failure, against the cost of effective remediation. The use of empirical design and rock mass classification becomes important (Franklin and Maerz, 1996). Even the mechanism of raveling is poorly understood. Methods of empirical classification and analysis have been developed (Maerz, 2000; Maerz et al., 2003; Maerz et al., 2004a; Maerz et al., 2004b; Youssef et al. 2003, Maerz et al., 2005, Youssef et al., 2007).

2
Figure 1: Example of wedge, planar, raveling, undercutting failures along road cuts.
1.1 Raveling rock falls Raveling failure, the most common type of rock failure, is poorly understood. Analysis is mostly descriptive, and prediction of the amount is typically an empirical exercise in guessing based on extra-polation of visual evidence. Raveling failures are often slow and time dependent, but can also be catas-trophic if they involve large blocks. Large block falls are often the result of the collapse of undercut overhanging ledges. Rock structure contributes to the raveling process; however it is typically weathering driven weakening and degradation of the intact rock that leads to the raveling, and external triggers such as ground vibrations, excess pore pressure, freeze-thaw or thermal cycling. The literature abounds with mention of raveling (Piteau, 1979a, Hoek and Bray, 1981; Walkinshaw and Santi, 1996; Kliche, 1999). Rock hazard rating systems use raveling as a parameter to determine the durability of rock cuts (Pierson and Van Vickle, 1993; Senior, 1999; Maerz et al., 2004b). Recent European research has investigated the processes and morphology of raveling, although in a qualitative observational way (Huisman et al., 2004, Nicholson, 2003; Kuhnel, 2002). Krautblatter and Dikau (2007) provide a review of what they call “rockwall retreat” provide conceptual models and triggering factors. 1.1.1 Mechanisms of raveling Kuhnel (2004) lists the following factors that drive rock degradation and raveling:
1. Stress release (unloading, growth of discontinuities) 2. Pressure shocks (blasting and earthquakes) 3. Water pressure 4. Thermal cycling 5. Freeze-thaw 6. Chemical weathering (oxidation/reduction, hydration/dehydration, recrystallization/resolution,
phase reactions/transformations, weathering rates increased by presence of water and gasses) 7. Biogenic causes 8. Anthropogenic (e.g. acid rain, other pollutions) 9. Interactions of the above factors (e.g., cracks propagation, water pressure opening, cracks, tree
roots opening them further) Kuhnel did not quantify the relative contribution of each factor but did order them in the following sequence:
1. Physical/mechanical/thermal (stress related) factors 2. Chemical weathering 3. Biogenic and Anthropogenic factors

3
Clearly different rock types respond differently. For instance quartz rich rocks are virtually immune from chemical weathering, whereas mafic igneous rocks are so prone to chemical attack that they rarely have a chance to be physically weathered. Similarly, soluble limestones dissolve quickly, not leaving time for physical weathering. Nevertheless Kuhnel provides a framework for mechanisms, even if no quantification is done. 1.1.2 Morphology and classification of raveling Nicholson (2003) quantitatively describes deterioration related morphologies. Figures 2 and 3 show erosional and depositional morphologies due to deterioration. Nicholson does not quantify any of the processes, nor does anyone else in the literature. Nicholson (2003) presents a quantitative classification along axes of material size, frequency of events and velocity of events. 1.1.3 Quantification of raveling/block falls No quantification of the raveling process has been found in the literature. Kemeny (2005), Lee (2007), Kemeny and Kim (2009) have proposed modifications to the UDEC® and PFC® (distinct element) modeling to consider progressive failure through crack growth. These address the issue of crack growth along existing cracks rather than a stochastic approach to raveling.
Figure 2: Erosional morphology due to deterioration (Nicholson, 2003).
Figure 3: Depositional morphology due to deterioration (Nicholson, 2003).
1.2 The role of LIDAR 1.2.1 What is LIDAR? LIDAR is an acronym for LIght Detection And Ranging. Different types of LIDAR units can measure distance, speed, rotation, and even chemical composition and concentration.
As a distance measuring device, LIDAR replaces traditional methods of laser surveying, which take individual measurements, and require reflective targets to measure distances and angles. LIDAR is more analogous to radar, in that the scanning laser can make up to 500,000 point measurements per second, returning a point cloud, which can be used by sophisticated software to create a very detailed surface

4
map. Variants of the LIDAR unit include models used from airplanes to create detailed ground surface maps and terrestrial models that can be operated from stationary locations to moving vehicles. At Missouri S&T, we have a Leica ScanStation II, and a Leica HDS6000, both terrestrial LIDAR models that were used for this project. These have a range of over one hundred meters, a sampling resolution of less than 1 mm, and a modeled precision of 2 mm. In our work we have been able to measure differences of 0.3 mm, under very controlled circumstances. 1.2.2 How was LIDAR used in this study? The LIDAR unit was used to collect data on the raveling process used to develop a model for raveling slope. It was used to do change detection on slopes, to measure with precision the initial geometries of the slope as an input to modeling, and monitor the changes in geometry of the cut or slope as individual pieces of rock ravel out of the slope. Using multiple scans over time, the timing and sequence of the falling rock was analyzed. LIDAR has been used in this manner to determine volumes of coastal erosion (Rosser et al, 2005, Young and Ashford, 2005), and rock slides (Oppikofer et al., 2008).
The Scan Station II LIDAR unit is typically set up at a stationary location, facing a slope, bluff, structure, or topographical feature (Figure 4). The device can automatically scan 360º horizontally and 270º vertically. The device will scan at a scan rate of 50,000 points per second. The device stores a “point cloud” which is a list of x, y, z coordinates that describe the topography with an accuracy of up to 2 mm (Figure 5). For this project, “before” and “after” LIDAR point clouds will be used to map the raveling process over time (Figure 5). LIDAR measurements allowed us to measure and map the sequence and removal of blocks, even blocks as small as or smaller than 1 cm on edge. Rock cuts were be measured and mapped. Measurements were correlated to rainfall, temperature, seismic, and hydraulic conditions.
Figure 4: Scan section of a rock face in a local quarry.
Figure 5: Point cloud of the scan and resulting areas of rock loss painted in red.
2. Results of a pilot study To demonstrate the feasibility of the proposed technique, a small 16 month study was undertaken. Two small local rock cuts, one in and one near a local quarry were imaged using LIDAR, at a frequency of once every week or every second week. At the same time measurements of temperature, rainfall and ground vibration from blasting were obtained. Resolution of the scans was set to 3 and 8 mm, with an average of 6.7 million data points per scan. The smallest rock that could be detected is 9 mm across.

5
2.1 Data processing methodology Software was developed to register the point clouds (with an average root mean square error of 2.5 mm) scanned at different times and measure the volume of the fallen rock. All software is developed in C++, compiled using the GNU G++ complier, and runs on Ubuntu® Linux. Two open-source libraries are used for graphic output – OpenCV for graphic output and OpenGL® for interactive display functions. The processing sequence was as follows:
1. Converting raw point cloud data into a single spherical surface representation (Figure 6). 2. Filling gaps in the data (empty bins) (Figure 7). 3. 3-D registration process of sequential scan images (Mikhail et al., 2001) (Figure 8). 4. Vegetation and other non-rock artifact detection and removal (Figure 9). 5. Cropping to a common horizontal and vertical domain (Figure 10). 6. Creation of a difference surface between any two registered scans (Figure 11). 7. Difference surface artifact removal (Figure 12). 8. Individual lost-rock statistics and volume determination (Figure 13).
Figure 6: Convert spatial randomness of raw database (left) to ordered 3 mm by 3 mm bins on a spherical surface (right).
Figure 7: Gaps in binning due to mechanical imprecision of the LIDAR (left) are removed by interpolating between the two closest opposing bins (right).

6
Figure 8: Pick points (red x’s in left image) are selected in areas where no change is seen or anticipated. A 50 by 50 kernel is fitted around the “pick point” to automatically establish a registration point (right). A 7 parameter shape-preserving conformal process is used to transform the data to a common coordinate system using between 4 and 16 registration points, resulting in a RMS error of less than 5mm for the 3 mm scan resolution.
Figure 9: Vegetation removal (left) using a virtual articulating conical probe (right) that determines whether each point in the cloud is part of the rock surface or an artifact such as vegetation or a bird/insect/other obstruction in the scan. (Green line is scan line, red line is the distance to the surface, and the yellow shows the articulating cone).
Figure 10: Red lines show crop areas of the different scans. The green box shows the largest minimum bounding rectangle common to all datasets.
Figure 11: Color coded difference surface. Blue areas indicate lost material, red areas indicate gained material, and green areas indicate no change. (Gained areas could be rock that has dropped into the image from above or small errors below the measurement threshold).

7
Figure 12: Several techniques are used to differentiate real lost rock material (right) from the residual artifacts in the difference map (left). These include successive dilate and erode functions and blob analysis. Lost rock is identified in reverse chronological sequence to reduce the incidence of false positive identifications.
Figure 13: Individual lost rock statistics (right) and graphical representation (top).

8
2.2 Verification study A rock fall simulation was conducted in which a known volume of clay, measured in regular shaped mold, was stuck to a rock outcrop (Figure 14) in 9 “blobs” to simulate 9 rock blocks. The outcrop was scanned with the LIDAR scanner, before and after attachment of the simulated rock blobs. In the first case the scanner was not moved between scans to simulate “perfect” registrations. In the second case the scanner was removed and repositioned and normal registration techniques were applied. Results showed that the accuracy of the measurement was 2% or less (Table 1).
Figure 14: Clay pressed into a mold with a volume of 3706 ml (left) and the clay attached to the rock outcrop simulating 9 individual blocks. Table 1: Block volume calculations from physical simulations Actual volume of the
nine blobs (ml) LIDAR measured
volume of the nine blobs (ml)
Percent error
LIDAR scanner not repositioned
3706
3737
+0.8364%
LIDAR scanner repositioned
3706
3648
-1.565%
2.3 Preliminary correlations and lessons learned
Preliminary correlations (Figure 15) between volume of blocks lost and freeze-thaw cycles, blasting episodes, and rainfall are somewhat tentative at this point:
1. In both sites significant episodes of volume loss occurred continually during the winter months when freeze-thaw cycles occurred. Significantly less volume loss occurred during most of the non-winter months.
2. A single precipitation event (between days 24 and 45 in the winter time frame), resulted in large volume loss in both sites.
3. A single precipitation event (between days 468 and 475 in the non-winter time frame), resulted in large volume loss in both sites.
4. Not all precipitation events resulted in volume loss. 5. There was no obvious correlation between volume loss and blasting parameters such as peak
particle velocity

9
6. Cumulative rock loss was similar in both sites over the duration of the project; incremental rock loss was significantly different.
7. Some episodes of volume loss were seemingly uncorrelated to any of the measured stimuli. Results of the analysis have already revealed several things that will be useful in developing a raveling model. When viewing the full suite of images for both sites (a few of which are shown in Figure 13) the following was observed:
Figure 15: Results of scanning over 475 days. Left: Site 1; right: Site 2. Light blue zones indicate winter seasons; brown dotted lines indicate peak rainfall episodes.

10
The raveling sequence was progressive, with significantly higher rates of raveling in the winter season (when the diurnal temperature cycle typically crosses back and forth over the freezing mark (frost wedging).
1. Raveling rates in some (weaker) layers of rock were higher than in other layers of rock, typically strata-bound. In addition raveling rates were found to be higher under obvious overhangs.
2. Raveling was progressive within a small area. Often an identifiable block or cluster, rather than fall down in a single episode and break on impact below, would ravel a little bit at a time (Figure 16).
3. There may be a threshold of rainfall to initiate acceleration of rock fall 4. There may be an interaction between rainfall and freeze thaw cycles.
Figure 16: Progressive raveling loss (left). Yellow, 7/15/2011, brown 7/26/2011, red 8/02/2011. Right: Close up of a small area.
3. Preliminary modeling studies using PFC
3.1 What is PFC? Particle fluid code (PFC and PFC3D) is a software package using discrete/distinct element methods (DEM) to model and analyze the particle interactions within a scientific or engineering system. In DEM, the interaction of the particles is treated as a dynamic process with states of equilibrium developing whenever the internal forces balance. The contact forces and displacements of a stressed assembly of particles are found by tracing the movements of the individual particles (Cundall and Strack, 1979; Cundall, 1988; Hart et al. 1988; HCItasca, 2006; Cundall and Potyondy, 2001). Crystalline rock behaves like a cemented granular material of complex-shaped grain in which both the grains and the cement are deformable and may break. The fundamental particle is circular or spherical, but the complex grains and blocks are produced by bonding particles. The damage occurs by bond breakages so that the material evolves from solid to granular. Therefore, the system exhibits a rich set of emergent behaviors similar to crystalline rock.
3.1 Results of a pilot study The basic particle used in PFC is the ball with unit thickness. Since the rocks are in various shapes, the balls were bonded through contact and parallel bonds to represent the rock masses. An original rock slope was created with the balls ranged from 0.05 m to 0.10 m in radius. The initial void ratio of the slope was set to 0.15. And the balls were then generated one by one until the void ratio reached 0.15 within the polygonal area, A’B’C’E’D, which was enlarged from the original slope area, ABCED. The walls, A’B’, C’E’, and E’B’, were then moved toward the positions of ABCE to compact the balls into the prescribed slope zone, ABCED.

11
The material properties used in the model were estimated. The contact bonds were installed to make the slope stand vertically. Once the magnitude of the tensile normal or shear contact force exceeds the respective strength, the bond breaks. After the material properties were given, a number of calculation steps were performed to compute the movement of the balls as they approached a mechanical equilibrium state, which means that the mean unbalanced force approached to a very small value, based upon the prescribed material properties. After the sufficient calculation cycles, the original rock slope was successfully created, as shown in Figure 17.
Near surface clusters are weakened by reducing bonding strengths as a trigger for raveling (Figure 18). (Contact bond s also vary randomly within the slope, and the weakened sections.) Time stepping results in failures that appear very realistic, but have not yet been compared to LIDAR measurements.
Figure 17: Model configuration (left), and intact rock slope (right).
Figure 18: Modified slope with clusters of weaker mechanical properties (left) and rock fall after 2070 time steps (right).

12
4. Conclusions The results of this research have proven the concept of using LIDAR to quantify time dependent raveling of and to correlate to external stimuli such as rainfall, temperature cycling, and seismic activity. Modeling with the Partical Flow Code (2D) shows that we can model the raveling mechanism.
5. References BRAWNER, C. O., 1994. Rockfall Hazard Mitigation Methods. Participant Workbook: FHWA Report –
FHWA-SA-93-085. CUNDALL, P.A., 1988. Formulation of a three-dimensional distinct element model – part I. A scheme to
detect and represent contacts in a system composed of many polyhedral blocks, International Journal of Rock Mechanics, Mining Science & Geomechanics Abstracts, Vol. 25, No. 3, pp. 107-116.
CUNDALL, P. and POTYONDY, D., 2001. Modeling solids via bonding, PFC training course, 1st
International PFC Symposium. CUNDALL, P.A., and STRACK, O.D.L., 1979. A discrete numerical model for granular assemblies,
Geotechnique, Vol. 29, No. 1, pp. 47-65. FRANKLIN, J. A., AND DUSSEAULT, M. B., 1991. Rock Engineering Applications. McGraw-Hill,
New York, NY, 429 pp. FRANKLIN, J. A., AND MAERZ, N. H., 1996. Empirical design and rock mass characterization:
Proceedings of the FRAGBLAST 5 Workshop on Measurement of Blast Fragmentation, pp. 193-201. FRANKLIN, J. A., AND SENIOR, S. A., 1987a. Outline of RHRON, the Ontario rockfall hazard rating
system: Proceedings International Symposium on Engineering Geology and The Environment, Athens, Greece, pp. 647-656.
FRANKLIN, J. A., AND SENIOR, S. A., 1987b. Rockfall Hazards – Strategies for detection,
assessment, and remediation: Proceedings International Symposium on Engineering Geology and The Environment, Athens, Greece, pp. 657-663.
HART, R., CUNDALL, P.A., and LEMOS, J., 1988. Formulation of a three-dimensional distinct element
model – part II. Mechanical calculations for motion and interaction of a system composed of many polyhedral blocks, International Journal of Rock Mechanics, Mining Science & Geomechanics Abstracts, Vol. 25, No. 3, pp. 117-125.
HCITASCA, 2006. PFC3D – Particle Flow Code in 3 Dimensions, User’s Manual. HOEK, E., AND BRAY, J., 1981. Rock Slope Engineering. The Institution of Mining and Metallurgy,
358 pp. HUISMAN, M, HACK, H., AND NIEUWENHUIS, J., 2004. Observed rock mass degradation and
resulting slope instability. EURROCK 2004, 4 pp. KLICHE, C., 1999. Rock Slope Stability. Society for Mining, Metallurgy, and Exploration, 253 pp.

13
KONYA, C.J., AND WALTER, E.J., 1991. Rock Blasting and Overbreak Control: FHWA Report – FHWA-HI-92-001.
KRAUTBLATTER, M. AND DIKAU, R., 2007. Towards a uniform concept for the comparison and
extrapolation of rockwall retreat and rockfall supply. Geograph. Ann, 89A, pp. 21-40. KUHNEL, R., 2002. Driving forces of rock degradation. Protection and Conservation of the Cultural
Heritage of the Mediterranean cities, pp. 11-17. KEMENY., J., 2005. Time-dependent drift degradation due to the progressive failure of rock bridges
along discontinuities. International Journal of Rock Mechanics and Mining Sciences, Vol. 42, No. 1, pp 35-46.
KEMENY., J., and KIM, C., 2009. Increasing our understanding of time-dependent rock mass behavior
with ground-based LIDAR, 3D discontinuum modeling, and fracture mechanics, Rock Mechanics: Proceedings of the Second Thailand Symposium, Fuenkajorn & Phien-wej (eds), Thailand, pp 35-53.
LIM, M., PETLEY, D. N., ROSSER, N. J., ALLISON, R. J., AND LONG, A. J., 2005. Digital
photogrammetry and time-of-flight laser scanning as an integrated approach to monitoring cliff evolution. The Photogrammetric Record 20, pp. 109-129.
LEE, J, 2007. Time-dependent crack growth in brittle rocks and field applications to geologic hazards.
Ph. D. Thesis, University of Arizona., 271 pp. MAERZ, N. H., 2000. Highway rock cut stability assessment in rock masses not conducive to stability
calculations. Proceedings of the 51st Annual Highway Geology Symposium, Aug. 29-Sept. 1, Seattle, Washington, pp. 249-259.
MAERZ, N. H., YOUSSEF, A., AND XIANG, Q., 2003. Digital imaging for screening and making
measurements of features on highway rock cuts. Transportation Research Board, 82nd Annual Meeting, Washington, D.C., Jan. 12-16, 2003, 20 pp.
MAERZ, N. H., YOUSSEF, A., AND LAUER, R., 2004. MORFH RS: A rockcut rating system for
Missouri highways. 55th Highway Geology Symposium, Kansas City, Missouri, Sep. 7-10, 2004, pp 406-424.
MAERZ, N. H., YOUSSEF, A., AND FENNESSEY, T. W., 2005. New risk-consequence rock fall
hazard rating system for Missouri highways using digital image analysis. Environment and Engineering Geoscience, v. xi, no. 3, pp. 229-250.
MIKHAIL, E. M., BETHEL, J. S., AND MCGLONE, J. C. 2001. "Introduction to Modern
Photogrammetry." John Wiley & Sons, Inc., New York, NY, pp. 373-376. (479 pp.). NICHOLSON, D., 2003. Breakdown mechanisms and morphology for man-made rockslopes in North
West England. North West Geography, v. 3. no. 1, pp. 12-26. OPPIKFER, T., JABOYEDOFF, M., BLIKRA, L. H., AND DERRON, M., 2008. Characterization and
monitoring of the Alnes rockslide using terrestrial lase scanning. Proc. Of the 4th Canadian Conference on Geohazards, quebec, Canada, pp. 211-218.

14
PIERSON, L. A., AND VAN VICKLE, R., 1993, Rockfall hazard rating system – Participants’ Manual: FHWA Report: – FHWA-SA-93-057, 102 p.
PITEAU, D. R., 1979a, Engineering geology considerations and basic approach to rock slope stability
analysis for highways. Part A., Rock Slope Engineering Reference Manual: FHWA Report – FHWA-TS-79-208, 78 pp.
PITEAU, D. R., 1979b, Methods of obtaining geological, structural, strength and related engineering
geology data. Part B, Rock Slope Engineering Reference Manual: FHWA Report – FHWA-TS-79-208.,147 pp.
PITEAU, D. R., 1979c, Approach and techniques in geological structural analysis. Part C, Rock Slope
Engineering Reference Manual: FHWA Report – FHWA-TS-79-208 PITEAU, D. R., 1979d, Slope stability analysis methods. Part D, Rock Slope Engineering Reference
Manual: FHWA Report – FHWA-TS-79-208. PITEAU, D. R., 1979e, Rock slope stabilization, protection and warning-instrumentation measures and
related construction considerations. Part E, Rock Slope Engineering Reference Manual: FHWA Report – FHWA-TS-79-208.
PITEAU, D. R., 1979f, Blasting for rock slopes and related excavation considerations. Part F, Rock slope
Engineering Reference Manual: FHWA Report – FHWA-TS-79-208. PITEAU, D. R., 1979g, Description of detail line engineering geology mapping method. Part G, Rock
slope Engineering Reference Manual: FHWA Report – FHWA-TS-79-208, 29 pp. PREH, A., POISEL, R., and KRASTANOV, G., 2001. Investigations of the failure mechanisms of hard,
competent rock lying on a soft, incompetent base by PFC2D, 1st International PFC Symposium. ROSSER, N. J., PETLEY, D. N., LIM, M., DUNNING, S. A., AND ALLISON, R. J., 2005. Terrestrial
laser scanning for monitoring the process of hard rock cliff erosion. Quarterly Journal of Engineering Geology and Hydrogeology 38, pp. 363-375.
SENIOR, S., 1999. Rockfall hazard remediation along Ontario highways. 50th Highway Geology
Symposium, Roanoke, Virginia, May. 20-23, 1999, pp. 276-286. SHIMIZU, Y., 2004. Fluid coupling in PFC2D and PFC3D, in: Numerical Modeling in Micromechanics
via Particle Method, eds. Shimizu, Hart and Cundall, 281-287. SINGH, B., AND GOEL, R. K., 1999. Rock mass classification: A practical approach in Civil
Engineering. Elsevier, Amsterdam, 267 pp. WALKINSHAW, J., and SANTI, P., 1996. Shales and other degrable materials. Landslides Investigation
and Mitigation, TRB special report 247, pp. 555-576. YOUSSEF, A., MAERZ, N. H., AND, FRITZ, M. A., 2003. A risk-consequence rockfall hazard rating
system for Missouri highways. 54th Highway Geology Symposium, Burlington, Vermont, Sep. 24-26, 2003, pp 175-195.

15
YOUSSEF, A., MAERZ, N. H., AND QINFANG, X., 2007. Rocksee: Video image measurements of physical features to aid in highway rock cut characterization. Computers & Geosciences, v. 33, no. 3, pp 437-444.
® Ubuntu is a registered trademark of Canonical Ltd. ® OpenGL is a registered trademark of Silicon Graphics International. ® PFC and PFC3D are registered trademarks of Itasca Inc.