Development of a Procedure to Measure the Effectiveness of Electret … · 2011-05-04 · iii...
108
Development of a Procedure to Measure the Effectiveness of Electret N-95 Respirator Filter Media for Capturing Nano-Particles Reza Mostofi Darbani A Thesis in The Department of Building, Civil and Environmental Engineering Presented in Partial Fulfillment of the Requirements for the Degree of Master of Applied Science (Civil Engineering) at Concordia University Montreal, Quebec, Canada December 2010 © Reza Mostofi Darbani 2010
Transcript of Development of a Procedure to Measure the Effectiveness of Electret … · 2011-05-04 · iii...

Development of a Procedure to Measure the Effectiveness of Electret
N-95 Respirator Filter Media for Capturing Nano-Particles
Reza Mostofi Darbani
A Thesis
in
The Department
of
Building, Civil and Environmental Engineering
Presented in Partial Fulfillment of the Requirements
for the Degree of Master of Applied Science (Civil Engineering) at
Concordia University
Montreal, Quebec, Canada
December 2010
© Reza Mostofi Darbani 2010

CONCORDIA UNIVERSITY School of Graduate Studies
This is to certify that the thesis prepared
By: Reza Mostofi Darbani
Entitled: Development of a Procedure to Measure the Effectiveness of Electret N-95 Respirator Filter Media for Capturing Nano-Particles
and submitted in partial fulfillment of the requirements for the degree of
Master of Applied Science (Civil Engineering)
complies with the regulations of the University and meets the accepted standards with respect to originality and quality.
Signed by the final examining committee:
Dr. S. Li Chair
Dr. M. Nokken Examiner
Dr. R. Sedaghati Examiner
Dr. F. Haghighat Supervisor
Approved by Dr. K. Ha-Huy
Chair of Department or Graduate Program Director
Dr. R. Drew
Dean of Faculty
Date Jan 13, 2011

iii
ABSTRACT
Development of a Procedure to Measure the Effectiveness of Electret N-95
Respirator Filter Media for Capturing Nano-Particles
Reza Mostofi Darbani
The phenomenal growth of the nano-technological products and their impacts on our
society led government organizations and scientists to consider the risks related to human
exposure to nano-particles (NPs). As a precautionary approach, respiratory protection is
suggested for workers to reduce their exposure to NPs. Thus, it is important to
characterize the performance of these respirators to capture NPs.
In this study, the performance of one model of N95 respirators was characterized against
poly and mono-disperse NPs. With poly-disperse NPs, a methodology was developed to
measure the performance of the N95 respirators against NaCl aerosols in the size range of
15 to 200 nm in three scenarios. The N95 respirator performance was also characterized
at 85 liters/min against twelve mono-size aerosols with size ranging from 20 to 200 nm.
Using poly-disperse aerosols test (PAT) method; the results demonstrated that the initial
penetration was significantly enhanced with the increased airflows and a shift toward
small particle size was observed for the most penetrating particle size (MPPS). For
particles below 100 nm, the penetration decreased with further loading. The MPPS was
also found to shift toward the large sized particles. In addition, the penetration augmented
slightly as the (RH) increased.

iv
Using mono-disperse aerosol test (MAT) method; the results revealed the initial particle
penetration is less than 5% NIOSH certification criterion. However, it was found that the
initial value, measured with (MAT) method, is not related with the initial penetration
measured with (PAT) method at each corresponding particle size at 85 liters/min.

v
ACKNOWLEDMENTS
First of all, I wish to express my deepest acknowledgments to my supervisors Dr.
Fariborz Haghighat and Dr. Ali Bahloul for all support, research guidance, inspiration
and patience over the last two years of my study. Great appreciation is also due to Dr.
Jaime Lara; without his continuous support and help, I could not accomplish this research
project during my experiments at the IRSST.
I would like to thank other members of this research project; Dr. Bei Wang, Yves
Cloutier Roberge Brigitte and Dr. Claude Ostiguy. Much appreciation also goes to
technicians Bernard Caron and Pierre Drouinas; for all their technical help to build and
develop the set-up.
Many thanks to the Institut de Recherche Robert-Sauvé en Santé et en Sécurité du Travail
and Nano-Quebec for supporting this project.
I am also very grateful to all my colleagues at the Concordia University sharing their
knowledge and experience while providing me such a friendly environment, so
remarkable and worthy.
Finally, I wish to express my deepest appreciation to my dear wife, Mahtab, for her
unconditional love, support and perseverance. Special thanks are due to my family, as
well, for being always the source of strength, devotion and encouragement.

vi
TABLE OF CONTENTS
LIST OF FIGURES ........................................................................................................... x
LIST OF TABLES ........................................................................................................... xii
LIST OF ABBREVIATIONS ......................................................................................... xiii
LIST OF SYMBOLS ......................................................................................................... xv
1 Chapter 1: INTRODUCTION ................................................................................. 1
1.1. Background .............................................................................................................. 1
1.2. Research Objective ................................................................................................... 5
1.3. Thesis Outline........................................................................................................... 6
2 Chapter 2: LITERATURE REVIEW ...................................................................... 7
2.1. Introduction .............................................................................................................. 7
2.1.1. Particle Filtration Mechanisms ...................................................................... 8
2.2. Personal Protective Equipment .............................................................................. 12
2.3. Factors Affecting Particle Filtration ..................................................................... 15
2.3.1. Face Velocity and Airflow Rate .................................................................... 15
2.3.2. Thermal Rebound Effect ............................................................................... 17

vii
2.3.3. Relative Humidity ......................................................................................... 20
2.3.4. Particle Loading ........................................................................................... 21
2.3.5. Particle Charge State ................................................................................... 22
2.4. Standards for the Filter Performance Evaluation and the Limitations ................. 24
3 Chapter 3: EXPERIMENTAL METHOD AND SYSTEM CALIBRATION ..... 27
3.1. Introduction ............................................................................................................ 27
3.2. Overview of Experimental Set-up ........................................................................... 28
3.2.1. Filtration Test against Mono-Disperse Aerosols ......................................... 28
3.2.2. Filtration Test against Poly-Disperse Aerosols ........................................... 29
3.3. Test Procedure ....................................................................................................... 30
3.4. Filtration Efficiency Measurement ........................................................................ 37
3.5. Set-up Characterization (Calibration) ................................................................... 38
3.5.1. No Filter Test (Correlation Test) ................................................................. 38
3.5.2. Particle Dispersal Uniformity Test at Upstream .......................................... 42
3.5.3. Particle Size Distribution at Upstream ........................................................ 46
3.5.4. Stabilization Test .......................................................................................... 49

viii
4 Chapter 4: RESULTS AND DISCUSSION ......................................................... 51
4.1. Introduction ............................................................................................................ 51
4.2. PHASE 1: Particle Penetration against NaCl Poly-Disperse Particles in the Range
15 to 200 nm (PAT Method) .......................................................................................... 52
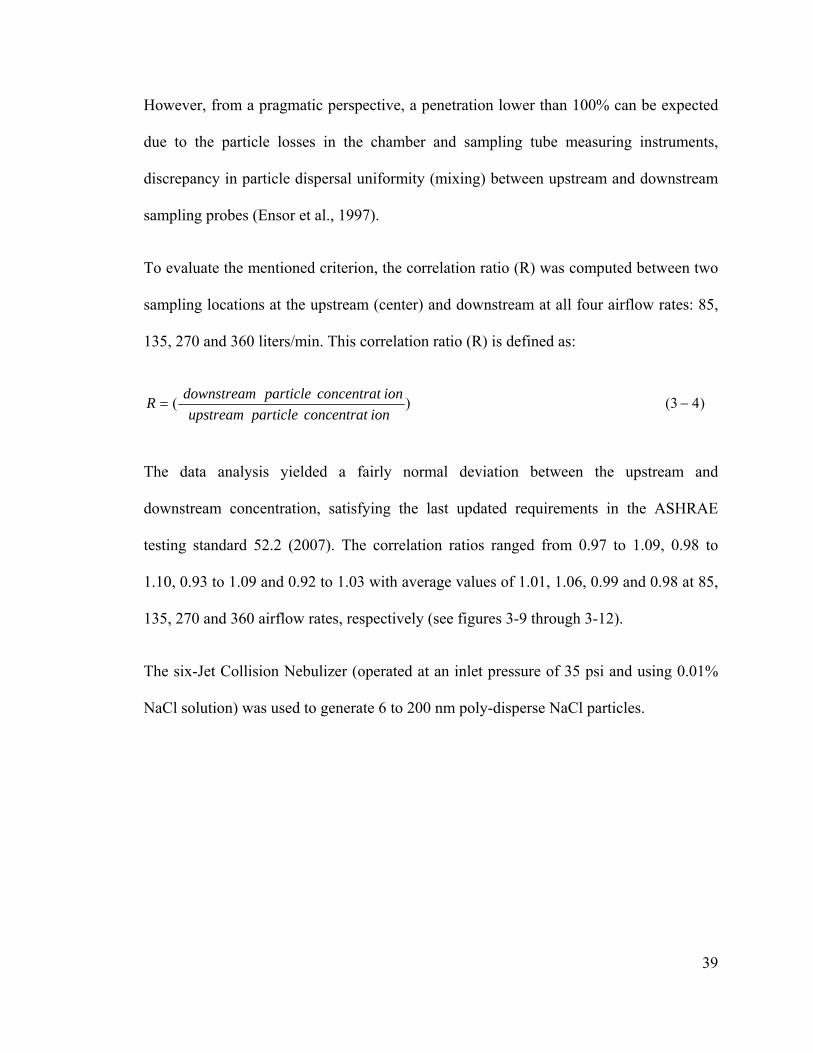
4.2.1. Initial Particle Penetration as a Function of Inhalation Flow Rate ............ 52
4.2.2. Particle Penetration as a Function of Loading Time ................................... 58
4.2.3. Particle Penetration as a Function of Relative Humidity (RH) ................... 63
4.3. PHASE 2: Particle Penetration against NaCl Mono- Disperse Particles in the
Range 20 to 200 nm (MAT Method) .............................................................................. 67
4.3.1. Correlation of Mono-Disperse and Poly-Disperse Particle Penetration ..... 67
5 Chapter 5: CONCLUSIONS AND FUTURE WORK .......................................... 70
5.1. Conclusions ............................................................................................................ 70
5.2. Recommendations and Future Work ...................................................................... 72
REFRENCES ................................................................................................................... 74
APPENDIX A: AEROSOL GENERATION SYETEM .................................................. 80
APPENDIX B: NANO-PARTICLE MEASURING INSTRUMENT ............................ 82
APPENDIX C: PARTICLE NEUTRALIZER ................................................................ 87

ix
APPENDIX D: PARTICLE SIZE DISTRIBUTION AT UPSTREAM ........................ 89

x
LIST OF FIGURES
Figure 1-1: Particle source versus particle size. Adapted from Crooks, 2007. ................... 1
Figure 2-1: Four primary particle collection mechanisms of particle capture. Adapted from DHHS, 2003. ............................................................................................................ 10
Figure 2-2: Fractional collection efficiency versus particle diameter for a mechanical filter. Adapted from Lee et al., 1980. ................................................................................ 11
Figure 2-3: The image of various fibrous filter media by scanning electron microscope. Adapted from Pui et al., 2006). ......................................................................................... 13
Figure 3-1: Schematic diagram of experimental set-up: testing filters against mono-disperse aerosols. Manikin adapted from Balazy et al., 2006a. ........................................ 29
Figure 3-2: Schematic diagram of experimental set-up: testing filters against poly-disperse aerosols. Manikin adapted from Balazy et al., 2006a. ........................................ 30
Figure 3-3: Schematic of the test system used to challenge N95 respirators against poly-disperse aerosols. .............................................................................................................. 31
Figure 3-4: Photograph of the tested N95 respirator. ....................................................... 32
Figure 3-5: Photograph of the N95 respirator sealed on the manikin. .............................. 32
Figure 3-6: Photograph of the filtered air supply (Model 3074, TSI Inc.) connected with six-Jet Collision Nebulizer. ............................................................................................... 33
Figure 3-7: The particle concentration and size distribution of the challenge NaCl aerosol at different testing airflow rates (operating Nebulizer at 25 psi inlet pressure, using 0.1% NaCl solution). .................................................................................................................. 34
Figure 3-8: The silica gel drying system. .......................................................................... 36
Figure 3-9: Penetration without the test filter at 85 liters/min airflow rate. ..................... 40
Figure 3-10: Penetration without the test filter at 135 liters/min airflow rate. ................. 40
Figure 3-11: Penetration without the test filter at 270 liters/min airflow rate. ................. 41
Figure 3-12: Penetration without the test filter at 360 liters/min airflow rate. ................. 41
Figure 3-13: Top view of the sampling locations at upstream. ......................................... 42

xi
Figure 3-14: Particle size distribution at five different upstream sampling locations under 85 liters/min airflow rate. .................................................................................................. 44
Figure 3-15: Particle size distribution at five different upstream sampling locations under 135 liters/min airflow rate. ................................................................................................ 44
Figure 3-16: Particle size distribution at five different e upstream sampling locations under 270 liters/min airflow rate. ...................................................................................... 45
Figure 3-17: Particle size distribution at five different upstream sampling locations under 360 liters/min airflow rate. ................................................................................................ 45
Figure 3-18: Particle concentration as a function of particle size at different pressures (85 liters/min and 0.01% NaCl solution). ............................................................................... 47
Figure 3-19: Particle concentration as a function of particle size at different pressures (85 liters/min and 0.1% NaCl solution). ................................................................................. 48
Figure 3-20: Particle concentration as a function of particle size at different pressures (85 liters/min and 1% NaCl solution). .................................................................................... 48
Figure 3-21: Challenge aerosol concentration during system startup at different airflow rates, using 0.01% NaCl.................................................................................................... 49
Figure 4-1: Effect of particle size and inhalation flow rate on initial particle penetration through N95 respirators (n=3). The error bars represent the standard deviations. ........... 52
Figure 4-2: Effect of particle size and inhalation flow rate on filter quality factor of N95 respirators (n=3). The error bars represent the standard deviations. ................................. 53
Figure 4-3: Effect of particle loading on particle penetration through N95 respirators at 85 liter/min constant airflow rate (n=3). ........................................................................... 58
Figure 4-4: Effect of particle size and particle loading on filter quality factor of N95 respirator at 85 liters/min constant airflow (n=3). ............................................................ 59
Figure 4-5: Effect of relative humidity on initial particle penetration through N95 respirators at 85 liters/min constant airflow rate (n=4). The error bars represent the standard deviation at each point. ....................................................................................... 63
Figure 4-6: The comparison of mono-disperse and poly-disperse particle penetration levels (n=4). The error bars represent the standard deviation at each point. .................... 67
Figure 4-7: The particle number concentration at each tested mono-sized particle (n=4). The error bars represent the standard deviation at each point. ......................................... 68

xii
LIST OF TABLES
Table 1-1: Number concentration and surface area of particle versus particle diameter. Adapted from Oberdorster, 2005. ....................................................................................... 2
Table 3-1: Summary of coefficient variation for the aerosol uniformity. ......................... 43
Table 3-2: Summary of stabilization test. ......................................................................... 50
Table 4-1: Summary of particle penetration, pressure drop, quality factor and coefficient of variation for the particle penetration. ........................................................................... 56
Table 4-2: Summary of particle penetration, pressure drop and quality factor in the early (A) and late (B) stages of particle loading. ....................................................................... 62
Table 4-3: Summary of particle penetration for the respirator's performance. ................. 66

xiii
LIST OF ABBREVIATIONS
Abbreviation Description
ASHRAE American Society of Heating, Refrigerating, and Air-Conditioning Engineers
CFR Code of Federal Regulations
CMD Count Median Diameter
CV Coefficient of Variation
DEHS Di Ethyl Hexyl Sebacate
DHHS Department of Health and Human Services
DMA Differential Mobility Analyzer
DOP Dioctyl Phthalate
DOS Dicotyl Sebacate
GSD Geometric Standard Deviation
HVAC Heating, Ventilating and Air-Conditioning
HEPA High-Efficiency Particulate Air
K Kelvin
MAT Mono-Disperse Aerosol Test
LPM Liters Per Minute
MPPS Most Penetrating Particle Size
NaCl Sodium Chloride
NAFA National Air Filtration Association

xiv
NIOSH National Institute for Occupational Safety and Health
NP Nano-Particle
PAT Poly-Disperse Aerosol Test
RH Relative Humidity
SCENIHR Scientific Committee on Emerging and Newly Identified Health Risks
SMPS Scanning Mobility Particle Sizer
UCPC Ultra Fine Condensation Particle Counter
UFP Ultra Fine Particle
V DMA Voltage
Kr Krypton

xv
LIST OF SYMBOLS
English Symbols Description
Cdown Downstream Concentration
Cup Upstream Concentration
Dp Particle Size Diameter
KB Boltzmann Constant
M Molecular Weight
P Particle Penetration
Q Airflow Rate
qf Quality Factor
R Correlation Ratio
T Absolute Temperature
Z Electrical Mobility
Greek Symbols Description
α Packing Density
η Total Collection Efficiency
Δp Pressure Drop

1
T
si
so
ac
en
gr
th
.1. Backgr
The term nan
ize, in at lea
ources; thes
ctivities (see
nvironment
rinding and
hese new sou
Figure
1
round
no-particles (
ast in one ax
e can be as
e figure 1-1
known as
polishing (R
urces of engi
e 1-1: Particl
Chapte
(NPs) basica
xis. NPs can
ssociated wi
). There is
the enginee
Rengasamy,
ineered NPs
le source ver
er 1: INT
ally refers to
n be introdu
ith either na
also a new
ered NPs w
, 2008a). Ho
contribute t
rsus particle
TRODUC
o that range
uced into the
atural pheno
source of n
which compr
owever, it is
to the total e
size. Adapte
CTION
of particles
e environme
omenon, hum
nano-particle
rises laser a
s not yet cle
missions.
ed from Cro
below 100 n
nt from diff
man or dom
e emission t
ablation, mi
ear to what
oks, 2007.
1
nm in
ferent
mestic
o the
lling,
level

2
In spite of very low mass concentration, the number of NPs in the environment can be
very high. Thus, the human exposure to NPs could be significantly more dangerous to
human health than the larger particles. Scientific Committee on Emerging and Newly
Identified Health Risks (SCENIHR) (2006) indicated that there could be roughly 10,000
to 20,000 NPs in the air of a normal room and 50,000 and 100,000 NPs per cubic cm in
the wood and urban street, respectively. Oberdorster (2005) has also reported the
relationship between the particle number concentration, the surface area of particles and
the particle’s diameter with the same airborne mass concentration of 10 µg/cm3 (see table
1-1). As noticed in table 1-1, with the same mass concentration, as the particle size
diameter reduces, number of particles would greatly increase along with the exponential
growth in particle surface area.
Table 1-1: Number concentration and surface area of particle versus particle diameter.
Adapted from Oberdorster, 2005.
Airborne mass
concentration
Particle size Particle number
concentration
Particle surface area
(µg/cm3) (nm) (particles/cm3) (µm2/cm3)
10 5 153,000,000 12,000
10 20 2,400,000 3,016
10 250 1,200 240
10 5,000 0,15 12

3
Over the past decade, remarkable research has been done to improve the quality and
functionalities of products by modifying the characteristics of their material structure at
the nano-level. This technology, termed nano-technology, has been applied to the
manufacturing of a wide variety of products.
It is believed that workers could be more exposed to NPs during the manufacturing of
different products and this could have potential impact to worker’s health. According to
the Bureau of Labor Statistics and National Institute for Occupational Safety and Health
(NIOSH), in 2000 in the U. S., approximately 2 million people worked with nano-
material products (NIOSH, 2003). Epidemiological assessments on the ultrafine particles
(UFPs), of the same size range as micro-particles, have clearly shown acute and chronic
effects related to the exposure to UFPs. Acute toxicity studies on the effects of NPs on
animals have also shown acute effects on different organs; however, chronic studies are
still very limited and more investigation is vital (Ostiguy et al., 2008).
Findings from the previously mentioned limited toxicological studies demonstrated that
for the same mass, under similar conditions, a specific chemical is normally more toxic at
the nanometric size range than that at the micrometric size range (Oberdorster, 2000;
Donaldson et al., 2001). The toxicity of the NPs was found to escalate remarkably with
the increase of the particles’ surface area and number concentration (McCullough et al.,
1997; Tran et al., 2000). This high surface area results in the higher surface reactivity of
NPs which influences their potential toxicity in the presence of more molecules on the
surface (Tran et al., 2000; Warheit et al., 2007a; Warheit at al., 2007b).

4
In general, workers are exposed to NPs through a wide variety of routes in the work
environments. These include inhalation, skin absorption, eye contact and ingestion.
Inhalation is considered as the most common route which NPs reach the various parts of
the living organism. Thus, in order to provide a satisfactory level of safety and health,
respiratory protection is suggested for workers against the NPs. When compared with
larger particles, a greater portion of inhaled NPs can penetrate into the lung where they
are deposited and then translocated to other parts of the body and deposit, such as the
brain, blood system, heart, and other organs (Nemmar et al., 2001; Oberdorster et al.,
2002; Claude Ostiguy et al., 2008). A portion of these inhaled NPs are translocated to the
brain via olfactory and trigeminus nerve, as observed on rats and mice (Oberdorster et al.,
2004; Oberdorster et al., 2005). Moreover, they can be transported to the blood system by
passing through the pulmonary protection barriers (Takenaka et al., 2001; Nemmar et al.,
2002; Oberdorster et al., 2002). In this regard, the toxicity studies in rats and mice have
shown that the exposure to NPs causes pulmonary disease, cardiovascular problems and
immune system impairments (Dockery et al., 1994; Hagdnagy et al., 1998; Huang et al.,
2007).
Wide ranges of engineering control systems have been proposed to reduce or eliminate
the exposure to NPs. These systems include enclosures, local exhaust systems, fume
hoods, and general ventilation systems.
If engineering controls are insufficient to ensure workers’ safety and health, respiratory
protection and personal protective equipment using filtration could be used to remove the
NPs. The question now is “how effective are these filters to protect workers against

5
NPs?” The effectiveness of respiratory filters is generally characterized by an airflow rate
of 85 liters/min or less. However, few studies have been done on the effectiveness of
respiratory protections against NPs at high airflow rates (in the case of respiratory peaks
with airflow rates ranging from 300 to 400 liters/min at heavy workloads). The result of
earlier (limited) work showed that high airflow rates lead to increase the particle
penetration through respirators (Richardson 2006). The effect of other parameters, such
as the particle size, humidity and the time of use on the performance of the filter
respirators remains also unknown. Therefore, with the exponential growth in the
manufacturing sector of nano-products, it is essential to develop a method for measuring
the effectiveness of respiratory protections and comparing their performances. To our
knowledge, there exists no current standard to quantify or classify the performance of
these filters against NPs.
1.2. Research Objective
The objectives of this study are:
• To develop a methodology to characterize the effectiveness of one model of
NIOSH-approved N95 respirator against poly-disperse aerosols in size range from
15 to 200 nm in different scenarios:
1. Investigating the effect of airflow condition and particle size on the
initial particle penetration through the respirator and
2. Investigating the effect of two other parameters, such the time of use
and the relative humidity on filtration performance.

6
• To develop and adapt the experimental set-up to challenge the same type of
respirator against mono-disperse particles with a size range between 20 to 200
nm.
1.3. Thesis Outline
Chapter 2 explains the fundamentals of nano-particle filtration and provides critical
reviews on the filtration performance of respirators and mechanical filters against NPs.
The testing protocol for respirator certification is also presented. Chapter 3 describes and
compares two different experimental set-ups for challenging filtering face-piece
respirators with NPs. The required procedures to test respirators against mono-disperse
and poly-disperse aerosols are discussed in the chapter. Thereafter, the results of
calibration and pre-qualification tests will be presented. Chapter 4 illustrates and
discusses the experimental results implemented to assess the filtration performance of
respirators in different scenarios. Finally, chapter 5 outlines the conclusions and
recommendations for future direction.

7
2 Chapter 2: LITERATURE REVIEW
2.1. Introduction
Aerosol filtration is one of the most common methods applied for air cleaning and
sampling. This method, using fiber filters, is now applied in a wide variety of
applications, such as respiratory protection, air cleaning of smelter effluents, processing
of nuclear and hazardous materials and clean rooms (Hinds, 1999).
The fiber filters are very efficient and low pressure drop devices for the collection of
particles within the small size, due to their loosely packed fibers with the good
orientation across the gas flow direction. There are various key factors which affect the
efficiency of the fiber filters in capturing particles such as particle characteristics (its
physical state, chemical composition, diameter, density and charge distribution), filter
characteristics (substrate, fiber diameter, thickness of the filter, packing density of fiber
and electrical property), collection mechanisms, operational conditions (temperature,
viscosity and filtration face velocity) (Davies, 1973; Dullien, 1989) and thermal rebound
due to Brownian motion.
Particle removal is mainly performed by two major mechanisms; mechanical and
electrostatic mechanisms. The mechanical mechanism is associated with inertia,
gravitational, interception and diffusion caused due to the effect of Brownian motion.
However, compared with the other mechanical mechanisms, the inertia and gravitational
mechanisms are normally ignored and not significantly considered in calculations for

8
capturing small particles; these two mechanisms are more dominant to capture the large
size particles (basically above 0.5µm). Meanwhile, the effect of Brownian motion
becomes more important for particle collection within very small nano size range,
particularly below 10 nm (Brown, 1993; Hinds, 1999). On the other side, the electrostatic
attraction force is the other collection mechanism; mainly due to Coulombic, image and
dielectrophoretic forces between the fiber filters and particles (Davies, 1973). The
parameters which can affect the filtration performance with the help of the electrostatic
attraction are the amount of charge on the particles, surface charge density of fibers and
the electric field applied externally (Wang, 2001).
Recent investigations show that, with the aid of both mechanical and electrostatic
mechanisms, the filtration efficiency would significantly improve in particle collection
(Balazy et al. 2006a; Huang et al., 2007; Eninger et al., 2008). The electret filters (use the
electrostatic forces for particle removal) were firstly developed by Nicolaig Louis Hansen
for particle removal (Davies, 1973). Hansen found the electret filters are more effective
than the mechanical filters in capturing particles. Rather than increase the filtration
performance, the electret filter media offers lower airflow resistance than the mechanical
filters, due to its low packing density.
2.1.1. Particle Filtration Mechanisms
Previous research suggested that filtration efficiency can be affected by several
parameters such as particle characteristics (e.g., its chemical composition, diameter and
density), filtration face velocity (based on airflow rate and filter‘s surface area), the filter
characteristics (e.g., fiber diameter, thickness, fiber packing density and porosity),

9
filtration mechanisms and operational conditions (temperature, relative humidity and
viscosity) (Davies, 1973; Dullien, 1989).
As discussed earlier, particle removal is performed by four main collection mechanisms:
(1) inertia impaction, (2) interception, (3) diffusion and (4) electrostatic attraction, as
illustrated in figure 2-1 (Hinds, 1999). The first three collection mechanisms refer
generally to mechanical filters and are influenced by particle size.
• “Inertia impaction occurs when the particle near a filter fiber changes in
streamline direction and collides with the fiber” (DHHS, 2003). This collection
mechanism becomes more important for capturing the large particles and
increases at the higher face velocities.
• “Interception occurs when a particle follows a certain gas streamline and comes
within one particle radius of a filter fiber” (DHHS, 2003). Soon after, the particle
touches the fiber; it will be removed from the gas flow.
• “Diffusion occurs when the random motion of the particle due to Brownian
motion causes the particle to touch the fiber filter” (DHHS, 2003). The diffusion
is dependent on the face velocity and the particle size as well. At lower face
velocities, the diffusion becomes more dominant, because the particle has more
time for zigzag motion, thus the more chance to collide and being captured by the
fiber filters. Moreover, the small size particles have more chance to be captured
by this mechanism, since they behave like the gas molecules causing more
random motion.

10
• The electrostatic mechanism which plays a significant role in electret filters is due
to electrostatic attraction between the particles and the fiber filters; mainly as a
result of the Coulombic, image and dielectrophoretic attraction forces.
Figure 2-1: Four primary particle collection mechanisms of particle capture. Adapted
from DHHS, 2003.
However, for nano-sized particles, the inertia mechanism does not significantly
contribute to the capturing mechanisms and are thus not considered in calculations as
they are more predominant on the collection of the larger size particles. Also note that the
effect of Brownian motion is more significant as the particles become smaller,
particularly for the particles within the nano size ranges (Brown, 1993; Hinds, 1999).
Figure 2-2 illustrates the combined effect of the first three mechanisms (inertia
impaction, interception and diffusion) on the particle collection as a function of the
particle diameter. In general, diffusion is considered as the predominant collection

11
mechanism for particles less than 200 nm, while the interception and inertia impaction
are dominant for the particles larger than 200 nm.
Figure 2-2: Fractional collection efficiency versus particle diameter for a mechanical
filter. Adapted from Lee et al., 1980.
Figure 2-2 also demonstrates that for particles below 100 nm filtration efficiency will
enhance as the particles become smaller. This is due mainly to the fact that diffusion
mechanism is dominated in this region. For particles with diameter between 100 to 400
nm, both diffusion and interception contribute to the removal of particles by filters.
However, in this region, the filtration efficiency is markedly reduced, as the particles are
not small enough to be captured by the diffusion effect and not too large to be captured
by impaction mechanism. This region is generally considered the worst-case situation;
this size range experiences the greatest penetration through the filter. And finally, for

12
particles larger than 400 nm, the filter performance will increase again as both the
interception and inertia impaction effects significantly contribute to the collection of
particles (Lee et al., 1980).
However, it should be mentioned that in the classic collection efficiency curve, for the
elecret respirator filters, the minimum filtration efficiency, for the most penetrating
particle size (MPPS), can be shifted toward small particle sizes lower than 100 nm (Han,
2000; Martin and Moyer, 2000; Huang et al., 2007; Rengasamy et al., 2007; Eninger et
al., 2008).
2.2. Personal Protective Equipment
The fibrous filters produce low-pressure drop and remove particles randomly laid
perpendicular to the airflow (see figure 2-3). Fibers are commonly made of cotton,
ceramic, fiberglass, polyester, polypropylene, polycarbonate or numerous other materials
which can be synthesized in both charged and uncharged filters (Davies, 1973).
Basically, in terms of filtration mechanism, two types of fibrous filter media including:
(1) mechanical filters and (2) electrostatic filters (electret filters) can be used in aerosol
filtration. In mechanical filters, inertia impaction, interception and diffusion mechanisms
contribute to the particle collection, while, in electret filters, the electrostatic attraction is
additionally applied to enhance the collection efficiency. In addition to higher collection

13
efficiency, in electret filters, with the aid of this extra mechanism, a lower pressure drop
across the filter occurs due to low packing density1.
Figure 2-3: The image of various fibrous filter media by scanning electron microscope.
Adapted from Pui et al., 2006).
Earlier studies also have indicated that the filtration mechanisms, mechanical and
electrostatic, can influence the performance of the fibrous filters in particle collection
within the nano-sized range. In mechanical filters both filtration efficiency and the air
resistance curve basically increase with respect to operating time. While in electret filters
1 The packing density is defined as the percentile ratio of fiber volume in the filter to total filter volume,
typically ranges from 1 to 30% (Davies, 1973).

14
this tendency moves in the inverse directions. During the filter loading, the electrostatic
effect between the particles and the filter is gradually diminished since more particles are
penetrated through the filter leading to less filtration performance. However, at a certain
point, the filtration performance cease to reduce and rise again, as the mechanical
mechanisms contribute much more to capture the particles: at this point, the deposited
particles on the filter medium surface behave as a very efficient layer to collect particles
by the mechanical mechanism forces.
Moreover, according to the literature, in contrast with mechanical filters, for electret
filters, the lowest filtration efficiency occurs at smaller particle sizes normally between
40-60 nm (Han, 2000; Martin and Moyer, 2000; Huang et al., 2007; Rengasamy et al.,
2007; Eninger et al., 2008). However, for mechanical (non-charged) filters, a particle
diameter of 300 nm is referenced as the Most Penetrating Particle Size (MPPS) at 85
liters/min. In this regard, the particle penetration through both mechanical and electret
filters were investigated for the particle size range from 4.5 nm to 10 µm by Huang et al.
(2007). They reported that the maximum penetration was reduced from 18.9 to 5.8% with
the co-operation of an electrostatic attraction force in particle collection. In addition, their
study demonstrated that the MPPS shifts toward the smaller size by using electret (pre-
treated) filters. The MPPS occurred at 50 nm for electret and 200 nm for mechanical
filters.
Balazy et al. (2006a) also measured the penetration of the MS2 viruses (a non harmful
stimulant of several pathogens) through filtering face-piece respirators. Their study was
carried out for particles ranging from 10 to 80 nm and at the airflow rates of 30 and 85

15
liters/min. They reported that the penetration through the electret N95 respirators can
exceed up to 5.6% in the MPPS at 85 liters/min, simulating an average inhalation rate for
heavy workload conditions. However, N95 respirators are expected to provide 95%
minimum filtration efficiency against non-biologic and biologic particles in the MPPS. It
was also acknowledged that the MPPS lies within the smaller particle size of
approximately 50 nm. While, the earlier results show that the MPPS diameter can be
highly variable due to the filter’s property, filtration mechanism, airflow rate, etc.
2.3. Factors Affecting Particle Filtration
2.3.1. Face Velocity and Airflow Rate
The face velocity / airflow rate can significantly affect the total filtration performance of
fibrous filters since they influence the contribution of diffusion, interception and
electrostatic mechanisms to the particle collection (Kousaka et al., 1990; Alonso et al.,
1997). At low face velocities, diffusion and electrostatic forces contribute significantly to
the capture efficiency due to a higher residence time. With an increasing face velocity,
the interception mechanism dominates while the diffusion effect contributes much less to
the filter’s collection performance. Thus, it is expected that the filtration efficiency for
small particles drops markedly at higher face velocities.
For the mechanical filters, particle penetration is presented as a function of the face
velocity. Steffens and Coury (2007) studied the effect of velocities varying from 3 to 25
cm/sec on the filtration efficiency, using homogeneous and heterogeneous fiber filters,
for the particle size between 8.5 to 94.8 nm in diameter. Their experimental results

16
implied that the filtration performance would reduce with increasing the filtration face
velocity. Boskovica et al. (2008) tested the filtration efficiency at various velocities
ranging from 5 to 20 cm/sec for different shapes of particles (sphere, semi rounded and
cubic). The results in all cases showed that at lower face velocities the filtration
efficiency of fibrous filters improved for all different shape of particles. Balazy et al.
(2004) investigated the filtration efficiency and pressure drop for face velocities between
10 and 30 cm/sec. Their experimental data demonstrated that increase in air filtration
velocity would lead to lower collection efficiency. This finding supports the dominance
of diffusion mechanism of particle removal in the nano-sized range. Kim et al. (2007)
also conducted the penetration test at three face velocities of 5.3, 10 and 15 cm/sec using
silver NPs from 3 to 20 nm. The results showed that a higher face velocity would
increase particle penetration due to the shorter residence time through the filters.
For respirator filters, particle penetration is determined as a function of the airflow rate
instead of that of the face velocity. Several studies have been conducted to investigate the
effectiveness of respirators in the removal of NPs under different airflow rates. Eninger et
al. (2008) evaluated the performance of one N95 and two models of N99 face-piece
respirators against three viruses and NaCl particles in the size range of 20 to 500 nm. The
test was carried out at airflow rates of 30, 85 and 150 liters/min. The highest NaCl
particle penetrations of 1.3, 5.9 and 10.2% for N99A respirator and 1, 4.3 and 6.6% for
N99B respirator were observed at airflow rates of 30, 85 and 150 liters/min, respectively.
For the N95 model, the highest NaCl penetrations were 1.4, 4.8 and 8.1% for airflow rate
of 30, 85 and 150 liters/min, respectively. For the viruses, an increase in the airflow rate

17
from 85 to 150 liters/min strongly affected the performance of all tested respirators
(N99A, N99B and N95). Balazy et al. (2006b) also measured the penetration through two
models of N95 respirators for NaCl particles within the 10 to 600 nm range at two airflow
rates of 30 and 85 liters/min. The airflow rate demonstrated a strong impact on particle
penetration through filtering face-piece respirators. Particle penetration through the both
N95 respirators would be exceeded 5% at airflow rate of 85 liters/min. Furthermore, the
performance of several N95 and P100 models against mono-disperse silver aerosols were
evaluated by Rengasamy et al. (2008a). The test was carried out for particles ranging
from 4 to 30 nm at airflow rate of 85 liters/min. Particle penetration decreased for all
tested respirators as the particle size decreased to 4 nm. For N95 filtering face-piece
respirators, particle penetration varied from 1.1 to 4.0%. Finally, for P100 respirators,
particle penetration less than 0.003 was observed with MPPS between 40 to 50 nm.
The majority of previous investigations suggested testing filtering face-piece respirators
at the rate of 85 liters/min, however, it has been recommended that respirators should be
tested at an airflow rate of 350 liters/min simulate human breathing at a heavy work load;
it is believed much higher breathing airflow rate may occur in the workplace (Janssen et
al. 2003; Balazy 2006b).
2.3.2. Thermal Rebound Effect
From the prediction of the theoretical models, particle collection efficiency should
increase as the size of the particle is reduced. However, some recent studies indicate that
the collection efficiency of nano-sized particles can be significantly reduced due to the
possibility of thermal rebound effect. It has been stated that with the reduction of the

18
particle size below a certain point, the mean thermal velocity due to Brownian motion
exceeds the capture velocity on particles, and consequently increases the likelihood of
particle detachment from the filter surface (Brown, 1993). On the other hand, particles of
decreasing sizes would have lower adhesion ability when they come in contact with filter
surfaces due to their behaviors: they behave more like molecules. Brown observed that as
nano-sized particles approach the dimension of molecular clusters and when they
undergo contact with a fiber surface they would not adhere to it (Hinds, 1999). However,
there is very limited information on the exact particle size from which such rebound
effect begins to occur.
Several researchers have examined the effect of thermal rebound on the particle
penetration through filters. Wang and Kasper (1991) confirmed the occurrence of the
thermal rebound phenomena in aerosol filtration of the particles smaller than 10 nm.
They showed that the thermal rebound velocity increases the capture velocity of particles
with size varying from 1 to 10 nm, causing the particle collection efficiency to drop for
particles smaller than 10 nm. Furthermore, in considering the effect of particle bouncing
due to the thermal rebound velocity, they developed a model to predict the filtration
efficiency of particle size in the thermal rebound regime. Otani et al. (1994) examined
particle penetration through a circular tube for silver particles below 2 nm. The results
showed a higher particle penetration through the tube at smaller particles. Similarly,
Balazy et al. (2004) investigated the particle penetration through the filters for liquid di-
ethyl-hexyl-sebacate (DEHS) particles below 20 nm. They concluded that the collection
efficiency of the particles was also dramatically reduced as the particle became smaller
than 20 nm. Ichitsubo et al. (1996) found that the collection efficiency of the particles

19
was lower than that predicted by the theoretical model for the particles with sizes below 2
nm: this could be likewise due to thermal rebound effect. Kim et al. (2006) studied the
filtration efficiency of two different types of glass fibrous filters on collection of NaCl
particles at room temperature. They pointed out that the thermal rebound effect occurred
at particles sizes below 2 nm and the electrostatic effect significantly enhanced in this
regime. However, Alonso et al. (1997) detected no particle rebound phenomenon in the
same size range as that investigated by Ichitsubo et al. (1996). They reported that the
disagreement between the theoretical and experimental studies was attributed to an
unreliable sizing of the particles below 3 nm with the currently available techniques.
Huang et al. (2007), measuring the penetration in the size range between 4.5 nm to 10 µm
NaCl aerosol particles through face-piece respirators, observed no thermal rebound
phenomena. Japuntich et al. (2007) measured the filtration efficiency of particles in the
size range of 10 to 400 nm and found no thermal rebound. Rengasamy et al. (2008a)
investigated the filtration performance of five models of NIOSH-approved N95 and two
models of P100 face-piece respirators against mono-disperse silver and NaCl NPs. They
reported that the penetration levels of silver particles decreased with particle diameter
down to 4 nm for all five N95 models and down to 12 nm for two P100 models, which
was consistent with the single-fiber filtration theory. They claimed that there was no
evidence for thermal rebound effect for particles in the size range of 4 to 30 nm.
Shin et al. (2008) detected no thermal rebound in the investigation of the filtration
efficiency of silver nano-particles between 3 to 20 nm at temperatures up to 500 K.
According to the study conducted by Wang and Kasper (1991), more particle detachment

20
from the fiber surface was expected as a result of exceeding the Brownian motion of NPs
at elevated temperatures compared to room temperatures would be observed. They
reported the possibility of thermal rebound at high temperatures for NaCl particles within
the 1 to 3 nm size range. However, no particle bouncing was reported even at elevated
temperatures. Shin et al. (2008) asserted that the inconsistency from two studies might be
attributed to the different behavior of silver particles at elevated temperature when
compared with behavior of NaCl particles. Wang and Kasper (1991) reported the
possibility of thermal rebound at high temperatures for NaCl particles with a 1 to 3 nm
diameter range.
2.3.3. Relative Humidity
Relative Humidity (RH) is one of the factors that may influence filtration performance.
The effect of humidity is not yet well understood due to a lack of investigations. Kim et
al. (2006) reported no significant effect of humidity on filtration efficiency for particles
smaller than 100 nm; showing almost the same filtration efficiency at different tested
(RH) of 0.04, 1.22 and 92%. Contrary to Kim et al.’s observation, Brown, (1993) and
Miguel, (2003) reported higher filtration efficiency for the fiber filters with an increase in
(RH) but for coarse particles. This phenomenon is attributed to particle adherence to the
fiber filter and collected particles due to increase in capillary force at higher (RH).
However, the attraction between particles and fiber filters due to capillary force is only
considerable for large size particles.
In contrast to earlier studies on mechanical filters, the studies for the electret filters
(charged filters) showed lower performance with increase of the (RH), due to the

21
reduction in the charges on the fiber filters and particles with an increase in (RH)
(Ackley, 1982; Moyer et al., 1989). Ikezaki et al., (1995) and Lowkis et al. (2001) also
confirmed that the potential of the electret filters to collect the particles decrease as the
surface charge was decreased with increase of the (RH). Yang and Lee (2005), however,
reported that (RH) had no effect on aerosol penetration through the electret (pre-treated)
filters. They implemented the filtration test at different (RH) of 30 and 70% for mono-
disperse generated NaCl particles size ranging from 50 to 100 nm.
2.3.4. Particle Loading
Particle loading is one of the other important aspects which influence the filtration
performance. The feedback effect of particle loading is less well understood. According
to the literature, the subsequent particle loading implies a significant impact on the
collection efficiency and also pressure drop evolution across a filter (Baumgartner et al.,
1986; Brown et al., 1988; Chen et al., 1993; Martin and Moyer, 2000; Wang et al., 2001).
With the absence of the electrostatic effect, the continuous particle loading generally
results in an increase in the particle collection efficiency and pressure drop, caused by the
particle accumulation on the fiber surface (Wang, 2001).
In contrast with results obtained for the mechanical filters, according to the previous
experimental studies on the electret filters, the particle penetration level mostly
propagates during the initial stage of filter loading (Baumgartner et al., 1986; Brown et
al., 1988; Chen et al., 1993; Martin and Moyer, 2000; Wang et al., 2001). However, the
pattern for particle collection efficiency may change by different fiber materials and
particle size. Chen et al. (1993) investigated the filtration performance of dust-mist

22
filtering face-pieces loaded continuously against corn oil aerosols with size diameter of
0.16 µm. They reported that the particle penetration initially increased with aerosol
loading due to reduction in electrostatic charge effect, whereas subsequently diminished
due to the increase in packing density of the fiber filter. Brown et al. (1988) reported that
the filter loading would significantly augment the penetration through the electret filters,
since the electrostatic charge effect on the filter fiber is screened by the deposited
aerosols. Their experiments were carried out for various industrial aerosols at different
particle size ranges.
Additionally, experimental studies on electret filters showed that the particle collection
efficiency relies generally on the manner in which the particles are collected; exposed
with solid or liquid particles (Martin and Moyer, 2000; Ji et al., 2003). Martin and Moyer
(2000) used solid NaCl and liquid DOP particles to test the filtration efficiency of N95
respirators. Their results indicated more particle penetration when the N95 respirator was
challenged with the liquid DOP aerosols; increased by about ten folds. In another study
conducted by Ji et al. (2003), the electret filters were loaded with poly-disperse solid
sodium chloride (NaCl) and liquid dicotyl sebacate (DOS) particles. In consistent with
the other study, much lower filtration performance occurred with testing filters against
liquid dicotyl sebacate (DOS).
2.3.5. Particle Charge State
Particle charge is another factor that significantly affects the particle filtration efficiency
of mechanical and electret filters (Fjeld and Owen, 1988; Chen et el. 1998). The increase
in filtration efficiency is associated with additional electrostatic attraction resulting from

23
coulombic and image force attraction (Brown, 1993). Kim et al. (2006) demonstrated the
difference in the collection efficiency through a glass fiber filter at different charge states
for particle ranging from 2 to 100 nm. They found that the filtration efficiency for
uncharged particles was much lower than that for charged particles, and this discrepancy
decreased with the reduction in particle size. They explained that this phenomenon was
due to the fact that diffusion is the most dominant deposition mechanism for nano-
particles and this process increases the effect of diffusion for smaller particles.
Penetration of neutralized and non-neutralized particle in the range of 10 to 600 nm
through electret and mechanical filters was also investigated by Balazy et al. (2006b). In
their study, higher filtration efficiency was observed when testing the penetration of
neutralized particles for electret filters. However, for the mechanical filters, they reported
no significant change between the neutralized and non-neutralized particles. Yang and
Lee, (2005) also measured the particle penetration with Boltzmann-equilibrium, neutral
(uncharged) and singly charged NaCl aerosols. Their results showed that the singly
charged aerosols would lead to higher filtration efficiency than neutralized aerosols: the
Coulombic force was dominant in the capture of small particles below 100 nm.
It is very difficult to draw a scientific conclusion from the prior studies investigated the
effect of various parameters on the filtration efficiency. These were carried out at various
conditions (temperature, airflow rate, RH, measurement techniques, etc.) and indicate
that there is a lack of understanding on the effectiveness of filtering face-piece respirators
for capturing NPs, and an absence of a standard procedure to measure the respirator
filter’s effectiveness. Prior studies were limited to relatively low airflow rates. Hence, the
results cannot be inferred for real applications. With an increased emergence of nano-

24
technologies, it is essential to develop a test method to characterize the effectiveness of
various respirator filters and to study the impact of above-mentioned parameters on their
effectiveness under conditions normally found in work environment. Personal protective
equipment filtration devices can play a significant role in reducing or eliminating the
exposure to NPs in a work place.
The majority of previous investigations on respiratory protective devices (for example,
filtering face-piece respirators) were conducted at constant airflow rates ranging between
30 and 85 liters/min. Although airflow rate of 85 liters/min simulates the relative high
breathing rate at strenuous workload used by NIOSH for respirator certification, it is
believed that the inhalation flow rate can exceed 350 liters/min at heavy workload
(Janssen, 2003; Balazy et al. 2006b).
2.4. Standards for the Filter Performance Evaluation and the Limitations
Recently, from June 1995, the National Institute for Occupational Safety and Health
(NIOSH) has certified the Non-Powered Air-Purifying Particulate Respirators in
accordance with title Code of Federal Regulations, part 84 (42 CFR 84), replaced with 30
CFR part 11 (CFR, 1996). In this updated regulation, in terms of the type of challenge
aerosols, solid and oily aerosols, the filters are categorized in three classes of N, R and P
respirators with three levels of filter efficiency, 95, 99 and 99.97% for each class of
filters. N type of respirators correspond to the filters with resistance against only solid
aerosol (not efficient against oily aerosols), while the R and P type respirators are also
intended to be fairly and highly resistant, respectively, against oily aerosols. NIOSH

25
approves the ‘N-series’ respirator filters with a poly-disperse NaCl particles with a count
median diameter (CMD) of 75±20 nm and a geometric standard deviation (GSD) not
greater than 1.86. And the R- and P- designated respirators are challenged against dioctyl
phthalate (DOP) with CMD of 165±20 nm and a GSD not further than 1.60 (CFR, 1996).
The existing certification NIOSH intends to certify the N, R and P respirators at very
conservative test condition, as the performance of the filter can tremendously vary under
different situations. For instance, to test filters in a severe condition, the respiratory tests
in NIOSH are performed at a constant airflow rate of 85 liters/min corresponding to an
average breathing rate of an individual involved in a heavy work load.
However, this certification tests may be used for ranking of respirators but may not
always represent the worst case scenario in terms of the collection efficiency (Eninger et
al., 2008). For example, Balazy et al. (2006b) showed that an emerging Coulombic force
would be induced if both filters and particles were charged: this would significantly
overestimate the respirator performance. As pointed out earlier, the MPPS for a specific
filter system, can be shifted mainly depends on the magnitude of filtration face velocity,
filter‘s type, filtration mechanism, fiber charge density and particle charge distribution
(Eninger et al., 2008). The MPPS for electret filters is much smaller than that for
mechanical filters. However, the NIOSH certification test assumes the MPPS of
approximately 300 nm for all filters and filters types: which may not be true for electret
filters. Furthermore, forward-light scattering photometers are used in the NIOSH testing
protocol to measure aerosol concentrations before and after the tested respirator.
Generally, photometer signal is only capable of measuring the particles with diameters

26
larger than 100 nm such that photometric method deployed in the NIOSH protocol is not
suitable for measuring the filtration efficiency for nano-particles (Eninger et al., 2008). In
a study carried out by Eninger et al. (2008), the results showed 68% (by count) and 8%
(by mass) of NaCl and 10% (by count) and 0.3% (by mass) of DOP particles are below
100 nm in NIOSH testing protocol. However, as noted above, the photometric method
used in NIOSH protocol does not effectively contribute to measure the ultrafine particles
(<100 nm). One of the other limitations in NIOSH certification is that the collection
efficiency of the filter respirators is not presented in terms of the particle size; the test is
only based on measuring particle mass concentration before and after filter for poly-
disperse challenge aerosols. However, as discussed previously, in spite of very low mass
concentration, the number of NPs can be very high in the environment. Thus, the human
exposure to NPs can be even more dangerous to human health than the larger particles.

27
3 Chapter 3: EXPERIMENTAL METHOD AND SYSTEM
CALIBRATION
3.1. Introduction
This chapter describes a small scale test facility used in this research to develop a “test
procedure” to evaluate and compare different devices. The test system was designed and
constructed to incorporate an air-cleaning device to simulate its actual application. The
duct was made of a stainless steel chamber with a Plexiglas opening in the front and
back. Air supplied to the system was filtered through a HEPA filter and conditioned to
have constant temperature and humidity. A HEPA filter was used at the end of the unit to
remove particles before discharging the air. Thus, the pump must be capable of providing
the design airflow rate against the system pressure drop.
In this chapter, according to the air filter test methodology, the schematic diagram of two
experimental setups are discussed and compared for challenging filters against NPs, as
shown in figures 3-1 and 3-2. These schematic diagrams express the required procedures
to test respirators against mono-disperse and poly-disperse aerosols utilized in different
scenarios, respectively. Thereafter, the required test procedures and results related to the
calibration and qualification tests are illustrated.

28
3.2. Overview of Experimental Set-up
3.2.1. Filtration Test against Mono-Disperse Aerosols
The six-Jet Collision Nebulizer (Model CN25, BGI Inc., Waltham. MA) is employed as
an aerosol generator to provide particles with a size ranging from 15 to 200 nm (see
figure 3-1). Next, a long differential mobility analyzer (long DMA) (Model 3081, TSI
Inc.) is used to extract mono-sized particles by size classifying the charged particles
based on their electrical mobility2. As the particles enter the DMA, they experience an
external electric field causing each particle with a certain diameter to follow a specific
trajectory and to migrate with a certain amount of velocity. Only specific size-selected
particles within a narrow range of electrical mobility (inversely related to particle size)
will have the correct trajectory to exit the DMA. Then, the resulting charged particles of
known size exiting from the DMA are passed through the neutralizer (Kr-85) (Model
3012A, TSI Inc.) to obtain the Boltzmann charge equilibrium. Afterwards, according to
the testing airflow rate, an extra dry- filtered airflow is added to the mono size selected
aerosol flow. The total aerosol flow from the DMA and the extra introduced clean air are
mixed before entering the filter test system. In addition, a small mixing fan is used at the
inlet of the chamber to disperse the aerosols. An ultra fine condensation particle counter
(UCPC) (Model 3775, TSI Inc.) is then used to monitor the particle concentration in real
time at the downstream and upstream of the filter alternately. And consequently, the
2 The electrical mobility is the ratio of migration velocity caused by an external force, an electric field, to
the magnitude of the external force.

29
filtration efficiency at the tested particle size is measured. By performing the test for
different mono size particles, the particle filtration efficiency (or particle penetration) can
be determined as a function of particle size.
Figure 3-1: Schematic diagram of experimental set-up: testing filters against mono-
disperse aerosols. Manikin adapted from Balazy et al., 2006a.
3.2.2. Filtration Test against Poly-Disperse Aerosols
In this experimental set-up (see figure 3-2), after generating poly-disperse aerosols and
passing the generated aerosols through the neutralizer, the additional required dry-clean
airflow is added to the neutralized poly-disperse aerosols. Next, the mixed poly-disperse
aerosol and airflow is passed directly into the chamber. The Scanning Mobility Particle
Sizer (SMPS) (Model 3936, TSI Inc), which mainly consists of DMA and CPC, is then
used to scan the particle size distribution both at the downstream and upstream of the
filter, alternately. Consequently, the particle collection efficiency (or particle penetration)
is determined as a function of particle diameter.

30
Figure 3-2: Schematic diagram of experimental set-up: testing filters against poly-
disperse aerosols. Manikin adapted from Balazy et al., 2006a.
3.3. Test Procedure
Figure 3-3 presents the full schematic of the experimental set-up utilized to challenge
tested respirators against poly-disperse aerosols. The test system was first set-up and
calibrated according to the requirements of the ASHRAE testing standard 52.2 (2007)
(see section 3.5 related to the calibration tests).

31
Figure 3-3: Schematic of the test system used to challenge N95 respirators against poly-
disperse aerosols.
In the case of respiratory filters, one model of NIOSH- approved N95 filtering face-piece
respirators was selected to challenge against poly-disperse NPs (see figure 3-4). The
selected N95 respirator was sealed by silicon sealant on the manikin’s face and placed on
the left side of the test chamber (see figure 3-5). Considering this situation, the possible
leakage through the respirators and manikin’s face was not taken in the filtration
efficiency analysis.

32
Figure 3-4: Photograph of the tested N95
respirator.
Figure 3-5: Photograph of the N95
respirator sealed on the manikin.
The six-Jet Collision Nebulizer was operated at an inlet pressure of 25 psi, and fed with
0.1% (V/V) NaCl solution to generate poly-disperse NaCl particles in the 15 to 200 nm
range. The challenge NaCl aerosol employed in this study, with 99.9% purity and density
of 2165 kg/m3, was dissolved in distilled water and alcohol. A filtered air supply (Model
3074, TSI Inc.) was used to provide a clean-dried air entering the generation system (see
figure 3-6).

33
Figure 3-6: Photograph of the filtered air supply (Model 3074, TSI Inc.) connected with
six-Jet Collision Nebulizer.
Prior to the filtration efficiency test, in order to reach a steady state concentration at the
upstream of the chamber, the generation system was allowed to operate for at least 5
minutes (for more detailed information, review the calibration results for the stabilization
test). To reduce the chance of particle loading, the N95 respirator was bypassed during
the stabilization period. Having stabilized the system, the switching valve was adjusted,
letting the total aerosol flow pass directly through the test filter.
Subsequently, after allowing the system to stabilize and setting the sampling flow rate at
1.5 liters/min, the concentration and size distribution were measured alternately twice at
the downstream and twice at the upstream of the test filter by a SMPS. The required time
for each measurement at either downstream or upstream was 135 seconds. Consequently,

34
the particle penetration values were determined as a function of particle diameter. The
particle concentration and size distribution at airflow rates of 85, 135, 270 and 360
liters/min at upstream (used for challenging the N95 respirator against poly-disperse
aerosols) are presented in figure 3-7.
Figure 3-7: The particle concentration and size distribution of the challenge NaCl aerosol
at different testing airflow rates (operating Nebulizer at 25 psi inlet pressure, using 0.1%
NaCl solution).
In the experimental set-up, a pressure transducer was also applied to measure the pressure
drop across the tested face-piece respirator. Thus, the quality factor (qf)3, which
3 The quality factor is used as a means to categorize the filter performance in accordance with particle
penetration and air resistance (Hinds, 1999).
0.0
0.5
1.0
1.5
2.0
2.5
3.0
3.5
4.0
6 10 16 27 45 74 122 200
Num
ber
Con
c. (x
E06
)
Particle Size, Dp (nm)
85 lpm
135 lpm
270 lpm
360 lpm

35
corresponds to the particle penetration (P, %) and airflow resistance (Δp, in mm H2O)
through the filter, was determined based on the particle size. This indicator of filter
performance is defined as:
)13()/1ln(−
Δ=
pPq f
The selected N95 respirator was not preconditioned for relative humidity before testing
(filters were tested as received from the manufacturer). According to the 42 CFR 84, pre-
treatment at 85% relative humidity and 38° C for 25 hours is required for N series
respirators. Additionally, the operational conditions (temperature, pressure and relative
humidity) were monitored in the chamber during the test. The temperature was
maintained at the ambient temperature (23±2°C) and the relative humidity (8±2%). In
addition, a small mixing fan was housed at the inlet of the chamber.
To remove the possible water vapour in the aerosol flow coming out from the Collision
Nebulizer, a diffusion dryer was applied. The drying system was composed of an inner
tube made of a wire screen and surrounded by silica gel in an outer plastic tube (see
figure 3-8). In this case, as the aerosol passed through the inner tube, the water vapour
was absorbed on the porous wall and afterwards removed with the surrounding silica gel.

36
Figure 3-8: The silica gel drying system.
To challenge N95 respirators against mono-disperse aerosols, the same testing procedure
as discussed above was followed, except the experimental set-up was adapted to be
capable of testing filters with mono-disperse particles (see figure 3-1).
After generating poly-disperse aerosols using the six-Jet Collision Nebulizer (operated at
an inlet pressure of 25 psi, using 0.1% NaCl solution) and passing the generated aerosols
through the silica gel drying system, a long DMA was utilized to extract mono size
particles before entering the filter test system.
A UCPC was used to count the particle concentration of each selected mono-sized
particle at both the downstream and upstream of the filter. The challenge mono-sized

37
NaCl aerosols were pumped for 2 minutes with UCPC at a sampling flow rate of 1.5
liters/min both at downstream and upstream. To provide a reliable sampling condition,
the particle counter instrument (UCPC) was allowed to stabilize after switching between
the two sampling ports at the downstream and upstream. Consequently the percentage
penetration was measured at each tested mono-sized particle.
3.4. Filtration Efficiency Measurement
The particle penetration through the filter was determined as the ratio of the downstream
concentration (Cdown) to upstream concentration (Cup) for the challenge aerosol, which is
presented as follow:
2)-(3 100)((%) ×=up
down
CC
P
Consequently, the total collection efficiency (η) is defined as:
3)-(3 100]1[100(%) ×−=−=up
down
CC
Pη
As mentioned earlier, a UCPC instrument was used to count the average number
concentrations at the upstream and downstream of the filter. Notes, according to the
measurement technique, the total collection efficiency can be determined in terms of
mass or number concentration.

38
3.5. Set-up Characterization (Calibration)
Prior to the filtration efficiency test, in order to provide a reliable operating conditions for
the test rig and sampling procedures, some calibration and qualification tests were
conducted. These calibration tests involve:
• Conducting no filter test (correlation test) to quantify the accuracy of the
fractional efficiency measurement,
• Measuring the size distribution at different locations at upstream, to assure the
dispersal uniformity of the challenge aerosol in the test chamber,
• Measuring the concentration and size distribution of the challenge aerosol using
different NaCl solution concentrations and,
• Conducting the stabilization test during the system startup to determine the time
interval until the particle concentration reaches a steady condition at upstream.
In this study, the calibration tests were implemented at four different testing constant
airflow rates: 85, 135, 270 and 360 liters/min.
3.5.1. No Filter Test (Correlation Test)
The purpose of this test was to quantify the accuracy of the fractional efficiency
measurement. The experiment similar to the filtration efficiency tests was conducted
without any removal device (respirator). In an ideal operating condition, penetration level
of 100% would be achieved at each particle size.
39
However, from a pragmatic perspective, a penetration lower than 100% can be expected
due to the particle losses in the chamber and sampling tube measuring instruments,
discrepancy in particle dispersal uniformity (mixing) between upstream and downstream
sampling probes (Ensor et al., 1997).
To evaluate the mentioned criterion, the correlation ratio (R) was computed between two
sampling locations at the upstream (center) and downstream at all four airflow rates: 85,
135, 270 and 360 liters/min. This correlation ratio (R) is defined as:
)43()( −=ionconcentratparticleupstream
ionconcentratparticledownstreamR
The data analysis yielded a fairly normal deviation between the upstream and
downstream concentration, satisfying the last updated requirements in the ASHRAE
testing standard 52.2 (2007). The correlation ratios ranged from 0.97 to 1.09, 0.98 to
1.10, 0.93 to 1.09 and 0.92 to 1.03 with average values of 1.01, 1.06, 0.99 and 0.98 at 85,
135, 270 and 360 airflow rates, respectively (see figures 3-9 through 3-12).
The six-Jet Collision Nebulizer (operated at an inlet pressure of 35 psi and using 0.01%
NaCl solution) was used to generate 6 to 200 nm poly-disperse NaCl particles.

40
Figure 3-9: Penetration without the test filter at 85 liters/min airflow rate.
.
Figure 3-10: Penetration without the test filter at 135 liters/min airflow rate.
0.0
0.3
0.6
0.9
1.2
1.5
6 10 16 27 45 74 122 200
Num
ber
Con
c. (x
E06
)
Particle Size, Dp (nm)
UpstreamDownstream
0.0
0.3
0.6
0.9
1.2
1.5
6 10 16 27 45 74 122 200
Num
ber
Con
c. (x
E06
)
Particle Size, Dp (nm)
UpstreamDownstream

41
Figure 3-11: Penetration without the test filter at 270 liters/min airflow rate.
Figure 3-12: Penetration without the test filter at 360 liters/min airflow rate.
0.0
0.3
0.6
0.9
1.2
1.5
6 10 16 27 45 74 122 200
Num
ber
Con
c. (x
E06
)
Particle Size, Dp (nm)
UpstreamDownstream
0.0
0.3
0.6
0.9
1.2
1.5
6 10 16 27 45 74 122 200
Num
ber
Con
c. (x
E06
)
Particle Size, Dp (nm)
UpstreamDownstream

42
3.5.2. Particle Dispersal Uniformity Test at Upstream
This qualification test was carried out to ensure the uniformity of the particle
concentration at upstream of the filter in the test chamber. To verify this, the coefficient
variation (CV) of aerosol uniformity4 was calculated at five upstream sampling locations
(right up, right down, left up, left down and center) under four different airflow rates (85,
135, 270 and 360 liters/min) at each particle size, with no removal devices (see figure 3-
13).
.
Figure 3-13: Top view of the sampling locations at upstream.
According to the data analysis for the particle size range of 6 to 200 nm, the average CV
values were 4.3, 4.8, 2.8 and 5.2% at 85, 135, 270 and 360 liters/min airflow rates,
respectively (see figures 3-14 through 3-17). These ranges computed for the correlation
4 The correlation variation (CV) of aerosol uniformity is defined as the ratio of standard deviation to mean
value of the particle concentration at each particle size.
8cm 8cm 8 cm
8 cm

43
variation satisfied the requirements specified in the ASHRAE testing standard 52.2
(2007) (CV < 15% for each testing airflow rate) and indicated good mixing and
uniformity in the test chamber. For more detailed information, including information on
the coefficient variation for the aerosol uniformity, see table 3-1.
In this experiment, the six-Jet Collision Nebulizer (operated at an inlet pressure of 35 psi
and using 0.01% NaCl solution) was used to generate 6 to 200 nm poly-disperse NaCl
particles.
Table 3-1: Summary of coefficient variation for the aerosol uniformity.
Airflow rate Correlation variation (%)
(liters/min) Minimum Maximum Average
85 1.9 7.9 4.3
135 2.7 9.8 4.8
270 0.6 5.5 2.8
360 3.3 8.8 5.2

44
Figure 3-14: Particle size distribution at five different upstream sampling locations under
85 liters/min airflow rate.
Figure 3-15: Particle size distribution at five different upstream sampling locations under
135 liters/min airflow rate.
0.0
0.3
0.6
0.9
1.2
1.5
6 10 16 27 45 74 122 200
Num
ber
Con
c. (x
E06
)
Particle Size, Dp (nm)
Right upRight downLeft upLeft downCenter
0.0
0.3
0.6
0.9
1.2
1.5
6 10 16 27 45 74 122 200
Num
ber
Con
c. (x
E06
)
Particle Size, Dp (nm)
Right upRight downLeft upLeft downCenter

45
Figure 3-16: Particle size distribution at five different e upstream sampling locations
under 270 liters/min airflow rate.
Figure 3-17: Particle size distribution at five different upstream sampling locations under
360 liters/min airflow rate.
0.0
0.2
0.4
0.6
0.8
1.0
6 10 16 27 45 74 122 200
Num
ber
Con
c. (x
E06
)
Particle Size, Dp (nm)
Right upRight downLeft upLeft downCenter
0.0
0.1
0.2
0.3
0.4
0.5
6 10 16 27 45 74 122 200
Num
ber
Con
c. (x
E06
)
Particle Size, Dp (nm)
Right upRight downLeft upLeft downCenter

46
3.5.3. Particle Size Distribution at Upstream
In this qualification test, the particle concentration and size distribution were measured at
the upstream of the chamber under different airflow rates of 85, 135, 270 and 360
liters/min. The six-Jet Collision Nebulizer was used to provide particles with a size
ranging between 6 to 200 nm (operated at 15, 25, 30 and 35 psi inlet pressures, using
0.01, 0.1 and 1% NaCl solution concentrations). Like the other previous qualification
tests, the experiment was conducted without a respirator on the manikin.
According to the obtained results, at the same inlet pressure, with an increase in salt
solution concentration (used to generate poly-disperse particles) the particle number
concentration was found to increase at each particle diameter (see figures 3-18 through 3-
20). The particle size distribution also demonstrated a shift toward larger sizes. For
instance, when operating the Nebulizer at 35 psi and 85 liters/min airflow rate, the
maximum particle concentrations were 1.0E06, 1.65E06 and 2.63E06 particles/cm3 at 34,
50 and 70 nm in size using 0.01, 0.1 and 1% NaCl solutions, respectively (see figures 3-
18 through 3-20).
In addition, with increased inlet pressures, the particle concentration was found to elevate
at each particle size. For instance, using 0.01% NaCl solution, at 85 liters/min airflow
rate, the maximum particle concentrations were approximately 0.25E06, 0.58E06,
0.78E06 and 1.0 E06 particles/cm3 at 15, 25, 30 and 35 psi, respectively (see figure 3-18).

47
A similar pattern was also observed for the particle concentration and size distribution at
higher airflow rates of 135, 270 and 360 liters/min at upstream, except for lower
concentration due to increased airflow (see appendix D).
Figure 3-18: Particle concentration as a function of particle size at different pressures (85
liters/min and 0.01% NaCl solution).
0.0
0.3
0.6
0.9
1.2
1.5
6 10 16 27 45 74 122 200
Num
ber
Con
c. (x
E06
)
Particle Size, Dp (nm)
15 psi
25 psi
30 psi
35 psi

48
Figure 3-19: Particle concentration as a function of particle size at different pressures (85
liters/min and 0.1% NaCl solution).
Figure 3-20: Particle concentration as a function of particle size at different pressures (85
liters/min and 1% NaCl solution).
0.0
0.4
0.8
1.2
1.6
2.0
6 10 16 27 45 74 122 200
Num
ber
Con
c. (x
E06
)
Particle Size, Dp (nm)
15 psi
25 psi
30 psi
35 psi
0.0
0.6
1.2
1.8
2.4
3.0
6 10 16 27 45 74 122 200
Num
ber
Con
c. (x
E06
)
Particle Size, Dp (nm)
15 psi
25 psi
30 psi
35 psi

49
3.5.4. Stabilization Test
A stabilization test was conducted at four different constant airflow rates (85, 135, 270
and 360 liters/min) to determine the time interval required for the particles to reach a
steady state concentration. The six-Jet Collision Nebulizer was operated at 35 psi inlet
pressure to generate poly-disperse NaCl particles, using 0.01% NaCl solution.
The preferred stabilization times were 1.95, 1.35, 0.82 and 0.57 minutes at 85, 135, 270
and 360 liters/min airflow rates, respectively (see table 3-2). According to the data
analysis, after the set-up was stabilized, the total number concentrations for the generated
poly-disperse aerosols were approximately 0.63E06, 0.54E06, 0.40E06 and 0.32E06
particles/cm3 at the respective airflow rates.
Figure 3-21: Challenge aerosol concentration during system startup at different airflow
rates, using 0.01% NaCl.
0.0
0.2
0.4
0.6
0.8
1.0
0 60 120 180 240 300 360 420 480 540
Num
ber
Con
c. (x
E06
)
Time (second)
85 lpm
135 lpm
270 lpm
360 lpm

50
In addition, as noticed in figure 3-21, some inconsistency occurred in the particle number
concentration even after the stabilization period. This fluctuation occurred in a cycle
nearly at every 20 seconds. However, no explanation was found for this phenomenon.
Table 3-2 presents a summarized result for the stabilization test at all four testing airflow
rates.
Table 3-2: Summary of stabilization test.
Airflow rate Stabilization time Particle concentration
(liters/min) (min) (xE06 particles/cm3)
85 1.95 0.63±0.01
135 1.35 0.54±0.01
270 0.82 0.40±0.02
360 0.57 0.32±0.06

51
4 Chapter 4: RESULTS AND DISCUSSION
4.1. Introduction
The proposed research was carried out for two sets of experiments. In the first set-up, an
experimental methodology has been developed to test N95 respirators against 15 to 200
nm poly-disperse aerosols in three different scenarios (see figure 3-2). First, the effect of
airflow condition (85, 135, 270 and 360 liters/min) and particle size on the initial
penetration and the quality factor levels of the N95 respirator were investigated.
Thereafter, the effect of particle loading on the filtration performance of the N95
respirator was examined at constant airflow rate of 85 liters/min. Finally, the correlation
between relative humidity (RH) and initial percentage penetration was assessed at 85
liters/min constant airflow rate.
In the second phase, the experimental set-up was adapted to test N95 respirators against
mono-disperse particles (at twelve particle sizes) with a size range of 20 to 200 nm at
constant airflow rate of 85 liters/min (see figure 3-1). The results have also been
correlated with the initial particle penetration values measured at constant airflow rate of
85 liters/min when challenged with poly-disperse aerosols.
In this chapter, the outcomes of each experiment are explained and discussed in details.

52
4.2. PHASE 1: Particle Penetration against NaCl Poly-Disperse
Particles in the Range 15 to 200 nm (PAT Method)
4.2.1. Initial Particle Penetration as a Function of Inhalation Flow Rate
Test Description
The N95 respirators were challenged with poly-disperse NaCl aerosols for a period of 5
minutes at four constant airflow rates: 85, 135, 270 and 360 liters/min. The experimental
set-up was developed to test filters against poly-disperse aerosols (see figure 3-2).
Data Analysis
Figure 4-1: Effect of particle size and inhalation flow rate on initial particle penetration
through N95 respirators (n=3). The error bars represent the standard deviations.
0
5
10
15
20
15 20 27 36 48 64 85 113 151 200
Pene
trat
ion,
P (%
)
Particle Size, Dp (nm)
85 lpm135 lpm270 lpm360 lpm
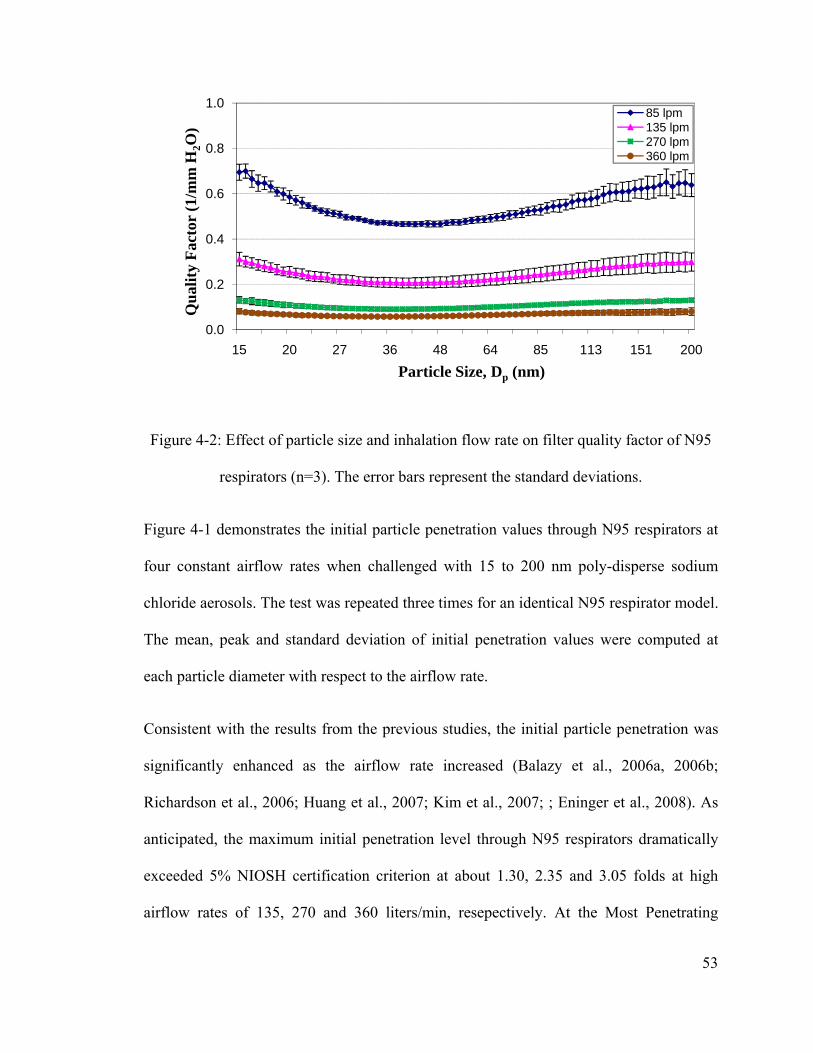
53
Figure 4-2: Effect of particle size and inhalation flow rate on filter quality factor of N95
respirators (n=3). The error bars represent the standard deviations.
Figure 4-1 demonstrates the initial particle penetration values through N95 respirators at
four constant airflow rates when challenged with 15 to 200 nm poly-disperse sodium
chloride aerosols. The test was repeated three times for an identical N95 respirator model.
The mean, peak and standard deviation of initial penetration values were computed at
each particle diameter with respect to the airflow rate.
Consistent with the results from the previous studies, the initial particle penetration was
significantly enhanced as the airflow rate increased (Balazy et al., 2006a, 2006b;
Richardson et al., 2006; Huang et al., 2007; Kim et al., 2007; ; Eninger et al., 2008). As
anticipated, the maximum initial penetration level through N95 respirators dramatically
exceeded 5% NIOSH certification criterion at about 1.30, 2.35 and 3.05 folds at high
airflow rates of 135, 270 and 360 liters/min, resepectively. At the Most Penetrating
0.0
0.2
0.4
0.6
0.8
1.0
15 20 27 36 48 64 85 113 151 200
Qua
lity
Fact
or (1
/mm
H2O
)
Particle Size, Dp (nm)
85 lpm135 lpm270 lpm360 lpm

54
Particle Sizes (MPPS), with the lowest filtration efficiency, the percentage penetrations
were 2.7±0.54, 6.6±0.90, 11.7±1.00 and 15.3±1.97% at 85, 135, 270 and 360 liters/min,
repectively. The mean initial penetrations were also 1.64±0.72, 4.21±1.60, 8.13±2.43 and
11.46±2.51% at the respective airflow rates for the tested particle size range of 15 to 200
nm.
However, compared with the obtained results for the particle size range from 15 to 200
nm, the data analysis suggested higher mean initial penetrations for the particle size range
<100 nm; 1.89±0.67, 4.82±1.40, 9.13±2.03 and 12.45±2.16% at 85, 135, 270 and 360
liters/min airflow rates, respectively (see table 4-1). Meanwhile, the coefficient variation
for the initial penetration was altered from 0.19 to 0.53, 0.07 to 0.22, 0.06 to 0.28 and
0.11 to 0.33 at the respective airflow rates.
The mean initial particle penetration at 360 liters/min exceeded that at 85 liters/min by
about 7-fold. In addition, according to the obtained results, with the increase of airflow
rate, the MPPS demonstrated a shift toward small particles; approximately 46, 41, 37 and
36 nm at 85, 135, 270 and 360 liters/min, respectively, which was consistent with the
literature (Martin and Moyer, 2000; Balazy et al., 2006a, 2006b; Richardson et al., 2006;
Huang et al., 2007; Rengasamy et al., 2008a; Rengasamy and Shaffer, 2008b). The shift
in MPPS toward small sizes and the increase in the particle penetration are both due to
the fact that, along with the increase in airflow rate, the diffusion and electrostatic
mechanisms contribute less to the removal of smaller particles as a result of less
residence time (Richardson et al., 2006).

55
It should be noted that NIOSH certifies the N95 filtering face-piece respirators based on
filtration efficiency higher than 95% at the MPPS of 300 nm (CFR, 1996). However, as
observed in figure 4-1, the initial penetration in the MPPS occurred at a particle size
smaller than 300 nm at all airflow rates. Some previous studies reported that the iso-
propanol treatment (applied to remove the electrostatic charge) of N, R and P types
would shift the MPPS from 30- 100 nm to 250- 350 nm and the particle penetration levels
would increase significantly, confirming that the electrostatic mechanism plays a
significant role in the filtration performance for N and P type respirators (Martin and
Moyer, 2000; Huang et al., 2007; Rengasamy et al., 2007).
Furthermore, along with increasing the airflow rate, the quality factor value was reduced,
while not significantly dependent upon the particle size (see figure 4-2). This dramatic
drop in the quality factor values, particularly at higher airflow rates, is largely attributed
to the increase in the pressure drop and particle penetration, which is in agreement with
the literature (Han, 2000; Eninger et al., 2008).
According to the results, more enhanced values were observed for the quality factor at
low airflow rates (85 and 135 liters/min), which was improved by average factors of 8.1
at 85 liters/min and 3.6 at 135 liters/min compared with that at 360 liters/min.
Conversely, the quality factors were considerably low and roughly identical at 270 and
360 liters/min. As seen in table 4-1, the mean quality factors for the particles between 15
to 200 nm were 0.548±0.067, 0.247±0.032, 0.108±0.013 and 0.068±0.007 at 85, 135, 270
and 360 liters/min airflow rates, respectively. In comparison with the results obtained for
the particles between 15 to 200 nm in size, the data analysis suggested a similar mean

56
quality factor for the particles below 100 nm in size; 0.5248±0.062, 0.2342±0.026,
0.102±0.011 and 0.065±0.006 at the respective airflow rates (see table 4-1).
Table 4-1: Summary of particle penetration, pressure drop, quality factor and coefficient of variation for the particle penetration.

57
CV
* (1
5-10
0 nm
)
(%)
0.19
-0.5
3
0.07
-0.2
2
0.06
-0.2
8
0.11
-0.3
3
*Coe
ffic
ient
of v
aria
tion
is d
efin
ed a
s the
ratio
of s
tand
ard
devi
atio
n to
the
mea
n.
CV
* (1
5-20
0 nm
)
(%)
0.19
-0.5
3
0.07
-0.3
4
0.06
-0.2
8
0.11
-0.4
2
Qf 1
5-10
0 nm
(1/ m
m H
2O)
0.52
48±0
.062
0.23
42±0
.026
0.10
2±0.
011
0.06
5±0.
006
P15-
100
nm
(%)
1.89
±0.6
7
4.82
±1.4
0
9.13
±2.0
3
12.4
5±2.
16
Qf 1
5-20
0 nm
(1/ m
m H
2O)
0.54
8±0.
067
0.24
7±0.
032
0.10
8±0.
013
0.06
8±0.
007
P15-
200
nm
(%)
1.64
±0.7
2
4.21
±1.6
0
8.13
±2.4
3
11.4
6±2.
51
MPP
S (1
5-20
0 nm
)
(nm
)
46
41
37
36
Max
imum
P
(15-
200
nm)
(%)
2.7±
0.54
6.6
±0.9
0
11.7
±1.0
0
15.3
±1.9
7
Pres
sure
dro
p
(mm
H20
)
7.79
±0.2
7
13.3
2±1.
03
23.7
9±0.
77
32.7
1±0.
91
Q
(lite
rs/m
in)
85
135
270
360
Tabl
e 4-
1: S
umm
ary
of p
artic
le p
enet
ratio
n, p
ress
ure
drop
, qua
lity
fact
or a
nd
coef
ficie
nt o
f var
iatio
n fo
r the
par
ticle
pen
etra
tion.

58
4.2.2. Particle Penetration as a Function of Loading Time
Test Description
The selected N95 respirator was loaded continuously against 15 to 200 nm poly-disperse
NaCl particles at 85 liters/min constant airflow rate for a time interval of 5 hours. The
experimental methodology was developed to test filters against poly-disperse aerosols
(see figure 3-2).
Data Analysis
Figure 4-3: Effect of particle loading on particle penetration through N95 respirators at
85 liter/min constant airflow rate (n=3).
0.0
0.5
1.0
1.5
2.0
2.5
3.0
15 20 27 36 48 64 85 113 151 200
Pene
trat
ion,
P (%
)
Particle Size, Dp (nm)
Initial1st hour2nd hour3rd hour4th hour5th hour

59
Figure 4-4: Effect of particle size and particle loading on filter quality factor of N95
respirator at 85 liters/min constant airflow (n=3).
Figure 4-3 illustrates the effect of particle loading on the particle penetration level
through the N95 respirator at constant airflow rate of 85 liters/min against poly-disperse
sodium chloride particles. The test was replicated three times for an identical N95
respirator model. The mean, peak particle penetrations and also the quality factor for the
N95 respirator were determined over time (once at each hour).
For the particles below 100 nm in size, the penetration level was found to diminish with
further particle loading. Conversely, the results demonstrated that for the particles
roughly larger than 100 nm, the penetration increases over loading time. As summarized
in table 4-2, for the particles below 100 nm, the maximum and mean penetration levels
were reduced from 2.66±0.21 to 1.48±0.12% and from 1.76±0.70 to 0.87±0.50%,
0.0
0.2
0.4
0.6
0.8
1.0
15 20 27 36 48 64 85 113 151 200
Qua
lity
Fact
or (1
/mm
H2O
)
Particle Size, Dp (nm)
Initial1st hour2nd hour3rd hour4th hour5th hour

60
respectively. Meanwhile, an increase in the mean penetration level from 0.71±0.21 to
1.07±0.07% (see table 4-2) was observed for the larger particles.
It was recognized that the MPPS for the N95 respirator shifted toward the large particle
sizes; from 41 to 66 nm. This is because diffusion becomes more dominant to collect NPs
while electrostatic attraction force shows less contribution in capturing large size
particles (Martin and Moyer, 2000, Wang, 2001; Woon et al., 2008). Moreover, less
deviation in particle penetration was identified with further particle loading (see figure 4-
3).
As mentioned earlier in the section, the penetration for the particles between 15 to 100
nm showed a considerable reduction with the loading process, whereas, the penetration
gradually increased for the larger sizes. Seemingly, this phenomenon is due to the
formation of particle dendrites on the surface of the filter (Wang, 2001; Woon et al.,
2008). With the lack of electrostatic attraction force, particle loading generally leads to an
increase in capturing the particles, as the deposited particles are similar in size to the
approaching particles. This allows the particles to remain straight in their gas stream lines
adjacent to the fiber surface (Wang, 2001). On the contrary, the captured particles may
suppress the collection of particles caused by the electrostatic attraction force, which is a
noticeable collection mechanism for the large size particles predominantly between 150
to 500 nm (Wang, 2001). Experimental studies on electret filters verified that the particle
collection efficiency relies generally on the amount of electrostatic charge on the filter
fiber (Brown et al., 1988; Chen et al., 1993; Martin and Moyer, 2000).

61
Figure 4-4 displays the filter quality pattern of the N95 respirator at each particle
diameter during the filter loading. The results showed further discrepancy in the quality
factors at larger particle sizes (the quality factor values were similar at very nano-sized
particles over the aerosol loading time). As shown in table 4-2, for the particles between
15 to 200 nm, the mean quality factor value differed from 0.551±0.077 to 0.457±0.088 in
the early and late stages of the filter loading, respectively. The quality factors for the
particles below 100 nm also changed between 0.507±0.086 to 0.471±0.099 in the
respective stages.

62
Table 4-2: Summary of particle penetration, pressure drop and quality factor in the early (A) and late (B) stages of particle loading.
Qf 1
5-10
0 nm
(1/ m
m H
2O)
0.50
7±0.
086
0.47
1±0.
099
Qf 1
5-20
0 nm
(1/ m
m H
2O)
0.55
1±0.
077
0.45
7±0.
088
P100
-200
nm
(%)
0.71
±0.2
1
1.07
±0.0
7
P15-
100
nm
(%)
1.76
±0.7
0
0.87
±0.5
0
P15-
200
nm
(%)
1.48
±0.7
7
0.92
±0.4
4
MPP
S (1
5-20
0 nm
)
(nm
)
41
66
Max
imum
P
(15-
200
nm)
(%)
2.66
±0.2
1
1.48
±0.1
2
Pres
sure
dro
p
(mm
H20
)
7.95
±0.5
7
10.8
6±1.
27
Parti
cle
load
ing
stag
e
(A)
(B)
Q
(lite
rs/m
in)
85
85
Tabl
e 4-
2: S
umm
ary
of p
artic
le p
enet
ratio
n, p
ress
ure
drop
and
qua
lity
fact
or in
the
early
(A) a
nd la
te (B
) sta
ges o
f par
ticle
load
ing.

63
4.2.3. Particle Penetration as a Function of Relative Humidity (RH)
Test Description
The respirator was tested against 15 to 200 nm poly-disperse NaCl particles at constant
airflow rate of 85 liters/min at three relative humidities; 10, 30 and 70% for 5 minutes. A
similar experimental methodology was established to perform the filtration efficiency
tests against poly-disperse aerosols (see figure 3-2), except a MNR humidifier was
utilized to condition the relative humidity before the total air entered the inlet chamber.
Data Analysis
Figure 4-5: Effect of relative humidity on initial particle penetration through N95
respirators at 85 liters/min constant airflow rate (n=4). The error bars represent the
standard deviation at each point.
0
1
2
3
4
5
6
15 20 27 36 48 64 85 113 151 200
Pene
trat
ion,
P (%
)
Particle Size, Dp (nm)
RH=10%RH=30%RH=70%

64
Figure 4-5 presents the initial penetration of sodium chloride particles through the
selected N95 respirators at Q=85 liters/min at three different relative humidities (10, 30
and 70%). The test was replicated four times for the selected N95 respirator model at
each relative humidity for the particles ranging from 15 to 200 nm. The mean, peak and
standard deviation of initial penetration levels were determined. Consistentent with the
results obtained from the previous studies on electret filters, for the particles below 100
nm, with an increase of the (RH), lower filtration performance was observed steadily, and
is attributed to the reduction in the charges on the fiber filters and particles (Ackley,
1982; Moyer et al., 1989). However, for the large sized particles, the particle penetration
levels were first similar at 10 and 30% (RH); whereas subsequently increased as (RH)
elevated to 70% (see figure 4-5).
As expected, the maximum initial penetration was found to escalate as the (RH)
increased, but, in all cases not exceeded up to 5% NIOSH certification criterion. In this
regard, the penetrations in the MPPS were respectively 2.73±0.47, 3.30±0.50 and
4.27±0.90% at 10, 30 and 70% (RH). The penetration mean values were 1.6±0.73,
1.9±0.90, 2.6±1.10% at the respective (RH) for the particles ranging in size from 15 to
200 nm.
It is noteworthy that the filtration data displays more mean penetrations for the particles
below 100 in size; 1.9±0.66, 2.3±0.75 and 3.0±0.94% at 10, 30 and 70% (RH),
respectively (see table 4-3).
The initial particle penetration exceeded by an average factor of 1.6 at the relative
humidity of 70%. With an increase in (RH), at the MPPS, no consistent shift was

65
identified. However, the MPPS still occurred in the nano-sized range between 30 to 50
nm, acknowledging the presence of electrostatic attraction on the collection of particles
(see table 4-3). For more detailed information including the data analysis on the initial
penetrations, MPPS and coefficient variation of the particle penetration, review table 4-3.

66
Table 4-3: Summary of particle penetration for the respirator's performance.
CV
* (1
5-10
0 nm
)
(%)
0.17
-0.6
6
0.09
-0.7
5
0.19
-0.9
4
* C
oeff
icie
nt o
f var
iatio
n is
def
ined
as t
he ra
tio o
f sta
ndar
d de
viat
ion
to th
e m
ean.
CV
* (1
5-20
0 nm
)
(%)
0.17
-0.7
3
0.07
-0.9
0
0.19
-1.0
9
P15-
100
nm
(%)
1.9±
0.66
2.3±
0.75
3.0±
0.94
P15-
200
nm
(%)
1.6±
0.73
1.9±
0.90
2.6±
1.10
MPP
S (1
5-20
0 nm
)
(nm
)
41
36
39
Max
imum
P
(15-
200
nm)
(%)
2.73
±0.4
7
3.30
±0.5
0
4.27
±0.9
0
(RH
)
(%)
10
30
70
Q
(lite
rs/m
in)
85
85
85
Tabl
e 4-
3: S
umm
ary
of p
artic
le p
enet
ratio
n fo
r the
resp
irato
r's

67
4.3. PHASE 2: Particle Penetration against NaCl Mono- Disperse
Particles in the Range 20 to 200 nm (MAT Method)
4.3.1. Correlation of Mono-Disperse and Poly-Disperse Particle Penetration
Test Description
The filtration performance of N95 series respirators was investigated against twelve
different mono-sized NaCl particles (20, 30, 40, 45, 50, 55, 60, 80, 100, 120, 160 and 200
nm) at 85 liters/min constant airflow rate. An experimental method was developed to test
filters against mono-disperse aerosols (see figure 3-1).
Data Analysis
Figure 4-6: The comparison of mono-disperse and poly-disperse particle penetration
levels (n=4). The error bars represent the standard deviation at each point.
0
1
2
3
4
5
20 30 40 45 50 55 60 80 100 120 160 200
Pene
trat
ion,
P (%
)
Particle Size, Dp (nm)
MAT Test
PAT Test

68
Figure 4-7: The particle number concentration at each tested mono-sized particle (n=4).
The error bars represent the standard deviation at each point.
Figure 4-6 illustrates the particle penetration levels through N95 respirators at constant
airflow rate of 85 liters/min against mono-disperse sodium chloride particles using the
mono-disperse aerosol test (MAT) method. It also shows the results with the measured
penetrations at constant airflow rate of 85 liters/min when challenged with poly-disperse
aerosols. The test was repeated with four identical N95 respirators model against mono-
sized NaCl aerosols. Consistent with the results from the previous studies for the electret
filters, the MPPS occurred in the 40 to 100 nm range. Compared with the obtained results
when N95 respirator was challened against poly-disperse aerosols test (PAT) method,
higher initial penetration level was found at each tested particle size with the (MAT)
method (see figure 4-6). However, in all cases, the initial penetration never exceeded the
5% NIOSH certification criterion at 85 liter/min.
0
400
800
1200
1600
2000
20 30 40 45 50 55 60 80 100 120 160 200
Part
icle
Con
cent
ratio
n
Particle Size, Dp (nm)
MAT Test

69
The results also revealed no significant relation between the initial particle penetrations,
measured with (MAT) and (PAT) methods at each corresponding particle size at 85
liters/min.
In addition, as observed in figure 4-7, the results showed very low number concentration
of nano-particles at the upstream of the N95 respirator compared with the measured
number concentratin with (PAT) method at each corresponding particle size at 85
liters/min. Depending on the particle size, the number concentration were approximately
between 80 to 1600 particles/cm3. This low number concentration of nano-particles is
mainly due to the diffusion losses through the measuring instrument; Scanning Mobility
Particle Sizer (SMPS), mainly from five parts: the penetration through the impactor inlet,
penetration through the neutralizer, penetration through the tubing to the Differential
Mobility Analyzer (DMA) and CPC, penetration through the DMA and penetration
through the CPC (review the TSI manual for series 3080 electrostatic classifiers).
.

70
5 Chapter 5: CONCLUSIONS AND FUTURE WORK
5.1. Conclusions
The main objective of this research was to develop a methodology to characterize the
effectiveness of one model of NIOSH-approved N95 respirator against poly-disperse
aerosols in size range from 15 to 200 nm. Then to use this methodology 1) to investigate
the effect of airflow condition and particle size on the initial particle penetration through
the respirator, 2) to investigate the effect of two other parameters, such the time of use
and the relative humidity on filtration performance, and 3) to develop and adapt the
experimental set-up to challenge the same type of respirator against mono-disperse
particles with a size range between 20 to 200 nm.
In order to achieve the objective of the study, an experimental set-up was first designed,
constructed and calibrated for testing filters for capturing NPs. A methodology was
developed to generate a controlled atmosphere of NPs, and to characterize the particles
(in terms of size and number distribution) and measure the concentration of the NPs in an
enclosed system. Then, a methodology was developed to characterize the performance of
filters used for respiratory protections in different scenarios, for capturing the NPs.
The conclusions of this study are as follow:
• Challenging N95 respirators with poly-disperse aerosols, the initial particle
penetration was dramatically enhanced with an increase in airflow rate. The initial
penetration in the MPPS through N95 respirator dramatically exceeded 5%

71
NIOSH certification criterion by average factors of 1.30, 2.35 and 3.05 at high
airflow rates of 135, 270 and 360 liters/min, respectively. The MPPS was shifted
toward small particle size; approximately 46, 41, 37 and 36 nm at 85, 135, 270
and 360 liters/min, respectively.
• The particle penetration level through N95 respirator reduced for the particle size
range nearly below 100 nm at 85 liters/min airflow rate with further particle
loading, while, a gradual increase in particle penetration was observed for the
larger size particles. The MPPS was also found to shift toward the large particle
sizes; from 41 to 66 nm.
• For the particles nearly below 100 nm, the filtration performance was reduced as
the relative humidity increased. However, the filtration performance was similar
at (RH) of 10 and 30%; and subsequently increased as (RH) elevated to 70%. The
MPPS was not significantly affected by (RH).
• It was found that when challenging N95 respirators against mono-disperse
aerosols using (MAT) method, the initial particle penetration never exceeded <5%
NIOSH certification criterion. The MPPS also occurred in the 40 to 100 nm
range. However, no consistent correlation was found for the measured initial
particle penetrations with those obtained using poly-disperse aerosols test (PAT)
method.

72
5.2. Recommendations and Future Work
The recommendations for the future research work on filtration performance assessments
are as follow:
• The developed methodology has the ability to investigate the collection efficiency
of series of filtering face-piece respirators. Thus, it is recommended to test three
classes of N, R and P respirators with three levels of filter efficiency; 95, 99 and
99.97%, for each class of filters against solid and liquid particles. Due to the
conditions aforementioned, N type of respirators correspond to the filters with
resistance against only solid aerosol (not efficient against oily aerosols), while the
R and P type respirators are also intended to be fairly and highly resistant,
respectively, against oily aerosols.
• The method should be modified such that more reliable to challenge filtering face-
piece respirators against mono-disperse particles. As mentioned before, when
respirators were challenged with MAT method, low concentration was obtained at
each tested particle size at the upstream of the filter compared with that achieved
with PAT method.
• The method should be applicable to investigate the performance of respiratory
mask filters under a realistic airflow pattern (cyclic airflow). Previous studies
were almost limited to test filters at constant airflow rates. However, the results of
these studies cannot be inferred for real applications because a realistic airflow
rate through a respiratory mask filter is not constant and varies corresponding to

73
breathing rate. It is suggested that the performance of a filter under a periodic
airflow rate would be different than that of measured under constant airflow rate.
• Last but not least, improved guidance in the selection and use of respirators
against nano-particles should be developed to ensure high levels of respiratory
protection for workers and exposed persons.

74
REFRENCES
Ackley, M.W. (1982). Degradation of Electrostatic Filters at Elevated Temperature and Humidity. 3rd World Filtration Congress pp. 169–176.
Alonso, M., Kousaka, Y., Hashimoto, T., & Hashimoto, N. (1997). Penetration of Nanometer-Sized Aerosol Particles through Wire Screen and Laminar Flow Tube. Journal of Aerosol Science, 27, 471–480.
ASHRAE. Standard 52.2. (2007). Method of Testing General Ventilation Air-Cleaning Devices for Removal Efficiency by Particle Size. American Society of Heating, Refrigerating, and Air-Conditioning Engineers, Inc., Atlanta.
Balazy, A., Podgorski, A., & Gradon, L. (2004). Filtration of Nano-sized Aerosol Particles in Fibrous Filters. I- Experimental Results. Journal of Aerosol Science, 35, 967–968.
Balazy, A., Toivola, M., Adhikari, A., Sivasubramani, S.K., Reponen, T., & Grinshpun, S.A. (2006a). Do N95 Respirators Provide 95% Protection Level against Airborne Viruses, and How Adequate Are Surgical Masks?. American Journal of Infection Control, 34, 51–57.
Balazy, A., Toivola M., Repoen T., Podgorski A., Zimmer A., & Grinshpun S.A. (2006b). Manikin-Based Performance Evaluation of N95 Filtering Face-Piece Respirators Challenged with Nano-particles. Annals of Occupational Hygiene, 50, 259–269.
Baumgartner, H., Loffler, F., & Umhauer, H. (1986). Deep-Bed Electret Filters-The Determination of Single Fbre Charge and Collection Efficiency. IEEE Transactions on Electrical Insulation, 21, 477–486.
BGI. (2002). Collision Nebulizer-Instructions. MRE 1, 3, 6 and 24 Jet. BGI Incorporated.
Boskovica, L., Agranovskia, I.E., Altmana, I.S., & Braddocka, R.D. (2008). Filter Efficiency as a Function of Nano-Particle Velocity and Shape. Journal of Aerosol Science, 39, 635–644.
Brown, R.C. (1993). Air Filtration: An Integrated Approach to the Theory and Applications of Fibrous Filters. Oxford U.K.: Pergamon.
Chen, C.C., Lehtimäki, M., & Willeke, K. (1993). Loading and filtration characteristics
of filtering facepieces. American Industrial Hygiene Association Journal 54:2, 51–60.

75
Chen, C.C., & Huang, S.H. (1998). The Effect of Particle Charge on the Performance of a Filtering Face-Piece. American Industrial Hygiene Association Journal, 59, 227–233.
Code of Federal Regulations (CFR). (1996). Approval of Respiratory Protective Devices. Title 42, Part 84, pp. 528–593.
Crooks, M. (2007). Nano-Safty and Instrumentation. NanoMicroClub Networking Event. Presented by Crooks (TSI Inc.) 22nd May on Oxford.
Davies, C.N. (1973). Air Filtration. Academic Press, London.
De la Mora, J. F., De Juan, L., Eichler, T., & Rosell, J. (1998). Differential Mobility Analysis of Molecular Ions and nanometer Particles. TrAC Trends in Analytical Chemistry, 17, 328–339.
Department of Health and Human Services (DHHS). (2003). Guidance for Filtration Air Cleaning System to Protect Building Environments from Airborne Chemical, Biological, and Radiological Attacks. Publication 2003–136.
Donaldson, K., Stone, V., Clouter, A., Renwick, L., & MacNee, W. (2001). Ultrafine Particles. Journal of Occupational and Environmental Medicine, 58, 211–216.
Dockery, D.W., & Pope, A.C. (1994). Acute Respiratory Effects of Particulate Air Pollution. Annual Review of Public Health. 15, 107–132.
Dullien, F.A.L. (1989). Introduction to Industrial Gas Cleaning, Academic Press, San Diego.
Eninger, R.M., Honda, T., Adhikari, A., Tanski, H., Reponen, T., & Grinshpun, S.A. (2008). Filter Performance of N99 and N95 Face-Piece Respirators against Viruses and Ultrafine Particles. Annals of Occupational Hygiene, 52, 385–396.
Ensor, D.S., & Hanley, J.T. (1997). Recent Advances in Particulate Air Filter Testing: Quality Assurance Framework; issue of Air Media.
Fjeld, R. & Owens, T. (1988). The Effect of Particle Charge on Penetration in an Electret Filter. IEEE Transactions on Industry Applications, 24, 725–731.
Hagdnagy, W., Stiller-Winkler, R., Kainka, R., Ranft, U., & Idel, H. (1998). Influence of Urban Air Pollution on the Immune System of Children. Journal of Aerosol Science, Supplement 2, S997–S998.
Han, D.H. (2000). Performance of Respirator Filters Using Quality Factor in Korea. Industrial Health Journal, 38, 380–384.
Hinds, W.C. (1999). Aerosol Technology: Properties, Behavior, and Measurement of Airborne Particles. (2nd ed.), NewYork: Wiley.

76
Huang, S.H., Chen, C.W., Chang, C.P., Lai, C. Y., & Chen, C.C. (2007). Penetration of 4.5 nm to 10 µm Aerosol Particles through Fibrous Filters. Journal of Aerosol Science, 38, 719–727.
Ikezaki, K., Iritani, K., Nakamura, T., & Hori, T. (1995). Effect of Charging State of Particles on Electrets. Journal of Electrostatics, 35, 41–46.
Ichitsubo, H., Hashimoto, T., Alonso, M., & Kousaka, Y. (1996). Penetration of Ultrafine Particles and Ion Clusters through Wire Screens. Journal of Aerosol Science, 24, 119–127.
Janssen, L. (2003). Principles of Physiology and Respirator Performance. Occupational Health & Safety, 72, 73–81.
Japuntich, D.A., Franklin L., Pui, D.Y.H., Kuehn, T., Kim, S.C., & Viner, A.S. (2007). A Comparison of Two Nano-Sized Particle Air Filtration Tests in the Diameter Range of 10 to 400 nm. Journal of Nanoparticle Research, 9, 93–107.
Ji, J.H., Bae, G.N., Kang, S.H., & Hwang, J. (2003). Effect of Particle Loading on the Collection Performance of an Electret Cabin Air Filter for Submicron Aerosols. Journal of Aerosol Science, 34, 1493–1504.
Kim, C.S., Bao, L., Okuyama, K., Shimada, M., & Niinuma, H. (2006). Filtration Efficiency of a Fibrous Filter for Nano-Particles. Journal of Nanoparticle Research, 8, 215–221.
Kim, S., Harrington, M., & Pui, D. (2007). Experimental Study of Nano-Particles Penetration through Commercial Filter Media. Journal of Nanoparticle Research, 9, 117–125.
Kousaka, Y., Okuyama, K., Shimada, M., & Takii, Y. (1990). Development of a Method for Testing Very High-Efficiency Membrane Filters for Ultrafine Aerosol Particles. Journal of Chemical Engineering of Japan, 23, 568–574.
Lee, K.W., & Liu, B. (1980). On the Minimum Efficiency and the Most Penetrating Particle Size for Fibrous Filters. Journal of the Air Pollution Control Association, 30, 377–381.
Lowkis, B., & Motyl, E. (2001). Electret Properties of Polypropylene Fabrics. Journal of Electrostatics, 51-52, 232–238.
May, K.R. (1973). The Collison Nebulizer Description, Performance & Application. Journal of Aerosol Science, Vol. 4, #3, pp. 235.
McCullough, N.V., Brosseau, L.M., & Vesley, D. (1997). Collection of Three Bacterial Aerosols by Respirator and Surgical Mask Filters under Varying Conditions of Flow and Relative Humidity. Annals of Occupational Hygiene, 41, 677–690.

77
Miguel, A.F. (2003). Effect of Air Humidity on the Evolution of Permeability and Performance of a Fibrous Filter during Loading with Hygroscopic and Non-Hygroscopic Particles. Journal of Aerosol Science, 34, 783–799. Martin, S.B. & Moyer, E.S. (2000). Electrostatic respirator filter media: filter efficiency and most penetrating particle size effects. Applied occupational and Environmental Hygiene 15, 609–617.
Moyer, E.S., & Stevens, G.A. (1989). ‘‘Worst Case’’ Aerosol Testing Parameters: II. Efficiency Dependence of Commercial Respirator Filters on Humidity Pretreatment. American Industrial Hygiene Association Journal, 50, 265–270.
National Institute for Occupational Safety and Health (NIOSH) and the Bureau of Labor Statistics (BLS). (2003), Respirator Usage in Private Sector Firms. Department of Health and Human Services& Department of Labor.
Nemmar, A., Vanbilloen, H., Hoylaerts, M., Hoet, P., Verbruggen, A., & Nemery, B. (2001). Passage of Intratracheally Instilled Ultrafine Particles from the Lung into the Systemic Circulation in Hamster. American Journal of Respiratory and Critical Care Medicine, 164, 1665–1668.
Nemmar, A., Hoet, P., Vanquickenborne, B., Dinsdale, D., Thomeer, M., Hoylaerts, MF., Vanbilloen, H., Mortelmans, L., & Nemery, B. (2002). Passage of Inhaled Particles into the Blood Circulation in Humans. Circulation, 105, 411–414.
Oberdorster, G. (2000). Toxicology of Ultrafine Particles: in Vivo Studies. Philosophical Transactions of the Royal Society A, 358, 2719–2740.
Oberdorster, G., Sharp, Z., Atudorei, V., Elder, A., Gelein, R., Lunts, A., Kreyling, W., & Cox, C. (2002). Extrapulmonary Translocation of Ultrafine Carbon Particles Following Whole-Body Inhalation Exposure of Rats. Journal of Toxicology and Environmental Health, Part A, 65, 1531–1543.
Oberdorster, G., Sharp, Z., Atudorei, V., Elder, A., Gelein, R., Kreyling, W., & Cox, C. (2004). Translocation of Inhaled Ultrafine Particles to the Brain. Inhalation Toxicology, 16, 437–445.
Oberdorster, G. (2005). Nanotoxicology: An Emerging Discipline Evolving from Studies of Ultrafine Particles. Environmental Health Perspectives, 113, 823–839.
Ostiguy, C., Soucy, B., Lapointe, G., Woods, C. et Ménard, L. (2008). Les Effets Sur La Santé Reliés Aux Nano-Particules, Rapport IRSST R–558, 2e édition.
Otani, Y., Cho, S.J. & Emi, H. (1994). Removal of Nanometer Size Particles and Ions from Air. Proceedings of the 12th ISCC, Yokohama, Japan, pp. 21–25.

78
Pui, D.Y.H. & Kim, S.C. (2006). Penetration of Nano-Particles through Respirator Filter Media. Final Report NIOSH Contract No. 254–2005–M–11698, Mechanical Engineering Department University of Minnesota.
Rengasamy, S., Verbofsky, R., King, W.P., Eimer, B.C., & Shaffer, R.E. (2007). Nano-Particle Penetration through NIOSH-Approved N95 Filtering Face-Piece Respirators. Journal of the International Society for Respiratory Protection, 24, 49–59.
Rengasamy, S., King, W.P., Eimer, B.C., & Shaffer, R.E. (2008a). Filtration Performance of NIOSH-Approved N95 and P100 Filtering Face-Piece Respirators against 4 to 30 Nanometer-Size Nano-Particles. Journal of Occupational and Environmental Hygiene, 5, 556–564.
Rengasamy, S., Eimer, B.C., & Shaffer, R.E. (2008b). Nano-Particle Filtration Performance of Commercially Available Dust Masks. Journal of the International Society for Respiratory Protection, 25, 27–41.
Richardson, A.W., Eshbaugh, J.P. Hofacre, K.C. & Gardner, P.D. (2006). Respirator Filter Efficiency against Particulate and Biological Aerosols under Moderate to High Flow Rates. U.S. Army Edgewood Chemical Biological Center Report for Contract No. SP0700-00-D-3180.http://www.cdc.gov/niosh/npptl/researchprojects/pdfs/CR–085Gardner.pdf.
SCENIHR. (2006). The Appropriateness of Existing Methodologies to Assess the Potential Risks Associated with Engineered and Adventitious Products of Nanotechnologies. Directorate C–Public Health and Risk Assessment. C7–Risk Assessment. Scientific Committee on Emerging and Newly Identified Health Risk.
Shin, W.G., Mulhollandb, G.W., Kim, S.C., & Pui, D.Y.H. (2008). Experimental Study of Filtration Efficiency of Nano-Particles below 20 nm at Elevated Temperatures. Jounral of Aerosol Science, 39, 488–499.
Steffens, J. & Coury, J.R. (2007). Collection Efficiency of Fiber Filters Operating on the Removal of Nano-Sized Aerosol Particles: I–Homogeneous Fibers. Separation and Purification Technology 58, 99–105.
Takenaka, S., Karg, D., Roth, C., Schulz, H., Ziesenis, A., Heinzmann, U., Chramel, P., & Heyder, J. (2001). Pulmonary and Systemic Distribution of Inhaled Ultrafine Silver Particles in Rats. Environmental Health Perspectives, 109, 547–551.
The National Air Filtration Association (NAFA). (2007). Method of Testing General Ventilation Air-Cleaning Devices for Removal Efficiency by Particle Size. User's Guide for ANSI/ASHRAE 52.2. http://www.nafahq.org/LibaryFiles/Articles/Article006.htm. Accessed July 20, 2008.

79
Tran, CL., Buchanan, D., & Cullen, RT. (2000). Inhalation of Poorly Soluble Particles. II. Influence of Particle Surface Area on Inflammation and Clearance. Inhalation Toxicology, 12, 1113–1126.
TSI. (2003). Model 3012A Aerosol Neutralizer Instructions. TSI Incorporated.
TSI. (2005). Model 3936 Scanning Mobility Particle Sizer Spectrometer Instructions. TSI Incorporated.
Wang, H., & Kasper, G. (1991). Filtration Efficiency of Nanometer-Size Aerosol Particles. Journal of Aerosol Science, 22, 31–41.
Wang, C.S. (2001). Electrostatic Forces in Fibrous Filters- A Review. Powder Technology, 118, 166–170.
Warheit, D.B., Webb, T.R., Colvin, V.L., Reed, K.L., & Sayes, C. M. (2007a). Pulmonary Bioassay Studies with Nanoscale and Fine-Quartz Particles in Rats: Toxicity Is Not Dependent Upon Particle Size But on Surface Characteristics. Toxicological Sciences, 95, 270–280.
Warheit, D.B., Webb, T.R., Reed, K.L., Frerichs, S., & Sayes, C. M. (2007b). Pulmonary Toxicity Study in Rats with Three Forms of Ultrafine-TiO2 Particles: Differential Responses Related to Surface Properties. Toxicological Sciences, 230, 90–104.
Wiedensohler, A. (1998). An Approximation of the Bipolar Charge Distribution for Particles in the Submicron Size Range. Journal of Aerosol Science, 19, 387–389.
Woon, W., Leung, F., & Hunga, C.H. (2008). Investigation on Pressure Drop Evolution of Fibrous Fiter Operating in Aerodynamic Slip Regime under Continuous Loading of Sub-Micron Aerosols. Separation and Purification Technology, 63, 691–700.
Yang, S., & Lee, G.W.M. (2005). Filtration Characteristics of a Fibrous Filter Pretreated with Anionic Surfactants for Mono-disperse Solid Aerosols. Journal of Aerosol Science, 36, 419–437.

80
APPENDIX A: AEROSOL GENERATION SYETEM
The aerosol generation systems should have a good particle size distribution and a stable
particle output. Three major measurement techniques are commonly applied in aerosol
research studies as a generation system. These techniques are: Electro-Spray, Jet
Collision Nebulizer and Traditional Evaporation Condensation Method.
In this study, due to its simplicity and efficiency, the Jet Collision Nebulizer technique
has been employed for generating submicron aerosols, fed with sodium chloride, to
challenge N95 filtering face-piece respirators. This generation system technique has been
first used by Collision in 1935 in the scientific investigations (May, 1973). As shown in
figure A-1, after passing a compressed- clean air through the liquid (supplied in 1 liter
glass jar), the solution is drawn into high velocity jet section, where it is atomized and
evaporated in to droplets. Then, to remove the large droplets coming out from the jet
section, the liquid/gas is impacted with a barrier across from the jet. Finally, the sprayed
droplets exit the atomizer from the aerosol outlet at top. For more detailed information,
see the BGI manual for the 3, 6 and 24- Jets Collision Nebulizer.

81
Figure A-1: Schematic digram of Collision Nebilizer model Waltham. MA. Adapted
from BGI, Inc., 2002.

82
APPENDIX B: NANO-PARTICLE MEASURING
INSTRUMENT
Various measurement techniques have been developed to determine the characteristics of
NPs. These methods include: mass concentration, number concentration and size
distribution. As mentioned earlier, the Scanning Mobility Particle Sizer (SMPS) has been
employed in this study to measure the particle concentration and size distribution based
on the particle electrical mobility (inversely proportion to the particle diameter). This
advanced technique is capable to measure particles ranged from 4 to 10000 nm.
The SMPS mainly consists of particle size classifier (Electrostatic classifier with DMA)
and particle detector (UCPC). Particle size classifier classifies the charged particles based
on their electrical mobility (or electrical mobility diameter). Particles with a narrow range
of electrical mobility are able to exit from DMA and then counted by the Ultrafine
Condensation Particle Counter (UCPC).
Particle Size Classifier
Figure B-1 shows the schematic diagram of the electrostatic classifier with long DMA
(model 3081, TSI Inc.). In this system, to provide a bipolar equilibrium charge on the
aerosols, the aerosol flow is first passed through a radioactive bipolar charger in the
Electrostatic Classifier before entering the DMA. Then, the particles are selected in DMA
according to their electrical mobility.

83
As shown in the figure, the DMA contains an outer, grounded cylinder and an inner
cylindrical electrode which is connected to a negative power supply (0 to 10 KV- DC).
The electric field between the two concentric cylinders separates the particles according
to their electrical mobility (which is inversely related to the particle size). Particles with
the negative charge(s) are deposited on the outer wall, whereas those with positive
charge(s) move rapidly towards the negatively- charged center electrode. Only size
selected particles within a narrow range of electrical mobility have the correct trajectory
to exit DMA. The electrical mobility of these selected particles is affected by various
parameters including the flow rates, geometric parameters and the voltage of the center
electrode. The size selected particle stream exiting from DMA is then counted by the
Ultrafine Condensation Particle Counter (UCPC).

84
Figure B-1: Schematic diagram of the Electrostatic classifier with long DMA, model
3081. Adapted from TSI Inc., 2005.
Particle size distributions are measured by changing the voltage between the inner and
outer cylindrical electrodes in the DMA, which changes the electrical field. DMA voltage
(V) is corresponded to the electrical mobility, Z, and mobility diameter, d, by the
following equation:

85
2
5.0
1
2 441.0
2
)(ln
pdM
Tk
LVRR
QZ
B ⎟⎠⎞
⎜⎝⎛
=Π
=
Where R1 and R2 are the inner and outer radius of the DMA, L is the DMA length from
inlet to outlet slit, Q is the carrier gas flow rate, k is the Boltzmann constant, and T, p,
and M are the temperature, pressure and molecular weight of the carrier gas (Fernandez
de la Mora et al., 1998). For more specific information, review the TSI manual for series
3080 electrostatic classifiers.
Ultrafine Condensation Particle Counter (UCPC)
Ultrafine Condensation particle counter (UCPC) is normally used as a part of Scanning
Mobility Particle Sizer (SMPS) to count the number of particles greater than a few
nanometers in diameter. Particle detection and counting is provided by a simple optical
detector after a supersaturated vapor of 1-butanol condenses on the particles, causing
them to grow larger.

86
Figure B-2: Schematic diagram of Ultrafine Condensation Particle Counter, model 3775.
Adapted from TSI Inc., 2005.
In the UCPC, single particles larger than 2 nm are grown to micrometer size by means of
condensation of a fluid (alcohol or water) on the particles. The CPC then optically counts
these particles. For more detailed information, review the TSI manual for the Ultrafine
Condensation Particle Counter (UCPC), model 3775.

87
APPENDIX C: PARTICLE NEUTRALIZER
To evaluate the filtration efficiency tests in a worst case scenario, the particles are
required to be charge neutralized before entering the test chamber. This is especially vital
when the generated particles carry a considerable amount of charge. To minimize this
problem, a neutralizer instrument (3012A Model, TSI Inc.) is applied to either eliminate
or reduce the possible positive and negative charges carried by the particles.
As the particles enter the neutralizer, they become exposed to the positive and negative
air ions. The air ions are attracted to the oppositely charged particles causing the level of
possible charge on the particles to reduce significantly.
Figure C-1: Model 3012A Aerosol Neutralizer. Adapted from TSI Inc., 2003.
By providing sufficient residence time, the Boltzmann charge equilibrium will be
obtained for the particles. The following table displays an approximation of the charge
distribution for the particles in nano size range, carried out by the Wiedensohler, (1998).
In spite of particle neutralization, a portion of the particles still carry some charges which
becomes greater at larger particle size. Notes, the 3012A model aerosol neutralizer

88
applies a radioactive source (10 milligrams of Kr-85) to provide negative and positive air
ions.
Table C-1: Distribution of charges on aerosol according to Gunn Formula
(Wiedensohler,1998).
Percent of Particle Carrying Np Elementary Charge Units
Dp(µm) -6 -5 -4 -3 -2 -1 0 +1 +2 +3 +4 +5 +6
0.01 5.14 90.75 4.11
0.02 0.02 10.96 80.57 8.64 0.01
0.04 0.54 19.50 64.79 14.86 0.31
0.06 0.02 1.92 24.32 54.13 18.51 1.09 0.01
0.08 0.11 3.72 26.81 46.73 20.46 2.10 0.05
0.10 0.37 5.63 27.31 42.28 20.91 3.30 0.17
0.20 0.05 0.53 3.40 12.38 25.49 29.66 19.51 7.26 1.53 0.18 0.01
0.40 0.27 1.14 3.60 8.54 15.24 20.46 20.65 15.66 8.93 3.83 1.24 0.03 0.05
0.60 1.21 3.00 6.19 10.53 14.82 17.25 16.60 13.20 8.69 4.73 2.13 0.79 0.24
0.80 2.42 4.64 7.71 11.12 13.90 15.06 14.15 11.53 8.15 4.99 2.65 1.22 0.49
1.00 3.56 5.84 8.53 11.13 12.96 13.45 12.46 10.30 7.59 5.00 2.93 1.54 0.92

89
APPENDIX D: PARTICLE SIZE DISTRIBUTION AT
UPSTREAM
Figure D-1: Particle concentration as a function of particle size at different pressures (135
liters/min and 0.01% NaCl solution).
0.0
0.2
0.4
0.6
0.8
1.0
6 10 16 27 45 74 122 200
Num
ber
Con
c. (x
E06
)
Particle Size, Dp (nm)
15 psi
25 psi
30 psi
35 psi

90
Figure D-2: Particle concentration as a function of particle size at different pressures (135
liters/min and 0.1% NaCl solution).
Figure D-3: Particle concentration as a function of particle size at different pressures (135
liters/min and 0.1% NaCl solution).
0.0
0.3
0.6
0.9
1.2
1.5
6 10 16 27 45 74 122 200
Num
ber
Con
c. (x
E06
)
Particle Size, Dp (nm)
15 psi
25 psi
30 psi
35 psi
0.0
0.4
0.8
1.2
1.6
2.0
6 10 16 27 45 74 122 200
Num
ber
Con
c. (x
E06
)
Particle Size, Dp (nm)
15 psi
25 psi
30 psi
35 psi

91
Figure D-4: Particle concentration as a function of particle size at different pressures (270
liters/min and 0.01% NaCl solution).
Figure D-5: Particle concentration as a function of particle size at different pressures (270
liters/min and 0.1% NaCl solution).
0.0
0.2
0.4
0.6
0.8
1.0
6 10 16 27 45 74 122 200
Num
ber
Con
c. (x
E06
)
Particle Size, Dp (nm)
15 psi
25 psi
30 psi
35 psi
0.0
0.3
0.6
0.9
1.2
1.5
6 10 16 27 45 74 122 200
Num
ber
Con
c. (x
E06
)
Particle Size, Dp (nm)
15 psi
25 psi
30 psi
35 psi

92
Figure D-6: Particle concentration as a function of particle size at different pressures (270
liters/min and 1% NaCl solution).
Figure D-7: Particle concentration as a function of particle size at different pressures (360
liters/min and 0.01% NaCl solution).
0.0
0.5
1.0
1.5
2.0
2.5
6 10 16 27 45 74 122 200
Num
ber
Con
c. (x
E06
)
Particle Size, Dp (nm)
15 psi
25 psi
30 psi
35 psi
0.0
0.1
0.2
0.3
0.4
0.5
6 10 16 27 45 74 122 200
Num
ber
Con
c. (x
E06
)
Particle Size, Dp (nm)
15 psi
25 psi
30 psi
35 psi

93
Figure D-8: Particle concentration as a function of particle size at different pressures (360
liters/min and 0.1% NaCl solution).
Figure D-9: Particle concentration as a function of particle size at different pressures (360
liters/min and 1% NaCl solution).
0.0
0.2
0.4
0.6
0.8
1.0
6 10 16 27 45 74 122 200
Num
ber
Con
c. (x
E06
)
Particle Size, Dp (nm)
15 psi
25 psi
30 psi
35 psi
0.0
0.2
0.4
0.6
0.8
1.0
1.2
6 10 16 27 45 74 122 200
Num
ber
Con
c. (x
E06
)
Particle Size, Dp (nm)
15 psi
25 psi
30 psi
35 psi