![DPI611 User Manual K0571[1]...• Safety and Quick Start Guide • Stylus 1.2 OBSERVANCE OF THE USER MANUAL This manual contains safety and battery installation information for the](https://static.fdocuments.in/doc/165x107/5e794ed6ad2cc566a8424cc1/dpi611-user-manual-k05711-a-safety-and-quick-start-guide-a-stylus-12.jpg)
Development of a new road safety strategy for Western ......such as speed limit observance,...
53
Bruce Corben David B. Logan Ian Johnston Peter Vulcan DEVELOPMENT OF A NEW ROAD SAFETY STRATEGY FOR WESTERN AUSTRALIA 2008–2020 Report No. 282 June 2008
Transcript of Development of a new road safety strategy for Western ......such as speed limit observance,...

Bruce Corben David B. Logan
Ian Johnston Peter Vulcan
D E V E L O P M E N T O F A N E W R O A D S A F E T Y S T R AT E G Y
F O R W E S T E R N A U S T R A L I A 2 0 0 8 – 2 0 2 0
Report No. 282
June 2008

ii Monash University Accident Research Centre

Development of a new road safety strategy for Western Australia, 2008-2020
Monash University Accident Research Centre iii
MONASH UNIVERSITY ACCIDENT RESEARCH CENTRE REPORT DOCUMENTATION PAGE
Report No. Date ISBN ISSN Pages 282 June 2008 0 7326 2352 9 1835-4815 (online) 53
Title and subtitle: Development of a new road safety strategy for Western Australia, 2008-2020 Author(s): Corben B.F., Logan D.B., Johnston I.R., Vulcan, A.P. Sponsoring Organisation: Office of Road Safety, Department of The Premier and Cabinet, Western Australia Abstract: The Western Australian government decided to take a bold approach by developing a new road safety strategy in full accord with the principles of the Safe System. With the assistance of a mathematical model developed by the Monash University Accident Research Centre, comparisons were made of cumulative serious casualties potentially saved for various combinations of Safe System elements, namely safe roads and roadsides, safe speeds, safe vehicles and safe road use. An ambitious combination of these initiatives was established in order to deliver major reductions in serious road trauma throughout Western Australia. If adopted fully, annual serious casualties are estimated to fall to around 50% of their 2006 levels by 2020.
Key Words:
Safe System, Vision Zero, computer modelling, prediction, serious casualties, strategy performance, road safety
Disclaimer
This report is disseminated in the interest of information exchange. The views expressed here are those of the authors, and not necessarily those of Monash University
Reproduction of this page is authorised Monash University Accident Research Centre Building 70, Monash University, Victoria, 3800, Australia. Telephone: +61 3 9905 4371, Fax: +61 3 9905 4363

Acknowledgements
Thanks to Christine Mulvihill and Angela Clapperton, of MUARC, for their time and effort spent in extracting valuable supplementary data. The dedication and enthusiasm the entire team at the Western Australian Office of Road Safety were very much appreciated during our frequent visits during the preparation of the proposed strategy. Their unflagging commitment to achieving the best possible outcomes and willingness to accommodate new ideas was admirable. Finally, the success of any ambitious road safety strategy is heavily dependent upon the involvement and commitment of the road authority. Many thanks go to all of those we had the pleasure of working with at Main Roads Western Australia, tolerating our endless queries with great patience!
iv Monash University Accident Research Centre

Development of a new road safety strategy for Western Australia, 2008-2020
Contents
ACKNOWLEDGEMENTS................................................................................................... IV
CONTENTS............................................................................................................................. V
EXECUTIVE SUMMARY.................................................................................................. VII
BACKGROUND................................................................................................................VII
THE SAFE SYSTEM.........................................................................................................VII
APPROACH TO DEVELOPING THE OPTIMAL STRATEGY...................................... IX
MODELLING ..................................................................................................................... XI
MODEL STRUCTURE......................................................................................................XII
RESULTS...........................................................................................................................XII
SUMMARY ..................................................................................................................... XIII
1 DESCRIPTION OF ASSIGNMENT .............................................................................. 1
2 THE SAFE SYSTEM ....................................................................................................... 2
3 OVERALL APPROACH................................................................................................. 4
4 SAFE SYSTEM MATRIX............................................................................................... 7
4.1 SAFE ROADS & ROADSIDES.............................................................................. 7
4.2 SAFE SPEEDS ........................................................................................................ 8
4.3 SAFE VEHICLES ................................................................................................... 8
4.4 SAFE ROAD USE................................................................................................... 9
5 MODELLING APPROACH ......................................................................................... 11
5.1 MODEL DESCRIPTION ...................................................................................... 12
5.2 KEY ASSUMPTIONS........................................................................................... 12
5.3 MODEL OUTPUTS .............................................................................................. 13
5.4 FACTORS AFFECTING FORECASTING.......................................................... 13
5.5 SENSITIVITY ANALYSIS .................................................................................. 15
6 STRATEGY ASSESSMENT......................................................................................... 16
6.1 THE PREFERRED STRATEGY .......................................................................... 16
6.2 OUTCOMES.......................................................................................................... 18
6.3 SENSITIVITY ....................................................................................................... 19
6.4 COVERAGE OF HIGH PRIORITY PROBLEMS ............................................... 20
6.5 STRATEGY ALTERNATIVES............................................................................ 23
6.6 ADDITIONAL INITIATIVES .............................................................................. 24
7 STRATEGY DELIVERY .............................................................................................. 26
Monash University Accident Research Centre v
vi Monash University Accident Research Centre
7.1 IMPLEMENTATION............................................................................................ 26
7.2 MONITORING AND REVIEW............................................................................ 27
7.3 METRICS FOR MONITORING SERIOUS CASUALTIES................................ 27
7.4 CONTINUOUS INNOVATION ........................................................................... 28
7.5 KEY COMMITMENTS AND PROFESSIONAL DEVELOPMENT.................. 28
8 CONCLUSION ............................................................................................................... 29
9 REFERENCES ............................................................................................................... 30
APPENDIX A: DESCRIPTION OF GEOGRAPHIC AREAS ........................................ 33
APPENDIX B: MODEL KEY ASSUMPTIONS................................................................ 35

Development of a new road safety strategy for Western Australia, 2008-2020
EXECUTIVE SUMMARY
Background
The Western Australian government and Road Safety Council have undertaken to develop a new road safety strategy for the period 2008 to 2020 within the Safe System or Vision Zero frameworks. Other than in Sweden and the Netherlands, where Vision Zero and the Sustainable Safety concepts originated, such systematic development has not been tried elsewhere in the world. This project, therefore, should be recognised as a highly-challenging initiative. The proposed 12-year strategy, subject to successful implementation, can be expected to deliver large and lasting road safety benefits for Western Australia. A key aspect of the approach was to develop a model to encompass the projected benefits of a combination of best-practice Safe System countermeasures. The METS (Macro Estimates for Target Setting) model was developed for Victoria and, with the permission of VicRoads, the underlying model structure was used as the basis for substantial further development, culminating in METS-WA. Given the challenge of implementing such an ambitious approach, the Road Safety Council determined that the strategy should be developed in a consultative and transparent way to maximise stakeholder and community acceptance. The Road Safety Council undertook an extensive consultation process parallel to MUARC’s modelling work. The consultation had as its basis the fundamental belief that the community should be provided with the best evidence about what works, no matter how controversial, so that it can debate and consider the options available to improve safety. The consultation process is the subject of separate reports available from the WA Office of Road Safety. The Safe System
Australasia’s Safe System road safety philosophy requires a profound shift in thinking and insight in society’s efforts to curb road trauma. Translating the philosophy and principles into real-world practice has the potential to deliver major advances in the safety performance of Australia’s road transport system over coming years and decades. Of the highly motorised countries, Sweden and the Netherlands lead the world in road safety performance and, during the mid to late 1990’s, each created and adopted fundamentally new approaches to reducing road trauma. While these philosophies differ in their relative emphases, they are both founded on a strong ethical platform and both acknowledge the vital importance of recognising the limitations of humans in the road-transport system and both place substantial accountability with the system designers1 and operators. The Australasian formulation of the Safe System philosophy combines the best elements of Sweden’s “Vision Zero” and the Netherlands “Sustainable Safety” road safety philosophies. Like its Swedish and Dutch counterparts, Australasia’s Safe System philosophy also aspires to prevent death and serious injury within its road transport systems. While some will regard this goal as unrealistic, it is important to realise that:
Designing and operating a system that tolerates consistently high levels of serious trauma is both unethical and at risk of perpetuating the acceptance of failure by system designers and operators;
New, fundamentally safe designs will result from viewing the safety of the road transport system in this new light. Fundamentally safe designs and protocols for operation can shift system safety a large step forward, in contrast with the incremental progress characterising traditional approaches.
1 For a definition of this role, refer to p. 2.
Monash University Accident Research Centre vii
The Safe System concept comprises four key principles: 1. The limits of human performance – Traditional approaches to road safety focus heavily
on preventing human failures within the system. For example, there has been marked progress with programs targeting drink driving, speeding, and restraint use. However, despite this partial success, these and other forms of human failure, such as poor gap selection at complex or simple intersections or while overtaking, failure to stay within travel lanes, even on high speed high standard roads, and driving while fatigued, have so far proven beyond our capabilities to eliminate through behaviour change programs. A guiding philosophy that explicitly acknowledges the intrinsic capabilities of humans is essential to future success. Note that this guiding philosophy still requires road users to behave responsibly.
2. The limits of human tolerance to violent forces – Humans are limited in their biomechanical tolerance to the violent forces and energy exchanges that commonly occur in traffic crashes. When tolerance limits are exceeded serious injury or death results. The Safe System explicitly acknowledges these limits by seeking to create a road transport system in which foreseeable collisions invoke forces within the biomechanical limits of the humans involved. To achieve this in practice, the ability of a vehicle to protect its occupants in common crash types and at typical impact speeds (resulting from legal travel speeds) must be known and taken into account in decisions about system design and operation. So too is it vital to understand the biomechanical limits of unprotected road users (e.g. pedestrians, bicyclists and motorcyclists) in collisions across the full range of vehicle types and speed zones.
3. Shared responsibility – Traditionally, the majority of road safety responsibility has been placed upon the individual road user. Under this new approach, ultimate responsibility for the safety performance of the road transport system resides with the system designers and operators. However, it is only possible to move progressively towards a situation of no deaths or serious injuries in the long term provided road users comply with key behaviours such as speed limit observance, restraint use, driving unimpaired and in use of vehicles with good safety features.
Thus, the system designers depend on compliance by road users for achieving a truly safe system, while individual, complying users depend on inherently safe design standards and operation for their safety.
4. A forgiving road transport system – The road transport system is, fundamentally, a real-world illustration of the basic laws of nature governing the movement of objects, be they vehicles or humans, relative to the physical environment. How these objects interact is, ultimately, a matter of physics varied in time and space according to human intervention, which is particularly difficult to predict or control.
Safe outcomes are largely determined by the ability of individual road users to moderate kinetic energy, which is the physical energy gained by an object (usually a vehicle) as a result of its motion. Kinetic energy is a function of both the mass of an object and, more importantly, its speed at any instant in time. Unlike mass, which is linearly related to kinetic energy, speed has a squared (i.e. 2nd power) relationship with kinetic energy. A safe road transport system depends on the successful separation of sources of kinetic energy (crash avoidance) and, where this cannot be achieved, the controlled dissipation of kinetic energy to avoid exceeding human biomechanical limits (injury prevention or mitigation). Given the inherent limitations of human performance within the road transport system, the Safe System seeks to create roads and roadsides that are tolerant of human error and reasonable levels of impairment. This is achieved by ensuring that sources of kinetic energy
viii Monash University Accident Research Centre

Development of a new road safety strategy for Western Australia, 2008-2020
remain separated or, in worst cases, can be managed within the limits of human tolerance to serious injury. A major challenge for the future is to identify and implement current initiatives that meet this goal, as well as to generate new initiatives consistent with these Safe System principles. Approach to Developing the Optimal Strategy
To facilitate the identification of the best mix of initiatives for Western Australia’s next road safety strategy, the concept of a “Safe System Matrix” was created. The matrix aimed to focus resources on a relatively small number of large and severe problems, using proven, high-impact solutions. This approach still permits other problems of lower priority to be addressed, but at a level commensurate with the potential savings in serious trauma. The Safe System Matrix served two important purposes: 1. It provided a systematic, structured approach to identifying strategically important road
safety initiatives, consistent with the principles of the Safe System. In particular, it ensured that each of the main components of the Safe System, namely, safe roads and roadsides, safe travel speeds, safe vehicles and safe road use, were comprehensively addressed within the strategy.
2. The Matrix was structured to ensure that the differing road safety problems and priorities between Western Australia’s three main geographic areas – Metropolitan Perth, Regional WA and Remote WA – could be more precisely targeted within the strategy to meet their differing needs. ‘Regional WA’ approximately represents the road network within a 300 km radius of metropolitan Perth, while ‘Remote WA’ encompasses the rest of the state. These divisions were chosen to acknowledge the substantial differences in road, vehicle and other characteristics between each of these areas.
Safe Roads and Roadsides
This aspect consists of countermeasures aimed at improving the safety of roads and roadsides. It allows for the continuation of existing Accident Black Spot and Safer Roads programs across the whole of WA, provided the selected sites and routes do not overlap with the specific regional and remote treatments detailed below. One of the key countermeasures proposed for metro Perth was a ‘Safe System Transformation’ of intersections. This would involve the implementation of such measures as roundabouts, full control of right turns at signals, combination red light/speed cameras and others at key intersections. It is also recommended that ongoing research be conducted into the development of new barrier solutions for urban applications. In addition to the whole of WA programs, a Safe System Transformation is proposed for major routes radiating from Perth. This aims to address the run-off-road and potentially, head-on, crash problem on key strategic routes from the metro Perth boundary as far out into regional WA as practicable. A similar strategy could be adopted for key rural centres. Traditionally, specific road sections would be treated on the basis of crash history. In the case of a Safe System Transformation, however, the goal would be to start from the metro end of each route (where crash densities tend to be higher) and work outwards ‘injury-proofing’ entire road lengths rather than individual sections which happen to have experienced injury producing crashes in the past.
Safe Speeds
Reducing travel speeds across Western Australia is one area where significant serious casualty savings are possible at relatively low cost. This is particularly true for a very large, sparsely populated state like Western Australia where, in the foreseeable future, it will be practically impossible to provide best-practice infrastructure solutions across much of the
Monash University Accident Research Centre ix

state. For the whole of WA, a program of enhanced enforcement of speed limits is recommended, involving measures such as better targeted police coverage and increased use of speed cameras. It is also recommended that a systematic program of ‘fine tuning’ of existing speed limits be pursued, particularly in metropolitan Perth as well as regional and remote centres. This involves redefining the start of a new speed limit to ensure that hazardous sites, such as intersections or high risk curves, fall within the lower speed limit. In addition to the above measures, two speed-related countermeasures are recommended for metro Perth. The first of these is to reduce urban speed limits from 60 km/h to 50 km/h. Currently, 27% of all serious casualties occur in 60 km/h speed zones within the metropolitan area and small reductions in travel speed would lead to significant serious casualty savings. Another situation where speed limits are too high to meet Safe System aspirations is in areas of high pedestrian activity, such as the Perth central business district and suburban strip shopping centres. It is therefore recommended that these areas be rezoned to 40 or even 30 km/h to improve Safe System compatibility in both avoiding and mitigating pedestrian-vehicle conflicts. In regional WA, it is recommended that speed limits be reduced by 10 km/h, with progressive reinstatement possible as the Safe System Transformation program is completed along the selected key routes. It is also deemed highly desirable for the state open road speed limit to be reduced from 110 km/h to 100 km/h, where the vast majority of roads may never be practically able to be brought up to Safe System standards.
Safe Vehicles
This component of the strategy aims to capitalise on the proven safety performance of a number of vehicle safety features that, in general, are not currently fitted as standard on many vehicles available on the Australian market. These features include electronic stability control (ESC) and intelligent speed assist2 (ISA), which help to prevent crashes occurring and side impact and curtain air bags, and active head restraints, which help to reduce occupant injury severity when a crash occurs. This initiative aims to accelerate the introduction of these features into Western Australia’s vehicle population by requiring government fleet purchasers to specify selected features when renewing the government fleet and by encouraging corporate fleet purchasers to do likewise. Not only will this approach accelerate the take-up of these proven features in WA vehicle fleets, it will also put much-needed pressure on vehicle manufacturers to provide these features as standard in new vehicles, or at least as options that can be specified as standalone features in their base models. These benefits will flow on to private vehicle purchasers as government and fleet vehicles are turned over to the general fleet. Based on current and proposed levels of availability of the above features, a timeline for their introduction to government and corporate fleet purchases is proposed.
Safe Road Use
For a best practice strategy for WA, the safe road use component would involve the creation of an integrated suite of campaigns that present and promote the Safe System road safety philosophy as well as targeting traditional and new problem areas. The main features would include:
An emphasis on the Safe System being a new, ambitious approach capable of achieving major improvements in traffic safety over the next decade and beyond;
2 The speed reductions resulting from the fitment of Intelligent Speed Assist (also known as Intelligent Speed Adaptation) systems provide increased opportunities for crash avoidance as well as mitigating injury severity in the event of a crash. For example, see Carsten & Tate (2005).
x Monash University Accident Research Centre
Development of a new road safety strategy for Western Australia, 2008-2020
The importance of shared responsibility, with road users to comply with key laws including drink driving, drug driving, seat belt use and fatigue driving. Correspondingly, the system designers and operators have an obligation to create a low risk road transport system, in which there is no death or serious injury, provided users comply with key traffic laws.
A series of problem-specific education, promotion and publicity campaigns targeting key problem types amenable to improvement through behaviour change programs including drink-driving, drug-driving, speeding, restraint use, distraction/inattention and fatigue driving. Furthermore, as part of each issue-specific campaign, there would be ongoing reinforcement of Safe System principles and the concept of shared responsibility. Also of critical importance is the need for institutional behaviour change, with the prime purpose of supporting professionals within the agencies to understand better the shift in responsibilities necessary for strategy success.
Modelling
Central to the overall approach to developing an optimal road safety strategy for Western Australia was the modelling of proposed strategy performance using evidence-based estimates of the effectiveness of the individual road safety initiatives described in the previous section as well as combinations of initiatives. The modelling approach operates at a macro level and so includes only those initiatives expected to have a sizeable impact on the reduction in severe road trauma. Using evidence-based estimates of effectiveness and actual crash data for Western Australia over recent years, the model used mathematical methods to forecast future savings in serious casualties in each year of the 12-year period from 2008 to 2020. These predicted savings in serious casualties were summed over the strategy life for each individual initiative, assuming it alone was implemented. These savings were also summed for combinations of initiatives implemented as part of a strategy, allowing differentiation between options in terms of their potential contribution to preventing road fatalities and serious injuries. The total number of serious casualties prevented over the life of the strategy was used as the principal measure of strategy worth. These savings were estimated relative to the level of serious casualties that could be expected to occur in the absence of a significant road safety strategy. The forecasting task was a challenging exercise, with some levels of uncertainty and the need to make assumptions about the underlying nature of the road transport system into the future. The approach taken with modelling for the WA strategy attempted to account for two main, whole-of-system, influences:
Future growth in serious casualties as a result of increasing exposure, reflected by vehicle kilometres travelled (VKT);
Future reductions in serious casualty rates due to the total effect of a series of road safety measures introduced, too small to be individually measured, and the gradual effects of increasing motorisation.
Together, the combined effect of traffic growth and serious casualty reduction due to increased motorisation was used to define a continuous point of reference against which potential savings in serious casualties due to the proposed strategy and its individual elements were estimated. The model produced two principal outputs: 1. The estimated total number of serious casualties saved over the life of the strategy
(relative to the forecast numbers of serious casualties in the absence of a significant strategy).
2. The percentage reduction in serious casualties in the final year of the strategy compared with the most recent year for which full serious casualty data were available.
Monash University Accident Research Centre xi
The total number of serious casualties saved over the life of a strategy can be used to identify the most effective combination of different strategy options, while the percentage reduction in Year 12 provides a target for achievement by the end of the strategy (and at intermediate milestones throughout). Model Structure
The METS (Macro Estimates for Target Setting) model was originally developed over a period of 16 months from early 2006, funded by VicRoads to support the development of the new Victorian road safety strategy. The Western Australian version, METS-WA, was based on the most recent version of METS, with further development and significant customisation to tailor it to the Western Australian road safety environment. The model was a numerical implementation of concepts developed in the late 1990s by MUARC researchers, principally Peter Vulcan. It started with a base number of annual serious casualties (killed and hospitalised) derived from Western Australian police-reported data. The effectiveness of individual countermeasures in reducing the proportion of total serious casualties – derived from appropriate scientific studies – was used to predict serious casualty numbers from the effects of the countermeasure in isolation for each year for the duration of the strategy. The aforementioned underlying trends were also taken into account. Individual countermeasures were then combined, either additively or multiplicatively as appropriate, into strategy ‘packages’. A unique feature of METS-WA is its ability to allow different levels and combinations of initiatives to be relatively easily compared. The key assumptions underpinning the modelling process for each Safe System component were derived from either reliable agency-supplied statistical data or the results of sound research. For a number of other variables, conservative consensus estimates were used, based on the best evidence available at the time. In addition to the two principal outputs of the model, namely, cumulative numbers of serious casualties saved over the life of the strategy and; performance of the strategy in its final year, the model also provides approximate indications of (a) total strategy cost; (b) cost per serious casualty saved; (c) the monetary savings to society resulting from the serious casualty savings and; (d) the ratio of monetary savings to strategy cost. Results
Recommended Safe System strategy
The relative performance of each of the groups of initiatives was estimated in terms of the projected cumulative serious casualties estimated over the 12-year life of the strategy for infrastructure (safer roads and roadsides), enhanced enforcement, speed limit reductions, vehicle safety measures and an aggregate behaviour change program. The individual initiatives were combined to create the Optimum Safe System Option. This was estimated to yield cumulative savings of some 16000 serious casualties over the 12-year duration of the strategy, reducing annual serious casualties from approximately 3000 in 2006 to around 1420 serious casualties per annum by Year 12 in 2020. This represents a 52% reduction in serious casualties compared with 2006. By the conclusion of Year 12, the model predicts that the number of annual state-wide fatalities could be as low as 100. As traffic growth has a significant influence on model outputs, as well as being less predictable than other variables, a range of traffic growth figures were investigated. The effect of lower traffic growth is to improve the performance of the strategy, while higher traffic growth results in greater cumulative serious casualty savings, but worse strategy performance overall, highlighting one of the potential risks in strategy implementation.
xii Monash University Accident Research Centre

Development of a new road safety strategy for Western Australia, 2008-2020
Monash University Accident Research Centre xiii
Strategy Alternatives
Several variations to the Safe System strategy were modelled in order to investigate some of the delays that might eventuate prior to full strategy implementation. Delays in individual Safe System component were modelled while holding the others at the levels specified by the Optimal Safe System Option. This enabled estimates to be made of savings in serious casualties foregone as a result of delays in implementation. These lower serious casualty savings ranged from around 600 to 1400 over the life of the strategy depending upon the Safe System component. Delays in more than one initiative concurrently were not investigated, but would have a combinative effect. Summary
The Western Australian government decided to take an ambitious approach by developing a new road safety strategy in accordance with the principles of the Safe System. With the assistance of a mathematical model developed by the Monash University Accident Research Centre, the cumulative serious casualty savings were compared for a full range of best-practice Safe System options drawn from safe roads and roadsides, safe speeds, safe vehicles and safe road use. An optimal combination of these initiatives was proposed with the intention of delivering major reductions in serious road trauma throughout Western Australia. If adopted fully, annual serious casualties are estimated to fall to around 50% of 2006 levels by 2020.


Development of a new road safety strategy for Western Australia, 2008-2020
Monash University Accident Research Centre 1
Description of Assignment
This report details the development of a comprehensive road safety strategy for Western Australia for the period 2008 to 2020. Strategy development has been explicitly anchored in the Safe System and Vision Zero frameworks. Such a systematic approach has not been undertaken elsewhere in the world. In Sweden, where the Vision Zero concept was created, it has served primarily as a philosophical underpinning for individual innovations. This project, therefore, should be recognised as an ambitious, highly-challenging initiative. The proposed 12-year strategy, if successfully implemented, can be expected to deliver large and lasting road safety benefits for Western Australia and, ultimately, the rest of Australia. The project has been undertaken in seven key stages: 1. Identify relevant information about the political, economic, social and technological
environments in Western Australia as they relate to road safety;
2. Assess the current position of road safety in Western Australia, including a review of the progress of the ‘Arriving Safely’ strategy for 2003 to 2007;
3. Provide a set of realistic targets for the achievement of outcomes towards Vision Zero over the 2008-2020 timeframe and for shorter periods as part of a set of rolling action plans;
4. Analyse the costs and benefits of different road safety measures within the ‘safer systems’ framework;
5. Provide a series of strategic directions and options for consideration by stakeholders and the community as part of the consultation and community engagement processes;
6. Provide a description of proven countermeasures that are framed around the ‘safe systems’ framework; and
7. Provide advice on the roll out of initiatives over the 12-year period and the ramifications of not commencing initiatives or meeting targets as recommended.
The purpose of this report is to document the results of the seven stage process, by reporting specifically on Stages 3 to 7, while taking into account Stages 1 and 2, for which separate reports have been prepared.
The Safe System
Australasia’s Safe System road safety philosophy requires a profound shift in thinking and insight into society’s efforts to curb road trauma. Translating the philosophy and principles into real-world practice has the potential to deliver major advances in the safety performance of Australia’s road-transport system over coming years and decades. Of the highly motorised countries, Sweden and the Netherlands lead the world in road safety performance. During the mid to late 1990’s both countries created and adopted fundamentally new and ambitious approaches to reducing road trauma. While differing in their relative emphases, both are founded on a strong ethical platform and acknowledge the vital importance of recognising the limitations of humans in the road-transport system. The Swedish and Dutch philosophies also place substantial accountability with the system designers and operators. In this context, the system designers and operators are defined as those individuals in the road authorities who have direct professional responsibility for standards-setting and service delivery across the full range of activities involved in the road transport system. These activities include planning, design, construction, operation, traffic management and maintenance for both roads and roadsides. Also included are registration and licensing services that determine the conditions of user access to the road transport system. The Australasian formulation of the Safe System combines the best elements of Sweden’s “Vision Zero” and the Netherlands’ “Sustainable Safety” road safety philosophies. Vision Zero sets the highly ambitious long-term goal of achieving no deaths and no serious injuries within the Swedish road-transport system. The Dutch Sustainable Safety approach seeks to avoid the next and future generations of Dutch people inheriting a road transport system that results in the high losses of life and health that characterise current system performance. Australasia’s Safe System philosophy also aspires to prevent death and serious injury within its road-transport systems. While this goal will be regarded as unrealistic by some, it is important to realise that:
Designing and operating a system that tolerates consistently high-levels of serious trauma is both unethical and at risk of perpetuating the acceptance of failure by system designers and operators;
New, fundamentally safe designs will result from viewing the safety of the road-transport system in this new light. Fundamentally safe designs and protocols for operation can shift system safety a large step forward, in contrast with the incremental progress characterising traditional approaches.
The Safe System comprises four key principles: 1. The limits of human performance – Traditional approaches to road safety focus heavily
on preventing human failures within the system. For example, there has been marked progress with programs targeting drink-driving, speeding, and restraint use. However, despite this partial success, these and other forms of human failure, such as poor gap selection at complex or simple intersections or while overtaking, failure to stay within travel lanes, even on high-speed high-standard roads, and driving while fatigued, have so far proven beyond our capabilities to eliminate through behaviour change programs. A guiding philosophy that explicitly acknowledges the intrinsic capabilities of humans is essential to future success. Note that this guiding philosophy still requires road users to behave responsibly.
2. The limits of human tolerance to violent forces – Humans are limited in their biomechanical tolerance to the violent forces and energy exchanges that commonly occur
2 Monash University Accident Research Centre
Development of a new road safety strategy for Western Australia, 2008-2020
Monash University Accident Research Centre 3
in traffic crashes. When tolerance limits are exceeded serious injury or death results. The Safe System explicitly acknowledges these limits by seeking to create a road-transport system in which foreseeable collisions invoke forces within the biomechanical limits of the humans involved. To achieve this in practice, the ability of a vehicle to protect its occupants in common crash types and at typical impact speeds (resulting from legal travel speeds) must be known and taken into account in decisions about system design and operation. So too is it vital to understand the biomechanical limits of unprotected road users (e.g. pedestrians, bicyclists and motorcyclists) in collisions across the full range of vehicle types and speed zones.
3. Shared responsibility – Traditionally, the majority of road safety responsibility has been placed upon the individual road user. Under this new approach, ultimate responsibility for the safety performance of the road-transport system resides with the system designers and operators. However, it is only possible to move progressively towards a situation of no deaths or serious injuries in the long-term provided road users comply with key behaviours such as speed limit observance, restraint use, driving unimpaired and in use of vehicles with good safety features. Thus, the system designers depend on compliance by road users for achieving a truly safe system, while individual, complying users depend on inherently safe design standards and operation for their safety.
4. A forgiving road-transport system – The road-transport system is, fundamentally, a real-world illustration of the basic laws of nature governing the movement of objects, be they vehicles or humans, relative to the physical environment. How these objects interact is, ultimately, a matter of physics varied in time and space according to human intervention, which is particularly difficult to predict or control.
Safe outcomes are largely determined by the ability of individual road users to moderate kinetic energy, which is the physical energy gained by an object (usually a vehicle) as a result of its motion. Kinetic energy is a function of both the mass of an object and, more importantly, its speed at any instant in time. Unlike mass, which is linearly related to kinetic energy, speed has a squared (i.e. 2nd power) relationship with kinetic energy. For example, when the speed of a vehicle increases two-fold, its kinetic energy increases four-fold; while increasing its speed three-fold increases its kinetic energy nine-fold. A safe road-transport system depends, therefore, on the successful separation of sources of kinetic energy (crash avoidance) and, where this cannot be achieved, the controlled dissipation of kinetic energy to avoid exceeding human biomechanical limits (injury prevention or amelioration). Given the inherent limitations of human performance within the road-transport system, the Safe System seeks to create roads and roadsides that are tolerant of human error and reasonable levels of impairment. This is achieved by ensuring that sources of kinetic energy remain separated or, in worst cases, can be managed within the limits of human tolerance to serious injury. A major challenge for the future is to identify and implement current initiatives that meet this goal, as well as to generate new initiatives consistent with these Safe System principles.

Overall Approach
The overall approach taken to strategy development can be summarised as: 1. Undertaking an environmental scan of the social, economic, political and technological
factors in Western Australia that should or could influence the strategy. The results of this task are the subject of a separate report (Johnston, Corben and Logan, 2007), in which it was concluded that there are no fundamental organisational structural barriers to enhancing road safety within Western Australia. What is needed is a strengthening of the lines of accountability, starting with a new level of commitment from the highest levels of government. All relevant ministers actively leading and demanding effective programs will strengthen agency commitment and co-ordination. Strong accountability mechanisms for strategy delivery will lead to agency role clarification. Each agency should develop its own internal strategy to achieve its component of the new State strategy.
2. Reviewing the performance of “Arriving Safely”, Western Australia’s current road safety strategy (2003-2007). The results of this review are documented in a separate report (Mulvihill, Corben and Vulcan, 2007), which highlights several key trends, namely:
A downward trend in the number of fatalities, despite a substantial increase in 2006; An upward trend in the number of persons seriously injured despite a reduction in
2006;
A substantial increase in the number of fatal crashes on local roads and highways; An upward trend in the number of motorcyclists, car drivers and bicyclists killed and
in the number of motorcyclists and heavy vehicle occupants seriously injured;
A consistent reduction in speeding related fatal crashes; A consistent upward trend in the number of deaths related to drink-driving, particularly
in 2006;
A general downward trend in the number of unrestrained drivers and passengers killed, but an increase in the number of unrestrained drivers seriously injured.
Based on the review of the performance of Arriving Safely, it is evident that the following areas need to be addressed in Western Australia’s next Road Safety Strategy either because they have not improved over the life of the Strategy or because they continue to comprise a substantial proportion of fatalities and serious injuries:
Improvement of the safety of roads, particularly highways and local roads; Road user behaviour including speeding, restraint use and, in particular, drink-driving; Motorcycle, pedestrian and bicyclist safety. 3. Developing a conceptual framework to identify major opportunities to reduce severe
trauma in Western Australia, based on the key elements of Australasia’s Safe System road safety philosophy. Both the Safe System philosophy and the conceptual framework are described.
4. Undertaking macro-modelling of alternative strategy packages to estimate future total savings in serious casualties over the life of an optimal strategy option and selected variants. Serious casualties are defined as the sum of fatalities and hospitalisations. The modelling activity uses best available evidence on the effectiveness of individual initiatives and scientific methods for forecasting future savings in serious casualties. For the optimal option and its variants, both total savings in serious casualties and the percentage reduction in serious casualties in the final year of the strategy, compared with the commencement
4 Monash University Accident Research Centre
Development of a new road safety strategy for Western Australia, 2008-2020
Monash University Accident Research Centre 5
0.
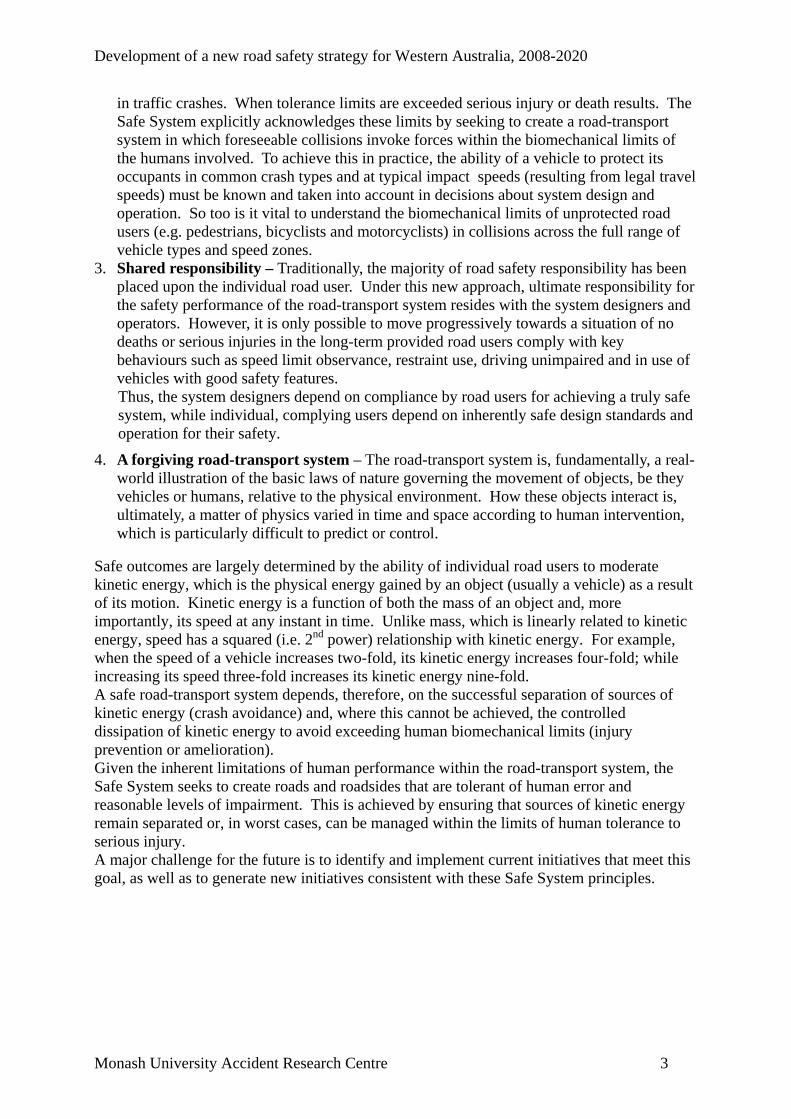
5. The macro-modelling described above identified the Optimum Safe System Option (OSSO), which has been formulated to reflect best-practice in the achievement of safe roads and roadsides, safe travel speeds, safe vehicles and safe road use. Variations on the OSSO are also considered:
Safe roads and roadsides: The OSSO assumes an annual investment of $185M over the life of the strategy. This report presents the results, in terms of the estimated total serious casualty savings, for the OSSO, as well as for a delayed case, in the form of a reduction in infrastructure investment by 30% from the OSSO level (equivalent to a two-year delay), with other initiative inputs held constant;
Safe travel speeds: The OSSO assumes that WA’s urban 60 km/h speed limits will be reduced to 50 km/h in Year 1 of the strategy, open road 110 km/h speed limits will be reduced to 100 km/h (also in Year 1 of the strategy), with the remainder of the State’s speed limits being reduced by 10 km/h in Year 3 of the strategy. The results of a major variant in the Safe Speeds component of the OSSO are also presented. These variants assume that the above timing for implementation of speed limit reductions would be delayed by four years, with other initiative inputs held constant.
Safe vehicles: The OSSO assumes that a selection of proven vehicle safety features will be introduced into government and corporate vehicle fleet purchases, according to a specified schedule. The variant on the Safe Vehicles component assumes that the introduction of these features will be delayed by two years for electronic stability control (ESC) and for side-impact and curtain airbags, and by four years for intelligent speed assist3 (ISA). In both OSSO and its corresponding variant; it has been assumed, somewhat conservatively, that only 80% of purchases in the first year and 90% in the second year will be achieved. From the third year of implementation of the Safe Vehicles component, all new purchases will meet the safety criteria for government and corporate fleet purchases.
Safe road user behaviour: No variants to the best-practice combination of the behaviour change initiatives were modelled.
3 Also known as Intelligent Speed Adaptation.


Development of a new road safety strategy for Western Australia, 2008-2020
Safe System Matrix
To facilitate the development of Western Australia’s next road safety strategy, the concept of a “Safe System Matrix” was created. The matrix aims to focus resources on a relatively small number of large and severe problems, using proven, high-impact solutions. This approach still permits other problems of lower priority to be addressed, but at a level commensurate with the potential savings in serious trauma. The Safe System Matrix serves two important purposes: 1. It provides a systematic, structured approach to identifying strategically important road
safety initiatives, consistent with the principles of the Safe System. In particular, it ensures that each of the main components of the Safe System, namely, safe roads and roadsides, safe travel speeds, safe vehicles and safe road use, are comprehensively addressed.
2. The Matrix has been structured to ensure that the differing road safety problems and priorities within Western Australia’s three main geographic areas – Metropolitan Perth, Regional WA and Remote WA – can be more precisely targeted within the strategy. The three geographic areas are defined in Appendix A.
The Safe System Matrix is shown in generic form in Table 1.
Table 1. The Safe System Matrix for Western Australia.
Safe Roads & Roadsides
Safe Speeds Safe Vehicles Safe Road Use
All of WA Accident Black Spot and Safer
Roads Programs
Enhanced enforcement
Crash avoidance and occupant
protection countermeasures
Ongoing behaviour change
programs
Metro Perth Safe System intersection
transformation
Regional WA
Remote WA
Safe System transformation
on key rural routes
Specific speed limit adjustments
to match geographic priorities
Specific crash avoidance
countermeasures to match
geographic priorities
Targeted behaviour
programs to match
geographic priorities
Safe Roads & Roadsides
The Safe Roads & Roadsides cell consists of countermeasures aimed at improving the safety of roads and roadsides. It is anticipated that the existing Accident Black Spot and Safer Roads programs across the whole of WA will continue, ensuring that selected sites and routes did not overlap with the specific regional and remote treatments detailed below. One of the key countermeasures for metro Perth is a ‘Safe System transformation’ of intersections. This would involve the implementation of such measures as roundabouts, full control of right-turns at signals, combination red light/speed cameras and others at key intersections. Sites would be selected on the basis of numbers of serious casualty crashes. Run-off-road crashes are also a significant problem in urban areas, but few effective solutions yet exist. It is recommended that ongoing research be conducted into the development of new barrier solutions for urban applications.
Monash University Accident Research Centre 7

In addition to the whole of WA programs, a “Safe System transformation” is proposed for routes radiating from Perth. This would be aimed at addressing the run-off-road and potentially, head-on crash problems on key strategic routes from the metro Perth boundary as far out into regional WA as practicable. A similar strategy could be adopted for key rural centres such as Kalgoorlie, Geraldton, Port Hedland and Karratha. Traditionally, specific road sections would be treated on the basis of crash history. In the case of a Safe System transformation, however, the strategy would be to start from the metro end of each route (where crash densities tend to be higher) and work outwards. Other desirable initiatives would include improved pedestrian separation, lighting and path definition around indigenous communities; traffic calming in areas of high pedestrian density in both metro and regional centres and ongoing promotion of alternatives to short-trip motor vehicle journeys in the form of dedicated bicycle and shared pedestrian/bicycle paths. Safe Speeds
Reducing travel speeds across the state is one area where significant serious casualty savings are possible at relatively low cost. Reductions in the higher speeds would be expected to yield savings in fuel costs and lessen greenhouse gas emissions. Furthermore, in a very large, sparsely populated jurisdiction like Western Australia, it is practically impossible to provide best-practice infrastructure solutions across much of the state. For the whole of WA, a program of enhanced enforcement of speed limits is recommended. A comprehensive set of recommendations has been proposed in a separate report prepared by MUARC for the WA Police (Cameron and Delaney, 2006). It is also recommended that a systematic program of ‘fine tuning’ of existing speed limits be pursued, particularly in metropolitan Perth as well as regional and remote centres (see Section 0). In addition to the above measures, two speed-related countermeasures are recommended for metro Perth. The major one of these would be to reduce urban speed limits from 60 km/h to 50 km/h. Currently 27% of all serious casualties occur in 60 km/h speed zones within the metropolitan area and small reductions in travel speed would lead to significant serious casualty savings. Another area where Australian speed limits are too high is in areas of high pedestrian activity such as the Perth central business district and urban strip shopping centres. It is recommended that these areas be rezoned to 40 or even 30 km/h to improve Safe System compatibility in both avoiding and mitigating pedestrian-vehicle conflicts. In regional WA, it is recommended that speed limits be reduced by 10 km/h, with progressive reinstatement possible as the program of Safe System Transformation is completed along the selected key routes (see Section 0 above). It would also be highly desirable for the state open road speed limit to be reduced from 110 km/h to 100 km/h. It is acknowledged this may be difficult to enforce along much of the network and that compliance and perception of increased travel times may be a problem. Nevertheless, it is likely that many drivers will conform and any reduction, even if only slight, will lead to serious casualty savings. Finally, lower speed limits in and around remote towns and indigenous communities, where there are pedestrian movements across roads or highways, would also contribute to reductions in road trauma. Safe Vehicles
In recent years significant advancements in vehicle safety have been made to both occupant protection and, more recently, to improving the ability of vehicles in reducing or avoiding crashes. Fitment of features such as electronic stability control (ESC), side chest-protecting airbags and curtain airbags has often been restricted to the more expensive vehicle marques or only available when packaged with other non safety-related features. Manufacturers are now responding to market demand and making crash avoidance and newer occupant protection features more accessible and the new road safety strategy is coming at a good time to take
8 Monash University Accident Research Centre

Development of a new road safety strategy for Western Australia, 2008-2020
advantage of these changes. Australia has one of the older vehicle fleets in the developed world, with vehicles remaining in service for 20 years or more. Safety features fitted to new vehicles therefore take a long time to propagate into the vehicle fleet. Corporate fleet purchases constitute a large proportion of new vehicle sales, so maximising their take-up of safer vehicles is essential to improving the safety of the whole fleet. Vehicles are typically turned over every 2-4 years, after which they enter the private fleet and replace older, less safe cars. While government vehicles comprise only a small proportion of new vehicle sales, they can take on an important lead role in setting an example to be followed by the manufacturers as well as the rest of the community. For these reasons, it is recommended that the safety features recommended in this report be made compulsory on government-purchased vehicles and strongly advocated as essential to corporate fleet purchasers. Across the whole of WA, ESC should be fitted to all new corporate and government-purchased vehicles – ideally across all three levels of government. This is particularly important in remote WA, where 4WD vehicles constitute a significant proportion of vehicle sales and are heavily over-represented in crashes where ESC could be of great benefit. Intelligent Speed Assist (ISA) has been extensively trialled throughout the world, including WA, and has shown benefits in discouraging drivers from exceeding the speed limit. ISA systems use GPS and an in-vehicle database to know the applicable speed limit at any location. Passive (advisory) systems warn the driver once the speed limit is exceeded, with increasing levels of insistence as speed increases. Active systems go one step further by applying gentle upward pressure on the accelerator to discourage further speed increases. This pressure can be over-ridden for safe overtaking, but has been shown to improve speed compliance in the real world (e.g. Regan et al, 2005). It is recommended that advisory ISA be introduced on government and fleet vehicle purchases. Passive safety systems, which mitigate injury in the event of a crash, are well-developed in some modern vehicles. Fitment of some of them, however, has been slow to filter down to the vehicle models most commonly sourced by government and fleet purchasers. Head-protecting side curtain airbags, in particular, have been available for a number of years and are demonstrating benefits in early evaluations. They, along with thorax (chest) side airbags should be fitted to all corporate and government fleet vehicles. Of lesser importance, but still beneficial and recommended for inclusion in the strategy, are active head restraints, which help to prevent neck injury in rear impacts. Vehicle safety technology is advancing rapidly and new features are being trialled constantly. It is also recommended that the WA Road Safety Strategy undertake a program of constant review to identify and evaluate emerging technologies in crash avoidance and occupant protection throughout the life of the strategy, or support a national approach to such a program. Such technologies might include improved alcohol interlocks, advanced seat belt reminders and interlocks, following distance warning, lane departure warning and reliable fatigue warning systems. Safe Road Use
Safe System principles, while strongly advocating an injury-tolerant system, also demand that the system be used responsibly by those within it. Therefore, an ongoing program of safe road use also needs to be pursued. Across the state, programs addressing alcohol and drug use in combination with driving, fatigue and the issues faced by novice drivers should continue to be rolled out. In addition to this, campaigns addressing the Safe System and the concept of shared responsibility between system designers/operators and users will also help to improve community support. Of critical importance is the need for institutional behaviour change with the prime purpose of supporting professionals within the agencies to understand better the shift in responsibilities necessary for strategy success (see also Section 0). Promoting better speed choice will support enforcement campaigns.
Monash University Accident Research Centre 9

10 Monash University Accident Research Centre
Programs addressing driver distraction are required for metro Perth, while in regional and remote WA, the difficulties in following requirements of graduated licensing schemes in less-advantaged communities should be taken into account. The problems of relatively low restraint use (including travel in vehicle load spaces), as well as unlicensed driving, should also be addressed.

Development of a new road safety strategy for Western Australia, 2008-2020
Modelling Approach
Central to the overall approach has been the modelling of the performance of the proposed strategy using evidence-based estimates of the effectiveness of individual road safety initiatives and alternative combinations of initiatives. The modelling approach operates at a macro level and so includes only those initiatives expected to have a sizeable impact on the reduction in severe road trauma. Using evidence-based estimates of effectiveness and actual crash data for Western Australia over recent years, the model uses mathematical methods to forecast future savings in serious casualties in each year of the 12-year period from 2008 to 2020. These predicted savings in serious casualties can be summed over the strategy life for each individual initiative, assuming it alone is implemented. These savings can also be summed for combinations of initiatives implemented as part of a strategy, allowing differentiation between options in terms of their potential contribution to preventing road fatalities and serious injuries. The principal measure of worth of a strategy option is the total number of serious casualties prevented over the strategy life. These savings are estimated relative to the level of serious casualties that could be expected to occur in the absence of a significant road safety strategy. Forecasting future road trauma occurrence and trends is a challenging exercise, characterised by uncertainty and assumptions about the nature of changes in the road-transport system and their potential effects on the strategy. However, to plan for success, it is necessary to follow such a path, while reducing as far as practicable, the potential for error. The approach taken with modelling for the WA strategy has attempted to account for two main, whole-of-system, influences.
Future growth in serious casualties as a result of increasing exposure, reflected by vehicle kilometres travelled (VKT);
Future reduction in serious casualty rates due to the total effect of a series of road safety measures introduced, too small to be individually measured, and the gradual effects of increasing motorisation in Western Australia.
These two influences, while tending to counteract each other, result in a forecast general upward trend of around 1% per annum in serious casualties through to 2020 (and beyond) due to a higher rate of traffic growth than the projected decline in serious casualties due to motorisation (2.6% average annual increase for traffic growth, compared with 1.6% annual decrease resulting from higher levels of motorisation). More sophisticated modelling has been carried out by MUARC (Cameron, 1997) that suggests higher rates of natural decrease for fatalities; however a conservative value was used for the Western Australian modelling. Other macro-level influences could be incorporated in the model if desired. Together, the effects of traffic growth trends and motorisation trends are used to define a point of reference in each year of the strategy, against which potential savings in serious casualties due to the implemented strategy can be estimated. The model has two principal outputs: 1. The estimated total number of serious casualties saved over the life of the strategy
(relative to the forecast numbers of serious casualties in the absence of a significant road safety strategy).
2. The percentage reduction in serious casualties in the final year of the strategy compared with the most recent year for which full serious casualty data were available. The total number of serious casualties saved over the life of a strategy can be used to identify the most effective strategy, while the percentage reduction in Year 12 provides a target for achievement by the end of the strategy (and at intermediate milestones throughout).
Monash University Accident Research Centre 11

The model also produces a number of additional output measures for each initiative and each strategy option. All costs are in present-day values.
The estimated cost (as provided by responsible agencies); The average cost per serious casualty saved; The ratio of the monetary value of the serious casualties saved to implementation
costs;
The time profile of cumulative serious casualty savings over the life of the strategy; The predicted numbers of fatalities and serious injuries in the final year of the strategy; The fatality, serious injury and serious casualty rates (per capita) in the final year of
the strategy. These can be compared with rates at the commencement of the strategy and with other jurisdictions of interest (e.g. Sweden, the Netherlands, Victoria, Australia, etc.). Population projections were derived from Australian Bureau of Statistics sources.
Model Description
The METS (Macro Estimates for Target Setting) model was originally developed over a period of 16 months from early 2006, funded by VicRoads to support the development of the next Victorian road safety strategy. Although the Western Australian version was based on the latest version of METS, METS-WA has undergone extensive development and customisation with the aim of tailoring it to the Western Australian road safety environment, as well as incorporating significant improvements to the underlying model. This section is based on METS-WA v1.07, which is the culmination of three months of further development of METS v5.86. METS-WA is an Excel workbook of 28 linked worksheets. The underlying model uses seven of these, with the remainder providing support and output, both graphical and tabular. The model is a numerical implementation of concepts developed in the late 1990s by MUARC researchers, principally Peter Vulcan (e.g. Vulcan & Corben, 1998). It starts with a base number of annual serious casualties (killed and hospitalised) derived, in the case of WA, from police-reported data. The effectiveness of individual countermeasures in reducing the proportion of total serious casualties – derived from appropriate scientific studies – is used to predict serious casualty numbers from the effects of the countermeasure in isolation for each year for the duration of the strategy. Underlying trends are also taken into account by modelling the effects of both traffic growth (in vehicle kilometres travelled) and the natural death rate reduction that has been shown to occur with increasing motorisation in highly motorised countries (e.g. Jacobs, Aeron-Thomas and Astrop, 2000). Individual countermeasures are then combined into strategy ‘packages’, either additively or multiplicatively, the latter avoiding double-counting of savings when different initiatives act upon the same ‘pool’ of serious casualties. A unique feature of METS-WA is its ability to allow different levels and combinations of initiatives to be relatively easily compared. Key Assumptions
METS-WA uses a worksheet with more than 150 input variables, both user-defined and calculated. Table 5 (in Appendix B) contains a list of some of the more significant variables used by METS-WA v1.07. Where possible, input variables were derived either from reliable agency-supplied statistical data or the results of sound research. For a number of variables, however, neither of these sources were able to provide the specific data required. Where this was the case, conservative consensus estimates, based on the best evidence currently available, were used.
12 Monash University Accident Research Centre

Development of a new road safety strategy for Western Australia, 2008-2020
Model Outputs
METS-WA is primarily designed to produce graphical outputs that can be easily incorporated in presentations. Numerical data is also available, but care must be taken to avoid implying greater accuracy than the model is able to provide. The following sections describe the main outputs, as well as some of the additional information available where relevant inputs allow.
Principal Outputs
The two principal outputs of the model are (a) cumulative numbers of serious casualties saved over the life of the strategy and; (b) performance of the strategy in its final year, as well as selected milestone points. Strategy performance is measured as the percentage reduction in the number of serious casualties in the selected year compared with a chosen baseline year, usually the most recent year for which full serious casualty data is available. METS-WA provides estimates of this value for Years 3, 6, 9 and 12, in line with the proposed intervals for intermediate strategy action plans. The number of cumulative serious casualties saved is a relative figure calculated by projecting the future state of baseline serious casualties in the absence of a specific strategy. Although it is a somewhat arbitrary baseline, it allows different strategy options to be compared with one another. Moreover, cumulative savings are important to consider, as strategy performance in a single year may give little indication of overall strategy performance.
Additional Indicators
Where the costs of implementing initiatives have been provided, the model also provides approximate indications of (a) total strategy cost; (b) cost per serious casualty saved; (c) the monetary savings to society resulting from the serious casualty savings and; (d) the ratio of monetary savings to strategy cost. Costs are all expressed in present-day values, with future cost increases not taken into account. Factors Affecting Forecasting
METS-WA is intended to provide macro estimates of serious casualty savings over the life of a road safety strategy. In order to accomplish such a complex task, it was necessary to make a number of simplifications. In general, these were aimed at ensuring conservative estimates, with the key factors are described below.
General
The strategy, although planned for launch in mid-2008, has been modelled as commencing at the beginning of calendar year 2009. Consequently, Year 12 would be completed at the end of 2020.
Serious casualties were assumed to rise in direct proportion to increased vehicle kilometres travelled and in inverse proportion to the natural reduction factors described at the beginning of this section;
Estimates of future traffic growth in Western Australia were not available in readily usable form at the time of writing. A base value of 2.6% annually was used, based on observed traffic growth for the period 2001-2005. Conversations with Main Roads WA suggested that this value seemed reasonable.
The background level of road safety improvement was calculated from numbers of serious casualties and vehicle kilometres travelled for the period 1990-1996. During this time, it is believed that few specific road safety initiatives were implemented and the absolute number of serious casualties remained relatively constant. The value used was -1.6% p.a. The model has also taken into account the projected effects of existing
Monash University Accident Research Centre 13

infrastructure investment, contributing to some serious casualty savings between 2006 and the start of the strategy.
One effect that has not been included in either the model or the effect of underlying road safety improvement is the introduction of new safety-related Australian Design Rules for vehicles, including ADR 69 (progressively introduced from July 1995), ADR 72 (from January 1999) and ADR 73 (from January 2000). Vehicles manufactured to these three standards, for full-frontal, side impact and offset frontal impact protection respectively, are only now likely to be propagating in significant numbers into the Western Australian vehicle fleet4 and their effects will contribute to underlying road safety improvements for the life of the new strategy.
Road and roadside measures were modelled such that no benefits were credited in the first year of investment and 50% in the second year, with the full projected serious casualty savings only credited from the third year. Similarly, speed limit reductions were assumed to have only 50% of their full effect in the first year of implementation, with the remaining 50% the year after. Finally, implementation of safety features into government and corporate fleet purchases were given an allowance of 20% of non-complying purchases in the first year and 10% in the second year, with all purchases required to be fitted with the nominated features from the third year after introduction;
Roads & Roadsides
Numbers of serious casualties saved per A$100m of annual investment (2006 values) through Accident Black Spot (ABS) and Safer Roads (SRP) infrastructure programs were set at 106 and 70 respectively. These values were derived from a combination of a WA evaluation carried out on a relatively small ABS program and preliminary Victorian SRP estimates.
In order to extrapolate the effects of ongoing ABS investment between the baseline year (2006) and Year ‘zero’ of the strategy (2008), a ‘pull-through’ effect on serious casualty savings equivalent to $35m per annum was assumed.
The possibility of diminishing returns from infrastructure investment have not been accounted for, but it is expected that the estimated serious casualty savings from infrastructure investment were set conservatively and should be achievable with well-targeted programs.
Long-term commitment to major infrastructure investment is expected to lead to substantially lower unit costs of major treatment types, such as roadside barriers. This likely gain has been ignored by the model.
Infrastructure performance has been assumed to be independent of traffic throughput and absolute serious casualty numbers. This has not yet been modelled, but may mean the model is slightly less conservative in this regard.
4 ADR 69 (‘Full Frontal Impact Occupant Protection’) applied to all passenger cars (‘MA’ category) from 1/1/1996 (new models from 1/7/1995), all forward control passenger vehicles (‘MPVs’, category ‘MB’) and passenger SUVs (category ‘MC’) from 1/1/2000 (new models from 1/1/1998), all light commercial vehicles (‘NA1’, under 3500 kg GVM) from 1/7/2000 (new models from 1/7/1998). ADR 72 (‘Dynamic Side Impact Occupant Protection’) applied to all MA, MB and MC category vehicles from 1/1/2004 (new models from 1/1/1999) and to all NA1 category vehicles from 1/7/2005 (new models from 1/7/2000). ADR 73 (‘Offset Frontal Impact Occupant Protection’) applied to all MA category vehicles from 1/1/2004 (new models from 1/1/2000) and is not applicable to MB, MC or NA1 vehicles.
14 Monash University Accident Research Centre

Development of a new road safety strategy for Western Australia, 2008-2020
Monash University Accident Research Centre 15
Speeds
At the time of writing, mean speeds (as opposed to ‘free speeds’) were not available for the WA road network. In urban areas, mean speeds are generally considerably lower than the speed limit due to the effects of traffic congestion. Speed reductions of between 3-5 km/h were assumed for 10 km/h speed limit reductions. In particular, a 7% reduction in speed (from 40 km/h to 37 km/h) was used for the 60 km/h to 50 km/h rezoning; 4% (115 km/h to 110 km/h) for the 110 km/h to 100 km/h rezoning and 6% overall for the reduction in all remaining speed limits by 10 km/h.
The complete recommendations for enhanced enforcement were modelled (Cameron and Delaney, 2006).
Vehicles
No allowances were made for the effects of changes in fleet mix, with the assumption being that the relative proportions of each crash type remain similar to current values. Furthermore, the distribution of serious casualties by speed zone and metro/regional/remote is assumed to remain constant throughout the life of the strategy;
No take-up of vehicle safety measures by private buyers (beyond those delivered by ex-fleet vehicles being disposed into the private fleet) has been assumed. The recent increase in availability of ESC, for example, among the more popular vehicles is likely to improve returns in this area.
See also the notes to the General sub-section at the beginning of this section.
Road Use
Due to the complexity in appropriately identifying and modelling individual behaviour change initiatives, an approximate cumulative effectiveness of 8% over 10 years (equating to around 11% over 12 years) was assumed.
Sensitivity Analysis
Given the macro nature of the model, it is also appropriate to investigate the changes in outcomes resulting from variations in input data. Traffic growth, in particular, is difficult to predict so upper and lower estimates were added to the model outputs documented in Section 0. It is also possible to investigate the effects of variations in almost any of the other input variables if desired.

Strategy Assessment
The Preferred Strategy
The strategy focuses heavily on a relatively small and manageable number of high priority categories, including speed, run-off-road and head on crashes, intersection crashes, restraint use, fatigue, distraction, and various other forms of impaired driving. Also covered are the safety issues relating to novice drivers/riders, motorcyclists, pedestrians, bicyclists, indigenous road users and heavy vehicles. These issues, collectively accounting for the vast majority of all serious road trauma in WA, will be addressed through a mix of proven, high-impact initiatives from the four areas of the Safe System; Safe Roads and Roadsides, Safe Speeds, Safe Vehicles, Safe Road User Behaviour. The ‘best-practice’ strategy is set out in the following sections.
Safe Roads and Roadsides
An investment of $185M per annum on Safe System infrastructure is proposed, commencing during 2009 and continuing through the life of the strategy. The provisional distribution of the $185M p.a. is as listed below.
$50m p.a. for a state-wide Accident Black Spot Program (which represents an approximate $30m p.a. increase over actual investment levels in the mid-1990s);
$35m p.a. for a continuation of the Safer Roads Program across Western Australia; $25m p.a. for a program of intersection safety upgrades in Metro Perth; $75m p.a. for a program of “Safe System Transformations” in regional and remote
W.A. Relative investment levels between regional and remote W.A. should be determined progressively, on the basis of maximising the total reductions in serious casualties for the available funds;
It is recommended that the existing programs, namely, the Accident Black Spot and the Safer Roads Program, be conducted along roads and at intersections not forming part of the Metropolitan Perth intersections program or the Regional and Remote Safe System Transformation programs. The criteria for program development procedures for both of these programs should maximise the total savings in the number of serious casualties from road & roadside safety investment, a task potentially requiring further work be done to optimise the allocation of the total investment to yield the best serious casualty reductions possible.
Safe Speeds
The evidence regarding the safety benefits and cost-effectiveness of lower travel speeds on both crash and injury risk is compelling. Lower travel speeds must, therefore, be part of any best-practice road safety strategy. This component consists of three main parts:
Achieving better compliance with speed limits through more effective enforcement by Police, supported by targeted public education. The speed enforcement program has been documented in a separate report to the Office of Road Safety and consists of a package of speed enforcement programs tailored specifically for the Western Australian environment including point-to-point speed cameras and a mix of covert and overt speed enforcement;
Fine-tuning speed zone lengths by redefining the start of a new speed limit so as to incorporate known hazardous locations within lower speed limits. This would include hazardous locations situated near an existing speed limit change, such as on the approach to signalised intersections or high risk curves;
16 Monash University Accident Research Centre

Development of a new road safety strategy for Western Australia, 2008-2020
Reductions in existing urban speed limits in recognition of the high speed limits in urban WA relative to comparable countries of Europe and the US; reduction in the current 110 km/h speed limit along roads which are undivided and lined with trees, embankments, drains, ditches and a variety of other roadside hazards. Speed limit reduction would typically be 10 km/h and limits could be selectively returned to their current level on major regional routes treated under the Safe System Transformation program.
Better signage of speed limit changes in recognition of the difficulties drivers and riders experience in complying with frequently changing limits.
Safe Vehicles
This component of the strategy aims to capitalise on the proven safety performance of a number of vehicle safety features that, in general, are not currently-fitted as standard on many vehicles available on the Australian market. These features include electronic stability control (ESC) and Intelligent Speed Assist, which help to prevent crashes occurring and side impact and curtain air bags, and active head restraints, which help to reduce occupant injury severity when a crash occurs. This initiative aims to accelerate the introduction and rate of penetration of these features into Western Australia’s vehicle population by requiring government fleet purchasers to specify selected features when renewing the government fleet and by encouraging corporate fleet purchasers to do likewise. Not only will this approach accelerate the take-up of these proven features in WA’s vehicle fleets, it will also put much-needed pressure on vehicle manufacturers to provide these features as standard in new vehicles, or at least as options that can be specified as standalone features in their base models. These benefits will flow on to WA’s private vehicle purchasers as government and fleet vehicles are turned over to the general fleet. Based on current and proposed levels of availability of these features, a timeline for their introduction to government and corporate fleet purchases has been recommended as follows:
ESC from Year 1; Curtain and side-impact airbags from Year 1; Intelligent Speed Assist from Year 3; Active head restraints from Year 5 Furthermore, it now seems likely that ESC and side impact protection for the head will be required on all new cars sold in Australia from 2011 onwards (Austin, 2008).
Safe Road Use
For the new best-practice strategy for WA, the safe road use component would involve the creation of an integrated suite of campaigns that present and promote the Safe System road safety philosophy. The main features would include:
An emphasis on the Safe System being a new, ambitious approach capable of achieving major improvements in traffic safety over the next decade and beyond;
The importance of shared responsibility; Road users to comply with key laws including drink-driving, drug-driving, seat belt
use, fatigue-driving, etc.;
System designers and operators to aspire to the creation of a low-risk road transport system, in which there is no death or serious injury, provided users comply with key traffic laws;
A series of problem-specific education, promotion and publicity campaigns targeting key problem types amenable to improvement through behaviour change programs;
Monash University Accident Research Centre 17

Drink-driving; Drug-driving; Speeding; Restraint use; Distraction/inattention Fatigue-driving etc.;
Ongoing reinforcement of Safe System principles and shared responsibility as part of each problem-specific campaign.
It is planned that further development of the Safe Road Use component of the strategy will occur early in 2008. This work will be progressed through a workshop involving MUARC, WA Office of Road Safety and selected external experts to specify in more detail the best practice programs to achieve Safe Road Use. Outcomes
The following figures show the performance of both the Optimum Safe System Option (OSSO) as well as breakdowns by strategy component. Figure 1 shows relative numbers of serious casualties saved over the life of the strategy for individual initiatives. It assumes that each initiative is implemented in isolation and serves to show the relative savings of each. When combined, the savings would not necessarily be additive.
Performance of individual initiatives
0
500
1000
1500
2000
2500
3000
3500
4000
4500
5000
Infra: ABS Infra: SRP Infra: SST(Met Int)
Infra: SST(Rg)
Infra: SST(Rm)
Spd: Enh.Enf. Metro
Spd: Enh.Enf. RgRm
Spd: 60 ->50 (Yr 1)
Spd: 110RgRm ->
100 (Yr 1)
Spd: Minus10 (Yr 3)
VehicleSafety
Initiatives
Beh: Aggregatemeasures
Cu
mu
lati
ve s
erio
us
casu
alty
sa
vin
gs
ov
er p
erio
d 2
009
-202
0
v1.07 Figure 1. Comparison of serious casualty savings by individual initiative.
Figure 2 shows cumulative serious casualty savings when the individual initiatives in Figure 1 are combined into Safe System groups. Once again, overall savings are not necessarily able to be calculated by adding the effects of each.
18 Monash University Accident Research Centre

Development of a new road safety strategy for Western Australia, 2008-2020
Performance of Safe System elements
0
1000
2000
3000
4000
5000
6000
7000
8000
9000
10000
Infrastructure Spd: Enh. Enf. Spd: Spd Red. Vehicle Safety Behaviour
Cu
mu
lati
ve
seri
ou
s ca
sual
ty s
avin
gs
ov
er p
eri
od
200
9-20
20
v1.07 Figure 2. Comparison of serious casualty savings by Safe System group.
When the above initiatives are combined, the Optimum Safe System Option is estimated to yield cumulative savings of 16000 serious casualties over the 12-year duration of the strategy. Year zero (2008) serious casualties were projected to be about 3000 (based on the effects of existing infrastructure investment, traffic growth and natural reduction on the 2006 total of 2962), reducing to around 1420 serious casualties per annum by Year 12 in 2020. The latter value represents a 52% reduction in serious casualties compared with 2006. It is estimated that the number of state-wide fatalities annually could reach as low as 100. Sensitivity
As traffic growth has a significant influence on model outputs, as well as being less predictable than other variables, a range of traffic growth figures were investigated. The results are shown in Table 2.
Table 2. Effects of varying traffic growth on model outputs.
Traffic growth (per annum) Output estimate
2.6% (base) 2.0% 3.0%
Cumulative serious casualty savings over 12 years (rounded to nearest 500)
16000 15500 17000
Percentage reduction in Year 12 52% 57% 49%
Estimated serious casualties in Year 12 (rounded to nearest 10)
1420 1290 1520
Estimated fatalities in Year 12 (rounded to nearest 10)
100 90 105
Monash University Accident Research Centre 19
The effect of lower traffic growth is to improve the performance of the strategy, while higher traffic growth results in greater cumulative serious casualty savings, but worse strategy performance overall. This is because the higher traffic growth assumption predicts a larger number of serious casualties to which the strategy initiatives are applied. At the time of writing it was not possible to obtain robust projections of the potential effects of the Western Australian economic growth, manifested by vehicle kilometres travelled (vkt). Between 1990 and 2002, vkt increased at an average of 1.5% per annum. Between 2003 and 2006, the latest year for which data was available, the rate of increase was 2.6% (ABS, 2007). Consequently, the latter figure was used, along with the two other rates for comparison, as shown in Table 2 above. In comparison, the Australian Bureau of Statistics (ABS, 2006) estimates that the Western Australian population growth rate will range between 0.5 and 1.4% from 2004 to 2051. Furthermore, during the period 1989-90 to 2004-05, primary energy production in Western Australia increased by an average of 4% per annum (ABARE, 2006) while vkt increases averaged around half this rate. The Australian Bureau of Agricultural and Resource Economics (Riwoe, Cuevas-Cubria and Akmal, 2006) predict primary energy consumption increases of 3% per annum between 2010 and 2020, perhaps implying traffic growth of 1.5%, a scenario which would lead to better outcomes in 2020 than the base prediction. Coverage of High Priority Problems
The main thrust of the proposed strategy is the focus on a relatively small and manageable number of major categories of severe trauma, using proven, high impact solutions. In defining the major categories of trauma, it is important to identify the high-priority problems that collectively account for a large proportion of all serious trauma, while also individually accounting for the largest numbers of serious casualties. On this basis, the categories in Table 3 have been identified from an analysis of WA’s reported traffic crashes over the most recently available five-year period. They are listed in decreasing order of priority, as defined by their estimated contribution to serious casualty occurrence. For some problems, such as distraction or fatigue, reliable figures are not presently available.
20 Monash University Accident Research Centre

Development of a new road safety strategy for Western Australia, 2008-2020
Table 3. Contribution to total hospitalisations and fatalities by high priority category for the three-year period 2005-2007.
Metro Regional Remote WA High Priority Category*
n % n % n % n %
Speed1 4,214 3,454 1,386 9,054
Intersections2 1,855 44% 1,006 29% 102 7% 2,963 33%
Run-off-road2 774 18% 1,349 39% 860 62% 2,983 33%
Head-on2 141 3% 289 8% 67 5% 497 5%
Other crash types2 1,444 34% 810 23% 357 26% 2,611 29%
Fatigue3 25-30%3
Distraction3 ~25%3
Drug driving, (fatalities 2005)4 42 26%
Drink driving5 418 10% 350 10% 228 16% 996 11%
Non-restraint use6 122 5% 202 8% 280 26% 604 10%
Young drivers7 768 29% 680 29% 203 27% 1,651 29%
Indigenous drivers3
Motorcyclists 516 12% 440 13% 107 8% 1,063 12%
Pedestrians 403 10% 151 4% 63 5% 617 7%
Bicyclists 198 5% 84 2% 11 1% 293 3%
KSI casualties from crashes involving heavy vehicles8
170 4% 262 8% 130 9% 562 6%
* Data source: Unpublished preliminary data, Office of Road Safety, taken from Integrated Road Information System, Main Roads Western Australia. (2008).
Table notes: 1. Speed contributes to all crashes. 2. Crash types were defined using the Road User Movement (RUM) codes (Andreassen, 1991) Intersection crashes: RUM codes 11-19, 22-26, 32-34, 38 or 39. Run-off-road crashes: RUM codes equal to 71-77, 81-84. Head-on crashes: RUM codes equal to 21 or 51. All other crashes: any other RUM code value.
3. Figures unable to be reliably estimated using the IRIS crash data. See Dobbie (2002) for fatigue; Young, Regan and Hammer (2003) for distraction.
4. Fatalities only. Refer to tables 59 to 61 of Hill, Marchant and Gant (2007) for drugs detected in persons killed in road crashes in 2005.
5. Crashes where the highest blood alcohol concentration of all involved motor vehicle driver or motorcycle riders was greater than or equal to 0.05 g/100 mL.
6. Restricted to occupants of motor vehicles that are likely to be fitted with seatbelts in police attended crashes. This excludes motorcyclists, motorcycle passengers, and occupants of motorised wheelchairs/gophers, tractors and vehicles that are normally towed (trailers, caravans etc).
7. Novice drivers cannot be identified from the IRIS crash data. Therefore, ‘Young drivers’ aged 17 to 24 years were used as a proxy instead. These figures have been restricted to motor vehicle drivers and motorcyclists.
Monash University Accident Research Centre 21

While some of these problems account for only relatively small numbers of serious casualties, they nevertheless represent high-risk categories and, in some instances, involve vulnerable or disadvantaged groups of road users. That is, the major focus will be on the numerically large and severe problems, however attention will also be paid to selected problems of lesser magnitude. The trauma categories vary widely, ranging from crash types to road location types, to road user and behaviour types. To help ensure that the final strategy is as comprehensive as practicable, problem types have been mapped to their respective solutions. Table 4 indicates subjectively the extent to which each of the four elements of the Safe System Matrix contributes to reduced trauma in the identified high-priority problem types. In general, there appears to be comprehensive coverage of these problems in the proposed strategy. However, motorcyclists, bicyclists and indigenous road users may warrant further attention, given their high risks in traffic and the lack of proven initiatives currently available to assist each of these groups.
22 Monash University Accident Research Centre

Development of a new road safety strategy for Western Australia, 2008-2020
Table 4. Mapping of high priority categories to OSSO countermeasures.
Estimated efficacy of OSSO element in addressing category area
substantial benefit moderate benefit some or indirect benefit only - no measurable benefit Category of Crash
Road/ Roadside
Speed Vehicle Behaviour
Speed
Intersections Run-off-road and head-on
Fatigue Distraction Drug driving
Drink driving 1
Non-restraint use 1
Novice drivers Motorcyclists Indigenous road users Pedestrians Bicyclists Heavy vehicles Note:
1. Provided alcohol and seatbelt interlocks are included more broadly in the vehicle safety part of the strategy.
Strategy Alternatives
Several variations to OSSO were modelled, to investigate the effects of some of the delays that might eventuate prior to full strategy implementation. Each change was modelled while keeping the others at levels specified by the OSSO. The following delays were examined:
Infrastructure: reduce annual investment by 30% (equivalent to 2-year delay); Speed: delay 60-50 km/h, 110-100 km/h until Year 5 (from Year 1); delay 10 km/h
reduction until Year 7 (from Year 3);
Enforcement: delay enhanced enforcement until Year 5 (from Year 1);
Monash University Accident Research Centre 23

Vehicles: delay ESC, side/curtain airbags until Year 3 (from Year 1); delay ISA until Year 7 (from Year 3); no change for Active Head Restraints (Year 5)
No changes were made to the aggregate behaviour change program. Figure 3 shows the results of each change in terms of cumulative serious casualty savings differences. Each bar on the graph represents the number of serious casualty savings foregone over the life of the strategy, in comparison with the Optimal Safe System Option.
Change in cumulative serious casualty savings for OSSO variants
-1500
-1000
-500
0
500
1000
1500
OSSO OSSO (red Infra) OSSO (red Spd) OSSO (red Enf) OSSO (red Veh Saf)
Cu
mu
lati
ve s
erio
us
casu
alty
dif
fere
nce
s fr
om
OS
SO
ove
r p
erio
d 2
009-
2020
v1.07 Figure 3. Effects of varying initiative commitment on cumulative serious casualties saved.
Additional Initiatives
The OSSO described in this document includes a number of initiatives that have not been accounted for in the model. The main reason for not including their potential benefits in the model predictions is that the model has been designed to make macro-level estimates only; that is, trauma savings were predicted only for the measures expected to make relatively sizeable contributions to the total savings possible. Expected cumulative serious casualty savings of around 500 were not explicitly modelled. This is consistent with the generally conservative approach to forecasting strategy performance to avoid arriving at unrealistic targets. Additional benefits realised from this approach would be regarded as a bonus on top of the predicted savings. The following additional initiatives were not explicitly modelled, but are recommended for inclusion in the strategy. These initiatives aim to address problems of lower absolute magnitude, but nevertheless of high risk. Typically, vulnerable road users will be the main beneficiaries.
Safe Infrastructure
Traffic calming for pedestrians Pedestrian separation, lighting and path definition around indigenous communities Road-based Intelligent Transport Systems for intersection speed limits in Regional and
Remote WA.
24 Monash University Accident Research Centre

Development of a new road safety strategy for Western Australia, 2008-2020
Monash University Accident Research Centre 25
Bicycle paths
Safe Speeds
Fine tuning of speed limits Rezone Perth CBD and suburban strip shopping centres to 40 km/h or 30 km/h Lower speed limits in towns and indigenous communities
Safe Vehicles
Promotion of four and five star NCAP-rated new vehicles or ‘above average’ second-hand vehicles as rated by the Used Car Safety Ratings (Newstead, Cameron and Watson 2007)
Reliable fatigue warning systems Seat belt reminder systems and interlocks Improved alcohol interlocks Following distance warning systems Lane departure warning systems Less aggressive/pedestrian-friendly vehicle design Safety-based route navigation While several of these initiatives could be expected to provide cumulative serious casualty savings numbering greater than 500 by around 2025, they have not been modelled separately because the projected delays in their implementation are expected to limit the accumulated savings by the conclusion of this strategy to fewer than 500 serious casualties.
Safe Behaviour
There are no additional initiatives to be listed here, as the prime modelling assumption relating to safe road use was that the combined effect of a comprehensive suite of behaviour change initiatives would not exceed the equivalent of 8% over 10 years, corresponding to around 12% over 12 years.

Strategy Delivery
This project has aimed to identify the best opportunities for reducing severe road trauma in Western Australia during the period from 2008 to 2020, and beyond. It has also sought to assemble an optimum combination of initiatives which, collectively, can address the highest priority problems currently facing Western Australia. Key options have been described and their potential performance assessed in earlier sections of this report. Implementation
It is important to recognise that a strategy based on world’s best practice can deliver the predicted benefits only if implementation of the strategy takes place in accordance with the timelines and resources implied within the strategy. Having regard to the outcomes of the environmental scan and the review of “Arriving Safely”, Western Australia’s current road safety strategy, the State’s ability to implement the next strategy as planned is not necessarily assured. Unless the State’s key agencies, including the Western Australia Police Service, Main Roads Western Australia, Local Government, Planning and Infrastructure and others receive and retain the resources required to deliver the strategy actions in accordance with the planned timelines and to the extent required, there is a major risk that the estimated benefits and final target in 2020 cannot be achieved. The modelling approach described in Section 0 demonstrates clearly that implementation delays can be very difficult to overcome. Other aspects of risk to successful delivery of the strategy include:
Delays with crucial legislation being passed by Parliament; Sub-optimal development of infrastructure programs by Western Australia’s road
authorities (Main Roads and the State’s municipalities); past evaluations of the effectiveness of infrastructure investment programs demonstrate that systematic methods for selecting routes and intersections for safety improvement, as well as the choice of solutions, are crucial to success;
Slower than planned take-up of vehicle safety features into government and corporate fleet purchases;
Competing priorities for police, such as implementing the planned speed enforcement program in all geographic areas of Western Australia; including remote areas where traffic enforcement presents particular challenges;
Assuring an on-going, absolute commitment to delivering the strategy by the most senior members of government and the head of key road safety agencies within WA; highly effective monitoring and management procedures will be necessary to assure that the required progress is made throughout the life of the strategy. The macro-modelling reported in Section 0 of this report provides numerical targets for serious trauma in Western Australia at milestone points throughout the strategy (i.e. every three years).
For these reasons, it is strongly recommended that particular attention be directed in the strategy to its delivery on time and to the required extent. Options such as:
A highly energised ministerial group to create meaningful public accountability and to drive accountability down through agency CEOs.
The CEOs of all responsible agencies personally attend Road Safety Council meetings to ensure they have a full and current understanding of key strategy delivery issues in order that their agencies can respond quickly and effectively to changing needs. A further advantage of this approach is to demonstrate personal commitment and leadership to the agency staff in meeting strategy targets.
26 Monash University Accident Research Centre

Development of a new road safety strategy for Western Australia, 2008-2020
The Road Safety Council should report regularly to the Ministerial Council to report on strategy progress and thereby strengthen agency accountability. More frequent reporting may be appropriate while the new strategy is being established.
Monitoring and Review
A crucial benefit of a longer-term strategy (i.e., spanning the 12 years from 2008 to 2020 is the ability to put in place high-impact programs whose benefits will be lasting. For strategies developed within short time frames (e.g., 3-5 years), major initiatives which require substantial planning and preparation before implementation are less likely to be included in the strategy because of the uncertainty of government and stakeholder commitment beyond the strategy life. It is clear that the most worthwhile initiatives often require a minimum of several years of lead time before they can be implemented. The benefits of a 12-year strategy are substantial, primarily ensuring that government and its key agencies think beyond the lifespan of political cycles and so commit to initiatives with the potential for lasting improvements to the system rather than short-term fixes. Moreover, from a Western Australian point of view, the 12-year length synchronises neatly with the next national strategy. However, a long strategy also necessitates regular, systematic monitoring and review of progress to be carried out. This is already undertaken in Western Australia by the Office of Road Safety for the current five-year “Arriving Safely” strategy (2003-2007). The continuation of this process is even more important for a 12-year strategy. To support this activity, the strategy modelling work provides target reductions in serious casualties relative to the base year for milestone points throughout the period 2008 to 2020. These targets provide the opportunity to determine whether the strategy is progressing satisfactorily and so allow adjustments in direction, resourcing and timing, if required. Metrics for monitoring serious casualties
Measuring progress towards the ultimate target is important to assuring success, but is challenging for those responsible for strategy implementation. The strategy target is expressed in terms of a reduction in serious casualties by 2020. This means that it is necessary to monitor both the annual number of road deaths and serious injuries throughout the twelve year period. The definition of road deaths is generally clear and with little ambiguity. However, the operational definition of serious injury used to generate the mass data systems is much less clear, with a very broad range of injury outcomes constituting a serious injury resulting from a traffic crash. Not only does the definition of serious injury span a very wide range of injury types but injury severity for the same injury type can also vary substantially. For example, a serious injury can result in one or many days spent in hospital and rehabilitation, but under current criteria all are counted equally. It is recommended that the definition of a serious casualty be reviewed and, if necessary, redefined or enhanced for the purpose of more accurately monitoring strategy progress. However, if the definition of serious injury is changed after the adoption of a strategy target, the relevance of the original target may be reduced. In this case both the current and an enhanced definition must be monitored.
Monash University Accident Research Centre 27

28 Monash University Accident Research Centre
Continuous Innovation
Another important consideration in the adoption of a long-term strategy (also linked to the monitoring and review process) is the need to inject into the strategy new thinking, technologies and practices that can further strengthen the strategy. That is, the strategy once adopted in 2008, should be viewed as a living concept that can be modified, as necessary, to improve its performance. During the life of the new strategy, there will be, for example, advances in vehicle safety features, both structural and technological which, will need to be assessed in relation to the initially-adopted “Safe Vehicles” component of the strategy. In the area of investment in safe roads and road-sides, more information will come to light on the relative effectiveness of various forms of treatment, which will enable more precise targeting of solutions to characteristic problem types. New designs and infrastructure standards will emerge during the strategy life; as will new construction practices that will enable unit costs to be reduced and economies of scale to be gained. Similarly, breakthroughs in effective speed management and behaviour change initiatives can also reasonably be expected during this period. A best-practice strategy will include a component which ensures future innovations and new knowledge will be incorporated into the strategy to enhance its overall performance. Key Commitments and Professional Development
A number of crucial changes in the way road safety partners and stakeholders and indeed the Western Australian community, perceive and fulfil their roles in supporting the strategy and its implementation will be needed over the 12 years. For example, while the Safe System road safety philosophy is becoming better understood by implementing agencies, the concept is not yet sufficiently well-developed in terms of the translation of the philosophies and principles into real-world practice. Only with the confidence, understanding and commitment of key players, namely, senior ministers of government, agency CEOs and other senior managers, the Road Safety Council, professional groups and stakeholders, and, ultimately, the road user community, can a best-practice strategy be successfully implemented. It is proposed, therefore, that the strategy also include an educational and professional development component, designed and implemented to ensure that required knowledge, commitment and overall capacity resides with the key players in strategy implementation. This may involve:
Presentations and discussions with relevant Ministers, the Premier and agency CEOs; Presentations and discussions with agency CEOs and senior managers within agencies; Professional development of agency staff to convey a full understanding of the Safe
System concept, including the clarification of professional responsibilities, to identify initiatives compatible with Safe System principles and the important gaps in available solutions. Early identification of critical gaps will permit the necessary research and development activities to be undertaken to enable approaches to be strengthened as early as possible;
Mass media or other promotional/educational initiatives to explain the Safe System concept to the Western Australian community, the importance of shared responsibility and how high priority problems can be tackled within this framework. Such an approach is also discussed in Section 0, the preferred strategy.

Development of a new road safety strategy for Western Australia, 2008-2020
Conclusion
The strategy options presented in this report represent what is thought to be the optimum solution achievable by applying Safe System principles. Such an ambitious combination of initiatives has few precedents in the world and has the potential to result in enormous reductions in severe road trauma in Western Australia if adopted fully, with annual serious casualties estimated to be reduced by around 50% below 2006 levels. In contrast, fatalities and hospitalisations 12 years earlier (1992-1994) averaged 2539 per annum, rising to an average of 2987 for 2004-2006 – an increase of 18% over that 12-year-period. The development of a new road safety strategy for the 12-year period from 2008 to 2020 presents many opportunities. Clearly, the central focus is on achieving major reductions in the level of severe trauma that occurs in the Western Australian road transport system every year. The strategy also presents other opportunities to achieve benefits in other, related aspects of society. There are major challenges facing societies such as WA and indeed, many of the highly-developed countries of the world. Among those that interface directly with the road transport system are the impact of rapidly growing levels of motorisation on emissions, noise and amenity of urban areas; social isolation; the consumption of limited energy reserves; public health concerns such as asthma and obesity, especially among children and car-dependent societies; ever-increasing traffic congestion; and major environmental concerns such as global warming and climate change. While the primary concern is to reduce trauma, this strategy has also attempted to identify opportunities that allow additional social goals to be achieved through synergistic benefits. For example, reducing risks to pedestrians, cyclists and public transport users has in addition to the direct safety gains, the potential to contribute to more active lifestyles, support public transport patronage, reduce energy consumption, emissions and urban noise levels and, in some instances, delay the need for costly improvements to cater for current high levels of traffic growth and congestion. In turn, contributions to slowing global environmental degradation and climate change can be made. Substantial reductions in trauma will also benefit the function of Western Australia’s health system. Hospital resources will be freed up, enabling delivery of improved services to non-road trauma patients, leading to lower overall costs, shorter waiting periods or both. It may even be possible to delay substantially the building of new hospital or rehabilitation facilities by a number of years, depending upon the magnitude of the savings achieved. New, high-impact synergies must continue to be sought, both during the life of the next strategy and beyond.
Monash University Accident Research Centre 29

References
ABARE, 2006. Energy Update 2006. Canberra, ACT. Australian Bureau of Agricultural and Resource Economics. ANDREASSEN, D.C., 1991. Model guidelines for road accident data and accident types: Version 1.1. Technical Manual ATM No. N29. Australian Road Research Board, Melbourne. AUSTIN, P., 2008. Brumby road toll reforms backed. The Age, 22 February, internet. Available from: http://tinyurl.com/35vgt7 AUSTRALIAN BUREAU OF STATISTICS, 2006 Population Projections Australia. Canberra: ABS, 3222.0. AUSTRALIAN BUREAU OF STATISTICS, 2007 Survey of Motor Vehicle Use Australia. Canberra: ABS, 9208.0. CAMERON, M., 1997. Comparison of methods of modelling trends in road casualties in Australasia and the Netherlands. 1997 Road Safety Research and Enforcement Conference, Hobart, Department of Transport, Tasmania. CAMERON, M., DELANEY, A., 2006. Development of Strategies for Best Practice in Speed Enforcement in Western Australia – Summary Report. Restricted. CARSTEN, O.M.J., AND TATE, F.N., 2005. Intelligent Speed Adaptation: accident savings and cost-benefit analysis. Accident Analysis and Prevention, 37(3), 407-416. COMMONWEALTH DEPARTMENT OF HEALTH AND AGED CARE, 2001. Measuring Remoteness: Accessibility/Remoteness Index of Australia (ARIA), Revised Edition. Canberra, ACT: Commonwealth of Australia, (Occasional Papers: New Series Number 14). Available from: http://tinyurl.com/2gj656 DOBBIE, K., 2002. An analysis of fatigue-related crashes on Australian roads using an operational definition of fatigue. Australian Transport Safety Bureau, Report OR23. Canberra, ACT. HILL, D.L., MARCHANT, R.J., GANT, P.D., 2007. Reported road crashes in Western Australia 2005. Road Safety Council of Western Australia. Perth, WA. JACOBS, G., AERON-THOMAS, A. ASTROP, A., 2000. Estimating global road fatalities. TRL Report 445. Transport Research Laboratory: Berkshire, UK. JOHNSTON, I.R., CORBEN, B.F., LOGAN, D.B., 2007. Western Australia – Road Safety Strategy Development: Task 1 – Environmental Scan and its Implications. Monash University Accident Research Centre, discussion draft 19 August 2007. Clayton, Victoria. MEULENERS, L., HENDRIE D., LEGGE, M., CERCARELLI, L.R., 2005. An Evaluation of the Effectiveness of the Black Spot Programs in Western Australia, 2000-2002. Injury Research Centre, School of Population Health, The University of Western Australia, RR155. Crawley, WA. MULVIHILL, C.M., CORBEN, B.F., VULCAN, A.P., 2007. Summary of Road Safety Performance in Western Australia, 2003-2006. Monash University Accident Research Centre, draft 28 August 2007. Clayton, Victoria. NEWSTEAD, S.V., CAMERON, M.H., WATSON, L.M., 2007. Vehicle safety ratings estimated from police reported crash data: 2007 update Australian and New Zealand crashes during 1987-2005. Monash University Accident Research Centre, Report No. 266. Clayton, Victoria. REGAN, M., TRIGGS, T., YOUNG, K., TOMASEVIC, N., MITSOPOULOUS E., STEPHAN, K., TINGVALL, C., 2005. On-Road Evaluation of Intelligent Speed Adaptation, Following Distance Warning and Seatbelt Reminder Systems: Final Results of the Australian TAC SafeCar Project. Volume 1. Monash University Accident Research Centre. Clayton, Victoria.
30 Monash University Accident Research Centre

Development of a new road safety strategy for Western Australia, 2008-2020
Monash University Accident Research Centre 31
RIWOE, D., CUEVAS-CUBRIA, C., AKMAL, A., 2006. A Review of Energy and Greenhouse Gas Emission Projections for Western Australia. ABARE Project 3103. Prepared by Australian Bureau of Agricultural and Resource Economics. VULCAN, A.P., CORBEN, B.F., 1998. Prediction of Australian road fatalities for the year 2010. Presented to: National Road Safety Summit. Canberra, ACT. YOUNG, K.L., REGAN, M.A., HAMMER, M., 2003. Driver Distraction: A Review of the Literature. Monash University Accident Research Centre, Report No. 206. Clayton, Victoria.


Development of a new road safety strategy for Western Australia, 2008-2020
Appendix A: Description of Geographic Areas
In order to develop a strategy addressing the full geographic diversity of Western Australia, the state was separated into three main geographic regions, described as ‘Metro’, ‘Regional’ and ‘Remote’. These divisions were derived from the Accessibility/Remoteness Index of Australia (ARIA) classifications defined in Commonwealth Department of Health and Aged Care (2001). ARIA uses Geographic Information System (GIS) technology to provide a measure of remoteness (from service centres) for all places and points in Australia. Five categories are defined, with remoteness scores assigned to each: 1. Highly Accessible (ARIA score 0-1.84) - relatively unrestricted accessibility to a wide
range of goods and services and opportunities for social interaction;
2. Accessible (ARIA score 1.84-3.51) - some restrictions to accessibility of some goods, services and opportunities for social interaction;
3. Moderately Accessible (ARIA score 3.51-5.80) - significantly restricted accessibility of goods, services and opportunities for social interaction;
4. Remote (ARIA score 5.80-9.08) - very restricted accessibility of goods, services and opportunities for social interaction;
5. Very Remote (ARIA score 9.08-12) - very little accessibility of goods, services and opportunities for social interaction.
The five categories were aggregated into three for modelling purposes:
‘Metro’: Highly Accessible. In Western Australia, this region encompasses metropolitan Perth only;
‘Regional’: Accessible and Moderately Accessible. This region fundamentally comprises the south west of WA, from the Perth metropolitan boundary out to a radius of approximately 300 km.
‘Remote’: Remote and Very Remote. The ‘Remote’ region covers the remainder of WA, including rural towns.
Figure 4 shows each of the regions on a map of Western Australia.
Monash University Accident Research Centre 33

34 Monash University Accident Research Centre
Figure 4. Map of Western Australia, showing ‘Metro’ (scarlet, Inset 1); ‘Regional’ (dark
orange and orange) and ‘Remote’ (pale orange and yellow).

Development of a new road safety strategy for Western Australia, 2008-2020
Appendix B: Model Key Assumptions
Variable values in the table below are for the Optimum Safe System Option as at end August 2007 (METS-WA version 1.08) and are subject to revision.
Table 5. Model key assumptions.
Value Name Description/source
General variables
2.6 Traffic growth per annum (%) Based on vehicle kilometres travelled trend, 2000-2005
-1.6 “Natural” SC reduction per vkt with motorisation (%)
Based on S.C. per vkt, 1990-1996. This period was chosen as one of relatively little activity on the form of new road safety measures.
Fatalities, hospitalisations and serious casualties in metro Perth, regional WA and remote WA (12 variables)
Latest available data, 2006 (E. Ceklic, Office of Road Safety)
2006 Strategy baseline year Year for which latest fatality and hospitalisation data available
2008 Year ‘Zero’ Year immediately prior to strategy commencement1
Infrastructure variables
30 Annual investment in Accident Black Spot (ABS) programs (A$m)
In 2006 dollars
35 Annual investment in Safer Roads Program (SRP) (A$m)
In 2006 dollars
2 ABS investment start year First full year of funding for infrastructure component
2 SRP investment start year First full year of funding for infrastructure component
100 Estimated serious casualties saved per $100m p.a. of ABS investment
Based on WA ABS evaluation (Meuleners, Hendrie, Legge, Cercarelli, 2005)
70 Estimated serious casualties saved per $100m p.a. of SRP investment
Based on the above, but scaled down to allow for likely lower efficiencies
25 Annual investment in Safe System Transformation (SST) of metro Perth intersections (A$m)
In 2006 dollars
2 Metro intersection SST start year First full year of funding for infrastructure component
Monash University Accident Research Centre 35
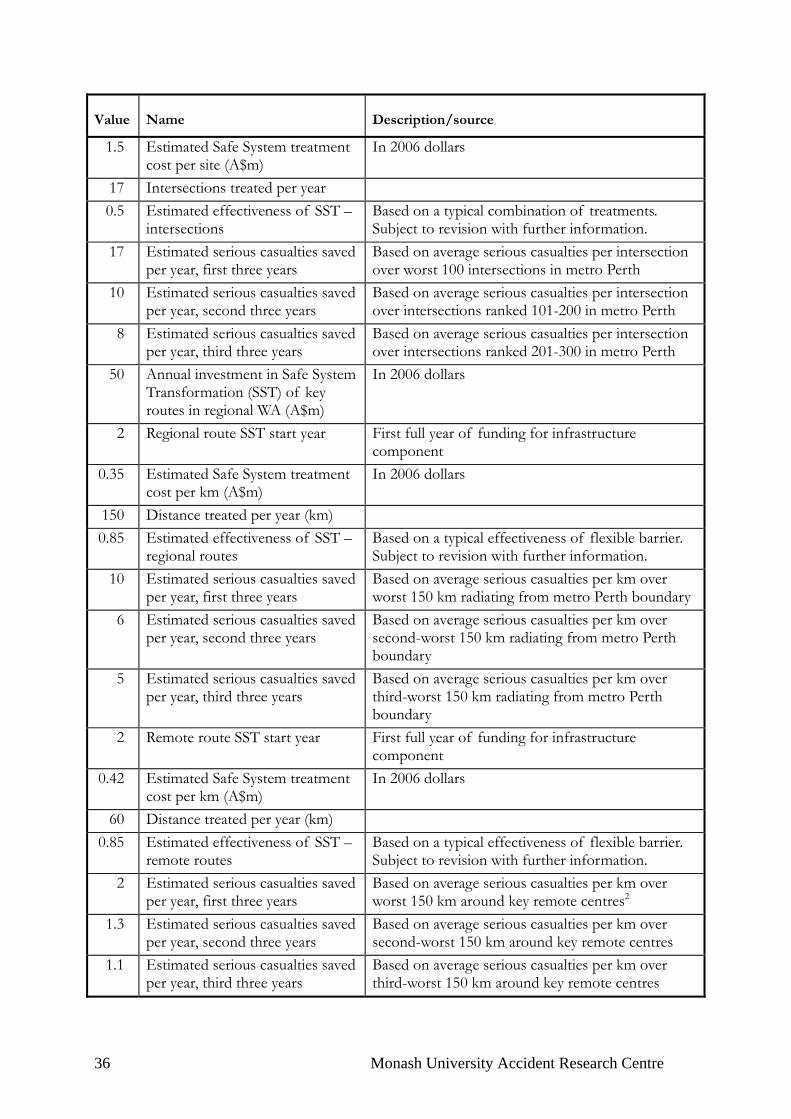
Value Name Description/source
1.5 Estimated Safe System treatment cost per site (A$m)
In 2006 dollars
17 Intersections treated per year
0.5 Estimated effectiveness of SST – intersections
Based on a typical combination of treatments. Subject to revision with further information.
17 Estimated serious casualties saved per year, first three years
Based on average serious casualties per intersection over worst 100 intersections in metro Perth
10 Estimated serious casualties saved per year, second three years
Based on average serious casualties per intersection over intersections ranked 101-200 in metro Perth
8 Estimated serious casualties saved per year, third three years
Based on average serious casualties per intersection over intersections ranked 201-300 in metro Perth
50 Annual investment in Safe System Transformation (SST) of key routes in regional WA (A$m)
In 2006 dollars
2 Regional route SST start year First full year of funding for infrastructure component
0.35 Estimated Safe System treatment cost per km (A$m)
In 2006 dollars
150 Distance treated per year (km)
0.85 Estimated effectiveness of SST – regional routes
Based on a typical effectiveness of flexible barrier. Subject to revision with further information.
10 Estimated serious casualties saved per year, first three years
Based on average serious casualties per km over worst 150 km radiating from metro Perth boundary
6 Estimated serious casualties saved per year, second three years
Based on average serious casualties per km over second-worst 150 km radiating from metro Perth boundary
5 Estimated serious casualties saved per year, third three years
Based on average serious casualties per km over third-worst 150 km radiating from metro Perth boundary
2 Remote route SST start year First full year of funding for infrastructure component
0.42 Estimated Safe System treatment cost per km (A$m)
In 2006 dollars
60 Distance treated per year (km)
0.85 Estimated effectiveness of SST – remote routes
Based on a typical effectiveness of flexible barrier. Subject to revision with further information.
2 Estimated serious casualties saved per year, first three years
Based on average serious casualties per km over worst 150 km around key remote centres2
1.3 Estimated serious casualties saved per year, second three years
Based on average serious casualties per km over second-worst 150 km around key remote centres
1.1 Estimated serious casualties saved per year, third three years
Based on average serious casualties per km over third-worst 150 km around key remote centres
36 Monash University Accident Research Centre

Development of a new road safety strategy for Western Australia, 2008-2020
Value Name Description/source
Speed and speed enforcement variables
1 Start year of enhanced enforcement - metro
1 Start year of enhanced enforcement – rest of WA
0.07 Net effectiveness of enhanced enforcement in reducing serious casualties in metro Perth
Cameron and Delaney (2006)
0.26 Net effectiveness of enhanced enforcement in reducing serious casualties in rest of WA
Cameron and Delaney (2006)
Proportions of serious casualties by speed zone by metro/rest of WA
Latest available data, 2006 (E. Ceklic, Office of Road Safety)
0.93 Estimated mean speed reduction factor from changing 60 km/h speed zones to 50 km/h
Estimate
0.96 Estimated mean speed reduction factor from changing 110 km/h speed zones to 100 km/h
Estimate
0.94 Estimated mean speed reduction factor from reducing all speed zones (except former 60 km/h and 110 km/h) by 10 km/h
Estimate
1 Year of introduction of 60 km/h to 50 km/h
1 Year of introduction of 110 km/h to 100 km/h
3 Year of introduction of 10 km/h reduction in remaining speed limits
Vehicle safety variables
0.81 Proportion of crashed vehicles that are passenger cars/4WDs
i.e. suitable for ESC fitment
0.42 Estimated proportion of serious casualties resulting from single vehicle crashes
No metro/regional remote breakdown available at 28/08/07
0.25 Estimated proportion of serious casualties resulting from side impact crashes
Estimate – no metro/regional remote breakdown available at 28/08/07
Monash University Accident Research Centre 37
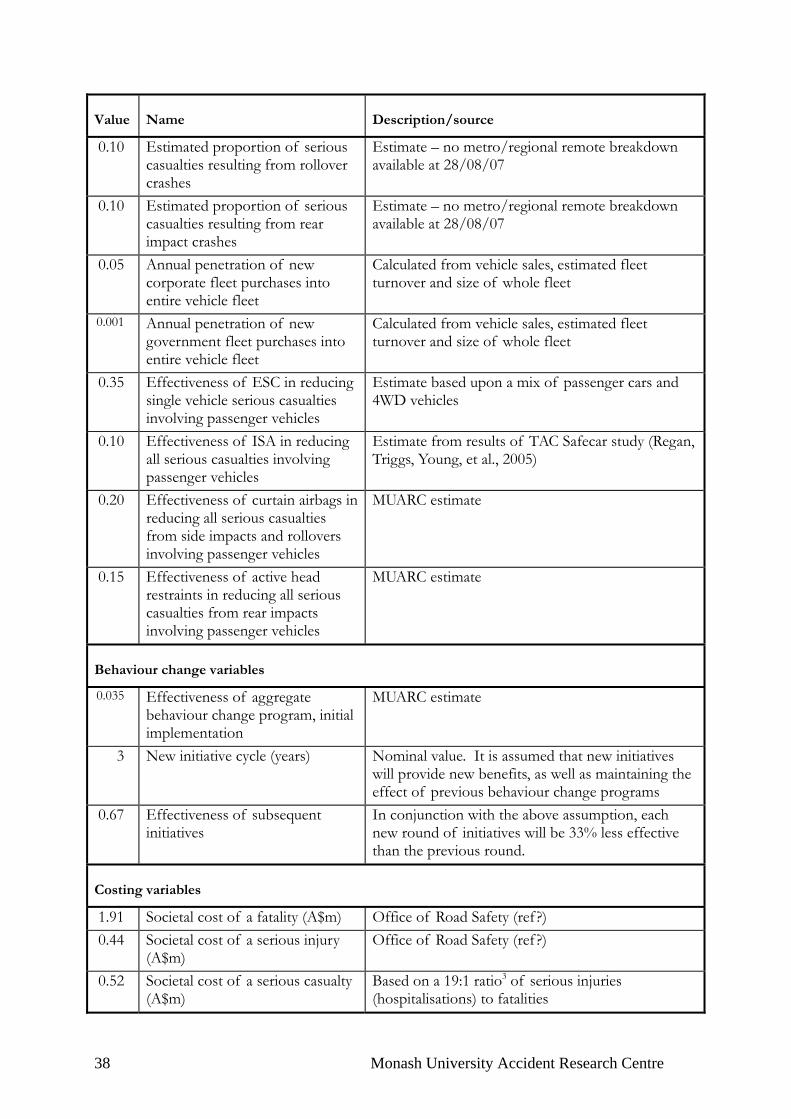
Value Name Description/source
0.10 Estimated proportion of serious casualties resulting from rollover crashes
Estimate – no metro/regional remote breakdown available at 28/08/07
0.10 Estimated proportion of serious casualties resulting from rear impact crashes
Estimate – no metro/regional remote breakdown available at 28/08/07
0.05 Annual penetration of new corporate fleet purchases into entire vehicle fleet
Calculated from vehicle sales, estimated fleet turnover and size of whole fleet
0.001 Annual penetration of new government fleet purchases into entire vehicle fleet
Calculated from vehicle sales, estimated fleet turnover and size of whole fleet
0.35 Effectiveness of ESC in reducing single vehicle serious casualties involving passenger vehicles
Estimate based upon a mix of passenger cars and 4WD vehicles
0.10 Effectiveness of ISA in reducing all serious casualties involving passenger vehicles
Estimate from results of TAC Safecar study (Regan, Triggs, Young, et al., 2005)
0.20 Effectiveness of curtain airbags in reducing all serious casualties from side impacts and rollovers involving passenger vehicles
MUARC estimate
0.15 Effectiveness of active head restraints in reducing all serious casualties from rear impacts involving passenger vehicles
MUARC estimate
Behaviour change variables
0.035 Effectiveness of aggregate behaviour change program, initial implementation
MUARC estimate
3 New initiative cycle (years) Nominal value. It is assumed that new initiatives will provide new benefits, as well as maintaining the effect of previous behaviour change programs
0.67 Effectiveness of subsequent initiatives
In conjunction with the above assumption, each new round of initiatives will be 33% less effective than the previous round.
Costing variables
1.91 Societal cost of a fatality (A$m) Office of Road Safety (ref ?)
0.44 Societal cost of a serious injury (A$m)
Office of Road Safety (ref ?)
0.52 Societal cost of a serious casualty (A$m)
Based on a 19:1 ratio3 of serious injuries (hospitalisations) to fatalities
38 Monash University Accident Research Centre

Development of a new road safety strategy for Western Australia, 2008-2020
Monash University Accident Research Centre 39
1 Although funding is anticipated to be available from FY 2008/09, the model works on calendar years therefore a start year of 2009 was nominated for reasons of conservatism. 2 Estimate only. Data not yet available as at 28 August 2007. 3 Between 1987 and 2001 (inclusive), the ratio of hospitalisations to fatalities in Western Australia averaged about 12:1. However, the trend from 2002 indicates that the figure is likely to approach 19:1 during the life of the strategy. Given that many countermeasures influence fatalities with greater effectiveness than they do to serious injuries, using a high ratio is preferable for model conservativeness.