Development of a Hot Tear Indicator for Use in - University of Iowa
13
1 Development of a Hot Tear Indicator for Use in Casting Simulation C. Monroe C. Beckermann Department of Mechanical and Industrial Engineering The University of Iowa, Iowa City, IA 52242 Abstract A hot tear indicator based on the physics of solidification and deformaion is presented. This indicator is derived using available data from computer simulation of solidification and solid deformation. Hot tears form when the mushy zone is starved of liquid feeding and deformed in tension. The unfed tensile deformation causes a small additional porosity. A physical model based on mass balance is developed to find the additional porosity formed. This additional porosity or porosity due to solid deformation (PSD) is a locator for initiation sites for hot tears in the casting, not a full tear prediction. By evaluating this quantity on the whole geometry, an indicator consistent with physical intuition and past experimental results is found. Using a simulation study of hot tear castings developed in SFSA literature, conclusions are drawn about the usefulness of this indicator. In summary, reducing the strain in the casting, increasing the feeding of the section, decreasing the carbon content from 0.3% to 0.15%, decreasing the sulfur and phosphorus content from 0.08% combined to 0.02%, and eliminating core restraint all decrease the hot tear tendency. Introduction Once hot tears occur in steel castings, they must be fixed by welding or the casting must be scrapped. Considerable effort is spent to eliminate hot tears from castings. Hot tears are identified as cracks, either on the surface or internally in the casting. These cracks may be large and visible to the naked eye or small and found only by magnetic particle inspection. A valve casting shown in figure 1 is an example of a dramatic hot tear. They are caused by a combination of thermal effects, such as hot spot size, and casting restraint, such as cores in cylindrical castings [1]. In addition, composition can affect hot tearing tendency [2]. Physically, two factors contribute to hot tearing in the mushy zone. Hot tears are formed when the mushy zone is (a) cutoff from liquid feeding and is (b) under tensile loading [3]. Figure 1 Dramatic Hot Tear Example [5]. Liquid feeding is caused because the material contracts upon solidification. This reduction in volume will create a pressure drop causing liquid feeding through suction. However, feeding may be cutoff because the solidified dendritic network may prevent flow; then porosity will form. Porosity formation signals that the liquid feeding is cutoff. In addition to causing porosity during solidification, thermal contraction of the solid also causes deformation that creates hot tears. Thermal gradients from non-uniform cooling cause mechanical strains.
Transcript of Development of a Hot Tear Indicator for Use in - University of Iowa

1
Development of a Hot Tear Indicator for Use in Casting Simulation C. Monroe C. Beckermann Department of Mechanical and Industrial Engineering The University of Iowa, Iowa City, IA 52242
Abstract A hot tear indicator based on the physics of solidification and deformaion is presented. This indicator is derived using available data from computer simulation of solidification and solid deformation. Hot tears form when the mushy zone is starved of liquid feeding and deformed in tension. The unfed tensile deformation causes a small additional porosity. A physical model based on mass balance is developed to find the additional porosity formed. This additional porosity or porosity due to solid deformation (PSD) is a locator for initiation sites for hot tears in the casting, not a full tear prediction. By evaluating this quantity on the whole geometry, an indicator consistent with physical intuition and past experimental results is found. Using a simulation study of hot tear castings developed in SFSA literature, conclusions are drawn about the usefulness of this indicator. In summary, reducing the strain in the casting, increasing the feeding of the section, decreasing the carbon content from 0.3% to 0.15%, decreasing the sulfur and phosphorus content from 0.08% combined to 0.02%, and eliminating core restraint all decrease the hot tear tendency.
Introduction Once hot tears occur in steel castings, they must be fixed by welding or the casting must be scrapped. Considerable effort is spent to eliminate hot tears from castings. Hot tears are identified as cracks, either on the surface or internally in the casting. These cracks may be large and visible to the naked eye or small and found only by magnetic particle inspection. A valve casting shown in figure 1 is an example of a dramatic hot tear. They are caused by a combination of thermal effects, such as hot spot size, and casting restraint, such as cores in cylindrical castings [1]. In addition, composition can affect hot tearing tendency [2]. Physically, two factors contribute to hot tearing in the mushy zone. Hot tears are formed when the mushy zone is (a) cutoff from liquid feeding and is (b) under tensile loading [3].
Figure 1 Dramatic Hot Tear Example [5].
Liquid feeding is caused because the material contracts upon solidification. This reduction in volume will create a pressure drop causing liquid feeding through suction. However, feeding may be cutoff because the solidified dendritic network may prevent flow; then porosity will form. Porosity formation signals that the liquid feeding is cutoff. In addition to causing porosity during solidification, thermal contraction of the solid also causes deformation that creates hot tears. Thermal gradients from non-uniform cooling cause mechanical strains.
becker
Text Box
Monroe, C., and Beckermann, C., “Development of a Hot Tear Indicator for Use in Casting Simulation,” in Proceedings of the 58th SFSA Technical and Operating Conference, Paper No. 3.1, Steel Founders' Society of America, Chicago, IL, 2004.

2
These strains create tensile or compressive stresses. Although each solid or liquid phase is incompressible, the mixture is compressible [4]. In compression, liquid is squeezed out. In tension, liquid may be sucked in. However if liquid is not available under tensile loading additional porosity may form. This porosity forms late in solidification along grain boundaries. This porosity is the initiation site for hot tears and is referred to as porosity due to solid deformation (PSD). Experimental work done by the Steel Founders’ Society of America is reported in Research Report #38. By changing casting lengths and section sizes, this report was able to test the effect of variation of hot spot size and strain on hot tears. This report concluded hot tears could be avoided by using filleted corners, smaller section size transitions, and an unrestrained casting and gating layout [5]. These methods enhance liquid feeding and reduce the tensile strain in the casting. Further work also demonstrated that chills and material composition have an effect on hot tearing tendency [1]. Phenomenological models of hot tearing in castings have been developed in the past. Features of these models are discussed in Rappaz et. al. [3]. However, Rappaz et. al. have gone a step further than the phenomenological modeling. Their RDG criterion is derived using a mass balance on a solidifying mushy zone. The authors solve for maximum sustainable strain rate. This is the strain rate beyond which cavitation, or porosity formation, occurs. The paper showed that this criterion agrees with typical “Λ curves” from phenomenological models and some experimental results. The “Λ curves” is a graph of hot tear criteria and composition. The peak occurs close to the maximum freezing range of that alloy. This model is developed using a one-dimensional control volume, which is not immediately applicable to three-dimensional situations. The RDG criterion also is sensitive to the definition of coherency temperature, i.e. temperature when the dentritic network can transmit stresses. In continuous casting, this criterion may be useful because the strain rate is directly related to the velocity of a symmetric casting. However, in shaped casting this criterion is not directly applicable. In another model, Mo et. al. simultaneously solves the energy, liquid and solid momentum, and continuity equations. Using a method similar to RDG criterion, a hot tear criterion based on the liquid pressure drop is used [6]. However, this method also has limitations because porosity formation is not considered. The authors demonstrate the sensitivity of the liquid pressure drop to strain rate, solid to liquid velocity coupling, solid constitutive equations, etc. In the following section, the method for obtaining the porosity due to solid deformation is developed. After the method is introduced, “T” section and cone castings from SFSA research reports are simulated. These simulations are compared to the experimental results. Also, the effect of feeding a hot spot and material composition on hot tearing is shown.
Method The motivation for the method proposed here arises due to the available modules of MAGMAsoft. The modules used include MAGMAsoft porosity module, MAGMAstress, and MAGMAsoft API. The MAGMAsoft porosity module developed by Carlson et. al. calculates the temperature, liquid velocity, and porosity formation in solidifying casting geometries [7]. Note that in the MAGMAsoft porosity module the solid is assumed to be stationary. Then using the temperature results, MAGMAstress predicts the deformation and stress in a solidifying casting. Because MAGMAstress must be run after the MAGMAsoft porosity module, the solid velocity is not available in the solution of the liquid velocities, porosity formation, etc. In order to find hot tears, information from both MAGMAsoft porosity module and MAGMAstress must be used together. MAGMAsoft API module is a C programming language interface extracts data from and creates MAGMAsoft postprocessor files. Using MAGMAsoft API, data from MAGMAsoft porosity module and MAGMAstress can be used to create a hot tear indicator.
As previously noted, hot tears form when the mushy zone is cut off from liquid feeding and is deformed in tension. Similarly, microporosity and some macroporosity form when solidification shrinkage cannot be fed by liquid through the mushy zone. Therefore, hot tears begin as additional porosity formed in excess of the porosity formed with no solid movement. The various contributions to porosity in solidification are found using the continuity equation. The volume averaged multi-phase model under consideration assumes that three phases exist. The three phases considered are the solid metal (s),
3
liquid metal (l), and porosity (p), such that 1=++ pls fff . The statement of continuity or mass balance for the three-phase system is
( ) ( ) 0=++⋅∇+++∂∂
ppplllsssppllss fffffft
vvv ρρρρρρ (1)
where t , f , ρ , and v are the time, phase fraction, density, and velocity respectively. This equation states that the time rate of change of the mass per unit volume of each phase is equal to the flux of mass per unit volume of each phase in and out of the control volume.
Because the solid deformation is solved separately, the effect of the solid velocity on the continuity equation is not known. One way to estimate this effect is to assume that solid deformation will create or destroy porosity. Under this assumption, the pore fraction can be split into two components, or s
plpp fff += . (2)
The first component, lpf , is referred to as porosity or original porosity and includes contributions of
solidification shrinkage, liquid mass flux, etc. The second component, spf , is referred to as additional
porosity or porosity due to the solid deformation (PSD).
Substitute these two porosity fractions from eq. (2) into eq. (1). Neglect the mass flux of the porosity, 0=pppf vρ , because the density of the porosity is several orders of magnitude less than the solid and liquid density. Rearrange the continuity equation in order to identify the contributions; then eq. (1) becomes
( ) ( )( ) ( ) ( )( ) ( ) 0
BA
=⎥⎦⎤
⎢⎣⎡ ⋅∇+−∂∂
+⎥⎦⎤
⎢⎣⎡ ⋅∇+−++−∂∂
444444 3444444 214444444444 34444444444 21ssslp
sllllp
lllss ff
tfff
t ppvv ρρρρρρρρρ . (3)
The MAGMAsoft porosity module solves part A of eq. (3) equal to zero. Part A is the continuity equation if the solid phase is assumed to be stationary. If the solid is stationary then the continuity equation is a balance of the solidification shrinkage, liquid density changes, porosity formation ( l
pf ), and liquid mass flux. If part A is zero, then part B must also equal zero. Part B represents a balance between the additional porosity ( s
pf ) and the solid mass flux. Again, setting each part equal to zero means that the liquid velocity of part A is uninfluenced by the solid velocity in part B, i.e. solid deformation cannot squeeze out or pull in liquid.
In eq. (3), set part A equal to zero. Also assume that the pore density is negligible in comparison
to the liquid density and assume that the liquid density is a constant equal to the density at liquidus. Then, solving for the time rate of change in PSD yields
( ) ( )sssl
sp ff
tvρ
ρ⋅∇=
∂∂ 1 (4)
This equation must be integrated to find the porosity due to solid deformation. The integration limits are found by noting the events that happen as hot tears form. First, hot tears form when liquid feeding is cut off from the mushy zone. So the start of the integration is set to the instant when porosity increases from zero, or 0>l
pf . Second, all solid deformation may not contribute to creation of PSD. Once the material is completely solid then PSD formation stops and all of the mechanical properties become important. Then crack growth and propagation become the dominate hot tear mechanisms. Therefore, the solidus temperature is used as an estimation of the temperature when the mushy zone develops adequate

4
strength to resist PSD formation, or sTT < . Integrating eq. (4) using these integration limits, the equation for PSD is
( ) ( )( )dtfff s
lp
TT
f ssssssl
sp ∫
<
>⋅∇+∇⋅==
0
1PSD vv ρρρ
. (5)
For eq. (5), MAGMAsoft porosity module provides results for the temperature, porosity fraction ( l
pf ), liquid density, solid fraction, and solid density. However, the solid velocity must be obtained from MAGMAstress. The MAGMAstress module uses a simple temperature dependent elastic-plastic mechanical model for a solidifying metal. However even with a simple mechanical model, it is believed that the thermal strains are useable. The thermal strains are given by the thermal expansion / contraction coefficient and the temperature field. Thermal strain drives the deformation in hot tearing.
Two terms are needed from MAGMAstress in eq. (5). The first is the solid velocity, which is
multiplied by the gradient of the solid fraction and the solid density. Note that the gradient of the solid fraction and solid density is small and could be neglected. The solid velocity is found by dividing the change of the displacement, u , by the time step, or
ts ∆
∆uv = . (6)
Second term needed from MAGMAstress is the divergence of the solid velocity. The divergence of the solid velocity is the sum of the normal strain rate components and can be expressed as
( ) ( ) zzyyxxs εεε &&&& ++==⋅∇ εv trace . (7)
The procedure to solve for PSD is completed in three steps. First, run the MAGMAsoft porosity module to solve for the temperature, porosity fraction, liquid density, solid fraction, and solid density. Then using the temperature results, run MAGMAstress to find the displacement and normal strain rate. Finally using MAGMAsoft API, gather these results, calculate PSD from eq. (5), and write new post-processing results showing the value of PSD on the geometry. Comparison of PSD with experimental hot tear results will be examined in the following sections. Note that this indicator does not predict crack growth. The appearance of crack may change the course of stress development. For example, if a site that forms early tears then the stress will be relieved. Other sites may not appear at all if the casting tears. In the following analysis, the indications in the area known to tear will be ranked by the greatest PSD. This of course is not a definitive answer to whether a particular casting will tear or not. However, this will yield information as to whether or not this indicator gives physically reasonable results.
“T” section Casting
Simulation Setup The test castings chosen for this study were based on Research Reports #38 [5] and #103 [8]. The following figure 2 shows some example castings of the proposed “T” section geometry. Thirteen “T” section castings are simulated with the following changes in the geometry and composition. Lengthening the arm will increase the amount of strain on the hot spot. Here, either 26” or 36” arm lengths are used as shown on figure 2. Increasing the arm width, dimension ‘C’ on figure 2, will increase the strength of the arm by providing more material to tear. The arm width is increased from 0.5” to 1.0” and then to 2.0” wide. Increasing the leg width, dimension ‘E’ on figure 2, will increase the hot spot size at the section transition. The leg width increased from 1.0” to 2.0” wide. Note that all of the castings have a thickness of 1.0”. All of the simulations are summarized in Table 1. In addition to eight simulations to test the effect of geometry effects, five simulations are run to show the effect of feeding and composition on hot tearing tendency. To show the effect of feeding on hot tearing, a riser is placed on top of the 2” wide leg section of the casting

5
that has a 36” arm length and 1” arm width. Without the riser this casting is this is identical to simulation 8. Simulations 10 – 12 test the effect of composition on hot tearing. This is accomplished by using extreme compositions of a WCB alloy.
Figure 2 Example of "T" section casting [5].
Table 1 Geometric Simulation Setup
Simulation # Arm Length Arm Width Dim. ‘C’
Leg Width Dim. ‘E’
Composition of Carbon and Sulfur + Phosphorus%
1 26” 0.5” 1.0” C 0.23% and S+P 0.044% 2 26” 0.5” 2.0” C 0.23% and S+P 0.044% 3 26” 1.0” 1.0” C 0.23% and S+P 0.044% 4 26” 1.0” 2.0” C 0.23% and S+P 0.044% 5 26” 2.0” 1.0” C 0.23% and S+P 0.044% 6 26” 2.0” 2.0” C 0.23% and S+P 0.044% 7 36” 1.0” 1.0” C 0.23% and S+P 0.044% 8 36” 1.0” 2.0” C 0.23% and S+P 0.044% 9 36” 1.0” 2.0” w/ Riser C 0.23% and S+P 0.044%
10 Same Geometry as Simulation # 8 C 0.3% and S+P 0.08% 11 Same Geometry as Simulation # 8 C 0.15% and S+P 0.08% 12 Same Geometry as Simulation # 8 C 0.3% and S+P 0.02%
In the Research Report #38, the composition of the steel for the castings was carbon 0.23%,
silicon 0.5%, manganese 0.6%, sulfur 0.028%, and phosphorus 0.016%. This was the composition used in simulations 1-8. The compositions for the final four simulations were chosen to represent a WCB alloy with extreme levels of carbon, sulfur, and phosphorus. Carbon is varied from 0.3% to 0.15%. Sulfur and Phosphorus is added together and varied from 0.08% to 0.02%. The other constituents of the WCB alloy were obtained from the ASM Worldwide Guide to Equivalent Irons and Steels, 4th edition, 2000. All the material properties, except the yield strength, elastic modulus, Poisson ratio, and hardening coefficient were obtained using IDS Solidification Analysis Package, version 1.3.2. The properties that took exception were obtained from extrapolating MAGMAsoft database information. The variation of composition is summarized in Table 1.
The gating was constant for all cases; it consisted of a small riser 2” in diameter connected by a
runner that was 0.5” thick and 1” wide. In the simulation, the ends of the bar were restrained by a mechanical boundary condition of zero displacement and the leg and gating system are not restrained. Figure 3 shows the simulation geometry for three 36” arm length simulations 7-9, gating included. Filling is not simulated; instead the entire casting is initialized above the liquidus at 1600 oC. The results were all generated using the commercial code MAGMAsoft.
6
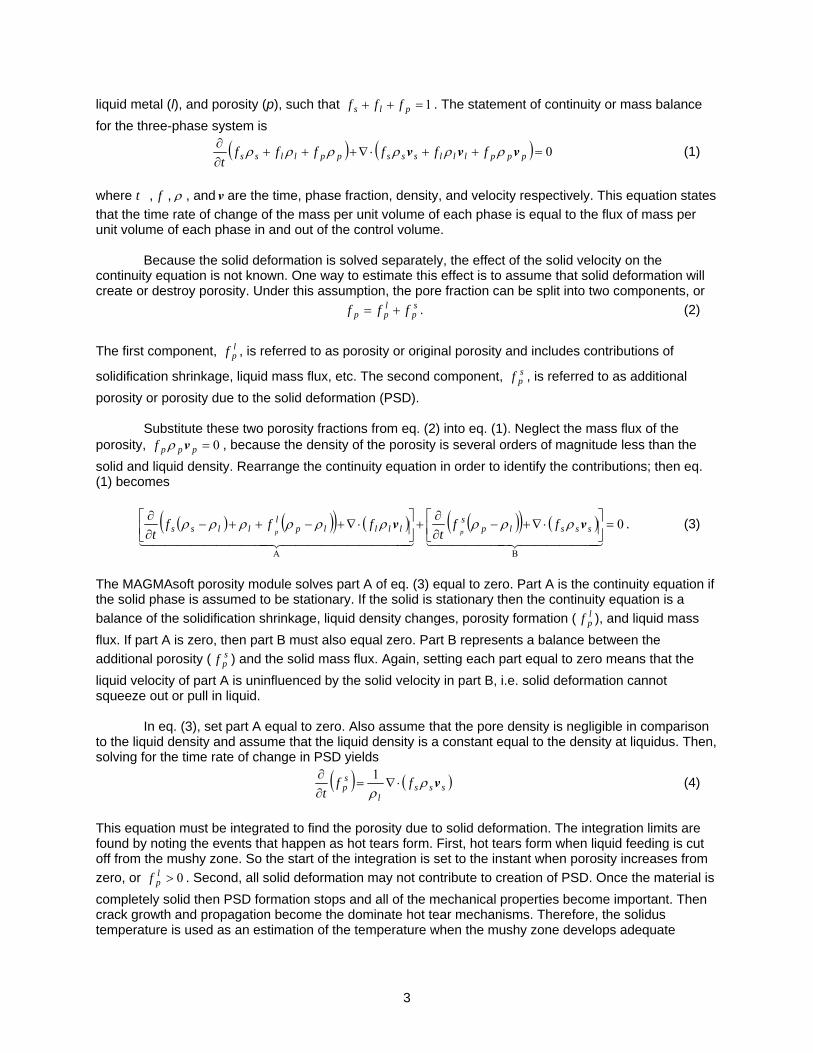
Figure 3 Simulation casting and gating for 36” bar length at (a) 1.0”, (b) 2.0”, (c) 2.0” with Riser.
Grid and Time Step Independence All of the reported results were run at ~150,000 cells in the casting geometry. Additional simulations at ~40,000 cells in the casting geometry were run on the “T” section casting to demonstrate the grid independence of the results. Figure 4 shows the comparison of 40,000 cells to 150,000 cells. This figure shows the PSD average for each simulation. The average PSD was calculated by summing the total amount of void space generated by PSD and dividing by the space occupied by PSD. To filter out small values of PSD that would dilute the average, a minimum cut off of 0.5% PSD was used.
Grid Size Independence
0
0.5
1
1.5
2
2.5
1 2 3 4 5 6 7 8
Simulation #
PSD
% A
vera
ge
(0.5
min
imum
)
150,000 cells 40,000 cells
Figure 4 Comparison of Two Grids for simulations 1-8.
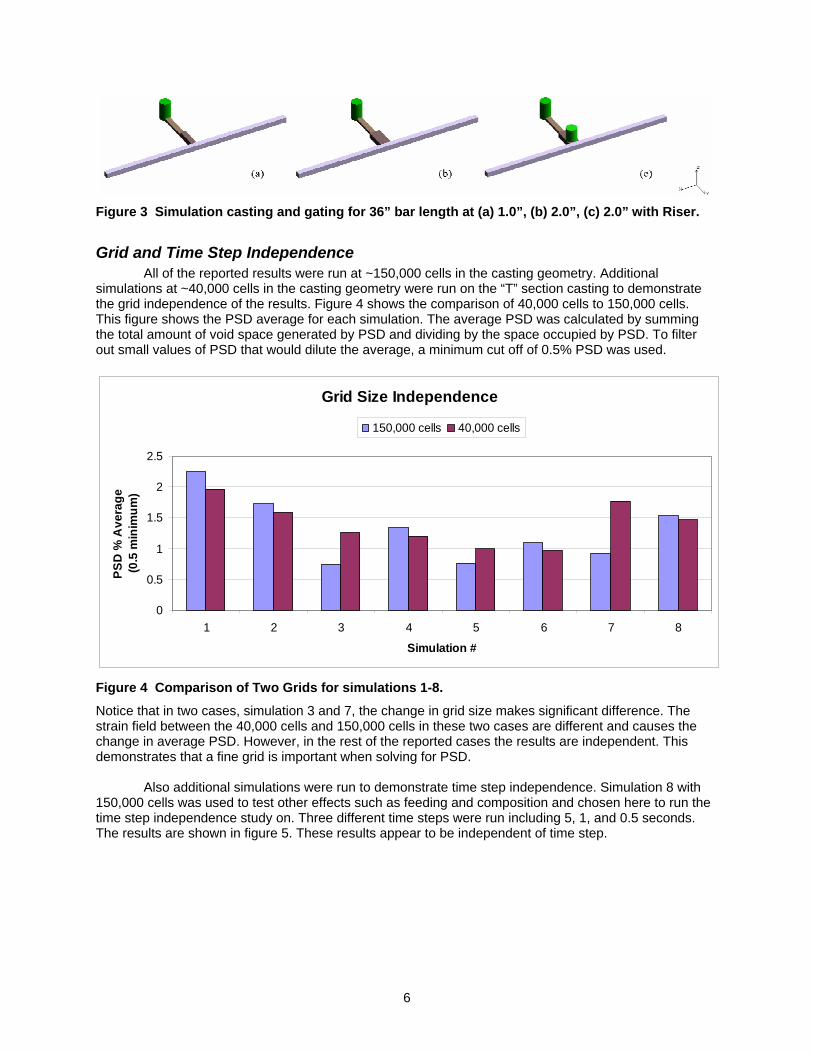
Notice that in two cases, simulation 3 and 7, the change in grid size makes significant difference. The strain field between the 40,000 cells and 150,000 cells in these two cases are different and causes the change in average PSD. However, in the rest of the reported cases the results are independent. This demonstrates that a fine grid is important when solving for PSD. Also additional simulations were run to demonstrate time step independence. Simulation 8 with 150,000 cells was used to test other effects such as feeding and composition and chosen here to run the time step independence study on. Three different time steps were run including 5, 1, and 0.5 seconds. The results are shown in figure 5. These results appear to be independent of time step.
7
Time step Independence for Simulation 8
0
0.5
1
1.5
2
2.5
0.5 1.0 5.0
Time step (seconds)
PSD
% A
vera
ge (0
.5 m
inim
um)
Figure 5 Time Step Independence for simulation 8.
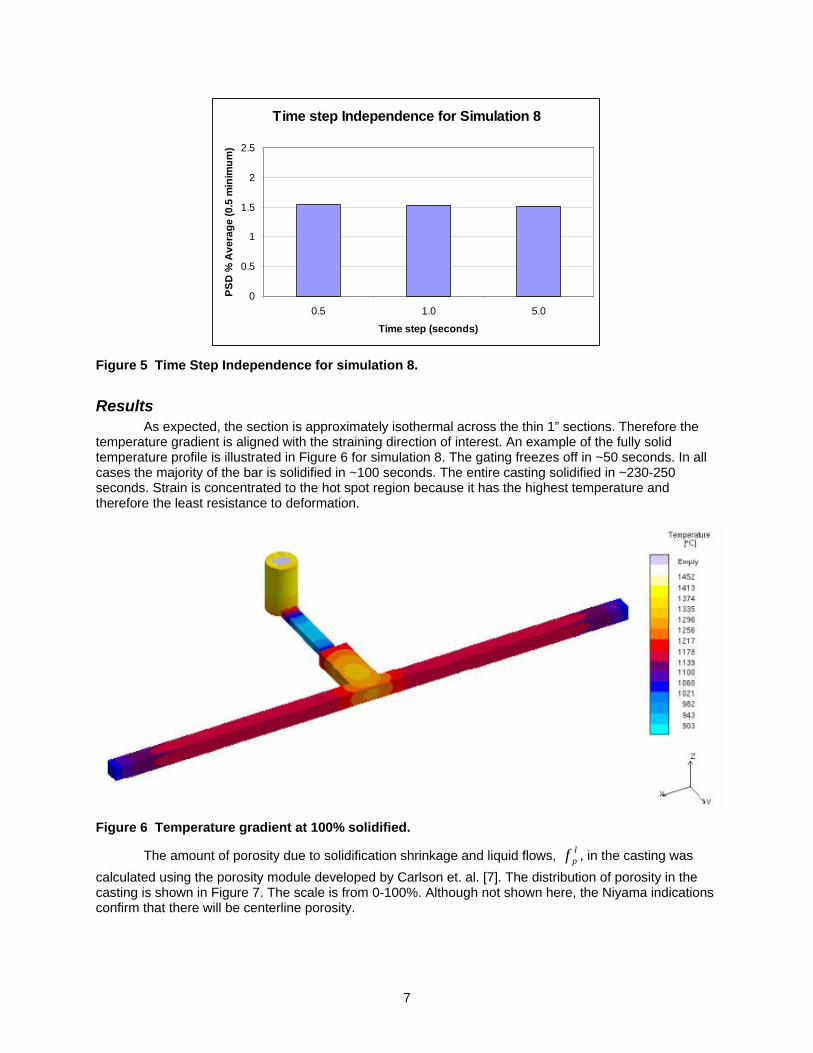
Results As expected, the section is approximately isothermal across the thin 1” sections. Therefore the temperature gradient is aligned with the straining direction of interest. An example of the fully solid temperature profile is illustrated in Figure 6 for simulation 8. The gating freezes off in ~50 seconds. In all cases the majority of the bar is solidified in ~100 seconds. The entire casting solidified in ~230-250 seconds. Strain is concentrated to the hot spot region because it has the highest temperature and therefore the least resistance to deformation.
Figure 6 Temperature gradient at 100% solidified.
The amount of porosity due to solidification shrinkage and liquid flows, lpf , in the casting was
calculated using the porosity module developed by Carlson et. al. [7]. The distribution of porosity in the casting is shown in Figure 7. The scale is from 0-100%. Although not shown here, the Niyama indications confirm that there will be centerline porosity.

8
Figure 7 Porosity due to Solidification Shrinkage and Liquid Flows.
Geometry Effects The porosity due to solid deformation (PSD), s
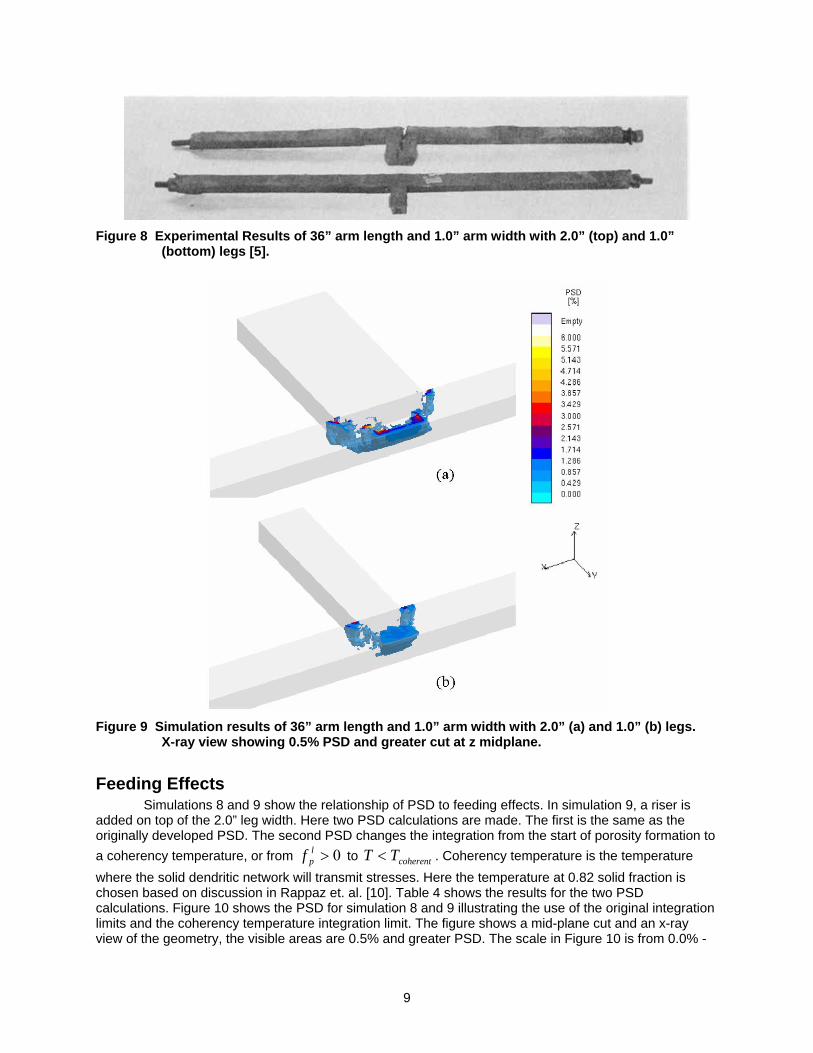
pf , is a measure the creation of initiation sites for cracks. In the test casting, most of the PSD occurs at the hot spot. In order to characterize each simulation an average PSD value will be used. The average was calculated by finding the volume of the PSD in the casting and dividing by the volume of the cells that the PSD occupies. In order to filter out small values of PSD, every PSD location above a 0.5% minimum is used. Table 2 shows the results of the “T” section simulations and prior experimental work. The three castings that showed actual tears are also the simulations with the greatest average PSD. Assuming that PSD acts as a stress concentration, further investigation could be made to associate particular PSD values to crack initiation at various stress levels. This is a promising result showing the use of the PSD indicator. Figure 8 shows two castings from the prior experimental results corresponding to simulations 7 and 8. In the experimental results, simulation 8 tears while simulation 7 does not. Figure 9 shows the PSD for simulations 7 and 8. This figure is an isometric, x-ray view showing indications of PSD that are 0.5% and greater, also cut at mid-plane. The scale in the figure is 0.0% - 6.0% PSD.
Table 2 Summary of results for “T” section Castings.
Simulation # Arm Length Arm Width Dim. ‘C’
Leg Width Dim. ‘E’
PSD Ave. (min 0.5%) Casting Trials [5]
1 26” 0.5” 1.0” 2.247% Heavy Tear 2 26” 0.5” 2.0” 1.724% Multiple Tears 3 26” 1.0” 1.0” 0.742% Untorn 4 26” 1.0” 2.0” 1.334% Untorn 5 26” 2.0” 1.0” 0.762% Untorn 6 26” 2.0” 2.0” 1.087% Untorn 7 36” 1.0” 1.0” 0.923% Untorn 8 36” 1.0” 2.0” 1.530% Heavy Tear
9
Figure 8 Experimental Results of 36” arm length and 1.0” arm width with 2.0” (top) and 1.0”
(bottom) legs [5].
Figure 9 Simulation results of 36” arm length and 1.0” arm width with 2.0” (a) and 1.0” (b) legs.
X-ray view showing 0.5% PSD and greater cut at z midplane.
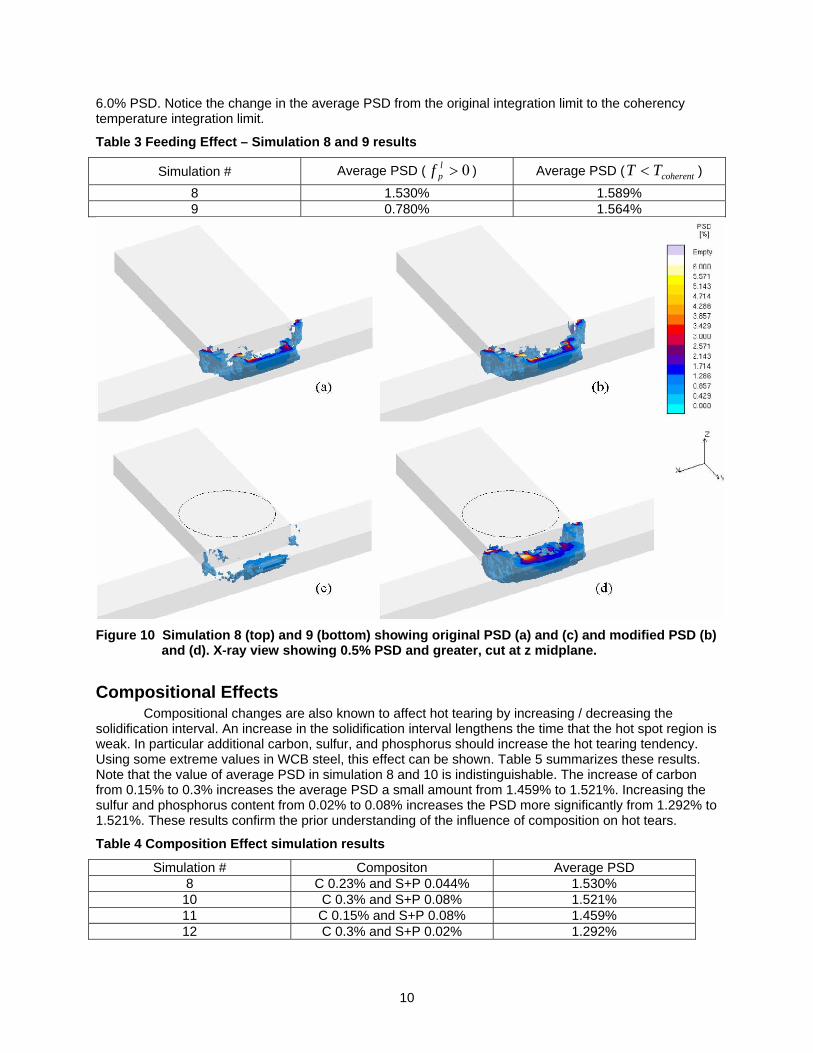
Feeding Effects Simulations 8 and 9 show the relationship of PSD to feeding effects. In simulation 9, a riser is added on top of the 2.0” leg width. Here two PSD calculations are made. The first is the same as the originally developed PSD. The second PSD changes the integration from the start of porosity formation to a coherency temperature, or from 0>l
pf to coherentTT < . Coherency temperature is the temperature where the solid dendritic network will transmit stresses. Here the temperature at 0.82 solid fraction is chosen based on discussion in Rappaz et. al. [10]. Table 4 shows the results for the two PSD calculations. Figure 10 shows the PSD for simulation 8 and 9 illustrating the use of the original integration limits and the coherency temperature integration limit. The figure shows a mid-plane cut and an x-ray view of the geometry, the visible areas are 0.5% and greater PSD. The scale in Figure 10 is from 0.0% -
10
6.0% PSD. Notice the change in the average PSD from the original integration limit to the coherency temperature integration limit.
Table 3 Feeding Effect – Simulation 8 and 9 results
Simulation # Average PSD ( 0>lpf ) Average PSD ( coherentTT < )
8 1.530% 1.589% 9 0.780% 1.564%
Figure 10 Simulation 8 (top) and 9 (bottom) showing original PSD (a) and (c) and modified PSD (b)
and (d). X-ray view showing 0.5% PSD and greater, cut at z midplane.
Compositional Effects Compositional changes are also known to affect hot tearing by increasing / decreasing the solidification interval. An increase in the solidification interval lengthens the time that the hot spot region is weak. In particular additional carbon, sulfur, and phosphorus should increase the hot tearing tendency. Using some extreme values in WCB steel, this effect can be shown. Table 5 summarizes these results. Note that the value of average PSD in simulation 8 and 10 is indistinguishable. The increase of carbon from 0.15% to 0.3% increases the average PSD a small amount from 1.459% to 1.521%. Increasing the sulfur and phosphorus content from 0.02% to 0.08% increases the PSD more significantly from 1.292% to 1.521%. These results confirm the prior understanding of the influence of composition on hot tears.
Table 4 Composition Effect simulation results
Simulation # Compositon Average PSD 8 C 0.23% and S+P 0.044% 1.530%
10 C 0.3% and S+P 0.08% 1.521% 11 C 0.15% and S+P 0.08% 1.459% 12 C 0.3% and S+P 0.02% 1.292%

11
Cone Casting
Simulation Setup In addition to “T” section castings, an additional two castings were simulated based on Research Report #103. This was work done by Charles Bates at the University of Alabama and tests the variation of hot tearing with various binders and core materials [8]. This casting is a cone casting illustrated in Figure 11. The casting develops a hot tear where the ingate meets the cone. This test casting is simulated using a WCB, 1022 alloy using IDS solidification analysis package and MAGMAsoft database to calculate the material properties similar to the previous “T” section simulation setup. The composition of the 1022 alloy is 0.23% carbon, 0.4% silicon, 1.25% manganese, 0.045% phosphorus, 0.045% sulfur, and 0.2% chromium. Two types of cores are simulated. The strong core is simulated using thermal expansion coefficients for furan sand [9]. The weak core is simulated using a zero stress boundary condition. The heat transfer is the same in both cases.
Figure 11 Cone Casting [8].
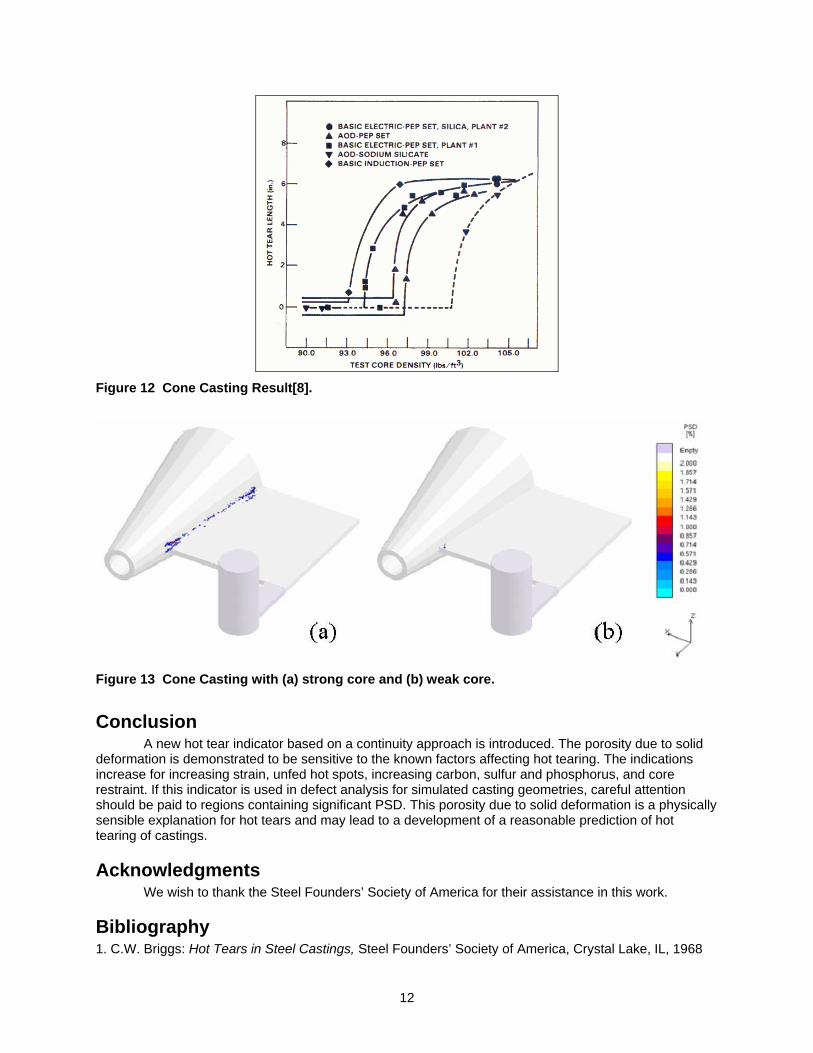
Results The tearing of the cone casting occurs at the junction of the ingate and the cone. Figure 12 shows a result from the experimental work [8]. This graph shows that the hot tear length is dependent on the density of the core. The hot tear length reduces to zero at smaller core densities. In the simulation this density effect is included. By using experimentally calculated thermal expansion coefficients, the high-density, strong core is modeled. By using a zero stress condition boundary at the core surface, the low-density, weak core is modeled. Figure 13 shows the results of the simulation. This figure is an x-ray view showing indications of PSD that are 0.5% and greater. The scale in the figure is 0.0% - 2.0% PSD.
12
Figure 12 Cone Casting Result[8].
Figure 13 Cone Casting with (a) strong core and (b) weak core.
Conclusion A new hot tear indicator based on a continuity approach is introduced. The porosity due to solid deformation is demonstrated to be sensitive to the known factors affecting hot tearing. The indications increase for increasing strain, unfed hot spots, increasing carbon, sulfur and phosphorus, and core restraint. If this indicator is used in defect analysis for simulated casting geometries, careful attention should be paid to regions containing significant PSD. This porosity due to solid deformation is a physically sensible explanation for hot tears and may lead to a development of a reasonable prediction of hot tearing of castings.
Acknowledgments We wish to thank the Steel Founders’ Society of America for their assistance in this work.
Bibliography 1. C.W. Briggs: Hot Tears in Steel Castings, Steel Founders’ Society of America, Crystal Lake, IL, 1968
13
2. A. Chojecki, I. Telejko, and T. Bogacz, Influence of chemical composition on the hot tearing formation of cast steel, Theoretical and Applied Fracture Mechanics, volume 27, 1997, pg 99-105. 3. M. Rappaz, J.-M. Drezet, and M. Gremaud, A New Hot-Tearing Criterion, Metallurgical and Materials Transactions A, volume 30A, February 1999, pg 449-455. 4. C. L. Martin, M. Braccini, and M. Suery, Rheological behavior of the mushy zone at small strains, Materials Science and Engineering A, volume A325, 2002, pg 292-301. 5. C.W. Briggs, Elements of Design for Prevention of Hot Tearing in Steel Castings, Steel Founders’ Society of America Research Report, No. 38, Technical Research Committee, SFSA, February 1957. 6. A. Mo, M. M’Hamdi, and H. G. Fjaer: “Mushy Zone Rheology and Hot Tearing in Aluminum DC Casting”, pp. 199-206, Modeling of Casting, Welding and Advanced Solidification Processes X, edited by D. M. Stefanescu, J.A. Warren, M.R. Jolly, and M J.M. Krane, Warrendale, PA, 2003. 7. K. Carlson, Z. Lin, R. Hardin, C. Beckermann, G. Mazurkevich, M. Schneider: “Modeling of Porosity Formation and Feeding Flow in Steel Casting”, pg 295-302, Modeling of Casting, Welding and Advanced Solidification Processes X, edited by D. M. Stefanescu, J.A. Warren, M.R. Jolly, and M J.M. Krane, Warrendale, PA, 2003. 8. C. E. Bates, Effects of Melt Practice, Core Binder, and Core Density on Hot Tearing of Cast Steel, Steel Founders’ Society of America Research Report , No. 103, Techincal Research Committee, SFSA, January 1991. 9. S. Ou and C. Beckermann, “Simulation of Dimensional Changes in Steel Casting”, in Proceedings of the Steel Founders’ Society of America Technical and Operating Conference, Chicago, IL, November 2003. 10. M. Rappaz, J.-M. Drezet, P.-D. Grasso, and A. Jacot: “Hot Tearing and Coalescence: Two Deeply-Connected Phenomena”, pg 53-60, Modeling of Casting, Welding and Advanced Solidification Processes X, edited by D. M. Stefanescu, J.A. Warren, M.R. Jolly, and M J.M. Krane, Warrendale, PA, 2003.