Development of a Fully Automated Software System for Rapid ...
40
Development of a Fully Automated Software System for Rapid Analysis/ Processing of the Falling Weight Deflectometer Data Final Report February 2009 Sponsored by Iowa Department of Transportation (CTRE Project 04-177 Phase 2) Non-Destructive Evaluation of Iowa Pavements Phase 2:
Transcript of Development of a Fully Automated Software System for Rapid ...

Development of a Fully Automated Software System for Rapid Analysis/Processing of the Falling Weight Deflectometer Data
Final ReportFebruary 2009
Sponsored byIowa Department of Transportation(CTRE Project 04-177 Phase 2)
Non-Destructive Evaluation of Iowa Pavements Phase 2:

About CTREThe mission of the Center for Transportation Research and Education (CTRE) at Iowa State University is to develop and implement innovative methods, materials, and technologies for improving transportation efficiency, safety, and reliability while improving the learning environment of students, faculty, and staff in transportation-related fields.
Disclaimer NoticeThe contents of this report reflect the views of the authors, who are responsible for the facts and the accuracy of the information presented herein. The opinions, findings and conclusions expressed in this publication are those of the authors and not necessarily those of the sponsors.
The sponsors assume no liability for the contents or use of the information contained in this document. This report does not constitute a standard, specification, or regulation.
The sponsors do not endorse products or manufacturers. Trademarks or manufacturers’ names appear in this report only because they are considered essential to the objective of the document.
Non-Discrimination Statement Iowa State University does not discriminate on the basis of race, color, age, religion, national origin, sexual orientation, gender identity, genetic information, sex, marital status, disability, or status as a U.S. veteran. Inquiries can be directed to the Director of Equal Opportunity and Compliance, 3280 Beardshear Hall, (515) 294-7612.
Iowa Department of Transportation Statements Federal and state laws prohibit employment and/or public accommodation discrimination on the basis of age, color, creed, disability, gender identity, national origin, pregnancy, race, religion, sex, sexual orientation or veteran’s status. If you believe you have been discriminated against, please contact the Iowa Civil Rights Commission at 800-457-4416 or Iowa Department of Transportation’s affirmative action officer. If you need accommodations because of a disability to access the Iowa Department of Transportation’s services, contact the agency’s affirmative action officer at 800-262-0003.
The preparation of this document was financed in part through funds provided by the Iowa Department of Transportation through its “Agreement for the Management of Research Conducted by Iowa State University for the Iowa Department of Transportation,” and its amendments.
The opinions, findings, and conclusions expressed in this publication are those of the authors and not necessarily those of the Iowa Department of Transportation.
Technical Report Documentation Page
1. Report No. 2. Government Accession No. 3. Recipient’s Catalog No.
CTRE Project 04-177 Phase 2
4. Title and Subtitle 5. Report Date
Non-Destructive Evaluation of Iowa Pavements Phase 2: Development of a Fully
Automated Software System for Rapid Analysis/Processing of the Falling Weight
Deflectometer Data
February 2009
6. Performing Organization Code
7. Author(s) 8. Performing Organization Report No.
Halil Ceylan, Kasthurirangan Gopalakrishnan, Sunghwan Kim, Alper Guclu, and
M. Birkan Bayrak
CTRE Project 04-177 Phase 2
9. Performing Organization Name and Address 10. Work Unit No. (TRAIS)
Center for Transportation Research and Education
Iowa State University
2711 South Loop Drive, Suite 4700
Ames, IA 50010-8664
11. Contract or Grant No.
12. Sponsoring Organization Name and Address 13. Type of Report and Period Covered
Iowa Department of Transportation
800 Lincoln Way
Ames, IA 50010
Final Report
14. Sponsoring Agency Code
15. Supplementary Notes
Visit www.intrans.iastate.edu for color PDFs of this and other research reports.
16. Abstract
The Office of Special Investigations at Iowa Department of Transportation (DOT) collects FWD data on regular basis to evaluate
pavement structural conditions. The primary objective of this study was to develop a fully-automated software system for rapid
processing of the FWD data along with a user manual. The software system automatically reads the FWD raw data collected by the
JILS-20 type FWD machine that Iowa DOT owns, processes and analyzes the collected data with the rapid prediction algorithms
developed during the phase I study. This system smoothly integrates the FWD data analysis algorithms and the computer program being
used to collect the pavement deflection data. This system can be used to assess pavement condition, estimate remaining pavement life,
and eventually help assess pavement rehabilitation strategies by the Iowa DOT pavement management team. This report describes the
developed software in detail and can also be used as a user-manual for conducting simulation studies and detailed analyses.
17. Key Words 18. Distribution Statement
FWD—NDT—pavement No restrictions.
19. Security Classification (of this
report)
20. Security Classification (of this
page)
21. No. of Pages 22. Price
Unclassified. Unclassified. 38 NA
Form DOT F 1700.7 (8-72) Reproduction of completed page authorized

NON-DESTRUCTIVE EVALUATION OF IOWA PAVEMENTS
PHASE 2:
DEVELOPMENT OF A FULLY AUTOMATED SOFTWARE SYSTEM
FOR RAPID ANALYSIS/PROCESSING OF THE FALLING WEIGHT
DEFLECTOMETER DATA
Final Report
February 2009
Principal Investigator
Halil Ceylan
Associate Professor
Center for Transportation Research and Education, Iowa State University
Co-Principal Investigator
Kasthurirangan Gopalakrishnan
Research Assistant Professor
Center for Transportation Research and Education, Iowa State University
Research Assistant
Sunghwan Kim, Alper Guclu and M. Birkan Bayrak
Authors
Halil Ceylan, Kasthurirangan Gopalakrishnan, Sunghwan Kim, Alper Guclu, and M. Birkan
Bayrak
Sponsored by
the Iowa Department of Transportation
(CTRE Project 04-177 Phase 2)
Preparation of this report was financed in part
through funds provided by the Iowa Department of Transportation
through its Research Management Agreement with the
Institute for Transportation
A report from
Center for Transportation Research and Education
Iowa State University
2711 South Loop Drive, Suite 4700
Ames, IA 50010-8664
Phone: 515-294-8103
Fax: 515-294-0467
www.intrans.iastate.edu

v
TABLE OF CONTENTS
ACKNOWLEDGMENTS ............................................................................................................ vii
EXECUTIVE SUMMARY ........................................................................................................... ix
INTRODUCTION ...........................................................................................................................1
OBJECTIVES ..................................................................................................................................2
PROGRAM USER MANUAL ........................................................................................................2
Program Main Menus ..........................................................................................................2 Flexible Pavement Analysis, Plotting, and Summary Menus ..............................................5 Rigid Pavement Analysis, Plotting, and Summary Menus ................................................18
Composite Pavement Analysis, Plotting, and Summary Menus........................................23
SUMMARY ...................................................................................................................................27
REFERENCES ..............................................................................................................................28

vi
LIST OF FIGURES
Figure 1. FWD analysis program main menu ..................................................................................3 Figure 2. ANN Information button in main menu ...........................................................................3 Figure 3. Screenshot of main menu on choosing ANN info show option .......................................4
Figure 4. Sample Excel sheet showing ANN model information ....................................................4 Figure 5. Flexible pavement analyses menus: (a) conventional, (b) full depth ...............................5 Figure 6. General information window ............................................................................................6 Figure 7. Screen shot of FWD data extraction through open FWD data file button:
(a) choosing raw FWD file, (b) FWD data extracted ...........................................................7
Figure 8. Extracted FWD data: (a) variable FWD load analysis, (b) 9-kip-constant FWD load
analysis .................................................................................................................................8 Figure 9. Filter options menu ...........................................................................................................9
Figure 10. Filtering the FWD data: (a) range check, (b) range and model check .........................10 Figure 11. Sample pavement analysis results identifying analysis results from FWD data that
falls outside filtering range ................................................................................................11
Figure 12. Sample Excel sheet outputs of flexible pavement analysis: (a) conventional,
(b) full-depth ......................................................................................................................12
Figure 13. Sample Excel sheet output statistics of pavement analysis ..........................................13 Figure 14. Plot option window.......................................................................................................14 Figure 15. Sample Excel plots for conventional pavement analysis results ..................................15
Figure 16. Sample Excel plots for full-depth asphalt pavement analysis results ...........................16 Figure 17. Output statistics summary sheet for flexible pavement: (a) conventional,
(b) full- depth .....................................................................................................................17 Figure 18. Rigid pavement analysis menu .....................................................................................18 Figure 19. Screen shot of Equations sheet .....................................................................................19
Figure 20. Screen shot of inputs in rigid pavement analysis menu: (a) hide normalization,
(b) show normalization ......................................................................................................20 Figure 21. Sample Excel sheet of rigid pavement analysis outputs ...............................................21 Figure 22. Sample Excel sheet rigid pavement analysis charts .....................................................22
Figure 23. Output statistics summary sheet for rigid pavement analysis ......................................23 Figure 24. Composite pavement analysis menu ............................................................................24
Figure 25. Sample Excel sheet outputs of composite pavement analysis ......................................25 Figure 26. Sample Excel sheet charts of composite pavement analysis ........................................26
Figure 27. Output statistics summary sheet for composite pavement analysis..............................27

vii
ACKNOWLEDGMENTS
The authors would like to thank the Iowa Department of Transportation (DOT) for sponsoring
this research. The project technical advisory committee (TAC) members from the Iowa DOT,
including Fereidoon (Ben) Behnami, Chris B. Brakke, Todd D. Hanson, Kevin B. Jones, and
Jason S. Omundson, are gratefully acknowledged for their guidance, support, and direction
throughout the research.


ix
EXECUTIVE SUMMARY
This study is a follow-up to the IA DOT Project (CTRE Project 04-177), Nondestructive
Evaluation of Iowa Pavements - Phase 1. The objective of this Phase II study is the development
of a fully-automated software system for rapid processing of the FWD data accompanied by a
user manual. The software system can automatically read the FWD raw data collected by the
Iowa DOT’s JILS-20 type FWD machine, process and analyze the collected data with the rapid
prediction algorithms developed during the phase I study. This report, which can also be used as
a user-manual for the software, contains examples or case studies for all three pavement types
(flexible, rigid, and composite) illustrating the step-by-step procedure in using the software.
Some of specific features of the fully-automated software system described in this report are
summarized below:
A comprehensive pavement structural analysis toolbox incorporating all three
common pavement types (flexible, rigid, and composite)
Capability of automatically reading the FWD raw data collected by the JILS-20 type
FWD machine that Iowa DOT owns
Integration of all the Artificial Neural Network (ANN) models developed as part of
Phase I research into a comprehensive unified framework
Rapid backcalculation of pavement layer moduli and prediction of critical pavement
responses from FWD data (100,000 deflection basins analyzed in less than a second)
Useful for both project-level and network-level pavement structural evaluation
Visualization of results through automatic plotting capability
Commonly used Import/Export options for transporting data
Automatic generation of output statistics


1
INTRODUCTION
Evaluating structural condition of existing, in-service pavements is a part of the routine
maintenance and rehabilitation activities undertaken by the most Departments of Transportation
(DOTs). In the field, the pavement deflection profiles (or basins) gathered from the
nondestructive Falling Weight Deflectometer (FWD) test data are typically used to evaluate
pavement structural condition. FWD testing is often preferred over destructive testing methods
because it is faster than destructive tests and does not entail the removal of pavement materials.
This kind of evaluation requires the use of backcalculation type structural analysis to determine
pavement layer stiffnesses and as a result estimate pavement remaining life. Although the Office
of Special Investigations at Iowa DOT has collected the FWD data on regular basis, the
pavement layer moduli backcalculation techniques used so far have been cumbersome and time
consuming. Thus, there was a need for more efficient and faster methods.
During the first phase of the Iowa (DOT) Project (CTRE Project 04-177), “Nondestructive
Evaluation of Iowa Pavements-Phase I”, advanced yet easy-to-use backcalculation models were
developed using the ANN methodology (Ceylan et al, 2007). ANNs are very adaptable and
support the real-time applications of the developed models. These ANN models are capable of
predicting pavement layer stiffnesses as well as pavement critical responses (forward modeling)
from FWD test results. For the three pavement types, over 300 models in total were developed
for varying input parameters. The primary pavement types considered were flexible
(conventional and full-depth), rigid, and composite.
Predicted flexible pavement parameters were, EAC-modulus of hot-mix asphalt (HMA) or asphalt
concrete (AC), Kb-base modulus parameter, ERi-subgrade resilient modulus, εAC-tensile strain at
the bottom of asphalt layer, εSG-compressive strain at the top of subgrade, and σD-subgrade
deviator stress.
For rigid pavements, EPCC-modulus of portland cement concrete (PCC), ks-coefficient of
subgrade reaction, σPCC-tensile stress at the bottom of the PCC layer, and radius of relative
stiffness (RRS) were predicted.
In the case of composite pavements (CPs), where an AC surface is overlaid on top of an existing
PCC pavement, EAC, EPCC, ks, σPCC (tensile stress at the bottom of the PCC), and εAC were
predicted.
The developed methodology was successfully verified using results from long-term pavement
performance (LTPP) FWD test results, as well as Iowa DOT FWD field data. All successfully
developed ANN models were incorporated into a Microsoft Excel spreadsheet-based
backcalculation software toolbox with a user-friendly interface. The phase I study also concluded
that the developed nondestructive pavement evaluation methodology for analyzing the FWD
deflection data would be adopted by Iowa DOT pavement and material engineers and
technicians, who do not employ any preferable FWD backcalculation analysis technique.

2
OBJECTIVES
This phase II follow-up study of IA DOT Project (CTRE Project 04-177) focused on the
development of a fully-automated software system for rapid processing of the FWD data. The
software system can automatically read the FWD raw data collected by the JILS-20 type FWD
machine that Iowa DOT owns, process and analyze the collected data with the algorithms being
developed during the phase I study. This system smoothly integrates the FWD data analysis
algorithms and the computer program being used to collect the pavement deflection data. With
the implementation of the developed software system the FWD data can be filtered, processed
and analyzed on-the-fly.
PROGRAM USER MANUAL
The password-protected, Excel-based software toolbox was developed using Microsoft Visual
Basic programming language and Excel macros. In case of troubleshooting, the user is requested
to change the macro security (Tools Macro Security) to the “medium” or “low” level to
allow macros to run. The Excel spreadsheets provide the user interaction for data editing and
pasting, displaying results, charts, and tables, and for displaying statistical information. The
Excel sheets include a main menu, analysis menu (for each pavement type), plotting menu, and
summary menu.
Program Main Menus
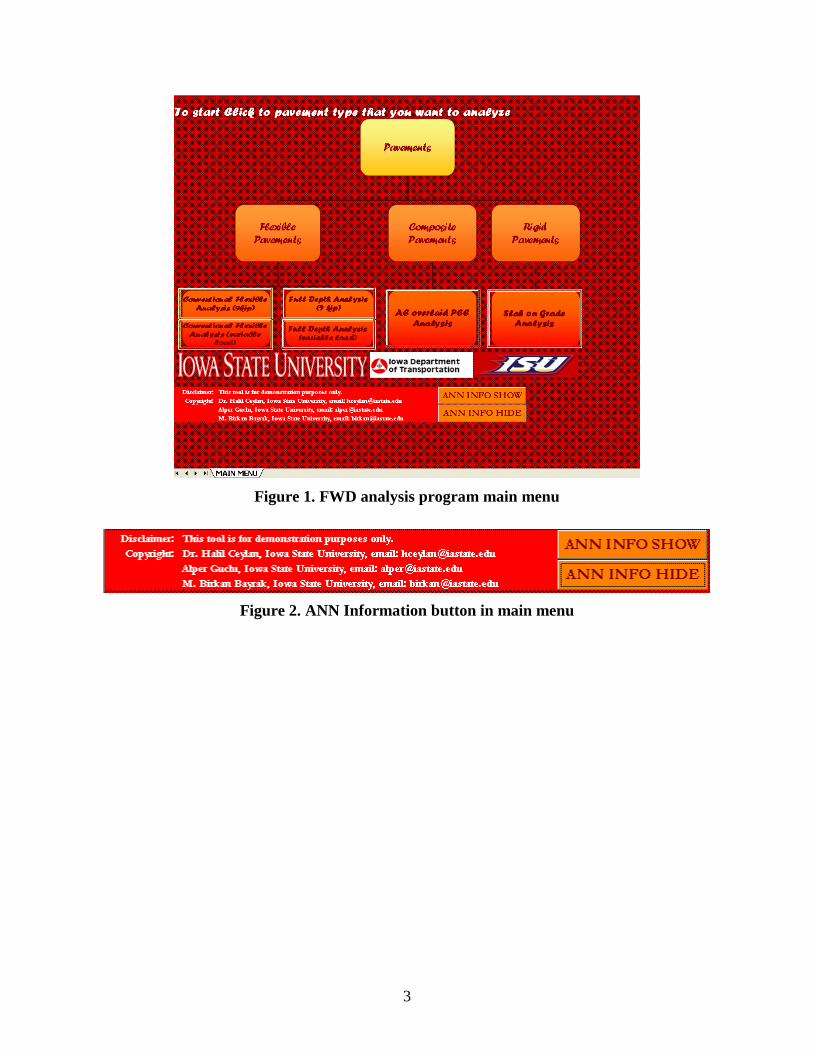
The program starts by displaying the main menu (Figure 1). As a first step, users are expected to
select the pavement type (conventional, full-depth flexible, composite or rigid pavements) by
clicking on it to activate the selected pavement analysis Excel sheet/interface. There are six
Excel pavement analysis sheets, including the conventional flexible pavement analysis module
with 9-kip and variable FWD load, the full-depth flexible pavements analysis module with 9-kip
and variable FWD load, and the composite and rigid pavement analysis module with 9-kip FWD
loading. The software toolbox is programmed to give warning messages if the user clicks
anywhere else.
While working with the toolbox, all other Excel features are accessible, including open, close,
copy, paste, save, save as, print, and print settings. When the user quits the toolbox, all the charts
and results for the analysis, except the last data entered, will be deleted. To retain the results,
they should be copied into another spreadsheet.
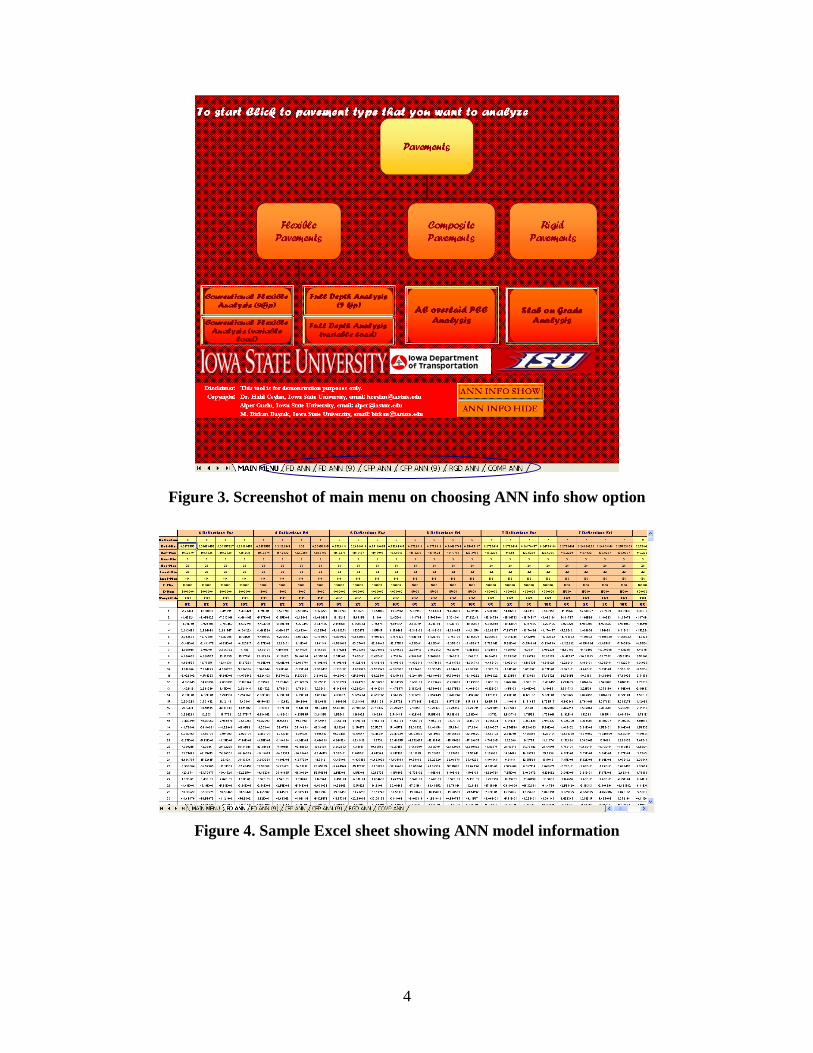
The ANN information buttons in Figure 2 provide the user general information about the ANN
models employed. Six Excel Spreadsheets as shown in Figure 3 appear upon clicking “ANN info
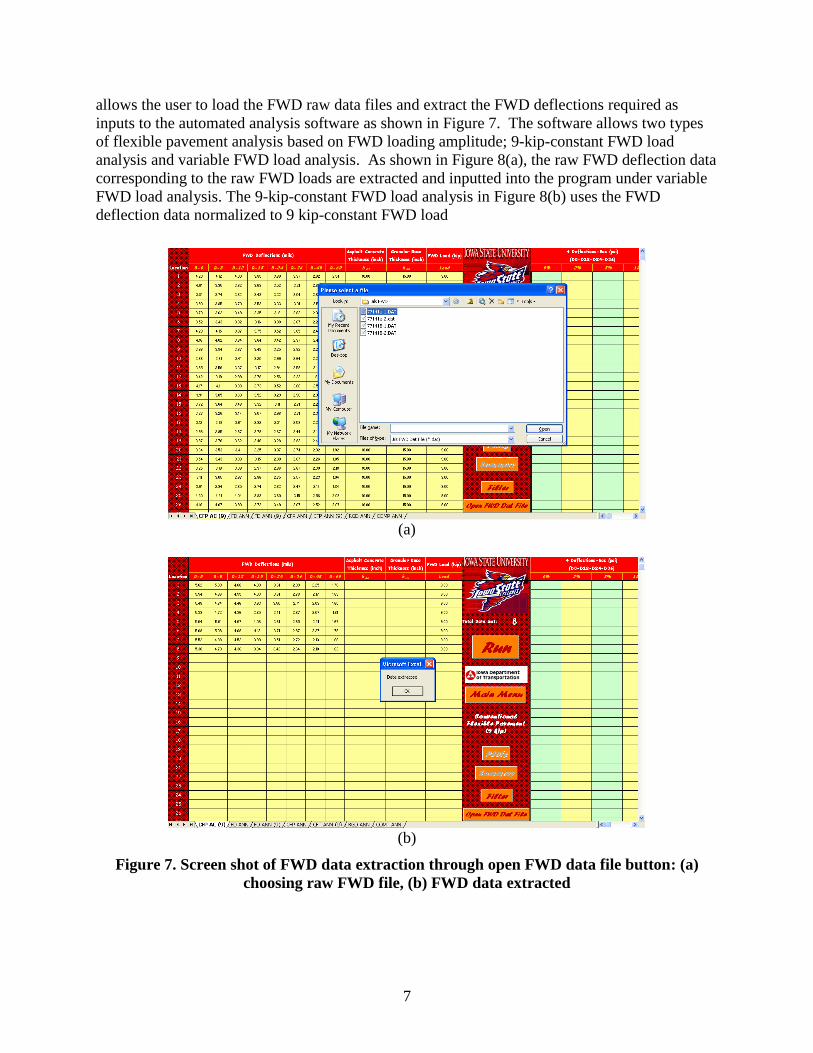
show” button. Each of Excel sheets as shown in Figure 4 contain the ANN model information
such as the ranges of the data used in the development of ANN models. These Excel sheets can
be hid again by clicking on “ANN info hide”.
3
Figure 1. FWD analysis program main menu
Figure 2. ANN Information button in main menu
4
Figure 3. Screenshot of main menu on choosing ANN info show option
Figure 4. Sample Excel sheet showing ANN model information

5
Flexible Pavement Analysis, Plotting, and Summary Menus
Pavement analysis menu consists of three main sections: inputs, analysis tool, and outputs. The
user can provide the software with the information required for analysis in the inputs section of
the pavement analysis menu. The analysis tool allows the user to process the data and analyze
with several functions. The results of analysis are provided in the outputs section of the
pavement analysis menu. Typical layouts of the conventional and full depth flexible pavement
analysis menus are shown in Figure 5.
(a)
(b)
Figure 5. Flexible pavement analyses menus: (a) conventional, (b) full depth
Inputs
Analysis
Tool
OutputsInputs
Analysis
Tool
Outputs
InputsAnalysis
Tool OutputsInputsAnalysis
Tool OutputsInputsAnalysis
Tool Outputs

6
After selecting one of the pavement types from the main menu, a general information window
appears. Its purpose is to get information that represents a project site at the beginning of each
analysis (see Figure 6.). The user is required to fill in the information to continue with pavement
analysis.
General information inputs will be displayed with each graph at the end of the analysis to
identify the project information.
Figure 6. General information window
At the next step, the user is expected to enter the FWD deflection data and other required inputs.
These include pavement layer information (layer thicknesses), and FWD load (for variable FWD
load analysis). Depending on the pavement type, the number of layers can be changed. The input
requirements for conducting conventional flexible pavement analyses include FWD deflection
data, asphalt concrete thickness, granular base thickness, and FWD load. The input requirements
for conducting full depth asphalt pavement analyses are same as those for conventional flexible
pavement analyses except that granular base thickness is not required. If any of the required
parameter is missing, the program will display an error message which reads “No Data” in the
results section.
The default units used in the program are US customary units. FWD deflection data (D0 till D60)
should be entered in mils (10-3
inches), layer thickness in inches, and FWD load should be in
kips. The program will not run correctly if the inputs are entered in different units or if they are
out of range. The user is requested to refer to the report for the appropriate ranges of these
parameters. Reported results are pavement layer modulus values, strains, and stresses. Modulus
and stress values are reported in psi and strains are reported in micro-strains (x106).
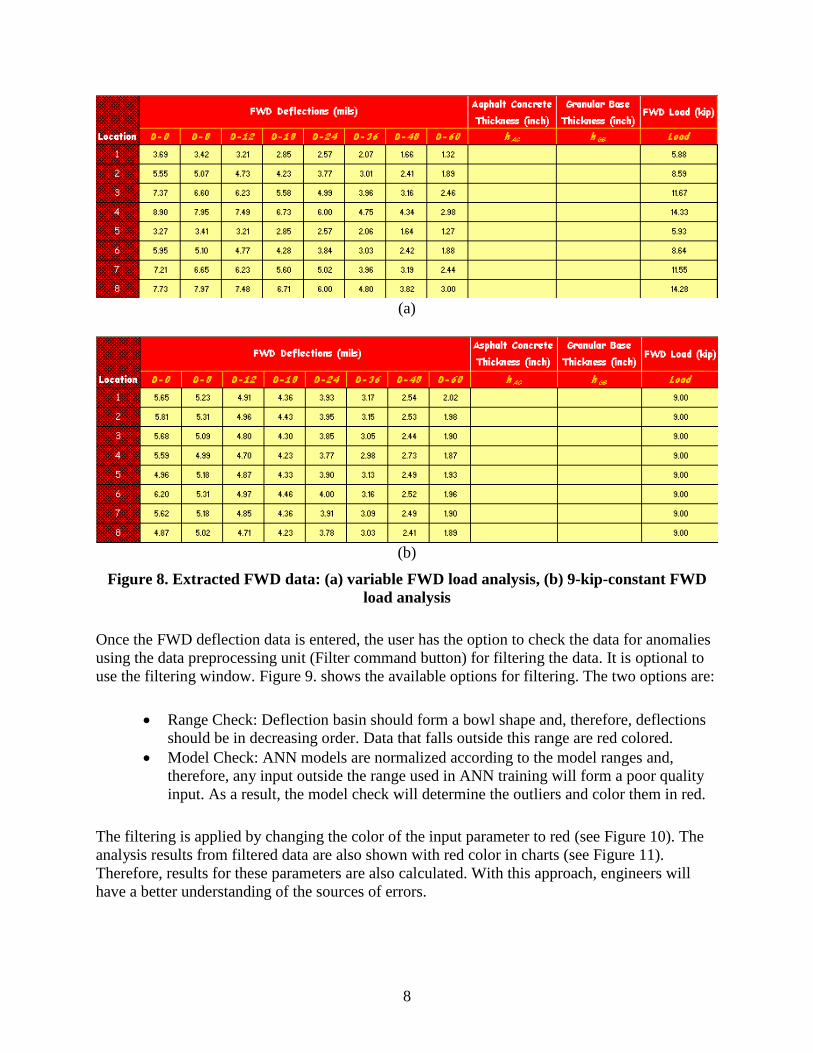
User can enter the FWD deflection database manually or obtain those directly from the JILS-20
type FWD raw data files clicking “Open FWD data file”. The “Open FWD data file” command
7
allows the user to load the FWD raw data files and extract the FWD deflections required as
inputs to the automated analysis software as shown in Figure 7. The software allows two types
of flexible pavement analysis based on FWD loading amplitude; 9-kip-constant FWD load
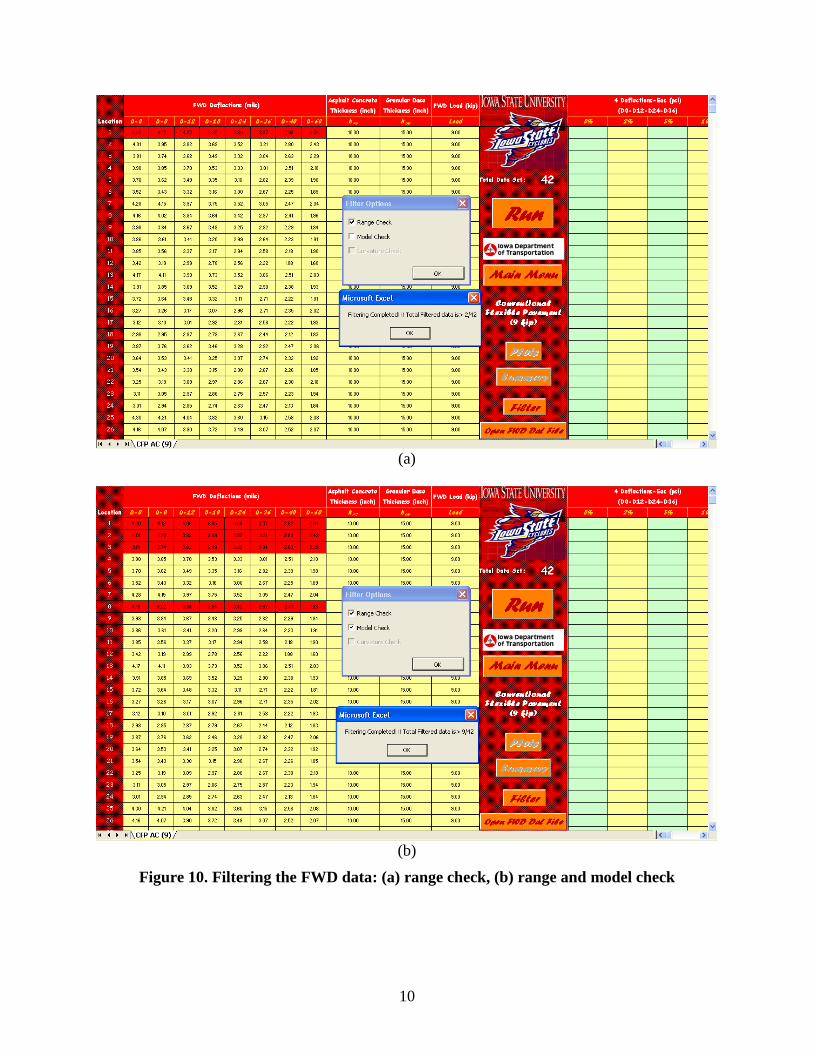
analysis and variable FWD load analysis. As shown in Figure 8(a), the raw FWD deflection data
corresponding to the raw FWD loads are extracted and inputted into the program under variable
FWD load analysis. The 9-kip-constant FWD load analysis in Figure 8(b) uses the FWD
deflection data normalized to 9 kip-constant FWD load
(a)
(b)
Figure 7. Screen shot of FWD data extraction through open FWD data file button: (a)
choosing raw FWD file, (b) FWD data extracted
8
(a)
(b)
Figure 8. Extracted FWD data: (a) variable FWD load analysis, (b) 9-kip-constant FWD
load analysis
Once the FWD deflection data is entered, the user has the option to check the data for anomalies
using the data preprocessing unit (Filter command button) for filtering the data. It is optional to
use the filtering window. Figure 9. shows the available options for filtering. The two options are:
Range Check: Deflection basin should form a bowl shape and, therefore, deflections
should be in decreasing order. Data that falls outside this range are red colored.
Model Check: ANN models are normalized according to the model ranges and,
therefore, any input outside the range used in ANN training will form a poor quality
input. As a result, the model check will determine the outliers and color them in red.
The filtering is applied by changing the color of the input parameter to red (see Figure 10). The
analysis results from filtered data are also shown with red color in charts (see Figure 11).
Therefore, results for these parameters are also calculated. With this approach, engineers will
have a better understanding of the sources of errors.

9
Figure 9. Filter options menu
10
(a)
(b)
Figure 10. Filtering the FWD data: (a) range check, (b) range and model check
11
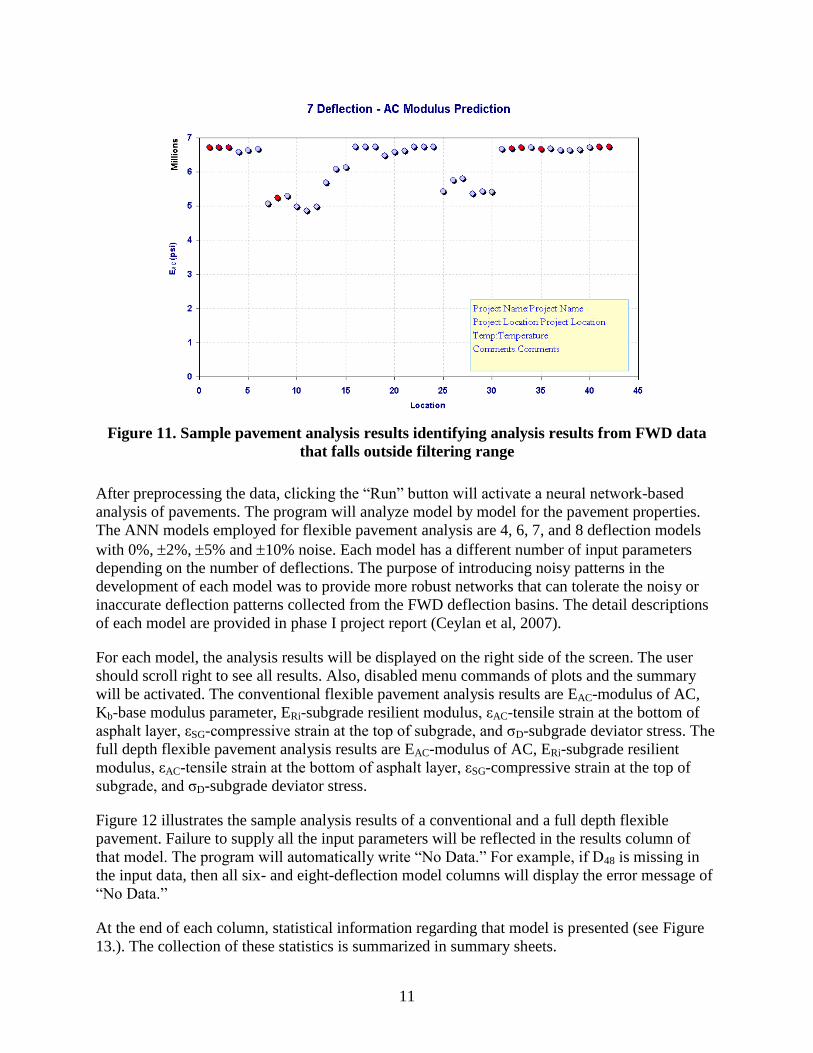
Figure 11. Sample pavement analysis results identifying analysis results from FWD data
that falls outside filtering range
After preprocessing the data, clicking the “Run” button will activate a neural network-based
analysis of pavements. The program will analyze model by model for the pavement properties.
The ANN models employed for flexible pavement analysis are 4, 6, 7, and 8 deflection models
with 0%, 2%, 5% and 10% noise. Each model has a different number of input parameters
depending on the number of deflections. The purpose of introducing noisy patterns in the
development of each model was to provide more robust networks that can tolerate the noisy or
inaccurate deflection patterns collected from the FWD deflection basins. The detail descriptions
of each model are provided in phase I project report (Ceylan et al, 2007).
For each model, the analysis results will be displayed on the right side of the screen. The user
should scroll right to see all results. Also, disabled menu commands of plots and the summary
will be activated. The conventional flexible pavement analysis results are EAC-modulus of AC,
Kb-base modulus parameter, ERi-subgrade resilient modulus, εAC-tensile strain at the bottom of
asphalt layer, εSG-compressive strain at the top of subgrade, and σD-subgrade deviator stress. The
full depth flexible pavement analysis results are EAC-modulus of AC, ERi-subgrade resilient
modulus, εAC-tensile strain at the bottom of asphalt layer, εSG-compressive strain at the top of
subgrade, and σD-subgrade deviator stress.
Figure 12 illustrates the sample analysis results of a conventional and a full depth flexible
pavement. Failure to supply all the input parameters will be reflected in the results column of
that model. The program will automatically write “No Data.” For example, if D48 is missing in
the input data, then all six- and eight-deflection model columns will display the error message of
“No Data.”
At the end of each column, statistical information regarding that model is presented (see Figure
13.). The collection of these statistics is summarized in summary sheets.

12
(a)
(b)
Figure 12. Sample Excel sheet outputs of flexible pavement analysis: (a) conventional, (b)
full-depth

13
Figure 13. Sample Excel sheet output statistics of pavement analysis
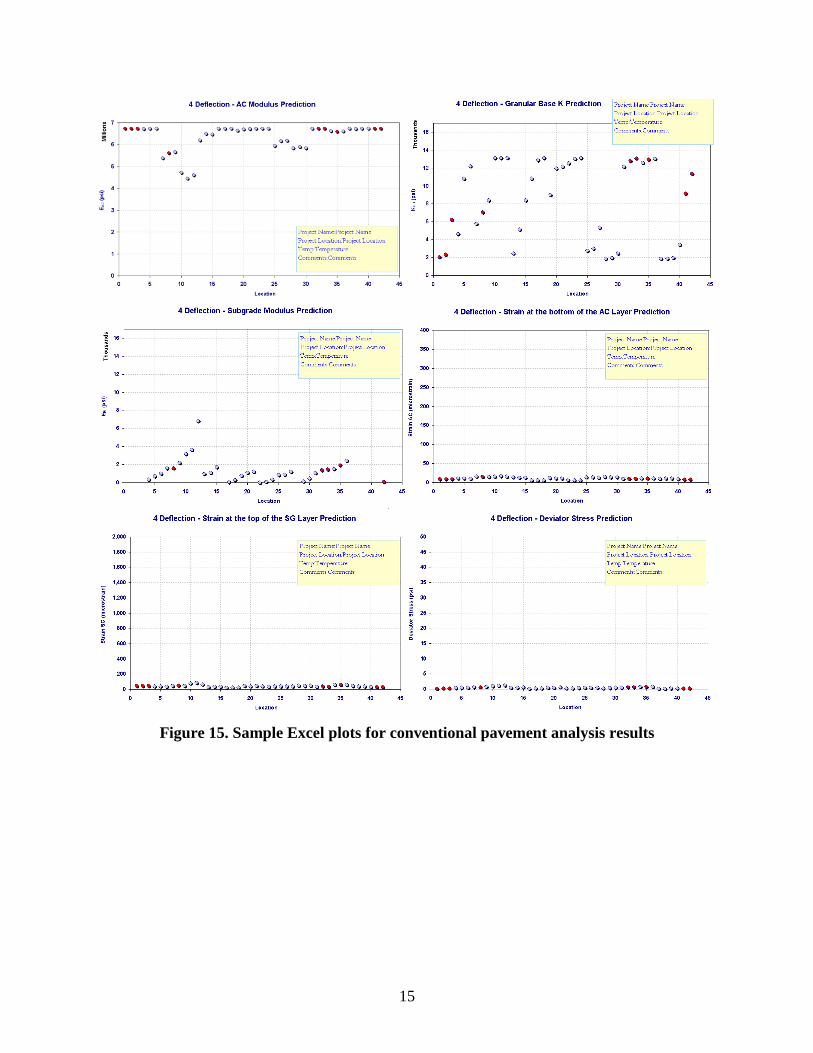
The plot button will be enabled after the backcalculation analysis is complete. The plot option
window appears after clicking on the plot button (see Figure 14). With this window, the user can
select the models to display on charts. Selected models will be plotted in the form of
backcalculated parameter versus FWD test location. Provided that the data is from a specified
section, the first data will be represented as the starting point, and each subsequent data is
assumed to correspond to FWD test locations along the path of the pavement system. Filtered
data from the preprocessor will be displayed in red, whereas all others will be in blue. The upper
right corner will display a textbox containing general information about the project. Figure 15
and Figure 16 illustrate color-coded conventional and the full depth flexible pavement analysis
results, respectively, from 4-deflection ANN model with 0 % noise.

14
Figure 14. Plot option window
15
Figure 15. Sample Excel plots for conventional pavement analysis results

16
Figure 16. Sample Excel plots for full-depth asphalt pavement analysis results
The Summary button within the pavement analysis Excel spreadsheet is disabled until the “Run”
button is clicked. It summarizes the statistical output information for each model. It opens up a
new Excel sheet with tables of each output and summary statistics for every model (see Figure
17). The reported statistical information include:
Average (or mean value): The average value along the section.
Standard deviation: A common measure of the dispersion. It shows how widely the
data is spread from the mean value.
Coefficient of variation (CV): CV is a measure of the dispersion of probability
distribution. It is the ratio of the standard deviation to the mean. It allows the user to

17
compare the CV of populations that have different mean values. It is reported as a
percentage.
(a)
(b)
Figure 17. Output statistics summary sheet for flexible pavement: (a) conventional, (b) full-
depth

18
Rigid Pavement Analysis, Plotting, and Summary Menus
Similar to flexible pavement analysis menu, the rigid pavement analysis menu consists of three
main sections: inputs, analysis tool, and outputs as shown in Figure 18. Required input
parameters for rigid pavement analysis are deflection data, pavement layer information (layer
thicknesses, degree of bonding, and estimated moduli ratio), and FWD load. To simplify the
ANN-based backcalculation methodology, PCC layer and base layer thicknesses are combined
into one thickness value (effective PCC thickness) through the concept of equivalent thickness
(Ceylan et al, 2007). While conducting the analysis, the effective PCC thickness can be
automatically calculated from pavement layer information and used in the backcalculation
analysis.
The analysis tool functionalities in the rigid pavement analysis menu are identical to those in
flexible pavement analysis menu except two additional functions-“equation” and “show
normalization.” The “Equation” button, once clicked, is meant to provide the equations sheet as
shown in Figure 19. This equation sheet summarizes the equations used for calculation of
effective PCC thickness for fully bonded PCC layers, unbonded PCC layers and partially bonded
PCC layers. The “show normalization” button is enabled only after the backcalculation analysis
is complete. The raw FWD deflection data corresponding to the raw FWD loads are normalized
to the 9-kip constant FWD load during backcalculation analysis. As shown in Figure 20, the
normalized FWD data can be shown or hid in rigid pavement analysis menu by clicking “show
normalization” or “hide normalization.” Preprocessing the data for rigid pavement analysis such
as obtaining and filtering the FWD data is same as that for flexible pavement analysis.
Figure 18. Rigid pavement analysis menu
InputsAnalysis
Tool OutputsInputsAnalysis
Tool OutputsInputsAnalysis
Tool Outputs

19
Figure 19. Screen shot of Equations sheet

20
(a)
(b)
Figure 20. Screen shot of inputs in rigid pavement analysis menu: (a) hide normalization,
(b) show normalization

21
Similar to flexible pavement analysis, the program can analyze model by model by clicking the
“Run” button after preprocessing the data. The ANN models employed for rigid pavement
analysis are 4-, 6-, 7-, and 8-deflection models with 0%, 2%, 5% and 10% noise. Each model
has a different number of input parameters depending on the number of deflections. The purpose
of introducing noisy patterns in the development of each model was to provide more robust
networks that can tolerate the noisy or inaccurate deflection patterns collected from the FWD
deflection basins. Detailed descriptions of each model are provided in phase I project report
(Ceylan et al, 2007).
For each model, the analysis results will be displayed on the right side of the screen. The user
should scroll right to see all results. Also, disabled menu commands of Plots and Summary will
be activated after the analysis is complete. The rigid pavement analysis results are EPCC-modulus
of PCC, ks-coefficient of subgrade reaction, σPCC-tensile stress at the bottom of the PCC layer,
and radius of relative stiffness (RRS)
Figure 21 illustrates the sample analysis results from a rigid pavement run. Figure 22 illustrates
color-coded rigid pavement analysis results of 4-deflection ANN model with 0 % noise which
are generated from the plotting function. Figure 23 illustrates sample Excel sheet with the output
tables and their statistics for every model generated by clicking “summary” button.
Figure 21. Sample Excel sheet of rigid pavement analysis outputs

22
Figure 22. Sample Excel sheet rigid pavement analysis charts

23
Figure 23. Output statistics summary sheet for rigid pavement analysis
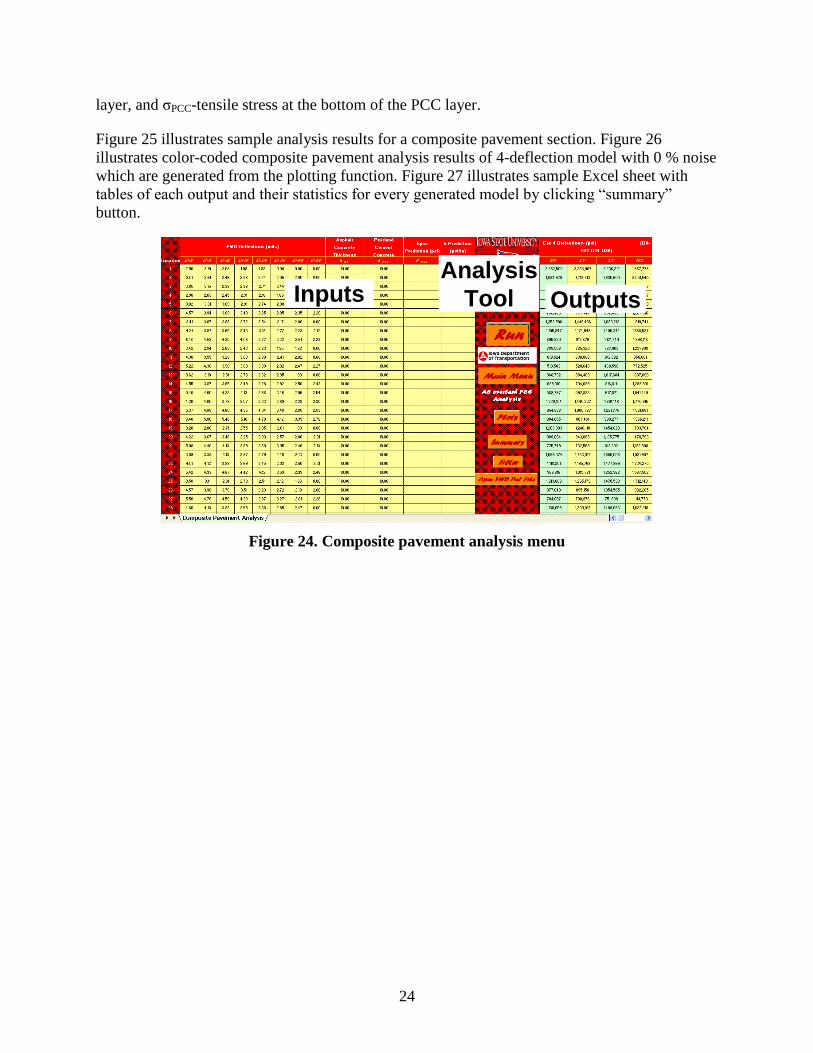
Composite Pavement Analysis, Plotting, and Summary Menus
The AC overlaid PCC-type composite pavement analysis menu also consists of three main
sections: inputs, analysis tool, and outputs as shown in Figure 24. Required input parameters for
composite pavement analysis are deflection data, pavement layer information (layer thicknesses,
PCC modulus predictions, and coefficient of subgrade reaction predictions), and FWD load. The
analysis tool functionalities in composite analysis menu are identical to those in flexible
pavement analysis menu. This means preprocessing of the data for composite pavement analysis
is same as that for flexible pavement analysis.
Similar to flexible and rigid pavement analysis, the program analyzes the data model by model
by clicking the “Run” button after preprocessing the data. The ANN models employed for
composite pavement analysis are 4-, 6-, 7-, and 8- deflection models with 0%, 2%, 5% and
10% noise. Each model has a different number of input parameters depending on the number of
deflections and a different level of noise to provide more robust networks. Detailed descriptions
of each model are provided in phase I project report (Ceylan et al, 2007).
For each model, the analysis results will be displayed on the right side of the screen. The user
should scroll right to see all results. Also, disabled menu commands of plots and the summary
will be activated. The composite pavement analysis results are EAC-modulus of AC, EPCC-
modulus of PCC, ks-coefficient of subgrade reaction, εAC-tensile strain at the bottom of asphalt
24
layer, and σPCC-tensile stress at the bottom of the PCC layer.
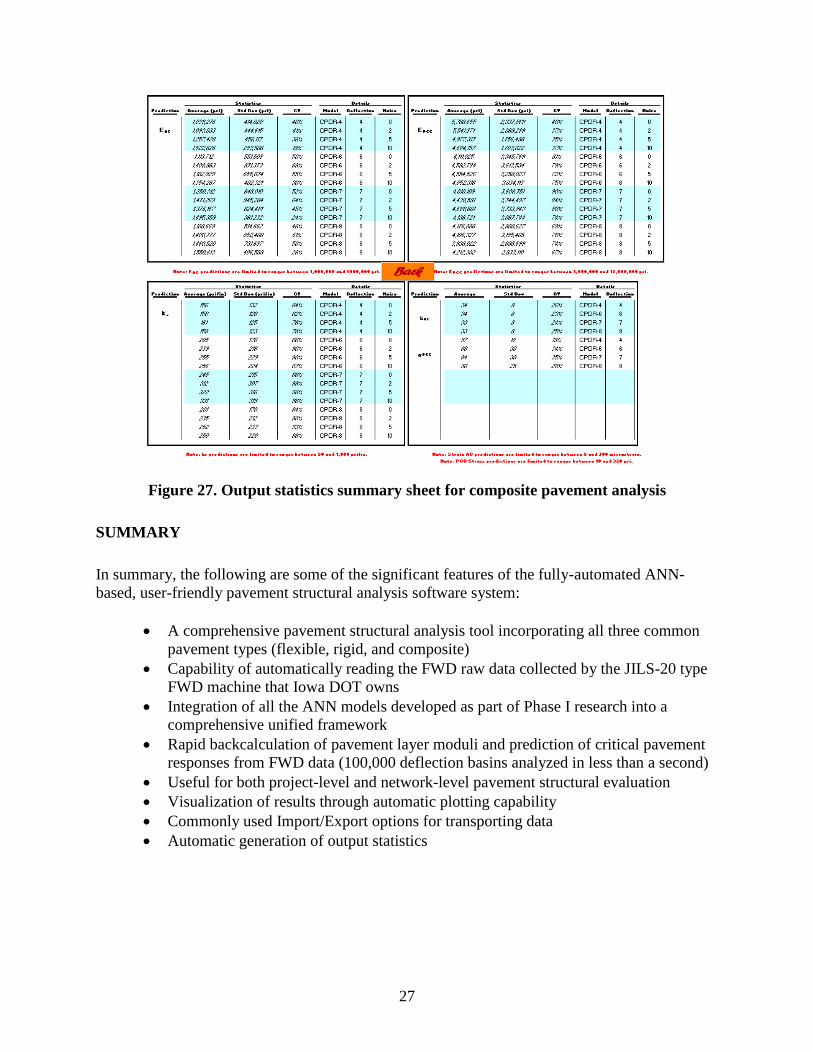
Figure 25 illustrates sample analysis results for a composite pavement section. Figure 26
illustrates color-coded composite pavement analysis results of 4-deflection model with 0 % noise
which are generated from the plotting function. Figure 27 illustrates sample Excel sheet with
tables of each output and their statistics for every generated model by clicking “summary”
button.
Figure 24. Composite pavement analysis menu
InputsAnalysis
Tool OutputsInputsAnalysis
Tool Outputs

25
Figure 25. Sample Excel sheet outputs of composite pavement analysis

26
Figure 26. Sample Excel sheet charts of composite pavement analysis
27
Figure 27. Output statistics summary sheet for composite pavement analysis
SUMMARY
In summary, the following are some of the significant features of the fully-automated ANN-
based, user-friendly pavement structural analysis software system:
A comprehensive pavement structural analysis tool incorporating all three common
pavement types (flexible, rigid, and composite)
Capability of automatically reading the FWD raw data collected by the JILS-20 type
FWD machine that Iowa DOT owns
Integration of all the ANN models developed as part of Phase I research into a
comprehensive unified framework
Rapid backcalculation of pavement layer moduli and prediction of critical pavement
responses from FWD data (100,000 deflection basins analyzed in less than a second)
Useful for both project-level and network-level pavement structural evaluation
Visualization of results through automatic plotting capability
Commonly used Import/Export options for transporting data
Automatic generation of output statistics

28
REFERENCES
Ceylan, H., Guclu, A., Bayrak, M. B., and Gopalakrishnan, K. 2007. Nondestructive Evaluation
of Iowa Pavements-Phase I. CTRE Project 04-177, Center for Transportation Research
and Education, Iowa State University, Ames, Iowa.