
Development of a Dynami c Headspace Method for a Purge-and ... · March 12–17, 2006 Development...
14
Application Note 25330206 Keywords Dynamic Headspace Eclipse Headspace Method 5021 Method 5030 Method 5035 Model 4552 Purge and Trap USEPA VOC Volatile Organic Compounds Water/Soil Autosampler Presented at the 2006 Pittsburgh Conference on Analytical Chemistry and Applied Spectroscopy, Orlando, FL March 12–17, 2006 Development of a Dynamic Headspace Method for a Purge-and-Trap Water/Soil Autosampler Introduction Two different types of instrumentation have traditionally been used to perform analysis of volatile organic compounds (VOCs), depending on the expected concentration level of the analytes. Low-level VOCs are analyzed by purge and trap (P&T) using USEPA Method 5030 for waters or Method 5035 for soils and sludge. High-level VOCs are analyzed using a static headspace technique and USEPA Method 5021. Headspace methods prevent contamination of the sample needle because the needle never penetrates the sample surface. Despite higher detection limits, headspace analysis is also used for foods, pharmaceuticals, consumer products, and forensic samples, when preventing cross- contamination between samples is especially important. With a very simple modification to the OI Analytical Model 4552 P&T Water/Soil Autosampler configuration, using a single instrument for dynamic headspace and traditional P&T techniques is now possible. By replacing the long sparge needle (used with USEPA Method 5035) with a shorter needle, which does not come into contact with the sample, a true dynamic headspace analysis can be performed on virtually any sample type. The shorter needle provides a steady stream of purge gas that sweeps the surface of the sample, which is stirred and heated. The analytes are swept from the headspace and concentrated on the analytical trap prior to thermal desorption to the gas chromatograph (GC). This dynamic headspace technique prevents cross-contamination much like static headspace methods and is capable of detection limits lower than static headspace. However, because of lower purge efficiencies, detection limits using dynamic headspace will always be higher than those of traditional P&T analysis. This application note illustrates the relative recoveries and analytical precision of VOCs using USEPA Methods 5030, 5035, and dynamic headspace. The effects of instrument variables, such as sample temperature and stirring, are shown using the dynamic headspace technique. The practical limit of quantitation for selected compounds and calibration statistics are also shown.
Transcript of Development of a Dynami c Headspace Method for a Purge-and ... · March 12–17, 2006 Development...
Application Note 25330206
KeywordsDynamic HeadspaceEclipseHeadspaceMethod 5021Method 5030Method 5035Model 4552Purge and TrapUSEPAVOCVolatile Organic CompoundsWater/Soil Autosampler
Presented at the 2006 Pittsburgh Conference on Analytical Chemistry and Applied
Spectroscopy, Orlando, FLMarch 12–17, 2006
Development of a Dynamic Headspace Method for a Purge-and-Trap Water/Soil Autosampler
IntroductionTwo different types of instrumentation have traditionally been used to perform analysis of volatile organic compounds (VOCs), depending on the expected concentration level of the analytes. Low-level VOCs are analyzed by purge and trap (P&T) using USEPA Method 5030 for waters or Method 5035 for soils and sludge. High-level VOCs are analyzed using a static headspace technique and USEPA Method 5021.
Headspace methods prevent contamination of the sample needle because the needle never penetrates the sample surface. Despite higher detection limits, headspace analysis is also used for foods, pharmaceuticals, consumer products, and forensic samples, when preventing cross-contamination between samples is especially important.
With a very simple modification to the OI Analytical Model 4552 P&T Water/Soil Autosampler configuration, using a single instrument for dynamic headspace and traditional P&T techniques is now possible. By replacing the long sparge needle (used with USEPA Method 5035) with a shorter needle, which does not come into contact with the sample, a true dynamic headspace analysis can be performed on virtually any sample type. The shorter needle provides a steady stream of purge gas that sweeps the surface of the sample, which is stirred and heated. The analytes are swept from the headspace and concentrated on the analytical trap prior to thermal desorption to the gas chromatograph (GC). This dynamic headspace technique prevents cross-contamination much like static headspace methods and is capable of detection limits lower than static headspace. However, because of lower purge efficiencies, detection limits using dynamic headspace will always be higher than those of traditional P&T analysis.
This application note illustrates the relative recoveries and analytical precision of VOCs using USEPA Methods 5030, 5035, and dynamic headspace. The effects of instrument variables, such as sample temperature and stirring, are shown using the dynamic headspace technique. The practical limit of quantitation for selected compounds and calibration statistics are also shown.
2
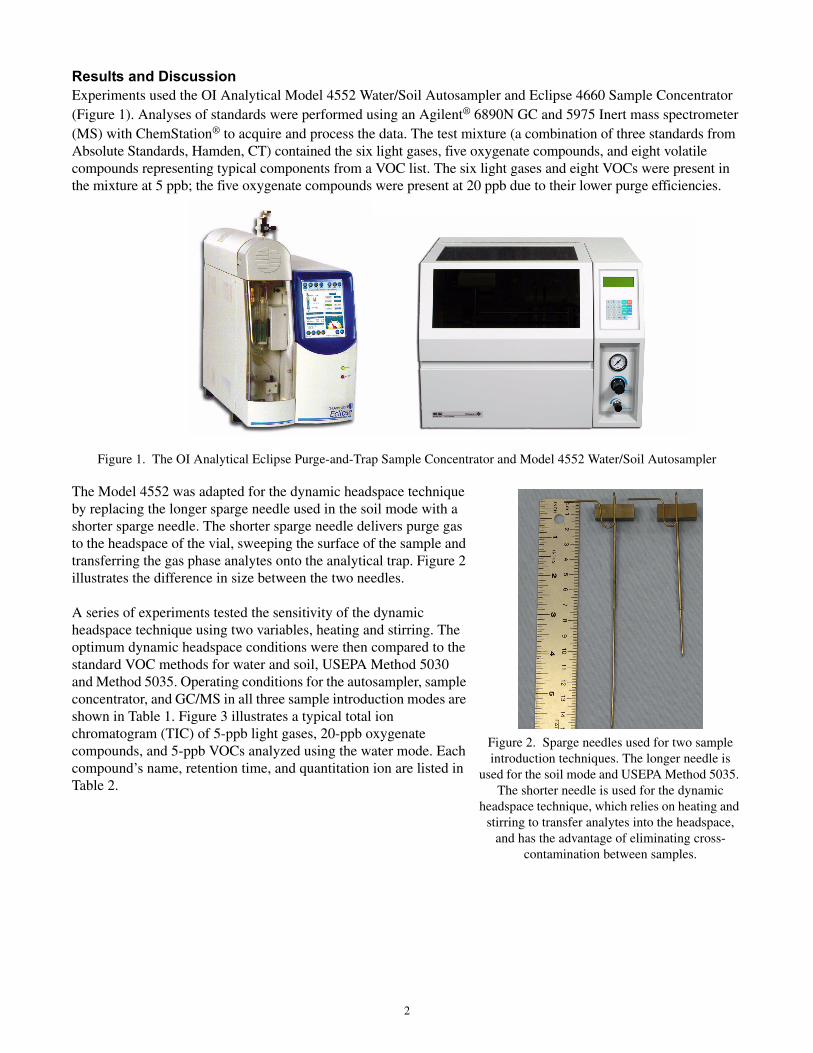
Results and DiscussionExperiments used the OI Analytical Model 4552 Water/Soil Autosampler and Eclipse 4660 Sample Concentrator (Figure 1). Analyses of standards were performed using an Agilent® 6890N GC and 5975 Inert mass spectrometer (MS) with ChemStation® to acquire and process the data. The test mixture (a combination of three standards from Absolute Standards, Hamden, CT) contained the six light gases, five oxygenate compounds, and eight volatile compounds representing typical components from a VOC list. The six light gases and eight VOCs were present in the mixture at 5 ppb; the five oxygenate compounds were present at 20 ppb due to their lower purge efficiencies.
Figure 1. The OI Analytical Eclipse Purge-and-Trap Sample Concentrator and Model 4552 Water/Soil Autosampler
The Model 4552 was adapted for the dynamic headspace technique by replacing the longer sparge needle used in the soil mode with a shorter sparge needle. The shorter sparge needle delivers purge gas to the headspace of the vial, sweeping the surface of the sample and transferring the gas phase analytes onto the analytical trap. Figure 2 illustrates the difference in size between the two needles.
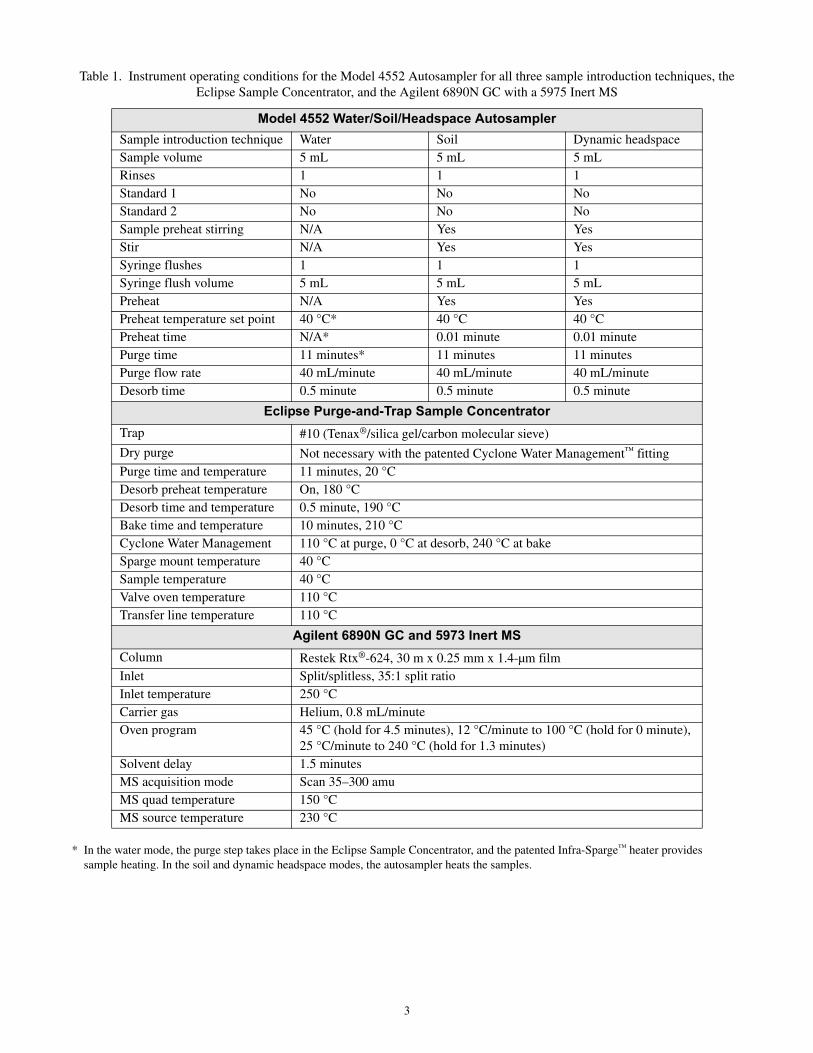
A series of experiments tested the sensitivity of the dynamic headspace technique using two variables, heating and stirring. The optimum dynamic headspace conditions were then compared to the standard VOC methods for water and soil, USEPA Method 5030 and Method 5035. Operating conditions for the autosampler, sample concentrator, and GC/MS in all three sample introduction modes are shown in Table 1. Figure 3 illustrates a typical total ion chromatogram (TIC) of 5-ppb light gases, 20-ppb oxygenate compounds, and 5-ppb VOCs analyzed using the water mode. Each compound’s name, retention time, and quantitation ion are listed in Table 2.
Figure 2. Sparge needles used for two sample introduction techniques. The longer needle is
used for the soil mode and USEPA Method 5035. The shorter needle is used for the dynamic
headspace technique, which relies on heating and stirring to transfer analytes into the headspace,
and has the advantage of eliminating cross-contamination between samples.
3
* In the water mode, the purge step takes place in the Eclipse Sample Concentrator, and the patented Infra-Sparge™ heater provides sample heating. In the soil and dynamic headspace modes, the autosampler heats the samples.
Table 1. Instrument operating conditions for the Model 4552 Autosampler for all three sample introduction techniques, the Eclipse Sample Concentrator, and the Agilent 6890N GC with a 5975 Inert MS
Model 4552 Water/Soil/Headspace AutosamplerSample introduction technique Water Soil Dynamic headspaceSample volume 5 mL 5 mL 5 mLRinses 1 1 1Standard 1 No No NoStandard 2 No No NoSample preheat stirring N/A Yes YesStir N/A Yes YesSyringe flushes 1 1 1Syringe flush volume 5 mL 5 mL 5 mLPreheat N/A Yes YesPreheat temperature set point 40 °C* 40 °C 40 °CPreheat time N/A* 0.01 minute 0.01 minutePurge time 11 minutes* 11 minutes 11 minutesPurge flow rate 40 mL/minute 40 mL/minute 40 mL/minuteDesorb time 0.5 minute 0.5 minute 0.5 minute
Eclipse Purge-and-Trap Sample ConcentratorTrap #10 (Tenax®/silica gel/carbon molecular sieve)
Dry purge Not necessary with the patented Cyclone Water Management™ fittingPurge time and temperature 11 minutes, 20 °CDesorb preheat temperature On, 180 °CDesorb time and temperature 0.5 minute, 190 °C Bake time and temperature 10 minutes, 210 °CCyclone Water Management 110 °C at purge, 0 °C at desorb, 240 °C at bakeSparge mount temperature 40 °CSample temperature 40 °CValve oven temperature 110 °CTransfer line temperature 110 °C
Agilent 6890N GC and 5973 Inert MSColumn Restek Rtx®-624, 30 m x 0.25 mm x 1.4-µm filmInlet Split/splitless, 35:1 split ratioInlet temperature 250 °CCarrier gas Helium, 0.8 mL/minuteOven program 45 °C (hold for 4.5 minutes), 12 °C/minute to 100 °C (hold for 0 minute),
25 °C/minute to 240 °C (hold for 1.3 minutes)Solvent delay 1.5 minutesMS acquisition mode Scan 35–300 amuMS quad temperature 150 °CMS source temperature 230 °C
4
Figure 3. Typical total ion chromatogram (TIC) of the six light gases at 5 ppb, five oxygenate compounds at 20 ppb, and eight VOCs at 5 ppb analyzed in the water mode. The insert shows the extracted ions for the six light gases. A Restek Rtx-624
column (30 m x 0.25 mm x 1.4-µm film) was used with the following oven program: 45 °C (hold for 4.5 minutes), 12 °C/minute to 100 °C (hold 0 minute), 25 °C/minute to 240 °C (hold 1.3 minutes).
7
8, 9 10
11
12
13
1415
16
17 18
19
1
2
3
45
6

5
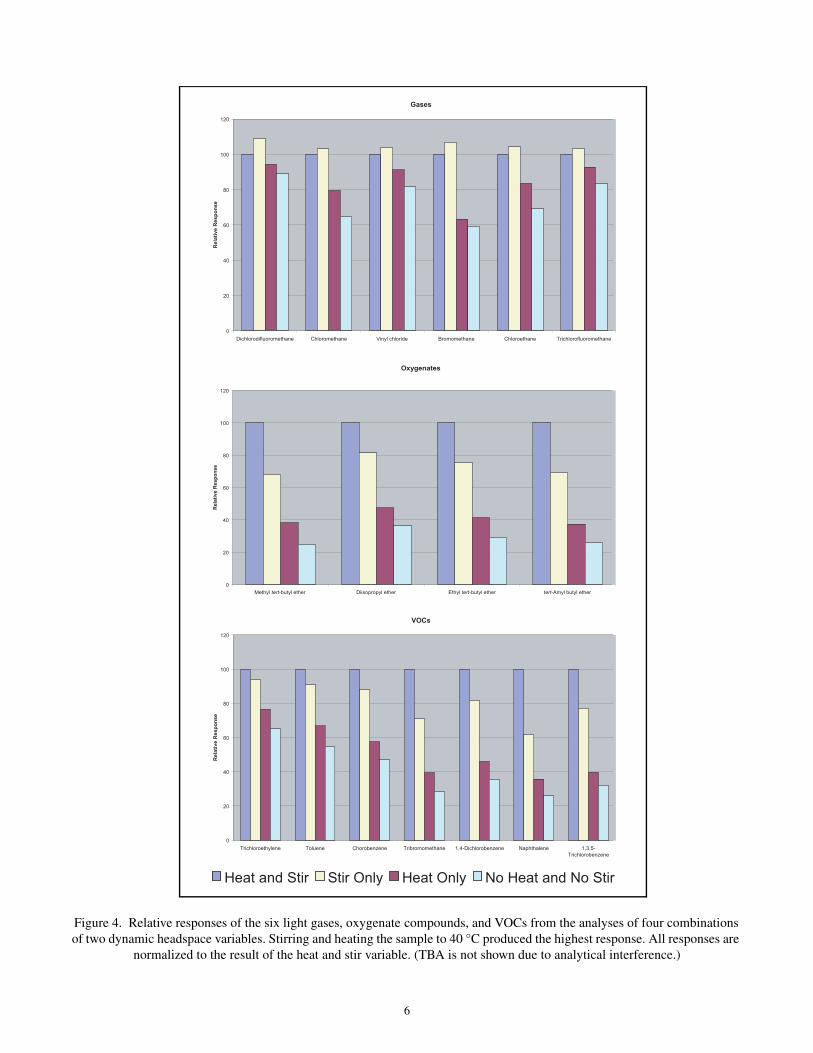
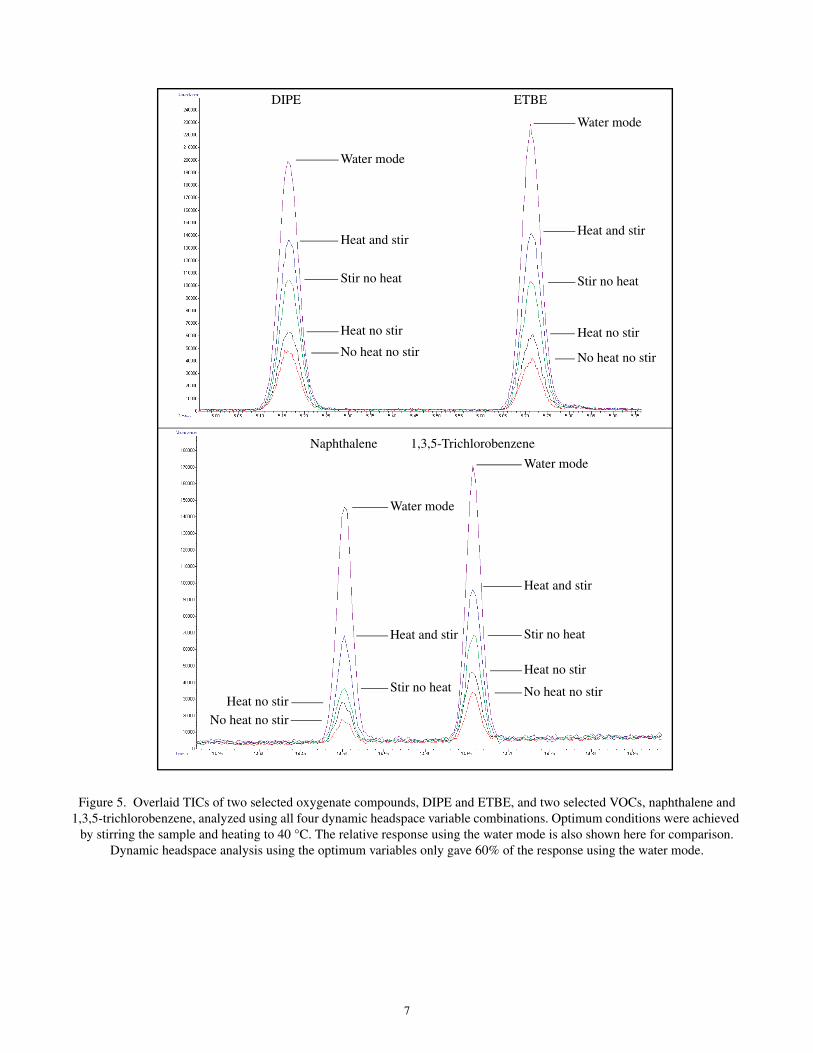
Dynamic Headspace VariablesTwo variables, heating the sample to 40 °C and stirring, were chosen to test their effects on analyte response when using the dynamic headspace technique. These variables were chosen because they are similar to the heating and agitation commonly used in static headspace analyses, and because they are used in the VOC soil mode with Method 5035. The analyte responses were compared using four combinations of the two variables: no stirring and no heat, heating only, stirring only, and stirring and heating. Figure 4 illustrates the relative responses of all the analytes using the combinations of variables for dynamic headspace analysis. Overlaid TICs of selected compounds shown in Figure 5 demonstrate responses of the four combinations of variables in the dynamic headspace mode, and compare them to the responses in the water mode.
As expected, dynamic headspace analyses performed without heating or stirring produced the lowest responses for all compounds. The six light gases, which have the highest volatility and are in the gas phase at ambient temperature, only required stirring to be released into the headspace. Stirring alone had a greater effect than heating alone on the oxygenate and VOC responses, and the operating conditions producing the highest recoveries overall were a combination of stirring and heating the sample to 40 °C.
Table 2. Compound names, retention times, and quantitation ions for the peaks shown in Figure 3
Compound Number Compound Name Retention
Time Quant. Ion
Gases1 Dichlorodifluoromethane 1.8 852 Chloromethane 1.95 503 Vinyl chloride 2.07 624 Bromomethane 2.41 965 Chloroethane 2.51 646 Trichlorofluoromethane 2.78 101
Oxygenates7 tert-Butanol (TBA) 4.11 599 Methyl tert-butyl ether (MTBE) 4.39 73
10 Diisopropyl ether (DIPE) 5.16 4511 Ethyl tert-butyl ether (ETBE) 5.71 5912 tert-Amyl methyl ether (TAME) 7.33 73
VOCs8 1,2-Dichloroethene 4.4 96
13 Trichloroethylene 8.03 9514 Toluene 9.67 9115 Chlorobenzene 11.09 11216 Bromoform 11.8 17317 1,4-Dichlorobenzene 13.24 14618 Naphthalene 14.5 12819 1,3,5-Trichlorobenzene 14.66 180
6
Figure 4. Relative responses of the six light gases, oxygenate compounds, and VOCs from the analyses of four combinations of two dynamic headspace variables. Stirring and heating the sample to 40 °C produced the highest response. All responses are
normalized to the result of the heat and stir variable. (TBA is not shown due to analytical interference.)
VOCs
0
20
40
60
80
100
120
Trichloroethylene Toluene Chorobenzene Tribromomethane 1,4-Dichlorobenzene Naphthalene 1,3,5-
Trichlorobenzene
Re
lati
ve
Re
sp
on
se
0
20
40
60
80
100
120
Dichlorodifluoromethane Chloromethane Vinyl chloride Bromomethane Chloroethane Trichlorofluoromethane
Re
lati
ve
Re
sp
on
se
Gases
Oxygenates
0
20
40
60
80
100
120
Methyl tert-butyl ether Diisopropyl ether Ethyl tert-butyl ether tert-Amyl butyl ether
Re
lati
ve
Re
sp
on
se
Heat and Stir Stir Only Heat Only No Heat and No Stir
7
Figure 5. Overlaid TICs of two selected oxygenate compounds, DIPE and ETBE, and two selected VOCs, naphthalene and 1,3,5-trichlorobenzene, analyzed using all four dynamic headspace variable combinations. Optimum conditions were achieved
by stirring the sample and heating to 40 °C. The relative response using the water mode is also shown here for comparison. Dynamic headspace analysis using the optimum variables only gave 60% of the response using the water mode.
DIPE ETBE
Naphthalene 1,3,5-Trichlorobenzene
Water mode
Heat and stir
Stir no heat
Heat no stir
No heat no stir
Water mode
Heat and stir
Stir no heat
Heat no stir
No heat no stir
Water mode
Heat and stir
Stir no heatHeat no stir
No heat no stir
Water mode
Heat and stir
Stir no heat
Heat no stir
No heat no stir
8
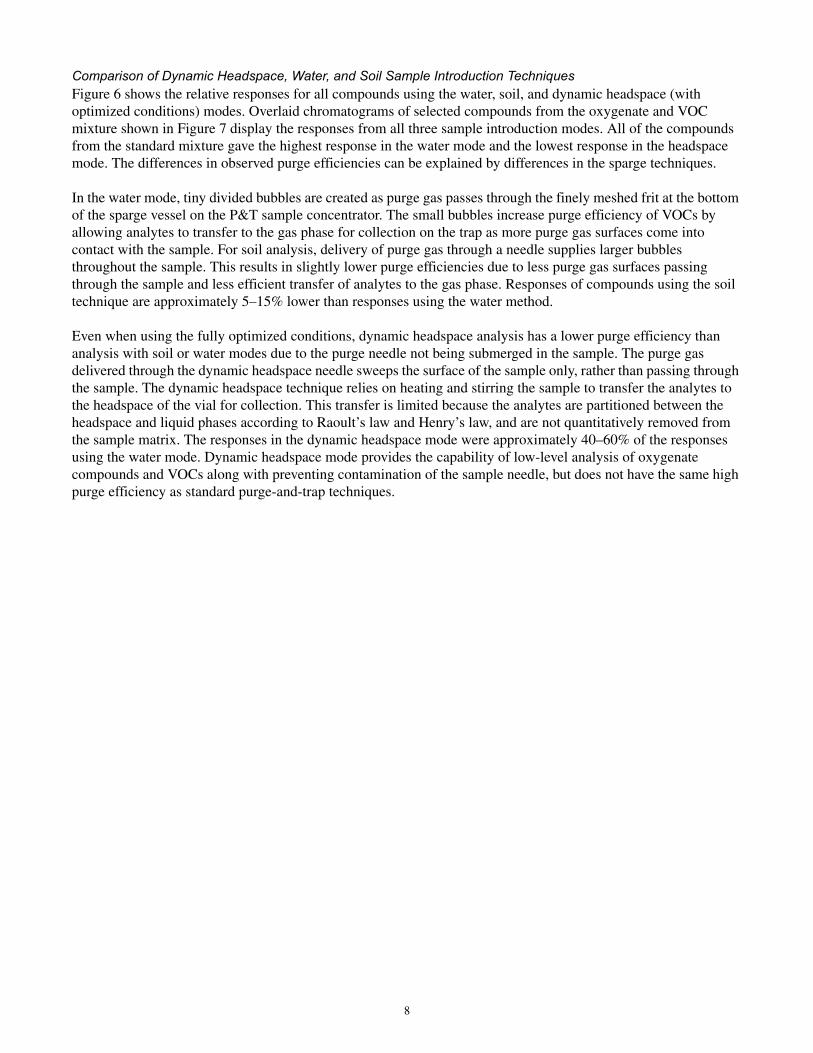
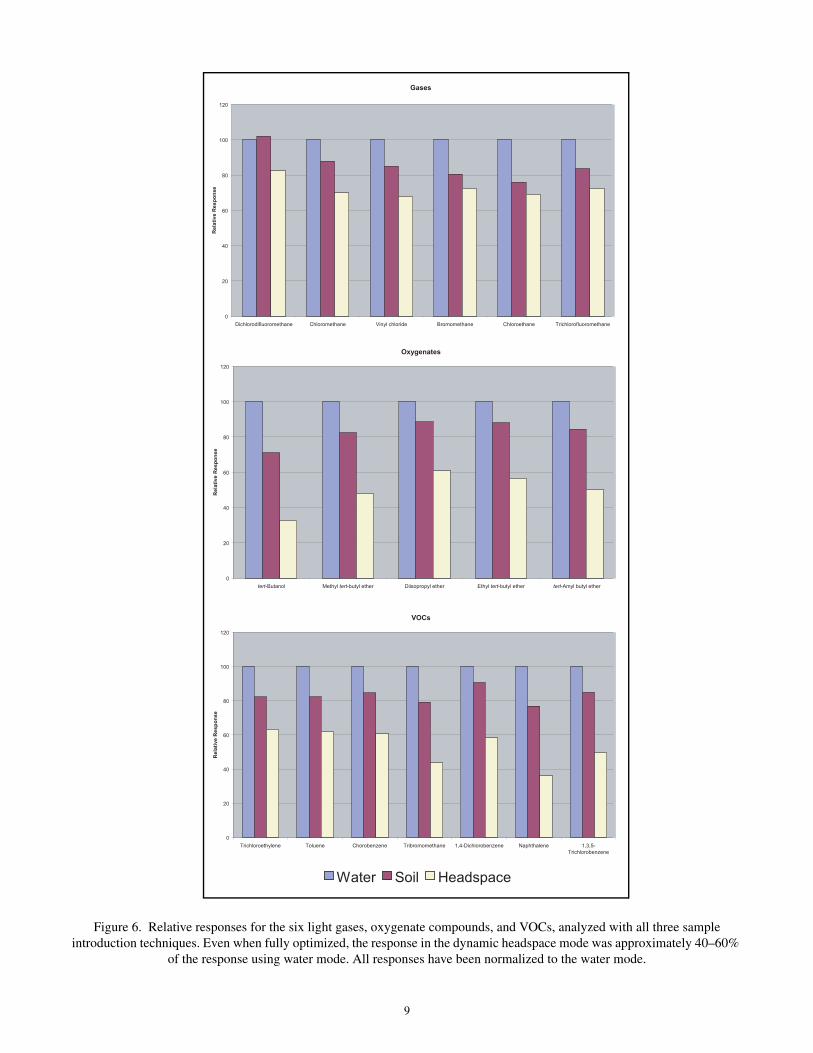
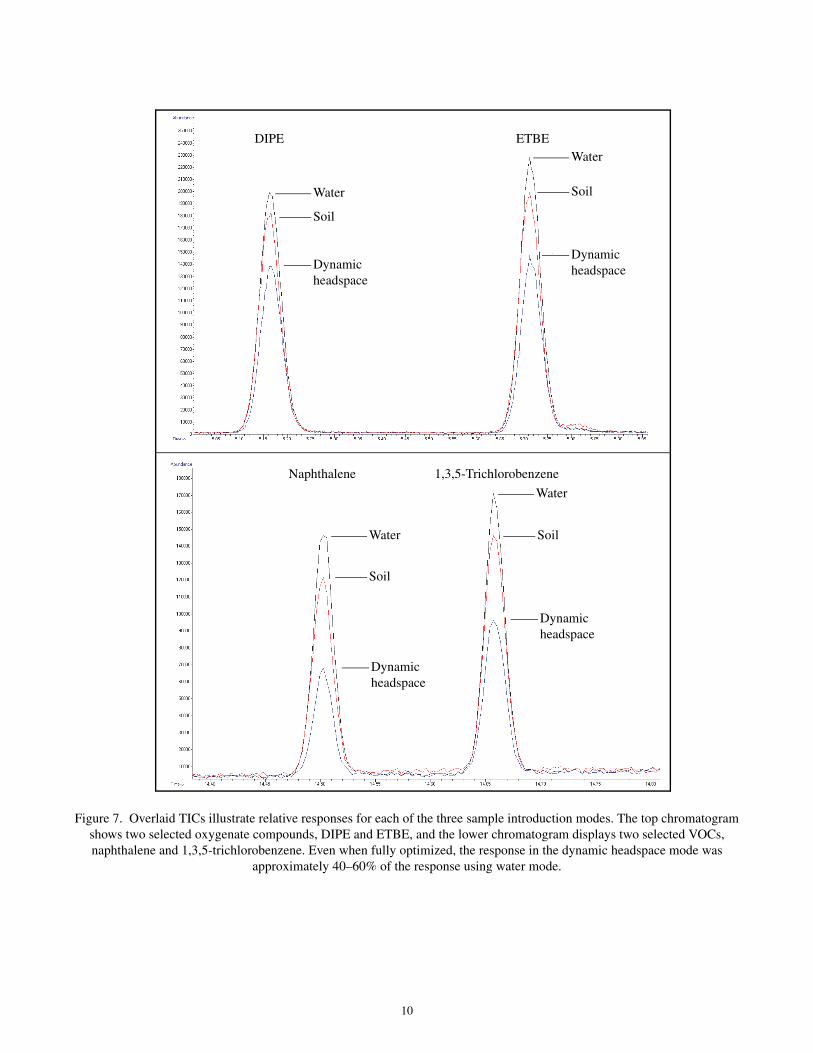
Comparison of Dynamic Headspace, Water, and Soil Sample Introduction TechniquesFigure 6 shows the relative responses for all compounds using the water, soil, and dynamic headspace (with optimized conditions) modes. Overlaid chromatograms of selected compounds from the oxygenate and VOC mixture shown in Figure 7 display the responses from all three sample introduction modes. All of the compounds from the standard mixture gave the highest response in the water mode and the lowest response in the headspace mode. The differences in observed purge efficiencies can be explained by differences in the sparge techniques.
In the water mode, tiny divided bubbles are created as purge gas passes through the finely meshed frit at the bottom of the sparge vessel on the P&T sample concentrator. The small bubbles increase purge efficiency of VOCs by allowing analytes to transfer to the gas phase for collection on the trap as more purge gas surfaces come into contact with the sample. For soil analysis, delivery of purge gas through a needle supplies larger bubbles throughout the sample. This results in slightly lower purge efficiencies due to less purge gas surfaces passing through the sample and less efficient transfer of analytes to the gas phase. Responses of compounds using the soil technique are approximately 5–15% lower than responses using the water method.
Even when using the fully optimized conditions, dynamic headspace analysis has a lower purge efficiency than analysis with soil or water modes due to the purge needle not being submerged in the sample. The purge gas delivered through the dynamic headspace needle sweeps the surface of the sample only, rather than passing through the sample. The dynamic headspace technique relies on heating and stirring the sample to transfer the analytes to the headspace of the vial for collection. This transfer is limited because the analytes are partitioned between the headspace and liquid phases according to Raoult’s law and Henry’s law, and are not quantitatively removed from the sample matrix. The responses in the dynamic headspace mode were approximately 40–60% of the responses using the water mode. Dynamic headspace mode provides the capability of low-level analysis of oxygenate compounds and VOCs along with preventing contamination of the sample needle, but does not have the same high purge efficiency as standard purge-and-trap techniques.
9
Figure 6. Relative responses for the six light gases, oxygenate compounds, and VOCs, analyzed with all three sample introduction techniques. Even when fully optimized, the response in the dynamic headspace mode was approximately 40–60%
of the response using water mode. All responses have been normalized to the water mode.
0
20
40
60
80
100
120
Dichlorodifluoromethane Chloromethane Vinyl chloride Bromomethane Chloroethane Trichlorofluoromethane
Re
lati
ve
Re
sp
on
se
Gases
0
20
40
60
80
100
120
Trichloroethylene Toluene Chorobenzene Tribromomethane 1,4-Dichlorobenzene Naphthalene 1,3,5-
Trichlorobenzene
Re
lati
ve
Re
sp
on
se
VOCs
0
20
40
60
80
100
120
tert-Butanol Methyl tert-butyl ether Diisopropyl ether Ethyl tert-butyl ether tert-Amyl butyl ether
Re
lati
ve
Re
sp
on
se
Oxygenates
Water Soil Headspace
10
Figure 7. Overlaid TICs illustrate relative responses for each of the three sample introduction modes. The top chromatogram shows two selected oxygenate compounds, DIPE and ETBE, and the lower chromatogram displays two selected VOCs, naphthalene and 1,3,5-trichlorobenzene. Even when fully optimized, the response in the dynamic headspace mode was
approximately 40–60% of the response using water mode.
DIPE ETBE
Naphthalene 1,3,5-Trichlorobenzene
Water
Soil
Dynamic headspace
Water
Soil
Dynamic headspace
Water
Soil
Dynamic headspace
Water
Soil
Dynamic headspace
11
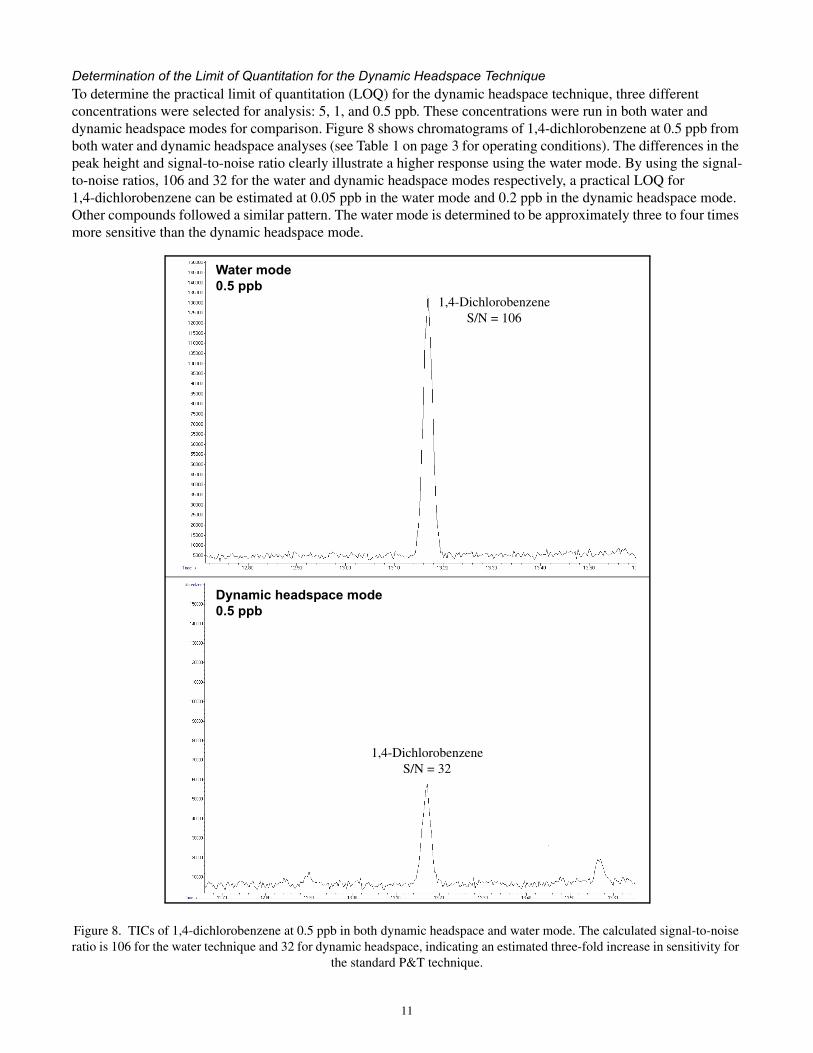
Determination of the Limit of Quantitation for the Dynamic Headspace TechniqueTo determine the practical limit of quantitation (LOQ) for the dynamic headspace technique, three different concentrations were selected for analysis: 5, 1, and 0.5 ppb. These concentrations were run in both water and dynamic headspace modes for comparison. Figure 8 shows chromatograms of 1,4-dichlorobenzene at 0.5 ppb from both water and dynamic headspace analyses (see Table 1 on page 3 for operating conditions). The differences in the peak height and signal-to-noise ratio clearly illustrate a higher response using the water mode. By using the signal-to-noise ratios, 106 and 32 for the water and dynamic headspace modes respectively, a practical LOQ for 1,4-dichlorobenzene can be estimated at 0.05 ppb in the water mode and 0.2 ppb in the dynamic headspace mode. Other compounds followed a similar pattern. The water mode is determined to be approximately three to four times more sensitive than the dynamic headspace mode.
Figure 8. TICs of 1,4-dichlorobenzene at 0.5 ppb in both dynamic headspace and water mode. The calculated signal-to-noise ratio is 106 for the water technique and 32 for dynamic headspace, indicating an estimated three-fold increase in sensitivity for
the standard P&T technique.
1,4-DichlorobenzeneS/N = 106
1,4-DichlorobenzeneS/N = 32
Dynamic headspace mode0.5 ppb
Water mode0.5 ppb
12
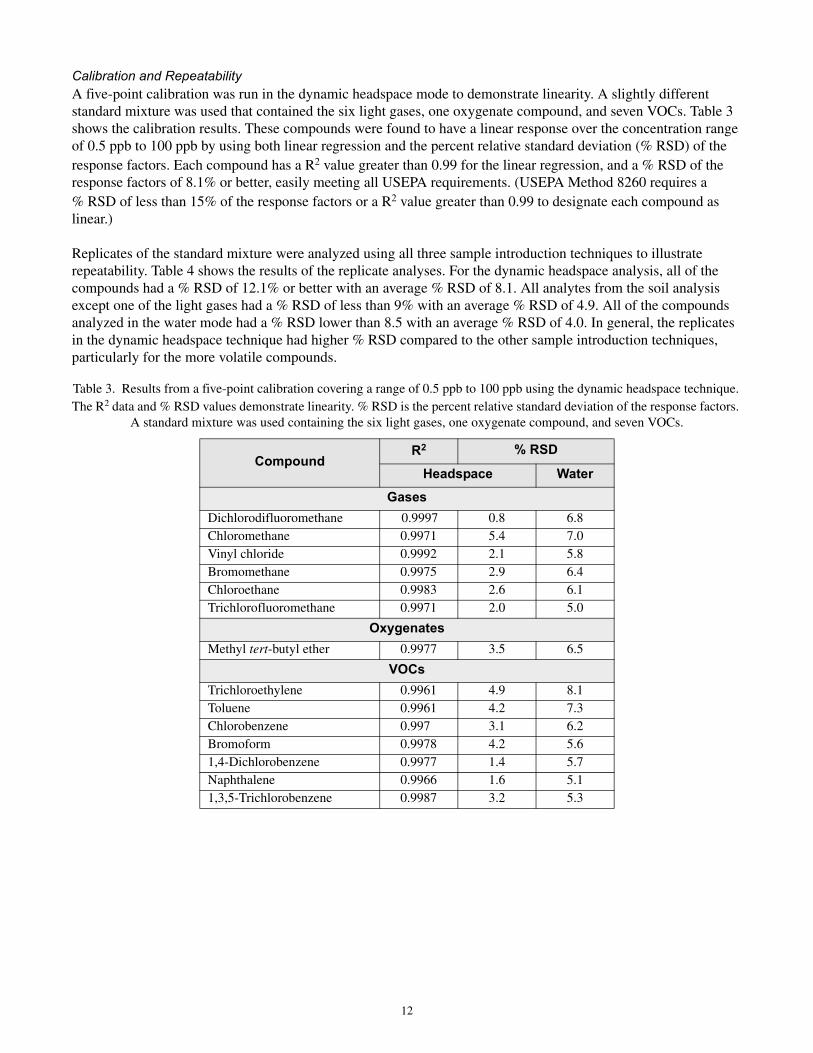
Calibration and RepeatabilityA five-point calibration was run in the dynamic headspace mode to demonstrate linearity. A slightly different standard mixture was used that contained the six light gases, one oxygenate compound, and seven VOCs. Table 3 shows the calibration results. These compounds were found to have a linear response over the concentration range of 0.5 ppb to 100 ppb by using both linear regression and the percent relative standard deviation (% RSD) of the response factors. Each compound has a R2 value greater than 0.99 for the linear regression, and a % RSD of the response factors of 8.1% or better, easily meeting all USEPA requirements. (USEPA Method 8260 requires a % RSD of less than 15% of the response factors or a R2 value greater than 0.99 to designate each compound as linear.)
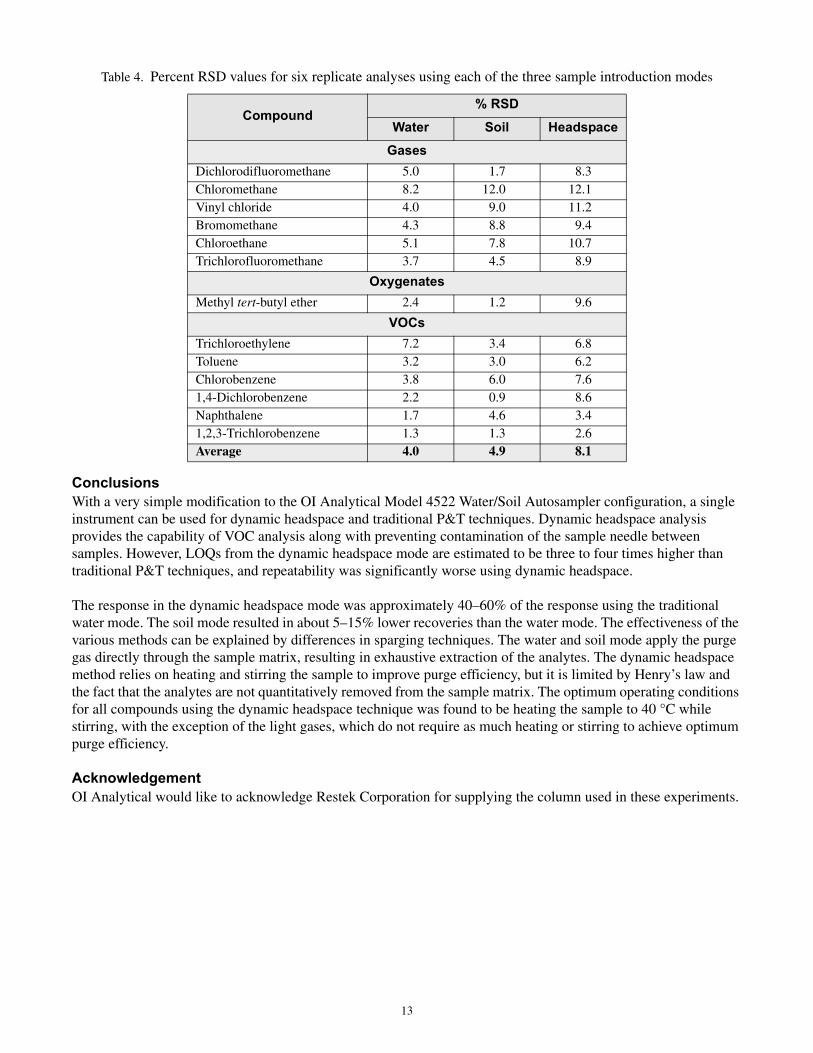
Replicates of the standard mixture were analyzed using all three sample introduction techniques to illustrate repeatability. Table 4 shows the results of the replicate analyses. For the dynamic headspace analysis, all of the compounds had a % RSD of 12.1% or better with an average % RSD of 8.1. All analytes from the soil analysis except one of the light gases had a % RSD of less than 9% with an average % RSD of 4.9. All of the compounds analyzed in the water mode had a % RSD lower than 8.5 with an average % RSD of 4.0. In general, the replicates in the dynamic headspace technique had higher % RSD compared to the other sample introduction techniques, particularly for the more volatile compounds.
Table 3. Results from a five-point calibration covering a range of 0.5 ppb to 100 ppb using the dynamic headspace technique. The R2 data and % RSD values demonstrate linearity. % RSD is the percent relative standard deviation of the response factors.
A standard mixture was used containing the six light gases, one oxygenate compound, and seven VOCs.
CompoundR2 % RSD
Headspace Water
GasesDichlorodifluoromethane 0.9997 0.8 6.8Chloromethane 0.9971 5.4 7.0Vinyl chloride 0.9992 2.1 5.8Bromomethane 0.9975 2.9 6.4Chloroethane 0.9983 2.6 6.1Trichlorofluoromethane 0.9971 2.0 5.0
OxygenatesMethyl tert-butyl ether 0.9977 3.5 6.5
VOCsTrichloroethylene 0.9961 4.9 8.1Toluene 0.9961 4.2 7.3Chlorobenzene 0.997 3.1 6.2Bromoform 0.9978 4.2 5.61,4-Dichlorobenzene 0.9977 1.4 5.7Naphthalene 0.9966 1.6 5.11,3,5-Trichlorobenzene 0.9987 3.2 5.3
13
ConclusionsWith a very simple modification to the OI Analytical Model 4522 Water/Soil Autosampler configuration, a single instrument can be used for dynamic headspace and traditional P&T techniques. Dynamic headspace analysis provides the capability of VOC analysis along with preventing contamination of the sample needle between samples. However, LOQs from the dynamic headspace mode are estimated to be three to four times higher than traditional P&T techniques, and repeatability was significantly worse using dynamic headspace.
The response in the dynamic headspace mode was approximately 40–60% of the response using the traditional water mode. The soil mode resulted in about 5–15% lower recoveries than the water mode. The effectiveness of the various methods can be explained by differences in sparging techniques. The water and soil mode apply the purge gas directly through the sample matrix, resulting in exhaustive extraction of the analytes. The dynamic headspace method relies on heating and stirring the sample to improve purge efficiency, but it is limited by Henry’s law and the fact that the analytes are not quantitatively removed from the sample matrix. The optimum operating conditions for all compounds using the dynamic headspace technique was found to be heating the sample to 40 °C while stirring, with the exception of the light gases, which do not require as much heating or stirring to achieve optimum purge efficiency.
AcknowledgementOI Analytical would like to acknowledge Restek Corporation for supplying the column used in these experiments.
Table 4. Percent RSD values for six replicate analyses using each of the three sample introduction modes
Compound% RSD
Water Soil Headspace
GasesDichlorodifluoromethane 5.0 1.7 8.3Chloromethane 8.2 12.0 12.1Vinyl chloride 4.0 9.0 11.2Bromomethane 4.3 8.8 9.4Chloroethane 5.1 7.8 10.7Trichlorofluoromethane 3.7 4.5 8.9
OxygenatesMethyl tert-butyl ether 2.4 1.2 9.6
VOCsTrichloroethylene 7.2 3.4 6.8Toluene 3.2 3.0 6.2Chlorobenzene 3.8 6.0 7.61,4-Dichlorobenzene 2.2 0.9 8.6Naphthalene 1.7 4.6 3.41,2,3-Trichlorobenzene 1.3 1.3 2.6Average 4.0 4.9 8.1

�������������� � ��������������������
� �������������� �!"��������������� �###���$��$�%
Agilent and ChemStation are registered trademarks of Agilent Technologies, Inc.Rtx is a registered trademark of Restek Corporation.Tenax is a registered trademark of Enka Research Institute Arnhem.