Development of a detector for chromatography - TU/e · cosity 1)
65
Development of a detector for chromatography Citation for published version (APA): Willems, G. H. W. (1981). Development of a detector for chromatography Eindhoven: Technische Hogeschool Eindhoven DOI: 10.6100/IR34922 DOI: 10.6100/IR34922 Document status and date: Published: 01/01/1981 Document Version: Publisher’s PDF, also known as Version of Record (includes final page, issue and volume numbers) Please check the document version of this publication: • A submitted manuscript is the version of the article upon submission and before peer-review. There can be important differences between the submitted version and the official published version of record. People interested in the research are advised to contact the author for the final version of the publication, or visit the DOI to the publisher's website. • The final author version and the galley proof are versions of the publication after peer review. • The final published version features the final layout of the paper including the volume, issue and page numbers. Link to publication General rights Copyright and moral rights for the publications made accessible in the public portal are retained by the authors and/or other copyright owners and it is a condition of accessing publications that users recognise and abide by the legal requirements associated with these rights. • Users may download and print one copy of any publication from the public portal for the purpose of private study or research. • You may not further distribute the material or use it for any profit-making activity or commercial gain • You may freely distribute the URL identifying the publication in the public portal. If the publication is distributed under the terms of Article 25fa of the Dutch Copyright Act, indicated by the “Taverne” license above, please follow below link for the End User Agreement: www.tue.nl/taverne Take down policy If you believe that this document breaches copyright please contact us at: [email protected] providing details and we will investigate your claim. Download date: 24. Aug. 2019
Transcript of Development of a detector for chromatography - TU/e · cosity 1)

Development of a detector for chromatography
Citation for published version (APA):Willems, G. H. W. (1981). Development of a detector for chromatography Eindhoven: Technische HogeschoolEindhoven DOI: 10.6100/IR34922
DOI:10.6100/IR34922
Document status and date:Published: 01/01/1981
Document Version:Publisher’s PDF, also known as Version of Record (includes final page, issue and volume numbers)
Please check the document version of this publication:
• A submitted manuscript is the version of the article upon submission and before peer-review. There can beimportant differences between the submitted version and the official published version of record. Peopleinterested in the research are advised to contact the author for the final version of the publication, or visit theDOI to the publisher's website.• The final author version and the galley proof are versions of the publication after peer review.• The final published version features the final layout of the paper including the volume, issue and pagenumbers.Link to publication
General rightsCopyright and moral rights for the publications made accessible in the public portal are retained by the authors and/or other copyright ownersand it is a condition of accessing publications that users recognise and abide by the legal requirements associated with these rights.
• Users may download and print one copy of any publication from the public portal for the purpose of private study or research. • You may not further distribute the material or use it for any profit-making activity or commercial gain • You may freely distribute the URL identifying the publication in the public portal.
If the publication is distributed under the terms of Article 25fa of the Dutch Copyright Act, indicated by the “Taverne” license above, pleasefollow below link for the End User Agreement:
www.tue.nl/taverne
Take down policyIf you believe that this document breaches copyright please contact us at:
providing details and we will investigate your claim.
Download date: 24. Aug. 2019
DEVELOPMENT OF A DETECTOR FOR CHROMATOGRAPHY
PROEFSCHRIFT
!er vcrkr(jgin,g van de graad van doctor in de technische wctenschappen aan de Technische
I-logeschool Eindhoven, op gezag van de rector rnagnif'icus, prof. ir. J. Erkelens, v~~r een commissie aangewczcn door het college
Van dekanen in het openbaar Ie verdedigen op dinsdag 14 april 1981 te 16.00 uur
DOOR
GERARDUS HUBERTUS WILHELMUS WILLEMS
GEBOREN TE VENLQ
DI{UK~ COOPERATIEVl'. CONDENSFABRIEK 'FRIESLAND' W.a. U:EUWARDEN
Dil proefschrlft is gucdgekeurd door de pWl\"lotoren: Prol·. dr. .I A. Poulis Ort
Prof. df. ir. CA.M.G. ("tamcrs

vaar !lSi?
v()or mijn ouders
CONTENTS
CONT~NTS
CHAPTER I GENERAL INTRODUCTION 7
CHAPTER 2 THE FLOW-IMPEDANCE nRIDGE DETECTOR 9
CHAPTER 3
CHAPTER 4
2.1 Introduction 2.2 Principle of the detector 2.3 Detector response for gases 2A Detector response for liquids
VISCOMETER 3.1 Introduction 3.2 Experimental 3.3 Analysis for the binary mixtures 3.4 Results 3.5 Discussion
APPLICATION OF THE FLOW-IMPEDANCE BRIDGE DETECTOR IN CHROMATOGRAPHY 4.1 Introduction 4.2 Gas chromatography
4_2_1 IImoductio/J 4.2.2 Experimental 4_2.3 Results 4.2.4 Di.~cussion
9 9
II
18
19 19 19 21 23 31
33 33 38 38 40 44 47
5

4.3 Liquid chromatography 4.3.1 introduaion 4.3.2 Exp('rimental 4.3.3 Results and discussion
4.4 Conclusions
REFERENCES
SUMMARY
SAMENVATTING
OANKBETUIGING
flJRRICULUM VITAE
6
51 51
51 53 56
58
5'1
60
hi

CHAPTER 1
GENERAL INTRODUCTION
Since the introducHon of chroma tography as an analytical technique there has been a continuous need for improved detectors. A large variety of detectors has been developed for both gas and liquid chromatography. In principle they all respond to a specific property of matter e.g. light absorption, thermal conductivity etc,
One of the ways to classify these detectors, is to distinguish between concentration and mass flow-sensitive detectors, Concentration-sensitive detectors respond to the concentration of a solute in the detector, whereas mass flow-sensitive detectors respond to the mass flow-rate of solute through the detector. Another important difference between various detectors is the variety of suhstances to wruch they respond: universal versus selectivE_
The most commonly used detectors in gas chromatography are the name-ionization detector and the therm<ll conductivity detector. For liqUid chromatography the UV-detector is mostly used_ In order to apply these detectors for quantitative analYSiS, a calibration curve must be obtained for each substance. This calibration curve should be measlIrcd under the same experimental conditions that are used for the actual analysis_ Such a calibration can be avoided by using a detector where only knowledge of a physical property of the substances is required.
An universal mas, flow-sensitive detector has been developed which can be used for both gas and liquid chromatographyi,~ _ The detection principle is based on viscosity measurements with a flOW-impedance bridge detector. In contrast with the detector as proposed by Janak and Novak3 ,4,
the detector under discussion is a real analogue of the Wheatstone bridge. In order to use this detector for quantitative analysis, only information about the relationship between the viscosity and the composition of the so)ute·carrier mixture that flows through the detector is needed.
Since there is little data on this subject in literature, measurements have been conducted to acquire these viscosity data. With the detector that has been developed accurate measurements of the viscosity of mixtures as a function of the composition are possible_
7

!"rom the Chapmalln-E)1skog theory, an expression can be derived by which the viscosity of a binary gas mixture can be calculated from the values of some physical pararneters of the compononts of this rtliXt\lrO, ~y
reversing this procedu,e it sho\lld be possible to obtain these phydcal parameters from accurate viscosity measurements over a range of temper"-tures_
8

CHAPTER 2
THE FLOW-lMPEDANCE BRIDGE DETECTOR
2.1 INTRODUCTION
The Wheatstone bridge is a very accurate method for the determination of small variations in the valllC of an electric resistance. The analogue of an electric resistance in fluid dynamics is a capillary, the flow resistance of which is determined by the dimensions of the capUIary and the viscosity of the fluid flowing through it. For a certain capillary the flow resistance is only determined by the viscosity and thus by the nature of the fluid.
A change in the composition of the fluid resulting in a variation in the viscosity can be detected by measuring the change in the flow resistance of the capillary. In order to detect these changes in the flow resistance accura.tely an analogue of the Wheatstone bridge with four equal capUlaries was constructed. With this flow-impedance bridge detector one is able to detect very small variations in the viscosity of a OUid.
A description of the detection principle together with the dynamic behaviour of the detector follow~. Also a relation is derived that enables one to use the flow-impedance bridge detector for quantitative analysis.
2.2 PRINCIPLE OF THE DETECTOR
In the flow-impedance bridge detector four equal capillaries, together with a differential manQmeter, arc constructed to form a Wheatstone-like bridge. A single variation of the viscosity of the fluid flowing through the detector will result in four variations of the pressure difference measured by the differential manometer. These variations, due to the changes in the pressure drop across the various capillaries, are shifted in time. Thls time shift is obtained with the usc of a time delay line in onc of the branches of the bridge.
A schematic flow diilgram of the detector is shown in Fig. 2.1.
9

rig. 2.1 Flow diagram of the dctector.
WI, Wz , W3 and W4 ~re the four equal capillaries, and Pin and P",ut ~re the pre~sures at the inlN and outlet of the detector respectively. TOL represents the time delay line and DMM the differential manometer nwasuring the difference hetween the pressures P A and PB . The dlmensiOIlS of the time delay line and of the connections between WI and W2 and between W.l and W4 are such that their flow re~istance (g small comp<1red to the flow impedance of tho capillaries.
L
Fig, ;:,2 Vis<;:<)sity v;iTj~tion at the inlet of the detq't<)T ~s a functiQn of time,
Should the viscosity or the fluid entering the inlet of the detector change (see Fig. 2.2), then it is possible to show the variation of the diffC1"ontial prc~sure PA PH with time in a schematic diagr<lm <IS eXlnessed in Fig. 2.3.
In Fig. 2.3 t~, represents the time intervallhe front of viscosity varia· tion needs t() reach capillary W" and 1M stand~ for the time interval the fluid needs to rass Ihe manometer from WI to W1 and from W3 to W •.
10
w, w
".
0
t
1M
I w,.
.. ---i "'3
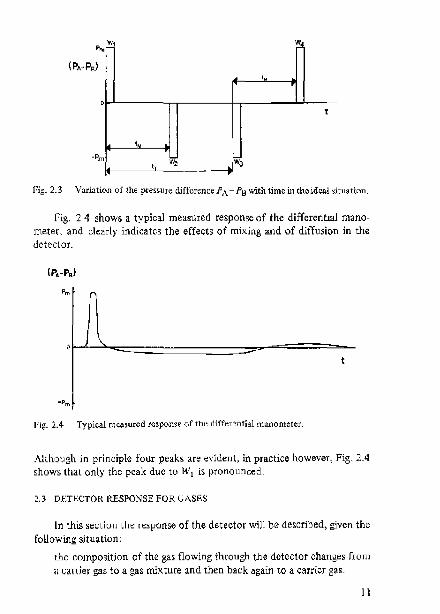
Fig. 2.3 Variation of the pressure difforence P A _. PIl with time in thcidcal situation.
Fig. 2.4 shows a typical measured response of the differential mano· meter, and clearly indicates the effects of mixing and of diffusion in the detector.
I.'ig. 2.4 Typical m<;1!.sured response of the diff"r~tJti.1 manometer.
Although in principle four peaks are evident, in practice however. Fig. 2.4 shows that only the peak due to WI is pronounced.
2.3 DETf-:CTOR RESPONSE FOR CASES
In this section the response of the detector wiJI be described, given the following situation;
the composition of the gas flowing through the detector changes from a carrier gas to a gas mixture and then back again to a carr"'! gas.
)1
The gas mixture (viscosity I)", (Pa.~» is a binary mixture of carrier gas (vis· cosity 1)<") and a sol\IlC gas with viscosity I)s.
The calculations of the detecto( response will be rostrictod to the varia· tion of t.he viscosity of the gas in W, . That th is ,estriction is j\lst.ified, is
shown in l'ig. 2.4, where it can be seen that the viscosity variation of the gas in the other capillaries only results in a smooth variation of the base line.
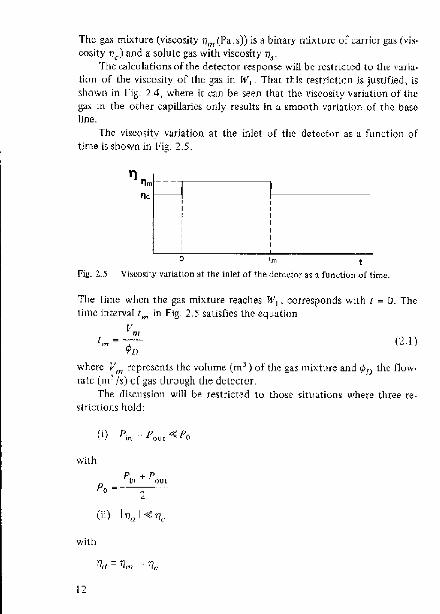
The viscosity v~riation at the inlet of the detector as a function of time is shown in hg. 2.5.
'1 flm - - -,---------,
<)
rig. 2.5 Yisc<l~ity variation ~t the inlet of the detector as a fUllction of lime.
The timo when the gas mlxture reaches WI, corresponds wilh I = O. The time interval t"., in Fig. 2.5 satisfies the equation
V m (2.1)
where Vm represents the volume (m 3) of the gas )11ixtllre and <PI) the flow·
rate (m'/s) of gas through the detector. The uiscussic)l1 will be restricted lO tllO~C sit\Jation~ where three reo
strictions hold:
(I) 1'. ,.,
Wilh
P;" ·r ""'H Po = ... _-_ ..... 2
with
12

(iii) the time intervals teap and t. are small compared with all other time intervals involved. leap is the time interval the front of the gas mi:xture needs to pass a ea pillary
2 Veap tell P .. -;;;;;--
where Vcap (m') is the volume of a capillary, Is is the time interval the gas requires to move from a stationary flow situation to another. According to Schlichting5 this time interval can be estimated from the following equation.
r2 p t ,,--
S 7J
where r (m) is the radius of the capillary and p (kg,m -~) is the density of the gas with viscosity 7/.
Since the mean pressure in the detector is almost constant (restriction (i», and the Reynolds number is low then the following relation between Dow·rate and pressure drop for a capillary can be used.
(2.2)
where 0: = ITI' /8l, ¢,,"P is the flow,rate through and Poop (Pa) the pressure drop acroSS a capillary with radius r (m) and length I (m).
As the two compartments of the differential manometer are separated by a flexible membrane the volumes of the compartments will depend on the difference between the gas pressures on both sides, For this relation the following equations are used
(2.3")
(2.31.»
where ~(m3 Pa-1 ) represents the VO\L1mctric displacement of the membrane per unit of pressure difference, The volume Va includes those volumes that are directly connected to the compartments of tho differential manometer.
For the gas pressures at A and B the following equations arc obtained:
0:. a: "-·(P, .... p )--'(P -p )=~. tlc In A 17(" A out
+
Vo dP", +'~.--
Po dt (2.4")
13
d(PA-J'll) {J • ---------.~- .,.
cit
Since the fOllr capillaries are equal, the following starting condition is pertinent:
t~O
Combination of eqns_ 2_4a and 2Ab leads 10:
(2.5)
rtlH 170 (Pill - PO,,!) '1]", '1]"
(Po -PA )· 17", T1/" (FA Fu) 2 . rtm Tll,~ =
= 7),,,-rto .~:~VoIPn . d(FA - PIl)
dt (2.6)
Neglection of th~ lerrll with Po -- P A leads (0 a much simpler differential equation. Tliis omission is justified because 117m -- 1/" I <{ rtm + 1/e and Ip() FA I <i; Pin - Pout. The solLltion of this differential equatioIl reads
(2.7)
where I'm is the maximum vahle of the presslire difference, and itself being:
'1]", 't1,. Piro -- Pout l' =---
m rt", + fie 2 in)
r is the time constant of the detector:
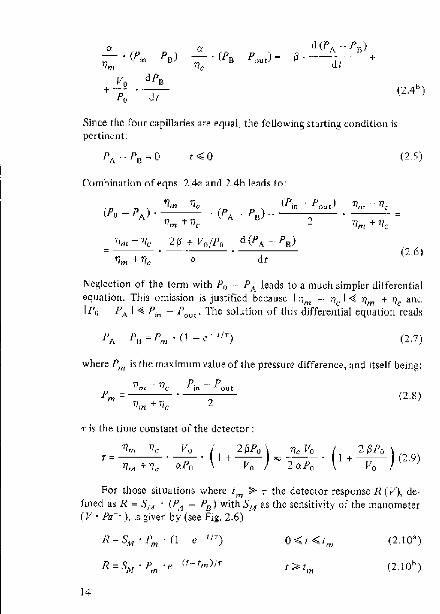
For those SitUaliOnS where tm ?- T the detector response R (V), delined as R = 8M • (P/1 - PB ) with SM as the sensitivity of the manometer (V . Fa- 1
), is given by (see Fig. 2,6)
(2_10')
R =S . F 'e (t--tm)/'-M tn (2.10")
14
' ..... "l'
I I
II
/1 "-""----~----. -,. - - - - - .- - -
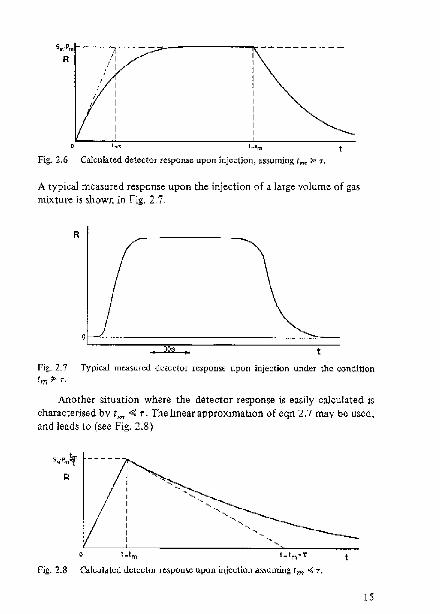
Fig. 2.6 Calculated detector te~pOnSe upon injection, assuming 1m :<- r.
A typical measured response upon the injection of a large volume of gas mixture is shown in Fig. 2.7.
R
t
Fig. 2.7 Typic.1 measured detector response upon injection under the condition tm ;.. r.
Another situation where the detector response is easily calculated is characterised by tm ~ T. The linear approximation ofeqn 2.7 may be used, and leads to (see Fig. 2.8)
15

T
trn R =SM' 1',." ._- 'e' (/-tm)/T
r
(2.11 ")
(2.11 b)
Fig. 2.9 shows a typical measured response under the condit iOll tm < T
lr::===~ _OJ~ .....
Hg, 2,,9 Typical measured detector response upon inj~ctiol1 undur llll': condition i IH ,,~ To
Returning to l'ig. 2.6 let us ~()t1sider the surface arell O( V.s) of tltc peak, and relate this surface llr~u to the Vol\lme V,(11l·1 ) of plirc solute with viscosity lis in the gas mixture. I'or t.his calculalion l\ lineHr rciati()11 is a,wlllcd bClwccn tlte concentration of willIe in the gil~ mixture and the viscosity of this mixture
(TIm .. - 1),.)' ~." = (77, TI,,)' v. (2.12)
For t.lte surface' lnell 0 the following is valid:
0= f R.dl (2.13)
And using I", i;> T, then:
o = SM . P"., • I", (2.14)
Suhslitlllio[) ur lh,' egos 2.1,2.2, 2.R and 2.12 leads to
1/., .... 1/" ()=--_·S V
40: M!" (tin ~ r) (2.15)
1(>
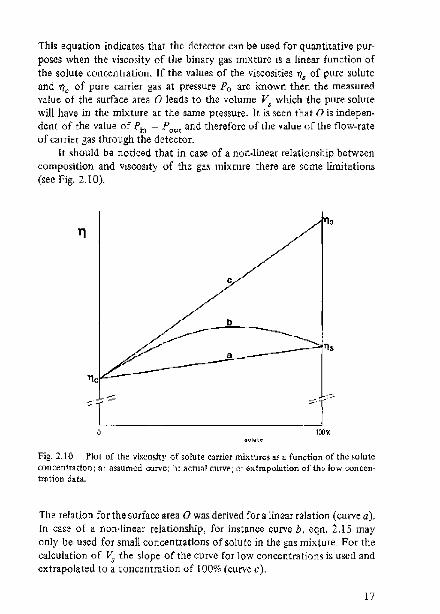
This equation indicates that the detector Can be u~ed for quantitative purposes when the viscosity of the binary gas mixture is a linear function of the solute concentration. If the values of the viscosities tI, of pure solute and tI" of pure carrier gas at pressure Po are known then the measured value of the surface area a leads to the volume V. which the pure solute will have in the mixture at the same pressure. It is seen that 0 is independent of the value of Pin - Pout and therefore of the value of the flow-rate of carrier gas through the detector.
It should be noticed that in case of a non-linear relationship between composition and viscosity of the gas mixture there are some limitations (sec fig. 2.10).
c
--;::
~T ~------------------------------------1~OO%
.~
J Fig. 2.10 Plot of the vi,cosity of soMe carrier mi)(ture~ as a function of the ."lute concentration: a~ as:nlltitd curve: b: actual curve; 0: extrapolation of the: low cuncen\r~tion data.
The relation for the surface area 0 was derived for a liMar relation (curve a). In case of a Ilon·linear relationship, for instance curve b, eqn. 2.15 may only be used for small concentrations of solute in the gas mixture. For the calculation of ~ the slope of the CUrve for low concentrations is used and extrapolated to a concentration of 100% (curve c).
17
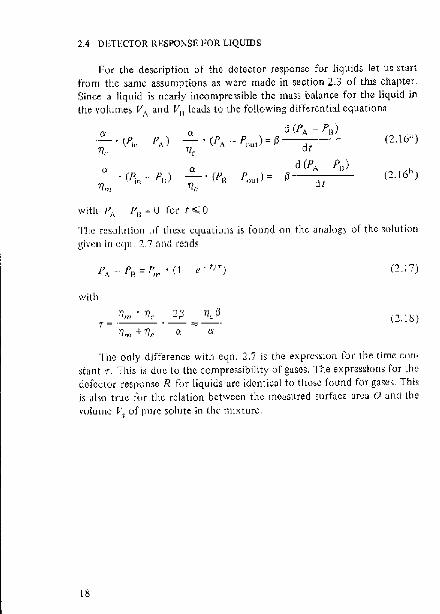
2.4 DETECTOR Rr:Si'ONSL l"OR LIQUIDS
Fol' the de~cripti()n of the detector respOllse for liquids let us start from the ~amc assumptions as were made in section 2.3 or this chapter. Since a IiqLtid is nearly incoolpressible the maSS bahlflee for the liquid in Lfle yol\ltlleS VA ~nd VB leadS to (he following differential equations
(2.16")
(x _.-.0 (1' ..... p.l ." In H '(m
(2.16" )
with· 1\ PI! ~ Ufo!' t";;; 0
The resolution l)f these equations is f()llnd on the analogy of the wlution
given in cqn. 2.7 and reads
0.17)
with
"rim 0 t)c 2[3 7([3 "T = .---- . -- "'" --. (2.1Ci)
1)""l + t)c 0: a
Tile only difference with cqn. 2.7 is the exprc~sion COl' the time con· stant f. This is due to the compressibility ()f gasos. The expression, for the dOrCdOr response R ti)r liquidS arc identic,J! to those round for gases This is also truc for tlte relation between the lnOaS\lr~d surface area () and the
volulIle V, or p\l(~ solute in the mixture.
lS

CHAPTER 3
VISCOMETER
3.1 INTRODUCTION
One of the main problems with the measurement of viscosity is the calibration of the viscomcter. 6 ,7 For this calibration a fluid with a known viscosity is normally used. The uncertainty in the value of this visco~ity causes a systematic error in the experimental determinatlons. This error can be reduced by measuring the viscosity of a substance with respect to the viscosity of a reference fluid.
With the flow.impedance bridge detector described in the previous chapter, measurements to obtain such relative viscosity data can be per· formed, In this chapter the results of these measurements for binary gas mixtures are reported. The composition of the mixtures used was varied, and the lighter component in the mixture Was used as a reference gas.
The experimental results were compared with those found theoretically. Therefore the Chapman-Enskog solution of the Boltzmann equation togethe, with the extended law of corresponding states were usCd8,~.
3.2 EXPERIMENTAL
For the determination of the relative viscosity tl* "tlm/tlc of a binary mixture, the flow-impedance bridge detector was used. The lighter component of the hinary mixture (reference ga~) was ll~ed as a carrier gas. To simplify the notation, in the foIlowing equations the heavier compound of the mixture will have a subscript 1 and the lighter component will be denoted with a SUbscript 2 : i.e. tl* = tlmjTi~
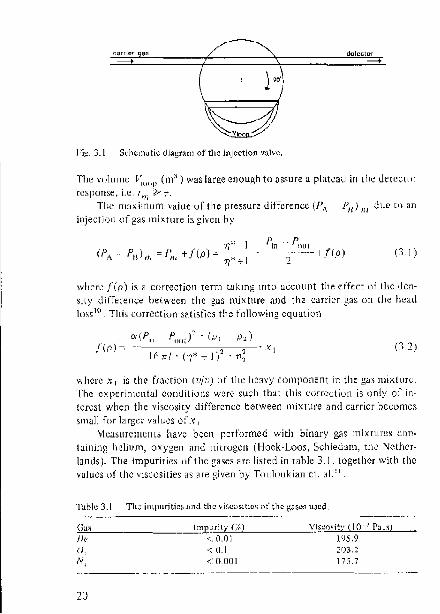
For the injection of an amount of gas mlxt\lre into the flow of carrier gas an injection valve (type 772, Packard-Becker, Delft, the Netherlands) was used, as given in Fig, 3.1.
19
dol~ctor
Fig. 3. I SdlCrnatic ~iagraIl) of the injection v'llw.
The volume VI""p (nr' ) waS hirge enough to ns~ure a platl'au in the d\,(cc(or response, i.c. tm ;.-- 'r.
The rnaxinlUm value ur the pressure difference (/\ P/I) iii due to an injectioll of gas mixture is given hy
1)~' I l'il1 I'olll PI!) 0, = P,." + j'(p) '- ---. -----.• - + f(p)
17" + 1 :1 (3.1 )
where j'(p) is a correctioll term taking into account the effect of the density dlfference between the gas mixwre and the carrier gas OIl the head loss 10 This correctiun s~itisries the following equation
./(p) " (Xu';" 1'''''1)2 - (p, pi)
1671/- (rl" + 1)2 - 7r~ (3.2)
where x, is the fractioll (v/v) ()f the heavy cOlllponent in the gas rnixturc. The experimental cOIlditions were such that thi~ correctiun is ()nly of interest when the vi,c(lsity difference between mixture and carrier bccomes $111(1)) for larger valLl(~s or x I .
Measurements have been performed with binary gJS mixtures COli"
taining hcliul1l, oxygen ,llld nitrogen (Hoek-Loos, Schiedalll, the Netherlands). The impurities of tltc gases are listed in table 3.1 . together with the value's of the viSCOSities as ,Ire given by Touloukian Cl. ltL II.
'l'u,hle 3.1 Tht.:': ln~pllritk:-; ~ll1d the vi~uositic .. of the g.\lSC~ llsed,
fie 0, N,
20
__ ~~~l:'~lrilY Co <.0.0 I <.0.1 <: O.OOt
--_._ ... _ ....... __ .. .
Yf\""sity (10 i Po. <)
l~5.9 203.;: 17.).7
The capillaries constituting the bridge are made of stainless steel with an inner diameter of 0.38'10-3 m and a Icngth of 0.1095 m, loading to 0: '" (4.76 ± 0.04)·1O-'~ m". The time delay line consists of a nylon tube with all inner diameter of 4· 10-3 m and a length of 1 nl. This type of wbe was also used to connect WI with W1 and W" with W4 , hoth connections having a length of 0,5 m. As the volume of each compartment of the dif· ferential manometer is 10-6 m3
, the volume Vo equals 7.3 .10-6 m 3. The
value of ff of the manometer (model MP-45. Validyne, Northridge, U.S.A.) was measurcd to be gA' 10-11 mJ IPa. POol is atmospheric pressure and 1';" - Pout has a value of about 260 Pa. This WaS measured with a Baroccll differential manometer with an accuracy of 0.1 % (model 5810, Datametrics, Wilmington, U.S.A.). PA - PE was measured with an accuracy of I 'x,. For the production of the gas mixtures a gas mixing pump was used, also having an accuracy of 1 % of the adjusted value (modelIM300a-F, Wosthoff, Bochum, G.f.R.). All the experiments were performed at room temperature T", 293.7 ± 0.5 K.
3.3 ANALYSIS j·OR TH~; BINARY MIXTURES
for the analysis of the experimental data of binary gas mixtures, the Chapm<ln-Enskog solution of the Boltzmann equation was used. This solu· tion leads to the following expression for the reduced viscosity~.
1)", 1)'" = - = (I +A)j(B + C) (3.3)
112
where A .. ~ A IZ {x~!2 + 2Xl (I -XdIMI2 (~+~)-lJ 5 M, L 1)1 1)2
+ {I -xd" M~} M,
2 1)2 1), B;::x, - +2xI (l--XI)- +(1 ... x l ?
1'/ I 1) 12
3 {2 M[ 772 1)12 C=- An x t --+2x,(l-·x , )M ,2 --+
5 M~ 1'/, 1)1
21
In these equatiolls MI and M, arc the molecular weight! (kg/mol) of the ~pcci(;~ and M,~ is defined by
M'2 ,,-,(M I +Mz l"/(4M I M,) (3.4 )
The quantity A 12 is defined hy
(3.5)
wher~ n (2,2)' and n ( 1 • 1 ). arC universal c(lIH~i()n in tcgrals wh kh ~Ire both
1I 1\IIKtiun of the reduced tcmperalllre Til'
And :q~ being defined a, fulll)wS :
where ('I.,)A is 1I p(ltcnti,\! jlM<ll11ctcr (K).
The viscosity 1) 12 can be expressed by
5 { lkTM[M J }Y' I 1) ~ - ----.......... ... • ----.-. .
12" Ie) -rrN(M , +M2
) u;, -[).(1.2)<
0.6)
(37)
wll(:;rC k is the UoiV.m;lnn COllstant, N is Avogadro's nllinber. Tis tht tCIlI·
pe['~\tllre (Kl ;111(\ 0
"
, is the collision dbmcter (m). i\lthough these eqllatioll3 were dofined for l11onatomi,: gases Ke,tin
cl. a1. 12·16 h~\ve sh()wn that they can aiso be used for poiyatomic gases. They abo gave cxpressions for the universal colJi!ioll integrals
n(l,I)' =exp{0.347 0.444 (In T*) i"O.093 (In '1'*,)2 .. O.oJO(ln:r*):I}
O.S < T" < 25 (3.1l)
~l(2·2)· =/. cxp{O.45667-· 0.53955 (In T*)+0.18265 (1n T*~2
·0.03(,92 (In T''j'' + 0.00241 (in p)" }
I < 1'*<90
where I is a correction factor cuvering higher approximatiom.
13.<))
Silllila,' to eqn. ).7 the rollowing relatiun can be derived for the vis·
co~ity of a pure gas
22
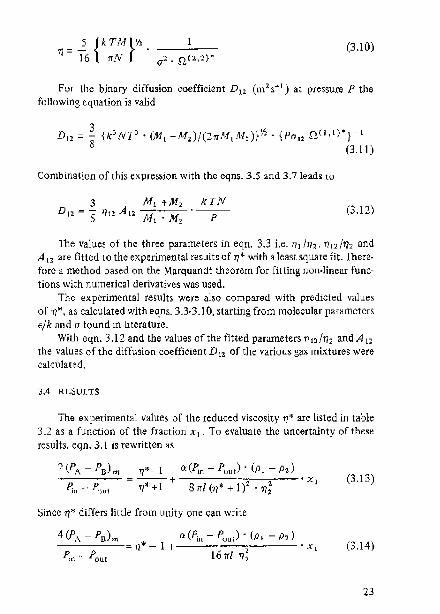
(3.10)
For the bin~ry oiffusion coefficient Dl~ (ml S~I) at pressure P the following equation is valid
Combination of this expression with the eqns. 3.5 and 3.7 leads to
(3.12)
The values of the three parameters in eqn, 3.3 Le, lJl/lJ~, 1)12/112 and A II are fitted to the experimental reSLlits of 1')* with a least square fit. There· fore a method based on the Marquandt theorem for fitting non·linear funelions with numerical derivatives was used.
The experimental results were al~o compared with predicted values of 7)*, as calculated with eqns. 3.3.3.10, starting from molecular parameters Elk and (J found in literature.
With 04n. 3.12 and the values of the fitted parameters 7)12/7)2 and A II
the values of the diffusion coefficient D12 of the various gas mixtlireS were calculated.
3.4 ){ESlitTS
The experimental values of the reduced viscosity 7)* arc listed in table 3.2 as a function of the fraction Xl' To evaluate the uncertainty of these results, eqn. 3.1 is ,ewritten as
11*- I a (Pin - Puut )' (Pl - Pl)
= -1/-"'-+-1 + 8111 (7)~ + j-f . 7)~
Since 1/" differs little from unity one can write
(3.13)
(3.14)
23

The rat.io (I'll. - PI!)",/(Pi" - p',ut) is measured within 1%, with a systemat.ic eITO], which is less than 0.1 %. This systematic error is so small hecause
the different. i<1 I manometer measuring FA' Ffl is calibrated against the manollletor measuring p;" t; .. ,/. The fract.i()n x I is determined with an accuracy of I %, so the second term on the right hand side has ~ln accuracy of ahollt I % and a systematic error of 2';;" Because the influence c)f this
term on the reSlllts is less than a few percent, the vaillc of 7,'- I call hc determined with an accuracy of 1 % and a systematic error of about 0.2%.
hblo 3.2 The rCdllcc,d viscosity n' with various fractions of the lighter ulInpunent for the.": gas mixtures lI:;~d_
._-"", ..•. ,._ ... '.-'., .. " .... _._-, ...
FrudioTlx] Reduced viscosity,,· -",.".",,'-,-"'"
OJ)] 1.00776 i 0.00007 100208, 0.00002 1.00 I 79.! 0.0000 I 0.Q2 1.0143 .0.0001 '1.00381 , 0.00003 1.00351 , 0.00003 0.03 1.0211 ,0.0002 1.00537" 0.00005 1.00516 , 0.00005 004 1.0275 ,0.0002 1.00657 i 0.00006 1.00689 , 0.00006 0.05 1.0334 " 0.0003 1.00766 , 0.00007 1.00844 , 0.00008 0.06 1.0333 .\ 0.0003 j .00350 i 0.00008 1,0100 , 0.0001 0.07 1.0434 , 0.0004 1.00933 , 0.00009 1.0117 , 0.0001 0.08 1.0480 , 0.0004 1.00982 , 0.00009 1.0133 \ O.QOOI 0.09 1.0524 , 0.0005 1.01020, 0.00010 1.0149 ,0.0001 0.10 1.0567 , 0.0005 1.01039 , 0.00010 1.0165 J 0.000"1 0.15 1,0734 ,0.0007 1.0MSl , 0.00009 1.0247 , 0.0002 0.20 1.0836 .\ 0.0008 1.00681, 0.00006 1.0331 ) 0.0(1)3
0.30 1.0944 ,.0.0009 0.99641 , O.OOOOJ 1.0491 ! 0.0004 040 1.0949 ~. 0.0009 0.9832 , 0.0002 1.0647 t 0.0006 0.50 1.0847 , 0.0008 0.9687 ,·0.0003 1.0809 !,0.0008 0.60 1.0817 ,,0.0008 0.9535 , 0.0004 1.0956 , 0.0009 0.70 1.0728 , 0.0007 0.9392 , 0.0006 l.l J 1 , 0.001 0.80 1.0613 .\ 0.0006 O.nsZ ± 0.0007 1.126 , 0.001 0.90 1.0506 ,0.0005 0.9119 ± O.OOOR 1.142 , 0.001 1.00 1,0393 ± 0.0004 0.8982 ± 0.0010 1.156 I 0.001
-""~----..
Gas mixture 0, H,. N, ... 1(,_ 0, -.N., .~',""'--'-----'
The result> uf the least square fit applied to the experimcntal data Me listed in table 3.3.
The vallles of the parameters of tile oxygen·nitrogen mixture werc ohtained
by t1tting the fir~t two parameters i.e. rl,/T], and T]" /T]?" and using A" ,IS
an input paraillctel', whidl vallIe wa~ taken from liter'llure". This had to be dune !lecallse uf the almost linear relatiun betwee!l17~ and the coneen-
24
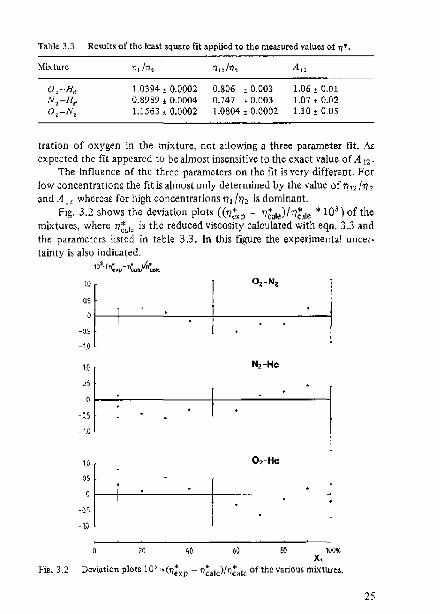
Table 3.3 Results of the least square fit applied to the measured values of 7j".
MixttLfC 11,/n, 11" /11, An
O,"'H, 1 ,0394 ± 0.0002 0.a06 ± 0.003 1.06 ± 0.01 N,-II, 0,8989 ± 0.0004 0.747 " 0.003 1.07 ± 0.02 O,-N, 1.1 563 i 0.0002 1,0804 ± 0.0002 1.10 ± 0.05
tration of oxygen in the mixture, not allowing a three p<lrameter nt. As expected the fit appeared to be almost insensitive to the exact value of A 12·
The influence of the three parameters on the fit is very different. For low concentrations the fit is almost only determined by the value of t)1~ Irr2 <Inci A 12 whereas for high concentrations 171 /112 is dominant.
Fig, 3,2 shows the deviation plots «1/~xj) _. 1/~al,)lrrt"l. * 10') of the mixtures, where 1/~"le is the reduced visoosity oalculated with eqn. 3.3 and the parameters listed in table 3.3, In this figure the experimental uncertainty is also indicated.
103
• ''':IIP -Tl~IO~~IC
~.; r_--+-___ -'----__ -----t ___ O_~ -_N_~ ___ ___l
-05
-1.0
1.0
uS
-0.>
-1.0
:: r_+------! ____ --+ __ ~O-~--H-e---____1 -OS
-1.0
20 40 60 80 100% X,
rig, 3.2 Dcviati<:m plots 10' • (1]:xp - 1]~;.IJ/1]~"I' of the various mixtures.
25

In Pig. 3.3 changes in the calculated vahles of 7/* (Lln;"I<.)' due to a variation of one of the parameters \1sed to cakubte 1)~;'k' is shown. These parameters wOre varied one by one a.nd the variation was equal to the standard deviation as listed in table 3.3.
to
0.5
10
os
20 40
1 _ ..:::.. (rn /'I'l~J
1= 6!rmlm) J =.6. (Ato!)
60
N,,-He
100% X,
Fig. 3.3 Illtlu"llce of the variatioll in the param<;t<;rs used for the eakulali<m "I' the valuc. for fI'.
As already mentionod in section 3.3 the reduced viscosity Can also be calculated from potential par"meters i.e. 0"1, 0"2, On and CI, "2, "12. In table 3.4 some values of thc~e parameters, fO\1nd in literature,N,12 <lre listed. Thc valllcs given hy Ilirschfeldcr CL al. ,He diviJeJ in two series: H+ is valld for temperatures above 300 K and If- is used for lower temperatures.
Since I-lirschfelder et. al. give no vallles for 012 and "12, these val\1es
26
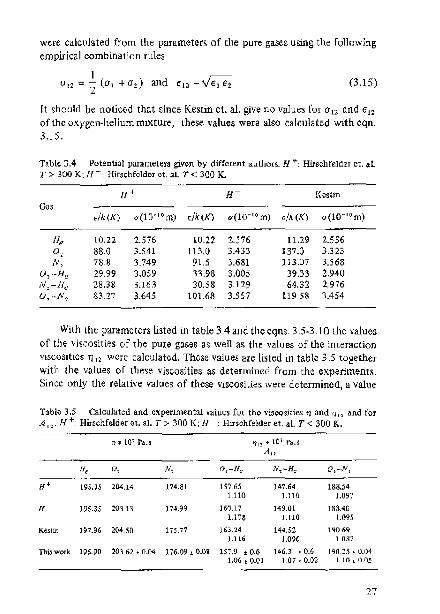
were calculated from the parameters of the pure gases using the following empiric") combination rules
I (J12=-(U l +(J1) and <ll"'..,;e,e:;-
2 (3.15)
It should be noticed that since Kestin et. al. give no v<llues for 012 and <:12
of tbe oxygen-helium mixture, these value~ were also calculated with cqn. 3.15,
Table 3.4 Potential parameters given by different authOtS. 1I +: Hirschf~ld~r ct, at T> 300 K; If -': Hirschfelder ct. at r < 300 K.
ll+ 1I Kostin G3S
e/k(K) .,(10"'· m) c/k(K) 0-(10"" m) </k(K) a(10-00m) ---.. ~
fl(! 10,22 2.576 10,n 2.576 11,29 2.556 0, 88,0 3.541 113.0 3.433 137.0 },323
N, 78.8 3.749 91.5 3.681 l13.07 3.568 0, ·-I-Ie 29.99 3.059 33,98 3,005 39,33 2,940 N,-lI,. 28.38 3.163 30,58 3.129 64,32 2.976 O,--N, 83.27 3.645 101.68 3.557 119,58 3.454
With the parameters listed in table 3.4and the eqns. 35-3.10 the values of the viscosities of the pure gases as well a~ the values of the interaction viscosities 1{,1 were calculated. These values arc listed in table 3.5 together with tbe values of these viscosities as determined from the experiments, Since only the relative values of these viscosities were determined, a value
Yable 3,5 Calculated and experimental values fOI tile Yiseo~itie, '1 and '1" and for A",fI+: Hirschfelder et. al. T:> 300 K; JI-: Hirsdlfdder et. aL r < 300 K.
Tt" 10' f'a.s ill:l • 1 eJ'l (';:t.. ~
A"
ll, o ~ iV, 01-··11~ N,:'-Ha OJ-,·N l
H+ 195,35 204.14 174,61 ISHS 147.64 lSS.54 1110 1.110 1.097
If 195.35 203.13 )74.99 100,17 149.01 IRMO 1.108 LlI0 1.095
Ke~ain 197.96 204,50 175.77 1~>.24 144.52 190.69 1.1l6 1.096 1.082
Thi:;w"rk 195.90 203.62 , 0.Q4 176.09 l 0.08 157.9 ,0,6 146.3 .• O.~ 190,25 , lI.1l4 1.06 , 0.0\ 1.07 : 0.02 LlO,0.05
27
.18
· 17
• I G
I · 15
1 · 11
·13
1 . 1 ~
I .11 (J~I Q 1 . I ( )
if)
'= .. l.rEI CI w 1 . Of] U =J 0 uJ 1·07 ".,
J ·06
I. OS
1.04
1 .0.1
.Il?
I ·01
02 jN N2
. ~
. ,
o . I .2 ·3 .4 . S .1)
FRACTION X1
! . . I,
J ./ 1/
11/
' __ . L ____ . __ L __ ..
. B ·9
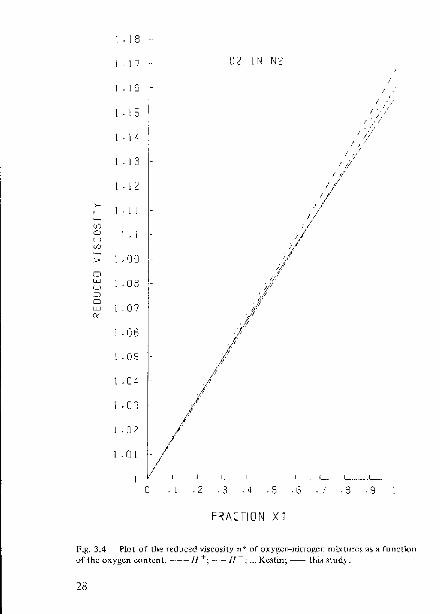
Fif,. 3.4 Plot of tile ~ed\lced viscosity '1· of o)(ygQn-n.it1'Og~n mixtur"s "3 ~ function of the uxygen cont~nt. _._-- JJ +; -.--1/--; ... Kcstin; _. this Shldy.
28
.8g
.88
87 _L-.. L-__ ~ ... __ I __ '--_L--L_~
o ·1 ·2 ·3 .4 ·5 .67 .8 .9
FRACTION X1
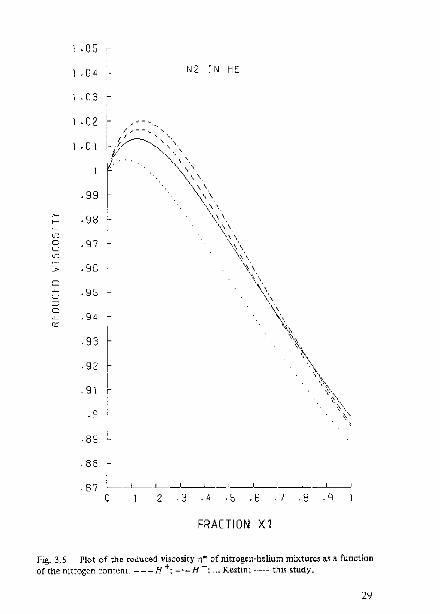
Fig. 3.5 Plot of the redUCed viscosity 71· of nitrogen-h~lium mixtures as a function of the nitrogen content --- H +; -'.- Ii -; ... Kcstin; - ---. thi,l study.
29
0'2 IN H F
-Y9
-8R I .... ,." .L._ .. __ L .. L .... ___ .. L._ .. 1
n • I .2 , j - 4 .;, ,Ci . (] Y
FRACTION X1
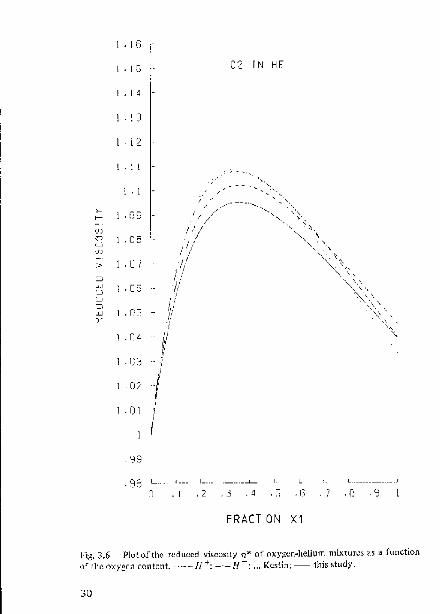
Fig, 3.6 Plut oHhe redllced vu;cu,ily 71' of oxygcn-helh1.1)1 mixtures as a function M the oxygen contcnt .. -----.. J[ +; ---H -: '" Kc,tin; -- tllig ~tudy_
30

for the viscosity of one of the pure gases had to bo adopted. Therefore the viscosity of purdwliu)1l was used (table 3.1). Also in table 3.5 the calculated and experimental values of A 12 are given, except the value of A 12 for the oxygen-nitrogen mixture for this work, which is an assumed value_
Fig. 3.4-3.6 show the reduced viscosity 1/* of the three mixturcs as a function of x I, calculated with eqns. 3.3 and 3.4 and the data listed in lable 3.5.
The values of the binary diffusion coefficient D [2 were also calculated from the experimental results. (eqn. 3.12) These values were converted to 273.2 K. using the following expression given by Chapman and Cowlingl~
dlnD l2 5 ---",2 .. · - c
d T 2 0<c<I/5 (3.16)
The rcslilts are given in table 3.6 together with values givcn by Chapman
Table 3.6 Experimental vatu~s of the diffusion coefficient D" comp<lIcd with values given by Chapntan. )loth at 213.2 K.
C11~plnall
Thb work 0.626 0.60, 0.02
N, H,.
0.607 0.57 , 0.02
O,-·N,
0.181 0.178 j, 0.009
-----------------.--.. ~-
3.5 DISCUSSION
As hils been shuwn by the experimental results, it is possible to llse the flow-impedance bridge detector for th~ accurate determination of the rcdllCcd viscosity (1/*) of a binary gas mixture as a function of the composHio)). With thc present configuration it is possible to detect relative viscosity changes in the order of 1 O-~ --I 0-6 • The only restriction is that the capillaries of the bridge have to be equal. This can be checked within 0.01%, so the systematic error in 1/* dllc to this effect will be less than 0.01%.
The results from the lhcoretical approach me quite satisfactory. The values of the viscosity of the pure gases and those of the interaction Yiscosity (7)[1), correspond well with those calculaled from potential parameters found in literature.
31

As is shown by table 3.3 and 3.4 variOllS sets (11" potential parameters load to almost the ~ame value for the viscosity. Since the flow-impedance bridge detector i~ a very accurate method for tllc dClNmil1otion of the rcdllced viscosity. it should be possihle to determine these potential parameters aCCIlratcly from viscogity measurements over a range of temper,}
tllres_

CHAPTER 4
APPLICATION OF THE FWW·IMPEDANCE BRIDGE DETECfOR IN CHROMATOGRAPHY
4.1 INTRODUCTION
So far it has been assumed that peaks entering the detector had a block shape. [n chromatography however the concentration profile of the solute-carrier mixture leaving the column is normally a Gaussian curve
e=e exp [ ~J m 202
(4.1 )
where em is the maximum concentration (kg.m-3) at the outlet of the
column, and (J is the standard deviation. Typical values of a for both gas and liquid chromatography are in the order of 5·10 sec. The ma)(imum concentration em can be expressed by
(4.2)
where M" is the maSS (kg) of the injected solute, ~ is the porosity of the column, and 1> is the flow-rate through the column (m3
sol ).
Since the concentration Cj',j at the inlet of the column equals
Ms (~, ,= -,-.... ,'-'-
''') V· Inl
(4.3)
where V;"i is the injected volume, the dilution D by the column is given by
C jnj IE 1> a ..,f2";; D-------
- C"I - Vi"j (4.4)
In table 4.1 some typical values for the various parameters for both gas (GC) and liquid chromatography (LC) together with the calculated values of the dilution D are listed.
33
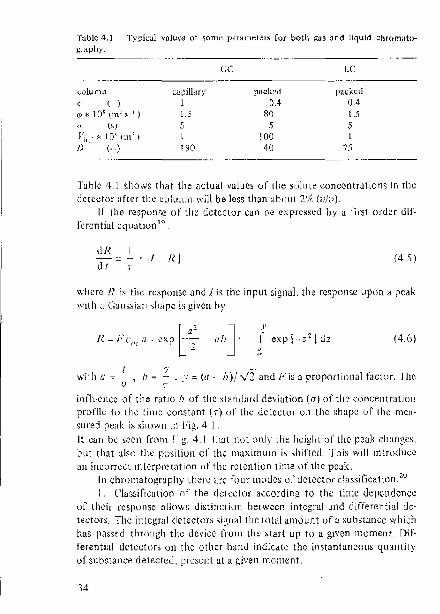
Table 4.] Typk:ul V"hl(:'S ()f ~Ol11e paralIl~t~ts foJ' both g~~s and liquid chromato-graphy.
i..~oluml1
< () (j) .t: I Ol'i (11'1,1 ~ I)
('I V;"i * 10" (m' I j) (.-)
cal)ill"ll 1 1.5
I
190
(;C
p"ckcd 0.4
~O
5 [00 40
LC
packed 0.4 1.5 5 I
7.1
Table 4.1 $I\Ow3 that the actual valuc~ 01" the 3011lte concontrations in t.hc detector after the cOIUIlin will be less Thim about 2'N, (v/o).
If the respnllse of the lictcctur can be expressed by 1I fi.-st order difkrentild equlItion ").
dN
d t r . II N j (4S)
where R is the response and f is the input signa!. the re~p()nsc upon a peak with a C:"lIssian shape is given by
ta2 j{ "- /.' c (). eXI) _._--
III '-,
.I' f ex pl··· z 21 LIz
! () wjth 11 -, 0 ' h = T • Y ~ (a· h)! ,,/i' and F is a propoltional factor. The
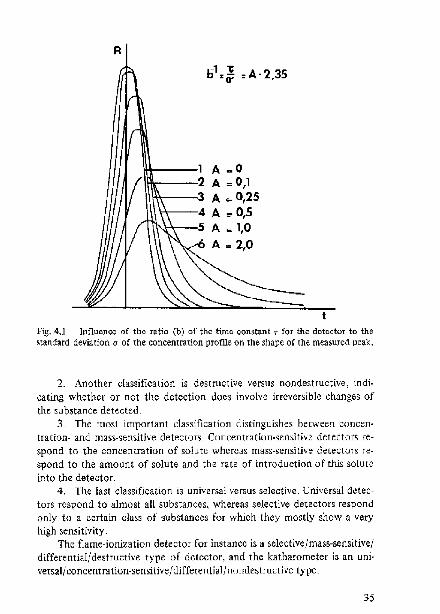
inf1\lcl\(\' of the r,.tio h of the staIldard cicviiltion (el) of the concentration profile to til" tiJlW ,:onst<lIlt (T) of til" JCtC(tof ~)J1 the shape lOr th~ IllCH
smed pe,li( ig SIIllWIl in l'i~. 4, I .
11 caIl be seen fn)11l Fig. 4.1 Ihal not only the height. of the peak changes, bill that also t.he p()silion of the Illaximuirl i, ,I\iftcd. Thi~ will introdH~e lIB iIlcmrC(\ interpretat.ion of the rGlention time of t.he peak.
In chromatography I/Joro lire four moue, or ueto(\or d'lssificatilln. 20
I. Classificatioll of the dotector ~ccording to the time dependence or their r'CS[1()l1S~ :Jilows distinclion between integral and differential de· tectors. The inlcgI'lil detectors signal the total aillount of a sub,lance whid1 has [1ass~d through the device I"rom the sbrt up to a given m()ment. Differential Lletcc[ors on the ()th~r h,lIlU indicatc tho instantancous quantity lOr slll)nance detected, present at a given moment.
34
R d "t u "0: : A· 2,35
1\+---1 A-O lHlr---2 A '" 0,1 l*--~3 A 0= 0,25
4 A =' D,S ,,, .. +---5 A '"' 1,0
t Fig. 4.1 Int1uenQ; of the r~t;o (b) of thc time con~t~nt T for tho detector to the standard deviation" of the concentration plofll0 on the shape of the measured pc~k.
2_ Another classification is destructive versus nondestructive, indio cating whether Qr not the detection d()e~ involve irrevcr~iblc changes of the substance detected_
3_ The most important classification distinguishes between concen· tration- and mass-sensitive detectors_ C()ncentratkm·~ensitivc detectors respond to the concentration of solute whereas mass-s~nsitive detectors respond to the amount of solute and the r~te of Introduction of this solute into the detector.
4. The last classification is universal versus selective_ Universal detectors respond to almost all substances, whereas selective detectors respond only to a certain cla~s of ~lIbstances for which they mostly show a very high sensitivity_
The flame-ionization detector for instance is a selective!mass-sensitive! differential/destructive type of detector, and the katharometer is an uni· versal! concentra lion-sensitive! differential! nO[lde~tructivc ty pc,
35
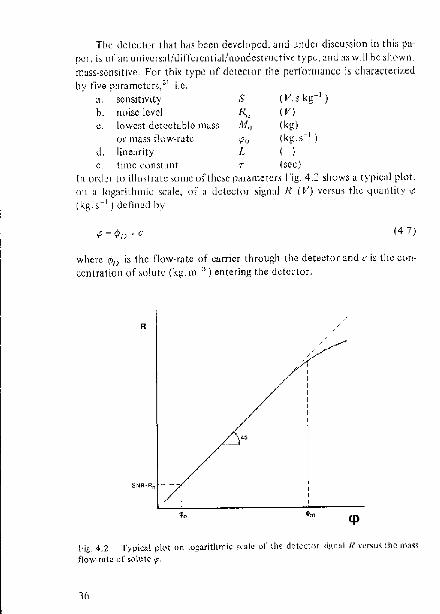
The detcctor that kls been developed, ~nd llnliel' discu3~ion in this pa
pCI', is of an univcrSiti/di I TertIi tiul/llondcs(I'univc type, and as will he shown,
Illass-scnsitiv(~. For this type of detector (110 perforlllancc is chara(:(~rized
by five p;trarnctcrs,2 1 i.e,
a, sensitivity
h. noise level
c.
d,
lowesl detecta hlo ]11ilSS
Of mass flow-rate
line~lrit.y
s
'PI) L
(V. S kg-] )
(V)
(kg) (kg .S-I )
( )
c. tilllC constant T (,ec) In order (0 illustrate WIllC orthcsc paj'~l11eters I-'ig_ 4.2 shows a typi(:ill plot,
on a logarithmic scale, of il detector signal R (V) versus the quantity <.(!
(kg,s-I ) defined by
.p=¢f)'C (4,7)
where q)f) is the rIow-rilte of carrier through the detectol- and c is thl' con
centration of solute (kg, III :1) entering t.he detector.
<1',"
!,'it., 4.2 Typi~a! p!,-,t 011 lugarithm;(: s",,1e or llle dell'clor ;ir'1ili R versu.' tho ,MSS
now-,ate or solute -p,
36

These five parameters will be discussed in detail in the following section. (ad. a). Th~ ~eilsitivity of the detector is defined as
dR s=d<p
(4.8)
This parameter depends on a detector quantity, and a quantity which only depends upon the combinatioil of carrier and solute.
(ad. b). The noise level R" is defined as the standard deviation of the base line t1uctuations. For the determination of this noise level the av~rage value of the signal R over a period of time comparable with the time interval 4 a of the concentration profile is used. For qualitative analy~is the signal to noise ratjo SNR has to have a valu~ of 3, whereas for quantitative analysis this value is taken to be 10. Zl •
(ad. c). The lowest detectable mass flow-rate (<Po) can be calcUlated with the following equation (sec i'ig. 4.2).
R,. 'Po = S . SNR (4.9)
As was noted above the term SNR = 3 is used for qualitative analysis, therofore:
(4.10)
For the lowest detectable mass (Mo) with SNR " 3 the expression (4.11) is equated
3R"oili M,,=----~
S
where a is Ihe ~tandard deviation of the concentration profile. (ad. d). The linearity L is defined as (see Fjg. 4.2):
(4.11)
(4.12)
where 'P,,, indic~tes the point where the slope of the line differs 3% from unity.
37
(ad, 0), The time constant (T) of t.he det.ector follows from the response upon ~H\ instantaneous change in t.he inpllt (eqIl. 4.5). The influence of the time constant upon the recorded chromatographic peak is shown in I'ig. 4.1. For qualita tive analysis the ratio OfT has to be in the ord~r of 10.
The perfmm;ll1ce of lhis new uctector in ga$ and liq\lid Cht'OlWltO' graphy slI(ces$ivcly will be described, listing the values of thc above dc·
tined parameters for this detector Ht. t.he end of each paragraph.
4.';, (;;\:i ClIROM;\TOld,;\I'HY
4.2.1 /Ilfrodll('fion
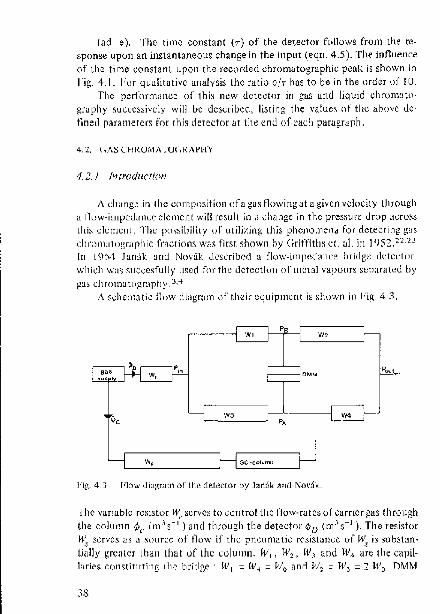
i\ t.:hang\~ in the composition ofa gas flowing at a given v01()city t)J!'Ough a Il()w·impedance clcincJlt will ['(suit in ,\ change in the pmssurc drop aCrl)~$ this clemen!. The possibility of Lltilil.ing !l\is phOIlOIl1et1<1 for detecting gas chl\llllutugraphic f"anions was firST. showll by C;ritliths et. a1. in I ')S2,22,2J lIt 19(A Jan{lk and Novuk doscribc(1 u fiow-it1lpcd;ltlce bridge detector, wll iell wa~ ~uct;e~fully used fot· the detectiou or lllctal vapollrs separated by gas chromat()graphy. ~\,4
i\ Schematic fll)w di;lgr,tt11 oft.hdr CCjuiplllcnl is shown in I'i!l., 43,
!'ill. 4.3 Flow uiagram 01" the uetector by Janak alld Novak.
The variable resistor It;. ~crvcs to coutwl the Iluw-rate~ of carrier gas through the column <Pc \t1l.I S- I ) and th),ough the detec(m ¢[) \t11.1S- 1 ). The resistor Ws serves tl~ a souree of !low if the pneumatic rc~istalwc of WI' i~ substan· tially grcillcr thall that ()f the col\lmn, WI' W2 , W.l and W" are lh~ capillaries constituting Ill" bl'jdg~ . WI = W4 = Wo and 1112 = W.J = :1 W() !)MM
JS

is the differential manometer measuring the difference between the pressures PA and PR . The response R of the detector can be expressed by
(4.13)
where SM is the sonsitivity of the differential manometer. It can be SMn fro111 this equation that the response of the detector by Janak and Novak is effected by two experimental parameters i.e,Pin - Pout and <Po" The bridge can be balanced by adjusting Wr • The change of W4 duc to a change in the composition of the gas leaving the GC-colurnn causes a change in R and can be given by
4 - 9
When the bridge is balanced then:
(4.14)
(4.15 )
If this result is compared with the expression that was derived for the new detector (eqn. 2.S)
17m ' 17c R=SM P ""----
,~ rtc (4.16)
it can be ~een that these expressions are very similar. The big difference between the two method~ however is determined by the way the detector is balanced. In the sct-up by Janak and Novak this b<llancing is in fact achieved by adjusting the pressure difference Pin - Pout and the gas flow-rate ¢". and thus will be sensitive for flow variations. The detector under discussion is balanced beCause of the usc of four equal capillaries and thus is independent of the gas flow-rate as in a real Wheatstone bridge.
39

In the ne)(t ~ectiolls kt us describe some experiments which indicate the possihle LIse of the new detector in gas chromatography.
4.2.2 Fxperimental
III order to explore the possible LIse of the new detectof in ga~ .;hrOIll,\togruphy (he set-\Ip s)wwn schematically in l'ig. 4.4 was used.
Iii!;, 4,4 Schclll<ltic diagram of th" e>.perirncntal amlJ1gcll1ont.
During the experiments fom types of injection systems werC lIscd to inject a volume (V;,) of sO[\1(e or of a mixture of solute ;l.I1c! carrier gas into the flow of carrier gas through the detector. I.e. (see rig. 4.5)
(i) syringe, Vinj < 50'10-') m;' ; type 705, 11~l11ilt()n, Bonaduz, Switzerlaml (sec Fig. 4S')
(iil injection valve 230'10-9 ,;;; I-I,,,,~, ,,; 1120'1O-9 n1'\; typo 772,
Packard-Beckel', Delft, the Ne(herland~ (see Fig. 4.5") (iii) syringe in cotllbinaliort with a splitter; type 8(i820, Ila!'lliltort,
BOllad\!!', Swill;~rland (see Fig. 4.5") (iv) injcctiun piston, Viai = 10") Ill;' (sec Fig. 4.5,1)
When using injection system (iii) a division factor K must be applied, and is definod as i'ollows (s~c Fig. 4.5")
(4.17)
The usc of the tplittcr enables one to inject solute volumes (V,.) int(l the detector much smaller than the syringe volume Vinj
(4.1 il)
where xj'\i is the fraction (v/ti) of pLlre solute of the injected gas. The first experiments were performed with nitrogen as the carrier gas
and oxygen as the solute. This gJS combination was chosen because of the fairly lineM relation. between the viscosity of the oxygeJl-nitrogen mixture ~I\d tile conccntratiull of oxygen (~ce Fig. 3.4). According to cqn. 2.9 for the tiTne constant of the detector r '" 0.39 sec. is obtained.
40

lIolulilll
------.
Fig. 4.5 Injection systems used in the experiment..
cietec::tor
det~tor -
rel9lrlc~lo:n
¢!o ------.
In order to investigate the influence of a gas combInation with a non· linear viscosity relationship, hellum as carrier gas and natural gas as solute were useu. The composition of the natural gas is Iistcu in table 4.2.
41
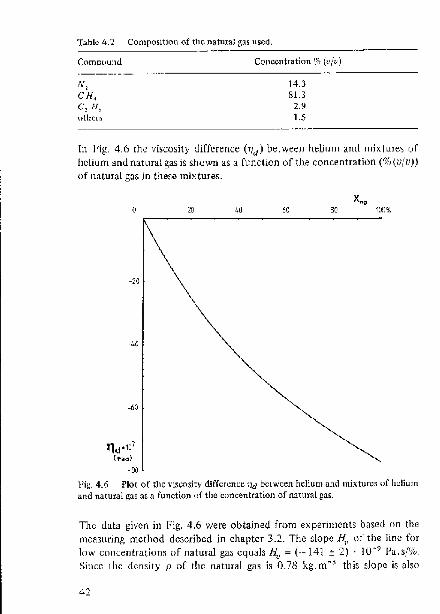
Tabk 4.2 Composition of the ]1at\l~a) gas llsed, ---=--_______ ,-..r----
Compound
N, eli, C, II, other:;
COllCC11tr~ti()n % (o/v)
14.3 81.3
2.9 1.5
[n Fig. 4.6 the viscosity difference (1),,) between helium and Ill.ixtures of hdiuill and natural gas is shllwn as a function of the concentration (%(vlv» of natural gas in these mixture~.
Xn •
40 60 60 100~.
-20
-60
-80
Fig. 4.6 Plot of the vis("'sjty difference lId bet ween helium and mixture' of i,"I,urn and natural gas as a functi(}n of 1.h" "Oncenltatioll of natural gas.
The uata givcn in Fig. 4,6 wet'e obtained from experiments based on the measuring method described in chapter 3.2. Thc slope fl., of the line for low concentrations of natural gas equals Hv = (--141 ± 2) , 10 .. 9 Pa.s/%. Since the density p of (he natural gas is 0.78 kg.rn"3 this slope is also
42
equal to flm = (--·181 ± 3) . 10-1 Pa.s,kg-1 m~, When helium is used as carrier gas then the time constant T is calculated to be OA3 sec.
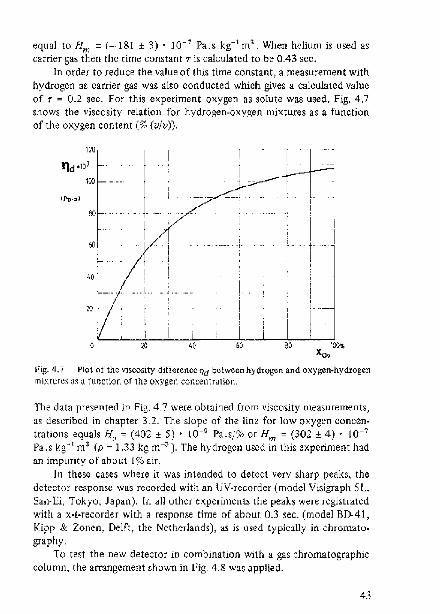
In o(der to reduce the value of this time constant, a nW8su,ement with hydtogcTl as cattier gas was also conducted which gives a calcu1a.tcd value of T = 0.2 sec. For t.his experiment oxygen as solute was used, Fig. 4,7 shows the viscosity relation for hydrogen-oxygen mixtures as It function of the oxygen content (% (v/v)),
1,0
'ld'107
100
(Pit·51
6(J
1.0
20
...... 1 ..
:10 40 60 100., Xc,
rig. 4,7 I'lot or the viscosity difference 'ld between hyUr<.>gen and oxygen-hydrogen "'i)(wre~ lIS ~ fu!)ction of the oxygen concentration.
nle data presented jn Fig, 4,7 were obtained from viscosity measurements, as described in chapter 3.2. The slope of the line for low oxygen Coneen· Ualions equals Hv = (402 ± 5) • 10-9 Pa.s!% Or Hm = (302 ± 4) - 10-1
h.s kg'"' 111 3 (p = 1.33 kg m~3), The hycltogciluscd in this experiment had an impmity of ahout 1 % air.
In these cases where it was intended to detect very sharp peaks, the detector response was recorded with an UV-rec(lrder (model Visigraph 51., San-fi, Tokyo, Japan). In all othcr exporimcilts the peaks were rcgiHratcd with a x·t-recorder with a response time of about. 0.3 sec, (model BD-41, Kipp & lonen, Delft, the Nethcrlands), as is used typically iTl chromatography.
To test the new detector in combination with a gas chromatographic column, the arrangement shoWTl in [,'ig. 4.8 Was applied.
43
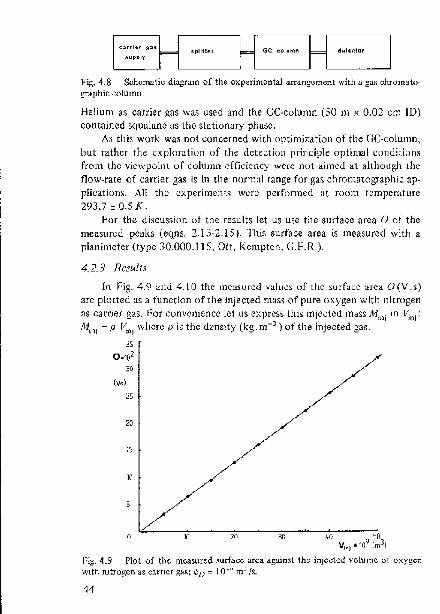
1"'if;.4.8 Sohcma!k diagram of the cxp~rinwIltal arrangement with a ga, chromato· graphic column_
Helium as carri~r gas was used ,Lnel the CC-column (50 III x 0.02 em ID) contain~d sq\lalane as tho stationary phasc,
As this work wa~ not concerned with optimi7.ation of the C;C-coILlmn, but rather the exploration of t.he detection principle optim~l conditions
from the vicwpoint of column efficicncy werC !lot aimed at 111lhoLLgh the
flow-rate of carrier ga~ is in the normal range for gas chromat.ogr,Lphic applicatioIl~. All the experiments were performed ill. room temperature
293.7 ± O.S K. For the discussion of the results let us use the surface area () of the
measured peaks (eqns, 2.13-2,15). This surface area is measured with a planimeter (type 10.000.115, Ott, Kempten, G.F.R.).
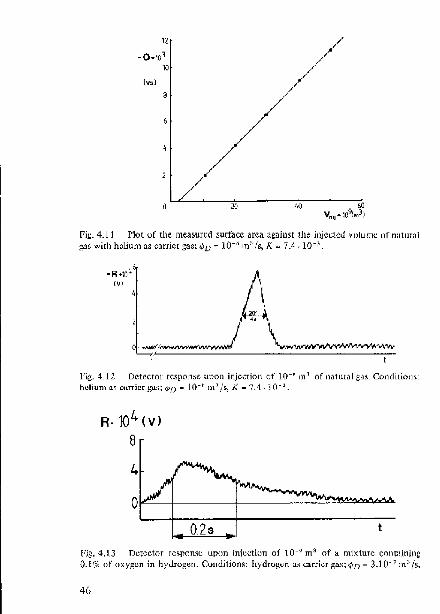
4.2.3 Results
In r;ig. 4.9 and 4.10 thc illCa$urCd values of the $UrfllCC arCa () (V .s) arc plotted as a function of the injected miLSS of pLlre oxygen with nitrogen
as carrier gas, I~'or convenience lei liS cxpres~ lhi~ iIlje~lccl mass Milli in V;ni:
Mini = P Villi where p h; the density (kg. 111-3) of t.he injected ga~.
20
I~
10
hl W ~ W 9~ V'OL -101m3)
Fig. 4.9 Plot of til" m~as\'t~d ~urf"cc arca again,[ the injcdecl volume or oxygen with nitrogen as (Carrier g~$; Ij)o = 10-" TIl; / •.
44

For these experiments the injection systems (I) and (li) were used respectively, in the set-up shown in fig. 4.4. '{'he volume Vu in Fig. 4.10 represents the dead space of the injl>ctlon valve.
o (vol
200 400 (,00 800
Fig. 4. 10 Plot of th~. mC~S\lrcd surface area again,t the injected volume of OXyg~1l with JlitrQgcn as catrier gas; <1>0 = 10-0 m' j,.
The experiml>nts with helium as carrier gas and natural gas as solute were performed with the set-up as shown in Fig_ 4.8, where the GC-column was replaced by a capillary with a !low resistance comparable with that of the column. The results of these experiments arC shown in Fig. 4. II, where Mini is also expressed in m3
•
The fact that the line does not pass through the origin, is due to the dead space of the syringe needle wltich has to be taken into account because of the excess preSSure in the splitter (2.5 -lOs Pa). The division factor K in these experiments was (7.4 :!: 0.2) - 1O-~. The maximum concentrations of natural gas in the detector, due to mixing and diffusion effects, were below 2% (v/v), so it can be assumed that II linear viscosity relationship exists (sec fig. 4.6). The dilution (about 50 times) compares well with those calculated for GC-colurllns (see table 4.1).
Fig. 4.12 shows the measured response of the detector upon an injcc. tion uf iO-~ nl~ of natural gas through the splitter. This corresponds with the. experiment at the lowest value of V;"i in Fig. 4.11. Due to the splitter only 0.08 - 10-9 tn~ of natural gas teaches the detector.
45
(v.l
20
Fig. 4.11 Plot of tile measu[l,d sllrface area against tile injocted VDlumc or natural gas wilh helium as carrie! gas; '~l) ~ 10-' In" !s, K = 7.4.10-'.
Fig" 4.12 DNector response "POll injection of 10-' ll\' of nutural g<ls. COllditio,ls: helium fl!1 carrier gU:l; 'i'f) = lO-H Ill.) j".ll K = 7.4.10-:>.
R· 104 (v)
8
0.2s t
Fig.4.l3 I)erootor rc~pOl1~e upon injection of 10-'J m,t of a mixt.ure OOl1t~llt1i"g 0.1 % of oxygt:.n in hyJrogt;r1. O'::'lldi1iOII~: hydrog.t;n a:-: l,;i.1rricr ga,"i; 1>TJ = 3.1 n- 7 1Il:~ Is.
4(,

The detector response, recorded with the UV-recorder, upon an injection of 10-9 m] of a mixture containing 0.1 % (vlv) oxygen in hydrogen is given in Fig. 4.13. FoL' this experiment injection system (iv) waS llsed in the arrangement shown in Fig. 4.4; hydrogen was \lsed as carrier gas.
The chromatogram (see Fig. 4.14) was obtained by injecting 60 ill of a mixture containing air and hydwcarbo))s with helillm as carrier gas. The hydrocarbon~ were methane, ethane, propane and butane. The arrange· ment shown in hg. 4.8 was applied and K was 10-2 .
Pi:;. 4.14 Chromatogram obtained by injecting 6.10' ',tI' of" mixture oontainin3 air and hydrocarbons. Conditions: helium as carrier gas; K = ro-', <i.>D = 10'-' rn' /$, I ~ ai!, 2 " methane, 3" ethane, 4 0 propane, 5 " butane.
The fact that nitrogen and oxygen were not separated was due to the duomatographic conditions.
4.2.4 Discussion
Let \J~ discuss the results in terms of the surface area O. According to
the eqns. 2.15 and 4.18 the surface arCa Can be ex.pressed by
(4.19)
where X ini is the fraction (v/v) of solute in the injected volume Vi"j. In most expcrimcnts pure solute was injected, therefore x inj = I. In order to express the sllfface area 0 in t~nns ofthe injected solute mass~, '" p • x;".1 , Violi ' where p is the density of the pure solute, then the following equation is applicable
H", 0=·······-· 'M' 'I 4& ,. "M (4.20)
where Hm (Pa.s. kg- t m') is the slope oHhe viscosity relation for low solute concentrations.
47

The theoretical vahle of the slope of t.he lines in Fig. 4.9-4.11 s,ltjsfie~
dO
d Villi
fl .. p '-~-'K'S '~ .. 4C\' M . "'.I
(4.21 )
Bclllw ill lablo 4.3 tho values of the vilrioug parallleters in this eqLliltion dO
ilrc Iistod, together with t.he calculated ami cxpcril)1cntal valLles of-d Vj"i
ror buth the experiments with nitrogen Hml with helium a~ (lltrier g;IS.
Tahle 4.3 Valu"" "I' til" parameters for t]10 varioll' "'perilllt'nt; t0gCtl'\('t witl, the l,.;alcuJal.cd ::l.[lU t:x!~l'ril\lI..:IHi.\l r0:ntlts.
Jlm.ljo: 10' (Pa.s kg'" 111"1)
P (k)!, 1lI \)
i\. .,. 10' ( )
);'ill i () t.:i.lk
" (4.76, O.(H)·lo-'··I11'.
r.arti~r gi.\S
1l1lnJglj" h~~Jiu.m
20.7 , 0.1 U3
1000 I iJ,3;l , 0.0'1
C>.4~ , O.(ll)
.. ·Ut 3 0.78 7.4 ,ru I
·0,24 . 0.01
·0.229 • n.003
SM (4.3~, 0,(11)·10 'VII'a
h011! Ihi, lable olle sees all excellent corrdlltion hct.wecii cxpl'riltlClil ,Ind thoory.
From Fig. 4.12 it can be ,cen that thl~ peak due to an inJcdio!l or lJ.lJe;· I () ,) Ill' Ila III I'll 1 gas into the detector is well above the )1oi~e lovel ilnd thilt (I gil1n in detection of ahout one order of magnitude is po~sib1c. If the standard deviMi()n of the pe~k could abo be redlKed by one order of lIIagllililllc. onc would h,lveadct~cti()nlil11it ofaboulIO" ll m'\ or )0- 12 kg of nalural gas u>ing hclillJl) as cllJ"l'ic( gas.
It is showll in Fig. 4.13 tliat tllis i.letcction limit is also valid for Ihe 1I11lo(lnt ..,f l)xygCn whic;h (~In be detectctl with itydror,cn il.~ t;;lrrier gBS.
The chromatogram givt:n in !,'ig. 4.14 indicates the possibility to mellsure several cilr()lllatognlphit; peah without lilly distlirbalKc due t.o viswsity val'i,l1iol)s in cilpilbrics other than WI'
For the ciisclISsion or the performance of the detector in tCflllS or tile five paralllekr~ dcrincd in th0 introduction of this dlaptcr, let us take the
situation where hydrogen is used as carrier gas and oxygen as solute, (lim '" (303 ± 4)- IO-7 Pa.skg-1 m3 ).
The response R of the detector can be written a, (cqn. 2.8)
lim C R,,.---.~-(P -p )·s
41ic In out M (4.22)
where c is the concentration of wlute (kg m-~). Making use of the following ex pression for the flow-rate (¢ I) of carrier gas through the detector
eqn. 4.22 can be expressed by
SM R=--ll 'c" 400 m ';'1)
(4.23)
(4,24)
The sensitivity S or the detector i, found by combination of the eqns. 4.7, 4.8 and 4,24, leading to
(4.25)
It can be seen from this equation tflat Lhe sonsitivity of the detector is only determined by an instmmcnt constant i.e, SM/4a and a parameter depending upon the gases involved i.e. lIm' The sensitivity is independent of the measuring Cil'l;UtllstanCCS.
According to eqIl. 2.9 the time constant 1 of the detector is given by ;
(4.26)
with Vo ",7.3-1O-"t11". Po '=I05Pa and fi=;ij.4·1O- t1 m 3 jPa.
The maximum mass flow-rate (<pm) up to which the detector maintains a linear re,ponse (see Fig. 4.2), can be calculated from the following equation
(4.27)
49

where xI'" is tile cllncentr,ltioJ\ (vlv) at which the slope of the line in Fig. 4.7 records a ;Vi!, (liffcrcnco fronl the vallie at concentration I.em . x,/l = 5')!,. I;or the flow-rate ¢f) avaJue()fIO"'~ll1)s-l iSLIsed, bcinganormal value
in gas chromatography: <{In, = (>.7' 10 .. 1<' kg.s- I.
In table 4.4 the vallle:s 0f the parameters are listed, which characterise the det~ctor in lile: present configLlrlllion.
Table 4.4 PnnJ.)11Dtt~r) charactt.)risiIlg tht': ctdcctor in its pH~!jtmt c.uJ\t1gurtltion. Con-dition; hydrog(11 \I~ carr1cr g:.a;.; and oxygen as _<;c)lutc.
s 7.0' 10' 0.2.1 (). 4
1.\.\0 " 0,9+-10· I ~
740 0.2
v~ I{]).'·I
V
k~ kp ., .. ,
II! Drder In estimate the ultimate lowest delcctable i\m()uni kt US begin !'rom 0qn. 4.11 and assume lh,\! the standard deviation (I can b,' as ~Illall a~ To I hi~ Icads to tile follOWing expressioll for the lowest dCICd"ble
umOllllt:
(4.213)
Suhstitulion ..,1' the vallil's of tile various paralllc[cr, !\iv.:;-s us
/1.'1" "- 1.1 . l 0- 11 kg (4.29)
If all lhc$e Cigllre~ together arc t"ken, onc may ~()ndude tilal the de· tector (\)1l1!l11I"es f:Jvourably with tile thermal conductivity detector, although there :lrc some differences. The ll1()~t important being Ihe fad that the thermal conductivity detector is c;onecnlrati()n-sen~it.iyc wherl!ils the detect(lr under discLission here i~ mass illlw-scnsitivc. Thi, m~alls t.hat for the thermal condudivity detector the qu,lI1litative a)l"ly~is depend on the gas !low-rate. whereas in this case thG rcwlts are independent of this ex
perimental panLII1C[CI".
50
4.3 LrQU1D ('l'lROMATOCRAl'HY
4.3.1 Introduction
As was shown in the previous chapter the flow-indepcndalwc bridge detector is highly suitable for use in gas chromatography. A logical extension of the field of appHcation is found in liquid chromatography.
Although the response of the detector is very similar for g~ses and liqUids. a change in the experimental configuration of the detector had to be made in order to obtain an acceptable value for the time constant 1"
when liquids are used. For this time constant eqn, 2.18 was derived
(4.30)
""hen water with a viscosity of (1.10 ;t 0.05)' 1O-~ Pa, s is used as a mobile pha~e olle obtains T as U value of 19 s. Since the standard deviation 0 of the concentration profile in liquid chromatography is about 5-10 s. it is evident that such a value for 1" is not acceptable.
In order to reduce this value, the membrane of the differentiallllallOmeter was replaced with a more rigid type. The value of (3 for thi> new membnwe was measured to be 1.7' 10-12 m3 IPa, leading to 1" = OA s. This change ill IlIembrane is accompanied by a change in the sensitivity SM of the manometer SM = 1.52' 10-3 VIPa.
There follows a bdef report on some of the preliminary experiments to indiCate the possible usc of the detector in liqLlid chromatography.
4.3.2 f::xperimentlll
for all experiments water as the mobile phase was used, and the water flow through the detector was controlled by hydrostatic pressure. The experimental configuration is schematically shown in Fig. 4.15.
The height II could be adjusted between 0.1· 1.3 m, leading to a !lowrate (<p,) 0[(4. 56)' 10-9 m3 /8 through the detector.
As solute ethanol was used with a p.a, grade (Merck, [)armstadt, C,I'.R). I'or the injection of small volumes of water·ethanol mixtures the injection system (I 0-9 m3) shown in Fig, 4.5<1 was applied. Due to mixing and diffll~ion effects an experimental vahle for the dilution of the injected mix-
51

lures of about 20() was ObWilll'd. Tilis lOlnpal"O~ f,.vourabiy with typi,,11
valtlc$ in iiqllid t~h r()matography. The relatiOT! bctw\~cn (he vis<;()~ity dlllcrcm·.c (rl,,) \)1" Wi.tcr alld waler
ctilarwi llliXlllrC~, and (he cOllccntralion (1'/1') of etiwl"1oi ill these mixtures is $l1owll il1 Fig. 4.1 (,. ThiS data was obtained frOill "xp\'rinlCl1t~ describr:d ill (:ililpter 3.2.
1.8
1.2
to
0.6
Q6
0.4
Ol
il) 60 Ul' 1'le% Xalh,flllOI
)·i~. 4.16 Plot of" ti,e vj,co,ity dille'fence TI" bet.ween waler ,llld wat<'f-ctiWI1"lrnix-ttlr~'-i :'}'i a i"LIIH.::tion of the. (':,0I1t.,;I,JIJtL'atio~1 ~)r ~tl1\ll1(Jl.
The slope of lhe line in Fig. 4.16 for low concentrations of ethanol equals flv = (3.4 :t O.I)-lO- s Pa.s/%. Since the density of pure ethanol equals p .. 0.79-lOl kg/m3 one can also apply H,.. ,,(4.3:t 0.1)' 1O-6 Pa.skg- l m3 .
From the same data an estimate of the maximum concentration, at which the slope of the line differs 3% from the vallie at concentration zero, is shown to be 4% (viI!).
The noise leYel (R,,) of the differential manometer was equal to 10-4 V. All the experiments were performed at a temperature of 291-7 ± 0-5 K_
For the discussion of the results let LIS LlSC the surfacc area () of the measured peak_
4. 3_ 3 Re~I~lt~ and di~cussiol1
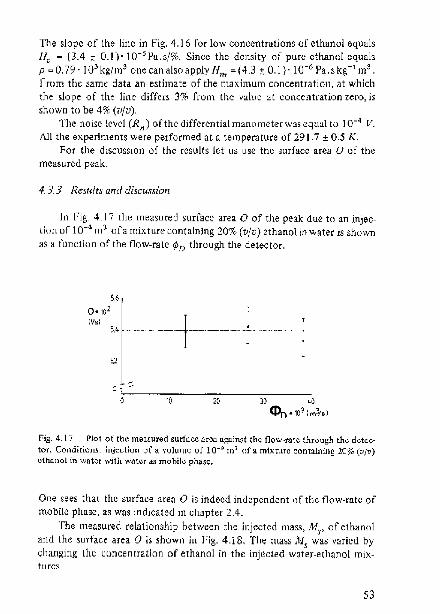
In hg. 4_17 the measured surface area 0 of the peak due to an injection of 10-4 m' ofamixtllre containing 20')(, (010) ethanol in water is shown as a fllnction of the flow-rate ¢f) through the detector.
;.6
~:,.' ~ --+-----1---- I
rig_ 4_17 PI"t of th" measured surface arCa against th~ now·ratc through the detec>tor. ConditiollS: inje~tion of a volume of 10-' m' of a mixture containing 20% (v/v) ethanol in wator with wat(:r a!i mobile phase.
One sees that the surface area 0 is indeed independent of the flow-rate of mobile phase, as was indicated in cilapter 2_4_
The measllred I'etationship between the injected mass, Ms' of ethanol and the surface area 0 is shown in Fig_ 4_18. The mass M, was varied by changing the concentration of ethanol in tht injected water-ethanol mixtures_
53

a,
o \v,)
02
0.1
Fig, .;1,18 Plot of lh'l.~ 1111,.~~LMlI'L.~d i\.\II·n1(~~ ~IRail'1~t the illj\:dt~tI Imts~ of dh~tl1ol. COlldi-tiot1~: watGr ll'-; mohik p hatH.': \ r.Pn :, 54.1 n -'J Ill ", /':1.
During these c.\pcrilll~llts t.he How-rale of w,ltcr through the detector wu:, 54' 10 ., Ill' ~-I _ The slop~ or tile lille ill Fig. 4.11) Cqll,lis
( dO) ; ---- '-(J.4:,:0.1)'10V~/kg. d /H\~, c,'xp
(~31 )
A,;cording t() cqn. 4.20 the theoretical vallie of this slope "Ill be calculated witll til~ followirlg cxprCS$il)n
( d () )
dM,. II,
(4.32)
SlIbsritlition or 111/1 '" (43 ± 0_1)' ]Q-~ P'l.skg- I 111
3, (~~ (4.76 1- 0.04)'
10'''''/ and 8M
~ 1.52' 10:l VjPa, Icad~ t()
( ii~) _(34±O.I)·]Qs Vs/kg- 1
dltt,. II.
and thus 11m; a i~ood <.:prl'ehirioll with the experimental value.
(4.33)
(·'ig. 4.19 ~h()w, tlie ilicaslll'ed rcspollSc upon tile in,iection or 7.9'
54

JO-~ kg of ethanol. This corresponds with the measurement at the lowest value of Ms in Fig. 4.18.
Fig. 4.19 Detector re~pon'<l upOn injection of 7.9· 10-' kg of ethanol. Condition" w~tCT a. mobile ph •. le, "'n = 54.10-' m' />.
As can he seen from Fig. 4.19 the peak is well above the noise level and a reduction of the peak height with one order of magnitude is possible. If one is also able to reduce the standard deviation of the peak by one order of magnitude, this would lead experimentally to a valLie of about 10-9 kg, as t.he 10west detectable maSS.
As was done with the application in ga, chromatography let us now also specify the five parameters which characterise the performancc ()f the detcctor in liquid chromatography. The sensitivity (S) of the detect0[ is gJven by eqn. 4.25, and the maximllm mass flow-rate (¥1m) is calculated with cqn. 4.27 by substitution of ¢D = 1O-~ m3 S-l ,xm ::: 4% and p = 0.79-10> kg.m- 3
: 'Pm = 3.2-1O- 7 kg.s- l• 'fhe time c()n,tant (r) is ex"
pre~sed by eqn. 4.30. In table 4.5 the values of the parameters for the present apparatus configuration are listed, and calculated for the situation where water is the mohile phase and ethanol is used as solute.
Table 4.5 Parameters eh.r.eteri~irlg the d~tcctor in its present configllraLioIl_ COn-dition: water as mobil~ phase and ethanol as solvtc,
Parameter
S 3.4· 10' Vol kg-'
Hn 10-' V
M" 1.1'10-" kg
'P" 8.8' 10- 10 kg S-I
'- 360 0.4
____ • __ . __ ._~ ___ .. _m.'"_'"~_~ __ .. ~~ ____ _
55
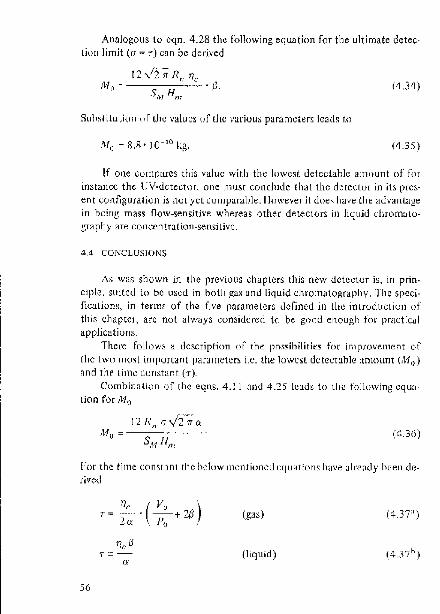
Analogous to cqrL 4_28 th~ following equ,ltion for the ultimate detection limit (C/ ~ r) can b(~ derived
12 v'iiT RII I),. M,) ,,-----~--.- '11_
SMH,."
SLlhstitution of the vahlcs ()f the various paramet.er~ leads t.o
(4.34)
(4.3.'»
If one cumpllrCS this value wit.11 t.he lowest. detectable llmOUIlt. of for
instance th~ lJV·dct.ector, one must conclude that tho detector in its present configuration is not yet cOlllparabk.llowever it. does have the advantage in being mass flow-sensitive whereas other detectors in Iiquiu chr()matography are concentration-sensitive.
4.4 CONCLUSIONS
;\~ W,lS shown ill the pfcvious chapters this !lew detector i>, in prin. ciple, suited to be lIsed in both gas and liquid chrOllliitography. The specificatiolls, in terms of the five pawneters dcllncd in the iIllro(\llClioIl of this chapter, arc not always considered to be good enOllgh for practical applications_
There follows a ucscriptio!l oC the possihilities for im provement of the two most important parameters i.c. the lowest uctectahle amoullt (M(») and the time constant (r)_
Combinntion of the ~qns. 4.11 and 4_25 lcad~ to the following equa" tion for Mo
(4.36)
For the time constant the below IlWrllioTled cquati()n~ have alre<ldy been derived
56
TI,,13 r=
Ci
(ga,) (4_37')
(liquid)
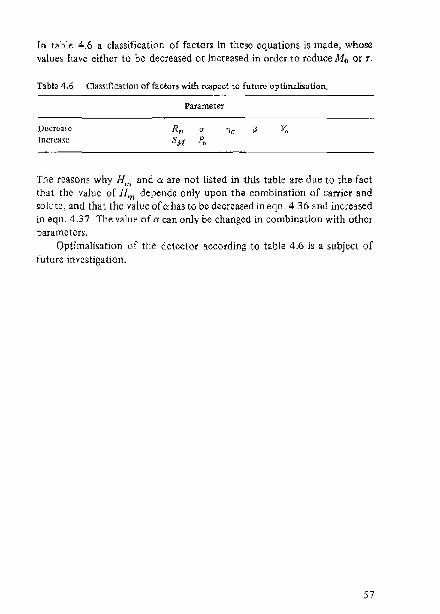
In table 4.6 a classification of factors in these oquations is ll1<lde, whose values have either to be decreased or increa.sed in order to reduce Mo or T.
Tablo 4.6 Classification of fll.ct<IT~ with rc~pect to future oplunali.aUon.
Dc.<.:n:.asc Incrml."e
Parameter
R" a SM p.
IJ v.
The reasons why H", and c< are not listed in this table are due to the fact that thc vahlc of JIm depends only upon the combination of carrier and solute, and that the value of 0: has to be decreased in eqn. 4.36 and increased in eqn. 4.37. The value of 0: can only be changed in combination with othor paraillct ers.
OptilllalisatioTl of the detector according to table 4.6 is a subject of future investigation.
57
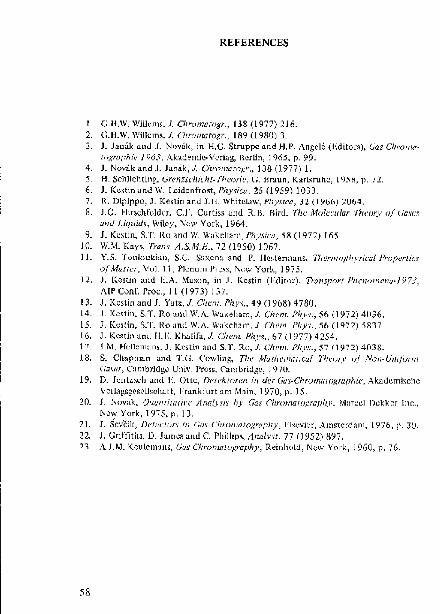
REFERENCES
1. G.H.W. WiilGJll~. 1. O'"OII"lIl[OlIr., 138 (1977) 216. 2. C.H.w. WiJlc"'s. J. {'''mmato!:}'., 189 (1980) 3. 3. J_ Jamik and J. Novak, in H.G. Struppc and 1-1.1'. Angcl6 (I';<litor~), lJas' 01/,011/(1-
tORl'apfi/(' J 963, Aki.ld~IIlh.~V\:r1.tlg, Bl.!rlin, 1965, p. ~? 4, J. Noviik and J. Janik • .I. (.'IlroIJWf()~r .. 138 (1977) 1. 5. H. S"hlichtil'2 .. (l1'('lIu,1u'<iIl-lfr""ri", C. Braun, Karhruhc, 195H, p. 71. 6. J. Ko,tin :lIld W. l.cidenfr"'t, 1'llysi(.'<I, 25 (1959) 1033. 7. [<. Dil'ippo, J. K",(ill ill1J 1.11. Whitelaw, PhY.I'ica, 32 (1966) ~064. R. .I.C!. Hir~ci1rddcr. c.!', CUl'tiss and R.Il. Bird, IiI" Moler.·u/ar n",ory oI (;0.1"<'.\'
"nd UquiU.l, Wiky, New York, 1964. 9_ .I. Ke,lin, S.T. 1(0 and W. Wakeham,Physica, 58 (1972) 165.
10. W.M. Kay, Tranl, A.S.M.H .. 72 (1950) 1067. 11. y.,s. '!'ouloukiall, S.C. S:lxcn.a ~nd P. IhJ ..... t~rIl)arH·;.~ n/t~nrlopl!.,v.\'ical Pro(N . .'rtlt.'.\"
of Maller, Vol. 11, Plenum l're.jl, New YOl'k, 1975. U. J. Kcslin .nd E.A. Mu""n, in .I. [(estin (Fdit"'), TranV'r>" I'h~n"'''<"'I'iI·197J,
A [I' Cont". rt'O~., 11 (1973) 137. 13. J. K('stin and J. Yala,1. ellul!. I'hy,,, 4':1 0 9611) 4780. 14 . .I. Ke,lil1. S.T. Ro "lid W.A. W"keliam, 1. CIl",n I'hy.,., 51'> (1 'n2) 40.:l6. 15. J. K~,lin, 5:r. Ro :'11(! W.A. W"k(')lam, J. 01<'111. PI/ys .• 56 (1972) 5837. 16. J. K('Stin ,lrld II. E. Khalifu, 1. (11<'111. Phy~ .. 67 (1977) 4254. '1'1. J.M. Hellc111(1I1S.J. Krs(j11 lind S.T. Ru,1. Ou:rI!.Phys.,57 (1912)4038. 18. S. Ch.plllun and T(;. (:uwlinl\, Til" MIlIl/ell'rllliCII! 1l1m,-y (J/ Non-UrlijlJrlII
(,'a,wlx, Cambrlc.lg0 UJ)iv. P1'0S~T Cal'nbridgl"~ 1970. 19. D. J~I1L~:;(,.'h and !',. Ott.c~ f),Jfj"Joktoren in rir!r Gas-ChrOnUl!o}!,.Tllphh', Ak~l(..lcmh;cl1c
V('ri<lgsgcsl,U,uhai'l, l'rankfurl a111 Main. 1970. P. ) S. 20. J. Novak:. Quanfila/rH.' At/(dy,~'i.'j hy (;(Z.~. ChrOIJUlWKraphYl Maret'] Dckkt:r Inc.,
NcwYork, InS,p. 13. 21. J. ScvcH(, J)dr.:cf()r~ ;n (;il.\" (Y!}"()lJ1ato}{t'aphy, FI,;,:(win, Amstcrdnlll:r 1976 1 p. JO. 22. J. GriJ"nths, D. Jam", and C Phillips, Allalyst, 77 (1952) 397. n. i\.J.M. Kv\I!cIll<\JlS. (f"s Cllrullwluwaphy, Reinll()ld, N(,w York, ]960, p. 76.
58

SUMMARY
During the development of chromatography, there has always been it need for simple universal and sensitive detectors, In thl~ thesis the development of an universal mass now-sensitive detector is described which can be used for both gas and liquid chromatography,
In chapter 2 the detection principle has been described together with an evaluation of the dctector response. The detection principle is based on the measurement of the viscosity difference between the carrier and the carrier-solute mixture, This measurement is performed with a now-impedance bridge detector, which is a real analogue of the well-known Wheatstone bridge. It is shown that the integral of the detector signal is propor· tional to the total mass of solute in the carrier. The value of this integral is dcterrnincd only by the sensitivity of the differential manometer, the dimensions of the capillaries constituting the bridge, and the change of the vLlcosity of solute-carrier mixtures with composition.
Since there is little published information available concerning the viscosity of mixtures, meaSUfements were conducted in order to determine thoso relationships for the mixtures used. For these measurements the described detector can also be applied as detailed in chapter 3. Using the detector in its present configuration, relative viscosity differences in the order of 1 O-~· - 10-6 can be detected. This chapter also describes how the values of wme physical parameters for gases Can be derived from visCOSity meaWreIlltnlS.
Chapter 4 deals with the application of the flow-impedance bridge de· tector in chromatography. FOr gas Chromatographic applications the detector characteristics are comparable with those of the thermal conductivity detector, although lhe latter is concentration-sensitive, The lowest detectable mass of oxygen for instance is determined to be about 3· 10-11 kg with hydrogen as the carrier gas. The lowest detectable amount for liquids, where water and ethanol were used as the mobile phase and solute respectively, equal~ 10-8 kg. 8eside~ also some indicatiqns are given concerning the possibilities for future optirnalisation of the detector.
59
SAMENY ATTING
Gcdurcmlc de ontwikkeling van (Ie chromatografk is cr steeds bellOefte gewecst aan eenv()lldige, ll[livcrsclc ell gevoclige detectorcn, In elit prod:
schrift wordt de oJlt.wikke1)ng beschroven Van cen universcle massast.roomgcvociige detector, die onder andere gebruikt kan worden in gas- en vJocist.ofchromalografic.
In hoofdswk 2 wordt. het detectieprincipo beschroycn en wordt. cen afleiding gcgeven van de detector rc£pons. He! detectieprincipe is gcbaseerd op het melon van het ver~chj] in viscositcit Van de dragcr Cll van rneng
sels, bestaande uit draget en monster. Dc.:e llletingen worden uitgevoerd l1Iet bchulp Van cen slromingswcerSi:ll1cisbnlgdelCctor, welh' cen analogon
is Van de hekende brug van Wheatstone. Er wordt. JangetOOl1d dat de integraal van het detector signaal evcnredig is met de rnassa van het monster in de drager', De waar<..lc van dexc int.egraaJ wordt aileen bcpaal<..l door <..Ie gevoeligheid van cle vt'rschildrukopnemel', de ai'metingcn van de capillaircn, die SarlWn de hfLIg v(},men, en hel vcrband tussen de viscositeit en de salIIcnstclling vnn ll1engscls bcstaarldc uit dr<lger en monste\'.
Oll1dal cr wcinig gepublkeerde gegcvcns zijn ovcr de viscosit.eit.en van IIIcngsels, zijn er mctingclI uitgevoerd ten einde doze relatics te hcpalcn.
V()or dit SO(xt melingcn kan de dctcct()l' ook worden toegcpast, zoaJs bcschrcycll wordt in hoofdstuk 3, Met behlilp van de det.ector in zijn huidige staat kunncn relative viseo~iteitsvel'schil!en Vall 10"~ I 0-6 worden gede
ICdeerd. In dit hoofdstuk wurdt ook hesehreven hoe de waarden Van CllkcJc physische pMallletcrs 7,o\ldcn kUrlncn worden Bfgeleid Ilit nauwkeu
rige llletingcn Van de viseositeiL In hoofdstuk 4 wordt de toe passing van de strol1lingsweer~tand~brllg
detector in de chwmatografit bchandcld. Bij toep~ssit1g in de gaschl'omawgrafie 7.ijll de cietcctorspecifkaties vergolijkbaar mct Llie van de warmte· gdeidbaarheidscel, hoewel deze Jaa/ste een concentratie·gevoel ige detector is. De kkinste hocveclhcid Zlilirstof die met do nic\twe deteclor kan wor· dl'n aangetoond, met waret'stof als draaggas, is 3.10- 11 kg. VOOI' vloeistoffen Jigt de dctcctiegrens van ethanol, met water ats rnobiclc lase, op I o-a kg, In dit hoofdstuk wordcll ook cnkcJc suggcsties gedaan vom de optimalisa· tie vall do dcte([oL
DANKBETUIGlNG
Aan het onderzoek beschreven in dil proefschrift is door velen bijge.
dragcn. Door het vervaardigen van enkele essentiett ondcrdelen, hebben de
leden van de wcrkplaats van de afdeling der Technische Natuurkunde een belangrijke bijdrage geleverd aan de realisatie van de detector.
Yoor hun cnthousiaste medewerking dank ik de stageairs 1. Boswijk, F. v.d. Vosse, H. Keulen en L. Brounts.
Or. if. l.A. Rijks en Dhr. H.A. Claessens van de vakgrocp lnstrumen· tcle Analyse van de afdding Scheik\lfidige Technologle ben ik erkentelijk voor hlln adviezen.
Y crder bell ik dank verschuldigd aan de leden en de studentclI Vall de vakgroep Analyse van Fysische Meetmethoden voor de stimulerende dist\lssies.
Yoorts dank ik DilL R. Jacobi V()(lf zijn typografische adviezen, Dhr. S.J .li. Crick voor he! corrigeren van de Engclse tekst, en UhI. P.G, RJetstra your Je vcrzurging van de figuren,
De direclie van de Cooperatieve Condensfahrick 'Friesland' w.a. wil ik bedunkcn Vllur het schepp en van de mogelijkheid om dit proef8chdft naast de dagelijksc werkzaamheden te voltooien.
61
CURRICULUM VITAE
Op aanbcvcling van het College van [)okarlOrl voIgt ollderstaand een kortc heschrijving van do lovonsloop van de 3UtO\ll. ]-jij werd op 9 november 1952 geborcll Ie Venlo. Na het behalen van het diploma II.B.S. ···13 aan de Ri.iksscholengel1lccll~chap Ie Venlo bogon hij in september 1970 met de swdle Technisch N,n.uurkunde aan de Technischc lIogc~dwol to Eindhoven. 110t ingonioursoxamen werd in juni 1976 behaald.
Van 1 aLlgLlstLl~ 1976 tot I allgllstu~ 1980 was de auleul' als wetenschap
pelijk ambtenaar in dienst van de Technische lI()g~sdl()()l Eindhoven. III deL.e pcriode werd in de vakgrucp Analyse van Fysische Meetmethoden van de afdcling Tcchnische Nal\Iurhlllde en in S3mcnwcrking met de vilkgrocp InstrLlrnentelc Analyse vall de afdcling Schcikundigc Te~hnologie het onclcrzock verricht clat 101 dit proefschl'ift heeft geleld.
Vanaf 1 augustus 1980 is hij <lIs research meuewcrker werkZaaill bij de
Coi,\peratieve Condcmfabrick 'rricsland' w.a. Ie Leeuwarden.
62
STELLINGEN
1. De door Annino en mcdcwerkers gebtuiktc afleiding van de gcvoeligheid Van de door hen ontwikkelde detector is onjuist.
R. Annino, J. Curren, R. Kalinowiski, E. Karas, R. Lindquist and R. Prescott, J- Chromatogr .. 126 (1976) 301.
2. Dc waarden Van de viscositciten van gas~cn, bepaald door Kestin en medewerkers met een rotaticviscosimeter, zouden beter toepasbaar zijn indien deze resultaten werden weergegeven in rdatic tot de viscositeiten van de ijkgassen.
J. Kestin and W. Leidenfr(lst, Physica, 25 (1959) 1033,
3. De resultaten van metingen va~ onder andere So en Shields aan de verlieshoek van kwartsglas, 7.etten de theoretische benadering van deze verlieshoek, zoils die gegeven wordt door v. Danid, op losse schroevcn.
E. So and J.Q. Shlelds, IEEE Trans. Instrum. Meas., vol. IM-28 (1979) 279. V. v. Daniel, Dielectric Relaxation, Academic Press, New York, 1967, p. 188.
4. Dc door Jentzseh en Otte gebruikte fnrmuie, die d(: invioed van de tijdconstantc van de detector op de vqrm van de gc· rc~ .. -jstreerde chromatografische pick besehrijft, is fundamenteel onjuist.
D. Jcntzsch, E. Otte, Detelztoren in der Gas-Chromatographi(', Akadcrnische Veriagsgesellschaft, Frankfurt am Main, 1970, p, 22.

G. In de praktijk vc:rdicnt de statischc capacit.(:itsmetbodr voof het meh:n van oppC"rvlaktc potenti;l1en Van n1onolagen dooy· gaans de voorh:ur boven de zogcnaamde "ionizin:.;.gap"methode.
J.L.M. Venselaar, A.J. Kruger, L.M.H. Vnbakel and J.A. l'olllis,j. Colloid Interface Sci., 70 (1979) 149.
6. Dc rappoftagc V<1n Bamett cn medcwcrkers, over de hepalinS van vitamincll in zuivdpcoduktcn, Z()U aan waardc winnen indi(:n cen vcrkhning zou Wordell gcgeven vooy de a;lIl
wc:lighcid van vitaminc A-palrnitaat.
S.A. Barnett, l..W. Frick and ILM. Bain(;, /Inal. Chl'J1L, :;2 (1980)610_
7. Btl1mmclhuis gceft een bcschrijving van de invlocd van de proce~OImtandigheden tijdens v(:Yst.uiving op de eigenschap· pen van instant vollemdkpoedcr. IIij gcbruikt hierbij tcn onrechLC de temperatuur van de llittredcnde Lucht van de droger als proccsparamch:r.
l.A.]. Brummclhuis, Milchwissr,·n.lcha!t, 30 (197!:i) 75.
8. G(;L:icn de vele on;r.ekerheden bij de cxpcrimenten van I·lung en Dinius bdrelTende de diilusie van l:uurstof in ckctrollet oplossingcn, is het nut van hun tOclsing van ek theorie van Podolsky aan de I11cetrcsultaLen twijfd'lChtig.
G.W. Hung ,\nd R.H. Dinius,1- Chern. Fn,>:_ Duta, 17 (l972) 449_ R.J. Podolsky,.f. Amer. Chem. Soc., 1 (1%8) 41-42.

9. IIet gelchrormltografisch patroon van uremisch sell..lm wIndt ten onrechte aangevoerd to onderstellning van de "middle-molecule" hypothese.
P. FiiI·~t, L Zimrn(:rman and J. Bergstrijrn, Kidney Int .. 1(1975) 272. P. Flirst, J. Zimmerman ar\d J. Bergsttum, Clin. NephroL. !i (1976) 178.
10. Het planten van bom(:n op f(duidswallen k<~n het cHed van deze wallen aanzienlijk verlagen.
Rapport. l'hysica Winkel Eindhoven.
II. Gezicn de reccnh: ontwikkdingcn Z()u de zin: "lIet bezil van een cigcn huis moet namdijk vont e(;n promDvendus als e(;n normak zaak worden beschouwd." geschrapt moeten worden uit de l10nnen voor promotie-toeiagen 1980-1981 van hct Ministetie van Onderwijs en Wetenschap" pen.
Drachten, 14 april 1981 G.H.W. Willems


![Fast, Simple, Novel and Economical Method for Ultra Trace ...chemiluminescence detection, [13] gas chromatography-mass spectrometry detector, [14] liquid chromatography-atmospheric](https://static.fdocuments.in/doc/165x107/5fd894530df2d70a381cf0a0/fast-simple-novel-and-economical-method-for-ultra-trace-chemiluminescence.jpg)