Development of a Design Manual for Agricultural …...Development of a Design Manual for...
149
Development of a Design Manual for Agricultural Pesticide Handling and Washdown Areas R&D Project Record P2-200/PR S. Rose, B. Basford and A. Carter Research Contractors: ADAS Consulting Ltd
Transcript of Development of a Design Manual for Agricultural …...Development of a Design Manual for...

Development of a Design Manual for Agricultural Pesticide Handling and Washdown Areas R&D Project Record P2-200/PR S. Rose, B. Basford and A. Carter Research Contractors: ADAS Consulting Ltd

R&D TECHNICAL REPORT P2-200/PR
Publishing Organisation Environment Agency, Rio House, Waterside Drive, Aztec West, Almondsbury, BRISTOL, BS32 4UD Tel: 01454 624400 Fax: 01454 624409 Website:www.environment-agency.gov.uk Environment Agency 2004 ISBN 1-84432-246-7 This report is the result of work jointly funded by the Environment Agency, Scotland and Northern Ireland Forum for Environmental Research (SNIFFER), Department for Environment, Food and Rural Affairs (Defra) and the Pesticides Safety Directorate (PSD). All rights reserved. No part of this document may be reproduced, stored in a retrieval system or transmitted, in any form or by any means, electronic mechanical, photocopying, recording or otherwise without the prior permission of the Environment Agency. The views expressed in this report are not necessarily those of the Environment Agency, SNIFFER, Defra (formerly MAFF), PSD, CPA, NFU or Bayer CropScience (formerly Aventis CropScience). Its officers, servants or agents accept no liability for any loss or damage arising from the interpretation or use of the information, or reliance upon views contained herein. Dissemination Status: Internal: Released to Regions External: Publicly Available Statement of Use: This report will ensure that Agency staff, external organisations and farmers are better informed about the potential point source pollution risk of pesticide handling and washdown areas and the options for their design, including the use of biobeds. The report provides underpinning information for Policy and Process staff involved in developing water quality, land quality and pesticides policies and guidance. Operational staff will benefit from an improved understanding of the issues of pesticide handling/washdown, the risks to surface and groundwater and the ways that farmers can improve their practice. Due to scientific and regulatory uncertainties this project has not produced a design manual for pesticide handling/washdown areas. Design concepts are provided in this Project Record and it is anticipated that the pesticide industry will utilise this information to produce guidance for farmers in the future. Keywords: Point source pollution, pesticides, pesticide handling and washdown areas, bioremediation systems, biobeds. Research Contractor: Steve Rose, Bill Basford & Andrée Carter, ADAS Consulting Ltd Contact: Andrée Carter, ADAS, Gleadthorpe, Meden Vale, Mansfield, Notts. NG20 9PF. Tel: 01623 844331 Fax: 01623 847424 Email: [email protected] Environment Agency’s Project Manager: The Environment Agency’s Project Managers for R & D Project P2-200 were: Alan Barnden and Alison Frogley, Kingfisher House, Goldhay Way, Orton Goldhay, Peterborough, PE2 5ZR SNIFFER’s Project Manager: SNIFFER’s Project Manager for R&D Project SR(02)34 was: Rob Morris, SEPA Corporate Office, Erskine Court, Stirling, FK9 4TR
Further copies of this report can be obtained from the Environment Agency’s National Customer Contact Centre by emailing [email protected] or by telephoning 08708 506506.

R&D PROJECT RECORD P2-200/PR
i
ACKNOWLEDGEMENTS This report was commissioned by the Environment Agency (EA) in collaboration with the Scotland and Northern Ireland Forum for Environmental Research (SNIFFER, representing Scottish Environment Protection Agency, SEPA and Environment and Heritage Service in Northern Ireland, EHSNI), the Department for Environment, Food and Rural Affairs (Defra) and the Pesticides Safety Directorate (PSD). Their technical and financial contribution to the project is appreciated. The technical and financial support from the Crop Protection Association (CPA) and the input of representatives from Bayer CropScience (formally Aventis), National Farmers Union (NFU) and the Voluntary Initiative on the project steering group is also acknowledged. The contractors would like to thank Horticulture Research International (HRI), Wellesbourne, for permission to work on their land in Stage 2; to the farm owner in Lincolnshire for permission to work on his land in Stage 4 and to all the farm staff who gave assistance throughout the construction and monitoring periods. The help given by all ADAS staff to maintain and service the sites is greatly appreciated. Thanks also to the contract laboratory for undertaking the analysis of all the water samples, to Allan Walker (HRI, Wellesbourne) for his useful comments on the pesticide results, and to Ian Foster (University of Coventry) for his contribution to the Stage 2 report. Particular acknowledgement is given to Paul Mason (Coventry University, now ADAS) for his significant contributions to Stages 2 and 4.

R&D PROJECT RECORD P2-200/PR
ii
EXECUTIVE SUMMARY Groundwater and surface water can be at risk of contamination from agricultural pesticides. In some cases this contamination is more likely to result from point sources than as a result of pesticide application to crops in the field. Such point sources could include areas on farms where pesticides are handled, filled into sprayers or where sprayers are washed down. As part of their pollution prevention activities, the Environment Agency for England and Wales, Scottish Environment Protection Agency (SEPA) and Environment and Heritage Service in Northern Ireland (EHSNI), (referred to jointly as the Agency or Agencies) and the Department for Environment, Food and Rural Affairs (Defra), seek to reduce the risk of pesticide pollution from point sources. The Agencies and Defra identified that there was a need to develop a design manual for agricultural pesticide handling and washdown areas and commissioned ADAS Ltd., with support from Horticulture Research International (Wellesbourne) and Coventry University to deliver this project. The primary objective of this project was to develop practical and low-cost design criteria for pesticide handling and washdown areas in order to reduce pesticide pollution from point sources, based on an improved understanding of the risk from waste pesticides arising from agricultural activities. The project was divided into five distinct stages: 1) Desk study review; 2) Experimental surface studies; 3) Full-scale design development; 4) Full-scale design trial; and 5) Design manual production. Stage 1 There is a range of relevant EU and national legislation, codes of practice and advisory information currently available to farm managers and pesticide users concerning pesticide handling, and disposal of associated washings and other materials. The variety of requirements, information and advice provided was found to be confusing and is difficult to assimilate given the different and sometimes conflicting statements. There are a number of anomalies, and impractical or expensive solutions for which there is no guarantee of acceptance by the regulatory agencies. There is an urgent need for a generic stewardship approach, targeted to the individual user, which identifies what improvements can be implemented now, in specific situations, and which has the support of all stakeholders. The current Voluntary Initiative (VI) for pesticide users is providing a lead in addressing this issue. Surveys of typical farm practice concerning the use of pesticides identified that current farmyard characteristics and practice vary. Many spray operators are not aware of the environmental problems which might arise when pesticide is spilt or incorrectly disposed of in a farmyard, nor the potential consequences of washing down spray equipment. Spillages, overflows and yard washing are identified as typical sources of contamination in all of the studies. The potential for point source contamination is large

R&D PROJECT RECORD P2-200/PR
iii
and a number of responses suggested that there are common issues which are relevant to point sources of contamination, namely: • there is restricted awareness of the environmental impact of point source losses and
the need for individuals to address the problem; • yard spray activities are mainly carried out on impermeable surfaces which are
usually drained to a sump which drains to surface water or a soakaway; • few farmers have a spill contingency plan; • few farmers have contracts with licensed disposal contractors; • a number cite tank overfilling as a common source of spillage; • many farmers washdown their spray vehicles in the farmyard; • there is no clear advice for disposal of containers and packaging or spill clean up
material; and • concern that advice changes and is not proven, implementation may be expensive
and there is no current justification or benefit to comply. Reviews of monitoring projects in the UK and other countries identified that point sources of pesticides can be responsible for a significant portion of the total amount of pesticide loading in water and can account for the peak concentrations detected. The ranges reported vary from at least 20% of the total load in a catchment but could be as high as 70%, depending on catchment characteristics. The farmyard characteristics, operating practices and local conditions vary but all researchers report similar reasons for the origin of the point source contamination. A range of solutions and initiatives have been developed, or research is still taking place, to minimise point source pollution or treat waste which arises from the spraying operations. The systems investigated, such as the Sentinel and biobeds, have been shown to significantly reduce pesticide concentrations but there does not appear to be clear advice on what is considered to be acceptable with regard to the concentrations of pesticide which can be discharged from these systems to the environment. The various relevant water or registration directives do not specify a de minimis and in the absence of data to prove no impact, the Drinking Water standard of 0.1µg/l is applied as a surrogate. None of the systems discussed can currently provide evidence for compliance and there is therefore concern from pesticide users that investment to reduce point source concentrations may still not be sufficient to obtain Agency approval. Some of the technologies which have been developed elsewhere e.g. sustainable urban drainage, porous pavements, addition of pesticide waste to slurry may have the potential to be applicable to the farmyard situation. The concept of on-farm integrated waste management is attractive and would appeal to farmers who face a multitude of requirements concerning the different wastes which are generated. There is a need for clear, pragmatic advice to users concerning the handling and disposal of pesticides and the associated wastes. There is no doubt that point source contamination of surface or ground waters can be important and any measures to reduce losses could make a significant difference. Awareness of the importance of point sources and training in good practice are clearly a priority area, which form a fundamental part of the VI. Immediate interim improvements to current yard practice could be made:

R&D PROJECT RECORD P2-200/PR
iv
• only tank mix in an area where spills are contained such that they cannot enter a water course or groundwater;
• wash down spray equipment in the field; • apply internal tank washings to the treated crop in accordance with label
recommendations; • be prepared for accidental spillages and the actions required to prevent pollution; • take care not to create minor spills through glugging or dropping of seals; • rinse empty containers thoroughly, adding rinsate to the tank mix and store upright; • incinerate containers and packaging as soon as possible after use (legal position
being reviewed); • sweep the yard if contaminated mud is deposited and return to the treated field; and • store the sprayer under cover. Stage 2 Experimental work was undertaken at Horticulture Research International (HRI), Wellesbourne, to ascertain pesticide losses in runoff and throughflow from eight different surfaces subjected to simulated pesticide point source pollution arising from farmyard pesticide handling and washdown activities. The surfaces investigated were concrete, asphalt, hardcore, porous paving, soil/grass, biobed, biobed with a carbonaceous additive (replacing peat substitute component) and hardcore with a carbonaceous additive. Six pesticides, representing a range of physico-chemical properties and timing of application (spring or autumn), were utilised in the experimental work. Both representative “contamination” events based on the findings from the Cherwell Project, and worst-case “contamination” events from farmyards were investigated. All the surfaces provided a significant improvement on the pesticide losses measured from the concrete surface, which is still in widespread usage on many farms. The traditional biobed surface gave the best overall performance during these experiments, followed closely by the soil/grass surface, in terms of pesticide storage and in situ degradation. Both the biobed and the soil/grass surfaces reduced the total pesticide loss generally by a factor of over 100 when compared to the concrete surface. Pesticide losses from these two surfaces were very low even with the worst case scenario of very high pesticide contamination during the third application, with the soil/grass area providing a 97% reduction when compared to concrete and the biobed providing >99% reduction. The provision of enhanced environmental conditions for pesticide retention and/or degradation processes (especially microbial degradation) in these two surfaces was considered the primary reason for these major differences. Porous paving and concrete produced the highest losses of the pesticides. The addition of the carbonaceous material to the biobed and hardcore surfaces did not significantly change their level of performance. Stage 3 The results from Stage 2 of the project indicated that the use of a bioremediation system, such as a biobed or a biologically active loamy soil area, could provide a

R&D PROJECT RECORD P2-200/PR
v
significant improvement to the currently widely used concrete pesticide handling and washdown area, in terms of point source pesticide pollution. The design and cost of three different pesticide handling and washdown areas were developed, namely: i) a concrete intercept area feeding a biobed, ii) a drive-over biobed, and iii) a concrete intercept area to soil/grass. Previous work had shown that water management control in these bioremediation systems was fundamental to their pesticide removal effectiveness. The design work therefore considered ways to reduce the amount of unnecessary “clean” water (such as direct rainfall input or runoff from other parts of the farmyard). Roofing was dismissed as being too expensive, but limiting the area on which the sprayer was parked during pesticide handling and washdown operations was considered a far more cost-effective solution. Surveys of modern spraying equipment used on farms in the UK indicated that a confined 7m x 5m area was more than adequate to park the spray equipment and allow the operator room to safely work around it. The drive-over biobed option required the installation of a metal grid capable of taking the weight of a fully loaded sprayer, which had a significant impact on the overall cost of this option. Stage 4 The three full-scale designs developed in Stage 3 were all built on a large farming enterprise in Lincolnshire which ran spraying operations from three farms which could be modified for experimental purposes. Due to the research objectives of measuring the concentrations in the water leaching through these bioremediation systems it was necessary to fully enclose the biomix/soil inside a butyl liner, whilst retaining free drainage. The water discharged from these treatment systems was disposed to nearby land under a Groundwater Regulations Authorisation. During 2002 the three bioremediation systems were subjected to two artificial applications of a suite of test pesticides (as used in Stage 2), which had a range of physico-chemical properties. Four pesticide mixtures, with appropriate concentrations and volumes, were applied to each site to represent potential contamination sources, namely – dropped foil seals, leaky hoses/nozzles, sump rinsate and sprayer washdown liquid. The amount of pesticide actives applied was calculated to represent the maximum potential contamination from 16 individual tank mixes on one spray day, which was a very severe test of these treatment systems. Normal spraying operations under good agricultural practice were also undertaken on the three sites by the farm staff, therefore testing their functionality. Individual pesticide concentrations in excess of 100,000µg/l were applied to all the treatment systems. All the treatment systems were able to successfully retain and/or degrade the test pesticides throughout the monitoring period. 87% of the analytical determinations from the leachate samples from all three bioremediation systems had a pesticide concentration of less than 0.5µg/l. There were some pesticide detections above 0.5µg/l but these should be viewed in the context of the very high input concentrations and the considerable opportunities for further dilution, retention and degradation that exist in the soil within the disposal area. The extremely good performance of these systems to retain and/or degrade pesticides, even following some very severe artificial pesticide loadings, suggests that they would

R&D PROJECT RECORD P2-200/PR
vi
work very effectively with more typical contamination levels that would be expected with normal pesticide usage in farmyards. Further work is, however, still needed to investigate the longer term operation, management and performance of these bioremediation systems, but the results to date are very encouraging. Also, the disposal of the spent biomix or soil, when its pesticide degradation and/or retention potential has declined significantly requires consideration. Stage 5 All the information and data collected and obtained during each stage of this project were considered in preparing a document for the design of agricultural pesticide handling and washdown areas. However there are a number of scientific and regulatory uncertainties that are beyond the scope of this project and which are of sufficient importance to preclude the production of a design manual as an output from this project. The scientific issues are concerned with the residual risks to groundwater posed by bioremediation systems and to their long-term management and performance. The regulatory issues relate to new regulations including Agricultural Waste, Hazardous Waste and on Landfill that are likely to impact on the disposal of pesticide washings. These new legal provisions could have significant impacts on the costs associated with bioremediation systems and on how they may be controlled. The collated findings from the project on the design concepts for pesticide handling and washdown areas have been produced as an Appendix to this Project Record. Despite the scientific and regulatory uncertainties, the Agencies recognise the potential of biobeds to reduce pesticide pollution of surface waters from pesticide handling areas. The Agencies will not be actively promoting the uptake of bioremediation systems on-farm but where there is a commitment to improve pesticide handling practices then proposals for biobeds will be considered on a case-by-case basis. The Agencies have produced interim guidance in order to advise their staff on the position regarding the use of biobeds on-farm. It is anticipated that the results of this project and the design concepts, whilst recognising the scientific and regulatory uncertainties, will be taken forward by the crop protection industry via the Voluntary Initiative. This project has provided good evidence that redesigned agricultural pesticide handling and washdown areas, linked to bioremediation systems, can minimise point source pollution of surface waters. Interception and bioremediation of spillages and contaminated water would also minimise the risk of infiltration and discharge to groundwaters compared to existing practices where no systems are in place.

R&D PROJECT RECORD P2-200/PR
vii
CONTENTS ACKNOWLEDGEMENTS i
EXECUTIVE SUMMARY ii
LIST OF TABLES ix
LIST OF FIGURES ix INTRODUCTION 1 1. STAGE 1 - DESK STUDY REVIEW 3
1.1 Background 3 1.2 Introduction 3 1.3 UK and EU Statutory and Non Statutory Requirements 5 1.4 Review of Current Handling and Washdown Practices 11 1.5 Review of Monitoring and Investigations to Identify Point Source
Contamination and Factors Influencing its Occurrence 18 1.6 Review of Methods to Minimise Contamination 20 1.7 Transferable Technology 24 1.8 Conclusions 25 1.9 Recommendations 27
2. STAGE 2 - EXPERIMENTAL SURFACE STUDIES 30
2.1 Introduction 30 2.2 Test Facility and HRI Wellesbourne 30 2.3 Experimental Methodology 34 2.4 Results 35 2.5 Discussion and Conclusions 38 2.6 Recommendations 39
3. STAGE 3 - SPECIFICATION FOR FULL-SCALE FACILITIES 40
3.1 Background 40 3.2 Selected Surfaces 40 3.3 Size of Area Required 40 3.4 Type of Area 41 3.5 Roof Cover 41 3.6 Intercept Systems Proposed 42 3.7 Experimental Scale Up 43
4. STAGE 4 - FULL-SCALE DESIGN TRIALS 45
4.1 Background 45 4.2 Site Construction & Instrumentation 45 4.3 Artificial Applications 53 4.4 Normal Farm Applications & Washdown 56

R&D PROJECT RECORD P2-200/PR
viii
4.5 Laboratory Analysis 57 4.6 Results 59 4.7 Discussion and Conclusions 72 4.8 Recommendations 73
5. STAGE 5 - DEVELOPMENT OF A DESIGN MANUAL 74 6. PROJECT CONCLUSIONS 76 7. PROJECT RECOMMENDATIONS 78 REFERENCES 79
APPENDICES: APPENDIX 1: Design Concepts for Agricultural Pesticide Handling and Washdown Areas 84
APPENDIX 2.1: Stage 2 - First application data 106
APPENDIX 2.2: Stage 2 - Second application data 107
APPENDIX 2.3: Stage 2 - Third application data 109
APPENDIX 3.1: Sprayer measurements 111
APPENDIX 3.2: Typical sprayer dimensions 112
APPENDIX 3.3: Trellis dome polytunnel layout 113
APPENDIX 3.4: Hesston bale-polytunnel layout 114
APPENDIX 3.5: Biobed layout 115
APPENDIX 3.6: Site visit – proposed full-scale sites, Lincs, 4 April 2001 116
APPENDIX 3.7: Specification of works to Reasby Hall (concrete intercept to biobed) 119
APPENDIX 3.8: Specification of works to Friesthorpe Farm (drive-over biobed) 122
APPENDIX 3.9: Specification of works to Southern Grange (concrete intercept area to soil/grass system) 124
APPENDIX 4.1: Stage 4 - Concrete intercept to biobed site. Pesticide concentration data (µg/l) from concrete runoff samples and biobed leachate samples 127
APPENDIX 4.2: Stage 4 - Drive-over biobed site. Pesticide concentration data from biobed leachate samples 132
APPENDIX 4.3: Stage 4 - Concrete intercept to soil/grass area. Pesticide concentration data from concrete runoff samples and biobed leachate samples 134

R&D PROJECT RECORD P2-200/PR
ix
LIST OF TABLES Table 1.1: Sources of water contamination by pesticides 5 Table 1.2: NPTC units of competence 6 Table 1.3: Active substances and their physico-chemical properties 28 Table 2.1: Active substances and their physico-chemical properties 34 Table 2.2: Pesticide residues remaining on hard surface layers 37 Table 2.3: Pesticide residues remaining in surface cores 37 Table 4.1: Test pesticides and their physico-chemical properties 54 Table 4.2: Pesticide application volumes and concentration ranges in the test
mixtures 55 Table 4.3: Total amount of pesticide applied in all four test mixtures on one
application day 55 Table 4.4: Test pesticides used on farm sites following normal agronomic advice,
in addition to the artificial applications 57 Table 4.5: Analytical recovery efficiencies 58 Table 4.6: Limits of quantification 58 Table 4.7: Rainfall recorded at concrete intercept to biobed site 59 Table 4.8: First application – weekly rainfall, runoff (concrete) and throughflow
(biobed/soil area) 61 Table 4.9: Second application – weekly rainfall, runoff (concrete) and throughflow
(biobed/soil areas) 62 Table 4.10: Summary of maximum pesticide concentrations (µg/l) detected in runoff and leachate samples following artificial applications 63 Table 4.11: Concrete intercept to biobed – pesticide concentrations in runoff from concrete and leachate through biobed 64 Table 4.12: Drive-over biobed – pesticide concentrations in leachate through biobed 66 Table 4.13: Concrete intercept to soil/grass area – pesticide concentrations in runoff from concrete and leachate through soil/grass area 67 LIST OF FIGURES Figure 2.1: Experimental test surface tanks 31 Figure 2.2: Schematic of experimental tank design 32 Figure 2.3: First application – test surface performance 35 Figure 2.4: Second application – test surface performance 36 Figure 2.5: Third application – test surface performance 36 Figure 4.1: Schematic of concrete intercept to biobed 47 Figure 4.2: Schematic of drive-over biobed 48 Figure 4.3: Schematic of concrete intercept to soil/grass area 49 Figure 4.4: Concrete intercept to biobed 50 Figure 4.5: Drive-over biobed 50 Figure 4.6: Concrete intercept to soil/grass area 51 Figure 4.7: Application of sump rinsate mixture to concrete intercept 55 Figure 4.8: Application of washdown liquid mixture to concrete intercept using
hand sprayer 56

R&D PROJECT RECORD P2-200/PR 1
INTRODUCTION Water resources can be adversely impacted by pesticides that originate from diffuse or point sources in the agricultural environment. Diffuse sources relate to the movement of pesticides from the field of application to water resources through mechanisms such as spray drift, runoff, leaching and drainflow. There are numerous environmental conditions that influence each of the transport mechanisms that may take place in any one field and at any one time following a pesticide application to a target crop. Point sources include any contamination derived from activities involved in the handling of pesticides, spray equipment filling, washing spray equipment and pesticide waste disposal operations, all of which tend to take place in the farmyard. The Environment Agency (EA), Scotland and Northern Ireland Forum for Environmental Research (SNIFFER) and the Department for Environment, Food and Rural Affairs (Defra) commissioned a research project to investigate point source pesticide pollution originating from the farmyard. The primary objective of this project was to develop practical and low-cost design criteria for pesticide handling and washdown areas in order to reduce pesticide pollution from point sources, based on an improved understanding of the risk from waste pesticides arising from agricultural activities. The project was divided into five distinct stages: Stage 1. Initial desk studies – a review of the current practices and procedures of farmers in the UK, Europe, and other countries in handling pesticides, washing down equipment and subsequent handling of waste pesticide arising. This included the identification and review of existing legislation and guidance. Stage 2. Experimental surface studies – investigations were carried out on the fate of six pesticides (isoproturon, dimethoate, chlorothalonil, chlorpyrifos, pendimethalin and epoxiconazole), with a range of physico-chemical properties, following activities on different surfaces, including concrete, hard-core and a field surface. This identified the most suitable surfaces and provided a baseline against which the constructed design could be compared. Stage 3. Full-scale design development – the results from the desk studies and on-farm assessments were used to develop designs for three full-scale pesticide handling and washdown area, linked to bioremediation systems. Two of these were based on a concrete handling area, as this is the most commonly found surface in the farmyard. The designs took into account: pesticide disposal, cost effectiveness, practicality and health and safety. Stage 4. Full-scale design trial - once the three full-scale designs were developed, each was constructed and investigations took place into their operation, management and pesticide reduction performance. Stage 5. Design manual and report production - due to scientific and regulatory uncertainties a design manual for agricultural pesticide handling and washdown areas was not produced. Lessons learned throughout the project with respect to the design,

R&D PROJECT RECORD P2-200/PR 2
construction, operation and management of these areas, linked to bioremediation systems, have been included as design concepts in an Appendix in this report. A stage report was written at the end of each stage of the project that was then used by the Project Steering Group to inform decisions about each subsequent stage.

R&D PROJECT RECORD P2-200/PR 3
1. STAGE 1 - DESK STUDY REVIEW 1.1 Background This part of the project provided a review of existing UK farmer/spray operator practices on agricultural pesticide handling and washdown areas, relevant EU and UK regulations/Codes of Practice, and associated research studies in the UK and abroad. This review has been published in the EA R&D Technical Report P2-200/TR/1. 1.2 Introduction The pollution of water resources by pesticides can arise from a number of sources and produce a number of detrimental impacts, both environmentally and economically. Pollution of surface water can lead to a detrimental impact on water quality and aquatic ecosystems. The pollution of water resources, both groundwater and surface water, has an additional effect in terms of the quality of potential drinking water supplies at the points of abstraction. Pesticide pollution can either cause the abstraction water to be rejected as being too polluted or can require that expensive water treatment is required prior to discharge into the potable water system. This water treatment cost is passed on to the consumers of water, i.e. the whole population. There are many stakeholders involved in the use of pesticides for plant protection and the quality of water resources in the UK (e.g. agrochemical companies, Environment Agencies, water supply companies, conservation bodies, Government). Water companies in Europe are required to supply drinking water in compliance with the Drinking Water Directive (80/778/EEC and now revised as 98/83/EEC). The pesticide parameter is set at the equivalent of a surrogate zero and requires that no single pesticide exceeds 0.1µg/l and total pesticides do not exceed 0.5µg/l. In order to comply with this stringent requirement many UK water companies have invested in considerable capital expenditure to remove pesticides residues from water intended for human consumption. In some locations, water treatment is not economically viable or practical and water must be supplied with little or no treatment. In order to reduce the economic and social costs of water treatment for pesticide contamination a number of initiatives have been developed by agrochemical companies through stewardship programmes, by water companies through liaison with landowners within catchments, and through spraysafe campaigns. The Plant Protection Products Registration Directive (91/414/EEC) requires that there is not an unacceptable impact on non-target organisms in the aquatic and terrestrial environment and that no active substance or relevant metabolite exceed 0.1µg/l. Regulatory action against some pesticides has been taken at member state level either through revocation or through use restrictions to minimise the impact of pesticide use on surface water quality. The Dangerous Substances Directive (76/464/EEC) requires the EC to set Environmental Quality Standards (EQSs) for List 1 compounds and member states the EQSs for List 2 compounds. In the UK both the DETR and the Environment Agency have commissioned work to derive EQSs. In the UK EQSs are currently available for 65 pesticides (Environment Agency, 1999) though not all are incorporated in statutory legislation but they are used as operational standards. The majority of EQSs are for the protection of aquatic life and are derived for both the marine and freshwater

R&D PROJECT RECORD P2-200/PR 4
environments. EQSs are generally expressed as annual averages (AA) to protect long-term exposure, or maximum allowable concentrations (MACs) to protect short term exposures. In addition some EQSs for example permethrin and cyfluthrin, are expressed as 95 percentiles (concentration that should not be exceeded for 95% of the time). Exceedance of EQS standards in water bodies requires investigation and action to ensure preventative measures are taken, if the source of contamination can be attributed. Some pesticides have been identified as priority substances within the context of the proposed Water Framework Directive. In order to comply with the objectives of this directive competent authorities will need to ensure that surface water quality is not compromised by pesticide contamination. Definitions of source terms (Carter, 2000): Diffuse - indirect contamination of water Pesticides are generally applied for agricultural purposes on a field scale to land where a microbiologically active soil layer is present and where degradation and dissipation processes can take place. The active substance and/ or its metabolites usually have the opportunity to move through the soil layers in solution or sorbed to soil particles before entering water via artificial drainage systems or as surface or sub-surface flow, leaching or by-pass flow. Groundwater and surface water bodies can be affected. Spray drift and pesticides in precipitation can also be considered to be a diffuse source of surface water contamination. Point - direct contamination of water Water contamination derived from a localised situation and enters a water body at a specific or restricted number of locations. Approved point source contamination exists in the form of consented discharges, e.g. from vegetable washing plants. Semi-point sources can occur when pesticides are applied to discrete or restricted sites and contamination from runoff impacts water resources at several locations, e.g. roadsides or railways. Other contamination events derive from spillages or discharges of product, tank mix, waste or washings directly to surfaces or drainage systems which can enter surface water or via soakaways to groundwater. Methods to prevent pesticides entering watercourses have been the focus of research for a number of years which has identified a number of potential contamination routes. The routes vary according to the nature and properties of the active substance and the prevailing agroclimatic conditions e.g. Carter (1999), Notenboom et al (1998). Investigations have focused on monitoring and understanding the processes which determine fate following application to agricultural land, e.g. Flury et al (1994) and data are now available to understand the relative importance of the different pathways for diffuse contamination. Water contamination has been shown to occur through approved use in some circumstances. It is now increasingly recognised that there are also a number of other contamination routes which arise from non-approved use, poor practice, illegal operations or misuse (Carter, in press; Helweg, 1994). Table 1.1 summarises the different routes which have been identified and classifies them as deriving from diffuse or point sources.

R&D PROJECT RECORD P2-200/PR 5
Table 1.1: Sources of water contamination by pesticides Diffuse Point Spray drift tank filling Volatilisation and precipitation spillages Surface runoff/overland flow leaks from faulty equipment Leaching washings and waste disposal Throughflow/interflow sumps, soakaways and drainage Drainflow direct contamination including overspray Base flow seepage consented discharges
Point source contamination can range in concentration from that found in dilute washings to the concentrated, formulated active substance depending on the nature of loss. Given that point sources are largely attributable to operator error or bad practice, equipment faults and the physical characteristics of the handling/mixing area it is considered that point sources can conceivably be controlled more easily than diffuse pollution. Better training of operators and improved design and operation of pesticide handling and washdown areas on farmsteads is seen as fundamental to minimising the risk of pollution from many point sources. This report describes the legislation pertaining to the handling, mixing and disposal of agricultural pesticides, reports on the results of surveys to identify current handling and washdown practices and reviews the monitoring and investigations to identify point source contamination. Existing methods to minimise contamination are discussed and other technologies, which might provide innovative solutions, are investigated. Finally, this report provides recommendations for future work. 1.3 UK and EU Statutory and Non Statutory Requirements 1.3.1 Registration and use of pesticides Approvals for the use of agricultural pesticides may be granted in the UK under either the Control of Pesticides Regulations (COPR) 1986 or the Plant Protection Products Regulations (PPPR) 1995. The latter implement the EC Authorisations Directive 91/414/EEC, whilst the former comprise ‘national rules’ which continue to apply to products not yet approved for listing on Annex I of the Directive. The use of pesticides on farms in the UK is controlled by Part III of the Food and Environment Protection Act (FEPA) 1985. Detail to implement the act is provided within the Control of Pesticides Regulations 1986 (COPR) and the Control of Substances Hazardous to Health Regulations (COSHH) 1994. For the disposal of waste pesticides the Control of Pollution Act (COPA) 1974, the Water Act 1989 and the Environmental Protection Act 1990 also apply. To assist those who have duties under the act or regulations codes of practice are available which advise on practical implementation. All pesticide users should be familiar with the requirements of this legislation. Under FEPA, everyone who uses or supervises the use of pesticides on a farm or holding must be trained and certified to use them safely and efficiently and the National Proficiency Test Council (NPTC) provides training and examination for operators. Test PA1 requires a general knowledge of the use, storage, handling and disposal of pesticides whilst others apply to specific methods of pesticide application. There is currently no requirement to update training or for re-examination. There are
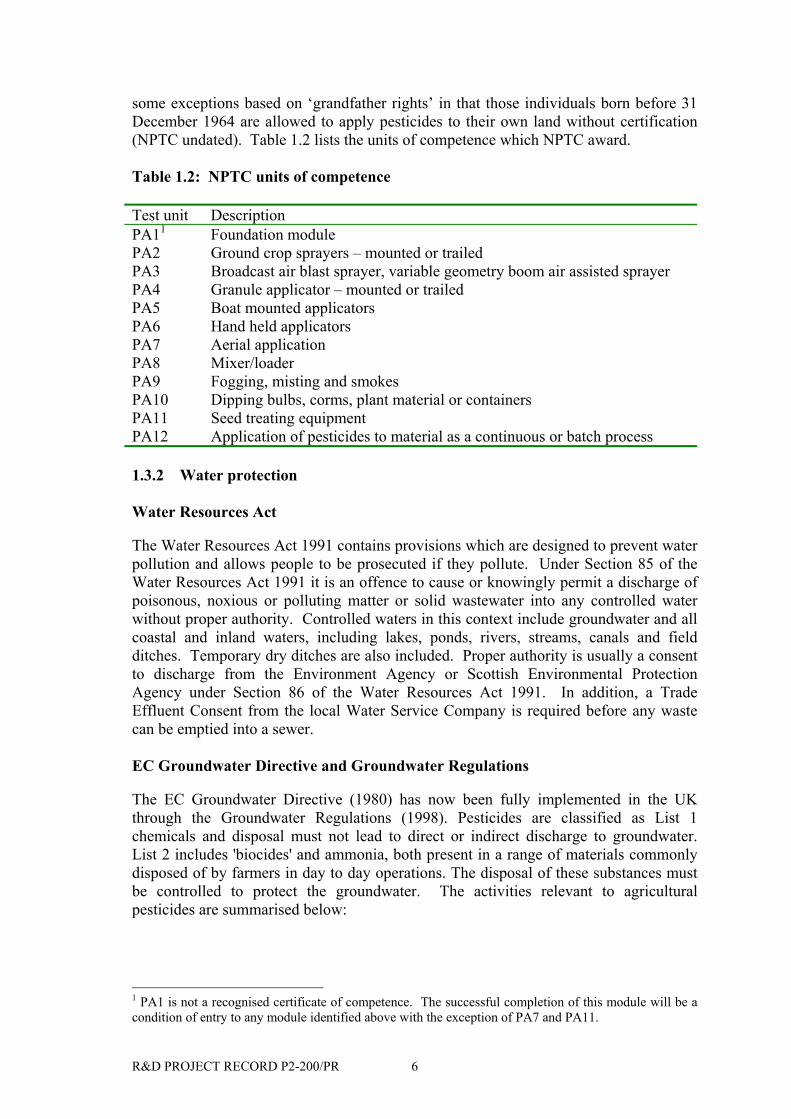
R&D PROJECT RECORD P2-200/PR 6
some exceptions based on ‘grandfather rights’ in that those individuals born before 31 December 1964 are allowed to apply pesticides to their own land without certification (NPTC undated). Table 1.2 lists the units of competence which NPTC award. Table 1.2: NPTC units of competence Test unit Description PA11 Foundation module PA2 Ground crop sprayers – mounted or trailed PA3 Broadcast air blast sprayer, variable geometry boom air assisted sprayer PA4 Granule applicator – mounted or trailed PA5 Boat mounted applicators PA6 Hand held applicators PA7 Aerial application PA8 Mixer/loader PA9 Fogging, misting and smokes PA10 Dipping bulbs, corms, plant material or containers PA11 Seed treating equipment PA12 Application of pesticides to material as a continuous or batch process 1.3.2 Water protection Water Resources Act The Water Resources Act 1991 contains provisions which are designed to prevent water pollution and allows people to be prosecuted if they pollute. Under Section 85 of the Water Resources Act 1991 it is an offence to cause or knowingly permit a discharge of poisonous, noxious or polluting matter or solid wastewater into any controlled water without proper authority. Controlled waters in this context include groundwater and all coastal and inland waters, including lakes, ponds, rivers, streams, canals and field ditches. Temporary dry ditches are also included. Proper authority is usually a consent to discharge from the Environment Agency or Scottish Environmental Protection Agency under Section 86 of the Water Resources Act 1991. In addition, a Trade Effluent Consent from the local Water Service Company is required before any waste can be emptied into a sewer. EC Groundwater Directive and Groundwater Regulations The EC Groundwater Directive (1980) has now been fully implemented in the UK through the Groundwater Regulations (1998). Pesticides are classified as List 1 chemicals and disposal must not lead to direct or indirect discharge to groundwater. List 2 includes 'biocides' and ammonia, both present in a range of materials commonly disposed of by farmers in day to day operations. The disposal of these substances must be controlled to protect the groundwater. The activities relevant to agricultural pesticides are summarised below:
1 PA1 is not a recognised certificate of competence. The successful completion of this module will be a condition of entry to any module identified above with the exception of PA7 and PA11.

R&D PROJECT RECORD P2-200/PR 7
• Where discharges contain listed substances in such small amounts no authorisation for disposal is required. This would include, tank calibration residues and disposal of empty containers that have been rinsed according to current codes2.
• The application of pesticides to crops in accordance with label stipulations does not
require authorisation under the regulations. Tank washings should be applied to the target crop in accordance with product label stipulations and do not require an authorisation under the regulations. Disposal of washing to uncropped land does require an authorisation. This includes a 2nd rinse, which will still contain pesticide residues. If a headland area is cropped then it is regarded as disposal onto crop. If there is no crop present then disposal needs to be authorised. If a 'Conservation Headland' is present, disposal is not permitted in any circumstances.
• Residues on the external surface of a sprayer typically consist of a mixture of active substances and where these are washed off the spray equipment as part of periodic maintenance and disposal of washings, an authorisation is required. If washed over the crops at the end of each application within label requirements, ‘use of materials’ applies and so authorisation is not required. Collection of washings, e.g. in a small sump, to immediately apply to crop within label stipulations does not require authorisation. Collection of washings for later disposal onto crops does require authorisation.
The Groundwater Regulations do not apply to the process of tank mixing since this is not a disposal activity. However the design and use of pesticide mixing areas can be covered by a Code of Practice and Notice powers. If spillages are disposed of to land, rather than collected and used, then an authorisation will be required. The storage of pesticides will be covered under a Code of Practice for the Groundwater Regulations, applying the same criteria used for storage of non-agricultural or other similar agricultural materials, i.e. sheep dip compounds. Washings which are treated using dedicated treatment systems such as the 'Sentinel units' must consider the implications of these regulations as they contain Listed substances. When used according to supplier's instructions, whereby discharge is regarded as acceptable quality, these are dealt with by means of 'Conditional Prohibition Notices'. The Agency prefers the option of not discharging pesticide waste or washings into stored slurry. If pesticides are allowed to discharge into stored slurry, then the whole of the stored slurry contains pesticides (comprising List 1 and 2 substances) and so, when spread onto land, require authorisation under the Groundwater Regulations. If the slurry disposal takes place on more than 6 occasions per year, then the operation would not qualify for the reduced application fee and would attract a higher annual charge. The Agency also notes that research is currently underway to investigate the potential of biobeds to dispose of pesticide washings and spillages. In the absence of evidence the Agency states that only a closed biobed system (no discharge) does not require an authorisation. However someone wishing to construct a system should be aware that Notice powers might be used if they pose an unacceptable risk of pollution.
2 Disposal of containers for Listed substances that cannot be rinsed in accordance with these codes i.e. cyanide based compounds, poisons, sheep dip 'pour-ons', will be liable to require authorisation under the regulations.

R&D PROJECT RECORD P2-200/PR 8
Future legislation Two new EC Directives are shortly to be implemented in the UK concerning incineration and waste disposal. Waste Framework Directive This directive will be fully implemented through the updating of the Waste Management Licensing Regulation (1994). A consultation document is scheduled to be published in summer 2000. The regulations will refer to the future requirements for disposal of agricultural waste including pesticide containers and packaging. Implementation of the regulations is likely to be in 2001/2002. Containers can currently be buried on farm (though this is not encouraged), incinerated or some can be returned to distributors/manufacturers. Material used for clean up or contaminated clothing cannot be disposed of in this manner and must be dealt with by a licensed waste contractor whose charges are approximately £4.50 per kilo of waste (BAA, 1999). Waste Incineration Directive It is anticipated that the Waste Incineration Directive will be adopted in autumn 2000. There will then follow a period for UK consultation and implementation by 2006. Current advice to incinerate rinsed containers using a high temperature bonfire, e.g. using the incinerator developed by the Crop Protection Association, formerly the British Agrochemicals Association, (BAA, 1998) may be in jeopardy if on farm incineration is no longer permitted. It is unlikely that the incinerator will meet the emission standards required by the proposed Directive. Discussions are currently taking place between interested parties but it appears that the UK Government may not consider a derogation to allow ‘on-farm’ incineration to continue. 1.3.3 Codes of Practice There are three types of codes which include advice on implementing the acts and regulations concerning pesticides (BCPC, 1996): Approved Codes of Practice (ACoPs) Failure to follow the guidance given may be taken as proof in a court of law that an offence has been committed. The onus is on the user to prove that any alternative approach used was as effective. Statutory Codes of Practice and Industry Codes of Practice (CoPs) Failure to follow a Statutory Code or Industry Code may be taken in a court of law as evidence that an offence has been committed. A Statutory Code which has been laid before Parliament, may be given more legal weight by the court. The MAFF Green Code is a Statutory Code made under Section 17 of FEPA. Parts of it have also been officially approved under the Health and Safety at Work Act (1974) and it is therefore also an ACoP. Additional practical advice is given in HSE Guidance notes such as AIS 16: Guidance on storing pesticides for farmers and other professional users. The Green Code is probably the most comprehensive source of information available to an operator using pesticides. It was written to provide practical guidance to farmers and growers on the safe use of pesticides on farms. A number of the guidelines

R&D PROJECT RECORD P2-200/PR 9
relate specifically to pesticide handling, mixing, washdown and disposal operations. Notable points include: 167 Contain any spillage immediately. Liquid pesticides should be soaked up with a
non-combustible material, e.g. sand, and disposed of safely. 174 If spillage occurs and there is a possibility of risk to other people, animals or the
environment, take prompt action to limit the effects (e.g. contain the spill). Warn others who may be affected or who have an interest; for example, the appropriate environment agency.
185 A list of precautions to take when filling spray equipment. 200 A list of guidance on what to do on completion of pesticide application. 230 Where spraying operations produce liquid wastes, the pesticide user will need to
provide arrangements for its disposal in an environmentally acceptable manner. 231 All washing operations should be carried out in an area suitable for the purpose
such that spillages cannot escape from the area and contaminate soil, or surface or groundwater.
232 On completion of the pesticide application all equipment involved in the operation should be cleaned, washed and rinsed. Washings water can be : - used for next batch of dilute pesticide, - sprayed on treated crop, - stored for disposal by registered waste carrier to licensed waste disposal facility,- put into on-farm treatment system (e.g. Sentinel) and discharge to sewer with the appropriate approval, - sprayed onto an area of uncropped land with EA approval.
242 Lightly contaminated packaging and other wastes, as well as discarded protective clothing resulting from dealing with spillages, will also require disposal. However, it is likely that disposal of such wastes on the premises will not be acceptable.
244 The solid waste arising from the clean-up of spillages including loose pesticides, heavily contaminated equipment and protective clothing, absorbents used on liquid spillages and the like should be arranged through an appropriately authorised/licensed specialist waste disposal operator.
The Scottish Office Code of Good Practice (Scottish Office, 1997) builds on the content of the Green Code. It states that: 12.7 Mixing pesticides and filling spray containers should take place well away from
any surface water, watercourse or drain and always be carried out in such a way that there is no risk of polluting water by spillage.
12.15 Wherever possible sprayers should be washed out in the field where the pesticide has been used.
12.16 After being cleaned, containers should be punctured in several places or crushed to make them unusable. These containers will generally be accepted at licensed disposal sites.
It is generally recognised that despite the recent revision of the Green Code in 1998, there are a number of recommendations, which do not meet with the approval or support of the various organisations concerned with the use of pesticides. This is especially so

R&D PROJECT RECORD P2-200/PR 10
given the results of recent research and legislation. A further revision is now in preparation and its second draft is currently with Government Departments. A document for public consultation will follow later in the year. 1.3.4 Relevant documents Documents, which include practical aspects of pesticide storage, mixing, use, washing and disposal activities on the farm, are covered in a number of publications. These include: • MAFF The Code of Practice for the Safe Use of Pesticides on Farms and Holdings -
The Green Code, (MAFF, 1998a); • MAFF Water Code (MAFF, 1998b); • MAFF Air Code (MAFF, 1998c); • MAFF The Code of Practice for Suppliers of Pesticides to Agriculture, Horticulture
and Forestry - The Yellow Code (MAFF, 1998d); • NAAC Code of practice for the use of approved pesticides in amenity and industrial
areas- The Orange Code (NAAC/BAA, 1998); • Scottish Office Code of Good Practice (Scottish Office, 1997); • British Agrochemicals Association, Think Water – Keep It Clean (BAA, 1994),
Container Incineration - A Practical Guide (BAA, 1998); • British Crop Protection Council (BCPC) Guide to Safe Spraying (BCPC, 1999); • British Crop Protection Council Boom Sprayers Handbook (BCPC, 1994); • EA/SEPA Pollution Prevention Guidelines (EA/SEPA, 2000); • SEPA Guidance Note 1 - Disposal of Waste Agrochemicals to Land (SEPA, 1999a);
and • SEPA Guidance Note 1 - Treatment and Disposal of Waste Pesticides (SEPA
1999b). 1.3.5 Building regulations requirement Any construction for pesticide handling and washdown would be termed ‘agricultural buildings’ and therefore would be exempt from formal buildings regulations. 1.3.6 Planning requirement Any new development which might be constructed for the purposes of pesticide handling and washdown require "prior notification" to the Local Planning Authority. Once notified the Authority has 28 days to respond, and if there is no response, then the farmer/land owner can proceed with the construction. However, full planning permission is required for the following circumstances: • if the structure is within 400 m of a protected dwelling (non-agricultural); • if it is within 25 m of a highway; • if it is to be more than 3 m high and within 3km of an airfield; and • if it is to be more than 12m high and more than 3 km of an airfield.

R&D PROJECT RECORD P2-200/PR 11
All waste, drainage and discharge implications in planning applications are notified to the local Environment Agency for comment. The EA might choose to investigate if it considers the potential environmental impact to be significant. 1.3.7 Regulatory issues There is a wide range of legislation, codes of practice and advisory information currently available to farm managers and pesticide users and highlights future legislation, which will impact on ‘on-farm’ activities. The variety of information and advice is confusing and difficult to assimilate given the different and sometimes conflicting statements. There are a number of anomalies, and impractical or expensive solutions. For example, clean up material from a small spillage is classified as Hazardous Waste and must be disposed of by a licensed waste disposal contractor yet rinsed containers (which do in practice still contain residues) can be incinerated. Contaminated clothing is also defined as hazardous waste and cannot be incinerated, yet it could be washed in a domestic washing machine and dirty water discharged to a sewer. 1.4 Review of Current Handling and Washdown Practices A number of investigations have been carried out to identify what the usual on-farm practices are concerning pesticides. This section summarises three such investigations carried out by ADAS National Farmers Union (NFU) and Rhône-Poulenc Agriculture. Any survey of this kind is difficult to carry out as users might be aware of the requirements on them and will be wary of admitting to malpractice. The Cherwell catchment postal survey only generated a 12% return from farmers using pesticides. For the purposes of this report the required information was obtained by interview of selected ADAS senior farm consultants who have wide ranging, long term, experience of farmyard practices. 1.4.1 ADAS consultant survey In March 2000 five ADAS consultants (four arable, one mechanisation) considered a wide range of technical prompts to assess the current position on pesticide handling and washdown practices. Their experience totalled 54 years of ADAS consultancy, with expertise in spray application and over 37 years for one individual, who currently serves on the Expert Working Group on spray application for the British Crop Protection Council. Experience across the group covered spray equipment from 12 - 24 m boom crop sprayers with tank sizes from 800 - 3000 litre capacity. They currently deal with 80 clients in the North Midlands of the UK, these businesses having 85 sprayers operating over some 30,000 ha in area. It is likely that all this area receives 4 - 5 spray treatments annually. The responses from the five ADAS Consultants were based on their detailed knowledge of pesticide handling and washdown operations on 80 farming enterprises.

R&D PROJECT RECORD P2-200/PR 12
The questions considered by the ADAS Consultants and answers provided were: 1. Where are sprayers filled? 100% of sprayers were filled in uncovered areas. 90 % filled in main yard or sub-yard of business. The remainder were filled remotely with some bowser use. Main influence on location of filling was the availability of a reliable and quick water supply. However, there appeared to be some influence from recent crop assurance requirements to maintain yard filling for known water quality purposes. 2. What surfaces are used for refilling areas? 75 % of the surfaces were hard standing, 75 % of which would be concrete or possibly asphalt. 15-20 % were hardcore, the remainder being soil/stony areas. Bowser use only took place in field entrances, some slope to field, others generally level. Hardcore in this context is described as crushed limestone, road planings, brick or random stones. 3. Were hard standings drained? Majority of concrete surfaces were drained to a sump. This sump often drains into main yard system, though some drain to non-contained or soak-away locations. 4. Where are sprayers washed out? Internally Internal washouts are sprayed onto crop in question. There was a universal view that all farmer groups accepted in-field internal washout as the safest and recommended action. Some crop assurance statements also require this. Most operators and farmers were fully aware of the IPU (isoproturon) Stewardship Scheme and other problems arising from random point source contamination in the field. External sprayer washings This is mainly carried out in yard areas with pressure washers or sprayer in-built washers, thus draining to a sump and subsequent drainage system. However, farmers widely held the view that drainage from yard areas was linked to considerable dilution as soon as it reached a watercourse. Therefore this was seen as less of a problem, especially as no on-farm treatment systems (e.g. Sentinel, Wisdom) were currently available which made commercial economic sense. 5. Perception of safety issues re. disposal of washings for different pesticide products? Some farmers held the view that differences could be made e.g. those products with high mammalian toxicity and those with much lower mammalian toxicity. This is judged by Personal Protection Equipment (PPE) recommendations. Where low PPE are stated then a perceived lack of washings problems follows.

R&D PROJECT RECORD P2-200/PR 13
6. Container handling Most farmers/spray contractors washed out the used containers an unspecified number of times, though some undertook triple washing. Containers were then generally stored with lids on, the right way up and placed in secure storage until disposal. 7. Are any waste disposal contracts known? Only one waste disposal contract was known (i.e. 1% of businesses) in which some liquid waste and containers were removed. Most businesses burn the containers where possible. The BAA incinerator design was well known and widely in use. 8. What is the reason for adopting correct disposal method? There was no real incentive for disposing of containers correctly, other than for some Crop Assurance Schemes. Health and Safety at work was acknowledged. Generally the operators were definitely interested in their own health and safety but they perceived that agriculture is over regulated through public ignorance of the functions and activities that take place on farms. 9. What would be the reaction to new methods, if developed? The comments were likely to be: is it necessary, is it a proven answer, will it work, will it satisfy crop assurance schemes and safety, what will it cost, why can’t we divert present farmyard drains to treatment. Farmers are not keen to rip up concrete already in situ on their farms. 10. Reasons for these reactions? Past signals and instructions in this area have been incorrect and costly. There is a perception that the agricultural industry is always under attack and other industries are not. There has been bad handling of groundwater legislation, scepticism of real legislation need and farmers are sick of legislation. However, farmers would probably comply, if current pesticide handling and washdown systems can be proved to be definitely at fault. Farmers might adopt a new system if it cost under £1000 to them and there was a possibility some grant aid for environmental improvement. There would be a question as to how these new rules, if they came in, would affect the smaller operators, i.e. 10 m sprayers in the hills, 40 ha per year. The system needs to work for both small and large volume spray operators throughout the UK. 11. Other issues, similar areas? Concerns were raised over the disposal of PPE, washing of contaminated clothing and the disposal of washing water. Would there be any controls of the discharge of water from domestic washing machines that were used for washing spray operators clothing that might have become contaminated with pesticide.

R&D PROJECT RECORD P2-200/PR 14
12. Issues for contractors? Spray contractors often work in remote locations on many farmer properties, would they have similar control over their discharges and working routines etc. ? Would bowser back up equipment and absorbent material/matting be made available for them ? Would they have a responsibility for handling and disposing of any contaminated material ? 13. What materials would the group consider possible for washdown/filling areas? Suggestions included porous materials, e.g. coke, which could then be shovelled up and burnt. Compressed paper and cardboard. Astroturf type over an absorbent. Straw mats, wood chip mats. Fibresand. Note - Under Health and Safety requirements the use of combustible materials for this clean-up operation is currently prohibited. 14. How would information on new procedures be best communicated to users? This could be achieved through quick press coverage (e.g. Farmers Weekly, Farming News, Crops, Arable Farming), a small booklet (A5), good diagrams (e.g. BAA incinerator type), Posters for spray shed, cut-away drawings, DIY build notes etc. Presentations at Sprays & Sprayers with mock-ups etc. Clear reminders on pesticide containers. CD-ROM for on-farm PC’s, which are now becoming more widespread on farms. 1.4.2 NFU / Rhône-Poulenc / Thames Water Agrochemical Stewardship Survey During the summer of 1999, 84 farmers in the upper River Cherwell catchment were contacted twice by the NFU to fill in a questionnaire (that had a pre-paid envelope enclosed in the package). There were only 24 replies. However, 14 of the farmers professed to be following an organic philosophy and therefore had no information to contribute. Therefore only 10 replies were available for analysis (Wise, pers.comm.). Consequently few usable results came out of the NFU survey but there were some interesting comments in relation to some of the questions: 1. What is the most frequent cause of accidental spillages on your farm? Foaming from sprayer tank Falling over of badly shaped cans Broken containers Overfilling of sprayer Never happened/can’t remember when we last had a problem None much, too expensive to spill 2. Do you have a contingency plan prepared in case of accidents? No plan (5 replies) Yes, 1 reply with no detail, 1 reply - clean up with sand , 1 reply - scatter sawdust clean up and burn

R&D PROJECT RECORD P2-200/PR 15
3. What is the ultimate fate of washings? Soakaway from blind ditch On own land in slurry In field Dilute and spray to field Into soil away from watercourses Slurry lagoon 4. How do you handle empty containers prior to disposal? Upturn and incinerate Rinse and incinerate Replace cap and upturn Store in spray shed 5. Where do you wash the sprayer? Yard with drain to soakaway On concrete farmyard In field On designated non-cropped area 6. How much rinsate (from inside sprayer) do you normally have to dispose of? 50-100 gallons (225-450 litres) 500 litres (2 respondents) 130 litres 100 litres 7. How often is your sprayer washed? Yes Annually 2-3 times per season 3-4 times/ annum Nov, May, July Regularly in the field Between different crops, Feb to July Twice/annum Nov/Dec, June/July When it is dirty enough to justify The NFU survey shows that there is a considerable need to further educate the farmers in best management practice. Hopefully, giving farmers more information on the implications of bad practices on the environment will encourage them to be more vigilant in their spraying activities.

R&D PROJECT RECORD P2-200/PR 16
1.4.3 Rhône-Poulenc survey A survey of 502 cereal farmers was commissioned by Rhône-Poulenc Agriculture in December 1998 which included an investigation of farmer actions with regard to best practice (Produce Studies 1999). The results indicated that there was a significant proportion of farmers not meeting best practice objectives; even when they appeared to know of the best practice policy. The sample structure was designed to be representative of farms with more than 5ha cereal crops and deliberately biased to larger farms. The following are extracts from the survey providing information relevant to this report. 1. Agreements with statements regarding use of isoproturon (score 1-5, disagree – strongly agree) I clean up spillages immediately 4.7 I have a contingency plan prepared for accidents
4.1
2. Action to deal with spillage (prompted) Absorb spill with soil 21% Disposal of spill?
Spray/spread on field 20% Bury in suitable place 14% Dung heap/waste tank 10% Uncropped waste area 9% Burn away from farm 9% Dispose of safely 8%
Absorb spill with other material 32% Wash spillage away with hose 19% Use contractor for spraying 14% Leave spill to evaporate 4% Not answered 12% 3. Description of washing sprayer (prompted) Wash and clean in yard 27% Wash and clean on designated uncropped area 24% Wash and clean into collection tank for disposal onto designated uncropped area
12%
Wash in field 10% Other 2% Not answered 28% 4. Sprayer cleaning frequency and timing Greatest frequency is in April, May and June but a high proportion do not clean the sprayer at all.

R&D PROJECT RECORD P2-200/PR 17
5. Preferred communication routes Via consultant agronomist 60% Information packs mailed direct to farm 22% Articles in farming press 19% Information pack from agchem supplier 8% Video 4% Internet 3% Audio tapes 1%
The isoproturon stewardship survey aims to promote good practice and the Produce Studies report shows that farmers with larger size farms were more aware of the campaign. Results also suggested that those who were aware had improved knowledge of good practice (though this does not mean it is implemented). 1.4.4 WRc survey In 1996 WRc undertook a farmer and contractor pesticide use survey on behalf of the EA as part of a research study (EA, 1998a). A questionnaire was sent out to all contractors and a sample of farmers in the catchments of the River Gipping in Suffolk and the River Avon in Hampshire/Wiltshire. Approximately one third of the questionnaires distributed were returned. Responses from the questionnaires indicated that farmers and contractors were generally aware of the need to exercise good practice in the handling and management of pesticides. Two issues of concern were identified by the survey. The practice of disposing excess pesticides and rinsate to soakaways, in use on 20% of farms surveyed (though 0% of contractors), creates a significant risk to surface water and groundwater pollution. Only 30% of farm operatives and 80% of contractors had received formal training in the safe and efficient use of pesticides, although this is a legal requirement unless ‘grandfather rights’ were applicable. 1.4.5 Common issues The surveys reported have different questions, objectives and methods of reporting. However it is clear that current farmyard characteristics and practice vary. Many spray operators are not aware of the environmental problems which might arise when pesticide is spilt or incorrectly disposed of in a farmyard, nor the consequences of washing down spray equipment. The potential for point source contamination is large and a number of responses suggest that there are common issues which are relevant to point sources of contamination; these include: • there is restricted awareness of the environmental impact of point source losses and
the need for individuals to address the problem; • spray activities are mainly carried out on impermeable surfaces which are usually
drained to a sump which drains to surface water or a soakaway; • few farmers have a spill contingency plan; • few farmers have contracts with licensed disposal contractors; • a number cite tank overfilling as a common source of spillage; • many farmers washdown their spray vehicles in the farmyard;

R&D PROJECT RECORD P2-200/PR 18
• there is no clear advice for disposal of containers and packaging or spill clean up material; and
• concern that advice changes and is not proven, implementation may be expensive and there is no current justification or benefit in following such advice.
1.5 Review of Monitoring and Investigations to Identify Point Source Contamination and Factors Influencing its Occurrence Most previous studies of pesticides in surface water have investigated sources of diffuse pollution from spray drift, field drains or surface run-off, e.g. Vicari et al (1999a, 1999b). The detailed study of pesticides in vulnerable aquifers (chalk and sandstone) in the UK began in the early 1990’s (NRA, 1992). Research has focused on reducing diffuse losses through techniques such as tillage changes (Isensee and Sadeghi, 1996), drainage management (Brown et al, 1999) or the use of no-spray buffer zones (UK Pesticides Safety Directorate). Whilst these techniques have been shown to be effective they can be difficult to implement at the field or catchment scale and the variation in losses from year to year can be greater than the effect of the measure. In recent years research studies have identified that point source pollution to surface waters can significantly contribute to the pesticide load leaving a catchment, however local site and catchment conditions can cause the amount to vary greatly. Point source pollution can arise from effluent discharges to rivers from sewage treatment works or factories, accidental spills, deliberate disposal of surplus material into soakaways or rivers, amenity weed control leading directly to drainage systems, or vandalism (EA, 1998b). Point sources, although difficult to identify and locate, arise generally from poor management. Water quality monitoring data in the UK suggests that the disposal of pesticide waste and washings could be responsible for between 30 and 50% of water contamination incidents (Carter 2000, Mason et al 1999). Much of the monitored contamination arises from small spillages and careless handling of approved pesticides during storage, preparation, application or disposal (BAA/NRA, 1995). Research on point source pesticide pollution has been undertaken in a number of European countries, including: Belgium, Denmark, France, Germany, Sweden and the UK. The magnitude and frequency of these losses at the European scale is not known, but it is generally acknowledged that management and technical solutions to reduce point source losses could be effective in reducing contamination within a catchment. The information provided below summarises examples of the findings of the research into contamination from point sources. 1.5.1 Belgium In Belgium the first results from the River Nils catchment obtained in spring 1998 with isoproturon, indicate that the total losses were relatively important (about 1% of the amount applied). It has been shown, in addition, that direct losses from point sources could represent up to 70% of the total load of the river during the period of investigation (Pussemier and Beernaerts pers. comm.). Despite heavy rains occurring during this period, field runoff was estimated to have only a relatively small contribution (25%) to the total load. Other entry routes were not relevant. Some of the most serious cases of water contamination have arisen from misuse, accidental spillage, or inadequate handling/storage conditions.

R&D PROJECT RECORD P2-200/PR 19
1.5.2 Denmark In Denmark it has been shown that 2,4-D, dichlorprop, parathion, and diquat were detected in groundwater at concentrations of up to 3800µg/l (Helweg, 1994). These high concentrations have been attributed to direct contamination from back-syphoning in the borehole during the tank filling process. Rinsing of sprayer around the borehole also contributed to the contamination. Other work from Denmark has investigated the leaching of pesticides from a site that was used for filling and washing sprayers (machine pool) over the period 1950-1981 (Jacobsen et al, 1999, Spliid et al, 1999). High concentrations of dichlorprop, mecoprop, diuron, bentazone, chloridazon, atrazine and 2-hydroxyatrazine were found close to the site, indicating that the groundwater had become polluted from this source. In Denmark there are at present about 750 such machine pools and 45,000 farmers have sprayers, indicating that the potential pollution problem with these old machine pool sites is nationwide. 1.5.3 Germany Work in the Hesse region of Germany on quantifying pesticide pollution from farmyard and other point sources proved that more than 60% of the total pesticide load in river water originated from farmyards connected to sewage plants. When agricultural advisors then provided best practice guidance to the farmers and spray operators on all their farmyard procedures this point source pesticide load could be reduced by up to 80%. Other work in the Westphalia region of Germany involving the regional Chamber of Agriculture, agrochemical companies and water companies identified that with suitable stewardship of farmer operations a 30% reduction in point source load could be achieved (Bach, 1999). 1.5.4 Sweden Kreuger (1998) found that in a study catchment in Sweden pesticide application for weed control in farmyards contributed to approximately 20% of the overall pesticide load in stream water and losses from these sources continued for many months after application. In this study the occurrence of pesticides in surface water was as a result of natural leaching and transport processes influenced by soil and weather conditions, as well as point sources such as spills and non-agricultural application. 1.5.5 UK In the UK, Mason et al (1999) discovered that around 40% of the pesticide contamination in a small catchment derived from activities in the farmyard even when the spray operator was observed. A number of simple solutions to minimising losses were identified. The Cherwell study also showed that the main areas of sprayer contamination were focused at the rear of the vehicle, especially the rear wheels, rear wheel hubs, rear mud guards and the spray boom (Higginbotham et al, 1999). These areas should therefore be targeted for thorough washing. Mud brought back into the farmyard after spraying operations was also shown to be a significant source of pesticide pollution, and the effect from this contaminated mud lasted more than 6 months from the date of spraying. Research by SSLRC in the UK has been investigating the physico-chemical properties of different hard surfaces (e.g. concrete, porous asphalt and ballast) and how they can

R&D PROJECT RECORD P2-200/PR 20
affect the degradation of six herbicides - glyphosate, isoxaben, oryzalin, oxadiazon, diuron and atrazine, used in non-agricultural environments (Shepherd and Heather, 1999). New surface material was used in order to remove interfering factors such as surface weathering and to allow comparison of results. Greatest herbicide losses were observed on concrete, except for glyphosate where the highest loss was observed for asphalt. Concrete is less pitted and less permeable than asphalt or ballast, thus the surface area for adsorption is reduced and the potential for runoff increased. As these materials age then their adsorption potential increases, especially as organic material will accumulate on them over time. 1.6 Review of Methods to Minimise Contamination The review of literature concerning point sources of pesticides highlighted a number of initiatives which have been developed to address the problem of spillages and disposal of washing water. Little of the information was found to be in the public domain as much of the work is on-going and a number of researchers have been contacted to obtain the current status of their work. 1.6.1 Purpose built facilities Dean and Bucklin (1997) from the University of Florida have produced a comprehensive set of building plans and management practices for a permanently sited agricultural pesticide mixing/loading facility. This consists of a 36ft x 22ft (11m x 8m) concrete area draining towards a central sump. The facility is totally covered with a solid roof, weather walls and secure storage areas for pesticide containers, protective clothing and rinsate. The waste water collected in the central sump is either sprayed onto suitable land as a dilute-spray application or it is removed from the site by a licensed hazardous waste disposal firm. All aspects of pesticide handling, mixing, washdown and disposal operations, together with what to do in the event of a spill, are documented in great detail. The cost of such a large facility would be prohibitive on most typical farmsteads in the UK with a minimum estimate of £30,000. It would only be appropriate to large scale farming or spray contracting enterprises. Other facilities is the USA rely on evaporation of washing water from large scale tanks for ‘disposal’ but obviously a warm climate is required for the success of this method. A number of individuals in the UK have developed their own facilities, e.g. a farmer at Martham in Norfolk has converted a pig shed to provide an under cover, tank mixing station. Morley Research Centre, HRI, ADAS and other research sites and Novartis at Whittlesford have concrete standings and boom troughs to collect washings which are directed to sumps. Water is treated using carbon filters e.g. Sentinel system but Environment Agency authorisation to discharge or dispose of this water must still be obtained as it is a fixed plant and covered by the Water Resources Act. Alternatively the waste must be stored and then collected by a licensed contractor whereby it may be incinerated or disposed of via an authorised landfill site. 1.6.2 Spray equipment In recent years spray equipment technology has taken steps to improve the mixing, filling and washing operations. Many modern sprayers now have the facility to wash out pesticide containers after the concentrate has been added to the spray tank. Internal rinsing of the main spray tank whilst still in the treated crop area is now common.

R&D PROJECT RECORD P2-200/PR 21
Closed transfer systems that do not require the opening of lids or the removal of foil seals can now be purchased and it can cost from £1000 to modify existing equipment. The main restriction to this technology being adopted further is the availability and cost of products, technical problems and the need to develop a system for returnable containers. Packaging companies are beginning to investigate container and lid/seal design to reduce the risk of the pesticide not entering the sprayer correctly, if handled correctly and to provide improved rinsing effectiveness. 1.6.3 Hard surfaces SSLRC, in the UK, have been undertaking a study for the Department of the Environment, Transport and the Regions to investigate the behaviour of a range of herbicides with varying physico-chemical properties, some of which can be applied to highways and railways to minimise weed growth. The removal of six herbicides (glyphosate, isoxaben, oryzalin, oxadiazon, diuron and atrazine) from three surface types (asphalt, concrete and ballast) was examined using artificial rainfall simulations. Applications were made in accordance with amenity labels. The results indicated that surface type significantly affected herbicide run-off, with concrete being the worst. On average, total herbicide loss for concrete was 28%, compared to 16% and 13% for asphalt and ballast respectively. Higher rainfall volumes and intensities produced greater losses. In general, the more soluble compounds with lower Koc produced higher losses. 1.6.4 In situ treatment Biobeds A number of studies are relevant to understanding how pesticides might be sorbed or degraded in situ on a variety of surfaces. These include studies on biobeds which are artificial degradation systems which are currently being undertaken in Sweden, Denmark, UK and Italy, e.g. Torstensson et al (1994), Fogg and Carter (1998). Torstensson and Castillo (1996) outlined the basic design of a farm-scale biobed that was subsequently utilised by SSLRC in the UK. It consists of a 60cm deep sealed pit that was filled with a mixture of chopped straw (50%), peat mould (25%) and top soil (25%) with grass laid on the surface. The results have shown a range of performances of the biobed system in terms of its pesticide removal efficacy by microbial decomposition (Fogg and Boxall, 1998). Some problems have been encountered with the amount of water entering the biobed, causing detrimental effects on the aerobic-anaerobic balance within the system and hence the biological degradation has been adversely affected. With the UK climate there is a need to cover biobeds, especially during the non-spraying periods, to reduce the entry of large volumes of “clean” rainwater into the biobed system which then saturates the biobed material. In Denmark, a study has been running for 3 years using biobeds (2m x 1m) with a bed made up of soil of the type normally used in farmyards (L.Hansen, pers. comm.; Henriksen et al, 1999). The outdoor biobeds were treated with different pesticides (MCPP and IPU) and supplied a controlled amount of rain. On two occasions each biobed was supplied with 8 g of each pesticide. Drainage water was collected from the bottom of the biobeds. In theory the biobeds were very effective at adsorbing and degrading the test pesticides, and much better than the test on "normal" soils from the plough layer and from farmyards when examined both in laboratory and in the field-

R&D PROJECT RECORD P2-200/PR 22
biobed. Compared to a clay soil the leaching of IPU was 60 times lower in the biobed one year after the treatment. However, for MCPP the leaching was only 4 times lower. Mean concentrations of IPU measured was 4.4 mg/l in clay soils and 0.08 mg/l in the biobed. For MCPP the measurements was 1.3 and 0.5 mg/l respectively. Even though there is a good removal of the pesticide, the concentrations leached from the biobeds were not acceptable to the Danish EPA. In addition the content of the biobed was defined as hazardous waste and would have to be disposed of by a licensed contractor at a total cost of £2,500-8,000. In France Rhône-Poulenc are sponsoring the development of ‘phytobac’ or biobeds but this work is in its early stages of development. Reed beds There has been some recent interest in the potential use of reed beds and other constructed wetlands to treat various wastewaters (WRc, 1996). Work undertaken at the Scottish Agricultural College (McKinlay and Kasperek, 1999) has shown that marsh plant systems were able to biologically decontaminate water polluted by the herbicide atrazine. The four plant species used were Schoenoplectus lacustris (common club-rush), Typha latifolia (bulrush or cattail), Iris pseudacorus (yellow iris) and Phragmites australis (common reed). The degradation of atrazine was achieved due to microbial reactions based in the rhizosphere. However, further work on this simple and relatively inexpensive reed bed system is needed on a wider range of pesticides in current agricultural usage before it can be proved to be a suitable remediation technique. Soil remediation Research in the US has tested an on-farm pollution control system using soil as a biological filter for trapping herbicide residues (Liaghat et al, 1996). Polluted water with concentrations of 100 µg/l of atrazine, metazachlor and metribuzin was applied to the soil test areas for 10 days continuously (daily applications lasted 4 hours) and no water was applied for the following 10 days. This cycle was repeated three times. Herbicide levels in the drainage water were found to be 10 µg/l or less. Biodegradation of herbicide residues in the soil was found to occur between water applications. Water treatment There are few commercially available on-farm water treatment systems that can handle pesticide sprayer washings and diluted chemicals from crop sprayings. Two such systems are the Sentinel and Wisdom systems. The Sentinel system incorporates two separate treatment processes, optimised flocculation and activated carbon. The Wisdom system comprises a vertical flow clarifier with a polymer enhanced flocculation process, followed by a carbon filter. Solid wastes from these systems are treated as hazardous waste and are disposed via a licensed contractor (approx. £4.50 per kg). The “cleaned” water is usually sprayed onto a designated EA approved field away from water courses or drainage systems. Both systems are costly, in excess of £10,000 for the main treatment plant, with additional costs associated with the concrete works needed to collect the washings etc. This type of water treatment system is only really suitable for large scale, high volume pesticide spraying operations.

R&D PROJECT RECORD P2-200/PR 23
Cleanup of spillages A number of companies manufacture and sell spill kits which were originally developed for industrial applications. Sorbent materials are used to soak up the spill and hazardous waste bags are provided for containment. The resulting waste must be disposed of by a licensed waste disposal contractor. A kit containing a number of sorbent pads and rolls with disposal bags contained in a highly visible, waterproof container costs approximately £75.00. Other material such as cat litter or sawdust are recommended for cleanup but this conflicts with the advice of the Green Code as it recommends sorbent, non-combustible material. 1.6.4 Container disposal Work by the Crop Protection Association at a number of farms in Yorkshire (BAA, 1999 and Dyer, pers. comm.) investigated the economic costs of disposing of agricultural packaging. Pesticide containers which were unrinsed required classification as special waste and were four times more expensive to dispose of than those which were thoroughly rinsed out. On completion of the project the farm operators had the opportunity of continuing to pay for the collection/recovery scheme but did not proceed because of the cost. Since 1998 the British Agrochemicals Association, now the Crop Protection Association, has been promoting the use of a cheap on-farm incinerator for the disposal of used pesticide containers that have been thoroughly cleaned and emptied (BAA, 1998). The BAA incinerator design, based on an old 210 litre steel oil drum, permits temperatures in excess of 700°C to be reached within a few minutes of lighting and a working temperature of approximately 800-950°C. The Environment Agency are evaluating the effectiveness and compliance of this design. 1.6.6 Training and advisory tools Check lists The Danes have also developed the concept of operational “check lists” which are used as a tool by Danish farmers and agricultural advisors. The check lists guide the sprayer operators through all the pesticide handling, mixing and washdown procedures that take place in the farmyard. They focus particularly on what spray operators should do and what they definitely should not to do. Stewardship material Novartis Agro S.A. in France have produced a colour leaflet and CD-ROM, which takes the reader/viewer through a series of ‘Asterix style’ cartoon images depicting a farmer undertaking a spraying operation (Novartis, 1998). The system provides an interactive quiz to provide training which highlights bad practice and provides information on correct practice. Rhône-Poulenc Agriculture and the Isoproturon Stewardship Group have promoted good farmyard practice in addition to cultivation advice. A number of leaflets and posters have been produced. An additional label panel has also been approved for UK, IPU products which provides brief advice on minimising point source pollution such as

R&D PROJECT RECORD P2-200/PR 24
keeping the sprayer under cover when not in use. The Cherwell project (Mason et al, 1999 and Higginbotham et al, 1999), funded by Rhône-Poulenc, has also been extensively promoted through farming press and farmer discussion groups. A CD-ROM presentation includes annotated photographs which provide a very effective message on the impact of small spillages on surface water quality. Farmer issues A range of solutions and initiatives have recently been developed, or research is still taking place, to minimise point source pollution or treat waste which arises from the spraying operations. There does not appear to be clear advice on what is considered to be acceptable with regard to the concentrations of pesticide which can be discharged to the environment. The various water or registration directives do not specify a de minimis and in the absence of data to prove no impact, the surrogate Drinking Water standard of 0.1µg/l is applied. None of the systems discussed can provide such evidence and there is concern that farmer investment to reduce point source concentrations may still not be supported by the Agencies. 1.7 Transferable Technology There is a wide range of activities or processes which generate contaminated waste water on the farm. A number of these have been considered but there is still scope for further ‘lateral thinking’ and investigation to determine whether any other technology is transferable to address the point source problem and the treatment of waste water. 1.7.1 Urban drainage Within the urban environment permeable surfaces for roads and footpaths have been used as a means of disposal of stormwater. This is seen as a source control technique which is now being recommended by the EA and SEPA as part of the Sustainable Urban Drainage System (SUDS) initiative (EA/SEPA, 1997; EA/SEPA, 1999). Such surfaces provide an alternative to impermeable concrete or tarmacadam surfaces which would otherwise produce rapid surface runoff, leading to possible flooding and degradation of receiving water quality through the controlled discharge of polluted urban runoff (Pratt, 1999; Pratt, 1995). Research work has shown that these permeable surfaces provide both extra storage for stormwater but also create opportunities for the degradation of some pollutants (e.g. hydrocarbons). 1.7.2 Porous pavements The company - Formpave, based at Coleford in Gloucestershire, manufactures porous blocks with a suggested infiltration rate of 4500mm/hour. These porous blocks, designed for lightly trafficked, pedestrian areas and domestic driveways, require a relatively sophisticated sub-base to be constructed under them to support the applied loading. The sub-base itself also has a significant storage capacity in which some pollutant degradation processes can occur. This porous pavement technique, with suitable modifications, could be applicable to the farmyard areas. However, one potential problem with this surface might be the ingress of fine sediment into the porous blocks, thereby blocking the pore spaces and rendering them less effective.

R&D PROJECT RECORD P2-200/PR 25
1.7.3 Addition to manure or slurry The addition of pesticide waste to manures or slurry and subsequent disposal to land is not approved by the Environment Agency unless a license is obtained under the Groundwater Regulations. In Sweden work is currently being carried out to monitor the fate of pesticide contaminated water when discharged into slurry tanks (Kreuger, pers.comm.) Concerns for this methodology are the potential reduction in degradation of a pesticide as the environment may be anaerobic. No other research has been identified to determine whether this may be a viable method of disposal but it is cited in the Produce Studies survey (1999) as a technique which some farmers employ. 1.7.4 Water treatment A treatment process for neutralising contaminated water is being promoted under the trade name of Analoyte. The system has been used in the treatment of dairy washings and for other waters with microbial contaminants. The process has been tested at the University of Hertfordshire and was shown to remove atrazine and isoproturon to levels below detection in a laboratory environment (Lowson, pers. comm.). The system would require an on-farm investment for an installation which would theoretically remove pesticide residues by chemical treatment. The quality of the resulting water and its environmental safety would require rigorous testing for any subsequent on-farm uses. A sorbent material, known as Jimsorb, has been placed into mole drains at the Brimstone Farm experimental site. In the year tested, significantly less pesticide residues were detected in drain flow compared to untreated drains. The material is a waste product from the china clay industry and has potential for testing in different application as it is cheap and can be provided in quantity and at various size grades (Harris, pers.comm). 1.7.5 Impact on farmer The brief reports listed above indicate that there is potential to explore some of the technologies which have been developed elsewhere and to determine whether they are applicable to the farmyard situation. Farmers face a multitude of requirements concerning the different wastes which are generated on-farm and therefore an integrated waste management approach would be more cost effective and easier to comply with. 1.8 Conclusions The problem of point source contamination of water by pesticides is an issue which is of interest to a wide range of stakeholders. Solutions to the causes of contamination are complex and will involve a consensus of opinion, compliance with various EU and national legislative and voluntary requirements and a range of solutions which can be applied at a site specific level. The involvement of a number of the key interested parties in this project will maximise the opportunity for a range of pragmatic, low-cost and effective solutions to be developed and agreed. There is a range of legislation, codes of practice and advisory information currently available to farm managers and pesticide users. There is also impending future legislation which will impact on ‘on-farm’ activities and this needs to be assessed to ensure that any recommendations from this project do not conflict with this. The

R&D PROJECT RECORD P2-200/PR 26
variety of information and advice provided is confusing and difficult to assimilate given the different and sometimes conflicting statements. There are a number of anomalies, and impractical or expensive solutions. The current revision of the Green Code offers an ideal opportunity for inclusion of a consensus of opinion on recommendations for good practice in the farmyard. What the Green Code cannot do is provide specific information which can be interpreted at the site level, e.g. contact details for spill disposal, local emergency contacts, suitability of different systems. There is an urgent need for a generic stewardship approach for all pesticides, targeted to the individual user, which identifies what improvements can be implemented now and which has the support of all stakeholders. The surveys reported have different questions, objectives and methods of reporting. However it is clear that current farmyard characteristics and practice vary. Many spray operators are not aware of the environmental concerns which might occur when pesticide is spilt or incorrectly disposed of in a farmyard, nor the consequences of washing down spray equipment. The potential for point source contamination is large and a number of responses suggest that there are common concerns which are relevant to point sources of contamination; these include: • there is restricted awareness of the environmental impact of point source losses and
the need for individuals to address the problem; • yard spray activities are mainly carried out on impermeable surfaces which are
usually drained to a sump which drains to surface water or a soakaway; • few farmers have a spill contingency plan; • few farmers have contracts with licensed disposal contractors; • a number cite tank overfilling as a common source of spillage; • many farmers washdown their spray vehicles in the farmyard; • there is no clear advice for disposal of containers and packaging or spill clean up
material; and • concern that advice changes and is not proven, implementation may be expensive so
there is no current justification or benefit in following such advice. The review of monitoring in the UK and other countries has identified that point sources of pesticides can be responsible for a significant portion of the total amount of pesticide contamination in water. The ranges reported vary from at least 20% of the total pesticide load in a catchment but could be as high as 70% depending on catchment characteristics. The farmyard characteristics, operating practices and local conditions vary but all workers report similar reasons for contamination. All reviews highlight the significant impact that small spills or washing waters can have on water quality. A range of solutions and initiatives have been developed, or research is still taking place, to minimise point source pollution or treat waste which arises from the spraying operations. There does not appear to be clear advice on what is considered to be acceptable with regard to the concentrations of pesticide which can be discharged to the environment. The various water or registration directives do not specify a de minimis and in the absence of data to prove no impact, the Drinking Water standard of 0.1µg/l is used as a surrogate. No system discussed can provide the necessary evidence for complete compliance and there is therefore concern that investment to reduce point source concentrations may still not be supported by the Environment Agency on these grounds.

R&D PROJECT RECORD P2-200/PR 27
There are a number of technologies which could be explored which have been developed elsewhere e.g. sustainable urban drainage, porous pavements, addition of pesticide waste to slurry manure to determine whether they are applicable to the farmyard situation. The porous pavement design will be tested as a potential surface in this project and results concerning the Swedish work on co-disposal of slurry and pesticide will be reported when available. The concept of on-farm integrated waste management, to include pesticide waste and washings is attractive and would appeal to farmers who face a multitude of requirements concerning the different wastes which are generated. This review emphasises the need for clear, pragmatic advice to users concerning the handling and disposal of pesticides and the associated wastes. There is no doubt that point source contamination of surface or ground waters can be significant and any measures to reduce losses could make an important difference. Awareness of the importance of point sources and training in good practice are clearly a priority area. There is also a clear need for design criteria which provide on farm handling and washdown facilities which minimise the overall problem of point source contamination. 1.9 Recommendations 1.9.1 Future test systems The development of a pesticide handling and washdown facility which minimises contamination of water resources from pesticides requires the testing of a range of surfaces which have the potential to be used. Stage 2 of the project will investigate different surfaces which ultimately prove to be suitable in providing a range of options to farmers which can be adopted according to scale of pesticide use, site vulnerability and farming operations. In order to compare the amount of pesticide washed off from different surfaces it will be essential to eliminate as many causes of variability as possible. In order to achieve this the six experimental sites will be all situated at Horticulture Research International, Wellesbourne. This will ensure that the same weather conditions apply to each surface. The surfaces investigated will comprise: • concrete; • permeable hard core; • biobed with grass cover; • porous asphalt; • field surface (soil with grass cover); and • porous pavement blocks. Each surface will be contained in a rigid fibreglass tank of approximately 1.8 x 0.9 x 0.9m in size. In order to eliminate the variability of contamination arising from spray operator activities each area will be ‘artificially’ contaminated by simulating losses based on the data obtained from the Cherwell project. A grid will be imposed on each surface and surface spots, spills, leaks and vehicle washing waste applied in a standard manner. Rainfall will be simulated to achieve a worst case event (e.g. 25mm in 24 hours) within 48 hours of application by applying irrigation in the absence of natural rainfall occurring. Subsequent natural rainfall will be allowed to fall on the areas.

R&D PROJECT RECORD P2-200/PR 28
Appropriate interception and collection for each surface will be established, e.g. surface runoff or drainage collectors. All water samples will be intercepted automatically. A data logger will record weather variables, timing of sampling and flow. The data logger will be accessed by telemetry to provide remote information on sampling and the ability to change sampling schedules. This methodology will allow the application of a number of pesticide active substances, (which may not be normally sprayed at that time or in a tank mix together) and the use of an inert tracer. Sampling will continue for at least 2 months to measure losses. Interception of surface runoff will be the main priority but since residues may remain or infiltration may have occurred samples will be taken by swabbing and coring to determine any final residues in surface and substrate at the end of monitoring. Flow and residue data will be combined to provide potential loss loadings for different surfaces. Control samples will be obtained from untreated areas for analytical purposes. The data capture team will advise when rainfall and flow events have occurred and samplers will normally be emptied and reset within 24 hours. Samples will be stored under appropriate conditions, i.e. refrigerated at 6°C or frozen prior to analysis according to storage stability requirements. The total number of samples collected will depend on the infiltration characteristics of the different surfaces, antecedent moisture conditions, rainfall, and the sampling strategy will be determined during a pre pesticide application period. Maximum total numbers analysed for all surfaces and each application event would be approximately 250, though the number would vary for each surface type. Six active substances will be investigated which represent typical spring and autumn applications to a cereal crop. These actives were chosen to complement the ongoing biobed work and also as they provide a good range of physico-chemical properties (Table 1.3). Table 1.3: Active substances and their physico-chemical properties Active substance
Koc (ml/g) DT50 (days) at 20-25°C
Water solubility (mg/l)
Vapour pressure (mPa) 25°C
Spring application Chlorothalonil 1380 30 0.6 0.076 Dimethoate 20 7 39800 0.25 Epoxiconazole 4400 100 6.6 <0.01 Autumn application Chlorpyrifos 6070 30 0.4 2.7
Isoproturon 100 25 65 3.15x10⁻³
Pendimethalin 5000 90 0.275 4.0
Sources: Wauchope et al (1992), Walker (pers.comm.), BCPC (1997). These small test systems will provide information on maximum concentrations from each surface and also the quantity of pesticide being washed off or leached from each surface.

R&D PROJECT RECORD P2-200/PR 29
1.9.2 Interim improvements to current practice This review has identified that immediate improvements could be made to yard practice: • only tank mix in an area where spills are contained such that they cannot enter a
water course or groundwater; • wash down spray equipment in the field; • apply internal tank washings to the treated crop in accordance with label
recommendations; • be prepared for accidental spillages and the actions required to prevent pollution; • take care not to create minor spills through glugging or dropping of seals; • rinse empty containers thoroughly, adding rinsate to the tank mix and store upright; • incinerate containers and packaging as soon as possible after use (legal position
being reviewed); • sweep the yard if contaminated mud is deposited and return to the treated field; and • store the sprayer under cover. General training and awareness of the importance of point sources of pesticide contamination of water sources should continue both at the farmer and spray operator level. It will be important to ensure key influencers such as agronomic advisors and local regulators from the Environment Agencies are aware of the issues. It is also essential to brief policy makers and regulators from the wide range of government departments and agencies who have responsibilities concerning pesticides of any significant developments within this project. To achieve this the Environment Agency described the project and its objectives at a press day on 17 May 2000. The project information sheet will be provided to members of the Pesticide Forum and all Steering Group members will promote the work of the project at events such as Sprays and Sprayers and Cereals.

R&D PROJECT RECORD P2-200/PR 30
2. STAGE 2 - EXPERIMENTAL SURFACE STUDIES 2.1 Introduction This chapter covers the work undertaken in Stage 2 of the project. In Stage 2 experimental assessments were conducted on the fate of pesticides, with varying physico-chemical properties, following simulated pesticide handling and washdown operations on different test surfaces. The test surfaces studied were: concrete, asphalt, hardcore, porous paving, soil/grass, biobed, biobed with a carbonaceous additive (replacing peat substitute component) and hardcore with a carbonaceous additive. The aim of this stage of the project was to compare how much of the pesticide is lost from the different test surfaces studied via runoff and throughflow. This will enable the suitability of different surfaces for pesticide handling and washdown areas to be determined and to provide a baseline data set to compare with results from comparable studies conducted on the new design in Stage 4. The aim of these experiments was to gain some simple results which can be used for comparative purposes, and that a high degree of statistical confidence was not required. The experiments and their results should be readily understood by farmers. 2.2 Test facility and HRI Wellesbourne The decision was taken by the Project Steering Group in May 2000 that all the test surfaces should be located at the same site to eliminate any local climatic differences that might become evident if a number of different geographical sites were included. All the test surfaces were located at Horticulture Research International (HRI) Wellesbourne. The purpose of the test facility built at HRI Wellesbourne was originally to enable six different surfaces to be tested to discover which is the most suitable for use in full-scale pesticide handling and washdown areas in the farmyard. In September 2000 two additional surfaces, incorporating a carbonaceous material known as “Jimsorb”, were installed at the facility at HRI Wellesbourne within a new contract with Jenkins Industrial Minerals. 2.2.1 Design of tanks and instrument pit The original six fibreglass tanks, 1.92m long by 0.91m wide by 0.61m deep were installed in holes dug in a straight line with 0.8m spacing in between them (Photo 2.1 and Figure 2.1). The tanks were installed such that they protruded approximately 5cm above the surrounding soil. The tanks were installed on a bed of sand and tilted to give a slope of 1.5% towards the front end. Along the front edge of the tanks a 10m wide by 1.5m long x 1.5m instrument pit was dug and lined with wood. The floor of the instrument pit was lined with 20cm depth of gravel. Once all the tanks and the wooden liner for the pit were in place soil was backfilled in around the tanks to ensure that a good contact was made between the tanks and surrounding soil. Each tank had a 60mm perforated drainage pipe installed running diagonally across its bottom. A hole was cut at the bottom front end of the tank to allow the pipe to carry water from the bottom of the tanks into a 27 litre removable glass leachate collector. This container is housed in a 68 litre plastic tank to enable the collection of any overflow. The additional two tanks containing Jimsorb were installed to exactly the

R&D PROJECT RECORD P2-200/PR 31
same specification as the rest and were located on the other side of the instrumentation pit. The surface temperature of all the surfaces was measured using a Campbell Scientific 107 temperature probe. The temperature 20cm below the surface was also measured in the biobed, biobed with Jimsorb and soil/grass tanks. For each surface a 6cm layer of 5mm pea shingle was laid in the bottom of the tank to cover the drainage pipe. This would permit water infiltrates through the overlying layers to drain out of the tanks and become available for sampling. This was covered with a 10/12 geotextile cut the exact size of the tank.
Figure 2.1: Experimental test surface tanks

R&D PROJECT RECORD P2-200/PR 32
0.91m
1.92m0.61m
Surface (1.5% slope)
To surface runoffCollector (where fitted)
To throughflow collector
Perforated drainage pipe
Figure 2.2: Schematic of experimental tank design Concrete surface 25cm of soil and 15cm of hardcore were laid in the base of the tank followed by 2.5cm of sand. A plastic damp proof membrane was laid on top of the sand followed by 10cm of concrete, which was mixed on site by hand. The mix consisted of 3 parts by volume Ordinary Portland cement, 4 parts sand and 7 parts 20mm aggregate, which is equivalent to a RC35 designated mix or ST5 standard mix. The surface of the concrete was ribbed, perpendicular to the direction of the slope. A gutter was sunk into the concrete along the front edge of the tank to enable the collection of surface runoff. To measure the amount of surface runoff the end of the gutter is piped to an ADAS tipping bucket flowmeter calibrated to tip when 0.7 litres of water enters the bucket. This is then collected into a ‘U’ bend device, from which water samples could be collected, and this was then allowed to outfall into a 67 litre plastic tank. A plastic cover was installed over the flowmeter to prevent rainfall diluting the sample. Asphalt surface 25cm of soil and 15cm of hardcore were laid in the base of the tank followed by 2.5cm of sand. Another sheet of 10/12 geotextile membrane was then added followed by 5cm of asphalt, supplied by a local builders merchant. The asphalt was compacted using a vibrating compactor, hired locally.

R&D PROJECT RECORD P2-200/PR 33
A surface collection system identical to that used on the concrete tank was installed. Hardcore surface 35cm of soil and 15cm of locally supplied hardcore were laid in the base of the tank and compacted using a hired compactor. Porous paving block surface 20cm of hardcore was laid in the base of the tank and compacted with the hired compactor. Next 15cm of 20mm gravel was added and then a layer of 10/12 geotextile. On top of this 5cm of 5mm gravel was laid. The porous paving blocks, supplied by Aquaflow, were laid in a normal interwoven pattern. Soil/Grass surface 45cm of soil was laid in the base of the tank with turf laid on the surface. Biobed The tank was filled with a wheat straw, peat substitute and topsoil mix in 50:25:25 proportions. The materials were well turned by hand to ensure even mixing. Turf was then laid on the surface to within approximately 5cm of the tank top. Biobed with Jimsorb carbonaceous material added The tank was filled with a wheat straw, Jimsorb (replacing the peat substitute component) and topsoil mix in 50:25:25 proportions. Jimsorb is a carbonaceous material that is a by-product of the China Clay Industry. The materials were well turned by hand to ensure even mixing. Turf was then laid on the surface to within approximately 5cm of the tank top. Hardcore with Jimsorb carbonaceous matter added 35cm of soil and 15cm of a hardcore/Jimsorb mix (in ratio 75%/25%) were laid in the base of the tank and compacted using a hired compactor. 2.2.2 Datalogging and automatic water sampling equipment A Campbell CR10X datalogging system was installed in the site hut. This collected data from the two tipping bucket flowmeters, a 0.2mm tipping bucket raingauge and 12 temperature probes every 5 minutes. It also controlled two Epic automatic water samplers which collected runoff water from the concrete and asphalt surfaces. Each sampler was programmed to empty the 2 litre sample container on the outfall from the tipping bucket every time the bucket tipped twice (i.e. every 1.4 litres of flow). The sample was collected into a one litre darkened glass Winchester bottle. A Siemens M20 GSM modem was used to enable data to be remotely collected from the site datalogger. Data were downloaded daily and stored on the ADAS Gleadthorpe

R&D PROJECT RECORD P2-200/PR 34
fileserver. Mains power was provided in the site hut to trickle charge the batteries which powered the instrumentation systems. 2.3 Experimental Methodology In order to eliminate the variability of contamination arising from spray operator activities each area was ‘artificially’ contaminated by simulating pesticide losses based on the data obtained from the Cherwell project. A grid was imposed on each surface and representative surface spots, spills, leaks and vehicle washing waste were applied in a standard manner to specific grid squares. Rainfall was simulated (when necessary) to achieve a worst case event (e.g. 25mm in 24 hours) within 48 hours of an application by adding irrigation water. Subsequent natural rainfall was allowed to fall on the test areas. Appropriate interception and collection systems for each surface were established, whether for surface runoff or for throughflow moving vertically downwards through the test surface layers in the tanks. All water samples were intercepted automatically into glass water containers. A data logger recorded rainfall, timing of automatic sampling and surface runoff flow rates. The data logger was accessed by telemetry to provide remote information on sampling and the ability to change sampling schedules. Sampling continued for at least one month after each application of pesticides to measure losses. When all applications were completed some destructive sampling was undertaken on the surfaces to measure the amount of pesticide residues left following drainage and throughflow occurrences. Six pesticides were chosen to be applied to the test surfaces. They represented a range of physico-chemicals properties (Table 2.1), with three that would normally be applied in the spring period and three that would normally be applied in the autumn period. Table 2.1: Active substances and their physico-chemical properties Active Koc
partition coefficient Soil DT50 half-life
Water Solubility
Vapour Pressure
(ml g-1) (days) (mg l-1) (mPa)
Spring Application
Chlorothalonil 1600–14000 5–36 0.81 0.076 Dimethoate 16–52 2–4.1(Aerobic) 23.3 0.25 7–16 (Photolytic) Epoxiconazole 957–2647 60–90 6.6 <0.01
Autumn Application
Chlorpyrifos 1250–12600 10–120 (Lab.) 1.4 2.7 35–56 (Field) Isoproturon 120
(Brown et al, 1995) 6–28 65 0.0008
Pendimethalin 5000 90–120
(Walker & Bond, 1977)0.3 4.0
Source: The Pesticide Manual (2001), C.D.S.Tomlin.

R&D PROJECT RECORD P2-200/PR 35
The first application of pesticides took place to the six original test surfaces on 7 June 2000. Only the three normally spring applied chemicals were used (namely dimethoate, chlorothalonil and epoxiconazole). The application rates represented the scaled-down Cherwell project findings on spills, drips, dilute sump liquid and sprayer washings when applied to the much smaller test surfaces (Mason et al., 1999). For the second application (on 13 October 2000) all six pesticides were applied, three for spring (dimethoate, chlorothalonil and epoxiconazole); and three for autumn (isoproturon, pendimethalin and chlorpyrifos) at the same scaled down application rates as observed from the Cherwell project. All eight test surfaces were available for this and subsequent applications. The third application (on 5 December 2000), of all six pesticides, represented all the Cherwell pesticide losses onto the farmyard and was not scaled down to the size of the test surface. This third application therefore represented the worse case scenario. 2.4 Results 2.4.1 First Application (three spring applied pesticides) The first application of pesticides to the original six test surfaces took place between 7 June and 1 August 2000. During the test period 76.6mm of rainfall fell on the site. Summary results, ranking the performances of the surfaces, are given here with more comprehensive results in Appendix 2.1. On 1 August 2000 three of the test surfaces were thoroughly wetted up so that they produced some drainage. 112 litres, 133 litres and 42 litres of water were applied to the biobed, soil/grass and hardcore surfaces respectively (equivalent to 64.1mm, 76.1mm and 24.0mm rainfall respectively). This action was taken because it was felt that the layers in the experimental tanks were probably drier (when installed) than would be expected during normal spring or autumn pesticide application periods.
Figure 2.3: First application – test surface performance
0.00
0.05
0.10
0.15
0.20
0.25
0.30
0.35
0.40
Biobed
Soil/gr
ass
Hardco
re
Asphalt
Porou
s pav
ing
Concre
te
Tot
al lo
ss o
f pes
ticid
e (%
app
lied
per
mm
rai
nfal
l)

R&D PROJECT RECORD P2-200/PR 36
2.4.2 Second Application (three spring and three autumn applied pesticides) This element of the study took place between 13 October 2000 and 21 November 2000 and involved all eight test surfaces. During the test period 134.4mm of rainfall fell on the site. Summary results, ranking the performances of the surfaces, are given here with more comprehensive results in Appendix 2.2.
Figure 2.4: Second application – test surface performance 2.4.3 Third Application (six pesticides - worst case scenario) This element of the work took place between 5 December 2000 and 7 February 2001. During this test period 140.2mm rainfall fell on the site. Summary results, ranking the performances of the surfaces, are given here with more comprehensive results in Appendix 2.3.
Figure 2.5: Third application – test surface performance
00.10.20.30.40.50.60.70.80.9
1
Biobed
Jimsor
b biobed
Soil/gr
ass
Jimsor
b hardco
re
Hardco
re
Asphalt
Porou
s pav
ing
Concre
te
Tot
al p
estic
ide
loss
(%
app
lied
per
mm
rai
nfal
l)
00.10.20.30.40.50.60.70.8
Biobed
Soil/gr
ass
Jimsor
b biobed
Jimsor
b hardco
re
Hardco
re
Asphalt
Porou
s pav
ing
Concre
te
Tot
al lo
ss o
f pes
ticid
e (%
app
lied
per
mm
rai
nfal
l)

R&D PROJECT RECORD P2-200/PR 37
2.4.4 Destructive sampling of test surfaces Following the third application a decision was taken by the Project Steering Group to end the experimental applications of the test pesticides and to undertake some destructive sampling of all the surfaces (by swabbing or coring) to ascertain where in the tanks any remaining pesticides residues resided following runoff or throughflow. Swabbing or coring was not possible from the two hardcore surfaces. Table 2.2: Pesticide residues remaining on hard surface layers µg cm-2 residue remaining on surface layer Surface dimethoate chlorothalonil isoproturon chlorpyrifos pendimethalin epoxiconazole Asphalt 0.08 12.16 0.88 30.60 91.34 5.42 Concrete 0.02 0.01 BDL 0.02 0.07 BDL Porous Paving
BDL 0.13 BDL 0.05 0.69 BDL
Note: BDL = Below detection level The results from the swabs indicate that the physico-chemical composition of the asphalt surface enables it to retain pesticides with high Koc’s, namely chlorpyrifos and pendimethalin. Both these pesticides also have reasonably long half-life’s. Very small residues were found remaining on the other two hard surfaces. Table 2.3: Pesticide residues remaining in surface cores Soil/Grass µg cm-2 residue remaining in core section Depth dimethoate chlorothalonil isoproturon chlorpyrifos pendimethalin epoxiconazole 0-5cm 0.35 105.07 32.59 39.40 172.80 17.58 5-10cm 0.05 6.18 6.18 4.42 21.33 0.30 10-15cm 2.00 5.16 2.63 5.71 29.05 0.25 15-20cm BDL 0.33 BDL 2.09 11.80 BDL Biobed µg cm-2 residue remaining in core section Depth dimethoate chlorothalonil isoproturon chlorpyrifos pendimethalin epoxiconazole 0-5cm 0.23 66.37 37.87 39.55 181.16 15.76 5-10cm 0.14 5.20 12.38 4.34 17.38 0.61 10-15cm 2.30 5.20 69.63 20.90 45.73 1.86 15-20cm 8.91 3.41 29.68 22.98 54.88 0.57 20-28cm 1.74 4.69 3.45 17.17 48.49 BDL Jimsorb Biobed
µg cm-2 residue remaining in core section
Depth dimethoate chlorothalonil isoproturon chlorpyrifos pendimethalin epoxiconazole 0-4cm 7.96 56.29 95.54 26.78 130.52 12.62 4-8cm 7.56 11.38 57.53 4.61 18.04 1.19 Note: BDL = Below detection level

R&D PROJECT RECORD P2-200/PR 38
The most abundant pesticide residue measured in the cores was the highly sorbtive pendimethalin, with the largest amounts remaining in the top 5cm layer of the core. The other two sorbtive pesticides, chlorpyrifos and chlorothalonil, together with epoxiconazole showed a similar pattern of occurrence in the core, with the majority remaining very near the surface. Perhaps a slightly unexpected result was the amount of isoproturon remaining in the two biobeds at levels similar to the far more sorbtive pesticides. The evidence from the drainage water samples did however show that it was not leaving the biobeds with high concentrations. This isoproturon will continue to degrade within the biobed matrix. Dimethoate, with a short half life and low Koc, was generally found in low amounts in all the cores and swabs. 2.5 Discussion and Conclusions All the test surfaces provided a substantial improvement over the performance of the concrete surface, which is still in use on many farms as the main constituent of a pesticide handling and washdown area. The Environment Agency are very keen to see the level of maximum concentrations of individual pesticides leaving the surfaces as runoff or throughflow kept below 0.1µg/l as much as possible, as this is a requirement as part of the EU Groundwater Regulations and Drinking Water Directive. Over the three applications the traditional biobed was the most efficient at removing pesticides from drainage water. Its performance with the much higher application rates in the third application were particularly encouraging. Over 1000 times less pesticide was lost from the biobed than from the concrete surface and very few exceedences of the 0.1µg/l concentration for a single pesticide were measured. The soil/grass surface also performed very well. The measurement of runoff from the concrete surface was not as high as would be expected. There is a possibility that some water has bypassed the water collection system via cracks between the concrete surface and the surrounding fibreglass or plastic materials. However, if more water had been measured then the total losses of pesticides from this surface would have been even worse. The Jimsorb biobed did not perform as well as the traditional biobed during the course of second and third applications. This may be due to the fact that the Jimsorb replaced the peat substitute in the mixture and the peat substitute may naturally have a higher adsorption potential for removing pesticides than Jimsorb. In addition, the traditional biobed mix was three months older than the Jimsorb biobed mix and therefore due to maturation processes (e.g. increased microbial biomass and activity) in this type of mixture then it might be expected to have a higher pesticide removal capacity. The Jimsorb hardcore surface performed in a very similar way to the traditional hardcore surface with similar total losses and maximum concentrations of the pesticides investigated. The porous paving surface did not perform well in these tests. Porous pavements are designed to remove any surface water quickly (e.g. from roads, car parks, pavements

R&D PROJECT RECORD P2-200/PR 39
etc.) and move it into more permeable layers underneath. In these experiments the water together with some pesticides was able to easily move to depth through the porous paving, rather than providing some storage in which in situ pesticide degradation could take place. Based on these results it would be extremely difficult for the Project Steering Group to justify the inclusion of Jimsorb into a standard biobed design for this project. However, we do believe that Jimsorb could be a useful tertiary treatment in certain circumstances for pesticide handling and washdown areas. For example, a layer of Jimsorb underneath an unlined biobed (if authorised by the EA in the future) may provide additional protection to the underlying groundwaters. Some testing of Jimsorb in this situation would be needed before this could be implemented into any design manual. More research on options for biobed design and biobed mixtures is also recommended. This work could be undertaken at the existing instrumentation facility based at HRI Wellesbourne. The fibreglass tanks containing the existing surfaces and underlying layers could very easily be removed and replaced by alternatives. 2.6 Recommendations The recommendation from this experimental work is to develop and test designs for full-scale pesticide handling and washdown areas on farms based on biobed and soil/grass systems. Both a bunded concrete area draining to a biobed and a drive-on biobed (as originally developed by Torstensson in Sweden) should be investigated over a number of representative pesticide application periods.

R&D PROJECT RECORD P2-200/PR 40
3. STAGE 3 - SPECIFICATION FOR FULL-SCALE FACILITIES 3.1 Background The objective of Stage 3 was to take the findings from the Stage 2 experimental tank studies and investigate the design options for scaling up to full farm-scale pesticide handling and washdown areas. This chapter outlines the decisions involved in proposing the surfaces included, sizes required, practical adoption issues and suggested specifications for three options to be considered under Stage 4 of the project. 3.2 Selected Surfaces When the surfaces investigated in Stage 2 were ranked in terms of their ability to retain and degrade pesticides then the use of a biobed system clearly requires further examination. Closely following this performance is that achieved by grass over soil. Thus whilst it would be possible to include other surfaces the most likely success is sought by only including biobed and soil/grass systems for comparative purposes. The manner in which these surfaces are used suggests that pesticide handling and washdown areas could either be as a concrete intercepted area feeding a biobed or be directly over a biobed, in the form of a drive-over biobed. In addition, a concrete intercepted area to soil/grass is also proposed. 3.3 Size of Area Required The minimum area over which a sprayer may safely be serviced (e.g. filled, chemicals added, minor adjustments etc) was suggested by studying a range of mounted, trailed and self propelled sprayers on the market. Manufacturer specifications only include the base dimensions of the main body of the sprayer, not those applicable to the extremities of a machine with its booms folded. Studies have suggested typical contamination levels found on the various surfaces of tractors and self-propelled vehicles. A pesticide handling and washdown area could allow for the whole vehicle to be adequately parked on any pad. In addition to these measurements a working room allowance was suggested for access by the operator around the vehicle. This working allowance was considered as 0.5 m to the front of the vehicle and 1 m to the sides and rear of any spraying machine where most operator attention would be focused. The maximum sizes proposed from measurements typified from Appendices 3.1 and 3.2 are given below: Sprayer type Overall Length (m) Overall width (m) Self propelled sprayer 10 #(7) 5 Trailer 7 5 Mounted 4 5 # The maximum length was only found with one unit in Appendix 3.2. The mean of all others was 6.7 m. For the purposes of scaling up for self-propelled sprayers it is

R&D PROJECT RECORD P2-200/PR 41
therefore proposed that the overall length of the intercept area be 7 m. For a few sprayers this may allow the cab front of a vehicle to overhang the intercept area which has been shown to contribute little to any contamination issue. 3.4 Type of Area Thus to meet the three size options above the following options were suggested. 1. Concrete Surface, i.e. essentially non – porous,
-with roof -without roof
both to intercept all handling area deposits to biobed 2. Porous Area, drive-over biobed 3. Concrete Surface, i.e. essentially non – porous,
-with roof -without roof
to intercept all handling area deposits to soil/grass area 3.5 Roof Cover Few projects concerned with biobed operation have considered the option of a roof cover. Reports of unsuccessful operation, i.e. waterlogging of biobed matrix, raised concerns as to whether a roof would be an appropriate consideration. A roof controls the amount of non-washing water entering the area and affords protection to the sprayer. This further reduces the potential contamination of the surrounding area. Therefore simple roofed options were considered and costed, checking both practical relevance and economic justification to commercial operations. Roof options include: • full Portal frame; • lean to framed structure; • polythene tunnel; and • polythene roof over straw bale walls. All roofs would have to allow operator height above any sprayer. Roofing costs and practical issues are noted below: • A roofed portal frame building of structural steelwork is suggested at £ 4,500 +
VAT. The cost is high due to the lack of scale penalising a probable 2 x 6 m bay of only 6 m width.
• Roofed lean to existing structure, probably saves £1000 on the above but relies heavily on available current structure and eaves height.

R&D PROJECT RECORD P2-200/PR 42
• A trellis-dome polytunnel (see Appendix 3.3). A simple structure sized to include standard polytunnel dimensions reduces the cost to £1300 + VAT.
• Poly roof – straw bale wall (see Appendix 3.4). To reduce costs when covering the concrete area, a polytunnel roof section could be mounted over straw bale walls. The latter would be of the Hesston Bale type, stacked 3 high. The internal faces of the bales to be covered with plastic sheet > 500g. (See Appendix 3.3) Cost for roof area approx. £1000 plus straw value and labour - £100 = Total £1100 + VAT on roof materials
Justification for roof Due mainly to economics and some limitations in siting and acceptance in the commercial field this question was re examined. Reference to early failures suggested that these had occurred due to excessive ingress of water onto the intercept area, and thus the biobed area became flooded. In the cases examined it was concluded that no attempt had been made to limit rainwater ingress onto the intercept area. This has the same effect as when livestock farmers try to limit foul water production. Having considered the above it was agreed that for Stage 4 none of the commercial scaling up options should include roofing. Bunding of intercept areas and flow control though the biobed should be planned to manage the biobed moisture status. 3.6 Intercept Systems Proposed From the original proposals excluding roofed options the following remain: 1. Concrete Surface, i.e. essentially non – porous, to intercept all handling area deposits to biobed 2. Porous Surface, drive over biobed 3. Concrete Surface, i.e. essentially non – porous, to intercept all handling area deposits to soil/grass area Each of these systems represents a practical possibility within many farm situations. Given that the results of the experimental scale up match the preceding trialled surfaces, each of the systems could be implemented without major cost or practical limitations within farmyard areas. The following simple summaries include suggested outline specifications for commercial adoption on farm. Concrete intercept to biobed 150 mm thick RC 45 mix concrete with either 1 layer mesh reinforcement, BS pattern A252 or polypropylene fibre reinforcement on a 1200g dpm on 25 mm thick sand blinding on a minimum 150 mm thick well compacted hardcore. 7 m x 5 m area. The slab shall be laid to falls of not less than 1 in 50 to a channel laid to falls direct to a trapped gulley with connection to a biobed via gravity or pump. Excavate as necessary to allow for a 5 m x 4 m x 1 m pit (Appendix 3.5). Fill pit with compost, soil and chopped straw. Fill area to ensure 50 mm proud of normal ground level prior to use. Provide compost / straw for top up.

R&D PROJECT RECORD P2-200/PR 43
Cost £1080, Biobed excavation, filling and fencing off, approximately £350. Total £1430 If an impermeable liner is needed then this would cost an additional £1000-£1500. Drive-over biobed Excavate as necessary to allow for a 7 m x 5 m x 1 m pit. Fill pit with compost, soil and chopped straw. Fill area to ensure 50 mm proud of normal ground level prior to use. Provide compost / straw for top up. Cost Excavation only £350, total not determined until compost straw mix known. Grid cost, variable dependent whether proprietary or home build from second hand materials and ground works for grid support required. (Proprietary possibly £3000-5000, home build under £1000). Total cost variable - approx. £4000. If an impermeable liner is needed then this would cost an additional £1000-£1500. Concrete intercept to soil/grass area 150 mm thick RC 45 mix concrete with either 1 layer mesh reinforcement, BS pattern A252 or polypropylene fibre reinforcement on a 1200g dpm on 25 mm thick sand blinding on a minimum 150 mm thick well compacted hardcore. 7 m x 5 m area. The slab shall be laid to falls of not less than 1 in 50 to a channel laid to falls direct to a trapped gulley with connection to a soil grass area via gravity or pump. Cost £1080 plus some fencing cost for soil grass area, i.e. £ 80 Total £1160 If an impermeable liner is needed then this would cost an additional £1000-£1500. The excavation of the hole for the liner would also cost an additional £300. 3.7 Experimental Scale Up The following proposals include many aspects which only appear due to the experimental nature of Stage 4 of this project. An essential feature of these recommendations is that all three proposals will include liners to the biobeds and soil/grass matrix. This being required to avoid soil water contamination in the event of unscheduled failure. Also required are interception chambers for flow meter/pump location further linked to holding tanks to ensure water control to the biobed and soil/grass areas and holding reservoirs to control discharge to the field designated disposal area. The design of each proposed system may be better understood by reference to the schematic representations given within Figures 4.1 - 4.3. This also covers the location and siting issues.

R&D PROJECT RECORD P2-200/PR 44
3.7.1 Location The three proposals were discussed with a Lincolnshire farmer who offered three independent sites within one business where two self propelled sprayers are used. The limitations on variabilities found across business and sites were judged to be reduced and agreement to site the three proposed pesticide handling and washdown areas within the business was made. A site visit was conducted in April 2001, Appendix 3.6 presents the site visit report. 3.7.2 Design specifications Each proposal was planned to suit each nominated site, which caused some variations to an ideal design in each case. However, these issues are common to many farm locations, e.g. location of pesticide store, proximity to water source, current routines, topography of site, footpaths and existing farm storage not necessarily involved with pesticide handling operations. The specifications for each site are given in Appendices 3.7-3.9 (Appendix 3.7 Concrete Intercept to Biobed; Appendix 3.8 Drive-over Biobed; Appendix 3.9 Concrete Intercept to Soil/Grass).

R&D PROJECT RECORD P2-200/PR 45
4. STAGE 4 - FULL-SCALE DESIGN TRIALS 4.1 Background The objective of Stage 4 of the project was to take the design recommendations from Stage 3 and construct some new full-scale pesticide handling and washdown areas with integrated monitoring instrumentation. The experimental tank investigations undertaken in Stage 2 of the project had clearly shown that bioremediation systems based on a biobed (comprising peat-free compost, topsoil and straw) or a biological active loamy soil bed, both with a grass turf cover, were very effective at retaining and/or degrading a suite of pesticides with a range of physico-chemical properties. These treatment systems provided a very favourable environment for physical, chemical and, especially, biological degradation of the pesticides. The three designs chosen for full-scale construction were: • concrete intercept draining to a biobed; • drive-over biobed; and • concrete intercept draining to a soil/grass area. Due to operational and logistical considerations all three pesticide handling and washdown areas were constructed on the same agricultural enterprise in Lincolnshire, which ran spraying operations from three existing sites which could be adapted for experimental purposes. The maximum distance between any two sites was 5km. This chapter details the construction, operation, management and initial monitoring of the three sites. Information and data collected during this stage of the project will be fundamental to the development of the comprehensive design manual for pesticide handling and washdown areas in Stage 5. 4.2 Site Construction & Instrumentation A detailed design specification for each site was produced in Stage 3 of the project. The three designs were: a) concrete intercept to biobed, b) drive-over biobed, and c) concrete intercept to soil/grass area. Some relatively minor revisions to the designs were necessary, due to local conditions prevailing at each site, and following discussions with the site owner and farm manager. Local sub-contractors were employed to construct the sites and provide a power supply for the instrumentation, under the supervision of ADAS staff. The ADAS Field Instrumentation Group (based at ADAS Boxworth, Cambs) designed and installed all the monitoring equipment (incorporating flowmeters, automatic water samplers, raingauge and data loggers). All construction and installation work complied with all the appropriate Health and Safety and Electrical Regulations. ADAS was required to apply for a Groundwater Regulations Authorisation for the disposal of discharge liquid from each of the sites to a designated area of land nearby. The Authorisation (Ref No. GWNLF/41022), covering all three sites was received from the Agency on 20 August 2001.

R&D PROJECT RECORD P2-200/PR 46
Construction commenced in February 2002 and the sites were commissioned for use by the farm in April 2002. A schematic diagram of each is given in Figures 4.1, 4.2 and 4.3. A photo of each site is given in Figures 4.4, 4.5, and 4.6.

R&D PROJECT RECORD P2-200/PR 47
Bunded concrete intercept area 7 x 5 m
Gravity drainage
Flowmeter + Autosampler + Pump 3m3 primary
tank, 2 walled
Electric pump in tank
Drip irrigation over biobed
Lined biobed 5 x 4 m x 1 m deep
Outlet from biobed + Flowmeter + Autosampler + Pump
5m3 secondary tank 2 walled
Pumped out to disposal area, drip irrigation
Collect Buffer and transfer Biobed Hold / Disposal
Figure 4.1: Schematic of concrete intercept to biobed

R&D PROJECT RECORD P2-200/PR 48
Drive over steel grid approx. 8 x 6 m, covered with mesh 100 mm x 40 mm
Biobed, 7 x 5 x 1 m deep.
Liner
Outlet from biobed
Flowmeter + Autosampler + Pump transfer
5 m3 secondary tank 2 walled
Pump out to disposal area, drip irrigation
Collect / Biobed Transfer / Hold / Disposal
Figure 4.2: Schematic of drive-over biobed

R&D PROJECT RECORD P2-200/PR 49
Bunded concrete intercept area 7 x 5 m
Gravity drainage
Flowmeter + Autosampler + Pump 3m3 primary
tank, 2 walled
Electric pump in tank
Lined soil/grass area 5 x 4 m x 1 m deep.
Outlet from liner + Flowmeter + Autosampler + Pump
5m3 secondary tank, 2 walled
Pump out to disposal area, drip irrigation
Collect Buffer and transfer Grass / soil area Hold / Disposal
Drip irrigation over soil/grass area
Figure 4.3: Schematic of concrete intercept to soil/grass area

R&D PROJECT RECORD P2-200/PR 50
Figure 4.4: Concrete intercept to biobed
Autosampler housing
Pre-disposal Storage tank Drive-over biobed
Concrete intercept area
Biobed
Figure 4.5: Drive-over biobed

R&D PROJECT RECORD P2-200/PR 51
Figure 4.6: Concrete intercept to soil/grass area Holes were excavated and the two biobeds and the soil/grass area were fully lined with 1000 TFS Monarflex Geomembrane (butyl rubber), laid on F32 Fibretex (geomembrane) to reduce puncture risk, and all underlain by a 25mm thickness of sand blinding on top of the surrounding soil. All the biobeds and soil/grass areas were fully lined for experimental purposes to enable samples to be collected of the leachate that had infiltrated and percolated through the organic matrices. The biomix used in the two biobeds was created on one of the farm sites on 19 February 2002 by mixing straw (50% by volume), local topsoil - silty clay loam (25% by volume) and a peat-free compost – Arthur J Bowers New Horizon multi-purpose compost (25% by volume). This was left to mature and compost in the farmyard for 3-4 weeks prior to being loaded into the biobed liners. By the time the sites were commissioned for use by the farm on 24 April the biomix was 9 weeks old. The volume of biomix added to the biobed system connected to the concrete intercept pad was approximately 10.5m3; whilst the volume of biomix in the much larger drive-over biobed was approximately 20.5m3. This was expected to slump naturally over time and would require an annual top-up of fresh biomix. The biomix in both biobeds was covered in grass turf derived from a long-term pasture field at ADAS Gleadthorpe. The soil that was loaded into the soil/grass liner was a silty clay loam topsoil derived locally from the farm. The volume of soil placed in the liner was approximately 13m3, as the soil was slightly domed above the local ground level. Like the biomix the soil was covered in grass turf derived from a long-term pasture field at ADAS Gleadthorpe. Pumps had to be installed at each site to transport the runoff/drainage water between treatment system components. Particular attention was given to the automation of the pumping systems, whilst also allowing manual intervention and override whenever
Concrete intercept area
Soil/grass area

R&D PROJECT RECORD P2-200/PR 52
necessary. The pumps had both float switch and timer switch activation to make the most efficient use of the storage tanks within the systems prior to the application, via drip irrigation, to either the biobed/soil area or to the designated disposal area. The submersible pumps chosen were widely available from industrial outlets or domestic pond equipment suppliers, were able to deliver up to 120l/min flow rate and work up to a maximum head height of 6m. The use of drip irrigation over the surface of the biobed/soil area allowed the pesticide laden runoff water to be distributed evenly across the entire surface area of the treatment system, thereby maximising the potential for pesticide retention and degradation processes to take place. Water flow from the concrete intercept areas and leachate flow from the biobed and soil/grass areas was measured by a tipping bucket flowmeter system linked to a dedicated data logger. The drive-over biobed was sampled via the leachate flow only. Automatic water samplers (each with a 23 x 1 litre darkened glass bottle capacity) were set up to sample these waters. Water samples were collected by these automatic samplers each time a set volume of flow had passed through the tipping bucket systems. This sample trigger volume was altered during the course of each monitoring period to limit the total number of samples collected. Generally, more samples were collected in the first 2 weeks of a monitoring period, following the artificial application of pesticides to the sites, than in the subsequent 6 weeks. ADAS staff visited the site at least once per week following the monitoring periods to collect samples, download data from loggers and maintain the sites. A logged tipping bucket raingauge was installed at the concrete intercept to biobed site. In addition to the data collected from the ADAS instrumentation on-site, extra information was gathered from the farm. This included daily rainfall from a manually recorded raingauge, all pesticide applications to the farm areas serviced by the three new handling and washdown sites and any washdown operations. During the course of the monitoring periods it became apparent that all washdown operations (exterior surfaces of the sprayer), using a pressure washer, were actually only being undertaken at one of the new sites (concrete intercept to biobed). Previous work on on-farm bioremediation systems has highlighted the importance of water management on the overall treatment performance. The amount of water passing through the bioremediation element of the pesticide handling and washdown site must be controlled to maximise its potential to retain and/or degrade pesticides. In addition, the biomix/soil area must not be allowed to become totally saturated for any length of time because this would severely limit the pesticide degradation processes. The biomix/soil areas should therefore be relatively free draining. Biobed/soil treatment systems connected to concrete intercept areas need to be able to cope with the direct rainfall falling on both the concrete intercept area (38.7m2) and the biobed/soil area (20m2) combined. At the test sites this amounted to a total surface area of 58.7m2. The drive-over biobed, without any concrete intercept area, only had the surface area of the biobed (45m2) for the entry of direct rainfall, which was approximately 25% less than the total surface area of each of the other two sites. To put the input of water from the concrete intercept areas into context – each 1mm of rain falling on the concrete surface produces approximately 39l of runoff (assuming no losses due to infiltration into concrete surface, direct evaporation from the concrete surface, leakages, etc.). Extra water can also enter the treatment systems following any

R&D PROJECT RECORD P2-200/PR 53
pesticide handling and washdown operations. The incorporation of a number of water storage components within the design of the three test sites permitted a reasonable level of control over the water management within the treatment systems. 4.3 Artificial Applications During the construction of the sites in early 2002 discussions took place within the Project Steering Group (PSG) as to what pesticides should be analysed for. At first there was agreement that the water samples generated at the sites should be analysed for pesticides which were actually being used on the farms. However, to allow the necessary analytical method development and validation work to take place prior to the collection of the samples it was necessary to attempt to predict what pesticides would be used during 2002. Detailed discussions with the farm owner, farm manager and farm agronomist proved that it was not possible to predict with enough certainty which pesticides would be used. The PSG then decided in spring 2002 that much more useful data would be produced if some artificial applications to the test sites were made using the same pesticide suite as was utilised in Stage 2 of the project. These pesticides were: isoproturon (herbicide), pendimethalin (herbicide), chlorothalonil (fungicide), epoxiconazole (fungicide), dimethoate (insecticide) and chlorpyrifos (insecticide). In addition, it was considered useful to include within the site investigations one pesticide that was confidently predicted to be used in normal agricultural practice on the farms during 2002. This pesticide was the fungicide, azoxystrobin. Azoxystrobin was not artificially applied with the other six pesticides, it was only included as a determinand in the water sample analysis suite. The above pesticides have a range of physico-chemical properties (Table 4.1) which will influence their fate and behaviour, both on the concrete intercept areas and when they enter the bioremediation systems. The PSG decided that the most appropriate way to test the new bioremediation systems was to use a worst-case scenario (i.e. a very heavy load of pesticides in a short period of time), based on the results from Stage 2 of the project. The worst-case scenario represented the equivalent of the expected possible pesticide contamination arising from 16 individual tank mixes on one day. A set of controlled mixtures were formulated with known pesticide concentrations and volumes to represent four possible contamination sources (Tables 4.2 and 4.3), namely: 1. dropped foil seals from pesticide packaging (spray concentrate); 2. faulty valves/nozzles/hoses (spray suspension); 3. sump rinsate; and 4. washdown liquid. For each of the contamination sources above a simulated 16 tank mixture containing the possible contamination from each of the six pesticides were formulated in three new glass bottles (one for each site). In reality, all four mixtures were applied to a site within a very short time period that only lasted approximately 30-45 minutes. This exercise therefore represents a very severe test of the ability of the bioremediation systems to remove pesticides from water. This level of contamination is extremely unlikely to happen during the normal agricultural usage of these systems, perhaps with the exception of a significant spillage of pesticide concentrate.

R&D PROJECT RECORD P2-200/PR 54
Mixtures 1, 2 and 3 were applied by hand from new glass bottles (Figure 4.7). These mixtures were applied to specific locations on the new pesticide handling and washdown areas where it would have been expected that the particular contamination source would fall. Mixture 4) was applied through a small portable petrol driven sprayer with a hand lance across the entire pesticide handling and washdown area to represent the washing down of the entire sprayer (Figure 4.8). Two artificial applications were made to the three sites – one on 6 June 2002 and another on 12 September 2002. A two month monitoring period followed each application. All samples collected from the site were suitably labelled and transferred to the cold store at ADAS Gleadthorpe for temporary storage. At an appropriate time a large batch of samples was then transported by ADAS from Gleadthorpe to the contract analytical laboratory (Synergy Laboratories Limited), where they were stored in a cold store prior to analysis. Table 4.1: Test pesticides and their physico-chemical properties Pesticide Koc
partition coefficient Soil DT50 half-life
Water Solubility
Vapour Pressure
(ml g-1) (days) (mg l-1) (mPa) Chlorothalonil 1600–14000 5–36 0.81 0.076 Dimethoate 16–52 2–4.1(Aerobic) 23.3 0.25 7–16 (Photolytic) Epoxiconazole 957–2647 60–90 6.6 <0.01 Chlorpyrifos 1250–12600 10–120 (Lab.) 1.4 2.7 35–56 (Field) Isoproturon 120
(Brown et al, 1995) 6–28 65 0.0008
Pendimethalin 5000 90–120
(Walker & Bond, 1977)
0.3 4.0
Azoxystrobin 500 48-84 (Lab)
7-56 (Field) 6 <0.0001
Source: The Pesticide Manual (2001), C.D.S.Tomlin.

R&D PROJECT RECORD P2-200/PR 55
Table 4.2: Pesticide application volumes and concentration ranges in the test mixtures Contamination source Volume applied
(l) Pesticide concentration range (µg/l)
Spray concentrate 0.4 250,000-4,000,000 Spray suspension 4 62,000-1,000,000 Sump rinsate 25 25,000-400,000 Washdown liquid 150 220-3,600
NB. The individual pesticide concentrations varied considerably according to the product used and the label application rate. Table 4.3: Total amount of pesticide applied in all four test mixtures on one application day Pesticide Total applied (mg) Isoproturon 12105 Chlorothalonil 12105 Dimethoate 2582 Epoxiconazole 1009 Chlorpyrifos 5810 Pendimethalin 16140
Figure 4.7: Application of sump rinsate mixture to concrete intercept

R&D PROJECT RECORD P2-200/PR 56
Figure 4.8: Application of washdown liquid mixture to concrete intercept using hand sprayer 4.4 Normal Farm Applications & Washdown The farming enterprise on which all three test sites were located provided ADAS with information on pesticide usage at each of the three sites for the period from April 2002 until November 2002. Pesticide handling activities, prior to application response to pest and disease problems on the farms, and subsequent washdown were undertaken at the sites, resulting in additional water and possibly pesticides being applied to the test sites. The data provided included the dates of applications, the products applied, and any washdown operations. The farm records indicate that during 2002 the concrete intercept to biobed site was used more often for spray operations than the other two sites. This is due to the particular cropped fields that this site serviced and the pests and diseases identified in these fields during the 2002 growing season. During the period April 2002 to the end of the monitoring period in November 2002 the concrete intercept to biobed site had 17 individual spray days, whereas the drive-over biobed only had 9 spray dates and the concrete intercept to soil/grass area only had 5 spray days. In addition, 6 washdown

R&D PROJECT RECORD P2-200/PR 57
operations took place at the concrete intercept to biobed site, whereas no washdown operations were undertaken at either of the other two sites. As each washdown operation utilised approximately 150-200 litres of water then this could have an impact on the results from this particular site. Some of the test pesticides that were applied artificially to the sites were also applied during normal farm spraying operations in 2002 (Table 4.4). In addition, the extra test pesticide of interest, azoxystrobin, was used at two of the sites. However, the same pesticides were not used at all sites. Table 4.4: Test pesticides used on farm sites following normal agronomic advice, in addition to the artificial applications Test site Pesticides applied Concrete intercept to biobed Pre-application 1 Cypermethrin, chlorothalonil, epoxiconazole Post application 1 Chlorothalonil Post application 2 None Drive-over biobed Pre-application 1 None Post application 1 Azoxystrobin Post application 2 None Concrete intercept to soil/grass area Pre-application 1 None Post application 1 Azoxystrobin Post application 2 None
4.5 Laboratory Analysis The analysis of all samples was undertaken by Synergy Laboratories Limited, Thaxted, Essex. Analytical method development and validation procedures were undertaken prior to the commencement of the analysis of the actual water samples from the test sites. 4.5.1 Method The pesticides were extracted from the water samples by shaking them with an immiscible organic solvent. After the immiscible layers had separated, the organic layer was removed and the solvent evaporated to just dryness. The dry extract was then re-dissolved in solvent. The final determination was by gas chromatography with mass selective detection in selected ion mode. Each analyte was determined by monitoring 3 mass ions (m/z >100) thus precluding the need for further confirmation. 4.5.2 Method validation The method was validated by fortifying samples of distilled water with known concentrations of each target analyte. Distilled water was used in preference to pre-

R&D PROJECT RECORD P2-200/PR 58
treatment water samples that were shown to contain trace levels of some of the target pesticides at levels greater than the anticipated limits of quantification. 4.5.3 Residue analysis Analyses were carried out in batches, each of which was sufficiently short to ensure that critical working steps could be carried out with the necessary care within the course of one day. Each batch consisted of at least one untreated sample and one control fortified with different concentrations with the pesticide suite in order to determine recovery efficiency rates and so provide an internal quality check. 4.5.3 Recovery efficiencies Individual recovery results are summarised in Table 4.5. All values have been corrected for any apparent residues found in the respective untreated samples used for fortification purposes. Table 4.5: Analytical recovery efficiencies Pesticide Mean recovery
(%) SD RSD
(%) No. tests Range
Dimethoate 92 20 21 54 58 to 152 Chlorothalonil 93 21 22 43 57 to 137 Isoproturon 94 21 22 38 61 to 131 Chlorpyrifos 90 16 18 57 65 to 140 Pendimethalin 85 16 18 58 58 to 131 Epoxiconazole 87 20 23 49 57 to 132 Azoxystrobin 92 16 17 58 63 to 147 4.5.4 Limit of quantification The limit of quantification (LOQ) was not the same for all individual pesticides due to dilutions and other analytical procedures (Table 4.6). The LOQ also varied depending on whether the samples were derived from the concrete surfaces or from biobed/soil throughflow. Table 4.6: Limits of quantification Pesticide Limit of quantification
in concrete runoff (µg/l)
Limit of quantification in leachate samples (µg/l)
Dimethoate 2 0.5 Chlorothalonil 2 0.1 Isoproturon 2 0.5 Chlorpyrifos 2 0.1 Pendimethalin 2 0.1 Epoxiconazole 2 0.1 Azoxystrobin 2 0.1

R&D PROJECT RECORD P2-200/PR 59
4.6 Results 4.6.1 Rainfall The tipping bucket raingauge was located at the central site (concrete intercept to biobed), with a distance of no more than 3km to either of the other two sites. Even though the three sites were reasonably close together there will have been some variation in the actual rainfall amount that each received. On a very localised level the proximity of each site to nearby trees, farm buildings, water tank structures, together with the direction of the prevailing wind direction will have affected the amount of rain actually falling on the particular pesticide handling and washdown area. Some check raingauges were installed at the two sites without a tipping bucket raingauge in September 2002 to provide a basic assessment of the differences in rainfall experienced at each site. The check raingauges were read every 3-7 days, depending on the frequency of site visits. During a two month monitoring period there were a few occasions when the rainfall recorded at one site was double that recorded at another site, though generally the rainfall totals across the sites were within about 20% of each other. Both the two month monitoring periods following the artificial applications were characterised by prolonged dry and then very wet spells (Table 4.7). After application one on 6 June 2002 a dry spell lasted for the rest of June before very heavy rains returned in July. August was slightly drier than average. Following application two on 12 September 2002 the dry spell lasted through September, before wet weather returned in October and November. Over the whole May to November 2002 period the total rainfall was 119% of the long term average. The occurrence of these dry and wet spells after the artificial applications would have had some impact on the potential for pesticide transport off the concrete intercept areas and/or through the bioremediation systems. In addition, other environmental factors prevalent at the sites, such as air temperature, humidity, sunshine hours, biomix/soil temperature, biomix/soil moisture content, biomix/soil organic matter content, evapotranspiration and biomass activity will have affected the rate of degradation of the pesticides and the potential for pesticide transport. Table 4.7: Rainfall recorded at concrete intercept to biobed site Month Rain (mm) Average rain (mm) % average rain May 63.0 51 81 June 27.4 48 57 July 128.4 55 233 August 55.6 64 87 September 23.2 51 45 October 59.4 49 121 November 91.0 60 152 Total 448 378 119

R&D PROJECT RECORD P2-200/PR 60
4.6.2 Flow From the tipping bucket flowmeter records at the three sites it has been possible to calculate the volume of runoff water from the concrete intercept areas or throughflow from the biobed/soil areas. The throughflow represents water that has infiltrated into the biomix/soil (from rainfall and irrigation) and percolated through this material to the bottom of the liner, where there is a discharge outfall. Local conditions, including rainfall, site exposure to sun/wind, moisture status (of concrete and/or biobed/soil), grass growth, washdown activities or other on-site incidents will all have influenced these flow values by varying degrees. In addition, the water management at the sites, including temporary storage in tanks, by pumps (with float switches and automatic timer activation) will have greatly affected both the amount and the timing when water was transferred from one component of the treatment system to another. First artificial application The artificial application of the first suite of test pesticides took place at all three sites on 6 June 2002. Table 4.8 shows how variable the runoff (from concrete) and throughflow (from biobed/soil area) volumes were over the course of the monitoring period, due to the local conditions prevailing at any one time. At all sites the loss of water, either via direct evaporation from the concrete and/or evapotranspiration from the grass turf, would have had a significant impact on the flow volumes. The grass growth at the concrete intercept to soil/grass site remained very good throughout the monitoring period, even after the input of pesticide laden water. The deep topsoil present in this treatment system has obviously encouraged very good root development, which can then fully utilise the available soil water. Grass growth at the two biobed sites has not been as good. In addition, the grass growth at the biobed sites (especially the drive-over biobed) was more affected by the pesticide (i.e. herbicide) inputs, both on application day and subsequently during normal farm spraying activity. Due to this the amount of water lost by evapotranspiration from the two biobeds would have been less than that from the soil/grass area. The total flow from the drive-over biobed site appears to be too high, in relation to the amount of rainfall that fell at the site. In particular, the flow volume for the period 8-14 August 2002 could not be possible, unless the monitoring equipment was faulty or there was an incident at the site whereby a large amount of additional water entered the biobed from the sprayer or from the water supply tank for some reason. Approximately 3000l of water cannot be adequately accounted for during this week for the drive-over biobed site.

R&D PROJECT RECORD P2-200/PR 61
Table 4.8: First application – weekly rainfall, runoff (concrete) and throughflow (biobed/soil area) Date
Date
Rain
Concrete intercept to biobed
Concrete intercept to soil
Concrete intercept to biobed
Concrete intercept to soil
Drive- over biobed
From
To
(mm)
Concrete Flow (l)
Concrete Flow (l)
Biobed Flow (l)
Biobed Flow (l)
Biobed Flow (l)
06/06/2002 12/06/2002 9.6 492 378 282 423 160.5 13/06/2002 19/06/2002 3.2 94 36 73.5 169.5 87 20/06/2002 26/06/2002 5 132 238 40.5 99 81 27/06/2002 03/07/2002 15.6 496 214 69 52.5 249 04/07/2002 10/07/2002 34.2 2072 1468 376.5 985.5 1050 11/07/2002 17/07/2002 3.2 168 108 568.5 1278 157.5 18/07/2002 24/07/2002 25.8 1104 652 262.5 931.5 801 25/07/2002 31/07/2002 54.2 2400 3262 259.5 717 2974.5 01/08/2002 07/08/2002 22.8 1044 1804 606 1737 1614 08/08/2002 14/08/2002 24 1108 1478 1032 1162.5 4527 15/08/2002 21/08/2002 6.2 414 96 1125 801 97.5 22/08/2002 28/08/2002 2.6 56 100 1131 295.5 45 29/08/2002 04/09/2002 0 132 54 468 61.5 19.5 05/09/2002 11/09/2002 21.4 852 750 391.5 288 342 Total 228 10564 10638 6686 9002 12206 Second artificial application The artificial application of the second suite of test pesticides took place at all three sites on 12 September 2002. Like the first application, runoff and throughflow volumes were very variable across the sites reflecting the local conditions that were prevailing over the monitoring period (Table 4.9). Once again the amount of water lost by evapotranspiration from the soil/grass site was far in excess of that from the two biobed sites, as its growth continued unchecked in any way. At times during the first half of this monitoring period the throughflow drainage of water out of the biobeds/soil area almost ceased as all the water was being stored within the matrix and utilised by the biomass. The heavier rainfall later in October wetted the systems up and throughflow recommenced.

R&D PROJECT RECORD P2-200/PR 62
Table 4.9: Second application – weekly rainfall, runoff (concrete) and throughflow (biobed/soil areas) Date
Date
Rain
Concrete intercept to biobed
Concrete intercept to soil
Concrete intercept to biobed
Concrete intercept to soil
Drive- over biobed
From
To
(mm)
Concrete Flow (l)
Concrete Flow (l)
Biobed Flow (l)
Biobed Flow (l)
Biobed Flow (l)
12/09/2002 18/09/2002 0 302 118 360 466.5 126 19/09/2002 25/09/2002 1.2 148 44 145.5 87 27 26/09/2002 02/10/2002 0.6 0 108 64.5 25.5 1.5 03/10/2002 09/10/2002 1 272 0 37.5 7.5 0 10/10/2002 16/10/2002 20.8 950 710 88.5 13.5 211.5 17/10/2002 23/10/2002 27.4 1280 1130 760.5 523.5 940.5 24/10/2002 30/10/2002 10.2 386 300 951 504 445.5 31/10/2002 06/11/2002 37 1762 1884 1065 510 1771.5 07/11/2002 08/11/2002 15.2 136 882 684 142.5 901.5 Total 113 5236 5176 4157 2280 4425 4.6.3 Pesticide concentrations A summary of maximum pesticide concentration detected at each site is shown in Table 4.10. For each site, in Tables 4.11, 4.12 and 4.13, the analytical data for the seven test pesticides are shown for a number of representative dates during the two month monitoring period following each of the two artificial applications. Samples that had been generated on exactly the same day after application were not always available due to differences in the timing of when runoff or throughflow was occurring at the individual sites. The full analytical data set is shown in Appendices 4.1, 4.2 and 4.3.

R&D PROJECT RECORD P2-200/PR 63
Table 4.10: Summary of maximum pesticide concentrations (µg/l) detected in runoff and leachate samples following artificial applications Concrete intercept to
biobed Drive-over biobed
Concrete intercept to soil/grass
First application Runoff Leachate Leachate Runoff Leachate Dimethoate 28,000 5.4 5.0 12,000 <0.5 Chlorothalonil 106,000 1.2 1.0 114,000 0.4 Isoproturon 190,000 68.8 6.9 91,000 3.3 Chlorpyrifos 106,000 0.4 3.9 79,000 3.4 Pendimethalin 228,000 3.4 13.7 109,000 2.6 Epoxiconazole 11,000 0.6 0.9 8,200 0.6 Azoxystrobin 4,100 5.4 6.9 1,700 0.6 Concrete intercept to
biobed Drive-over Biobed
Concrete intercept to soil/grass
Second application Runoff Leachate Leachate Runoff Leachate Dimethoate 44,277 0.9 15.5 24,800 <0.5 Chlorothalonil 96,807 0.3 <0.1 94,600 <0.1 Isoproturon 140,850 <0.5 1.2 55,900 <0.5 Chlorpyrifos 77,646 0.7 0.4 56,300 0.8 Pendimethalin 205,550 2.3 0.5 107,900 0.8 Epoxiconazole 9,108 0.8 0.7 9,450 0.8 Azoxystrobin 2,960 5.8 1.9 6,4100 0.6 For the six pesticides artificially applied to the sites a total of 1134 individual analytical determinations were made of the leachate samples from all three bioremediation systems. Of these samples 87% had a pesticide concentration <0.5µg/l.

R&D PROJECT RECORD P2-200/PR 64
Table 4.11: Concrete intercept to biobed – pesticide concentrations in runoff from concrete and leachate through biobed Residue Level (µg/l or ppb) Handling Area Date/Time Dimethoate Chlorothalonil Isoproturon Chlorpyrifos Pendimethalin Epoxiconazole Azoxystrobin First Application Concrete 13/05/2002 8:54 0 0 0 0 0 84 0.3 Concrete 06/06/2002 11:34 25900 106000 190000 92500 228000 11300 <2 Concrete 09/06/2002 17:49 800 <2 7100 200 <2 600 <2 Concrete 27/06/2002 17:23 1.2 0.1 <2 12.3 0.0 70.2 23.0 Concrete 03/07/2002 17:37 <2 0.1 <2 <2 6.9 46.0 6.7 Concrete 20/07/2002 3:11 <2 <2 <2 1.3 <2 57.0 20.0 Concrete 31/08/2002 17:33 0.5 0.3 1.6 0.9 6.0 19.7 16.9 Biobed 24/04/2002 5:26 <0.5 <0.1 18 <0.1 <0.1 0.60 <0.1 Biobed 06/06/2002 23:00 1.2 <0.1 5.4 <0.1 <0.1 <0.1 <0.1 Biobed 10/06/2002 4:12 <0.5 0.1 37.3 0.3 <0.1 <0.1 0.5 Biobed 27/06/2002 11:40 <0.5 0.1 <0.5 <0.1 <0.1 0.2 0.9 Biobed 04/07/2002 18:22 <0.5 0.1 <0.5 <0.1 0.2 0.6 0.8 Biobed 21/07/2002 21:54 1.9 <0.1 <0.5 <0.1 <0.1 <0.1 0.2 Biobed 01/08/2002 19:17 2.2 <0.1 <0.5 <0.1 <0.1 <0.1 <0.1 Second Application Concrete 31/08/2002 17:33 0.5 0.3 1.6 0.9 6.0 19.7 16.9 Concrete 12/09/2002 11:48 44277 96807 140850 77646 196790 8506 <2 Concrete 13/09/2002 11:11 1970 3810 5510 1920 10600 1550 <2 Concrete 23/09/2002 14:51 <2 6810 5370 1310 42400 2020 1650 Concrete 12/10/2002 7:15 219 395 282 64 1390 293 77 Concrete 23/10/2002 20:13 5 8.4 18.9 <2 66.6 24 1.4 Concrete 06/11/2002 7:16 <2 <2 <2 <2 36 <2 <2

R&D PROJECT RECORD P2-200/PR 65
Table 4.11 (cont): Concrete intercept to biobed – pesticide concentrations in runoff from concrete and leachate through biobed Residue Level (µg/l or ppb) Biobed 27/08/200 19:38 <0.5 1.0 <0.5 0.4 <0.1 0.1 0.4 Biobed 13/09/2002 6:30 <0.5 0.3 <0.5 0.5 0.0 0.6 0.5 Biobed 15/09/2002 7:57 <0.5 <0.1 <0.5 0.4 <0.1 0.2 0.4 Biobed 22/09/2002 3:14 <0.5 <0.1 <0.5 0.4 0.0 0.5 0.6 Biobed 10/10/2002 9:38 <0.5 <0.1 <0.5 0.4 0.6 0.5 0.5 Biobed 23/10/2002 22:53 <0.5 <0.1 <0.5 0.3 <0.1 0.3 0.3 Biobed 06/11/2002 11:47 <0.5 <0.1 <0.5 0.3 <0.1 0.2 0.4

R&D PROJECT RECORD P2-200/PR 66
Table 4.12: Drive-over biobed – pesticide concentrations in leachate through biobed Residue Level (µg/l or ppb) Handling Area Date/Time Dimethoate Chlorothalonil Isoproturon Chlorpyrifos Pendimethalin Epoxiconazole Azoxystrobin First Application Biobed 04/05/2002 1:15 0.00 0.00 17 0.00 0.00 0.00 1.00 Biobed 07/06/2002 5:08 <0.5 <0.1 <0.5 <0.1 <0.1 <0.1 4.7 Biobed 10/06/2002 17:35 <0.5 <0.1 <0.5 0.4 0.4 0.4 0.8 Biobed 25/06/2002 17:11 <0.5 <0.1 1.0 <0.1 <0.1 <0.1 6.9 Biobed 05/07/2002 2:23 0.9 <0.1 0.5 <0.1 <0.1 <0.1 0.6 Biobed 20/07/2002 15:57 <0.5 <0.1 <0.5 <0.1 <0.1 <0.1 <0.1 Biobed 01/08/2002 10:56 <0.5 <0.1 <0.5 <0.1 <0.1 <0.1 <0.1 Second Application Biobed 03/09/2002 10:21 <0.5 <0.1 <0.5 <0.1 0.2 0.7 1.7 Biobed 12/09/200218:46 <0.5 <0.1 <0.5 <0.1 0.3 0.6 0.9 Biobed 15/09/2002 16:25 6.0 <0.1 <0.5 0.1 0.1 0.2 <0.1 Biobed 23/09/2002 1:26 8.0 <0.1 <0.5 0.1 0.1 0.2 <0.1 Biobed 16/10/2002 11:23 <0.5 <0.1 <0.5 0.1 <0.1 0.2 <0.1 Biobed 22/10/2002 6:28 2.5 <0.1 <0.5 0.4 <0.1 0.3 <0.1 Biobed 06/11/2002 11:51 0.9 <0.1 <0.5 0.3 0.5 0.2 <0.1

R&D PROJECT RECORD P2-200/PR 67
Table 4.13: Concrete intercept to soil/grass area – pesticide concentrations in runoff from concrete and leachate through soil/grass area Residue Level (µg/l or ppb) Handling Area Date/Time Dimethoate Chlorothalonil Isoproturon Chlorpyrifos Pendimethalin Epoxiconazole Azoxystrobin First Application Concrete 30/04/2002 8:41 0 0 0 0 0.08 0.87 0 Concrete 06/06/2002 15:35 12000 114000 91000 79000 109000 8200 <2 Concrete 09/06/2002 17:55 <100 1500 <200 <2 810 <2 <2 Concrete 26/06/2002 20:33 <2 2.00 <2 3.20 6.50 49.80 76.90 Concrete 05/07/2002 2:34 <2 <2 <2 <2 <2 39.50 14.30 Concrete 20/07/2002 1:37 <100 <2 <2 <2 7.50 9.60 <2 Concrete 01/08/2002 12:57 <2 <2 5.40 <2 15.00 6.50 <2 Soil/grass 03/05/2002 06::26 <0.5 <0.1 <0.5 <0.1 0.04 0.01 <0.1 Soil/grass 06/06/2002 23:30 <0.5 <0.1 <0.5 <0.1 <0.1 <0.1 <0.1 Soil/grass 11/06/2002 1:56 <0.5 <0.1 0.6 0.5 0.5 0.3 0.5 Soil/grass 25/06/2002 20:49 <0.5 <0.1 <0.5 <0.1 <0.1 <0.1 0.3 Soil/grass 03/07/2002 0:14 <0.5 <0.1 <0.5 <0.1 <0.1 <0.1 0.20 Soil/grass 21/07/2002 5:29 <0.5 0.4 <0.5 <0.1 0.1 <0.1 <0.1 Soil/grass 01/08/2002 8:53 <0.5 <0.1 <0.5 <0.1 0.6 0.6 <0.1 Second Application Concrete 10/09/2002 12:00 <2 <2 <2 <2 <2 25.7 4.0 Concrete 12/09/2002 13:21 24800 94600 55900 56300 107900 9450 6410 Concrete 20/09/2002 17:42 7940 6840 5900 2400 65100 7900 1850 Concrete 15/10/2002 12:52 103.4 74.9 151.5 27.7 329.6 83.1 58.2 Concrete 23/10/2002 20:43 5 8.3 <2 <2 17.1 17 39.6 Concrete 06/11/2002 7:13 <2 7.6 16.1 <2 12 15.8 <2

R&D PROJECT RECORD P2-200/PR 68
Table 4.13 (cont): Concrete intercept to soil/grass area – pesticide concentrations in runoff from concrete and leachate through soil/grass area Residue Level (µg/l or ppb) Soil/grass 29/08/2002 22:00 <0.5 <0.1 <0.5 0.5 0.4 0.2 <0.1 Soil/grass 13/09/2002 7:15 <0.5 <0.1 <0.5 0.1 0.2 0.3 0.1 Soil/grass 14/09/2002 17:42 <0.5 <0.1 <0.5 0.3 0.3 0.3 0.2 Soil/grass 22/09/2002 10:19 <0.5 <0.1 <0.5 0.3 0.3 0.3 0.2 Soil/grass 17/10/2002 20:21 <0.5 <0.1 <0.5 0.3 0.4 0.2 0.2 Soil/grass 22/10/2002 13:52 <0.5 <0.1 <0.5 0.4 0.3 0.4 0.3 Soil/grass 06/11/2002 17:18 <0.5 <0.1 <0.5 0.3 0.3 0.8 0.3

R&D PROJECT RECORD P2-200/PR 69
Concrete intercept to biobed The pesticide concentrations recorded in the runoff water from the concrete intercept area on a date before the first application day (6 June 2002) were generally very low (Table 4.11). A detection of 84µg/l epoxiconazole before the first application may have been due to the fact that this pesticide was used during a normal farm application shortly before 6 June (Table 4.4) and some residues may have been present on the concrete surface. On the application day concentrations then rose rapidly for the six pesticides applied to values in excess of 10,000µg/l. Runoff was generated from the concrete area when the sump rinsate (25l) and washdown (150l) mixtures were applied to the surface. The washdown mixture, in particular, had a much lower concentration than the other mixtures and diluted the overall runoff concentration to some extent. Three days after application (9 June) some detections in excess of 200µg/l were measured. During the rest of June and July the detections in the runoff from the concrete surface reduced, except for epoxiconazole, pendimethalin and azoxystrobin. Epoxiconazole and pendimethalin tends to bind quite strongly to most materials, including concrete and soil. It will therefore tend to remain on the concrete surface where degradation processes will ensue, unless raindrop impact or pressure washing causes it to be re-mobilised and transported off the concrete pad. Due to the normal spraying practices employed on this farming enterprise this site received more inputs of water through washdown activities than the other two sites. This was the only site at which normal sprayer washdown, using a pressure washer, was undertaken. This additional water would have had some effect on the performance of the treatment system. Pesticide concentrations in the leachate from the biobed were generally very low (<0.5µg/l). This represented a reduction in the concentration that was applied to the top of the biobed (via drip irrigation) of >10,000 times. However, some detections in excess of the limit of quantification were obtained. The two soluble and mobile pesticides, dimethoate and isoproturon, were occasionally found at levels in excess of 1µg/l. The results for the second application followed a very similar pattern to the first application for both the runoff from the concrete and the leachate from the biobed. Numerous detections in excess of 1000µg/l were found in runoff from the concrete and this lasted for at least 1.5 weeks after the application. Detections in excess of 50µg/l were still present over one month after application. This may be related to the lack of significant rainfall throughout August and September, which did not permit any mobilisation and transport of the test pesticides off the concrete surface in runoff water. There were very few detections >0.5µg/l in leachate water from the biobed following the second application. The lack of rainfall and runoff generally at the site, together with the further maturing of the biomix (especially biomass activity), allowed the treatment system to work extremely effectively throughout the two month monitoring period.

R&D PROJECT RECORD P2-200/PR 70
The presence of an almost constant residue level for chlorpyrifos, epoxiconazole and azoxystrobin of 0.3-0.5µg/l in the leachate over the monitoring period suggests an analytical background level was being measured, rather than a true residue level. Drive-over biobed The four pesticide mixtures were applied to specific locations on the pesticide handling and washdown areas where it would have been expected that the particular contamination source would fall. In the drive-over biobed system this meant that the mixtures were applied directly to appropriate areas on the top surface of the biobed (grass turf), through the metal grid. This differs from the other two systems, which evenly distributed the pesticide laden runoff water across the complete surface of the biobed/soil area through the drip irrigation system. The drive-over biobed will therefore potentially develop pesticide “hotspots” over time for certain pesticide contamination sources (e.g. under hopper, under sump, under nozzles/valves), if the sprayer is always parked on the grid in the same orientation. This “hotspot” effect was very noticeable at this site with the grass turf being severely scorched in distinct areas. This scorching will have affected the amount of evapotranspiration possible from the grass cover. The drive-over biobed also differs from the other two treatment systems in that it contained a larger volume of biomix for the retention and degradation of pesticides and, because it did not have an associated concrete intercept area, it received less direct or indirect rainfall as the total surface area is approximately 25% smaller. Throughout both monitoring periods pesticide detections in the leachate water were rarely in excess of 0.5µg/l (Table 4.12). Some unexpected detections of azoxystrobin were found before the artificial application on 6 June. These could not be explained as azoxystrobin was not used at the site until after 6 June and its physico-chemical properties would suggest that it would be strongly sorbed to the organic material in the biobed and not available for transport. Concrete intercept to soil/grass area Like the concrete intercept area to biobed site the pesticide detections on the application days were very high, >8000µg/l (Table 4.13). Likewise, the detections were reduced more quickly in the few days after the first application than they were following the second application. The amount/rate of rainfall falling on the concrete surface after the application, together with the production of surface runoff, were thought to be the main reasons for this. Detections in excess of 100µg/l were still being measured on the runoff water a month after application. Like the biobeds the soil/grass bioremediation system has performed particularly well with few detections in excess of 0.5µg/l and many <0.1µg/l. This represented a reduction in the pesticide input concentration of >10,000 times. The presence of an almost constant residue level for chlorpyrifos, epoxiconazole and azoxystrobin of 0.3-0.5µg/l in the leachate over the monitoring period also suggests an analytical background level was being measured, rather than a true residue level.

R&D PROJECT RECORD P2-200/PR 71
The grass turf cover on the soil grew prolifically since it was laid in April 2002. Its growth was not in any way hindered by the pesticide residues being applied to it through the drip irrigation system. This may in part be due to the fact that the drip tape was located right at the base of the grass stems and so the pesticide laden water did not come into direct contact with the grass leaves. The mode of action of a particular herbicide would be important in this respect. As a result of the prolific grass growth a large volume of water will have been evapotranspired up into the atmosphere over the course of the two monitoring periods and therefore not available to be leached downwards through the soil system. This will have undoubtedly helped to improve the overall performance of this particular treatment system. 4.6.4 Operation and management of the treatment systems Due to the fact that these new full-scale bioremediation systems were designed to meet both normal on-farm operational requirements and experimental purposes it was expected that some unforeseen operational and management problems would be encountered. These operational and management issues were very relevant to the drafting of the design manual for pesticide handling and washdown areas. All the relevant findings in this respect were fed into the drafting of the design manual. The need to have storage tanks (3-5 m3) within the system to regulate the application of water to the biobed/soil areas and the disposal areas did pose some operational problems. The original storage volumes were calculated to meet the needs of the expected runoff from the concrete areas following rainfall and washdown operations, or the estimated potential leachate passing through the biobed/soil area. The structural integrity of one of the tanks at the concrete intercept to soil/grass site was compromised when the volume of water retained in the tank was not enough to withstand the inward pressure exerted by the surrounding soil. As a result this tank had to be removed, strengthened by reinforcing rods and then replaced. The consequences of this finding was that a minimum depth of water (e.g. >40cm) had to be retained in all the underground storage tanks at all sites to prevent this effect re-occurring. This reduced the overall storage volume available in each tank that was not considered when the tank size was originally calculated. The management of the pumping and drip irrigation systems then had to be altered accordingly. During the course of the monitoring periods the specification of the pumping system was altered. Originally it was envisaged that relatively high pressure pumps would be needed to run the drip irrigation systems to the required flow rate. During the course of the monitoring periods the self-priming of these pumps became a difficulty. It was found that the specification of the pumps installed to transport the water from the runoff collection chambers to the first storage tanks (prior to application to the biobed/soil area) were adequate for running the drip irrigation system as well. This meant that it was possible to use one pump specification for all aspects of the water transfer and irrigation on all sites. The biomix at both the biobed sites slumped over the course of the monitoring period, due to the natural composting process that occurred and after the biomix took up water and became heavier. In places the top of the biomix had subsided by about 40cm from its original level. Both biobeds had to be topped up with fresh biomix, from a stockpile of the original biomix created in February 2002. An annual top-up of biomix is

R&D PROJECT RECORD P2-200/PR 72
therefore essential for these treatment systems to maintain their maximum pesticide removal potential. The decomposition of the biomix into a very dark wet sludge like material at the base of the liner did have implications on the drainage of the water out of the liners. At one site the outlet to the liner (which had a fine filter on it) became clogged with this decomposed biomix and had to be cleared and the filter replaced. It is important that the biobed retains relatively free drainage at all times otherwise its potential for pesticide retention and/or degradation will be reduced. The specification of the filter therefore required alteration as a result. 4.7 Discussion and Conclusions The results from the three full-scale pesticide handling and washdown areas constructed in Lincolnshire have shown that these bioremediation systems are extremely effective in reducing point source pesticide pollution. All the information gained from the construction, operation, management and performance of the three systems has been fully utilised within the development of the design manual for pesticide handling and washdown areas. All three sites were subjected to the equivalent of the maximum potential point source pesticide contamination that might have arisen from 16 individual tank mixes on one spray day. This represented a severe test of the treatment systems to retain and/or degrade pesticides. Individual pesticide concentrations in excess of 100,000µg/l were measured in water that was applied to the bioremediation systems. In general, all three treatment systems were able to reduce these concentrations to below 0.5µg/l and often below 0.1µg/l over the course of the whole 5 month monitoring period. Some detections in excess of 0.5µg/l were measured in the water leaching out of the biobed/soil area, but these should be put into the context of the overall pesticide reduction performance of these treatment systems. Work by other researchers would suggest that following the maturing of the biomix over time, together with the adaptation of the biomass in all these treatment systems to selectively degrade pesticides, then the losses of contaminants out of the leachate water will be further reduced. However, at some point in the future, possibly 5-7 years in the UK climate, the biomix and soil may need to be removed from the liners and disposed of in the most appropriate manner. Fresh biomix (ideally pre-composed for at least two months) or soil would then have to be reloaded into the liners prior to any subsequent pesticide handling and washdown operations. Due to the timespan of this project it has not been possible to investigate the possible disposal options for spent biomix/soil, which will be subject to the appropriate waste management regulations. The widespread implementation of these on-farm bioremediation systems within the UK farming industry will require formal approval by the appropriate regulatory authorities. This requires the interpretation and consideration of a number of UK and EU Regulations and Directives for the various aspects of these treatment systems and how they might impact on the environment.

R&D PROJECT RECORD P2-200/PR 73
4.8 Recommendations The work undertaken in this stage of the project has highlighted the need to undertake further research into: • The long-term operation, management and performance of on-farm bioremediation
systems to reduce point source pesticide contamination. This could be achieved by further monitoring of the three existing sites in Lincolnshire for a number of years.
• The ability of the biomix or soil to retain and degrade pesticides. Can the biomix/soil be “engineered” even further to improve its potential to remove pesticides, especially those pesticides that are persistent or particularly mobile?
• Lifespan of bioremediation systems. How many years can these systems be operated before the biomix or soil needs to be replaced? Does a soil based system have a very different lifespan to a biobed?
• Disposal options for spent biomix/soil. How does the spent biomix/soil need to be handled, stored, treated etc. prior to disposal? What risks does the spent biomix/soil have on the environment during storage and/or disposal?

R&D PROJECT RECORD P2-200/PR 74
5. STAGE 5 - DEVELOPMENT OF A DESIGN MANUAL All the information and data collected and obtained during all the previous stages of this project were considered in the preparation of a draft design manual for agricultural pesticide handling and washdown areas. Critically, however there remain a number of scientific and regulatory issues which are beyond the scope of this project and which are of sufficient importance to preclude the production of a design manual for general use at this stage. The scientific issues primarily relate to the residual risks to groundwater posed by bioremediation systems and to their long-term management and performance. Further research is currently in hand on biobeds and it is likely that this will answer some of these questions. This project has identified a number of recommendations for additional research which, if taken forward, would address the longer-term uncertainties. The regulatory issues relate to new regulations likely to impact on the disposal of pesticide washings. In particular regulations are known to be in preparation on Agricultural Waste and Hazardous Waste. The future of the Groundwater Regulations and their relationship to the Landfill Regulations is unclear, as is the issue of Groundwater Regulations charges. These regulatory matters could potentially have significant impacts on the costs associated with bioremediation systems and on their legal status. In light of these unanswered questions it is considered inappropriate to publish a design manual as an output from this project, even in draft form, since its publication would imply the acceptability of the bioremediation systems whereas there is actually significant uncertainty. The collated findings from the project on the design concepts for pesticide handling and washdown areas have been produced as an Appendix to this Project Record. Despite the scientific and regulatory uncertainties, the Agencies recognise the potential of biobeds to reduce pesticide pollution of surface waters from pesticide handling areas. The Agencies will not be actively promoting the uptake of bioremediation systems on-farm but where there is an obvious commitment to improve pesticide handling practices then proposals for biobeds will be considered on a case-by-case basis. The Agencies have produced interim guidance in order to advise their staff on the position regarding the use of biobeds on-farm. The Environment Agency has produced an “Interim Position Statement on Agricultural Pesticide Handling and Washdown Areas in Relation to the Protection of Controlled Waters (focussing on biobeds)”. SEPA has produced an “Interim Regulatory Guidance Note on Biobeds and Soil/Grass Systems for Agricultural Pesticide Handling Areas”. A critical factor in deciding whether a biobed can be used in a particular situation is whether it is to be used for pesticide mixing/handling only or whether washdown is to take place. The Agencies have stated that, provided they are constructed and operated according to good practice, biobeds for pesticide mixing/handling do not require authorisation under the Groundwater Regulations. For washdown areas significant volumes of waste will be generated which could potentially pollute groundwater. Consequently the Agencies consider that where biobeds are proposed to be used for washdown, they should be lined and the drainage collected for subsequent disposal under a Groundwater Regulations

R&D PROJECT RECORD P2-200/PR 75
Authorisation. Unlined biobeds are not encouraged for washdown areas and would again require a Groundwater Regulations Authorisation. It is anticipated that the results of this project and the design concepts, whilst recognising the scientific and regulatory uncertainties, will be taken forward by the pesticide industry and by The Voluntary Initiative in particular. Bioremediation systems offer the potential to reduce surface water pollution by pesticides arising from the concrete farm yard but their potential detrimental impact on groundwater must be considered.

R&D PROJECT RECORD P2-200/PR 76
6. PROJECT CONCLUSIONS There are numerous EU and national regulations, codes of practice and advisory information available to pesticide users on how to handle and use pesticides correctly, and how to dispose of pesticide wastes in an appropriate manner. However, these are sometimes confusing and open to individual interpretation. This can potentially adversely affect the decision making process that pesticide users take in their own particular circumstances. The potential environmental consequences of mistakes and accidents that may occur whilst using pesticides and pesticide application equipment in the farmyard could be considerably reduced through a better awareness of the problem. Training of all pesticide users in the correct manner to use and dispose of pesticides and associated wastes, dealing with spillages and keeping pesticide application equipment in good working order, are all seen as fundamental to limiting point source pollution on farms. The Voluntary Initiative (VI) is currently addressing these issues. In recent years research studies have identified that point source pollution can significantly contribute to the pesticide load leaving a surface water catchment, however local site and catchment conditions can cause the amount to vary greatly. Point source pollution can also arise from effluent discharges to rivers from sewage treatment works or factories, accidental spills, amenity weed control leading directly to drainage systems, or even deliberate disposal of surplus material into soakaways or rivers and vandalism. Pesticide point sources, although difficult to identify and locate, arise generally from poor management and can therefore potentially be limited by effective intervention. The design, management and operation of agricultural pesticide handling and washdown areas are considered as primary targets to limit point source pesticide pollution. The characteristics of the farmyard surface and associated drainage will control the rate at which any spilt pesticide, washings or waste reaches a water resource. The surface and underlying substrate also dictate whether opportunities exist for in situ pesticide retention and/or degradation through physical, chemical or biological processes. Experimental tank studies undertaken in Stage 2 of this project indicated that when compared to the typical concrete surface found in most farmyards, the use of more permeable media, especially those with specifically designed bioremediation systems, could reduce pesticide losses by greater than 95%. In particular, biobeds (comprising a mixture of straw, loamy topsoil and peat-free compost) and good quality biologically active topsoil provided enhanced conditions for microbial degradation processes, if the water management in these systems was well controlled. Other workers have found both biobeds and soil-based systems to be extremely effective in retaining and/or degrading pesticides. The full-scale design trials of three new pesticide handling and washdown areas, all linked to bioremediation systems, provided very good evidence for limiting point source pesticide pollution. The extremely good performance of these systems to retain and/or degrade pesticides, even following some very severe artificial pesticide loadings, suggests that they would work very effectively with more typical contamination levels that would be expected with normal pesticide usage in farmyards.

R&D PROJECT RECORD P2-200/PR 77
This project has provided good evidence that redesigned agricultural pesticide handling and washdown areas, linked to bioremediation systems, can minimise point source pollution of surface waters. Further work is, however, needed to address the various policy issues associated with how these systems would legally operate under the different components of legislation and their interpretation in the UK, particularly with respect to the Groundwater Regulations and the proposed Waste Framework Directive. There are scientific uncertainties about the long-term use and management of biobeds and issues about the potential risk to groundwater. As a result of these issues it was decided that it was not appropriate to publish a design manual as an output of this project. It is anticipated that the information and experience gained from the project, together with the draft design concepts in Appendix 1 of this report, will be taken forward by the pesticide industry under the Voluntary Initiative.

R&D PROJECT RECORD P2-200/PR 78
7. PROJECT RECOMMENDATIONS The work undertaken in this project has highlighted the need to undertake further research into: • The long-term operation, management and performance of on-farm bioremediation
systems to reduce point source pesticide contamination. This could be achieved by further monitoring of the three existing sites in Lincolnshire for a number of years.
• The ability of the biomix or soil to retain and degrade pesticides. Can the biomix/soil be “engineered” even further to improve its potential to remove pesticides, especially those pesticides that are persistent or particularly mobile?
• Lifespan of bioremediation systems. How many years can these systems be operated before the biomix or soil needs to be replaced? Does a soil based system have a very different lifespan to a biobed?
• Disposal options for spent biomix/soil. How does the spent biomix/soil need to be handled, stored, treated etc. prior to disposal? What risks does the spent biomix/soil have on the environment during storage and/or disposal?
There is also a need to address the various policy issues associated with how these systems would legally operate in the future, particularly with respect to the proposed regulations for agricultural waste and changes to the Groundwater Regulations.

R&D PROJECT RECORD P2-200/PR 79
REFERENCES BAA (1994). Think water keep it clean, Practical advice for pesticide users to protect the water environment. British Agrochemicals Association, Peterborough, BAA (1998). Container incineration - a practical guide. British Agrochemicals Association. Peterborough. BAA (1999). Container management strategy. British Agrochemicals Association, Peterborough. BAA/NRA (1995). Think water keep it clean. How to protect surface water and groundwater from contamination by pesticides. Combined BAA/NRA leaflet, British Agrochemicals Association. Peterborough. Bach M., (1999). Reduction of pesticide contamination at the catchment level. Proceedings of the Warwick Conference, Agriculture & the Environment - Challenges and Conflicts for the New Millennium. 14-16 April 1999, ADAS, Wolverhampton. BCPC (1994). Boom sprayers Handbook. British Crop Protection Council, Farnham, Surrey. BCPC (1996). Using pesticides – a complete guide to safe, effective spraying. British Crop Protection Council, Farnham, Surrey. BCPC (1997). The Pesticide Manual. Eleventh edition. Ed. C.D.S. Tomlin. British Crop Protection Council, Farnham, Surrey. BCPC (1998). Managing pesticide waste and packaging. Proceedings of a Symposium at the University of Kent, Canterbury, 30 March - 1 April 1998. British Crop Protection Council, Farnham, Surrey. BCPC (1999). Using pesticides: a complete guide to safe, effective spraying. British Crop Protection Council, Farnham, Surrey. Brown, C.D., Marshall, V.L., Carter, A.D., Walker, A., Arnold, D.J. & Jones, R.L (1999). Investigation into the effect of tillage on solute movement to drains through a heavy clay soil. I. Lysimeter experiment. Soil Use and Management, 15, 84 - 93. Carter, A.D. (2000). Herbicide movement in soils: principles, pathways and processes. Weed Research, Vol 40, No 1, 113-122. Carter, A. D., (2000). How pesticides get into water – and proposed reduction measures. Pesticide Outlook, 11. 4, 149-157. Dean, T.W. and Bucklin, R.A. (1997). Building plans and management practices for a permanently-sited agricultural pesticide mixing/loading facility. SM-58. Florida Cooperative Extension Service. Pesticide Information Office. Institute of Food and Agricultural Sciences, University of Florida.

R&D PROJECT RECORD P2-200/PR 80
Environment Agency/SEPA (1997). A guide to sustainable urban drainage. Environment Agency and Scottish Environment Protection Agency. Environment Agency (1998a). Quantifying point source inputs of pesticides to river catchments - phase 2: farmer and contractor pesticide use survey. R&D Technical Report P141. Environment Agency. Environment Agency (1998b). Quantifying point source inputs of pesticides to river catchments - phase 2: development of a decision tree. R&D Technical Report P109. Environment Agency. Environment Agency/SEPA (1999). Sustainable urban drainage: an introduction. Environment Agency and Scottish Environment Protection Agency. Environment Agency (1999) Pesticides in the Aquatic Environment 1997. Environment Agency, Wallingford, Oxon. Environment Agency/SEPA (2000). Prevention of pollution by pesticides. Pollution Prevention Guidelines PPG9. Environment Agency and Scottish Environment Protection Agency. Flury, M., Leuenberger, J., Studer, B., Fluhler, H., Jury, W. A. and Roth K. (1994). Pesticide transport through unsaturated field soils: Preferential flow, ETH Zurich. Fogg, P. and Carter, A.D. (1998). Biobeds: the development and evaluation of a biological system for pesticide waste and washings, 49-58, In: Proceedings of the BCPC Symposium Proceeding No. 70, Managing pesticide waste and packaging, Farnham, Surrey. Fogg, P. and Boxall, A.B.A. (1998). Biobeds: the development and evaluation of a biological system for the disposal of pesticide waste and washings. Project JF4107. Soil Survey and Land Research Centre, Cranfield University, Shardlow, Derby. Helweg A. (1994). Threats to water quality from pesticides - case histories from Denmark. Pesticide Outlook, October 1994, 12 - 18. Henriksen, V.V., Bider, A., Nielsen, M., Laursen, B., Spliid, N.H., Helweg, A., Felding, G. and Hensen, L.S. (1999). Leaching of pesticides from washing-sites and capacity of biobeds to retain pesticides. Proceedings of 16th Danish Plant Protection Conference. DJF rapport, No.9, 47-63. Higginbotham, S., Jones, R.L., Gatzweiler, E. and Mason, P.J. (1999). Point-source pesticide contamination: quantification and practical solutions. Brighton Crop Protection Conference, 681-686. British Crop Protection Council, Farnham, UK. Isensee AR, Sadeghi AM (1996). Effect of tillage reversal on herbicide leaching to groundwater. Soil Science, 161, 382-389.

R&D PROJECT RECORD P2-200/PR 81
Jacobsen, O.S., Brusch, W., Laier, T., Hansen, S.U., Spliid, N.H. and Helweg, A. (1999). Transport and dating of pesticide residues from a 40 year old point source. XI Pesticide Chemistry Conference, Cremona, Italy, September 1999. 355-361. Kreuger, J. (1998). Pesticides in stream water within an agricultural catchment in southern Sweden, 1990-1996. The Science of the Total Environment, 216, 227-251. Laighat, A., Prasher, S.O. and Broughton, R.S. (1996). Evaluation of an on-farm pollution control system for reducing pesticide pollution. Transactions of the American Society of Agricultural Engineers, Vol 39, No. 4, 1329-1335. MAFF (1998a). Code of Practice for the Safe Use of Pesticides on Farms and Holdings. The Green Code. PB3528. Ministry of Agriculture, Fisheries and Food. MAFF (1998b). Code of Good Agricultural Practice for the Protection of Water. PB0585. Ministry of Agriculture, Fisheries and Food. MAFF (1998c). Code of Good Agricultural Practice for the Protection of Air. PB0618. Ministry of Agriculture, Fisheries and Food. MAFF (1998d). Code of Practice for Suppliers of Pesticides to Agriculture, Horticulture and Forestry. The Yellow Code. PB3529. Ministry of Agriculture, Fisheries and Food. MAFF (2000). Towards sustainable agriculture: a pilot set of indicators. PB4583. MAFF (1998). Code of Good Agricultural Practice for the Protection of Water. PB0585. Ministry of Agriculture, Fisheries and Food. Mason, P.J., Foster, I.D.L., Carter, A.D., Walker, A., Higginbotham, S., Jones, R. L., and Hardy, I. A. J. (1999). Relative Importance Of Point Source Contamination Of Surface Waters: River Cherwell catchment monitoring study. XI Pesticide Chemistry Conference, Cremona, Italy, September 1999. 405-412. McKinlay, R.G. and Kasprek, K. (1999). Observations on decontamination of herbicide-polluted water by marsh plant systems. Water Research, Vol 33, No 2. NAAC/BAA (1998). Code of practice for the use of approved pesticides in amenity and industrial areas - The Orange Code, NAAC/BAA. National Proficiency Test Council (undated) Certificate of competence in the use of pesticides. Advisory leaflet. NPTC, Stoneleigh, Warwickshire. Notenboom, J., Verschoor, A., van der Linden, A., van Plassche, E. And Reuther, C. (1998). Pesticides in groundwater: occurrence and ecological impacts. RIVM report 601506002 Bilthoven, Netherlands. Novartis (1998). Les Bonnes Practiques Agricoles. Protègent l’eau à chaque étape traitement. Novartis Agro S.A.

R&D PROJECT RECORD P2-200/PR 82
NRA (1992). Pesticides in major aquifers. R&D Note 72. National Rivers Authority. Pratt, C.J. (1995). A review of source control of urban stormwater runoff. J.CIWEM, Vol 9, 132-139. Pratt, C.J. (1999). Use of permeable, reservoir pavement constructions for stormwater and storage for re-use. Water Science and Technology, 39, No 5, 145-151. Produce Studies (1999). Evaluating the IPU Stewardship Campaign, report for Rhône-Poulenc Agriculture, report no PSL 9868/SRH. Produce Studies. Newbury. Rhône-Poulenc (1993). Reed bed technology: Staveley. Report by Rhône-Poulenc Chemicals Limited. Scottish Office (1997). Prevention of environmental pollution from agricultural activity: a code of good practice. The Scottish Office Agriculture, Environment and Fisheries Department. SEPA (1999a). Guidance Note 1. Disposal of waste agrochemicals to land: guidance on compliance for farmers, crofters and growers. Scottish Environment Protection Agency. SEPA (199b). Guidance Note 2. Best practice methods for the treatment and disposal of waste sheep dip and pesticides for farmers, crofters and growers. Scottish Environment Protection Agency. Shepherd, A. J. and Heather, A. I. J. (1999). Factors affecting the loss of six herbicides from hard surfaces. Brighton Crop Protection Conference, 669-674. British Crop Protection Council, Farnham, Surrey, UK. Spiteller, M., Hartman, J., Burhenne, J., Müller, K., Bach, M. and Frede, H.-G. (1998). Reduction of pesticide pollution in surface water determined by LC/MS-MS. Spliid, N.H., Helweg, A., Brüsch, W., Jacobsen, O.S. and Hansen, S.U. (1999). Pesticide point sources and dispersion of pesticides from a site previously used for the handling of pesticides. Proceedings of 16th Danish Plant Protection Conference. DJF rapport, No.9, 33-46. Torstensson, L., Olson, G., Norup, S. and Stenberg, B. (1994). Biobeds minimize environmental risks when filling agricultural spraying equipment. In 35th Swedish Crop Protection Conference. pp 223-233. Torstensson, L. and Castillo, M.Dp. (1996). Biobeds minimize environmental risks when filling agricultural spraying equipment. In: COST 66, Pesticides in soil and the environment, Abstracts. 13-15 May 1996. 223-224. Torstenssen., L. and Castillo, M.Dp. (1997). Use of biobeds in Sweden to minimize environmental spillages from agricultural spraying equipment. Pesticide Outlook, Vol 8, No 3, 24-27.

R&D PROJECT RECORD P2-200/PR 83
Vicari A., Rossi Pisa P. and Catzione P. (1999a). Tillage effects on runoff losses of atrazine metolachlor, prosulfuron and triasulfuron. Abstracts 11th EWRS Symposium, Basel, Switzerland, 28 June-1 July 1999. Vicari A., Rossi Pisa P. and Catzione P. (1999b). Losses of atrazine, metalochlor, prosulfuron and triasulfuron in subsurface drain water. Abstracts 11th EWRS Symposium, Basel, Switzerland, 28 June-1 July 1999. Wauchope, R.D., Buttler, T., Hornsby, A.G., Augustijn-Beckers, P.W.M. & Burt, J.P. (1992). The SCS/ARS/CES pesticide properties database for environmental decision-making. In: Reviews of Environmental Contamination and Toxicology, 123, 1-164. WRc (1996). Reed beds and constructed wetlands for wastewater treatment. WRc, Swindon, Wiltshire.

R&D PROJECT RECORD P2-200/PR 84
DRAFT
APPENDIX 1: DESIGN CONCEPTS FOR AGRICULTURAL PESTICIDE HANDLING AND WASHDOWN AREAS 1. BACKGROUND Chemical contamination from agricultural sprayer filling and pesticide handling areas has been shown to significantly contribute to water pollution. Most of these areas have developed conveniently alongside the on-site water supply and chemical store. Recent research investigating sprayer practices in the UK and elsewhere in the world have shown that by following a simple bioremediation treatment design, new areas can be created, or existing sites can be improved. Water discharging to the environment from these new treatment systems has been shown to contain significantly less pesticide than when left untreated. Research has shown that discharging liquid has shown reductions in pesticide concentrations of typically10,000 –100,000 fold. These design concepts will allow potential users to select a suitable type of pesticide handling and washdown area for their own particular farming or spraying business. It then assists in the preparation of the specification, construction and use for such an area, guiding the user on management principles for efficient operation of the area and final disposal of any discharge. 1.1 How much will it cost? It will involve some expense but the main focus is to recommend a cost-effective solution for each type of farming or spray contractor enterprise. Guidance costs are given at the end of this document in Section 6. 2. WHAT DOES THE PRINCIPLE INVOLVE? Basically 3 concepts:
1 An area on which the sprayer stands which collects all spilt or drained liquids. This may include rainfall.
2 Holding and bioremediation treatment system to handle all these
collected liquids
3 Distribution system for treated liquids The overriding principle is one of containment, as below:
• Provide a discrete area for the sprayer and operator to safely work on
• Limit any rainfall or other waters falling onto that area
• Collect all liquids falling on the area

R&D PROJECT RECORD P2-200/PR 85
DRAFT
• Direct all liquids to a designated bioremediation system • After treatment apply discharge to land in a controlled manner
2.1 What is a bioremediation system? In all the research referred to this is either a mixture of straw, soil and compost or a specially designated soil area. In the UK these systems have been included within an impervious liner. This liner is connected to a drain permitting throughflow drainage to a disposal system. Such a bioremediation system has become known as a BIOBED. The systems which may be appropriate are outlined in Figures 2.1 and 2.2 highlighting the main difference as An INDIRECT system where all liquids are intercepted, then directed to a biobed (Figure 2.1). DIRECT system where all liquids fall direct onto a biobed (Figure 2.2). 2.2 What does a biobed contain? Either
A mixture by volume of 50% straw, 25% topsoil and 25% peat-free compost, turfed over.
Or
A soil area, developed to be “biologically” active i.e. free from compaction, showing good rooting with a good ecosystem, turfed over.
In this document all references to a biobed in construction purposes can be interpreted as either one of the above. Where soil is selected for either system it is likely that enhanced performance will come from the selection of light or medium loamy soils. Clay soils may be difficult to manipulate within any mixing required and may mitigate against predictable drainage. Certain differences exist with the management of the various types of biobeds, this will be made clear in later sections. 2.3 What are the system choices? The major decision lies between what the intention is on the handling area: If the intention is to handle and mix pesticides ONLY, then drainage from the area may be direct to soil. No liner or holding tank is necessary.

R&D PROJECT RECORD P2-200/PR 86
DRAFT
Where the intention is to handle and mix pesticides, INCLUDING washdown of the sprayer / vehicle prior to liquid disposal then all discharges must be contained. They may then be: A collected and held, prior to disposal through an authorised waste disposal
contractor. B collected and held, prior to chemical treatment, disposal to an area of land under
a Groundwater Authorisation or to a consented discharge. C collected and held, prior to bioremediation treatment, disposal to an area of land
under a Groundwater Authorisation or to a consented discharge. A & B above generally involve considerable cost, particularly where intensive sprayer use is practised or where large volumes of water enter the system. The bioremediation system C offers a practical simple system at lower cost. Component parts of INDIRECT and DIRECT systems are depicted in the following diagrams. Selection of an appropriate system is then governed by its intended use.

R&D PROJECT RECORD P2-200/PR 87
DRAFT
Secondary tank
Bunded pesticide handlingconcrete intercept area
Rain – Roofing may not be required, see text.
WashdownDrips, Spills
Auto pump to primary tank
Auto control pump to drip irrigation onto biobed surface
Gravity flow through silt trap
Primary tank
Auto control pump (manual override) to drip irrigation in approved disposal area
Liner containing
biobed
Chamber
Biobed area
Auto pump to secondary tank
Approved area
Figure 2.1: Typical system schematic of INDIRECT system - Liquids intercepted to a biobed

R&D PROJECT RECORD P2-200/PR 88
DRAFT
WashdownDrips, Spills
Gravity
Auto control pump (manual override) to drip irrigation on approved disposal area
Drive-over grid –to support sprayerand operator
Biobed
CHAMBER
Tank
Approved area
Liner
Bunded pesticide handlinggrid area
Gravity
Auto pump to tank
Rain – Roofing may not be required, see text.
Figure 2.2: Typical system schematic of DIRECT system – liquids fall directly onto biobed, a “Drive-over” system

R&D PROJECT RECORD P2-200/PR 89
DRAFT
3. SYSTEM OVERVIEW 3.1 Sprayer / pesticide handling area 3.1.1 Size The size must be adequate to contain all liquids that possibly drop from the sprayer and allow the operator freedom of movement when undertaking all pesticide handling, mixing or filling operations. Routine servicing of the sprayer vehicle/machinery could take place on the same area. Allowances, from currently available equipment and work routines suggest the following typical sizes:
Sprayer type Overall Length (m) Overall width (m) Self propelled sprayer 7 5 Trailer 7 5 Mounted 4 5
Size is a compromise between containment of contamination, rainfall limitation and freedom to work safely. It will not allow for full boom unfolding but could allow for some unstowage of individual booms for improved access. Size must be related to current and anticipated future equipment. In addition, it is likely that for indirect systems, some transfer chambers and tanks would need to be sited nearby. This implies an overall area close to or within any “yard” of about 60 m2 (see Figure 3.1). The final discharge system will occupy an area of land close-by, the final size of which depends on a number of individual site factors. For initial consideration purposes it may be around 60-200 m2.

R&D PROJECT RECORD P2-200/PR 90
DRAFT
Figure 3.1

R&D PROJECT RECORD P2-200/PR 91
DRAFT
3.1.2 Surface type and water limitation This may be concrete or a steel drive-over grid. All areas must restrict surface water entering the area, or leaving it. The only possible route for liquid, once on the area must be through the treatment system. The simplest method for containment is a small bund. This is recommended to be not less than 100mm high, with width allowing reasonable vehicle run-on comfort at 250-300 mm. This size, ensures the operator is certain when the whole vehicle is on the pad and prevent casual driving of other vehicles over the pad. The concrete will need a slope in a convenient drainage direction of not less than 1: 100 to a silt trap and pump chamber as necessary. A steel drive-over grid necessary above a biobed or soil/grass area must provide safe, direct access for the vehicle and to permit the operator to work around the sprayer. The operator support area should include a mesh size to allow safe foot movement without any tendency to block with debris; mud etc. 100 x 40 mm has been satisfactory. Its design must support the gross weight of the vehicle (fully filled with spray mix). If the biobed is unlined this may allow foundations within the centre of the biobed. Where the biobed is to be lined then end and side foundations must be provided to support the grid base. The possibility of the vehicle leaving the grid at an angle should be considered within any design. Research from other countries suggests that there is a need to top up a biobed annually with fresh biobed mix. Therefore the grid should include easily removable sections to permit this. These sections are likely to require mechanical aids to removal, e.g. hooks or eyes for loader forks etc. Where a turfed over soil biobed is to be used it is recommended that a steel drive-over grid or steel wheel channels are installed to support the vehicle weight. This will prevent repeated traffic compacting the soil, decreasing its infiltration capacity and thus reducing its effectiveness. 3.1.3 Is roofing worthwhile? Generally speaking - No. Once the size, shape and site location aspects of each business are considered a roof becomes very expensive. If an existing building allows an intercept area to be covered this can be beneficial. However there is a need to ensure that the biobed areas are managed at a reasonable moisture input to maintain both activity and flow through the system. Simple systems of roofing such as polytunnels or simple handling area covers have been considered but a compromise of size and structure required soon suggests costs outweighing other issues. Some benefit could be obtained by limiting the effect of rainfall through during the winter period by providing some form of temporary cover, such as in the style of a cricket pitch cover, directing rainfall away from the biobed area.

R&D PROJECT RECORD P2-200/PR 92
DRAFT
3.1.4 Indirect system, liquid transfer from the concrete area To control the liquid transfer a buffer tank may be necessary. Where possible this should be sited as close to the handling area as possible. To save the need for a second pump gravity should be maximised at this point. The tank should be sized to the local site rainfall statistics, especially the expected rainfall intensity values. Note that 1 mm of rainfall on a 1 m2 area of good quality concrete produces 1 litre of runoff water. Thus peak rainfall intensity values of 25 – 40 mm per 24 hour period must be considered. This “buffer” or primary tank is therefore unlikely to be less than 3 m3 in volume. Where a drive-over grid is used then gravity ensures all liquids enter the biobed or turfed soil area. The drive-over grid also reduces the total amount of direct rainfall entering the system and avoids the need for any initial buffer tank storage. In all other situations, unless natural slopes can permit gravity transfer then a pump will be needed. Simple types of single phase submersible centrifugal pumps (up to 6 m head, approx. 200 watt motors) controlled by an integral float switch, with correct circuit protection, have been used successfully. All electrical equipment must be installed to current required electrical safety standards. 110 volt pump options are also available. Pipework suitable for transfer up to about 30m distance may be needed and with minimal lift this can be kept to 32 mm diameter (25 mm ID). 3.1.5 Distribution of collected liquid over biobed Drip irrigation pipes placed on the surface of either system have been effective. Drip emitters spaced at 30 cm and with the pipes 30 cm apart have resulted in practical distribution. Surface installation attracts small animals and some vermin problems have been found with thin walled drip “tape” systems. Burial of the tape may only be practical on the turfed soil system due to the need to annually top up the biobed systems. “Hard” hose drip systems may overcome the pest problems but would be more expensive. The submersible pumps (mentioned above) have dealt with the system pressures adequately in “tape” type drip systems. Distribution could be effective with a small sprinkler system but this poses potential challenges with drift, grass kill and working pressures within the pipe system. The drip system appears to maintain turf growth well on the soil based system. 3.2 Biobed sizing The developing science of biobed technology suggests that activity is most effective with biobeds 0.8-1.0 m deep. A surface area of 5m x 4 m has been shown to be appropriate to a concrete intercept area of 35 m2. Essentially this suggests a ratio of 1 m2 intercept to 0.6 m2 biobed. The biobed is suggested as being included within a lined pit or tank excavated to minimise soil movement, i.e. with side slopes of 30-350 dependent on soil type.

R&D PROJECT RECORD P2-200/PR 93
DRAFT
3.3 Should the biobed be lined? It is likely that an artificial liner will be required where washdown of the sprayer equipment is included. This ensures that all liquids are retained before being discharged via a designated disposal option. The liner material of a type suitable for small reservoirs should suffice. This is likely to be not less than 1.5mm thick and should be installed over a recommended geotextile mat and/or 25 mm sand blinding. The liner will require a bonded outlet point to convey all liquid from the biobed to the final distribution system. This unrestricted throughflow of liquid is vital to ensure that the biobed or turfed soil area is not waterlogged (anaerobic) and thus become ineffective. In the case of a site being just a handling and mixing area then a liner may not be required. With washdown facilities included, this aspect will need careful consideration with the local Agency office, with respect to Groundwater Regulations at each site. 3.4 Biobed mix Successful breakdown of pesticide residues has been achieved with a mixture by volume of 50% straw (wheat or barley), 25% soil and 25% peat-free compost. For guidance on mixing see later section on constructional details. Soil selection is critical to both ease of mixing and in biobed performance. Heavy clays, with poor drainage characteristics should be avoided. Loamy soils, which afford easy mixing and predictable drainage in situ with low compaction problems are more suitable. There is a benefit in covering the biobed area with turf. This ensures that there is good rooting activity and probably assists in moisture management, through evapotranspiration of water to the atmosphere. The turf does not need to be of high quality, turves from any established pasture field appear to function well. 3.5 Water outflow from biobed areas It is most likely that at the outfall from the biobed a pump will be necessary to either distribute the water to the designated disposal area directly or to a buffer tank. A similar type of pump as used in the initial transfer is satisfactory for this operation. With satisfactory treatment by the biobed area this water should have a very low or undetectable pesticide content. However it will need to be managed during distribution onto land. To meet this requirement, a buffer tank may be necessary to allow managed applications linked to local rainfall and soil conditions. This tank is again unlikely to be less than 3 m3. The distribution of the water can again be by drip irrigation or sprinkler system. The scheme would normally apply in the order of 2-4 mm per 24 hours, dependant on a number of local site factors. The precise specification for the drip irrigation will depend on the soil type and the size of the disposal area allocated. Hard hose type would again be preferred, unless burial of the tape type could be adopted. This could remain undisturbed for several years.

R&D PROJECT RECORD P2-200/PR 94
DRAFT
The location of this final distribution area will need to be discussed with the local Agency office and possibly an Authorisation under the Groundwater Regulations obtained. 4. CONSTRUCTIONAL DETAIL 4.1 Site selection The proximity of the on-site chemical store and water supply will influence the location of the pesticide handling and washdown area. The intention is to handle and open all chemical containers over the intercept area. Therefore this area should be close to the store but separate from the store bund. The water supply filling pipe connected to the sprayer should maintain the coupling well inside the handling area. Practically, having the intercept area approx. 4 m max from store and water appears sensible. The intercept site should not be close to any existing yard “flash flood” routes or roof rainwater outlets. Whilst the area will be bunded this might not suffice if the general site is incorrect. The prospect of roofing the area implies high cost. Such a structure would need to ensure access above the sprayer and include some side cladding. The minimisation of the handling area and limitation of other yard water is likely to be a better and more cost-effective option than roofing the entire area. The site should not intersect any common yard traffic routes. Contamination of wheels can lead to pollution elsewhere. Thus both the position of the area and the bund should preclude any casual use as a short cut or as a parking area. Its provision and siting should promote a “spraying use only” attitude amongst all involved. Local watercourses and drains will also influence the site selection. The whole approach to an area being developed is to ensure pesticide contaminated water is handled discreetly from all other waters. This is easier if some distance from potentially vulnerable sites can be provided to limit accidental functions. It is suggested that any disposal area should be over 10m from any open watercourse. The site should be close to a single phase electrical supply, with earth leakage protection installed to the appropriate electrical standard. Savings in design can be made if gravity can be used for liquids transfer. Bear in mind that initial silt traps and possibly storage tanks can be set into the ground (at 1.5 m depth), thus site levels & falls and distances must be determined accurately if the need for any pump is to be avoided. Close proximity to public access routes, e.g. footpaths is to be avoided. Whilst the aim is to lessen risk through the final discharge of any liquid, the handling area can be heavily contaminated and inadvertent use should be discouraged at all times.

R&D PROJECT RECORD P2-200/PR 95
DRAFT
4.2 Specifications INDIRECT systems have a common layout and component parts. Inclusion of a straw based biomix or soil in the biobed area is one of personal preference. DIRECT systems limit the number of pumps or chambers necessary. The overall area of any grid may be larger to cover supports over any foundation walls. 4.2.1 INDIRECT to biobed Sprayer standing area where handling and mixing will take place. New system – concrete (see Figure 4.1) Remove existing topsoil. Excavate as necessary to allow for the following construction:- 150 mm thick ST5 mix concrete with 2 layers mesh reinforcement pattern A252, with minimum cover of 40mm, on 1200g dpm, on a 25 mm sand blinding, on a 150 mm thick well compacted hardcore. Slab to be laid to falls of not less than 1 : 100. Slab to have a raised bund edge of minimum 300 mm x 100 mm. All as shown in Figure 4.1. Install 100mm x 100 mm deep Arco type drain, installed with manufacturers instructions, taken to trapped gully with a 50 mm diameter concentric rib reinforced PVC-U connection to a silt trap. Silt trap, with removable cover to provide 250 mm capacity below inlet pipe.

R&D PROJECT RECORD P2-200/PR 96
DRAFT
Figure 4.1

R&D PROJECT RECORD P2-200/PR 97
DRAFT
Existing concrete area – modified to form handling and mixing area Inspect concrete to ensure surface free from damage, pitting and cracks. Check fall is adequate as above. If not a new area may be required. If no drain available to be intercepted, cut concrete suiting the fall to accept 100mm x 100 mm deep Arco type drain, installed with manufacturers instructions, taken to trapped gully with a 50 mm diameter concentric rib reinforced PVC-U connection to a silt trap. Silt trap, with removable cover to provide 250 mm capacity below inlet pipe. Prepare surface at size edge to provide a key to accept raised bund edge of minimum 300 mm x 100 mm. This may need existing surface roughened including bonding agents or similar to accept concrete mix. Pumped transfer Excavate and install chamber to act as intermediate impervious reservoir for pump installation. Nominal size 0.75 m x 0.75 m x 0.75 m. Provide 50 mm concentric rib connection from silt trap to chamber. Install submersible pump, including float switch control. Provide and install suitable electrical supply to pump. Pump likely to have nominal capacity = 50 l/min @ 6.5m head. (approx. 200 w motor). Float switch nominally affords 0.25m depth in tank between on /off cycles, i.e. approx. 3 minute run time and meets most expected rainfall intensities on the intercept sizes suggested. Buffer Storage Discharge from any good quality concrete intercept area will produce 1 litre of water for every 1 mm of rainfall which falls on one square metre. Thus, it is prudent, in order to manage the moisture content of the biobed, to hold an amount of the liquids from the handling and mixing area in a buffer storage tank. It is a relatively frequent occurrence to have 25 mm of rain within 24 hours, thus almost 1 m3 may be collected. This tank will hold all spills; drainage etc so it would be prudent to ensure this is approx. 3m3 for most arable areas, e.g. rainfall up to 750 mm per annum. Precise constructional details for the installation of this tank will vary with design. Where a pump is needed for transfer the tank could be above ground. Frost proofing must be taken into account to a greater degree with this option. Where a below ground tank is selected guidance must be taken from the suppliers regarding the bedding of the tank within the soil. Liquid transfer to biobed It is important to distribute the liquid evenly over the biobed. The biobed surface area is not large and above ground small sprinklers may still provide excessive wetted areas. Tape type drip irrigation has been used successfully. This has a low pressure demand (nominally 7 m head). Emitters from this pipe have a flow of 1.6-2 l/h and may be spaced at 0.25-0.4 m with pipes spaced a similar distance apart. Hard hose systems are preferred for reasons stated earlier and should give a longer life, which counters their higher cost.

R&D PROJECT RECORD P2-200/PR 98
DRAFT
The submersible pump as used in the initial pumped transfer can be used here. The control of this pump should be by time and tank level control. With a drip irrigation outline as above approx. 4 mm liquid can be applied within 15 minutes. Thus it is relatively easy to manage the water flow within the biobed taking account of average and peak rainfall occurrences. Pressure head characteristics of these submersible pumps vary but those used within the research projects have supplied the drip tape adequately. Other sprinkler types of irrigation may be used but care should be taken to avoid drift and overlapping or non-biobed areas. Sprinkler systems are likely to require a higher pressure system and this could challenge the pump selection to accommodate this. Biobed construction A pit must be excavated to contain the biobed mix. This could be a shape to suit any tank or lining system, so long as the effective depth of the biobed is 0.8-1.0m and an outlet drain is provided at the base to ensure unrestricted water throughflow. Where a flexible liner is selected the liner manufacturers recommendations for installation must be followed. Successful biobed operation has been found with soil side slopes of 30-350
blinded with 25mm sand. Over this a geotextile membrane of 190 grams per square metre an artificial liner is installed. The liner must be anchored securely to the soil surface in line with manufacturers instructions. The liner is likely to be 1.5 mm thick and of a synthetic material. 100 mm drain is then bonded to the liner at the low point compatible with site layout. (See Figure 4.2 - suited to direct and indirect systems) A coarse filter should be installed over the drain intake to prevent the biomix material clogging the pipe. This is likely to be approx. 4 mm square mesh. Dependent on constructional plans and timing this liner may need filling with water (blocking the drain temporarily) to hold it in place until the biomix material is prepared.

R&D PROJECT RECORD P2-200/PR 99
DRAFT
Figure 4.2

R&D PROJECT RECORD P2-200/PR 100
DRAFT
Biobed mix This has been prepared successfully by layering the ingredients on a concrete yard area and then handling the material with a telehandler and manure fork (or similar machine). Small amounts may be handled manually with manure forks. A mixture, by volume, of 50% straw, 25% soil and 25% peat-free compost should be prepared. There appears to be little requirement for overlong mixing so long as the resultant mix can be left for some 6-8 weeks prior to loading in the biobed pit. By this time the composting operation has begun and the mix is likely to be effective at retaining and degrading pesticide residues. Loading of the material into the pit should leave the surface slightly humped to allow for subsidence prior to establishing the drip irrigation and use. Turfing over the mix requires only pasture type turf. Reasonable care should be taken to ensure the turves butt well and that some moisture is added to encourage successful establishment. The turves root relatively easily into the biobed mix. Drip irrigation installation can then progress laying the pipes over the turf as per manufacturers instructions. Liquid Transfer from biobed A second chamber similar to the initial intercept chamber is required. Unless the site has a particularly beneficial slope it is likely that pumped transfer is required. Excavate and install a chamber to act as intermediate impervious reservoir for pump installation. (Similar to section on liquid transfer to biobed) Chamber size, nominally 0.75 m x 0.75 m x 0.75 m. Connect from biobed liner to this chamber by 100 mm PVC-U connection. Provide and install suitable electrical supply to pump. Install pump identical to handling and mixing area transfer above. Buffer storage Whilst it would be possible to pump directly to a disposal area this is considered unlikely without a degree of interim storage. This is due to rainfall variations and soil type / moisture content. Therefore a similar holding capacity to the initial handling and mixing area storage tank (minimum 3m3), dependent on rainfall is suggested. Installation requirements are similar. Irrigation of final discharge water to disposal area For similar reasons as before drip irrigation is proposed. Soil type will determine the spacing of both emitters and pipes. Light soils will require closer spacings, progressively wider spacing on heavier soils to a probable maximum of 0.5m being likely. A system should be installed to apply 2-4 mm at a time. Where a spacing as 0.5 x 0.5m is possible with emitter flow as before such an application would be possible within 30 minutes. It is possible to bury the drip irrigation some 50 mm below the soil surface which would control surface evaporation and minimise any bird / vermin problems.

R&D PROJECT RECORD P2-200/PR 101
DRAFT
This pump should be automatically controlled by time with override provided by level control and manual deactivation. 4.2.2 DIRECT to biobed
These systems are simpler in principle as gravity is used to advantage and the containment of liquids is confined to one area only. It is unlikely that any system exists currently to allow modification, therefore a “new” approach may simplify decisions. Drive-over grid The purpose of the drive-over grid is to prevent the spray vehicle and other compaction factors affecting the performance of the biobed and allowing easy vehicle traffic over the area. Therefore the specification for the grid must fully take account of the intended or any future weight of the spray vehicle. Whilst a mounted small sprayer may be in use now it may be prudent to plan for larger vehicles, perhaps on contract spraying. Reference to Section 2.3 will determine whether or not a liner is needed. Where a liner is fitted, to avoid damage to the liner, the grid may need to be supported at the end and sides by foundation works accepting the complete spanning of the biobed. Some Scandinavian designs include only channels placed lengthways over the biobed, which support the vehicle wheels only. The operator thus stands on the biobed surface. On Health and Safety grounds, when handling chemical containers safely, this is considered undesirable, as a firm footing is required. The biobed itself, particularly if a straw/soil/compost mix is also not likely to function well if it is continuously compacted by the operators feet. Many spray vehicles approach any handling area from slightly different routes on occasions. This places a need to specify the design to deal with such variable angle approaches or departures. Such a specification thus allows the operator complete freedom in any working routine. The surface grid will need to give a sure footing to the operator and allow all liquids to pass vertically though it. A 40 x 100 mm steel mesh over the supporting steel work is recommended. Soil/mud from tyres should easily enter the biobed area. The grid requires removable sections to allow for the annual topping up of the biobed material. These sections are likely to require mechanical aids to removal, e.g. hooks or eyes for loader forks etc as unless the sections are very small they will be too heavy for one person to handle. For end and side foundations, excavate to a firm subsoil base; shutter as necessary and lay a concrete mix ST5 liaising with grid supplier over the anchorage system for the grid. The drive-over grid should not accept liquids, other than those vertically above it. Therefore a bund, similar to that for the concrete intercept areas, should be installed with a raised bund edge of minimum 300 mm x 100 mm. All as shown in Figure 4.2.

R&D PROJECT RECORD P2-200/PR 102
DRAFT
Biobed construction Constructional details are the same as for an indirect system. Biobed mix Biobed mixing is the same as for an INDIRECT system. As all liquids fall directly through the grid no liquid distribution system is needed. Liquid Transfer from biobed An initial intercept chamber is required. Unless the site has a particularly beneficial slope it is likely that pumped transfer is required. For this excavate and install chamber to act as intermediate impervious reservoir for pump installation. Nominal size 0.75 m x 0.75 m x 0.75 m. Connect from biobed liner to this chamber by 100 mm PVC-U connection. Provide and install suitable electrical supply to pump. Install pump identical to handling and mixing area transfer under indirect systems. Buffer storage Whilst it would be possible to pump directly to a disposal area this is considered unlikely without a degree of interim storage. This is due to rainfall variations and soil type / moisture content. Therefore a similar holding capacity to that used in the indirect systems (minimum 3m3), dependent on rainfall is suggested. Installation requirements are similar to indirect system Irrigation of final discharge water to disposal area For similar reasons as with indirect systems drip irrigation is proposed. Soil type will determine the spacing of both emitters and pipes. Light soils will require closer spacings, progressively wider spacing on heavier soils to a probable maximum of 0.5m being likely. In order to plan any frequent irrigation a system should be installed to apply 2-4 mm at a time. Where a spacing as 0.5 x 0.5m is possible with emitter flow as before such an application would be possible within 30 minutes. It is possible to bury the drip irrigation some 50 mm below the soil surface which would control surface evaporation and minimise any vermin problems. This pump should be automatically controlled by time with override provided by level control (e.g. float switch) and manual deactivation. 4.2.3 INDIRECT to disposal Concrete draining to sealed tank prior to disposal Where biobed systems may not provide a solution to discharge from a handling and mixing area the liquid should be stored in a sealed tank and disposed of through a waste

R&D PROJECT RECORD P2-200/PR 103
DRAFT
disposal contractor or via a Groundwater Regulations Authorisation. There is merit in roofing over the area to limit rainfall and thus the amount of liquid to be disposed of. The INDIRECT system principle and layout for the handling and mixing area is proposed. Constructional and installation detail will be similar up to the primary tank. This tank requires sizing to be compatible with road tanker disposal and liquids intercepted (rainfall and ex-sprayer use). Such a tank may need to be quite large to deal with all rainfall peak intensities safely. For instance a normal road tanker could accept a pick up, probably between 10 - 20m3. For a 7 x 5 m handling and mixing / washdown area and reasonable sprayer use with rainfall the 10m3 amount may be produced within one month. Final transfer to road haulage will normally be by the vehicles own pump. If not then selection must take account of loading times required and any delay penalties. It is essential to park any collection vehicle on the intercept area during transfer due to possible leakages etc. during the transfer process. The size and position of all couplings on the vehicle will need to be considered when planning the handling and mixing area. 4.3 Safety All materials must be selected to suit the intended purpose. All construction and installation work must be carried out within the relevant sections of the Health and Safety at Work Act. All electrical work must follow the appropriate British Standard. Particular attention should be paid to the exterior nature of all equipment provision and installation having particular due regard to electrical function in close proximity to liquids and operators. 5. SYSTEM MANAGEMENT 5.1 Daily operation The system as installed should avoid the need for detailed management inputs every day. There will be a need to assess the installation during spraying operations for normal function as well as when periods of high rainfall are experienced. In addition, outside spraying activities, a weekly observation should include: Check
• Intercept / grid areas for soil/mud deposits, brush up and transfer to biobed areas or push through the drive-over grid.
• Silt traps. If blocked, wearing suitable hand and face protection remove any trapped material by hand trowel or small shovel to adjacent biobed area.
• Liquid depth in all chambers, pump operation • Drip irrigation function-biobed area and disposal area, damage/leaks etc. • Condition of all biobed vegetative growth.

R&D PROJECT RECORD P2-200/PR 104
DRAFT
In periods of high rainfall it may be necessary to manually manage the pumping intervals applying to both the biobed and disposal irrigation systems. Experience will guide necessary action relative to soil types, capacities installed and system interaction. 5.2 Annual maintenance As with any composted material it is anticipated that the biomix material will degrade steadily through each year. Topping up of the biomix material will probably be required annually when approx. 300 mm of fresh biomix may need to be added. This procedure is expected, from Swedish experience, to be necessary each year for 5-7 years. At that time it is beneficial to remove all the biomix material to a safe location where it may composted for a further year to allow further pesticide degradation. During that year it is beneficial to turn or mix the compost thus ensuring maximum degradation of any remaining pesticides. The disposal of this material will be required to comply with the relevant waste regulations. The soil / turf mixture life is less well documented. Its life may be indicated by any vegetative growth performance. Final destiny for this material may also be as for the composted material above. 5.3 Cold weather provision Each site and installation will present different challenges during winter conditions. Most systems will need to remain functional during cold weather to handle natural rainfall entering the system. Installations should limit all surface pipe runs as far as possible. Where they exist they should be insulated to an effective level using proprietary waterproof pipe insulation. Most systems will be vulnerable where drip irrigation is used over biobed surfaces. It is suggested that these be covered with a straw layer for insulation purposes. 6. COSTS Indications of expected costs are given below. Inevitably these will vary depending on site and systems selected as well as whether any part of any system already exists and can be incorporated into the design. Bunded pesticide and mixing area, with drain and trap – concrete £ 40-50 per m2
Small pump chambers £250 each Pumps £60 each Electrical supply, time switches etc £350 per site Liner and membrane 5 x 4 m, nominal biobed with drain £800 3m3 plastic water storage tank-double skin £800-1500

R&D PROJECT RECORD P2-200/PR 105
DRAFT
Drive over grid – suited to loaded self propelled 24 m sprayer £90 per m2
Drip irrigation – biobed distribution and disposal area £300 Roofing area – single span, mono pitch £20-25 per m2
These costs, all for proprietary new items, suggest that one new un-roofed indirect system using two tanks on a new concrete surface could result in expenditure in the range of £6,000-7,000. The drive-over lined biobed option would require a similar level of expenditure. Many variables exist with each site, especially where part schemes already exist. Modifications to such schemes, using farm or local construction skills, may mean that in reality the actual expenditure may well be considerably lower than this.

R&D PROJECT RECORD P2-200/PR 106
APPENDIX 2.1: Stage 2 - First application data Dates: 07/06/00 - 01/08/00 (Total Rainfall 76.1mm) Biobed (Throughflow- Total 20.4l)* Total Loss
(% of applied)% of applied lost per mm rain
Max. Conc. (µg l-1)
Dimethoate BDL <0.001 <0.1 Chlorothalonil BDL <0.001 <0.3 Epoxiconazole 0.01 <0.001 <0.1 (* Total Rainfall 146.2mm, inc. extra irrigation)
Soil/Grass (Throughflow- Total 37.5l )+ Total Loss
(% of applied)% of applied lost per mm rain
Max. Conc. (µg l-1)
Dimethoate 0.01 <0.001 <0.1 Chlorothalonil 0.01 <0.001 <0.3 Epoxiconazole 0.03 <0.001 0.2 (+ Total Rainfall 158.2mm, inc. extra irrigation)
Hardcore (Throughflow- Total 59.15l)# Total Loss
(% of applied)% of applied lost per mm rain
Max. Conc. (µg l-1)
Chlorothalonil 0.01 <0.001 0.5 Epoxiconazole 0.07 <0.001 0.7 Dimethoate 0.14 0.001 3 (# Total Rainfall 106.1mm, inc. extra irrigation)
Asphalt (Runoff and Throughflow- Total 95.6l)
Total Loss (% of applied)
% of applied lost per mm rain
Max. Conc. (µg l-1)
Chlorothalonil 0.23 0.232 70 (throughflow)
Epoxiconazole 1.29 1.295 20 (runoff) Dimethoate 8.36 8.359 300
(throughflow) Porous Paving (Throughflow- Total 89l) Total Loss
(% of applied)% of applied lost per mm rain
Max. Conc. (µg l-1)
Chlorothalonil 0.14 0.002 20 Epoxiconazole 1.48 0.019 4 Dimethoate 10.72 0.140 90 Concrete (Runoff & Throughflow- Total 64.1l)
Total Loss (% of applied)
% of applied lost per mm rain
Max. Conc. (µg l-1)
Chlorothalonil 5.42 5.416 690 Dimethoate 8.65 8.647 430 Epoxiconazole 12.92 12.919 220

R&D PROJECT RECORD P2-200/PR 107
APPENDIX 2.2: Stage 2 - Second application data Dates: 13/10/00 – 21/11/00 (Total Rainfall 140.7mm) Soil/Grass (Throughflow- Total 139.4l)
Total Loss (% of applied)
% of applied lost per mm rain
Max. Conc. (µg l-1)
Dimethoate 0.02 <0.001 <0.1 Epoxiconazole 0.07 <0.001 <0.1 Pendimethalin 0.01 <0.001 <0.2 Chlorothalonil 0.01 <0.001 0.3 Isoproturon 0.01 <0.001 2 Chlorpyrifos 0.02 <0.001 0.3 Biobed (Throughflow- Total 147.1l) Total Loss
(% of applied)
% of applied lost per mm rain
Max. Conc. (µg l-1)
Dimethoate 0.02 <0.001 <0.1 Isoproturon 0.01 <0.001 <0.3 Epoxiconazole 0.07 <0.001 <0.1 Chlorothalonil 0.01 <0.001 <0.3 Pendimethalin 0.01 <0.001 0.2 Chlorpyrifos 0.02 <0.001 0.5 Jimsorb Biobed (Throughflow- Total 141.2l)
Total Loss (% of applied)
% of applied lost per mm rain
Max. Conc. (µg l-1)
Chlorothalonil 0.02 <0.001 0.2 Pendimethalin 0.01 <0.001 0.8 Chlorpyrifos 0.03 <0.001 0.8 Isoproturon 0.04 <0.001 6 Dimethoate 0.07 <0.001 0.8 Epoxiconazole 0.18 0.001 0.8 Asphalt (Runoff+Throughflow- Total192.9l)
Total Loss (% of applied)
% of applied lost per mm rain
Max. Conc. (µg l-1)
Epoxiconazole 0.11 0.099 <0.1 Pendimethalin 0.01 0.009 0.5 (runoff) Chlorpyrifos 0.03 0.032 1 (runoff) Chlorothalonil 0.02 0.024 3 (runoff) Dimethoate 0.23 0.332 2 (throughflow)

R&D PROJECT RECORD P2-200/PR 108
Isoproturon 1.39 1.554 50 (throughflow)
NB: Some problems with sample collection
on application day Jimsorb Hardcore (Throughflow- Total 173.5l)
Total Loss (% of applied)
% of applied lost per mm rain
Max. Conc. (µg l-1)
Epoxiconazole 0.09 <0.001 0.2 Pendimethalin 0.05 <0.001 3 Dimethoate 0.07 <0.001 2 Chlorothalonil 0.08 <0.001 4 Chlorpyrifos 0.14 0.001 8 Isoproturon 0.86 0.006 50 Hardcore (Throughflow- Total 184.2l)
Total Loss (% of applied)
% of applied lost per mm rain
Max. Conc. (µg l-1)
Pendimethalin 0.01 <0.001 0.5 Chlorothalonil 0.02 <0.001 0.8 Epoxiconazole 0.11 <0.001 0.3 Chlorpyrifos 0.04 <0.001 0.7 Dimethoate 0.11 <0.001 2 Isoproturon 1.23 0.009 50 Porous Paving (Throughflow- Total 188.4l)
Total Loss (% of applied)
% of applied lost per mm rain
Max. Conc. (µg l-1)
Pendimethalin 0.11 <0.001 7 Chlorothalonil 0.14 0.001 6 Chlorpyrifos 0.27 0.002 4 Epoxiconazole 1.06 0.008 5 Dimethoate 4.96 0.035 70 Isoproturon 15.73 0.112 730 Concrete (Runoff- Total 102.6l) Total Loss
(% of applied)
% of applied lost per mm rain
Max. Conc. (µg l-1)
Dimethoate 8.50 8.494 720 Chlorpyrifos 14.5 14.486 2230 Pendimethalin 14.69 14.671 6330 Chlorothalonil 15.76 15.761 2880 Epoxiconazole 19.05 19.044 360 Isoproturon 29.52 29.519 18190

R&D PROJECT RECORD P2-200/PR 109
APPENDIX 2.3: Stage 2 - Third application data Dates: 05/12/00 - 07/02/01 (Total Rainfall 146.5mm) Biobed (Throughflow- Total 161.3l)
Total Loss (% of applied)
% of applied lost per mm rain
Max. Conc. (µg l-1)
dimethoate BDL <0.001 <0.1 chlorothalonil BDL <0.001 <0.3 isoproturon BDL <0.001 <0.3 chlorpyrifos BDL <0.001 <0.2 epoxiconazole 0.01 <0.001 <0.1 pendimethalin BDL <0.001 <0.2
Jimsorb Biobed (Throughflow- Total 163.4l)
Total Loss (% of applied)
% of applied lost per mm rain
Max. Conc. (µg l-1)
Epoxiconazole 0.01 <0.001 <0.1 Chlorothalonil 0.06 <0.001 70 Isoproturon 0.10 0.001 180 Dimethoate 0.11 0.001 20 Pendimethalin 0.17 0.001 100 Chlorpyrifos 0.24 0.002 70
Soil/Grass (Throughflow- Total 156l)
Total Loss (% of applied)
% of applied lost per mm rain
Max. Conc. (µg l-1)
Epoxiconazole 0.01 <0.001 <0.1 Chlorothalonil 0.14 0.001 50 Chlorpyrifos 0.29 0.002 70 Pendimethalin 0.43 0.003 290 Isoproturon 0.60 0.004 345 Dimethoate 2.06 0.014 120
Hardcore (Throughflow- Total 184.7l)
Total Loss (% of applied)
% of applied lost per mm rain
Max. Conc. (µg l-1)
Chlorothalonil 0.31 0.002 170 Pendimethalin 0.32 0.002 250 Chlorpyrifos 0.32 0.002 160 Epoxiconazole 0.59 0.004 30 Isoproturon 2.57 0.018 2180 Dimethoate 4.38 0.030 210
Jimsorb Hardcore (Throughflow- Total 175.8l)
Total Loss (% of applied)
% of applied lost per mm rain
Max. Conc. (µg l-1)
Pendimethalin 0.29 0.002 400 Chlorpyrifos 0.28 0.002 210 Chlorothalonil 0.32 0.002 440 Epoxiconazole 0.48 0.003 40 Dimethoate 0.93 0.006 110 Isoproturon 4.17 0.029 3140

R&D PROJECT RECORD P2-200/PR 110
Asphalt (Runoff+Throughflow-Total 181.8l)
Total Loss (% of applied)
% of applied lost per mm rain
Max. Conc. (µg l-1)
Chlorothalonil 0.73 0.721 2500 (throughflow)
Chlorpyrifos 1.02 0.998 1800 (throughflow)
Pendimethalin 1.48 1.470 6180 (throughflow)
Epoxiconazole 1.65 1.581 500 (throughflow)Isoproturon 1.78 1.695 1810
(throughflow) Dimethoate 6.93 6.911 730 (throughflow) Porous paving (Throughflow- Total 193.2l)
Total Loss (% of applied)
% of applied lost per mm rain
Max. Conc. (µg l-1)
Chlorothalonil 1.52 0.010 1970 Pendimethalin 9.01 0.062 14140 Chlorpyrifos 7.79 0.053 4980 Epoxiconazole 13.46 0.092 530 Dimethoate 20.83 0.143 980 Isoproturon 19.88 0.136 9570 Concrete (Runoff & Throughflow- Total 128.7l)
Total Loss (% of applied)
% of applied lost per mm rain
Max. Conc. (µg l-1)
Dimethoate 12.18 12.182 46000 pendimethalin 24.44 24.437 371940 epoxiconazole 22.39 22.389 18100 chlorpyrifos 22.74 22.744 157600 isoproturon 24.83 25.221 421340 chlorothalonil 30.09 30.091 200610

R&D PROJECT RECORD P2-200/PR 111
APPENDIX 3.1: Sprayer measurements
SPRAYER DIMENSIONS – 22 machines, S/P, trailer, mounted
V L
V L + boom
Height
Length allowance plus 1.5 m (0.75m either end) Width = Overall width with boom Allowance = Plus 1.0 m either side for working
Variable position

R&D PROJECT RECORD P2-200/PR 112
APPENDIX 3.2: Typical sprayer dimensions Range of actual sprayer measurements found and with allowances suggested
Appendix 2
Actual dimensions with allowancemetre metre
Self propelled Vehicle Length V L + Boom Width Height Length WidthHouseham Imp 6.15 7.35 2.9 3.7 8.85 4.9
Super Imp 7.7 8.9 2.8 3.75 10.4 4.8Sprint 5.4 6.6 2.8 3.6 8.1 4.8Super Sprint 5.7 6.9 2.8 3.7 8.4 4.8
Sands 2000 6 7.3 2.9 3.3 8.8 4.9FCH 5.9 7.2 2.8 3.3 8.7 4.8FCH T 6.6 7.9 2.8 3.3 9.4 4.8
Chaviot 902 4.01 6 2.5 3.3 7.5 4.5Chavtrac 5.8 7.8 2.5 3.3 9.3 4.5Sprayranger 4.8 5 2.4 2.6 6.5 4.4F.Agribuggy 4.4 4.8 1.9 2.7 6.3 3.9Bateman Contour 2000 4.75 6.2 2.6 3.2 7.7 4.6Bateman Contour 2001 5.2 7.3 2.9 3.3 8.8 4.9
with 90 hp tractorTrailer Knight - Tracker 5 6 2.4 3 10.5 4.4
Knight - Tracker 3.7 5.1 2.4 2.9 9.6 4.4Technoma tracker 5.3 6.5 2.4 2.6 11 4.4Chafer - hitch 4.8 6.6 3 3.7 11.1 5Billericay - tracker 4.4 5.6 2.8 3.2 10.1 4.8
with 90 hp tractorMounted Lely 18m / 1000 1 1.7 2.4 3.4 6.2 4.4
Berthoud 1000 1.2 2.1 2.5 3.6 6.6 4.5Gem 12/1000 1.3 1.9 2.4 3.2 6.4 4.4
Front tank Lely 600 l 1.3 1.3 7.5

R&D PROJECT RECORD P2-200/PR 113
APPENDIX 3.3: Trellis dome polytunnel layout
12 m
6 m
PLAN Standard 6 m span
3.8 m
2 m
Trellis dome polytunnel SECTION

R&D PROJECT RECORD P2-200/PR 114
APPENDIX 3.4: Hesston bale-polytunnel layout
3.6 m
Polytunnel arch
Hesston type bales
Slope from far end
3.6 m

R&D PROJECT RECORD P2-200/PR 115
APPENDIX 3.5 Biobed layout
1 m
5 m
6 m
4 m
5 m
S/P sprayer / trailer fill area Mounted sprayer overall 4m long, 3m wide.
In fill as biobed (compost / mixed straw. Alternative is soil with grass over totally.
Grass area
BIOBED AREA, Dimensions also for grass / soil area

R&D PROJECT RECORD P2-200/PR 116
APPENDIX 3.6: Site visit – proposed full-scale sites, Lincs, 4 April 2001 Commercial Sites Report as at 4th April 2001 by Bill Basford Following the Biobeds Meeting at EA on 26/3/01 and Project Steering Group at HRI Wellesbourne on 28/3/01 a decision was taken to source commercial sites for 3 surface studies in 2001. The three surfaces are now agreed as 1. Concrete intercept, drained to a biobed 2. Drive over biobed 3. Concrete intercept, drained to soil/grass area. On 2/4/01 Steve Rose and Bill Basford visited a Lincolnshire farming business seeking co-operation with site provision. 5 existing filling / mixing areas were seen over a 1600 ha business. All currently used by a Sands 2500 self propelled or Chaviot self propelled sprayers. Each site services a minimum block of 170 ha, each site has an independent water supply. All cropping is combinable/ vining peas. From the 5 sites three were identified as providing a suitable opportunity to meet the three options as above. These 3 sites exist within a 3.2 km radius within the business. The 2 remaining sites are virtually new level concrete with no bund edges. Some excess flow noted off concrete, both sites more distant in access. The host is extremely interested in the study and has offered co-operation with the project over a 1 –2 season development as discussed. Dedicated sprayers could be linked to each site use. No formal agreement has been made yet but details are included below for steering group use only currently. The prospective host is John Rainthorpe, R & R Farms (also JDR Farms), Reasby Hall, Stainton by Langworth, Lincoln, LN3 5BW. The three sites are as below: Reasby Hall, Soil series - Salop. Currently broken soil surface, adjacent to water supply and chemical store. Power available. At lowish point of yard currently undergoing remodelling but bunding and bollarding could restrict water inflow / traffic use respectively. This site suggested as Intercept to biobed. Friesthorpe Farm, Soil series - Salop. Currently various rammed hardcore surface adjacent to water supply, power available. At farm road side but gradients etc suggest site suitable for Drive Over Biobed.

R&D PROJECT RECORD P2-200/PR 117
Scothern Grange, Soil series - Wickham 2. Currently water tank parallel to yard but immediate area at yard edge is volunteer cereals, grass, weed surface. Concrete area sufficient for modification to intercept bunded area to then supply a “grass/soil” option as with site 1. Power available. All sites have large concrete yards adjacent and are easily accessible by normal vehicles. In addition existing tarmac / hardcore sites exist which J Rainthorpe has offered for destructive sampling / analysis. Each option has been drawn schematically on 3 following drawings. Concrete Intercept to Biobed Collect - No problem with site as would be new concrete. Bunding vital to exclude yard influence, may need extra intercept drains higher up yard. Flowmeter considered essential on intercept area drain. Buffer and transfer – 3m3 tank suggested to take 10 year return heaviest 1 day rainfall event per year. (30 mm). Small electric pump to deliver flow to drip irrigation Biobed – Surface area reduced to minimise rainfall influence, 5 m x 4 m suggested, 1 m deep. Biobed lined with drainage port only to accommodate experimental monitoring. Drip irrigation over biobed area to give good spatial distribution of liquid transferred. Biobed surface turfed. Hold / disposal – 5 m3 tank suggested to accommodate rainfall events as above and throughflow from system. Drive Over Biobed Collect / Biobed – Drive over grid meshed to allow safe operation of operator without compaction to biobed matrix. Biobed lined for experimental purposes only. Liner with drainage port and valve for transfer / sampling. Biobed surface turfed Transfer / hold / disposal – Flowmeter essential inline to secondary tank. Reduced size tank (5 m3). Concrete Intercept to Soil/Grass Collect - No problem with site, concrete to be bunded and drained to collection sump. Bunding vital to exclude yard influence. Flowmeter considered essential on intercept area drain. Buffer and transfer – 3m3 tank suggested to take 10 year return heaviest 1 day rainfall event per year. (30 mm). Small electric pump to deliver flow to drip irrigation Soil/Grass area – Surface area reduced to minimise rainfall influence, 5 m x 4 m suggested, 1 m deep. Area lined with drainage port only to accommodate experimental

R&D PROJECT RECORD P2-200/PR 118
monitoring. Drip irrigation over soil/grass area to give good spatial distribution of liquid transferred. Hold / disposal – 5 m3 tank suggested to accommodate rainfall events as above and throughflow from system.

R&D PROJECT RECORD P2-200/PR 119
APPENDIX 3.7: Specification of works to Reasby Hall (concrete intercept to biobed) H & S at Work All ADAS staff and any sub contractors to follow relevant HSW risk assessment procedures. Underground Services The whole area destined for involvement in the research project will be scanned by appropriate equipment to determine the line of any service. Full discussion to be made on site with farms manager for full guidance. Procedure to follow Environment Agency Document EAS/6100/4/17 – Avoidance of Underground Services and ADAS SOP SAFE/003 - Managing Health and Safety in Construction. Jeff Lineker, ADAS Buildings Surveyor has received training in CDM regulations and has project managed various site operations from minor works to 2000 tonne grain store developments. Debris All debris shall be carted away unless otherwise stated. Concrete Intercept Area Remove existing topsoil and store on site for future use. Excavate as necessary to allow for the following construction:- 150mm thick ST5 mix concrete with 2 layers mesh reinforcement pattern A252, with a minimum cover of 40mm, on 1200g dpm, on 25mm sand blinding, on 150mm thick well compacted hardcore. Slab to be laid to falls of not less than 1 in 100. Slab to have a raised edge a minimum of 500mm x 100mm as shown on the drawing. Provide and install a 100mm x 100mm deep Arco type drain, installed in accordance with the manufacturers instructions, taken to a trapped gully with a 50mm diameter concentric rib reinforced PVC-U connection to the silt trap. Silt Trap Provide and install a proprietary concrete silt trap from J.K.H. Drainage units Ltd. (01638 713795) with a minimum of 250mm silt capacity below the inlet pipe. To have a standard pressed steel manhole cover. Provide and install a 50mm concentric rib reinforced PVC-U connection to chamber A. Chamber A Excavate as necessary to allow for the installation of the chamber as follows:-

R&D PROJECT RECORD P2-200/PR 120
Provide and install a Big J inspection chamber from J.K.H. Drainage Units Ltd., to be 1220 x 1070 x 1390 deep. To be fitted in accordance with the manufacturers instructions and to be bedded on a minimum of 100mm thick ST5 mix concrete. Manhole cover to be pressed steel and to be open-able to expose the whole chamber The chamber shall have 4 access points for entry of 50mm concentric rib reinforced pipes Chamber B To be as for chamber A, but to be 1830mm x 1375 x 2000mm deep, access points as for chamber A. Manhole cover to be pressed steel and to be open-able to expose the whole chamber. Primary Tank Excavate as necessary to allow for the installation of a 3800mm x 1000mm x1000mm deep tank ( to be installed by others). Contractor to blind the base of the excavation with 150mm sand. Secondary Tank Excavate as necessary to allow for the installation of a 3000mm x 2700mm x 1000mm deep tank (to be installed by others). Contractor to blind the base of the excavation with 150mm sand. Lined Biobed Excavate as necessary to allow for the construction of the bio-bed. To be 5000mm x 4000mm at the surface and to have 1in 1.5 sloping sides and to be 1000mm deep. (all finished dimensions. Provide and install a 1000 TFS Monarflex Geomembrane on F32 Fibretex on 25mm sand blinding. Form a sump area to the base of the bio-bed as shown on the drawing with a 50mm diameter concentric rib reinforced PVC-U connection to chamber B Fill to biobed to be undertaken by ADAS and farm staff. Trenches Excavate as necessary to allow for the trenching as shown on the drawing, to be a minimum of 750mm deep. Contractor to allow for the backfill of the trenches and tanks at a later date. Electricity supply Relay electrical supply from the workshop overhead to the existing water tank and provide all necessary equipment to provide a 110 volt supply to chamber A and

R&D PROJECT RECORD P2-200/PR 121
chamber B in accordance with current IEE regulations. Duct supply to chamber B to be laid within the same trench to be used for the feeder pipework as shown on the drawing.

R&D PROJECT RECORD P2-200/PR 122
APPENDIX 3.8: Specification of works to Friesthorpe Farm (drive-over biobed) H & S at Work All ADAS staff and any sub contractors to follow relevant HSW risk assessment procedures. Underground Services The whole area destined for involvement in the research project will be scanned by appropriate equipment to determine the line of any service. Full discussion to be made on site with farms manager for full guidance. Procedure to follow Environment Agency Document EAS/6100/4/17 – Avoidance of Underground Services and ADAS SOP SAFE/003 - Managing Health and Safety in Construction. Jeff Lineker, ADAS Buildings Surveyor has received training in CDM regulations and has project managed various site operations from minor works to 2000 tonne grain store developments. Debris All debris shall be carted away unless otherwise stated. Existing Diesel Tank Following planned pollution control strategy carefully remove the existing diesel tank and store on site for re-use by the farm. Demolish the existing concrete block tank stand. Chamber A Excavate as necessary to allow for the installation of the chamber as follows:- Provide and install a Big J inspection chamber from J.K.H. Drainage Ltd (01638 713795) . to be 1220 x 1070 x 2000mm deep. To be fitted in accordance with the manufacturers instructions and to be bedded on a minimum of 100mm thick ST5 mix concrete. Manhole cover to be pressed steel and to be open-able to expose the whole chamber. The chamber shall have 4 access points for entry of 50mm concentric rib reinforced pipes. Secondary Tank Excavate as necessary to allow for the installation of a 3000mm x 2700mm x 1000mm deep tank (to be installed by others). Contractor to blind the base of the excavation with 150mm sand.

R&D PROJECT RECORD P2-200/PR 123
Lined Biobed Foundations Excavate as necessary to allow for the following foundations for the steelwork supplied and erected by others. 4 number 1250mm x 1250mm x 700mm deep pads in ST5 mix concrete (contractor to liaise with steel erector for installation of anchors). 2 number strip footings 600mm x 6000mm x 450mm deep in ST5 mix concrete with 2 layers mesh reinforcement BS pattern A252. Liner Excavate as necessary to allow for the construction of the biobed. To be 7000mm x 5000mm at the surface and to have 1 in 1.5 sloping sides and to be 1000mm deep. (All finished dimensions). Provide and install a 1000 TFS Monarflex Geomembrane on F32 Fibretex on 25mm sand blinding. Form a sump area to the base of the bio-bed as shown on the drawing with a 50mm diameter concentric rib reinforced PVC-U connection to chamber A. Fill to biobed to be undertaken by ADAS and farm staff. Trenches Excavate as necessary to allow for the trenching as shown on the drawing, to be a minimum of 750mm deep. Contractor to allow for the backfill of the trenches and tanks at a later date. Electricity Install all necessary equipment to provide a 110 volt supply to chamber A and secondary tank in accordance with current IEE regulations. Form a trench to provide a below ground supply to chamber A, and a duct supply to the secondary tank to be laid within the trench for the feeder pipework as shown on the drawing. To allow for one pole for the electrical supply to run overhead.

R&D PROJECT RECORD P2-200/PR 124
APPENDIX 3.9: Specification of works to Southern Grange (concrete intercept area to soil/grass system) H & S at Work All ADAS staff and any sub contractors to follow relevant HSW risk assessment procedures. Underground Services The whole area destined for involvement in the research project will be scanned by appropriate equipment to determine the line of any service. Full discussion to be made on site with farms manager for full guidance. Procedure to follow Environment Agency Document EAS/6100/4/17 – Avoidance of Underground Services and ADAS SOP SAFE/003 - Managing Health and Safety in Construction. Jeff Lineker, ADAS Buildings Surveyor has received training in CDM regulations and has project managed various site operations from minor works to 2000 tonne grain store developments. Debris All debris shall be carted away unless otherwise stated. Water Supply Relocate water tank outfall in pipework to match existing to suit farm requirements. Concrete Intercept Area Remove existing topsoil and store on site for future use. Excavate as necessary to allow for the following construction:- !50mm thick ST5 mix concrete with 2 layers mesh reinforcement pattern A252, with a minimum cover of 40mm, on 1200g dpm, on 25mm sand blinding, on 150mm thick well compacted hardcore. Slab to be laid to falls of not less than 1in 100. Slab to have a raised edge a minimum of 500mm x 100mm as shown on the drawing. Provide and install a 100mm x 100mm deep Arco type drain, installed in accordance with the manufacturers instructions, taken to a trapped gully with a 100mm diameter concentric rib reinforced PVC-U connection to chamber A. Silt Trap Provide and install a proprietary concrete silt trap from J.K.H. Drainage Ltd. (01638 713795) with a minimum of 250mm silt capacity, below the inlet pipe. To have a standard pressed steel manhole cover. Provide and install a 50mm concentric rib reinforced PVC-U connection to chamber A.

R&D PROJECT RECORD P2-200/PR 125
Chamber A Excavate as necessary to allow for the installation of the chamber as follows:- Provide and install a Big J inspection chamber from J.K.H. Drainage Ltd, to be 1220 x 1070 x 1390 deep. To be fitted in accordance with the manufacturers instructions and to be bedded on a minimum of 100mm thick ST5 mix concrete. Manhole cover to be pressed steel and to be open-able to expose the whole chamber. The chamber shall have 4 access points for entry of 50mm concentric rib reinforced pipes. Chamber B To be as for chamber but to be 1220 x 1070 x 2000mm deep, to have 4 access points as for chamber A. Manhole cover to be pressed steel and to be open-able to expose the whole chamber. Primary Tank Excavate as necessary to allow for the installation of a 3800mm x 1000mm x1000mm deep tank ( to be installed by others). Contractor to blind the base of the excavation with 150mm sand. Secondary Tank Excavate as necessary to allow for the installation of a 3000mm x 2700mm x 1000mm deep tank (to be installed by others). Contractor to blind the base of the excavation with 150mm sand. Lined soil/grass area Excavate as necessary to allow for the construction of the soil/grass system. All topsoil and different ground strata to be stored nearby, independent of each other to allow for the filling of the soil/grass area (by ADAS and farm staff) to recreate the ground conditions found on site. To be 5000mm x 4000mm at the surface and to have 1 in 1.5 sloping sides and to be 1000mm deep. (All finished dimensions). Provide and install a 1000 TFS Monarflex Geomembrane on F32 Fibretex on 25mm sand blinding. Form a sump area to the base of the biobed as shown on the drawing with a 50mm diameter concentric rib reinforced PVC-U connection to chamber A.

R&D PROJECT RECORD P2-200/PR 126
Trenches Excavate as necessary to allow for the trenching as shown on the drawing, to be a minimum of 750mm deep. Contractor to allow for the backfilling of the trenches and tanks at a later date Electricity supply Excavate as necessary to for a trench to allow for relaying the existing electrical supply from the workshop, below ground to the existing water tank. Make good as necessary. Install all necessary equipment to provide a 110 volt supply to chamber A and chamber B in accordance with current IEE regulations. Form a trench to provide a below ground supply to chamber A, and a duct supply to secondary tank, to be laid within the same trench as used for the feeder pipework as shown on the drawing.

R&D PROJECT RECORD P2-200/PR 127
APPENDIX 4.1: Stage 4 - Concrete intercept to biobed site. Pesticide concentration data (µg/l) from concrete runoff samples and biobed leachate samples Concrete intercept to biobed Residue Level Handling Area Date collected Sample date/time Dimethoate Chlorothalonil Isoproturon Chlorpyrifos Pendimethalin Epoxiconazole Azoxystrobin Conc First Application Concrete 13-May-02 13/05/2002 8:54 <0.5 <0.1 <0.5 <0.1 <0.1 84 0.33 ppb Concrete 06-Jun-02 06/06/2002 11:29 18 18 84 60 131 9 <0.002 ppm Concrete 06-Jun-02 06/06/2002 11:30 13 17 125 102 191 11 <0.002 ppm Concrete 06-Jun-02 06/06/2002 11:34 26 106 190 93 228 11 <0.002 ppm Concrete 06-Jun-02 06/06/2002 11:36 28 74 141 106 200 11 <0.002 ppm Concrete 06-Jun-02 06/06/2002 11:38 16 37 117 74 151 8.6 <0.002 ppm Concrete 06-Jun-02 06/06/2002 11:41 9.4 19 68 25 81 3.1 <0.002 ppm Concrete 06-Jun-02 06/06/2002 11:42 7.4 6.3 <0.002 33 82 4.2 <0.002 ppm Concrete 06-Jun-02 06/06/200211:43 5.8 <0.002 <0.002 8.4 36 1.6 <0.002 ppm Concrete 06-Jun-02 06/06/2002 11:43 1.9 2.1 <0.002 14 46 3.2 <0.002 ppm Concrete 06-Jun-02 06/06/200211:44 2.4 1.9 <0.002 6.9 39 2.6 <0.002 ppm Concrete 06-Jun-02 06/06/2002 11:46 1.3 <0.002 <0.002 4.3 22 0.9 <0.002 ppm Concrete 06-Jun-02 06/06/2002 11:48 2 1.8 <0.002 8.7 32 2.7 <0.002 ppm Concrete 06-Jun-02 06/06/2002 11:50 2.4 1.8 <0.002 7.6 26 2.6 <0.002 ppm Concrete 06-Jun-02 06/06/2002 11:54 <0.002 <0.002 <0.002 1.8 5.7 0.5 <0.002 ppm Concrete 06-Jun-02 06/06/2002 12:02 1.4 0.92 <0.002 2 9.4 1.4 <0.002 ppm Concrete 06-Jun-02 06/06/2002 12:10 1.1 <0.002 <0.002 1.8 8.3 1.3 <0.002 ppm Concrete 10-Jun-02 09/06/2002 17:49 0.8 <0.002 7.1 0.2 <0.002 0.60 <0.002 ppm Concrete 10-Jun-02 09/06/2002 18:04 0.0404 <0.002 <0.002 0.0141 0.0171 0.1898 0.0262 ppm Concrete 10-Jun-02 09/06/2002 18:47 <0.002 <0.002 <0.002 0.0389 <0.002 0.30 <0.002 ppm Concrete 14-Jun-02 10/06/2002 11:05 0.0453 0.0498 <0.002 0.0111 0.0212 0.1824 0.0193 ppm Concrete 14-Jun-02 11/06/2002 9:03 0.25 <0.002 31 <0.002 0.44 0.36 1.1 ppm Concrete 14-Jun-02 12/06/2002 2:16 0.0513 0.0502 <0.002 0.0139 0.0821 0.181 <0.002 ppm Concrete 14-Jun-02 13/06/2002 23:49 <0.002 <0.002 0.80 <0.002 <0.002 <0.002 <0.002 ppm Concrete 21-Jun-02 20/06/2002 11:41 <0.002 <0.002 <0.002 <0.002 <0.002 0.0747 0.0378 ppm Concrete 21-Jun-02 20/06/2002 12:01 <0.002 <0.002 <0.002 <0.002 0.0277 0.0640 0.0309 ppm Concrete 28-Jun-02 26/06/2002 20:40 <0.002 <0.002 <0.002 0.0099 <0.002 0.0631 0.0292 ppm Concrete 28-Jun-02 27/06/2002 17:23 <0.002 <0.002 <0.002 0.0123 <0.002 0.0702 0.0230 ppm Concrete 28-Jun-02 27/06/2002 20:00 0.0032 <0.002 <0.002 0.0069 <0.002 0.0924 0.0238 ppm

R&D PROJECT RECORD P2-200/PR 128
Concrete 01-Jul-02 28/06/2002 14:46 <0.002 <0.002 <0.002 0.0107 <0.002 0.0541 0.0238 ppm Handling Area Date collected Sample date/time Dimethoate Chlorothalonil Isoproturon Chlorpyrifos Pendimethalin Epoxiconazole Azoxystrobin Conc Concrete 01-Jul-02 28/06/2002 14:47 <0.002 <0.002 <0.002 0.0150 <0.002 0.0634 0.0252 ppm Concrete 05-Jul-02 03/07/2002 10:44 <0.002 <0.002 <0.002 <0.002 0.0486 0.0819 0.0093 ppm Concrete 05-Jul-02 03/07/2002 17:37 <0.002 <0.002 <0.002 <0.002 0.0069 0.0460 0.0067 ppm Concrete 05-Jul-02 03/07/2002 17:52 0.0003 <0.002 <0.002 <0.002 0.0026 0.0771 0.0069 ppm Concrete 05-Jul-02 05/07/2002 1:12 <0.002 <0.002 0.0031 <0.002 0.0023 0.0578 0.0059 ppm Concrete 08-Jul-02 06/07/2002 11:36 <0.1 <0.002 <0.002 0.026 <0.002 0.069 0.038 ppm Concrete 08-Jul-02 08/07/2002 4:43 <0.002 <0.002 <0.002 0.0033 0.054 0.08 0.0092 ppm Concrete 12-Jul-02 09/07/2002 9:07 <0.002 <0.002 <0.002 <0.002 0.038 0.083 4.1 ppm Concrete 15-Jul-02 12/07/2002 10:49 <0.1 <0.002 0.0032 <0.002 <0.002 0.041 0.033 ppm Concrete 22-Jul-02 20/07/2002 3:11 <0.002 <0.002 <0.002 <0.002 <0.002 0.057 0.02 ppm Concrete 26-Jul-02 23/07/2002 6:06 <0.002 <0.002 <0.002 <0.002 <0.002 0.047 0.029 ppm Second Application Concrete 06-Sep-02 31/08/2002 17:33 <0.002 <0.002 <0.002 <0.002 0.006 0.0197 0.0169 ppm Concrete 12-Sep-02 12/09/2002 11:46 40.528 95.781 139.21 73.129 205.55 9.108 <0.002 ppm Concrete 12-Sep-02 12/09/2002 11:48 44.277 96.807 140.85 77.646 196.79 8.506 <0.002 ppm Concrete 12-Sep-02 12/09/2002 11:49 23.634 20.999 86.240 24.227 87.023 5.831 <0.002 ppm Concrete 12-Sep-02 12/09/2002 11:51 4.641 19.209 26.019 1.400 23.961 2.094 <0.002 ppm Concrete 12-Sep-02 12/09/2002 11:55 2.505 5.523 8.844 0.310 13.975 1.045 <0.002 ppm Concrete 12-Sep-02 12/09/2002 12:58 2.279 1.820 <0.002 0.069 8.978 0.938 <0.002 ppm Concrete 12-Sep-02 12/09/2002 12:00 1.793 1.968 2.667 0.039 4.341 0.866 <0.002 ppm Concrete 12-Sep-02 12/09/2002 12:02 1.276 1.426 <0.002 <0.002 3.520 0.827 <0.002 ppm Concrete 12-Sep-02 12/09/2002 12:04 1.130 1.387 <0.002 <0.002 4.379 0.780 <0.002 ppm Concrete 16-Sep-02 13/09/2002 11:11 1.97 3.81 5.51 1.92 10.60 1.55 <0.002 ppm Concrete 16-Sep-02 13/09/2002 11:18 0.03 3.17 3.38 1.74 4.77 1.51 <0.002 ppm Concrete 16-Sep-02 13/09/2002 11:24 0.53 0.63 2.89 0.63 1.80 0.39 <0.002 ppm Concrete 16-Sep-02 13/09/2002 11:31 0.51 0.62 0.00 0.38 2.23 0.42 0.22 ppm Concrete 24-Sep-02 23/09/2002 14:35 <0.002 <0.002 2.66 0.71 18.20 1.06 1.15 ppm Concrete 24-Sep-02 23/09/2002 14:51 <0.002 <0.002 5.37 1.31 42.40 2.02 1.65 ppm Concrete 27-Sep-02 25/09/2002 8:53 <0.002 <0.002 0.00 1.32 70.90 2.01 1.55 ppm Concrete 14-Oct-02 08/10/2002 9:37 <0.002 14.00 11.90 2.57 7.18 3.97 2.92 ppm Concrete 14-Oct-02 08/10/2002 8:48 <0.002 14.20 14.00 2.56 6.17 3.98 2.96 ppm Concrete 14-Oct-02 09/10/2002 8:15 0.168 0.370 0.265 0.079 1.320 0.137 0.075 ppm Concrete 14-Oct-02 12/10/2002 1:32 0.247 0.411 0.278 0.065 1.810 0.333 0.078 ppm Concrete 14-Oct-02 12/10/2002 7:15 0.219 0.395 0.282 0.064 1.390 0.293 0.077 ppm Concrete 14-Oct-02 12/10/2002 8:01 0.652 0.533 0.341 0.072 0.988 0.413 0.084 ppm

R&D PROJECT RECORD P2-200/PR 129
Concrete 18-Oct-02 15/10/2002 7:58 0.1548 0.0979 0.1442 0.0279 0.4968 0.1230 0.2039 ppm Handling Area Date collected Sample date/time Dimethoate Chlorothalonil Isoproturon Chlorpyrifos Pendimethalin Epoxiconazole Azoxystrobin Conc Concrete 18-Oct-02 15/10/2002 12:42 0.1064 <0.002 0.1453 0.0278 0.4750 0.1126 0.0801 ppm Concrete 18-Oct-02 15/10/2002 18:46 1.1831 <0.002 0.1443 0.0278 0.4049 0.2365 0.0691 ppm Concrete 18-Oct-02 15/10/2002 20:52 0.0640 <0.002 0.1519 0.0278 0.3416 0.0809 0.0635 ppm Concrete 21-Oct-02 20:10/2002 18:40 0.0612 <0.002 0.1519 0.0280 0.4378 0.0819 0.0560 ppm Concrete 21-Oct-02 20/10/2002 20:31 0.0943 <0.002 0.1556 0.0299 0.3674 0.0657 0.0563 ppm Concrete 21-Oct-02 20/10/2002 21:39 1.4759 <0.002 0.1518 0.0278 0.2205 0.1704 0.0578 ppm Concrete 21-Oct-02 21/10/2002 1:36 0.0573 <0.002 0.1532 0.0279 0.2252 0.0647 0.0560 ppm Concrete 25-Oct-02 21/10/2002 20:04 0.0048 <0.002 0.0173 <0.002 0.0541 0.0182 0.0012 ppm Concrete 25-Oct-02 23/10/2002 20:13 0.005 0.0084 0.0189 <0.002 0.0666 0.024 0.0014 ppm Concrete 28-Oct-02 26/10/2002 22:53 0.0044 0.009 0.0167 <0.002 0.2285 0.0232 0.0023 ppm Concrete 04-Nov-02 01/11/2002 16:03 <0.002 0.0095 0.0027 0.0029 <0.002 0.0143 <0.002 ppm Concrete 04-Nov-02 02/100/2002 21:56 <0.002 0.0038 <0.002 <0.002 <0.002 0.0183 <0.002 ppm Concrete 08-Nov-02 06/11/2002 7:16 <0.002 <0.002 <0.002 <0.002 0.036 <0.002 <0.002 ppm Concrete 08-Nov-02 06/11/2002 10:11 0.0045 0.008 0.0158 <0.002 0.0132 0.0174 <0.002 ppm First Application Biobed 22-Apr-02 12/04/2002 16:07 <0.5 <0.1 <0.5 <0.1 <0.1 0.62 7.1 ppb Biobed 26-Apr-02 24/04/2002 5:26 <0.5 <0.1 18 <0.1 <0.1 0.60 <0.1 ppb Biobed 07-Jun-02 06/06/2002 16:00 <0.5 <0.1 2.7 <0.1 <0.1 <0.1 1.63 ppb Biobed 07-Jun-02 06/06/2002 23:00 1.2 <0.1 5.4 <0.1 <0.1 <0.1 <0.1 ppb Biobed 10-Jun-02 07/06/2002 15:05 <0.5 0.2 68.8 0.3 1.8 <0.1 0.4 ppb Biobed 10-Jun-02 08/06/2002 8:28 <0.5 0.4 40.8 0.3 3.4 <0.1 0.4 ppb Biobed 10-Jun-02 09/06/2002 6:09 <0.5 1.2 50.6 0.4 <0.1 <0.1 0.3 ppb Biobed 10-Jun-02 10/06/2002 4:12 <0.5 0.1 37.3 0.3 <0.1 <0.1 0.5 ppb Biobed 14-Jun-02 11/06/2002 11:27 <0.5 <0.1 <0.5 <0.1 0.4 0.3 0.5 ppb Biobed 14-Jun-02 13/06/2002 21:34 <0.5 <0.1 <0.5 <0.1 0.4 0.3 0.4 ppb Biobed 17-Jun-02 15/06/2002 12:51 <0.5 1.1 <0.5 0.4 <0.1 0.1 <0.1 ppb Biobed 17-Jun-02 16/06/2002 22:54 <0.5 1.1 <0.5 0.4 0.4 0.1 5.4 ppb Biobed 21-Jun-02 19/06/2002 4:21 <0.5 <0.1 <0.5 <0.1 <0.1 0.2 0.6 ppb Biobed 21-Jun-02 20/06/2002 23:40 <0.5 <0.1 <0.5 <0.1 0.2 0.2 0.5 ppb Biobed 24-Jun-02 23/06/2002 8:49 <0.5 <0.1 <0.5 <0.1 <0.1 <0.1 0.3 ppb Biobed 28-Jun-02 27/06/2002 11:40 <0.5 0.1 <0.5 <0.1 <0.1 0.2 0.9 ppb Biobed 05-Jul-02 02/07/2002 20:36 <0.5 <0.1 <0.5 <0.1 <0.1 0.2 0.4 ppb Biobed 05-Jul-02 03/07/2002 22:36 4.1 0.2 <0.5 <0.1 <0.1 0.3 0.6 ppb Biobed 05-Jul-02 04/07/2002 18:22 <0.5 0.1 <0.5 <0.1 0.2 0.6 0.8 ppb Biobed 08-Jul-02 06/07/2002 0:58 5.4 <0.1 1.6 <0.1 <0.1 <0.1 <0.1 ppb

R&D PROJECT RECORD P2-200/PR 130
Biobed 08-Jul-02 06/07/2002 22:39 5.0 <0.1 1.2 <0.1 <0.1 <0.1 <0.1 ppb Handling Area Date collected Sample date/time Dimethoate Chlorothalonil Isoproturon Chlorpyrifos Pendimethalin Epoxiconazole Azoxystrobin Conc Biobed 08-Jul-02 07/07/2002 20:32 4.4 <0.1 1.2 <0.1 <0.1 <0.1 <0.1 ppb Biobed 12-Jul-02 10/07/2002 21:26 2.0 <0.1 <0.5 <0.1 0.1 0.4 0.1 ppb Biobed 15-Jul-02 13/07/2002 16:23 4.6 <0.1 <0.5 <0.1 <0.1 <0.1 0.2 ppb Biobed 19-Jul-02 16/07/2002 9:08 4.8 <0.1 <0.5 <0.1 <0.1 <0.1 <0.1 ppb Biobed 22-Jul-02 21/07/2002 21:54 1.9 <0.1 <0.5 <0.1 <0.1 <0.1 0.2 ppb Biobed 26-Jul-02 24/07/2002 11:29 2.7 <0.1 <0.5 <0.1 <0.1 <0.1 0.2 ppb Biobed 31-Jul-02 29/07/2002 8:15 1.5 <0.1 <0.5 <0.1 <0.1 <0.1 <0.1 ppb Biobed 02-Aug-02 01/08/2002 19:17 2.2 <0.1 <0.5 <0.1 <0.1 <0.1 <0.1 ppb Second Application Biobed 30-Aug-02 28/08/200 19:38 <0.5 1.0 <0.5 0.4 <0.1 0.1 0.4 ppb Biobed 13-Sep-02 13/09/2002 0:19 <0.5 0.3 <0.5 0.6 <0.1 <0.1 5.8 ppb Biobed 13-Sep-02 13/09/2002 2:20 <0.5 0.3 <0.5 0.6 0.3 <0.1 1.8 ppb Biobed 13-Sep-02 13/09/2002 4:24 <0.5 0.3 <0.5 0.6 <0.1 0.6 0.7 ppb Biobed 13-Sep-02 13/09/2002 6:30 <0.5 0.3 <0.5 0.5 <0.1 0.6 0.5 ppb Biobed 16-Sep-02 13/09/2002 13:54 0.9 <0.1 <0.5 0.7 2.3 0.2 0.5 ppb Biobed 16-Sep-02 13/09/2002 21:09 <0.5 <0.1 <0.5 0.4 <0.1 0.5 0.4 ppb Biobed 16-Sep-02 14/09/2002 4:50 <0.5 <0.1 <0.5 0.4 1.8 0.2 0.4 ppb Biobed 16-Sep-02 14/09/2002 13:22 <0.5 <0.1 <0.5 0.3 <0.1 0.2 0.5 ppb Biobed 16-Sep-02 14/09/2002 22:15 <0.5 <0.1 <0.5 0.3 <0.1 0.2 0.5 ppb Biobed 16-Sep-02 15/09/2002 7:57 <0.5 <0.1 <0.5 0.4 <0.1 0.2 0.4 ppb Biobed 16-Sep-02 15/09/200 18:09 <0.5 <0.1 <0.5 0.3 0.2 0.2 0.4 ppb Biobed 20-Sep-02 18/09/2002 7:52 <0.5 <0.1 <0.5 0.4 0.6 0.8 0.5 ppb Biobed 24-Sep-02 22/09/2002 3:14 <0.5 <0.1 <0.5 0.4 0.0 0.5 0.6 ppb Biobed 27-Sep-02 26/09/2002 19:32 <0.5 <0.1 <0.5 0.4 0.6 0.0 0.5 ppb Biobed 30-Sep-02 30/09/2002 7:45 <0.5 <0.1 <0.5 0.4 0.7 0.5 0.4 ppb Biobed 04-Oct-02 03/10/2002 19:16 <0.5 <0.1 <0.5 0.4 0.8 0.5 0.5 ppb Biobed 07-Oct-02 06/10/2002 15:11 <0.5 <0.1 <0.5 0.4 0.5 0.5 0.4 ppb Biobed 14-Oct-02 10/10/2002 9:38 <0.5 <0.1 <0.5 0.4 0.6 0.5 0.5 ppb Biobed 18-Oct-02 16/10/2002 4:40 <0.5 <0.1 <0.5 0.4 0.6 0.5 0.5 ppb Biobed 18-Oct-02 16/10/2002 18:00 <0.5 <0.1 <0.5 0.3 0.3 0.5 0.3 ppb Biobed 18-Oct-02 17/10/2002 7:05 <0.5 <0.1 <0.5 0.3 0.4 0.5 0.3 ppb Biobed 18-Oct-02 17/10/2002 16:12 <0.5 <0.1 <0.5 0.3 <0.1 0.5 0.3 ppb Biobed 21-Oct-02 18/10/2002 18:43 <0.5 <0.1 <0.5 0.3 <0.1 0.5 0.4 ppb Biobed 21-Oct-02 19/10/2002 10:52 <0.5 <0.1 <0.5 0.3 0.4 0.5 0.4 ppb Biobed 21-Oct-02 20/10/2002 4:23 <0.5 <0.1 <0.5 0.3 <0.1 0.5 0.4 ppb

R&D PROJECT RECORD P2-200/PR 131
Biobed 21-Oct-02 21/10/2002 2:44 <0.5 <0.1 <0.5 0.3 0.5 0.5 0.3 ppb Handling Area Date collected Sample date/time Dimethoate Chlorothalonil Isoproturon Chlorpyrifos Pendimethalin Epoxiconazole Azoxystrobin Conc Biobed 25-Oct-02 22/10/2002 17:09 <0.5 <0.1 <0.5 0.3 0.4 0.4 0.4 ppb Biobed 25-Oct-02 23/10/2002 22:53 <0.5 <0.1 <0.5 0.3 <0.1 0.3 0.3 ppb Biobed 28-Oct-02 27/10/2002 1:28 <0.5 <0.1 <0.5 0.3 <0.1 0.5 0.4 ppb Biobed 04-Nov-02 02/11/2002 9:02 <0.5 <0.1 <0.5 0.3 0.4 0.2 0.4 ppb Biobed 04-Nov-02 03/11/2002 20:02 <0.5 <0.1 <0.5 0.3 0.5 0.8 0.4 ppb Biobed 08-Nov-02 06/11/2002 11:47 <0.5 <0.1 <0.5 0.3 <0.1 0.2 0.4 ppb Biobed 08-Nov-02 07/11/2002 20:13 <0.5 <0.1 <0.5 0.3 0.3 0.2 0.4 ppb

R&D PROJECT RECORD P2-200/PR 132
APPENDIX 4.2: Stage 4 - Drive-over biobed site. Pesticide concentration data from biobed leachate samples Drive-over biobed Residue Level Handling Area Date collected Sample date/time Dimethoate Chlorothalonil Isoproturon Chlorpyrifos Pendimethalin Epoxiconazole Azoxystrobin Conc First Application Biobed 22-Apr-02 22/04/2002 12:00 <0.5 <0.1 <0.5 <0.1 <0.1 0.19 8.51 ppb Biobed 07-May-02 04/05/2002 1:15 <0.5 0.00 17 <0.1 <0.1 <0.1 1.00 ppb Biobed 07-May-02 04/05/2002 13:58 <0.5 <0.1 <0.5 <0.1 <0.1 0.4 8.2 ppb Biobed 07-Jun-02 06/06/2002 21:38 <0.5 <0.1 <0.5 <0.1 <0.1 0.40 8.2 ppb Biobed 07-Jun-02 07/06/2002 5:08 <0.5 <0.1 <0.5 <0.1 <0.1 <0.1 4.7 ppb Biobed 10-Jun-02 07/06/2002 20:14 5.0 <0.1 <0.5 0.2 13.7 <0.1 0.8 ppb Biobed 10-Jun-02 08/06/2002 23:52 <0.5 1.0 6.9 3.9 3.3 0.9 0.9 ppb Biobed 14-Jun-02 10/06/2002 17:35 <0.5 <0.1 <0.5 0.4 0.4 0.4 0.8 ppb Biobed 14-Jun-02 11/06/2002 11:22 <0.5 <0.1 <0.5 <0.1 0.4 0.3 0.4 ppb Biobed 14-Jun-02 14/06/2002 8:37 <0.5 <0.1 <0.5 0.4 0.4 <0.1 <0.1 ppb Biobed 17-Jun-02 15/06/2002 13:12 <0.5 <0.1 <0.5 0.4 0.4 <0.1 0.2 ppb Biobed 17-Jun-02 16/06/2002 13:49 <0.5 <0.1 <0.5 0.4 0.4 0.1 0.3 ppb Biobed 21-Jun-02 19/06/2002 21:26 <0.5 <0.1 <0.5 <0.1 <0.1 <0.1 0.3 ppb Biobed 21-Jun-02 21/06/2002 1:23 <0.5 <0.1 <0.5 <0.1 <0.1 <0.1 0.6 ppb Biobed 24-Jun-02 22/06/2002 7:54 <0.5 <0.1 <0.5 <0.1 <0.1 <0.1 0.6 ppb Biobed 28-Jun-02 25/06/2002 17:11 <0.5 <0.1 1.0 <0.1 <0.1 <0.1 6.9 ppb Biobed 05-Jul-02 03/07/2002 18:03 <0.5 <0.1 3.7 <0.1 <0.1 0.3 1.4 ppb Biobed 05-Jul-02 03/07/202 18:36 <0.5 <0.1 <0.5 <0.1 <0.1 0.1 0.6 ppb Biobed 05-Jul-02 03/07/2002 20:00 <0.5 <0.1 <0.5 <0.1 <0.1 <0.1 1 ppb Biobed 05-Jul-02 04/07/2002 0:34 1.4 <0.1 0.9 <0.1 <0.1 <0.1 1.1 ppb Biobed 05-Jul-02 04/07/2002 13:35 2.8 <0.1 <0.5 <0.1 <0.1 0.2 1.6 ppb Biobed 05-Jul-02 05/07/2002 2:23 0.9 <0.1 0.5 <0.1 <0.1 <0.1 0.6 ppb Biobed 08-Jul-02 05/07/2002 17:41 <0.5 <0.1 <0.5 <0.1 <0.1 0.35 5.2 ppb Biobed 08-Jul-02 06/07/2002 6:50 <0.5 <0.1 <0.5 <0.1 <0.1 <0.1 3.6 ppb Biobed 08-Jul-02 07/07/2002 14:23 <0.5 <0.1 <0.5 <0.1 <0.1 <0.1 <0.1 ppb Biobed 12-Jul-02 09/07/2002 13:08 <0.5 <0.1 <0.5 <0.1 0.1 0.2 <0.1 ppb Biobed 15-Jul-02 13/07/2002 8:16 <0.5 <0.1 <0.5 <0.1 <0.1 0.5 <0.1 ppb Biobed 22-Jul-02 20/07/2002 15:57 <0.5 <0.1 <0.5 <0.1 <0.1 <0.1 <0.1 ppb Biobed 26-Jul-02 23/07/2002 9:39 <0.5 <0.1 <0.5 <0.1 <0.1 <0.1 <0.1 ppb

R&D PROJECT RECORD P2-200/PR 133
Handling Area Date collected Sample date/time Dimethoate Chlorothalonil Isoproturon Chlorpyrifos Pendimethalin Epoxiconazole Azoxystrobin Conc Biobed 31-Jul-02 29/07/2002 22:41 <0.5 <0.1 <0.5 <0.1 <0.1 <0.1 <0.1 ppb Biobed 02-Aug-02 01/08/2002 10:56 <0.5 <0.1 <0.5 <0.1 <0.1 <0.1 <0.1 ppb Second Application Biobed 06-Sep-02 03/09/2002 10:21 <0.5 <0.1 <0.5 <0.1 0.2 0.7 1.7 ppb Biobed 13-Sep-02 12/09/2002 15:26 <0.5 <0.1 <0.5 <0.1 0.3 0.7 1.9 ppb Biobed 13-Sep-02 12/09/200218:46 <0.5 <0.1 <0.5 <0.1 0.3 0.6 0.9 ppb Biobed 13-Sep-02 12/09/2002 22:38 <0.5 <0.1 1.2 <0.1 0.3 0.6 0.4 ppb Biobed 13-Sep-02 13/09/2002 3:08 1.5 <0.1 <0.5 <0.1 0.3 0.6 0.5 ppb Biobed 16-Sep-02 13/09/2002 22:02 2.4 <0.1 0.7 0.2 0.3 0.3 <0.1 ppb Biobed 16-Sep-02 14/09/2002 14:53 15.5 <0.1 0.8 0.4 0.2 0.3 <0.1 ppb Biobed 16-Sep-02 15/09/2002 16:25 6.0 <0.1 <0.5 0.1 0.1 0.2 <0.1 ppb Biobed 20-Sep-02 19/09/2002 16:53 13.6 <0.1 <0.5 0.1 0.1 0.2 <0.1 ppb Biobed 24-Sep-02 23/09/2002 1:26 8.0 <0.1 <0.5 0.1 0.1 0.2 <0.1 ppb Biobed 18-Oct-02 16/10/2002 2:20 <0.5 <0.1 <0.5 0.1 <0.1 0.2 <0.1 ppb Biobed 18-Oct-02 16/10/2002 4:16 <0.5 <0.1 <0.5 0.1 0.2 0.2 <0.1 ppb Biobed 18-Oct-02 16/10/2002 6:08 <0.5 <0.1 <0.5 0.1 0.2 0.2 <0.1 ppb Biobed 18-Oct-02 16/10/2002 8:21 <0.5 <0.1 <0.5 0.1 0.2 0.2 <0.1 ppb Biobed 18-Oct-02 16/10/2002 11:23 <0.5 <0.1 <0.5 0.1 <0.1 0.2 <0.1 ppb Biobed 18-Oct-02 16/10/2002 15:50 <0.5 <0.1 <0.5 0.1 0.2 0.2 <0.1 ppb Biobed 18-Oct-02 16/10/2002 23:24 0.6 <0.1 <0.5 0.1 0.2 0.2 <0.1 ppb Biobed 21-Oct-02 19/10/2002 22:49 1.3 <0.1 <0.5 0.4 <0.1 0.3 <0.1 ppb Biobed 21-Oct-02 21/20/2002 00:03 0.9 <0.1 <0.5 0.4 0.4 0.3 <0.1 ppb Biobed 21-Oct-02 21/10/2002 3:21 0.8 <0.1 <0.5 0.4 0.4 0.3 <0.1 ppb Biobed 21-Oct-02 21/10/2002 5:27 0.9 <0.1 <0.5 0.4 0.5 0.3 <0.1 ppb Biobed 21-Oct-02 21/10/2002 6:57 0.9 <0.1 <0.5 0.4 0.5 0.3 <0.1 ppb Biobed 25-Oct-02 21/10/2002 17:05 0.4 <0.1 <0.5 <0.1 0.2 0.7 <0.1 ppb Biobed 25-Oct-02 22/10/2002 6:28 2.5 <0.1 <0.5 0.4 <0.1 0.3 <0.1 ppb Biobed 25-Oct-02 23/10/2002 21:35 2.6 <0.1 <0.5 0.4 <0.1 0.3 <0.1 ppb Biobed 28-Oct-02 27/10/2002 2:28 3.7 <0.1 <0.5 0.4 <0.1 0.3 <0.1 ppb Biobed 04-Nov-02 02/11/2002 0:55 1.4 <0.1 <0.5 0.4 <0.1 0.3 <0.1 ppb Biobed 04-Nov-02 03/11/2002 1:12 0.7 <0.1 <0.5 0.3 0.3 0.2 <0.1 ppb Biobed 08-Nov-02 06/11/2002 11:51 0.9 <0.1 <0.5 0.3 0.5 0.2 <0.1 ppb Biobed 08-Nov-02 07/11/2002 10:39 1.0 <0.1 <0.5 0.3 0.4 0.2 <0.1 ppb

R&D PROJECT RECORD P2-200/PR 134
APPENDIX 4.3: Stage 4 - Concrete intercept to soil/grass area. Pesticide concentration data from concrete runoff samples and biobed leachate samples Concrete intercept to soil/grass area Residue Level Handling Area Date collected Sample date/time Dimethoate Chlorothalonil Isoproturon Chlorpyrifos Pendimethalin Epoxiconazole Azoxystrobin Conc First Application Concrete 01-May-02 30/04/2002 8:41 <2 <2 <2 <2 0.08 0.87 0.00 ppb Concrete 06-Jun-02 06/06/2002 15:31 3.5 36 37 32 42 3.7 <0.002 ppm Concrete 06-Jun-02 06/06/2002 15:34 4.8 79 81 47 69 5.6 <0.002 ppm Concrete 06-Jun-02 06/06/2002 15:35 12 114 91 79 109 8.2 <0.002 ppm Concrete 06-Jun-02 06/06/2002 15:36 <10 66.9 65.4 30.0 51.3 2.6 <0.002 ppm Concrete 06-Jun-02 06/06/2002 15:39 4.9 102 81 68 92 7.3 <0.002 ppm Concrete 06-Jun-02 06/06/2002 15:41 5.4 77 65 48 68 6.7 <0.002 ppm Concrete 06-Jun-02 06/06/2002 15:42 <10 41.7 <20 20.1 38.4 2.5 <0.002 ppm Concrete 06-Jun-02 06/06/2002 15:43 2.2 66 <0.002 28 50 3.8 <0.002 ppm Concrete 06-Jun-02 06/06/2002 15:44 <10 33.5 <20 11.4 18.4 2.0 <0.002 ppm Concrete 06-Jun-02 06/06/2002 15:46 2.6 31 <0.002 16 29 3.1 <0.002 ppm Concrete 06-Jun-02 06/06/2002 15:49 <10 6.7 <20 6.5 11.4 0.0 <0.002 ppm Concrete 06-Jun-02 06/06/2002 15:53 1.4 1.5 <0.002 6.3 15.6 1.7 <0.002 ppm Concrete 06-Jun-02 06/06/2002 15:54 <10 4.7 <20 3.2 6.5 0.0 <0.002 ppm Concrete 06-Jun-02 06/06/2002 15:56 1.3 1.6 <0.002 3.3 10.4 1.5 <0.002 ppm Concrete 10-Jun-02 09/06/2002 17:55 <0.1 1.5 <0.2 <0.002 0.81 <0.002 <0.002 ppm Concrete 10-Jun-02 09/06/2002 18:03 <0.1 <0.002 <0.2 <0.002 <0.002 <0.002 <0.002 ppm Concrete 14-Jun-02 13/06/2002 21:09 <0.1 <0.002 <0.2 <0.002 0.56 0.82 1.7 ppm Concrete 14-Jun-02 14/06/2002 0:13 <0.1 <0.002 0.34 <0.002 0.40 1.2 1.2 ppm Concrete 21-Jun-02 20/06/2002 11:35 <0.002 <0.002 <0.002 0.0054 0.0108 0.0898 0.0900 ppm Concrete 21-Jun-02 20/06/2002 11:52 <0.002 <0.002 <0.002 <0.002 0.0024 0.0658 0.0598 ppm Concrete 28-Jun-02 26/06/2002 20:25 <0.002 <0.002 <0.002 <0.002 0.0095 0.0357 0.0486 ppm Concrete 28-Jun-02 26/06/2002 20:33 <0.002 0.0020 <0.002 0.0032 0.0065 0.0498 0.0769 ppm Concrete 28-Jun-02 27/06/2002 17:16 <0.002 <0.002 <0.002 0.0021 0.0027 0.0578 0.0581 ppm Concrete 01-Jul-02 30/06/2002 18:10 0.0020 <0.002 <0.002 0.0054 0.0073 0.0714 0.0725 ppm Concrete 05-Jul-02 03/07/2002 17:55 <0.002 <0.002 <0.002 <0.002 <0.002 0.0623 0.0262 ppm

R&D PROJECT RECORD P2-200/PR 135
Concrete 05-Jul-02 05/07/2002 1:38 <0.002 <0.002 <0.002 <0.002 <0.002 0.0519 0.0192 ppm Concrete 05-Jul-02 05/07/2002 2:34 <0.002 <0.002 <0.002 <0.002 <0.002 0.0395 0.0143 ppm Handling Area Date collected Sample date/time Dimethoate Chlorothalonil Isoproturon Chlorpyrifos Pendimethalin Epoxiconazole Azoxystrobin Conc Concrete 05-Jul-02 05/07/2002 5:43 <0.002 <0.002 0.0024 <0.002 <0.002 0.0630 0.0310 ppm Concrete 08-Jul-02 08/07/2002 4:10 <0.002 <0.1 <0.002 <0.002 0.032 0.056 0.041 ppm Concrete 12-Jul-02 09/07/2002 10:57 <0.002 <0.002 <0.002 <0.002 9.7 <0.002 0.0055 ppm Concrete 15-Jul-02 12/07/2002 19:33 <0.002 <0.002 <0.002 <0.002 <0.002 0.018 0.0043 ppm Concrete 22-Jul-02 20/07/2002 1:37 <0.1 <0.002 <0.002 <0.002 0.0075 0.0096 <0.002 ppm Concrete 26-Jul-02 23/07/2002 6:58 <0.1 <0.002 <0.002 <0.002 0.01 0.0022 0.0032 ppm Concrete 31-Jul-02 30/07/2002 13:08 <0.1 <0.002 <0.002 <0.1 0.0064 0.0015 0.0012 ppm Concrete 02-Aug-02 01/08/2002 12:57 <0.002 <0.002 0.0054 <0.002 0.015 0.0065 <0.002 ppm Second Application Concrete 10-Sep-02 10/09/2002 12:00 <0.002 <0.002 <0.002 <0.002 <0.002 0.0257 0.0040 ppm Concrete 12-Sep-02 12/09/2002 13:21 24.80 94.60 55.90 56.30 107.90 9.45 6.41 ppm Concrete 12-Sep-02 12/09/2002 13:23 17.70 79.20 50.70 45.70 87.50 8.58 <0.002 ppm Concrete 12-Sep-02 12/09/2002 13:25 13.50 68.60 37.30 41.90 77.40 8.18 <0.002 ppm Concrete 12-Sep-02 12/09/2002 13:28 7.86 43.40 27.20 29.80 55.00 4.94 <0.002 ppm Concrete 12-Sep-02 12/09/2002 13:29 5.20 39.30 <20 21.30 46.50 4.11 <0.002 ppm Concrete 12-Sep-02 12/09/2002 13:30 4.74 24.60 <20 10.60 38.20 3.94 <0.002 ppm Concrete 12-Sep-02 12/09/2002 13:37 4.36 15.80 <20 3.02 21.00 3.66 <0.002 ppm Concrete 12-Sep-02 12/09/2002 13:38 4.15 11.10 <20 3 15.00 3.52 <0.002 ppm Concrete 12-Sep-02 12/09/2002 13:39 2.33 9.59 <10 1.51 15.80 2.17 <0.002 ppm Concrete 24-Sep-02 20/09/2002 17:42 7.94 6.84 5.90 2.40 65.10 7.90 1.85 ppm Concrete 04-Oct-02 02/10/2002 7:34 4.34 11.00 5.98 2.00 35.30 4.15 1.52 ppm Concrete 14-Oct-02 12/10/2002 6:54 0.480 <0.002 0.289 0.064 1.520 0.620 <0.002 ppm Concrete 14-Oct-02 12/10/2002 7:19 0.273 0.340 0.279 0.064 1.090 0.440 <0.002 ppm Concrete 14-Oct-02 12/10/2002 7:49 0.258 <0.002 0.266 0.063 0.870 0.345 <0.002 ppm Concrete 18-Oct-02 15/10/2002 7:43 0.4142 0.0750 0.2130 0.0278 0.3053 0.1741 0.0579 ppm Concrete 18-Oct-02 15/10/2002 12:52 0.1034 0.0749 0.1515 0.0277 0.3296 0.0831 0.0582 ppm Concrete 18-Oct-02 15/10/2002 19:49 0.1263 0.0749 0.1544 0.0402 0.2316 0.0841 <0.002 ppm Concrete 18-Oct-02 15/10/2002 21:17 0.0814 0.0789 0.1538 0.0278 0.1337 0.0639 0.0558 ppm Concrete 21-Oct-02 20/10/2002 19:59 0.0675 0.0753 0.1527 0.0279 0.1738 0.0635 0.0565 ppm Concrete 21-Oct-02 20/10/2002 20:52 <0.002 0.0747 0.1565 0.0280 0.1045 0.0579 0.0559 ppm Concrete 21-Oct-02 21/10/2002 1:08 <0.002 0.0747 0.1551 0.0278 0.1009 0.0587 0.0564 ppm

R&D PROJECT RECORD P2-200/PR 136
Concrete 21-Oct-02 21/10/2002 4:54 0.0684 <0.002 0.1560 0.0280 0.0950 0.0597 <0.002 ppm Concrete 25-Oct-02 21/10/2002 20:01 0.005 0.0083 <0.002 <0.002 0.0171 0.017 0.0396 ppm Handling Area Date collected Sample date/time Dimethoate Chlorothalonil Isoproturon Chlorpyrifos Pendimethalin Epoxiconazole Azoxystrobin Conc Concrete 25-Oct-02 23/10/2002 20:43 0.0049 0.0078 <0.002 <0.002 0.023 0.0179 0.0145 ppm Concrete 28-Oct-02 26/10/2002 22:46 0.0045 0.0077 0.0171 <0.002 0.0615 0.0208 0.0085 ppm Concrete 04-Nov-02 01/11/2002 15:52 0.0044 <0.002 <0.002 <0.002 0.0131 0.0172 <0.002 ppm Concrete 04-Nov-02 02/11/2002 21:48 <0.002 0.0076 0.016 <0.002 0.015 0.0158 <0.002 ppm Concrete 08-Nov-02 06/11/2002 7:13 <0.002 0.0076 0.0161 <0.002 0.012 0.0158 <0.002 ppm Concrete 08-Nov-02 0/11/2002 09:36 <0.002 0.0077 0.0383 <0.002 0.0172 0.0164 <0.002 ppm First Application Soil/grass 01-May-02 01/05/2002 10:09 <0.5 <0.1 <0.5 <0.1 <0.1 0.31 11 ppb Soil/grass 03-May-02 01/05/2002 23:27 <0.5 <0.1 <0.5 <0.1 <0.1 <0.1 3.2 ppb Soil/grass 03-May-02 03/05/2002 06::26 <0.5 <0.1 <0.5 <0.1 <0.1 0.01 <0.1 ppb Soil/grass 07-Jun-02 06/06/2002 19:00 <0.5 <0.1 <0.5 <0.1 <0.1 0.48 <0.1 ppb Soil/grass 07-Jun-02 06/06/2002 23:30 <0.5 <0.1 <0.5 <0.1 <0.1 <0.1 <0.1 ppb Soil/grass 07-Jun-02 07/06/2002 4:00 <0.5 <0.1 <0.5 <0.1 <0.1 <0.1 <0.1 ppb Soil/grass 07-Jun-02 07/06/2002 8:30 <0.5 <0.1 <0.5 <0.1 <0.1 <0.1 <0.1 ppb Soil/grass 10-Jun-02 07/06/2002 12:29 <0.5 <0.1 <0.5 3.4 2.6 0.4 <0.1 ppb Soil/grass 10-Jun-02 07/06/2002 23:13 <0.5 <0.1 <0.5 3.4 2.6 0.4 0.4 ppb Soil/grass 10-Jun-02 08/06/2002 4:17 <0.5 <0.1 0.7 3.4 2.6 0.4 0.3 ppb Soil/grass 10-Jun-02 08/06/2002 11:21 <0.5 <0.1 0.7 <0.1 0.5 0.3 0.4 ppb Soil/grass 14-Jun-02 11/06/2002 1:56 <0.5 <0.1 0.6 0.5 0.5 0.3 0.5 ppb Soil/grass 14-Jun-02 11/06/2002 14:25 <0.5 <0.1 3.3 <0.1 0.5 0.3 0.4 ppb Soil/grass 14-Jun-02 12/06/2002 6:40 <0.5 <0.1 0.6 <0.1 0.5 0.3 <0.1 ppb Soil/grass 14-Jun-02 13/06/2002 1:02 <0.5 <0.1 0.5 <0.1 0.5 0.2 <0.1 ppb Soil/grass 17-Jun-02 15/06/2002 13:25 <0.5 <0.1 <0.5 0.5 0.6 0.1 0.1 ppb Soil/grass 17-Jun-02 16/06/2002 21:24 <0.5 <0.1 1.5 0.5 0.4 <0.1 <0.1 ppb Soil/grass 21-Jun-02 18/06/2002 19:13 <0.5 <0.1 <0.5 <0.1 <0.1 <0.1 <0.1 ppb Soil/grass 21-Jun-02 20/06/2002 16:04 <0.5 <0.1 <0.5 <0.1 <0.1 <0.1 0.1 ppb Soil/grass 24-Jun-02 23/06/2002 3:18 <0.5 <0.1 <0.5 <0.1 0.1 <0.1 0.2 ppb Soil/grass 28-Jun-02 25/06/2002 20:49 <0.5 <0.1 <0.5 <0.1 <0.1 <0.1 0.3 ppb Soil/grass 28-Jun-02 27/06/2002 14:15 <0.5 <0.1 <0.5 <0.1 0.1 <0.1 0.6 ppb Soil/grass 01-Jul-02 30/06/2002 9:11 <0.5 <0.1 <0.5 <0.1 <0.1 <0.1 0.6 ppb Soil/grass 05-Jul-02 03/07/2002 0:14 <0.5 <0.1 <0.5 <0.1 <0.1 <0.1 0.20 ppb

R&D PROJECT RECORD P2-200/PR 137
Soil/grass 08-Jul-02 06/07/2002 12:32 <0.5 <0.1 <0.5 <0.1 <0.1 <0.1 <0.1 ppb Soil/grass 08-Jul-02 07/07/2002 6:26 <0.5 <0.1 1.1 <0.1 <0.1 <0.1 <0.1 ppb Handling Area Date collected Sample date/time Dimethoate Chlorothalonil Isoproturon Chlorpyrifos Pendimethalin Epoxiconazole Azoxystrobin Conc Soil/grass 08-Jul-02 07/07/2002 16:18 <0.5 <0.1 <0.5 <0.1 <0.1 <0.1 <0.1 ppb Soil/grass 08-Jul-02 08/07/2002 7:52 <0.5 <0.1 <0.5 <0.1 <0.1 <0.1 <0.1 ppb Soil/grass 12-Jul-02 09/07/2002 11:21 <0.5 <0.1 <0.5 <0.1 <0.1 <0.1 <0.1 ppb Soil/grass 15-Jul-02 13/07/2002 10:17 <0.5 <0.1 <0.5 <0.1 <0.1 <0.1 <0.1 ppb Soil/grass 19-Jul-02 16/07/2002 12:26 <0.5 <0.1 <0.5 <0.1 <0.1 <0.1 <0.1 ppb Soil/grass 22-Jul-02 21/07/2002 5:29 <0.5 0.4 <0.5 <0.1 0.1 <0.1 <0.1 ppb Soil/grass 26-Jul-02 23/07/2002 15:02 <0.5 <0.1 <0.5 <0.1 <0.1 <0.1 <0.1 ppb Soil/grass 31-Jul-02 30/07/2002 19:46 <0.5 <0.1 <0.5 <0.1 <0.1 <0.1 <0.1 ppb Soil/grass 02-Aug-02 01/08/2002 8:53 <0.5 <0.1 <0.5 <0.1 0.6 0.6 <0.1 ppb Second Application Soil/grass 30-Aug-02 29/08/2002 22:00 <0.5 <0.1 <0.5 0.5 0.4 0.2 <0.1 ppb Soil/grass 13-Sep-02 12/09/2002 18:33 <0.5 <0.1 <0.5 0.1 0.3 0.4 0.1 ppb Soil/grass 13-Sep-02 12/09/2002 22:40 <0.5 <0.1 <0.5 <0.1 0.2 0.3 0.6 ppb Soil/grass 13-Sep-02 13/09/2002 3:04 <0.5 <0.1 <0.5 0.1 0.2 0.3 0.1 ppb Soil/grass 13-Sep-02 13/09/2002 7:15 <0.5 <0.1 <0.5 0.1 0.2 0.3 0.1 ppb Soil/grass 13-Sep-02 13/09/2002 10:21 <0.5 <0.1 <0.5 0.1 0.2 0.4 0.2 ppb Soil/grass 16-Sep-02 13/09/2002 13:41 <0.5 <0.1 <0.5 0.3 0.3 0.4 <0.1 ppb Soil/grass 16-Sep-02 13/09/2002 19:07 <0.5 <0.1 <0.5 0.3 0.3 0.4 <0.1 ppb Soil/grass 16-Sep-02 14/09/2002 1:14 <0.5 <0.1 <0.5 0.8 0.3 0.3 <0.1 ppb Soil/grass 16-Sep-02 14/09/2002 7:30 <0.5 <0.1 <0.5 0.3 0.4 0.3 0.2 ppb Soil/grass 16-Sep-02 14/09/2002 12:20 <0.5 <0.1 <0.5 1.0 0.4 0.3 0.2 ppb Soil/grass 16-Sep-02 14/09/2002 17:42 <0.5 <0.1 <0.5 0.3 0.3 0.3 0.2 ppb Soil/grass 16-Sep-02 14/09/2002 23:40 <0.5 <0.1 <0.5 0.3 0.4 0.3 0.2 ppb Soil/grass 20-Sep-02 17/09/2002 22:07 <0.5 <0.1 <0.5 0.3 0.4 0.3 0.2 ppb Soil/grass 20-Sep-02 19/09/2002 0:36 <0.5 <0.1 <0.5 0.4 0.5 0.4 0.3 ppb Soil/grass 24-Sep-02 22/09/2002 10:19 <0.5 <0.1 <0.5 0.3 0.3 0.3 0.2 ppb Soil/grass 27-Sep-02 26/09/2002 12:16 <0.5 <0.1 <0.5 0.3 0.4 0.3 0.2 ppb Soil/grass 18-Oct-02 17/10/2002 14:07 <0.5 <0.1 <0.5 0.3 0.8 0.3 0.2 ppb Soil/grass 18-Oct-02 17/10/2002 20:21 <0.5 <0.1 <0.5 0.3 0.4 0.2 0.2 ppb Soil/grass 18-Oct-02 18/01/2002 2:48 <0.5 <0.1 <0.5 0.3 0.4 0.6 0.4 ppb Soil/grass 21-Oct-02 18/10/2002 22:52 <0.5 <0.1 <0.5 0.4 0.3 0.4 0.4 ppb

R&D PROJECT RECORD P2-200/PR 138
Soil/grass 21-Oct-02 19/10/2002 11:19 <0.5 <0.1 <0.5 0.4 0.3 0.4 0.3 ppb Soil/grass 21-Oct-02 19/10/2002 23:05 <0.5 <0.1 <0.5 0.4 0.3 0.4 0.3 ppb Handling Area Date collected Sample date/time Dimethoate Chlorothalonil Isoproturon Chlorpyrifos Pendimethalin Epoxiconazole Azoxystrobin Conc Soil/grass 21-Oct-02 20/10/2002 11:03 <0.5 <0.1 <0.5 0.4 0.3 0.4 0.3 ppb Soil/grass 21-Oct-02 21/10/2002 2:37 <0.5 <0.1 <0.5 0.4 0.4 0.4 0.3 ppb Soil/grass 25-Oct-02 22/10/2002 13:52 <0.5 <0.1 <0.5 0.4 0.3 0.4 0.3 ppb Soil/grass 25-Oct-02 24/10/2002 10:22 <0.5 <0.1 <0.5 0.4 0.3 0.5 0.3 ppb Soil/grass 28-Oct-02 27/10/2002 2:17 <0.5 <0.1 <0.5 0.4 0.5 0.5 0.3 ppb Soil/grass 01-Nov-02 30/10/2002 1:28 <0.5 <0.1 <0.5 0.4 0.3 0.5 0.3 ppb Soil/grass 04-Nov-02 03/11/2002 3:13 <0.5 <0.1 <0.5 0.4 0.3 0.6 0.3 ppb Soil/grass 08-Nov-02 06/11/2002 17:18 <0.5 <0.1 <0.5 0.3 0.3 0.8 0.3 ppb