Development, Compilation and Use of Input-Output Supply and Use Tables in The

1
Development, Compilation and Use of Input-Output Supply and Use Tables in the United Kingdom National Accounts
IIOA, Istanbul, Turkey, 02-06 July 2007
Paper Prepared for the 16th International Input-Output Conference
Istanbul, Turkey, 2-6 July 2007
Development, Compilation and Use of Input-Output Supply and Use Tables in theUnited Kingdom National Accounts
by
Sanjiv Mahajan
For additional information please contact:
Mr Sanjiv MahajanHead of Current Price Input-Output BranchZone D3/12National Accounts Co-ordination DivisionOffice for National Statistics1 Drummond GatePimlicoLondonUnited KingdomSW1V 2QQ
Tel no.+(44) 020 7533 5954
E-mail:[email protected]
This paper is posted on the following websites:
www.iioa.orgwww.statistics.gov.uk/inputoutput

2
Development, Compilation and Use of Input-Output Supply and Use Tables in the United Kingdom National Accounts
IIOA, Istanbul, Turkey, 02-06 July 2007

3
Development, Compilation and Use of Input-Output Supply and Use Tables in the United Kingdom National Accounts
IIOA, Istanbul, Turkey, 02-06 July 2007
This paper looks at the development, compilation and use of Input-Output in the United Kingdom (UK) since thefirst official tables were drawn up in 1961 for the year 1954. The Input-Output Supply and Use Tables framework isnow a central part of the UK’s National Accounts, and is the key to agreeing the annual level of current price GrossDomestic Product as well as feeding into various parts of the National Accounts and other products.
AbstractIn the UK, the first official Input-Output Tables were published in 1961 for the year 1954, and have been producedroughly every five years as needed for the National Accounts rebasing of constant price estimates. However, since1991/2, the production of Input-Output Supply and Use Tables have been a central part of the UK’s NationalAccounts and have been used to set the annual level of current price Gross Domestic Product.
This paper looks at the development of Input-Output in the UK and covers:
History and development of I-O Supply and Use Tables.
Compilation and methodology of I-O Supply and Use Tables, and annual coherence adjustments to GDP.
Development of data sources used.
Stages of integration with National Accounts.
Development of new analyses based on I-O Supply and Use Tables to increase their value to users.
The paper also describes the UK’s approach to maintaining consistent I-O Supply and Use Tables over time, handlingrevisions and the planned improvement of the National Accounts through the development of quarterly and annualI-O Supply and Use Tables both in current and previous years prices’ prices. The paper also covers the UK’s approachto meeting demands for data from the Statistical Office of the European Community (Eurostat).
The main part of this paper was presented at the 29th General Conference of the International Association forResearch in Income and Wealth in Joensuu, Finland, in 20-26 August 2006.
AcknowledgementsThe author would like to thank the following people for their contributions:
Bob Cuthbert Neil O'Driscoll Asif Riaz
Ian Gouldson Jeremy Okai
Sanjiv Mahajan Joanne Penn
Daniel Mistry Amnn Rajput
May 2007
Introduction

4
Development, Compilation and Use of Input-Output Supply and Use Tables in the United Kingdom National Accounts
IIOA, Istanbul, Turkey, 02-06 July 2007
Role of Input-Output (I-O) Annual Supply and Use Tables
The main aim of the United Kingdom Office for National Statistics Input-Output work is to provide a framework forthe detailed reconciliation of the components of the three measures of Gross Domestic Product (GDP), thus agreeinga single annual estimate of current market price GDP. In order to achieve this, Input-Output (I-O) Supply and UseTables are produced annually.
The ONS Blue Book1 and the Pink Book2 incorporate the final results of various annual inquiries, which becomeavailable on average around 15 months after the year in question, and quarterly data, which is predominantly used tocalculate estimates for the latest year. As new data are collected it is likely that revisions will be necessary, hence theprovisional nature of the latest tables. The process of reassessing these estimates involves the preparation of currentprice I-O Annual Supply and Use Tables. This Input-Output approach brings together all the available informationon inputs, outputs, gross value added, incomes and expenditures. Similarly the production of the consolidated sectorand financial accounts requires the preparation of ‘top-to-bottom’ sector and sub-sector accounts to identifydiscrepancies in the sector estimates.
The first UK I-O Annual Supply and Use Tables were compiled during 1991/92 covering the year 1989, and publishedin the 1992 ONS National Accounts Blue Book (Chapter 18). For the 2006 Blue Book exercise, the first I-O AnnualSupply and Use Tables for 2004 were produced together with revised tables for the period 1992-2003, which includerevisions as described later in this article. The tables are based on the European System of Accounts 1995 (ESA 95)3.
The value of input-output is enhanced by the timely production of the tables, and to this end, the latest tables are nowbeing produced around 18 months after the end of the year to which they refer.
Since 1998, in line with the ESA 95, the Input-Output framework and data sources have been used to develop andproduce integrated annual production accounts by sector, and by industry, together with the annual generation ofincome accounts by sector, and by industry. This process has added a further dimension to the GDP accounts, and inturn, has provided further improvements to the quality of the data and the links between the UK accounts.
I-O Annual Supply and Use Tables also form the basis for the I-O Analytical Tables, which provide another dimensionto the National Accounts. These tables provide separate analyses of the uses of domestically produced and importedgoods and services. They also provide a framework to assess the direct and indirect changes on the whole economy,when the demand for a single product increases or decreases, as well as modelling a range of other types of economicchange. The latest such tables for the UK were produced for the year 19954, and published in April 2002. Furtherdetails describing I-O Analytical Tables are provided later in this article.
Another major role for I-O work in the ONS is to produce supply-side estimates of final demand. I-O analyses formthe basis for the models that produce these estimates. Information from I-O Annual Supply and Use Tables also formsthe basis of other statistics compiled in the ONS, for example: Producer Price Input Indices, Regional Accounts,Environmental Accounts and gross value added weights used in the annual chain-linking of the constant priceproduction measure of GDP.
Various new analyses have been developed based on the I-O Annual Supply and Use Tables, for example: tradeperformance and concentration ratios, as well as function based analyses like: ICT; food sector; oil and gas sector; andcreative sector. The development of I-O Supply and Use Tables in previous year’s prices extends the framework forensuring coherence of economic statistics into new areas, such as productivity.
Key external users of I-O analyses include the Bank of England, HM Treasury and HM Revenue and Customs formodelling the economy through a disaggregated view of industrial behaviour over time. Such models allow analysisof how the economy has, or will, respond to micro or macro economic change, for example: VAT regulations,consumer behaviour, rising oil prices, introduction of the minimum wage, and situations like BSE and foot andmouth disease. Other external customers include: other government departments, Eurostat, OECD, city analysts andbusinesses, economic forecasters and modellers, academics, trade associations, companies and the media.

5
Development, Compilation and Use of Input-Output Supply and Use Tables in the United Kingdom National Accounts
IIOA, Istanbul, Turkey, 02-06 July 2007
I-O Supply and Use Tables - basic structure
The I-O Annual Supply and Use Tables consist of two matrices, which bring together the production, income andexpenditure measures of GDP. When balanced, they provide a single measure of annual current price GDP, whichintegrates the components of gross value added, inputs and outputs, and final demands.
The I-O Annual Supply and Use Tables as illustrated in Graphic 1, reflect the structure and availability of the datacollected and the components needed to balance the three measures of GDP:
The I-O Annual Supply and Use Tables show the supply and demand for products in terms of 123 industries(represented by columns) and 123 products (represented by rows). Industries are defined using the 2003 version ofthe Standard Industrial Classification (SIC (2003)), and businesses are classified on the ONS Inter-DepartmentalBusiness Register (IDBR) to industries according to whatever product accounts for the greatest part of theiroutput. See Annex A for the classification of the 123 Input-Output groups and their links to SIC (2003).
The Supply Table shows the output of each industry by type of product at basic prices. Industries, by definition,produce mainly the principal product of the industry to which they are classified. The off-diagonal products aresecondary production or by-products of the production process. The Supply Table is published in summary formonly because of disclosure rules prohibiting the publication of data that may be traced to a single contributor toONS inquiries.
The industrial dimension of the Use Table shows, for each industry, the costs incurred in the production process asintermediate consumption along with primary inputs (labour costs, taxes on production, profits, etc.).
The product dimension of the Use Table shows intermediate demand and final demand and is valued atpurchasers’ prices, which represent the prices that purchasers actually pay.
Estimates of consumption (both intermediate and final demand) include goods and services both domesticallyproduced and imported.
○ ○ ○ ○ ○ ○ ○ ○ ○ ○ ○ ○ ○ ○ ○ ○ ○ ○ ○ ○ ○ ○ ○ ○ ○ ○ ○ ○ ○ ○ ○ ○ ○ ○ ○ ○ ○ ○ ○ ○ ○ ○ ○ ○ ○ ○ ○ ○ ○ ○ ○ ○ ○ ○ ○ ○ ○ ○ ○ ○ ○ ○ ○
1I-O Supply and Use Tables framework
Impo
rts
of g
oods
and
ser
vice
s
Dist
ribut
ors’
trad
ing
mar
gins
Taxe
s (le
ss s
ubsi
dies
) on
prod
ucts
Tota
l int
erm
edia
te d
eman
d
HHFC
e
NPI
SHs
FCe
Cent
ral g
over
nmen
t FCe
Loca
l gov
ernm
ent F
Ce
Gro
ss fi
xed
capi
tal f
orm
atio
n
Valu
able
s
Chan
ges
in in
vent
orie
s
TOTAL
SUPPLY
TOTAL OUTPUT
Expo
rts
of g
oods
and
ser
vice
s
PRODUCT
PRODUCT
TOTAL
DEMAND
Total intermediate consumption
Taxes (less subsidies) on production
Compensation of employees
Gross operating surplus
TOTAL OUTPUT (INPUTs)
DOMESTICSUPPLYat basic prices
Note: Supply Tableindustry/product detail isnot available due todisclosure rules
INTERMEDIATEDEMANDat purchasers’ prices
Supply Table Use Table
INDUSTRY INDUSTRYFINAL DEMANDat purchasers’ prices
GVA at basic prices(Primary inputs)
HHFCe represents Households final consumption expenditure.NPISHs FCe represents Non-profit institutions serving households final consumption expenditure.

6
Development, Compilation and Use of Input-Output Supply and Use Tables in the United Kingdom National Accounts
IIOA, Istanbul, Turkey, 02-06 July 2007
Stages of integration with National Accounts andRevisions
Publication of Blue Book and I-O Annual Supply and Use Tables
Table 2 shows the release dates for the ONS Blue Book datasetand for the quarterly data underpinning the annual datasetssince the 1992 Blue Book, which contained the first Input-Output Annual Supply and Use Tables for the year 1989.
Since then, for each annual exercise, the I-O Annual Supplyand Use Tables have always been consistent with, andpublished at the same time as, the corresponding ONS BlueBook and Pink Book datasets.
Different stages of the GDP compilation process
Data feeding into the compilation of GDP, like manyeconomic statistics5,6, are continually revised and theserevisions occur at different stages of the GDP compilationprocess.
Graphic 3 shows the evolution of the first GDP estimate
○ ○ ○ ○ ○ ○ ○ ○ ○ ○ ○ ○ ○ ○ ○ ○ ○ ○ ○ ○ ○ ○ ○ ○ ○ ○ ○
2Release of ONS annual Blue Book and consistentquarterly data
Blue Book Release of Release ofyear quarterly Blue Bookdataset dataset1992 Mid September Mid August1993 Mid September Mid August1994 Mid September Mid August1995 End June Mid July1996 End June Mid July1997 End June Mid August1998 End September Early October1999 End July End August2000 End June Early August2001 End September End September2002 End June Mid July2003 End September End October2004 End June Mid July2005 End June Mid July2006 End June Mid July
○ ○ ○ ○ ○ ○ ○ ○ ○ ○ ○ ○ ○ ○ ○ ○ ○ ○ ○ ○ ○ ○ ○ ○ ○ ○ ○ ○ ○ ○ ○ ○ ○ ○ ○ ○ ○ ○ ○ ○ ○ ○ ○ ○ ○ ○ ○ ○ ○ ○ ○ ○ ○ ○ ○ ○ ○ ○ ○ ○ ○ ○ ○
3Life cycle of national accounts data - estimation timeframe
Short term indicators
Quarter
Annual balancing
SecondBlue Book stage
Full I-O Supply and Use Table framework used to balance year (t-2)
GDP(P)=GDP(I)=GDP(E)
Month 1 Month 2 Month 3
FirstBlue Book stage
Year (t-1) not balanced
statistical discrepancies shown
Letter ‘t’ denotes the year of the Blue Book publication
Output (Production) - data available
Expenditure - data available
Income - dataavailable
Supply Use
through successive monthly and quarterly exercises through to the first Blue Book and second Blue Book exercises.
Table 4 shows when the UK GDP estimate for 2004 Quarter 1 was first published in April 2004, and the timing ofsubsequent revisions to this period up to the annual benchmarking exercise through the Input-Output AnnualSupply and Use Tables in June 2006.

7
Development, Compilation and Use of Input-Output Supply and Use Tables in the United Kingdom National Accounts
IIOA, Istanbul, Turkey, 02-06 July 2007
The next section of this article briefly describes the short-termand annual processes, and the cause of revisions at each stage.
Quarterly GDP process
There are three successive monthly releases after the end ofeach quarter:
Gross Domestic Product Preliminary Estimate, referred toas Month One (M1);
UK Output, Income and Expenditure release, referred to asMonth Two (M2); and
Quarterly National Accounts, referred to as Month Three(M3).
The Gross Domestic Product Preliminary Estimate is usuallyreleased around 25 days after the end of the reference quarter.The UK is one of the fastest countries in the world in releasingits first estimate of GDP, balancing a trade-off between
○ ○ ○ ○ ○ ○ ○ ○ ○ ○ ○ ○ ○ ○ ○ ○ ○ ○ ○ ○ ○ ○ ○ ○ ○ ○ ○
42004 Quarter 1: Initial estimates of GDP throughto annual benchmarking
Month ReleaseApr 2004 M1 Gross Domestic Product Preliminary Estimate
(after 25 days)May 2004 M2 UK Output, Income and Expenditure
(after 55 days)Jun 2004 M3 Quarterly National Accounts
(after 85 days)Sep 2004 Quarterly Round (M3)Dec 2004 Quarterly Round (M3)Mar 2005 Quarterly Round (M3)Jun 2005 Blue Book One stageSep 2005 Quarterly Round (M3)Dec 2005 Quarterly Round (M3)Mar 2006 Quarterly Round (M3)Jun 2006 Blue Book Two stage
(balanced through I-O SUTs framework)
timeliness and subsequent revisions.
The preliminary estimate for GDP provides estimates of the growth in the volume of GDP on the previous quarter. Itis based on a limited amount of information:
Index of Production for the first two months of the quarter.
Monthly Inquiry into Distribution and Services Sectors (MIDSS) for two full months and partial data for thethird month.
Retail Sales Inquiry estimates for the three months of the quarter.
Limited information on the output of the rest of the economy.
Although at this stage estimates are only available for broad industry groups, the preliminary estimate provides abroad indication of the level of growth in quarterly GDP, which will become more firmly based at later stages in theprocess.
The UK Output, Income and Expenditure is released around 55 days after the end of the reference quarter. A singleestimate of GDP with its income, output (or production) and expenditure components is produced, replacing andrevising the preliminary estimate. Revisions between M1 and M2 arise mostly from additional output based data.This quarterly GDP estimate is improved by the addition of, for example:
Index of Production and MIDSS data for the third month of the quarter, replacing previously used forecasts.
New information from the inventories and gross fixed capital formation inquiries.
Motor trades inquiry and HM Revenue and Customs data.
Early survey data covering the construction industry.
Data confrontation and balancing between the different approaches to the measurement of GDP.
The Quarterly National Accounts are released around 85 days after the end of the reference quarter. In this release, theONS produces a full set of quarterly economic accounts, revising and expanding the information made available inthe earlier estimate and revising estimates for earlier quarters in the current and, normally, previous years.

8
Development, Compilation and Use of Input-Output Supply and Use Tables in the United Kingdom National Accounts
IIOA, Istanbul, Turkey, 02-06 July 2007
Fuller survey data for components of each of the expenditure, output (or production) and income measures areavailable. Revisions between M2 and M3 arise from:
Additional output data. For example, construction industry estimates are based on full survey results in M3,replacing forecasts used in M1 and M2.
Newly received data for expenditure and income measures of GDP, replacing previously used forecasts.
Additional detail and replacement of imputation. For example, Expenditure and Food Survey (EFS) data areavailable in M3, replacing forecasts for households final consumption of services.
Availability of data from the ONS Quarterly Profits Inquiry, and revised estimates for inventories and gross fixedcapital formation.
Availability of some Balance of Payments data for the first time at this stage.
Data confrontation and balancing between the different approaches to the measurement of GDP.
Graphic 5 shows the evolving availability of data for components of the expenditure measure of GDP.
By this stage in the estimation process the full final employment figures (employee jobs in the Workforce Jobs survey)are usually available. These feed into both the income measure of GDP, and to a lesser extent the output (orproduction) measure of GDP. Given the fully integrated nature of the accounts, any imbalance in the sector accounts isalso part of the evidence considered in balancing GDP.
Quarterly GDP Expenditure componentsData availability and estimation
R = RevisedB = Benchmarked
○ ○ ○ ○ ○ ○ ○ ○ ○ ○ ○ ○ ○ ○ ○ ○ ○ ○ ○ ○ ○ ○ ○ ○ ○ ○ ○ ○ ○ ○ ○ ○ ○ ○ ○ ○ ○ ○ ○ ○ ○ ○ ○ ○ ○ ○ ○ ○ ○ ○ ○ ○ ○ ○ ○ ○ ○ ○ ○ ○ ○ ○ ○
5Data availabilty of quarterly GDP expenditure components
Limited data 100% B100% RTotal
60% 80%
Month 1Second
Blue Book
100% B
100% B
100% B
100% B
100% B
100% B
FirstBlue Book
100% R
100% R
100% R
100% R
100% R
Expenditure componentsPercentages for the year 2004in the 2006 Blue Book
HHFCe and NPISHs FCe64.8%
Exports of services9.2%
General government FCe21.3%
GFCF16.5%
Changes in inventories0.4%
Exports of goods16.2%
Month 3Month 2
80%
100%
85%
80%
60%
85%
100% R
45%
60%
55%
65%
100%
60%
Imports of goods-21.4%
Imports of services-7.0%
100%
60%
100%
80%
100% R 100% B
100% R 100% B
HHFCe is Households final consumption expenditure. NPISHs FCe is Non-profit institutions serving households final consumption expenditure. GFCF is Gross fixed capital formation.Valuables are not shown as the estimates are negligible.

9
Development, Compilation and Use of Input-Output Supply and Use Tables in the United Kingdom National Accounts
IIOA, Istanbul, Turkey, 02-06 July 2007
Annual GDP process including I-O Supply and Use Tables
Annual data sources, as they become available, provide more detail than the quarterly releases and are published andincorporated the following year. This is known as ‘Blue Book One stage’. In this stage, the latest complete year is year(t-1), where t is the year of the ONS Blue Book. This provides an opportunity to use data from sources that had notbeen available earlier, such as information from HM Revenue and Customs and Government out-turns for the fiscalyear. It is likely at this stage that revisions will be made to the latest annual data and underlying quarterly data. Thisrevision will take place 6 to 18 months after the M3 estimate has been published. For the year (t-1) in this stage, thethree measures of GDP are not fully balanced, and statistical discrepancies exist for the expenditure and incomemeasures of GDP.
The ‘Blue Book One stage’ estimates are again revised at the ‘Blue Book Two stage’, typically 18 to 30 months after thepreliminary GDP estimate is published. The first Input-Output Annual Supply and Use Tables are produced for theyear (t-2) using annual sources such as the ONS ABI together with a range of other benchmark sources and reviseddata. So, for example, the 2006 Blue Book included the first Input-Output Annual Supply and Use Table for the year2004, incorporating the first set of results from the ABI for that year. When balanced, the Input-Output AnnualSupply and Use Tables have removed the need for any annual statistical discrepancies between the three measures ofGDP. In the ‘Blue Book Two stage’ revisions can go back several years and impact on the first estimate for the year (t-1)produced during the ‘Blue Book One stage’, as well as the underlying quarterly estimates.
Chart 6 shows the impact of the first Input-Output Annual Supply and Use Table on the year (t-2) GDP at currentmarket prices, since the 1994 Blue Book.
Chart 7 shows the accumulative revision from the first ‘Blue Book One stage’ estimate of annual GDP for each yearbalanced through the Input-Output Annual Supply and Use Tables process to the latest estimate published in thisedition. Total revision varies between 0.4 per cent and 2.8 per cent of GDP.
For fuller details and analyses of the revisions generated by the different stages of GDP compilation. From M1through to benchmarking, see Akritidis7,8 and Richardson9,10. For further details on the annual process, see Mahajan11.
12088
6023
200
6023
7003
10163
7929
1917
12301
3266
-611
684
956
-5000 0 5000 10000 15000
○ ○ ○ ○ ○ ○ ○ ○ ○ ○ ○ ○ ○ ○ ○ ○ ○ ○ ○ ○ ○ ○ ○ ○ ○ ○ ○
6Impact of first I-O SUTs balance on year (t-2)GDP at current market prices£ million
1994 Blue Book: 1992
1995 Blue Book: 1993
1996 Blue Book: 1994
1997 Blue Book: 1995
1998 Blue Book: 1996
1999 Blue Book: 1997
2000 Blue Book: 1998
2001 Blue Book: 1999
2002 Blue Book: 2000
2003 Blue Book: 2001
2004 Blue Book: 2002
2005 Blue Book: 2003
2006 Blue Book: 2004
12088
10400
4822
8973
15461
17071
9222
22852
18857
12112
15809
13435
9815
12633
0 10000 20000 30000
○ ○ ○ ○ ○ ○ ○ ○ ○ ○ ○ ○ ○ ○ ○ ○ ○ ○ ○ ○ ○ ○ ○ ○ ○ ○ ○
7Accumulative revision to GDP from Blue BookOne stage to latest estimate since the1992 Blue Book£ million
1991
1992
1993
1994
1995
1996
1997
1998
1999
2000
2001
2002
2003
2004
10
Development, Compilation and Use of Input-Output Supply and Use Tables in the United Kingdom National Accounts
IIOA, Istanbul, Turkey, 02-06 July 2007
Sources of revisions
The scope for revisions to earlier periods is determined by the National Accounts revisions policy applied for eachquarterly and annual exercise. The policy is based around the arrival of new data and its economic significancecoupled with the need to be able to make methodological improvements. In general, revisions through the Input-Output Annual Supply and Use Tables framework are made due to:
Receipt of additional and/or more comprehensive data and the subsequent need to review any judgmentaladjustments made in previous balancing exercises, see Penneck and Mahajan12.
Update of institutional sector components to reflect final data.
Annual benchmarking of short-term based data sources.
Improvements and changes to methodology and classifications.
Inclusion of new sources and improvements to existing sources.
Specific data reconciliation exercises.
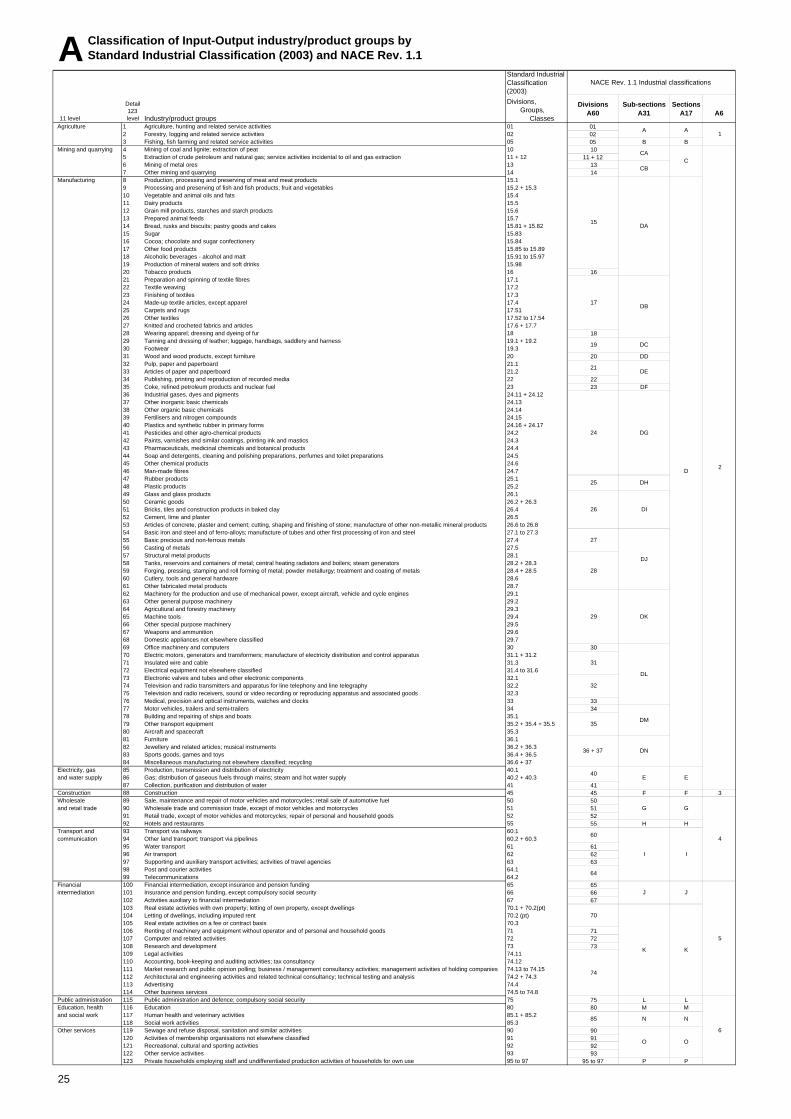
In principle, it should be noted that methodological and classification changes can cause time series to be revised all theway back to the year 1948, the earliest year of UK GDP at current market prices under the present system. Examples ofrecent cases that have generated substantial changes to the National Accounts and Input-Output Annual Supply and UseTables are shown in Table 8. For a more complete list of changes in the 1990s, see Brand and Jenkinson 13.
○ ○ ○ ○ ○ ○ ○ ○ ○ ○ ○ ○ ○ ○ ○ ○ ○ ○ ○ ○ ○ ○ ○ ○ ○ ○ ○ ○ ○ ○ ○ ○ ○ ○ ○ ○ ○ ○ ○ ○ ○ ○ ○ ○ ○ ○ ○ ○ ○ ○ ○ ○ ○ ○ ○ ○ ○ ○ ○ ○ ○ ○ ○
8Key changes affecting National Accounts and Input-Output Annual Supply and Use Tables in recent years
Blue Bookyear Change
n/a Implementation of Pickford Report Recommendations (Cabinet Office (1989))14.Implementation of Chancellor’s Initiatives (ONS (1991))15 - two funded packages in May 1990 and November 1991.
1992 Introduction of annual GDP current price balancing through the Input-Output Annual Supply and Use Tables framework.1993 Rebasing the National Accounts onto 1990=100.1995 Conversion of estimates from SIC (80) to SIC (92).1998 Use of ONS inquiry results based on the new Inter-Departmental Business Register.
Rebasing the National Accounts onto 1995=100.Move to the European System of Accounts 1995.
2000 Improved capital stock estimates from 1948.2001 Incorporation of the full impact of results from the new Annual Business Inquiry (ABI).
Inclusion of estimates for alcohol and tobacco smuggling.2003 Incorporation of initial results from the new annual all-industry purchases data collected via the ABI.
Inclusion of estimates for Missing Trader intra-community VAT fraud activity.Move to annual chain-linking of GDP with reference year 2000.
2004 Reclassification of National Health Service Trusts from the public non-financial corporation sector to the central government sector.Review of the public sector health industry estimates.Chain-linking of GDP with reference year 2001.
2005 Incorporation of results from Pension Inquiry data review.Range of Atkinson Review related revisions.Conversion of estimates from SIC (92) to SIC (2003).Chain-linking of GDP with reference year 2002.
2006 Reclassification of the BBC and S4C from the public non-financial sector to the central government sector.Inclusion of new Bank of England data on spread earnings and derivatives for banks, and data from new Bank of England Profit/Loss form.Improved estimates of consumption of fixed capital from 1948.Chain-linking of GDP with reference year 2003.

11
Development, Compilation and Use of Input-Output Supply and Use Tables in the United Kingdom National Accounts
IIOA, Istanbul, Turkey, 02-06 July 2007
Revisions can also be generated through the process of balancing Input-Output Annual Supply and Use Tables. Foreach year this process, when complete, shows:
for each of the 123 products, total supply equals total demand;
for each of the 123 industries, total inputs equals total outputs; and
for each of the 123 industries, GVA from the production approach equals that from the income approach,consistent both with components of the income measure and for each of the seven National Accountsinstitutional sectors.
These identities hold for each year and the balancing process also has to ensure consistency of the industry, productand institutional sector detail over time. For further details of the annual balancing process, see Mahajan 11.
Table 9 shows for each ONS Blue Book since 1992, the earliestyear for which revisions have been made to annual currentprice GDP and to Input-Output Annual Supply and UseTables. Improvements to the quality of Input-Output AnnualSupply and Use Tables have also been made without affectingtotal GDP. For example, the 2005 exercise included revisionsfor years back to 1992, whereas annual current price GDP wasonly revised from the year 1996.
Table 10 shows for each annual exercise from 1992, thepublication of new Input-Output Annual Supply and UseTables and the years for which earlier tables have been revised.
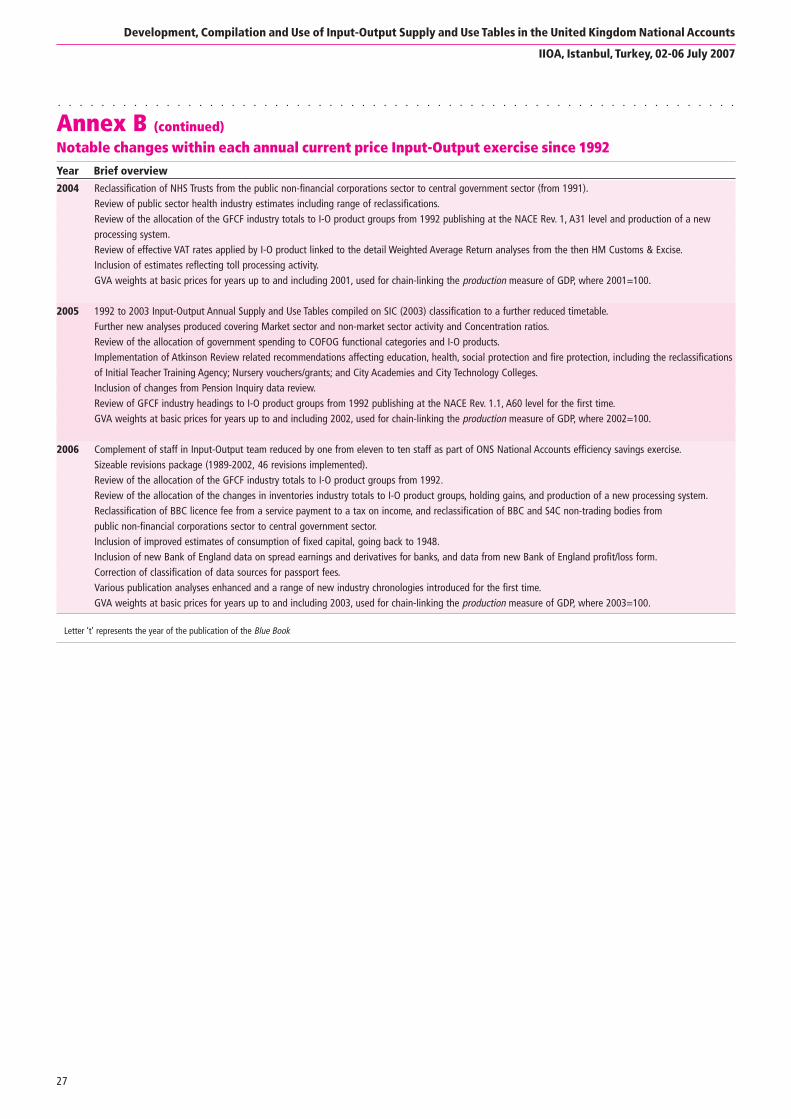
Annex B shows a brief summary reflecting key changesincorporated in the Input-Output Annual Supply and UseTables in each year.
○ ○ ○ ○ ○ ○ ○ ○ ○ ○ ○ ○ ○ ○ ○ ○ ○ ○ ○ ○ ○ ○ ○ ○ ○ ○ ○ ○ ○ ○ ○ ○ ○ ○ ○ ○ ○ ○ ○ ○ ○ ○ ○ ○ ○ ○ ○ ○ ○ ○ ○ ○ ○ ○ ○ ○ ○ ○ ○ ○ ○ ○ ○
10Input-Output Annual Supply and Use Tables published since 1992
System ofYear (t) Industrial Nationalpublished Input-Output Annual Supply and Use Tables classification Accounts
1992 ‘89 SIC (80) ESA 79
1993 ‘89r ‘90 SIC (80) ESA 79
1994 ‘89r ‘90r ‘91 ‘92 SIC (80) ESA 79
1995 ‘89r ‘90r ‘91r ‘92r ‘93 SIC (92) ESA 79
1996 '89r '90r '91r '92r '93r '94 SIC (92) ESA 79
1997 '89r '90r '91r '92r '93r '94r '95 SIC (92) ESA 79
1998 '89r '90r '91r '92r '93r '94r '95r '96 SIC (92) ESA 95
1999 '96r '97 SIC (92) ESA 95
2000 ‘89r ‘90r ‘91r '92r '93r '94r '95r '96r '97r '98 SIC (92) ESA 95
2001 ‘89r ‘90r ‘91r '92r '93r '94r '95r '96r '97r '98r '99 SIC (92) ESA 95
2002 '97r '98r '99r ‘00 SIC (92) ESA 95
2003 ‘92r ‘93r ‘94r ‘95r ‘96r ‘97r ‘98r ‘99r ‘00r ‘01 SIC (92) ESA 95
2004 ‘91r ‘92r ‘93r ‘94r ‘95r ‘96r ‘97r ‘98r ‘99r ‘00r ‘01r ‘02 SIC (92) ESA 95
2005 ‘92r ‘93r ‘94r ‘95r ‘96r ‘97r ‘98r ‘99r ‘00r ‘01r ‘02r ‘03 SIC (2003) ESA 95
2006 ‘89r ‘90r ‘91r '92r '93r '94r '95r '96r '97r '98r '99r ‘00r ‘01r ‘02r ‘03r ‘04 SIC (2003) ESA 95
Letter ‘r’ denotes the I-O Annual Supply and Use Tables that have been revised.
Letter ‘t’ denotes the year of publication.
○ ○ ○ ○ ○ ○ ○ ○ ○ ○ ○ ○ ○ ○ ○ ○ ○ ○ ○ ○ ○ ○ ○ ○ ○ ○ ○
9Earliest year revised since 1992 Blue Book
Blue Book Earliest year revisedyear Annual current I-O Annual Supply
price GDP and Use Tables1992 1984 19891993 1982 19891994 1983 19891995 1987 19891996 1987 19891997 1989 19891998 1948 19891999 1996 19962000 1948 19892001 1986 19892002 1997 19972003 1996 19922004 1991 19912005 1996 19922006 1948 1989

12
Development, Compilation and Use of Input-Output Supply and Use Tables in the United Kingdom National Accounts
IIOA, Istanbul, Turkey, 02-06 July 2007
The Input-Output Annual Supply and Use Tables are based on a wide range of sources:
In the main, these tables are based on returns from ONS statistical surveys such as the ABI, PRODCOM, ITIS,Financial Industry inquiries and the Expenditure and Food Survey, as well as data from other governmentdepartments such as Defra, DTI and HM Revenue and Customs.
Data from administrative systems are also used, such as the Government Expenditure Monitoring System,Subjective Analyses Return covering local government expenditure as well as tax and employment-based datafrom HM Revenue and Customs.
Models are also used, such as the Perpetual Inventory Model, to provide estimates for market and non-marketbodies’ consumption of fixed capital.
Over time, the ONS receives more complete information, for example, as more survey returns come in, this newinformation is incorporated within the National Accounts.
For further details covering sources and methods underlying the Input-Output Annual Supply and Use Tables arecovered later in this article and, see Mahajan16 and the UK Gross National Income Inventory of Methods17.
Revisions analyses are published each year in the Input-Output Analyses publication. Also, Input-Output basedarticles have been published in Economic Trends, see Mahajan18

13
Development, Compilation and Use of Input-Output Supply and Use Tables in the United Kingdom National Accounts
IIOA, Istanbul, Turkey, 02-06 July 2007
Annual coherence adjustments to GDP in the 2006 ONS Blue Book and I-O Supply and Use Tables
In practice, the data sources used in the National Accounts are subject to statistical error and complete coherencebetween measures of economic activity is not achieved without making specific adjustments. For the period 1989-2004, these adjustments are made through the current price I-O balancing process using the I-O Annual Supply andUse Tables and the underlying framework.
An article in the October 1999 Economic Trends 12 describes the background to these adjustments and briefly showshow they are made. The compilation and balancing process is described in more detail in the Input-OutputMethodological Guide 16 and the January 1997 Economic Trends. The process of achieving coherence in the accounts bybalancing I-O Annual Supply and Use Tables can most simply be explained as a series of different types ofadjustment.
The main types of adjustment described in the October 1999 Economic Trends article are:
conceptual and coverage adjustments;
quality adjustments; and
coherence adjustments.
Table 11 shows these coherence adjustments for 2003 and 2004.○ ○ ○ ○ ○ ○ ○ ○ ○ ○ ○ ○ ○ ○ ○ ○ ○ ○ ○ ○ ○ ○ ○ ○ ○ ○ ○ ○ ○ ○ ○ ○ ○ ○ ○ ○ ○ ○ ○ ○ ○ ○ ○ ○ ○ ○ ○ ○ ○ ○ ○ ○ ○ ○ ○ ○ ○ ○ ○ ○ ○ ○ ○
11Coherence adjustments within 2003 and 2004 annual current price GDP (£ million)
Income measure Coherence adjustment
2003 2004
Financial corporations’ profits 1,380 950Private non-financial corporations’ profits 1,884 -1,686Compensation of employees 2,992 2,361Rental income - -Self-employment income 2,682 1,910
Expenditure measure
Households final consumption 1,409 5,711NPISHs 520 802Central government - -Local government - -Gross fixed capital formation 505 3,535Changes in inventories - -Exports of services 3,010 3,265Imports of services 2,740 2,055
Production measure (adjustment to GVA by industry)
Agriculture, forestry & fishing 35 0Mining & quarrying 2,815 1,570Manufacturing 179 -1,385Electricity, gas & water supply 660 413Construction -366 240Distribution & hotels -1,857 -3,356Transport & communication -1,339 -685Finance & business services -4,194 -4,248Public administration & defence - -Education, health & social work 181 114Other services -794 -224

14
Development, Compilation and Use of Input-Output Supply and Use Tables in the United Kingdom National Accounts
IIOA, Istanbul, Turkey, 02-06 July 2007
Sources and methods underlying the I-O Supply and Use Tables
The ONS’s Input-Output work follows closely the approach of the United Nations in their System of NationalAccounts 1993 (SNA 93) 19 and the ESA 95. In addition, the United Nations Input-Output Tables and Analysis, Studies inMethods and Handbook 20,21 provide further detailed information. It is worth noting that Eurostat, in collaborationwith Member States, arranged a Task Force including the UK (representative from UK: Sanjiv Mahajan) in 2001 todevelop a new I-O Manual covering the compilation of I-O Supply and Use Tables and I-O Analytical Tablesconsistent with the ESA 95 and SNA 93, and this is available in draft form22.
Wherever possible, ONS inquiries have been used as the basis of the estimates in the tables. However, for the detailedfigures we have to use a wide variety of data sources of varying suitability and quality. Information on purchases, inparticular, is an area for which the ONS has a programme of continual development to improve the quality andcoverage of the inquiries.
Table 12 shows a summary of sources either directly or indirectly used.
The estimates used for the Input-Output Annual Supply and Use Tables for 1992-2004 are our best view of thestructure of supply and demand. Many of the detailed estimates have been changed by the need to achieve a balancewithin the I-O Annual Supply and Use Tables framework.
The UK is relatively rich in terms of the availability of source data to populate the Input-Output Annual Supply andTables, and producing all of the components for each of the three approaches to GDP. This enables detailed dataconfrontation as part of the balancing process, and consequently, a better quality end-product.
Over the past 15 years, the UK has implemented recommendations from the Pickford Report (1989) and theChancellor’s Initiatives (May 1990 and November 1991), which have led to numerous improvements to UK economicstatistics and the development of new business surveys and products.
Several new sources have been developed to collect annual data covering detailed information on purchases of goodsand services for intermediate consumption and a breakdown of gross fixed capital formation by industry and byproduct.
ONS sourcesAnnual Business InquiryBusiness Spend on Capital ItemsExpenditure and Food SurveyFinancial InquiriesInter-Departmental Business RegisterInternational Passenger SurveyInternational Trade in Services InquiryMonthly inquiry into Distribution and
Services SectorMonthly Production InquiryPerpetual Inventory ModelPRODCOMQuarterly Profits InquiryQuarterly Capital ExpenditureQuarterly Stocks InquiryRange of ad hoc pilot surveysVAT paid and VAT turnover data
Other government departmentsBank of EnglandDepartment for Environment, Food and Rural AffairsDepartment of the Environment, Transport and the RegionsDepartment of Enterprise, Trade and Investment (Nothern Ireland)Department for TransportDepartment of HealthDepartment of Trade and IndustryHer Majesty’s Revenue and Customs
(including INTRASTAT data)Her Majesty’s TreasuryMinistry of DefenceCommunities and Local Government
Non-government sourcesAssociation of British InsurersCivil Aviation AuthorityCompany annual reports and accountsCompany financial websitesRegulatory accounts
○ ○ ○ ○ ○ ○ ○ ○ ○ ○ ○ ○ ○ ○ ○ ○ ○ ○ ○ ○ ○ ○ ○ ○ ○ ○ ○ ○ ○ ○ ○ ○ ○ ○ ○ ○ ○ ○ ○ ○ ○ ○ ○ ○ ○ ○ ○ ○ ○ ○ ○ ○ ○ ○ ○ ○ ○ ○ ○ ○ ○ ○ ○
12Brief summary of data sources

15
Development, Compilation and Use of Input-Output Supply and Use Tables in the United Kingdom National Accounts
IIOA, Istanbul, Turkey, 02-06 July 2007
The next part of this section covers some of the key ONS annual survey sources developed and used to populate theInput-Output Annual Supply and Tables. It is worth noting that many of the sources provide data for both the SupplyTable and the Use Table.
Annual Business Inquiry
The Annual Business Inquiry (ABI) introduced in 1998, is a statutory survey with two parts: ABI/1 collectsemployment information and ABI/2 collects financial information from businesses and other establishments acrossmost of the economy. The ABI/2 forms the single largest ONS based source used to populate the Input-OutputAnnual Supply and Tables, and covers the following industries:
Parts of agriculture and all of forestry and fishing;
Mining and quarrying;
Manufacturing;
Electricity, gas and water;
Construction;
Distribution and hotels;
Transport and communication;
Business (not financial industries); and
Other services excluding general government.
In 2005/6, 69,900 ABI/2 forms (compared with 77,000 in 2004/05) were sent to businesses, collecting financialinformation covering:
Employment costs;
Turnover;
Purchases of goods and services;
Taxes paid and subsidies received;
Changes in inventories;
Gross fixed capital formation; and
Imports and exports of services.
This survey also collects from the distribution industries details of sales and purchases of goods for resale withoutprocessing, from which an estimate of distributors’ trading margins by product can be derived.
Detailed purchases of goods and services for intermediate consumption
Under the umbrella of the ABI/2, forms are sent to businesses across the whole economy collecting detailedbreakdowns of purchases of goods and services used up as intermediate consumption. The forms are specific to eachindustry, asking appropriate questions relevant to the industries’ activity. For example, the shoe manufacturingindustry is asked about their purchases of leather, fabric, glue, rubber etc. In 2005/6, detailed questions on purchaseswere sent to around 13,000 businesses selected as a sub-sample of the ABI/2.
PRODCOM
PRODucts of the European COMmunity (PRODCOM) is a statutory survey undertaken by the ONS, in line with theharmonised system across the European Community for the collection and publication of product statistics. It iscompiled by collecting data from manufacturers on an annual basis and covered over 24,500 businesses in 2005/6.
Detailed data is collected covering both value and volume of manufacturers’ product sales, merchanted goods, workdone, sales of waste products and residues, and other income.

16
Development, Compilation and Use of Input-Output Supply and Use Tables in the United Kingdom National Accounts
IIOA, Istanbul, Turkey, 02-06 July 2007
International Trade in Services survey
The International Trade in Services survey is an annual statutory inquiry collecting product detail (51 products) onimports and exports of services (by country of origin and destination) of the private sector with a few exceptions. Theannual sample in 2005/6 was around 20,000.
Business Spending on Capital Items Survey
The Business Spending on Capital Items Survey is an annual statutory survey covering most industries, and collectsdetailed product breakdowns of companies’ capital expenditure (acquisitions and disposals are covered separately)on assets such as vehicles and plant and machinery (over 50 products). The annual sample in 2005/6 was over 2,500.
For more information and detail on the data sources used, as well as the balancing process, please refer to theInput-Output Methodological Guide 1997 edition. Although based on now superseded UK methodologies it still offersextensive help.
The Gross National Income Inventory of Methods also provides more comprehensive detail on sources and methodsunderlying the compilation of the three measures of GDP and the balancing process.
Gross Value Added - link between survey based estimates and the I-O Annual Supply and Use Tables
Data collected and published through the ONS Annual Business Inquiry (ABI) shows ‘approximate’ GVA at basicprices and ‘approximate’ total output at basic prices. The ABI forms a major data input in the production of I-OAnnual Supply and Use Tables, which also show industry estimates of total output at basic prices and gross valueadded at basic prices but are different from those shown in the ABI. Alternative data sources are used for industriesnot covered by the ABI. In producing these estimates to be fully consistent with the ESA 95, there are essentially fourkey adjustments required: coverage adjustments, conceptual and valuation adjustments, quality adjustments andcoherence adjustments.
The adjustments can be briefly described as follows:
Coverage adjustments
These include, for example: allowances made for units missing from the IDBR; the self-employed; and, in the past, thetransformation of inquiry based estimates covering only Great Britain onto a full United Kingdom basis (includingNorthern Ireland).
Conceptual and valuation adjustments
These are needed to move the inquiry based estimates onto a full ESA 95 basis required for National Accounts. Theseadjustments include for example: income earned-in-kind; imputed insurance premium supplement; taxes andsubsidies on production; and capital formation on cultivated assets.
Quality adjustments
These are needed to address issues such as known biases or discontinuities in the source data. These may be specific toa range of products, industries or even to just one year, and are often not taken into source survey results due totiming or system constraints.
Coherence adjustments
These are needed to resolve the data confrontation posed by the various data sources used in producing and balancingthe production, income and expenditure measures of GDP through the I-O Annual Supply and Use Tables framework.

17
Development, Compilation and Use of Input-Output Supply and Use Tables in the United Kingdom National Accounts
IIOA, Istanbul, Turkey, 02-06 July 2007
Analyses
Over the past ten years, substantial improvements have been made to the production processes allowing for thedevelopment of a range of user orientated analyses. This has further developed the role of Input-Output in the UK.
The Current Price Input-Output Branch has been staffed with around 11 members (reduced to 10 from April 2006)over the past few years and covers the development, compilation, co-ordination and balancing of the Input-OutputAnnual Supply and Use Tables, as well as the production of the analyses in the UK Input-Output Analyses publication,and the publication itself.
The team has continually improved compilation methodologies; developed existing and new data sources; improvedlinks with data suppliers and the annual balancing process; and automated many processes and routines used in thecompilation of the Input-Output Annual Supply and Use Tables.
These achievements have enabled the efficient production of the product, including meeting the challenge ofmaintaining a long run of consistent Input-Output Annual Supply and Use Tables, presently for the period 1992-2004. This in turn has allowed the team to drive forward the development of a wide-range of new economic analyses,either as a time series or year specific, based on the Input-Output Annual Supply and Use Tables. These analysesinclude:
The UK economy - Analyses at a glance.
Export shares of goods and services.
Import penetration of goods and services.
Net trade in goods and services.
Information and communication technologies (ICT).
Creative sector.
Food sector.
Concentration ratios for businesses by industry.
Taxes and subsidies recorded within the production boundary.
Oil and gas sector.
Market sector and non-market sector activity.
Revisions analyses.
Chronologies of economic events for a number of industries.
Many of these analyses require appropriate industry, product and sector definitions. Wherever possible, we have usedinternationally recognised definitions, such as the OECD’s description of ICT activity and the definition of themarket sector as laid out in the ESA 95. If such definitions are not suitable, we have used definitions recognised in theuser community as used for the creative sector and food sector, both of which are used by other governmentdepartments.
User demands for analyses based on the Input-Output framework have been a key driver for developing suchanalyses. For example, key users like the Bank of England and HM Treasury are interested in the market sector andnon-market sector activity to assess the business cycle, monitor the output gap, and compare productivity betweensectors as well as across other countries. Market sector estimates also provide an important indicator of demandpressures reflecting changes in the quantity of goods and services sold in the market sector of the economy.
The United Kingdom Input-Output Analyses publication together with other I-O based products can be viewed on theONS Input-Output web-page at www.statistics.gov.uk/inputoutput.

18
Development, Compilation and Use of Input-Output Supply and Use Tables in the United Kingdom National Accounts
IIOA, Istanbul, Turkey, 02-06 July 2007
The next part of this paper provides brief overview extracts from some of the above articles in the United KingdomInput-Output Analyses, 2006 Edition, released in August 2006.

19
Development, Compilation and Use of Input-Output Supply and Use Tables in the United Kingdom National Accounts
IIOA, Istanbul, Turkey, 02-06 July 2007

20
Development, Compilation and Use of Input-Output Supply and Use Tables in the United Kingdom National Accounts
IIOA, Istanbul, Turkey, 02-06 July 2007
Input-Output Analytical Tables
The I-O Analytical Tables provide tools to analyse the structure of the economy and perform economic modelling.The I-O Analytical Tables show separately the consumption of UK produced goods and services and imported goodsand services. These tables provide a theoretical framework for further analysis of the structure of the economy, thecomposition and the effect of changes in final demand on the economy.
Cambridge University produced the first UK I-O Tables for the years 1948 (using only eight industry groups) and1950, with results published in the 1952 and 1953 Blue Books respectively. The first official UK I-O tables wereproduced by the Board of Trade and Central Statistical Office for the year 1954 (using forty-six industry groups)based on the 1960 Blue Book and published in 1961. Since then, I-O Tables have been produced roughly every fiveyears as needed for the National Accounts rebasing of constant price estimates.
The close relationship between I-O Annual Supply and Use Tables and I-O Analytical Tables has sometimes led toconfusion despite being two different products. For example, previous naming conventions have described the I-OAnnual Supply and Use Tables and I-O Analytical Tables as Derived Tables, Input-Output Tables, Input-OutputBalances or Symmetric Tables.
Graphic 13 shows diagrammatically the structure of the symmetric I-O Analytical Tables (Product by Product).
Tota
l int
erm
edia
te d
eman
d
HHFC
e
NPI
SHs
FCe
Cent
ral g
over
nmen
t FCe
Loca
l gov
ernm
ent F
Ce
Gro
ss fi
xed
capi
tal f
orm
atio
n
Valu
able
s
Chan
ges
in in
vent
orie
s
TOTAL
SUPPLY Ex
port
s of
goo
ds a
nd s
ervi
ces
PRODUCT
PRODUCT
TOTAL
DEMAND
DOMESTICSUPPLYat basic prices
INTERMEDIATEDEMAND(of domestically producedgoods and services)at basic prices
Supply Table Use Table
PRODUCT PRODUCTFINAL DEMANDat basic prices
HHFCe represents Households final consumption expenditure.NPISHs FCe represents Non-profit institutions serving households final consumption expenditure.X denotes the diagonal entries in the Domestic Supply Table. Off-diagonal entries in the industry by product Domestic Output Table and their associated inputs, have been moved to this product as part of the compilation of the Symmetric Table.
TOTAL OUTPUT
Total intermediate consumption
Imports of goods and services
Taxes (less subsidies) on production
Compensation of employees
Gross operating surplus
GVA at basic prices(Primary inputs)
Taxes (less subsidies) on products
TOTAL OUTPUT (INPUTS)
X X X X X X X X X X X X
○ ○ ○ ○ ○ ○ ○ ○ ○ ○ ○ ○ ○ ○ ○ ○ ○ ○ ○ ○ ○ ○ ○ ○ ○ ○ ○ ○ ○ ○ ○ ○ ○ ○ ○ ○ ○ ○ ○ ○ ○ ○ ○ ○ ○ ○ ○ ○ ○ ○ ○ ○ ○ ○ ○ ○ ○ ○ ○ ○ ○ ○ ○
13I-O Analytical Tables (symmetric): Product by Product

21
Development, Compilation and Use of Input-Output Supply and Use Tables in the United Kingdom National Accounts
IIOA, Istanbul, Turkey, 02-06 July 2007
The main differences between I-O Analytical Tables and the I-O Annual Supply and Use Tables are:
I-O Analytical Tables are symmetric tables (Product by Product or Industry by Industry). There are no off-diagonal elements in the Supply Table and the row totals equal the column totals in the Supply Table.
In the I-O Analytical Tables, consumption of imports of goods and services and UK produced goods and servicesare shown separately, since the assumptions underlying the construction of the I-O Analytical Tables cannot beapplied to imports. A symmetric Imports Use Table can be constructed only as a derivation of the domestic basedI-O Analytical Tables.
The valuation of the main I-O Analytical Tables is at basic prices. This valuation reflects the amount received bythe producers for their output, excluding distributors’ trading margins and taxes (less subsidies) on products.
There are various type of analyses that can be compiled in the process of producing I-O Analytical Tables. Forexample:
Industry by product transformation matrices covering distributors’ trading margins, taxes (less subsidies) onproducts and imports of goods and services;
Domestic Use Table and Imports Use Table at basic prices (Product by Industry);
Product by Product tables for the Domestic Use Table and Imports Use Table at basic prices;
Industry by Industry tables for the Domestic Use Table and Imports Use Table at basic prices;
Leontief Inverse;
Multiplier analyses (for example: output, employment and employment costs);
Primary input content of final demand, and links to GDP; and
Industrial analyses in terms of primary inputs.
For further details, see the last set of I-O Analytical Tables. These tables covered the year 1995 and were on an ESA 95basis using the Standard Industrial Classification 1992 (SIC (92)). The number of I-O groups (industry/product) wereextended from 123 to 138 in order to reflect the different input structures of central government, local governmentand NPISHs (Non-profit institutions serving households). These tables were also consistent with the I-O AnnualSupply and Use Tables for 1995 published in November 2001. The I-O Annual Supply and Use Tables for 1995 havesince been revised in each of the subsequent annual exercises from 2002 to 2006 inclusive.
Member States are now required under EU statistical regulation to produce I-O Analytical Tables together with I-OAnnual Supply and Use Tables, and submit them to Eurostat. The UK submitted the 1995 I-O Analytical Tables inDecember 2002.
Although the I-O Analytical Tables have been published roughly every five years, our plan to produce these tablesannually following publication of the 1995 tables, consistent with the I-O Annual Supply and Use Tables, has been inabeyance. In 2002, this plan was reconsidered in the light of changed priorities within the ONS. In particular, NationalAccounts production is being thoroughly reviewed as part of a re-engineering project. As a result, there are no explicitplans to produce another set of I-O Analytical Tables or to produce them annually until the higher priority parts ofthe National Accounts re-engineering programme is complete. At present, no further tables are expected to beproduced by the ONS until 2010 at the earliest.
Annex C shows a full chronology of UK I-O Analytical Tables.

22
Development, Compilation and Use of Input-Output Supply and Use Tables in the United Kingdom National Accounts
IIOA, Istanbul, Turkey, 02-06 July 2007
Future
Internationally driven changes
There are major changes that the UK has to prepare for, and implement. Those affecting the National Accounts andInput-Output Annual Supply and Use Tables at current prices include:
Implementation of the allocation of FISIM, by industry, by sector and by type of final expenditure;
Implementation of the new Standard Industrial Classification (2007), consistent with the new NACE Rev. 2; and
Changes to the System of National Accounts 1993 (SNA 93) and the European of System of Accounts 1995 (ESA 95).
The UK National Accounts and Input-Output Annual Supply and Use Tables presently treat FISIM as a nominalindustry and sector. The present plan is to implement the allocation of FISIM, by industry, by sector and by type offinal expenditure in the 2007 annual exercise, going back to the start of the UK National Accounts.
In line with the new Standard Industrial Classification (2007), which will be consistent with the new NACE Rev. 2, theONS will convert its business register onto the new classification through the year 2007. From the beginning of 2008,all ONS business surveys will be sampled using the new classification. The work programme will include thedevelopment of links between old and new register data to inform the creation of continuous survey results, andthereby continous time series within National Accounts.
The new classification will have a major impact on survey results and National Accounts, requiring extensive re-writing of computer systems and the generation of back-data onto a consistent basis. This will affect the compilation,balancing and publication of the monthly, quarterly and annual outputs of the National Accounts, including theInput-Output Annual Supply and Use Tables.
There are many international discussions covering the treatment of various issues leading to revision of the presentSNA 93, due for completion sometime in 2008. This in turn will lead to a revision of the ESA 95, due for completionmaybe around 2010. The UK is actively participating in many of these discussions. Once both of these stages havebeen agreed, it is likely that the National Accounts will be produced on the new basis maybe around 2012.
Domestically driven changes
In 2003, the UK began a major National Accounts Re-engineering Project as part of a much wider ONS office-wideStatistical Modernisation programme. All National Accounts production processes and the further development ofthe role of Input-Output are being reviewed. This includes the estimation of GDP through the Input-Output Supplyand Use Tables framework:
both at current prices and previous years’ prices;
quarterly and annually;
expanding the number of industries and products;
estimation of gross value added by double deflation;
balancing of deflators across supply and demand; and
improving links with labour market data.
The National Accounts Re-engineering Project also includes the re-organisation of management structures, and staffroles and responsibilities to reflect new systems and processes.
More details of this planned work are given in Beadle 23 .

23
Development, Compilation and Use of Input-Output Supply and Use Tables in the United Kingdom National Accounts
IIOA, Istanbul, Turkey, 02-06 July 2007
Examples of other developments we will need to consider include:
Improving the processes, with which long-run consistent Input-Output Annual Supply and Use Tables can bemaintained for an ever-increasing number of years. For example, in the 2006 annual exercise, Input-OutputAnnual Supply and Use Tables for the years 1992-2003 were revised and rebalanced, together with the productionof new tables for the year 2004. With limited resources and time available, this approach is not sustainable.Changes required will also need to include the development of an effective and appropriate revisions policy.
Regular production of Input-Output Analytical Tables. The last set of these tables were produced for the year1995 and published in 2002.
Development of new sources covering areas where the data available is relatively weak compared with other areasof the National Accounts or parts of the Input-Output Supply and Use Tables. For example, with the increasingrole of the distribution and service sector, there is a growing need for a SERVCOM type survey, similar toPRODCOM but collecting detail on sales by type of product for the construction, distribution and serviceindustries.
An ever-changing economy and changes to the SNA/ESA require continual development of our business surveysto meet the needs of National Accounts and the compilation of Input-Output Annual Supply and Use Tables.
Developing and publishing more economic analyses based on the Input-Output Supply and Use Tables to meetusers’ needs, both inside and outside government.
Summary
The role of Input-Output has greatly expanded in the UK in the past 15 years, and the challenges to date have beenmet in full.
The challenges ahead for the UK over the next few years are even greater with the requirements of the following:
Implementation of the allocation of FISIM, by industry, by sector and by type of final expenditure;
Implementation of the new Standard Industrial Classification (2007), consistent with the new NACE Rev. 2;
Changes to the System of National Accounts 1993 and the European of System of Accounts 1995; and
ONS National Accounts re-engineering programme placing Input-Output as the foundation of the UK quarterlyand annual National Accounts.
Success generates even greater expectations of success, and ONS will be striving to meet our targets and obligationsover the next few years.
For some of these issues, we would like to benefit from the experience in other countries that already successfullycarry out such processes. In other areas, we hope that our experiences and knowledge will be of assistance to othercountries who are developing the role of Input-Output in their National Accounts.

24
Development, Compilation and Use of Input-Output Supply and Use Tables in the United Kingdom National Accounts
IIOA, Istanbul, Turkey, 02-06 July 2007
References:
1 United Kingdom National Accounts 2006
(The ONS Blue Book) TSO 2006 ISBN 011621 7367
2 United Kingdom Balance of Payments 2006
(The ONS Pink Book) TSO 2006 ISBN 011621 7375
3 European System of Accounts 1995 (ESA 95)
(EU. Eurostat) ISBN 92 827 7954 8
4 Analytical Input-Output Tables for the United Kingdom, 1995
(Web only) ONS, April 2002. www.statistics.gov.uk/inputoutput
5 Economic Trends No. 480 October 1993 (containing Handling Revisions in the National Accounts by David Wroe).
Published by HMSO 1993 ISSN 0013 0400
6 Economic Trends No. 603 February 2004 (containing Revisions to Economic Statistics: their role in measuring economicprogress by Len Cook).
Published by TSO 2004 ISSN 0013 0400
7 Economic Trends No. 594 May 2003 (containing Revisions to Quarterly GDP Growth by Leonidas Akritidis).
Published by TSO 2003 ISSN 0013 0400
8 Economic Trends No. 601 December 2003 (containing Revisions to Quarterly GDP Growth and Expenditure components byLeonidas Akritidis).
Published by TSO 2003 ISSN 0013 0400
9 Economic Trends No. 584 July 2002 (containing Revisions to GDP: A time profile by Craig Richardson).
Published by TSO 2002 ISSN 0013 0400
10 Economic Trends No. 601 December 2003 (containing Revisions Analysis: A Time Series Approach by Craig Richardson).
Published by TSO 2003 ISSN 0013 0400
11 Economic Trends No.519 January 1997 (containing Balancing GDP: UK Annual Input-Output Balances by Sanjiv Mahajan).
Published by TSO 1997 ISSN 0013 0400
12 Economic Trends No. 551 October 1999 (containing Annual Coherence Adjustments in the National Accounts by StephenPenneck and Sanjiv Mahajan).
Published by TSO 1999 ISSN 0013 0400
13 Economic Trends No. 538 May 2000 (containing A Decade of Improvements to Economic Statistics by Martin Brand andGraham Jenkinson).
Published by TSO 2000 ISSN 0013 0400
14 Government Economic Statistics: A Scrutiny Report (Cabinet Office 1989).Published by HMSO 1989
15 Economic Trends No. 448 February 1991 (containing Improving Economic Statistics - The Chancellor’s Initiative).
Published by HMSO 1991 ISSN 0013 0400
16 UK Input-Output Balances Methodological Guide by Sanjiv Mahajan, 1997 Edition.
Published by ONS February 1997 ISBN 1 85774 234 6
17 UK ESA95 Gross National Income Inventory of Methods (Web only) ONS.
www.statistics.gov.uk/Statbase/Product.asp?vlnk=6392
18 Economic Trends No.610 September 2004 (containing Input-Output and GDP revisions analyses: 1992-2002 by Sanjiv Mahajan).
Published by TSO 2004 ISSN 0013 0400
19 System of National Accounts,
United Nations, 1993. ISBN 92 1 161352 3
20 Input-Output Tables and Analysis. Studies in Methods, Series F, No. 14, Rev. 1
United Nations, 1973.
21 Handbook of Input-Output Table Compilation and Analysis, Studies in Methods, Series F, No.74
United Nations, 1999.
22 Eurostat Input-Output Manual (Draft), 2001
23 Economic and Labour Market Review, Vol 1, no. 4 (containing Modernising the UK’s National Accounts by Jon Beadle)
Published by Palgrave Macmillan 2007 ISSN (on line) 1751-8334
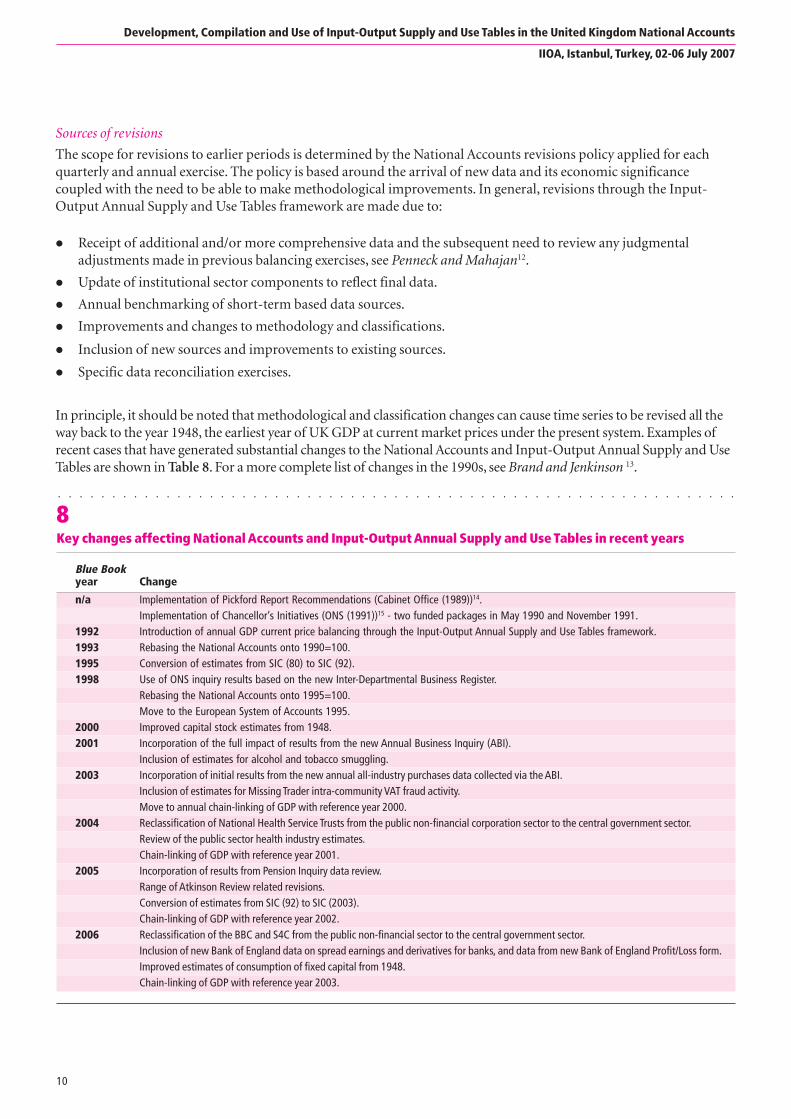
AStandard Industrial Classification (2003)
11 level
Detail 123 level Industry/product groups
Divisions, Groups, Classes
DivisionsA60
Sub-sectionsA31
SectionsA17 A6
Agriculture 1 Agriculture, hunting and related service activities 01 012 Forestry, logging and related service activities 02 023 Fishing, fish farming and related service activities 05 05 B B
Mining and quarrying 4 Mining of coal and lignite; extraction of peat 10 105 Extraction of crude petroleum and natural gas; service activities incidental to oil and gas extraction 11 + 12 11 + 126 Mining of metal ores 13 137 Other mining and quarrying 14 14
Manufacturing 8 Production, processing and preserving of meat and meat products 15.19 Processing and preserving of fish and fish products; fruit and vegetables 15.2 + 15.310 Vegetable and animal oils and fats 15.411 Dairy products 15.512 Grain mill products, starches and starch products 15.613 Prepared animal feeds 15.714 Bread, rusks and biscuits; pastry goods and cakes 15.81 + 15.8215 Sugar 15.8316 Cocoa; chocolate and sugar confectionery 15.8417 Other food products 15.85 to 15.8918 Alcoholic beverages - alcohol and malt 15.91 to 15.9719 Production of mineral waters and soft drinks 15.9820 Tobacco products 16 1621 Preparation and spinning of textile fibres 17.122 Textile weaving 17.223 Finishing of textiles 17.324 Made-up textile articles, except apparel 17.425 Carpets and rugs 17.5126 Other textiles 17.52 to 17.5427 Knitted and crocheted fabrics and articles 17.6 + 17.728 Wearing apparel; dressing and dyeing of fur 18 1829 Tanning and dressing of leather; luggage, handbags, saddlery and harness 19.1 + 19.230 Footwear 19.331 Wood and wood products, except furniture 20 20 DD32 Pulp, paper and paperboard 21.133 Articles of paper and paperboard 21.234 Publishing, printing and reproduction of recorded media 22 2235 Coke, refined petroleum products and nuclear fuel 23 23 DF36 Industrial gases, dyes and pigments 24.11 + 24.1237 Other inorganic basic chemicals 24.1338 Other organic basic chemicals 24.1439 Fertilisers and nitrogen compounds 24.1540 Plastics and synthetic rubber in primary forms 24.16 + 24.1741 Pesticides and other agro-chemical products 24.242 Paints, varnishes and similar coatings, printing ink and mastics 24.343 Pharmaceuticals, medicinal chemicals and botanical products 24.444 Soap and detergents, cleaning and polishing preparations, perfumes and toilet preparations 24.545 Other chemical products 24.646 Man-made fibres 24.747 Rubber products 25.148 Plastic products 25.249 Glass and glass products 26.150 Ceramic goods 26.2 + 26.351 Bricks, tiles and construction products in baked clay 26.452 Cement, lime and plaster 26.553 Articles of concrete, plaster and cement; cutting, shaping and finishing of stone; manufacture of other non-metallic mineral products 26.6 to 26.854 Basic iron and steel and of ferro-alloys; manufacture of tubes and other first processing of iron and steel 27.1 to 27.355 Basic precious and non-ferrous metals 27.456 Casting of metals 27.557 Structural metal products 28.158 Tanks, reservoirs and containers of metal; central heating radiators and boilers; steam generators 28.2 + 28.359 Forging, pressing, stamping and roll forming of metal; powder metallurgy; treatment and coating of metals 28.4 + 28.560 Cutlery, tools and general hardware 28.661 Other fabricated metal products 28.762 Machinery for the production and use of mechanical power, except aircraft, vehicle and cycle engines 29.163 Other general purpose machinery 29.264 Agricultural and forestry machinery 29.365 Machine tools 29.466 Other special purpose machinery 29.567 Weapons and ammunition 29.668 Domestic appliances not elsewhere classified 29.769 Office machinery and computers 30 3070 Electric motors, generators and transformers; manufacture of electricity distribution and control apparatus 31.1 + 31.271 Insulated wire and cable 31.372 Electrical equipment not elsewhere classified 31.4 to 31.673 Electronic valves and tubes and other electronic components 32.174 Television and radio transmitters and apparatus for line telephony and line telegraphy 32.275 Television and radio receivers, sound or video recording or reproducing apparatus and associated goods 32.376 Medical, precision and optical instruments, watches and clocks 33 3377 Motor vehicles, trailers and semi-trailers 34 3478 Building and repairing of ships and boats 35.179 Other transport equipment 35.2 + 35.4 + 35.580 Aircraft and spacecraft 35.381 Furniture 36.182 Jewellery and related articles; musical instruments 36.2 + 36.383 Sports goods, games and toys 36.4 + 36.584 Miscellaneous manufacturing not elsewhere classified; recycling 36.6 + 37
Electricity, gas 85 Production, transmission and distribution of electricity 40.1 and water supply 86 Gas; distribution of gaseous fuels through mains; steam and hot water supply 40.2 + 40.3
87 Collection, purification and distribution of water 41 41 Construction 88 Construction 45 45 F F 3 Wholesale 89 Sale, maintenance and repair of motor vehicles and motorcycles; retail sale of automotive fuel 50 50 and retail trade 90 Wholesale trade and commission trade, except of motor vehicles and motorcycles 51 51
91 Retail trade, except of motor vehicles and motorcycles; repair of personal and household goods 52 5292 Hotels and restaurants 55 55 H H
Transport and 93 Transport via railways 60.1 communication 94 Other land transport; transport via pipelines 60.2 + 60.3
95 Water transport 61 6196 Air transport 62 6297 Supporting and auxiliary transport activities; activities of travel agencies 63 6398 Post and courier activities 64.199 Telecommunications 64.2
Financial 100 Financial intermediation, except insurance and pension funding 65 65 intermediation 101 Insurance and pension funding, except compulsory social security 66 66
102 Activities auxiliary to financial intermediation 67 67103 Real estate activities with own property; letting of own property, except dwellings 70.1 + 70.2(pt)104 Letting of dwellings, including imputed rent 70.2 (pt)105 Real estate activities on a fee or contract basis 70.3106 Renting of machinery and equipment without operator and of personal and household goods 71 71107 Computer and related activities 72 72108 Research and development 73 73109 Legal activities 74.11110 Accounting, book-keeping and auditing activities; tax consultancy 74.12111 Market research and public opinion polling; business / management consultancy activities; management activities of holding companies 74.13 to 74.15112 Architectural and engineering activities and related technical consultancy; technical testing and analysis 74.2 + 74.3113 Advertising 74.4114 Other business services 74.5 to 74.8
Public administration 115 Public administration and defence; compulsory social security 75 75 L L Education, health 116 Education 80 80 M M and social work 117 Human health and veterinary activities 85.1 + 85.2
118 Social work activities 85.3 Other services 119 Sewage and refuse disposal, sanitation and similar activities 90 90
120 Activities of membership organisations not elsewhere classified 91 91121 Recreational, cultural and sporting activities 92 92122 Other service activities 93 93123 Private households employing staff and undifferentiated production activities of households for own use 95 to 97 95 to 97 P P
25
J J
5
6
85 N N
O O
70
K K
74
4 60
I I
64
40E
G G
DM 35
36 + 37 DN
29 DK
31
32
26 DI
27
DJ
28
DE
24
25 DH
A A
15DA
D
17DB
19 DC
21
Classification of Input-Output industry/product groups by Standard Industrial Classification (2003) and NACE Rev. 1.1
NACE Rev. 1.1 Industrial classifications
1
CAC
2
CB
DG
DL
E

26
Development, Compilation and Use of Input-Output Supply and Use Tables in the United Kingdom National Accounts
IIOA, Istanbul, Turkey, 02-06 July 2007
○ ○ ○ ○ ○ ○ ○ ○ ○ ○ ○ ○ ○ ○ ○ ○ ○ ○ ○ ○ ○ ○ ○ ○ ○ ○ ○ ○ ○ ○ ○ ○ ○ ○ ○ ○ ○ ○ ○ ○ ○ ○ ○ ○ ○ ○ ○ ○ ○ ○ ○ ○ ○ ○ ○ ○ ○ ○ ○ ○ ○ ○ ○
Annex BNotable changes within each annual current price Input-Output exercise since 1992Year Brief overview
1992 Year (t-3) compiled using 102 I-O groups on SIC (80) classification.First set of GVA estimates produced for 1989 using the Input-Output Annual Supply and Use Tables framework.GVA by industry estimates produced using the production approach differed from those produced using the income approach.
1993 1989 and 1990 compiled using 123 I-O groups on SIC (80) classification.GVA weights at factor cost for 1990 used for rebasing production measure of GDP by industry onto 1990=100.At the 11 industry level, GVA estimates from the production and income approaches were brought into line for the first time.Input-Output Annual Supply and Use Tables for 1989 and 1990 compiled with government treated as a producer, as opposed to a consumer, for the first time.
1994 Timetable for Input-Output Annual Supply and Use Tables compilation accelerated, and years (t-3) and (t-2) compiled simultaneously.
1995 1992 and 1993 compiled using 123 I-O groups on SIC (92) classification.1989 to 1991 converted from SIC (80) to SIC (92) using correlator derived from dual run of 1992 data.Input-Output Annual Supply and Use Tables completed to further reduced timetable.
1996 Complete reconciliation of estimates of GVA at factor cost derived from the production and income approaches at the 123-industry level for the first time.Inclusion of results from the new Overseas Trade In Services Inquiry.
1997 Input-Output Annual Supply and Use Tables completed to a further reduced timetable.Charts included in the I-O publication for the first time.
1998 Major revisions package (1986-96, 68 revisions implemented) balanced through the Input-Output Annual Supply and Use Tables framework using ONS inquiryresults based on the new IDBR for the first time.All I-O Annual Supply and Use Tables (1989-96) converted onto an ESA 95 basis.UK Production accounts by sector, for all sectors, produced for the first time.GVA weights at basic prices for 1995 used for rebasing the production measure of GDP onto 1995=100.
1999 Partly incorporated results from the new Annual Business Inquiry (ABI) including extension of ABI to cover oil and gas extraction industry.Input-Output Annual Supply and Use Tables completed to a further reduced timetable.
2000 Publication of annual current price quality and coherence adjustments underlying the balanced Input-Output Annual Supply and Use Tables for the first time.Inclusion of improved consumption of fixed capital estimates going back to 1948.
2001 Major revisions package (1986-97, 94 revisions implemented) balanced through the Input-Output Annual Supply and Use Tables framework incorporating thefull impact of the new ABI results, using dual run of 1997 data to provide link factors for back data.Estimates for smuggling activity included for the first time going back to 1994.Range of new analyses based on Input-Output Annual Supply and Use Tables produced for the first time, including ICT, Food sector, Creative sector,Import penetration, and Contribution of Top 5 businesses to each industry.
2002 Inclusion of ABI results covering forestry SIC (92) Class 02 and fishing SIC (92) Class 03 for the first time.Input-Output Annual Supply and Use Tables completed to a further reduced timetable.Web-only UK Input-Output Analyses publication, including further new analyses including Export of shares and Net trade in goods and services, all of which weremade available free of charge for the first time.Inclusion of new Expenditure and Food Survey results.Inclusion of government out-turn data on a Resource Accounting and Budgeting basis.Input-Output Analytical Tables for the year 1995 produced and published, also providing feedback structural mechanism for improvements to Input-OutputSupply and Use Tables.
2003 Inclusion of new ABI results covering parts of the agriculture industry (SIC (92) Class 014 and 015), and the annual all-industry purchases data.Move onto full HHFCe COICOP by I-O product analyses (from 1992).New International Trade In Services (ITIS) results going back to 1996.Inclusion of Missing Trader intra-community VAT fraud estimates for the first time going back to 1999.Inclusion of Subjective Analysis Return results to inform estimates of local government intermediate consumption by product (from 1996).GVA weights at basic prices for years up to and including 2000 used for chain-linking the production measure of GDP, where 2000=100.Further new analyses produced covering Taxes and subsidies, Oil and gas sector and Revisions.
27
Development, Compilation and Use of Input-Output Supply and Use Tables in the United Kingdom National Accounts
IIOA, Istanbul, Turkey, 02-06 July 2007
○ ○ ○ ○ ○ ○ ○ ○ ○ ○ ○ ○ ○ ○ ○ ○ ○ ○ ○ ○ ○ ○ ○ ○ ○ ○ ○ ○ ○ ○ ○ ○ ○ ○ ○ ○ ○ ○ ○ ○ ○ ○ ○ ○ ○ ○ ○ ○ ○ ○ ○ ○ ○ ○ ○ ○ ○ ○ ○ ○ ○ ○ ○
Annex B (continued)
Notable changes within each annual current price Input-Output exercise since 1992
Year Brief overview
2004 Reclassification of NHS Trusts from the public non-financial corporations sector to central government sector (from 1991).Review of public sector health industry estimates including range of reclassifications.Review of the allocation of the GFCF industry totals to I-O product groups from 1992 publishing at the NACE Rev. 1, A31 level and production of a newprocessing system.Review of effective VAT rates applied by I-O product linked to the detail Weighted Average Return analyses from the then HM Customs & Excise.Inclusion of estimates reflecting toll processing activity.GVA weights at basic prices for years up to and including 2001, used for chain-linking the production measure of GDP, where 2001=100.
2005 1992 to 2003 Input-Output Annual Supply and Use Tables compiled on SIC (2003) classification to a further reduced timetable.Further new analyses produced covering Market sector and non-market sector activity and Concentration ratios.Review of the allocation of government spending to COFOG functional categories and I-O products.Implementation of Atkinson Review related recommendations affecting education, health, social protection and fire protection, including the reclassificationsof Initial Teacher Training Agency; Nursery vouchers/grants; and City Academies and City Technology Colleges.Inclusion of changes from Pension Inquiry data review.Review of GFCF industry headings to I-O product groups from 1992 publishing at the NACE Rev. 1.1, A60 level for the first time.GVA weights at basic prices for years up to and including 2002, used for chain-linking the production measure of GDP, where 2002=100.
2006 Complement of staff in Input-Output team reduced by one from eleven to ten staff as part of ONS National Accounts efficiency savings exercise.Sizeable revisions package (1989-2002, 46 revisions implemented).Review of the allocation of the GFCF industry totals to I-O product groups from 1992.Review of the allocation of the changes in inventories industry totals to I-O product groups, holding gains, and production of a new processing system.Reclassification of BBC licence fee from a service payment to a tax on income, and reclassification of BBC and S4C non-trading bodies frompublic non-financial corporations sector to central government sector.Inclusion of improved estimates of consumption of fixed capital, going back to 1948.Inclusion of new Bank of England data on spread earnings and derivatives for banks, and data from new Bank of England profit/loss form.Correction of classification of data sources for passport fees.Various publication analyses enhanced and a range of new industry chronologies introduced for the first time.GVA weights at basic prices for years up to and including 2003, used for chain-linking the production measure of GDP, where 2003=100.
Letter ‘t’ represents the year of the publication of the Blue Book

28
Development, Compilation and Use of Input-Output Supply and Use Tables in the United Kingdom National Accounts
IIOA, Istanbul, Turkey, 02-06 July 2007
Title and Industrial Number of industriespublication details classification and products Valuation of tables1954Studies in Official Statistics: No. 8 Input-Output Tables SIC (48) 46 : Producers’ prices, with outputfor the United Kingdom 1954 (of which 2 services) and intermediate consumptionPublished by HMSO 1961, S.O. Code No. 63-166 shown net of intra-industry sales1963Studies in Official Statistics: No. 16 Input-Output Tables SIC (58) 73 : Producers’ pricesfor the United Kingdom 1963 (of which 8 services)Published by HMSO 1970, SBN 11 630077 91968Studies in Official Statistics: No. 22 Input-Output Tables SIC (68) 90 : Producers’ pricesfor the United Kingdom 1968 (of which 6 services)Published by HMSO 1973, SBN 11 630111 21970Business Monitor PA1004: SIC (68) 90 : Producers’ pricesInput-Output Tables for the United Kingdom 1970 (of which 6 services) Update of 1968 tablesPublished by HMSO 1974, ISBN 0 11 511356 81971Business Monitor PA1004: SIC (68) 60 : Producers’ pricesInput-Output Tables for the United Kingdom 1971 (of which 7 services) Update of 1968 tablesPublished by HMSO 1975, ISBN 0 11 511642 71972Business Monitor PA1004: SIC (68) 60 : Producers’ pricesInput-Output Tables for the United Kingdom 1972 (of which 7 services) Update of 1968 tablesPublished by HMSO 1975, ISBN 0 11 511778 41974Business Monitor PA1004 SIC (68) 103 : Producers’ pricesInput-Output Tables for the United Kingdom 1974 (of which 12 services) Update of 1968 tablesPublished by HMSO 1981, ISBN 0 11 512700 31979Business Monitor PA1004 SIC (80) 100 : Basic pricesInput-Output Tables for the United Kingdom 1979 (of which 13 services)Published by HMSO 1983, ISBN 0 11 513187 61984Input-Output Tables for the United Kingdom 1984 SIC (80) 102 : Basic pricesPublished by HMSO 1988, ISBN 0 11 620299 8 (of which 15 services)1990Input-Output Tables for the United Kingdom 10th Edition SIC (80) 123 : Basic prices(containing 1990 tables) (of which 33 services)Published by HMSO 1995, 0 11 620664 01995Analytical Input-Output Tables for the United Kingdom SIC (92) 123 : Basic prices(containing 1995 tables) (of which 35 services, plus 15Produced by Office for National Statistics (April 2002) non-market activity industriesWeb only - available from www.statistics.gov.uk/inputoutput shown separately).
Input-Output Analytical Tables have also been known as Input-Output Tables, Theoretical Tables, Symmetric Tables or Derived Tables.
○ ○ ○ ○ ○ ○ ○ ○ ○ ○ ○ ○ ○ ○ ○ ○ ○ ○ ○ ○ ○ ○ ○ ○ ○ ○ ○ ○ ○ ○ ○ ○ ○ ○ ○ ○ ○ ○ ○ ○ ○ ○ ○ ○ ○ ○ ○ ○ ○ ○ ○ ○ ○ ○ ○ ○ ○ ○ ○ ○ ○ ○ ○
Annex CChronology of UK Input-Output Analytical Tables