DEVELOPMENT CHARGES BACKGROUND STUDY City of Brampton
210
DEVELOPMENT CHARGES DEVELOPMENT CHARGES BACKGROUND STUDY BACKGROUND STUDY City of Brampton City of Brampton HEMSON C o n s u l t i n g L t d. May 28 th , 2014
Transcript of DEVELOPMENT CHARGES BACKGROUND STUDY City of Brampton

DEVELOPMENT CHARGES DEVELOPMENT CHARGES BACKGROUND STUDYBACKGROUND STUDY
City of BramptonCity of Brampton
HEMSON C o n s u l t i n g L t d.
May 28th , 2014

TABLE OF CONTENTS
EXECUTIVE SUMMARY .................................................................................................1
I INTRODUCTION ...............................................................................................13
II THE METHODOLOGY USES A CITY-WIDE APPROACH TO ALIGN DEVELOPMENT-RELATED COSTS AND BENEFITS.............................................15
A. A CITY-WIDE DEVELOPMENT CHARGE IS PROPOSED ............................15 B. KEY STEPS IN DETERMINING DEVELOPMENT CHARGES FOR
FUTURE DEVELOPMENT-RELATED PROJECTS .........................................16
III POPULATION IS FORECAST TO INCREASE BY 144,100 AND NON- RESIDENTIAL BUILDING SPACE BY 4.9MILLION SQUARE METRES BY 2023 ...................................................................................................................20
A. BRAMPTON HAS EXPERIENCED RAPID GROWTH IN RECENT YEARS ........................................................................................................20
B. THE RESIDENTIAL FORECAST IS BASED ON THE FORECASTS ENDORSED BY CITY COUNCIL IN APRIL 2014 ........................................21
C. NON-RESIDENTIAL SPACE FORECAST IS BASED ON FORECAST EMPLOYMENT GROWTH .........................................................................22
IV SUMMARY OF HISTORIC CAPITAL SERVICE LEVELS ........................................24
V THE DEVELOPMENT-RELATED CAPITAL FORECAST .........................................26
A. A DEVELOPMENT-RELATED CAPITAL FORECAST IS PROVIDED FOR COUNCIL’S APPROVAL ....................................................................26
B. THE DEVELOPMENT-RELATED CAPITAL FORECAST FOR CITY- WIDE SERVICES .........................................................................................27
VI PROPOSED DEVELOPMENT CHARGES ARE CALCULATED IN ACCORDANCE WITH THE DCA ........................................................................31
A. UNADJUSTED DEVELOPMENT CHARGE CALCULATION FOR CITY-WIDE SERVICES ................................................................................31
VII COMPARISON OF CALCULATED AND CURRENT DEVELOPMENT CHARGES ...........................................................................................................40
VIII LONG-TERM CAPITAL AND OPERATING COSTS .............................................44
A. NET OPERATING COSTS FOR THE CITY’S SERVICES ESTIMATED TO INCREASE BY $56.17 MILLION OVER 10 YEARS ................................44
B. LONG-TERM CAPITAL FINANCING FROM NON-DEVELOPMENT CHARGE SOURCES FOR GENERAL SERVICES TOTALS $393.43 MILLION....................................................................................................44
HEMSON
C. LONG-TERM CAPITAL FINANCING FROM NON-DEVELOPMENT CHARGE SOURCES FOR ENGINEERED SERVICES TOTALS $76.25 MILLION TO 2041 .....................................................................................45
IX DEVELOPMENT CHARGES ADMINISTRATION .................................................48
APPENDIX A: DEVELOPMENT FORECAST ..................................................................50
APPENDIX B: GENERAL SERVICES TECHNICAL APPENDICES INTRODUCTION AND OVERVIEW............................................................................65
APPENDIX B.1: GENERAL GOVERNMENT.........................................................71
APPENDIX B.2: LIBRARY SERVICES ...................................................................81
APPENDIX B.3: FIRE SERVICES...........................................................................89
APPENDIX B.4: RECREATION SERVICES............................................................99
APPENDIX B.5: PUBLIC WORKS: BUILDINGS AND FLEET .............................147
APPENDIX B.6: PARKING ................................................................................158
APPENDIX B.7: TRANSIT..................................................................................167
APPENDIX C: ROADS ...............................................................................................182
APPENDIX D: DEVELOPMENT CHARGES RESERVE FUNDS .....................................200
APPENDIX E: LONG-TERM CAPITAL AND OPERATING IMPACTS ..........................204
HEMSON
EXECUTIVE SUMMARY
The following summarizes the findings of the 2014 Development Charges Background Study.
A. STUDY CONSISTENT WITH DEVELOPMENT CHARGES LEGISLATION
This study calculates development charges for the City of Brampton in compliance with the provisions of the Development Charges Act, 1997 (DCA) and its associated regulation (Ontario Regulation 82/98).
The City of Brampton’s existing development charges by-laws, as noted below, expire on August 5, 2014 and Council must pass new development charges by-laws before the expiry date in order to continue to levy development charges. The by-laws are:
#222—2009: General Government #223—2009: Recreation Services #224—2009: Fire Services #225—2009: Library Services #226—2009: Transit Services #227—2009: Road Services #228—2009: Bramwest Parkway/North-South Transportation Corridor
The City needs to continue implementing development charges to fund capital
projects related to development throughout Brampton so that new development pays for its capital requirements to the extent allowed by the DCA and so that new services required by growth are provided in a fiscally responsible manner.
The DCA and O. Reg. 82/98 require that a development charges background study be prepared in which development charges are determined with reference to:
a forecast of the amount, type and location of housing units, population and non-residential development anticipated in the City;
HEMSONHEMSON
1

a review of future capital projects, including an analysis of gross expenditures, funding sources, and net expenditures incurred or to be incurred by the City to provide for the expected development, including the determination of the development and non-development-related components of the capital projects; and
an examination of the long-term capital and operating costs for the capital infrastructure required for each service to which the development charges by-laws would relate.
This report identifies the development-related net capital costs which are attributable to development that is forecast to occur in the City. These costs are apportioned to types of development (residential, non-residential) in a manner that reflects the increase in the need for each service attributable to each type of development.
B. ALL SERVICES WITH DEVELOPMENT-RELATED COSTS INCLUDED IN THE ANALYSIS
The following City services have been included in the development charge analysis:
General Government Library Services Fire Services Recreation Services Public Works: Buildings & Fleet Parking Transit Roads Bramwest Parkway/North-South Transportation Corridor
C. APPROACH USED TO CALCULATE DEVELOPMENT CHARGES
A City-wide average cost approach is used to calculate development charges for all services. This approach results in uniform charges throughout the City.
HEMSONHEMSON
2
D. THE CITY OF BRAMPTON IS ANTICIPATED TO GROW BY 144,100 PEOPLE AND 65,910 EMPLOYEES OVER 10 YEARS
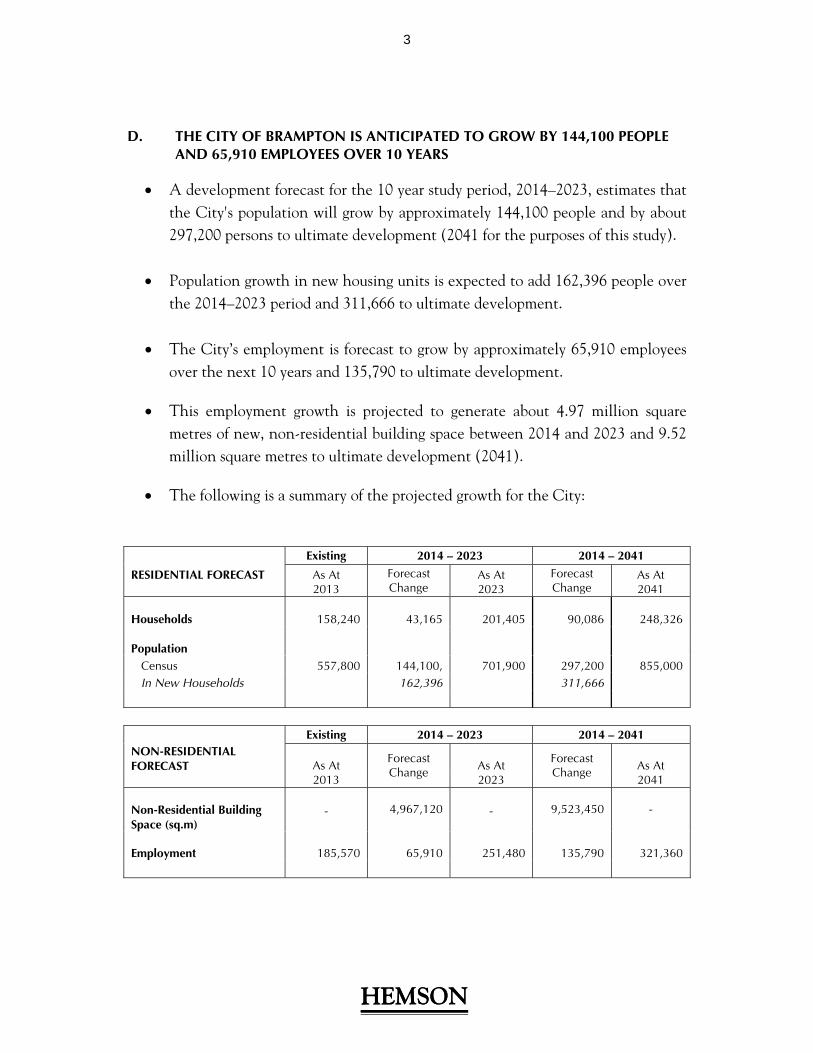
A development forecast for the 10 year study period, 2014–2023, estimates that the City's population will grow by approximately 144,100 people and by about 297,200 persons to ultimate development (2041 for the purposes of this study).
Population growth in new housing units is expected to add 162,396 people over the 2014–2023 period and 311,666 to ultimate development.
The City’s employment is forecast to grow by approximately 65,910 employees
over the next 10 years and 135,790 to ultimate development.
This employment growth is projected to generate about 4.97 million square metres of new, non-residential building space between 2014 and 2023 and 9.52 million square metres to ultimate development (2041).
The following is a summary of the projected growth for the City:
Existing 2014 – 2023 2014 – 2041
RESIDENTIAL FORECAST As At Forecast Change
As At 2023
Forecast Change
As At 2041 2013
Households
158,240
43,165
201,405
90,086
248,326
Population Census 557,800 144,100, 701,900 297,200 855,000 In New Households 162,396 311,666
Existing 2014 – 2023 2014 – 2041 NON-RESIDENTIAL FORECAST As At
2013
Forecast Change As At
2023
Forecast Change As At
2041 Non-Residential Building Space (sq.m)
-
4,967,120 -
9,523,450
-
Employment
185,570
65,910
251,480
135,790 321,360
HEMSONHEMSON
3

E. FUNDING ENVELOPE BASED ON “NET” GROWTH
In accordance with the DCA, development charges have been calculated at a level no higher than the average service level provided in the City over the ten-year period immediately preceding the preparation of the background study, on a service by service basis.
The maximum permissible funding envelopes in this study are based on “net” population, employment and household growth.
F. THE DEVELOPMENT CHARGES STUDY INCLUDES A $1.06 BILLION DEVELOPMENT-RELATED CAPITAL PROGRAM FOR GENERAL SERVICES OVER THE NEXT 10 YEARS AND A $1.44 BILLION PROGRAM FOR ENGINEERED SERVICES TO ULTIMATE DEVELOPMENT
The 2014–2023 development-related capital programs for general services including General Government, Library Services, Fire Services, Recreation Services, Public Works: Building & Fleet, Parking and Transit totaling $1.06 billion.
The engineered services capital program, including City-wide road works and
Bramwest/NSTC infrastructure totals an additional $1.44 billion. This amount is estimated to provide for development-related infrastructure required to 2041 and beyond.
The DCA requires that development-related net capital costs for general
services be reduced by grants, subsidies, and recoveries from other governments; capital replacements or other benefits provided to the existing community; existing reserve fund balances; amounts that exceed historic service levels; and a statutory 10 per cent reduction for eligible soft (or general) services, when calculating development charges.
After these deductions, the costs eligible for recovery through development
charges for the general services capital program is reduced to $510.03 million, and the engineered services development-related capital program decreases to $1.37 billion. These amounts are eligible for recovery through development charges.
The following is a summary of the development-related capital program.
HEMSON
4

General Services
Gross Cost ($000)
DC Eligible Cost For Recovery ($000)
General Government $16,599.6 $10,666.6
Library Services $70,887.0 $21,951.3
Fire Services $82,519.5 $29,122.2
Recreations Services $425,410.7 $346,201.6
Public Works: Buildings and Fleet $113,459.2 $29,393.0
Parking $23,550.2 $0.0
Transit $330,818.6 $72,698.8
Total – 10-Year General Services $1,063,244.8 $510,033.7
Engineered Services
Gross Cost* ($000)
DC Eligible Cost For Recovery ($000)
Roads - Excluding Bramwest NSTC $1,378,793.0 $1,313,834.4
Roads - Bramwest NSTC $63,287.8 $51,991.9
Total – Engineered Services to 2041 (Roads) $1,442,080.8 $1,365,826.3
* net of grants, subsidies and other recoveries
HEMSON
5
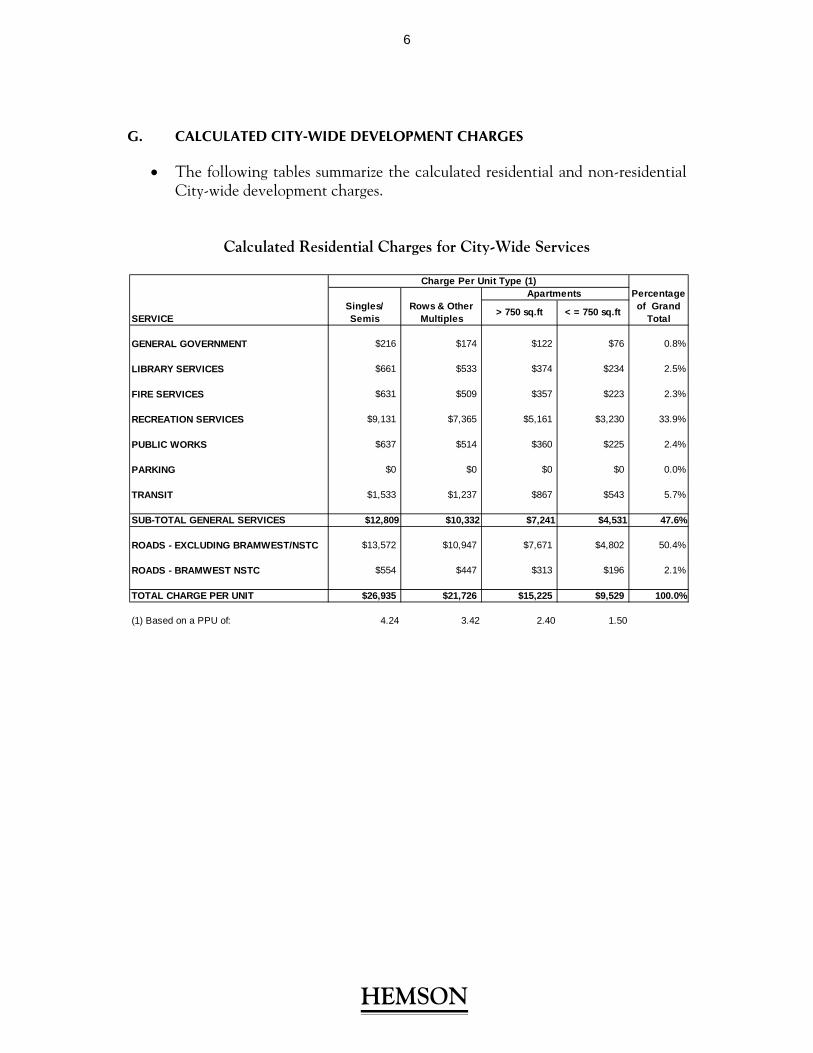
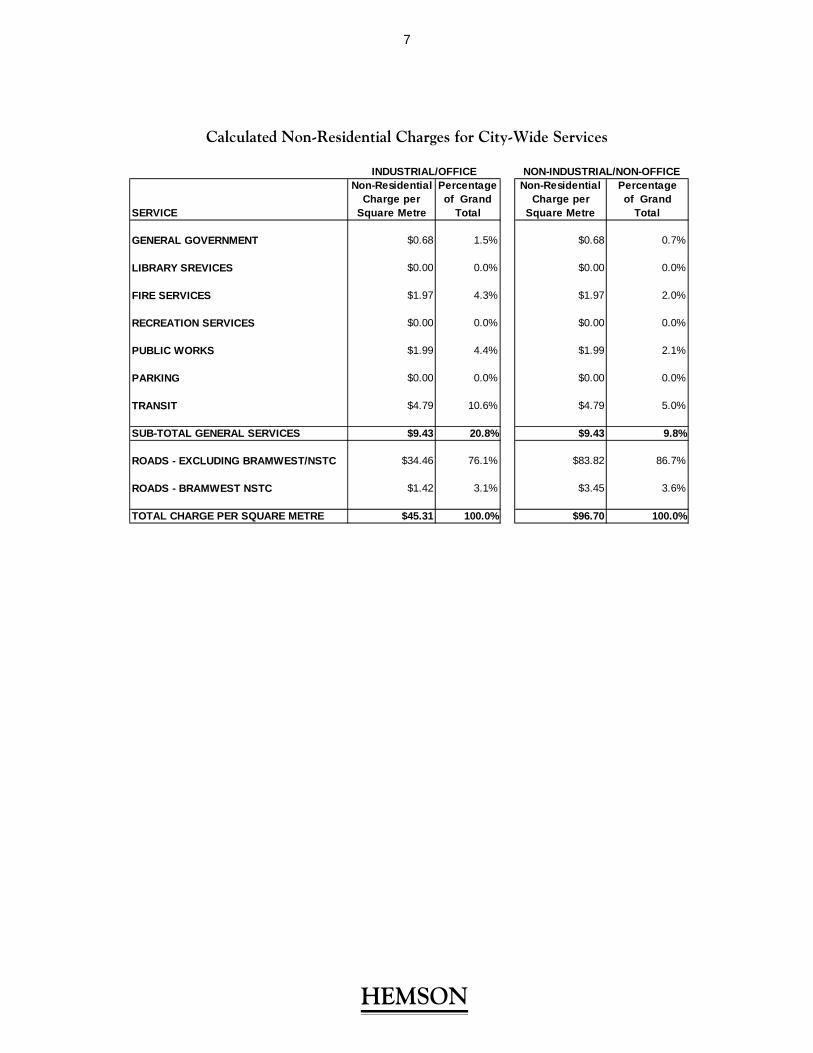
G. CALCULATED CITY-WIDE DEVELOPMENT CHARGES
The following tables summarize the calculated residential and non-residential City-wide development charges.
Calculated Residential Charges for City-Wide Services
PercentageSingles/ Rows & Other of Grand
SERVICE Semis Multiples Total
GENERAL GOVERNMENT $216 $174 $122 $76 0.8%
LIBRARY SERVICES $661 $533 $374 $234 2.5%
FIRE SERVICES $631 $509 $357 $223 2.3%
RECREATION SERVICES $9,131 $7,365 $5,161 $3,230 33.9%
PUBLIC WORKS $637 $514 $360 $225 2.4%
PARKING $0 $0 $0 $0 0.0%
TRANSIT $1,533 $1,237 $867 $543 5.7%
SUB-TOTAL GENERAL SERVICES $12,809 $10,332 $7,241 $4,531 47.6%
ROADS - EXCLUDING BRAMWEST/NSTC $13,572 $10,947 $7,671 $4,802 50.4%
ROADS - BRAMWEST NSTC $554 $447 $313 $196 2.1%
TOTAL CHARGE PER UNIT $26,935 $21,726 $15,225 $9,529 100.0%
(1) Based on a PPU of: 4.24 3.42 2.40 1.50
> 750 sq.ft < = 750 sq.ft
Charge Per Unit Type (1)Apartments
HEMSON
6
Calculated Non-Residential Charges for City-Wide Services
Non-Residential Percentage Non-Residential PercentageCharge per of Grand Charge per of Grand
SERVICE Square Metre Total Square Metre Total
GENERAL GOVERNMENT $0.68 1.5% $0.68 0.7%
LIBRARY SREVICES $0.00 0.0% $0.00 0.0%
FIRE SERVICES $1.97 4.3% $1.97 2.0%
RECREATION SERVICES $0.00 0.0% $0.00 0.0%
PUBLIC WORKS $1.99 4.4% $1.99 2.1%
PARKING $0.00 0.0% $0.00 0.0%
TRANSIT $4.79 10.6% $4.79 5.0%
SUB-TOTAL GENERAL SERVICES $9.43 20.8% $9.43 9.8%
ROADS - EXCLUDING BRAMWEST/NSTC $34.46 76.1% $83.82 86.7%
ROADS - BRAMWEST NSTC $1.42 3.1% $3.45 3.6%
TOTAL CHARGE PER SQUARE METRE $45.31 100.0% $96.70 100.0%
NON-INDUSTRIAL/NON-OFFICEINDUSTRIAL/OFFICE
HEMSON
7

As illustrated in the next table, the calculated residential charge is 5.3 per cent higher than the present charge for single and semi-detached units.
Comparison of Single/Semi Detached Unit Residential Charges
The general services portion of the charge increases by $1,098, or 9.4 per cent, over present rates. The increase reflects land and construction cost increases in excess of the legislated indexing rate.
The Roads (excluding Bramwest/NSTC) charge is calculated to increase by 2.1 per cent ($281); reflecting cost increases being experienced for roads and related projects. The Bramwest NSTC roads charge is calculated to decrease by 5.1 per cent ($30).
The calculated non-residential development charge for industrial and major
office development is approximately 7.9 per cent lower than the City’s current
SERVICE $ %
GENERAL GOVERNMENT $47 $216 $169 362.6%
LIBRARY SERVICES $716 $661 ($55) -7.7%
FIRE SERVICES $485 $631 $146 30.2%
RECREATION SERVICES $8,261 $9,131 $870 10.5%
PUBLIC WORKS $552 $637 $85 15.4%
PARKING $343 $0 ($343) -100.0%
TRANSIT $1,307 $1,533 $226 17.3%
SUB-TOTAL GENERAL SERVICES $11,711 $12,809 $1,098 9.4%
ROADS - EXCLUDING BRAMWEST/NSTC $13,291 $13,572 $281 2.1%
ROADS - BRAMWEST NSTC $584 $554 ($30) -5.1%
TOTAL CHARGE PER UNIT $25,586 $26,935 $1,349 5.3%
$/Unit
Calculated Charge per
Single/Semi
Current Charge per
Single/Semi
Difference in Calculated &
Current Charge
HEMSON
8

charge. This is primarily due to an increase in the floor space per worker assumption when compared to the 2009 development charges study.
Comparison of Industrial/Office Non-Residential Charge
The calculated non-residential development charge for non-industrial and non- office development (i.e. retail and institutional) is approximately 6.7 per cent lower than the City’s current charge.
SERVICE $ %
GENERAL GOVERNMENT $0.15 $0.68 $0.53 343.7%
LIBRARY SERVICES $0.00 $0.00 - -
FIRE SERVICES $1.61 $1.97 $0.36 22.4%
RECREATION SERVICES $0.00 $0.00 - -
PUBLIC WORKS $1.84 $1.99 $0.15 8.2%
PARKING $1.14 $0.00 ($1.14) -100.0%
TRANSIT $4.34 $4.79 $0.45 10.4%
SUB-TOTAL GENERAL SERVICES $9.08 $9.43 $0.35 3.8%
ROADS - EXCLUDING BRAMWEST/NSTC $38.47 $34.46 ($4.01) -10.4%
ROADS - BRAMWEST NSTC $1.66 $1.42 ($0.24) -14.3%
TOTAL CHARGE PER SQUARE METRE $49.21 $45.31 ($3.90) -7.9%
$/sq. m
Current Industrial and Office Charge
Difference in Calculated &
Current Charge
Calculated Industrial and Office Charge
HEMSON
9

Comparison of Other Non-Residential Charge
H. A PORTION OF DEVELOPMENT-RELATED COSTS REQUIRE FUNDING FROM NON-DEVELOPMENT CHARGE SOURCES
The Development Charges Act, 1997 requires that the development-related net capital costs for “soft” services be reduced by 10 per cent in calculating the applicable development charge for these services. The 10 per cent share of development-related net capital costs not included in the development charge calculation must be funded from non-development charge sources.
In total, about $63.80 million is identified to provide for the required 10 per cent reduction.
Non-development charge funding for replacement portions of the capital forecast (e.g. Station #201 and #203) and other benefits to the existing community (e.g. library collection materials) will total an additional $83.96 million.
SERVICE $ %
GENERAL GOVERNMENT $0.18 $0.68 $0.50 287.2%
LIBRARY SERVICES $0.00 $0.00 - -
FIRE SERVICES $1.84 $1.97 $0.13 6.8%
RECREATION SERVICES $0.00 $0.00 - -
PUBLIC WORKS $2.11 $1.99 ($0.12) -5.6%
PARKING $1.31 $0.00 ($1.31) -100.0%
TRANSIT $4.97 $4.79 ($0.18) -3.7%
SUB-TOTAL GENERAL SERVICES $10.41 $9.43 ($0.98) -9.4%
ROADS - EXCLUDING BRAMWEST/NSTC $88.74 $83.82 ($4.92) -5.5%
ROADS - BRAMWEST NSTC $4.51 $3.45 ($1.06) -23.5%
TOTAL CHARGE PER SQUARE METRE $103.66 $96.70 ($6.96) -6.7%
$/sq. m
Calculated Non-Industrial and
Non-Office Charge
Current Non-Industrial and
Non-Office Charge
Difference in Calculated &
Current Charge
HEMSON
10

community (e.g. library collection materials) will total an additional $83.96 million.
In summary, tax-supported funding of $147.76 million will be required over the 2014–2023 periods to support the development-related capital program.
It is estimated that net operating costs will increase by about $56.17 million by the year 2023 as the facilities and infrastructure embodied in the capital forecast come on stream and are operated and maintained.
I. NO SIGNIFICANT CHANGES ARE RECOMMENDED REGARDING COLLECTION OR BY-LAW ADMINISTRATION
It is recommended that practices regarding collection of development charges
and by-law administration continue to the extent possible. It is further recommended that the collection and administration policies be as
consistent as practicable with those of the Regional Municipality of Peel in order to simplify by-law administration and aid understanding for those required to pay the charges.
It is recommended that the by-law permit the payment of a development
charge in cash or through services in lieu agreements. The municipality is not obligated to enter into services in lieu agreements.
As required under the DCA, the City should codify any rules regarding application of the by-laws and exemptions within the development charges by-laws proposed for adoption.
It is recommended that no exemptions, other than those required in the
Development Charges Act, 1997, be formally adopted in the by-laws.
The current non-statutory discount for industrial development is proposed to be eliminated since the calculated rate is lower than the City’s current discounted rate.
HEMSONHEMSON
11

City Staff have proposed that exemptions on portions of ‘places of worship’ and ‘full service hotels’ be maintained.
City Staff have proposed a change in by-law wording that would waive development charges on the work portion of ‘live-work’ units
It is recommended that the City continue to pursue cost-sharing and uploading with the Regional Municipality of Peel for road-related infrastructure that meets the criteria of Regional significance.
It is proposed that conservation authorities be removed from the definition of a ‘local board’
It is recommended that Council adopt a set of Local Service Guidelines that will be presented through a Corporate Report.
It is recommended that Council adopt the development-related capital forecast
included in this background study, subject to annual review through the City’s normal capital budget process.
HEMSONHEMSON
12

I INTRODUCTION
This City of Brampton Development Charges Background Study is presented as part of a process to lead to the approval of new development charge by-laws in compliance with the Development Charges Act, 1997 (DCA).
The DCA and Ontario Regulation 82/98 (O. Reg. 82/98) require that a development charges background study be prepared in which development charges are determined with reference to:
A forecast of the amount, type and location of housing units, population and non-residential development anticipated in the City;
The average capital service levels provided in the City over the 10 year period immediately preceding the preparation of the background study;
A review of capital works in progress and anticipated future capital projects, including an analysis of gross expenditures, funding sources, and net expenditures incurred or to be incurred by the City or its local boards to provide for the expected development, including the determination of the growth and non-development-related components of the capital projects; and
An examination of the long term capital and operating costs for the capital infrastructure required for each service to which the development charges by-laws would relate.
This study presents the results of the review which determines the development-related net capital costs which are attributable to new development that is forecast to occur in the City of Brampton. These development-related net capital costs are then apportioned among various types of development (residential; non-residential) in a manner that reflects the increase in the need for each service attributable to each type of development. The study arrives, therefore, at proposed development charges for various types of development.
The DCA provides for a period of public review and comment regarding the proposed development charges. Following completion of this process, in accordance with the DCA and Council’s review of this study and the comments it receives regarding this study or other information brought to its attention about the proposed charges, it is intended that Council will pass new development charges for the City.
HEMSONHEMSON
13

The remainder of this study sets out the information and analysis upon which the proposed development charges are based.
Section II designates the services for which the development charges are proposed and the areas within the City to which the development charges will apply. It also briefly reviews the methodology that has been used in this background study.
Section III presents a summary of the forecast residential and non-residential development which is expected to occur within the City over the 2014–2023 period and to 2041 (ultimate development).
Section IV summarizes the historic 10 year average capital service levels that have been attained in the City which form the basis for the development charge calculations.
Section V, summarizes the development-related capital forecast that has been developed by various City departments and boards is reviewed.
Section VI summarizes the calculation of applicable development charges and the resulting calculated development charges by class and type of development.
Section VII provides a comparison of existing development charge rates in the City with the rates calculated in this study.
Section VIII provides an examination of the long term capital and operating costs for each service included in the development charge calculation.
Section IX provides a review of development charges administrative matters such as collection method and timing of payments, exemptions, credits for services-in-lieu, front-end financing, etc.
HEMSONHEMSON
14

II THE METHODOLOGY USES A CITY-WIDE APPROACH TO ALIGN DEVELOPMENT-RELATED COSTS AND BENEFITS
Several key steps are required in calculating any development charge. However, specific circumstances arise in each municipality which must be reflected in the calculation. This study, has therefore, been tailored for the City of Brampton’s unique circumstances. The approach to the proposed development charges is focussed on providing a reasonable alignment of development-related costs with the development that necessitates them.
A. A CITY-WIDE DEVELOPMENT CHARGE IS PROPOSED
The City provides a wide range of services to the community it serves and has an extensive inventory of facilities, land, infrastructure, vehicles and equipment. The DCA provides municipalities with flexibility to define services that will be included in the development charge by-laws, provided that the other provisions of the Act and its associated regulations are met. The DCA also requires that the by-laws designate the areas within which the by-laws shall be imposed. The development charges may apply to all lands in the municipality or to other designated development areas as specified in the by-laws.
1. Services Based on a City-Wide Approach
For the majority of services that the City provides, a range of capital facilities, land, equipment and infrastructure is available throughout the City; arenas, community centres, pools, libraries, fire stations, arterial roads, transit, parks and so on. As new development occurs, new facilities will need to be added so that service levels in newly developing areas are provided at levels enjoyed in existing communities. A widely accepted method for sharing the development-related capital costs for such City services is to apportion them over all new development anticipated in the City.
HEMSONHEMSON
15

The following services are included in the City-wide development charge calculation:
General Government; Library Services; Fire Services; Recreation Services Public Works Building & Fleet; Parking; Transit; Roads; and Bramwest Parkway/North-South Transportation Corridor
These services form a reasonable basis on which to plan and administer the development charges. It is noted that the analysis of each of these services examines the individual capital facilities and equipment that make them up. For example, Recreation Services includes various indoor facilities such as community centres, pools, arenas; associated land requirements as allowed under the DCA; and equipment.
The resulting development charge for these services would be imposed against all development anywhere in the City.
B. KEY STEPS IN DETERMINING DEVELOPMENT CHARGES FOR FUTURE DEVELOPMENT-RELATED PROJECTS
Several key steps are required in calculating development charges for future development-related projects. These are summarized below.
1. Development Forecast
The first step in the methodology requires a development forecast to be prepared for the 10 year study period, 2014–2023, for most City-wide services and for growth to ultimate development (2041) for roads services. The forecast of the future residential and non-residential development used in this study is based on development anticipated to occur within approved Official Plan designated urban areas. The forecast reflects Growth Plan targets, 2011 Census data and recent development activity.
For the residential portion of the forecast the net (or Census) population growth and population growth in new units is estimated. Net population growth equals the population in new housing units reduced by the decline in the population in the existing base anticipated over the 10 year period and to build-out (due to reducing household sizes as the community ages). Net population is used in the calculation of
HEMSONHEMSON
16

the development charges funding envelopes. In calculating the per capita development charge, however, the population growth in new housing units is used.
The non-residential portion of the forecast estimates the Gross Floor Area (GFA) of building space to be developed over the 10 year period, 2014–2023, and to 2041. The forecast provides estimates for three categories: population-related development, major office development, and employment land development. The forecast of GFA is based on the employment forecast for the City. Factors for floor space per worker by category are used to convert the employment forecast into gross floor areas for the purposes of the development charges study.
2. Service Categories and Historic Service Levels
The Development Charges Act provides that the increase in the need for service attributable to anticipated development:
... must not include an increase that would result in the level of service exceeding the average level of that service provided in the municipality over the 10-year period immediately preceding the preparation of the background study...(s. 5. (1) 4.)
Historic 10 year average service levels thus form the basis for development charges. A review of City’s capital service levels for buildings, land, vehicles, and so on, has therefore been prepared as a reference for the calculation, so that the portion of future capital projects that may be included in the development charge can be determined. The historic service levels used in this study have been calculated based on the period 2004–2013.
3. Development-Related Capital Forecast and Analysis of Net Capital Costs to be Included in the Development Charges
A development-related capital forecast has been prepared by the City’s departments and boards as part of the present study. The forecast identifies development-related projects and their gross and net costs, after allowing for capital grants, subsidies or other contributions as required by the Act (DCA, s. 5. (2)). In some cases, the capital costs identified in these forecasts represents supplementary funding requirements for projects which have had partial funding, already approved in previous years, under previously approved Capital Budgets. As such, the summary of funding attributed to some projects, may appear, low. The capital forecast provides another cornerstone upon which development charges are based. The DCA requires that the increase in the need for service attributable to the anticipated development may include an increase:
HEMSONHEMSON
17

... only if the council of the municipality has indicated that it intends to ensure that such an increase in need will be met. (s. 5. (1) 3.)
In conjunction with DCA, s. 5. (1) 4. referenced above, these sections have the effect of requiring that the development charge be calculated on the lesser of the historic 10 year average service levels or the service levels embodied in future plans of the City. The development-related capital forecast prepared for this study ensures that development charges are only imposed to help pay for projects that have been or are intended to be purchased or built in order to accommodate future anticipated development. It is not sufficient in the calculation of development charges merely to have had the service in the past. There must also be a demonstrated commitment to continue to emplace facilities or infrastructure in the future. In this regard, Ontario Regulation 82/98, s. 3 states that:
For the purposes of paragraph 3 of subsection 5 (1) of the Act, the council of a municipality has indicated that it intends to ensure that an increase in the need for service will be met if the increase in service forms part of an Official Plan, capital forecast or similar expression of the intention of the council and the plan, forecast or similar expression of the intention of the council has been approved by the council.
For some projects in the development-related capital forecast, a portion of the project may confer benefits to existing residents. As required by the DCA, s. 5. (1) 6., these portions of projects and their associated net costs are the funding responsibility of the City from non-development charges sources. The amount of City funding for such non-growth shares of projects is also identified as part of the preparation of the development-related capital forecast.
There is also a requirement in the DCA to reduce the applicable development charge by the amount of any “uncommitted excess capacity” that is available for a service. Such capacity is available to partially meet the future servicing requirements. Adjustments are made in the analysis to meet this requirement of the Act.
Finally, in calculating development charges, the development-related net capital costs must be reduced by 10 per cent for all services except services related to a highway and fire (DCA, s. 5. (1) 8.). The 10 per cent discount is applied to the other services, e.g. recreation, libraries, parking, transit and the resulting City funding responsibility from non-development charge sources is identified.
4. Attribution to Types of Development
The next step in the determination of development charges is the allocation of the development-related net capital costs between the residential and the non-residential sectors. This is done by using different apportionments for different services in
HEMSONHEMSON
18

accordance with the demands which the two sectors would be expected to place on the various services and the different benefits derived from those services.
Where reasonable data exist, the apportionment is based on the expected demand for, and use of, the service by each sector (e.g. shares of population and employment).
Finally, the residential component of the City-wide development charge is applied to different housing types on the basis of average occupancy factors. The non-residential component is applied on the basis of gross building space in square metres.
5. Final Adjustment
The final determination of the development charge results from adjustments made to development-related net capital costs for each service and sector resulting from the application of any unallocated reserve fund balances that are available to finance the development-related capital costs in the capital forecast. A cash flow analysis is also undertaken to account for the timing of projects and receipt of development charges. Interest earnings or borrowing costs are therefore accounted for in the calculation as allowed under the DCA.
HEMSONHEMSON
19

III POPULATION IS FORECAST TO INCREASE BY 144,100 AND NON-RESIDENTIAL BUILDING SPACE BY 4.9MILLION SQUARE METRES BY 2023
This section provides the basis for the development forecasts used in calculating the development charges and provides a summary of the forecast results. The development forecast in the development charges background study is based on estimates of growth occurring within approved Official Plan designated urban areas. This forecast is consistent with the population and employment forecasts endorsed by City Council in April 2014 for use in completing the City’s 2014 Development Charges By-law update.
This section begins with a brief discussion of recent growth trends in the GTA and in Brampton. This is followed by a summary of the results of the housing unit and population forecast and of the non-residential employment and space forecast. Details of the forecasts are provided in Appendix A.
A. BRAMPTON HAS EXPERIENCED RAPID GROWTH IN RECENT YEARS
During the 10-year period from 2004 to 2013 the City of Brampton experienced rapid population and employment growth. This growth was fuelled by a strong GTA economy and continued migration into the metropolitan region. Moving forward, Brampton is expected to continue to experience rapid housing growth until its greenfield housing capacity becomes largely exhausted, at some point during the 2030s. However, the rate of growth is expected to slow from the levels experienced over the past 10 years.
Brampton’s population and housing growth has well exceeded the GTA average in recent years. Between the 2001 and 2011 Census, the population of the GTA grew by 972,200 people or 19 per cent. During this same period the City of Brampton’s population grew by approximately 61 per cent per cent to a 2011 Census value of 523,900.
The number of housing units in Brampton has grown at a lower rate than population; likely as a result of the increase in the average number of persons residing in dwelling units. In contrast to other parts of the GTA, average household sizes in Brampton
HEMSONHEMSON
20

have grown over the course of the last decade, from an average household size of 3.4 in 2004 to 3.53 in 2013. For example, the population in new dwelling unit assumption for single and semi detached units has been increased from 4.0 in the 2009 Development Charges Study to 4.24 in this Study.
The City of Brampton has experienced stable employment growth over the past decade. In early years the City’s employment growth rate slowed from 3.1 per cent per year from 2004 to 2006 to 2 per cent from 2007 to 2011. In recent years, however, the growth rate has rebounded to approximately 3.8 per cent in 2012 and 2013.
B. THE RESIDENTIAL FORECAST IS BASED ON THE FORECASTS ENDORSED BY CITY COUNCIL IN APRIL 2014
The residential development forecast is based on development that is expected in designated urban areas of Brampton’s Official Plan. A description of the forecast methodology and more detailed tables of results are provided in Appendix A.
Table 1 provides a summary of the residential forecast for two planning periods: a 10 year planning period, 2014–2023, and 2024–2041 development. As noted in Section II, for development charges calculation purposes, the 10 year planning period is applicable to non-engineering services. The ultimate development forecast has been utilized in the calculation of the Roads & Related component of development charges.
Table 1 Summary of Residential Development Charges Forecast
The City’s Census population is expected to increase by about 144,100 people over the next 10 years reaching about 701,900 by 2023. The ultimate population is forecast to reach about 855,000 persons.
Existing 2014-2023 2014-2041RESIDENTIAL FORECAST As At Forecast As at Forecast As at
Mid-Year 2013 Change Mid Year-2023 Change Mid-Year 2041
Households 158,240 43,165 201,405 90,086 248,326
PopulationCensus 557,800 144,100 701,900 297,200 855,000 With Undercoverage 580,691 149,909 730,600 309,409 890,100
In New Households 162,396 311,666 % higher than "net" population 13% 5%
HEMSONHEMSON
21

The population figures referred to above reflect the “net” increase in population. This is the increase after taking into account the expected continuation of the decline in occupancy factors in existing housing units. The population residing in new housing units is expected to increase by 162,396 people over the 10-year planning period and 311,666 people to ultimate development.
About 43,200 housing units are forecast to be developed between 2014 and 2023. Over the long-term to 2041, about 90,100 additional housing units are forecast to be developed. Over this time period, the composition of the new units is forecast to be 54 per cent singles/semis, 20 per cent rows and other multiples, and 26 per cent apartments.
C. NON-RESIDENTIAL SPACE FORECAST IS BASED ON FORECAST EMPLOYMENT GROWTH
The non-residential space forecast is based on the forecast of employment, since most new non-residential space is required to accommodate new employment growth.
Non-residential space is forecast according to three categories: population related ‘employment’, ‘major office employment’, and ‘employment land employment’. Population related employment includes traditional retail forms, such as regional centres, district centres, neighbourhood convenience, highway commercial, big box and power centres occupied by retail and local service uses. Population related employment also includes institutional space consisting of all community institutional uses such as schools, places of worship and hospitals. Major office employment is defined as that working in free-standing office buildings of 20,000 square feet or greater. Employment land employment consists of buildings in Brampton’s “industrial” areas and may include some non-traditional retail space and office space associated with industrial or storage uses.
Because new non-residential space is required primarily to accommodate new employment growth, employment and space are expected to grow at similar rates over the forecast period.
The non-residential space forecast prepared for development charges purposes is summarized on Table 2.
HEMSONHEMSON
22

Table 2 Summary of Non-Residential Development Forecast
Table 2 provides a summary of the employment forecast for the 2014–2023 period and to ultimate development. Over the next 10 years, employment is projected to grow by 65,910 employees, an increase of nearly 36 per cent. Beyond 2023 to ultimate development, a further 69,880 employees are forecast to be added. Overall, City of Brampton employment is forecast to increase by 135,790 employees, about 73 per cent, between now and ultimate development.
The table also shows that about 4.97 million square metres of Gross Floor Area (GFA) is forecast to come on-stream over the next decade. During the post–2023 period to ultimate development it is forecast that a further 4.56 million square metres of GFA will be added. Overall, about 9.52 million square meters of GFA will be added from 2014 to 2041.
The major share of space (3.95 million square metres or about 80 per cent) that is forecast to be added over the next 10 years is anticipated in the employment land (i.e. industrial) and major office space category. The remaining forecast refers be population related employment space (i.e. non-industrial/non-office space) at about 1.02 million square metres (approximately 20 per cent of the total).
Existing 2014-2023 2014-2041NON-RESIDENTIAL FORECAST As At Forecast As at Forecast As at
Mid-Year 2013 Change Mid Year-2023 Change Mid-Year 2041
Employment 185,570 65,910 251,480 135,790 321,360
Non-Residential Building Space (sq.m.) 4,967,120 9,523,450Industrial / Office Building Space (sq.m.) 3,951,720 7,491,150Non-Industrial Building Spaces (sq.m.) 1,015,400 2,032,300
HEMSONHEMSON
23

IV SUMMARY OF HISTORIC CAPITAL SERVICE LEVELS
The DCA and Ontario Regulation 82/98 require that the development charges be set at a level no higher than the average service level provided in the municipality over the 10 year period immediately preceding the preparation of the background study, on a service by service basis.
For non-engineering services (fire, library, recreation, transit etc.) the legislative requirement is met by documenting historic service levels for the preceding 10 years, in this case, for the period 2004–2013. Typically, service levels for non-engineering services are measured as a ratio of inputs per capita (or per population plus employment).
O. Reg. 82/98 requires that when determining historical service levels both quantity and quality of service be taken into consideration. In most cases, the service levels are initially established in quantitative terms. For example, service levels for buildings are presented in terms of square feet per capita. The qualitative aspect is introduced by the consideration of the monetary value of the facility or service. In the case of buildings, for example, the cost would be shown in terms of $’s/square foot to replace or construct a facility of the same quality. This approach helps to ensure that the development-related capital facilities that are to be charged to new development reflect not only the quantity (number and size) but also the quality (value or replacement cost) of service provided historically by the City. Both the quantitative and qualitative aspects of service levels used in the present analysis are based on information provided by staff of the City and boards, and is based on historical records and their experience with costs to acquire or construct similar facilities, equipment and infrastructure as of 2013.
Table 3 summarizes service levels for all services included in the development charge calculation. Appendices B and C provide detailed historical inventory data upon which the calculation of service levels is based.
HEMSONHEMSON
24

HEMSON
TABLE 3
CITY OF BRAMPTONSUMMARY OF AVERAGE HISTORIC SERVICE LEVELS 2004 - 2013
FOR GENERAL AND ROADS SERVICES
Service
1.0 GENERAL GOVERNMENT $42.34 per capita & employmentBuildings $31.40 per capita & employmentLand $7.56 per capita & employmentMaterials $0.83 per capita & employmentGeneral Government Fleet $2.55 per capita & employment
2.0 LIBRARY SERVICES $169.26 per capitaBuildings $106.70 per capitaLand $21.31 per capitaMaterials $30.13 per capitaFurniture and Equipment $11.12 per capita
3.0 FIRE SERVICES $674.67 per householdBuildings $318.95 per householdLand $143.48 per householdVehicles $167.74 per householdEquipment $44.50 per household
4.0 RECREATION $2,669.46 per capitaIndoor Recreation $1,329.49 per capitaPark Facilities $226.98 per capitaOutdoor Buildings $68.47 per capitaParkland $839.85 per capitaSpecial Facilities $164.95 per capitaFleet and Equipment $39.71 per capita
5.0 PUBLIC WORKS - BUILDINGS & FLEET $139.96 per capita & employmentBuildings $38.96 per capita & employmentLand $74.05 per capita & employmentFurniture $1.98 per capita & employmentFleet $24.97 per capita & employment
6.0 PARKING $111.81 per capita & employmentParking Lots $91.92 per capita & employmentLand $19.34 per capita & employmentEquipment $0.55 per capita & employment
7.0 TRANSIT $362.86 per capita & employmentTransil Facilities $79.02 per capita & employmentService Centres/Terminals $19.47 per capita & employmentLand $49.93 per capita & employmentBus Shelters/Pads $13.79 per capita & employmentStops/Loops $10.69 per capita & employmentEquipment $21.86 per capita & employmentVehicles $168.10 per capita & employment
8.0 ROADS $7,369.19 per capita & employmentRoads and Related Infrastructure $7,369.19 per capita & employment
2004 - 2013Service Level
Indicator
HEMSON
25

V THE DEVELOPMENT-RELATED CAPITAL FORECAST
A. A DEVELOPMENT-RELATED CAPITAL FORECAST IS PROVIDED FOR COUNCIL’S APPROVAL
The DCA requires the Council of a municipality to express its intent to provide future capital facilities at the level incorporated in the development charges calculation. As noted above in Section II, Ontario Regulation 82/98, s. 3 states that:
For the purposes of paragraph 3 of subsection 5 (1) of the Act, the council of a municipality has indicated that it intends to ensure that an increase in the need for service will be met if the increase in service forms part of an official plan, capital forecast or similar expression of the intention of the council and the plan, forecast or similar expression of the intention of the council has been approved by the council.
Based on the development forecasts summarized in Section III and detailed in Appendix A, staff of the City departments, in collaboration with the consultants, developed a development-related capital forecast as of December 31, 2013 setting out those projects that are required to service anticipated development. For all services except Roads, the capital plan covers the 10 year period from 2014–2023. As permitted by the DCA s. 5 (1) 4., the development charge for Roads services is based on ultimate development expected in the City (to 2041). It should be noted, in some cases, the capital costs identified in these forecasts represents supplementary funding requirements for projects which have had partial funding, already approved in previous years, under previously approved Capital Budgets. As such, the summary of funding attributed to some projects, may appear, low.
One of the recommendations contained in this background study is for Council to adopt the development-related capital forecast developed for the purposes of the development charges calculation. It is assumed that future capital budgets and forecasts will continue to bring forward the development-related projects contained herein, that are consistent with the growth occurring in the City. It is acknowledged that changes to the forecast presented here, may occur through the City’s normal capital budget process.
HEMSON
26
B. THE DEVELOPMENT-RELATED CAPITAL FORECAST FOR CITY-WIDE SERVICES
A summary of the Development-Related Capital Forecast for general services is presented in Table 4.
HEMSON
27

HEMSON
Gross Grants/ MunicipalService Cost Subsidies Cost 2014 2015 2016 2017 2018 2019 2020 2021 2022 2023
1.0 GENERAL GOVERNMENT $16,599.6 $0.0 $16,599.6 $535.3 $10,914.3 $764.3 $764.3 $1,189.3 $441.4 $541.4 $541.4 $441.4 $466.4
1.2 Development-Related Studies $4,571.0 $0.0 $4,571.0 $171.0 $550.0 $400.0 $400.0 $825.0 $400.0 $500.0 $500.0 $400.0 $425.0
1.1 Buildings and Fleet $12,028.6 $0.0 $12,028.6 $364.3 $10,364.3 $364.3 $364.3 $364.3 $41.4 $41.4 $41.4 $41.4 $41.4
2.0 LIBRARY SERVICES $70,887.0 $0.0 $70,887.0 $22,694.0 $2,977.0 $3,077.0 $3,277.0 $3,477.0 $3,677.0 $18,877.0 $4,077.0 $4,277.0 $4,477.0
2.1 Recovery of Negative Reserve Fund Balance $20,017.0 $0.0 $20,017.0 $20,017.0 $0.0 $0.0 $0.0 $0.0 $0.0 $0.0 $0.0 $0.0 $0.0
2.2 Buildings, Land & Furnishings $15,500.0 $0.0 $15,500.0 $50.0 $50.0 $50.0 $50.0 $50.0 $50.0 $15,050.0 $50.0 $50.0 $50.0
2.3 Material Acquisitions $35,370.0 $0.0 $35,370.0 $2,627.0 $2,927.0 $3,027.0 $3,227.0 $3,427.0 $3,627.0 $3,827.0 $4,027.0 $4,227.0 $4,427.0
3.0 FIRE SERVICES $82,519.5 $0.0 $82,519.5 $44,858.5 $11,428.0 $8,303.0 $2,000.0 $6,430.0 $6,200.0 $2,000.0 $900.0 $200.0 $200.0
3.1 Recovery of Negative Reserve Fund Balance $23,683.5 $0.0 $23,683.5 $23,683.5 $0.0 $0.0 $0.0 $0.0 $0.0 $0.0 $0.0 $0.0 $0.0
3.2 Buildings, Land & Furnishings $46,816.0 $0.0 $46,816.0 $20,980.0 $10,203.0 $6,253.0 $0.0 $4,780.0 $4,600.0 $0.0 $0.0 $0.0 $0.0
3.3 Vehicles $6,045.0 $0.0 $6,045.0 $120.0 $1,075.0 $1,200.0 $1,100.0 $750.0 $700.0 $1,100.0 $0.0 $0.0 $0.0
3.4 Equipment $5,975.0 $0.0 $5,975.0 $75.0 $150.0 $850.0 $900.0 $900.0 $900.0 $900.0 $900.0 $200.0 $200.0
4.0 RECREATION AND PARKS $425,410.7 $10,680.0 $414,730.7 $19,516.9 $99,131.9 $24,567.9 $26,284.9 $55,769.9 $32,937.9 $34,239.9 $39,138.9 $27,467.9 $55,674.9
4.1 Major Facilities $104,360.0 $0.0 $104,360.0 $1,030.0 $5,880.0 $850.0 $13,500.0 $42,100.0 $1,500.0 $20,500.0 $19,000.0 $0.0 $0.0
4.2 Park Facilities and Equipment/Fleet $10,448.7 $0.0 $10,448.7 $644.9 $644.9 $4,644.9 $644.9 $644.9 $644.9 $644.9 $644.9 $644.9 $644.9
4.3 Parkland Development $310,602.0 $10,680.0 $299,922.0 $17,842.0 $92,607.0 $19,073.0 $12,140.0 $13,025.0 $30,793.0 $13,095.0 $19,494.0 $26,823.0 $55,030.0
5.0 PUBLIC WORKS: BUILDINGS AND FLEET $113,459.2 $0.0 $113,459.2 $41,862.3 $8,999.1 $8,320.1 $19,305.1 $3,923.1 $9,131.1 $19,830.1 $696.1 $696.1 $696.1
5.1 Recovery of Negative Reserve Fund Balance $38,016.2 $0.0 $38,016.2 $38,016.2 $0.0 $0.0 $0.0 $0.0 $0.0 $0.0 $0.0 $0.0 $0.0
5.2 Buildings, Land & Equipment $68,482.0 $0.0 $68,482.0 $3,150.0 $8,303.0 $7,624.0 $18,609.0 $3,227.0 $8,435.0 $19,134.0 $0.0 $0.0 $0.0
5.2 Equipment $6,961.0 $0.0 $6,961.0 $696.1 $696.1 $696.1 $696.1 $696.1 $696.1 $696.1 $696.1 $696.1 $696.1
6.0 PARKING $23,550.2 $0.0 $23,550.2 $2,355.0 $2,355.0 $2,355.0 $2,355.0 $2,355.0 $2,355.0 $2,355.0 $2,355.0 $2,355.0 $2,355.0
6.1 Parking Facilities $23,550.2 $0.0 $23,550.2 $2,355.0 $2,355.0 $2,355.0 $2,355.0 $2,355.0 $2,355.0 $2,355.0 $2,355.0 $2,355.0 $2,355.0
7.0 TRANSIT $330,818.6 $149,092.0 $181,726.6 $57,459.6 $14,658.0 $8,739.0 $5,794.0 $79,221.0 $3,171.0 $3,171.0 $3,171.0 $3,171.0 $3,171.0
7.1 Recovery of Negative Reserve Fund Balance $44,936.6 $0.0 $44,936.6 $44,936.6 $0.0 $0.0 $0.0 $0.0 $0.0 $0.0 $0.0 $0.0 $0.0
7.2 Buildings, Land & Equipment $76,500.0 $0.0 $76,500.0 $750.0 $750.0 $0.0 $0.0 $75,000.0 $0.0 $0.0 $0.0 $0.0 $0.0
7.3 Vehicles $205,179.0 $148,009.0 $57,170.0 $11,461.0 $13,596.0 $8,427.0 $5,482.0 $3,909.0 $2,859.0 $2,859.0 $2,859.0 $2,859.0 $2,859.0
7.4 Other Transit $4,203.0 $1,083.0 $3,120.0 $312.0 $312.0 $312.0 $312.0 $312.0 $312.0 $312.0 $312.0 $312.0 $312.0
TOTAL TEN-YEAR GENERAL SERVICES $1,063,244.8 $159,772.0 $903,472.8 $189,281.7 $150,463.3 $56,126.3 $59,780.3 $152,365.3 $57,913.4 $81,014.4 $50,879.4 $38,608.4 $67,040.4
TABLE 4
CITY OF BRAMPTONSUMMARY OF DEVELOPMENT-RELATED CAPITAL FORECAST
Total Net Capital Program
FOR GENERAL SERVICES 2014 - 2023(in $000)
HEMSON
28

The table provides a total for all general services analysed over the 10 year period, 2014–2023. The Roads & Related services analysed to ultimate development (2041) are not included in this table. Further details on the capital plans for each individual service category are available in Appendices B–C.
The Development-Related Capital Forecast for ten-year general services estimates a total gross cost of $1.06 billion. Approximately, $159.77 million in senior government grants, subsidies or other recoveries are expected to offset the cost of the program. Therefore, the net municipal cost of the capital program is $903.47 million.
This capital forecast incorporates those projects identified to be related to development anticipated in the next 10 years. It is not implied that all of these costs are to be recovered from new development by way of development charges (see the following Section VI for the method and determination of net capital costs attributable to growth). Portions of this capital forecast may relate to providing servicing for development which has occurred prior to 2014 (for which development charge reserve fund balances exist), for replacement of existing capital facilities (e.g. Fire station repositioning/replacement) or for growth anticipated to occur beyond the 2014–2023 planning period. In addition, the amounts shown on Table 4 have not been reduced by 10 per cent for various “soft” (or general) services as mandated by s. 5 (1) 8. of the DCA.
Of the $903.47 million in ten-year net municipal capital costs for general services, $414.73 million (46 per cent) is related to the provision of Recreation Services. The development of City-wide parkland and the construction of new recreation facilities are included in the capital program. This service category also provides for the acquisition of recreation related City-wide fleet and equipment.
The development-related capital program for Transit relates to the recovery of a negative reserve fund balance, a new maintenance and storage facility garage, additional vehicles and transit equipment. This program also includes two new minor transit terminals in 2014 and 2015, located in the northeast and northwest end of the City. The net municipal cost for this program totals to $181.73 million and represents 20% of the net municipal capital costs for general services.
HEMSON
29
The next largest development-related capital component is for Public Works at $113.46 million (13 per cent). The capital program includes for the recovery of the City’s negative reserve fund balance and the construction of new works yards throughout the planning period. The program also includes new additions to the City’s fleet and equipment inventory.
Fire Services represents $82.52 million (9 per cent) of the capital program and provides for two new stations, a new training facility, an apparatus and maintenance facility (remaining unfunded balance only) and the replacement of two stations (#201 and #203) with larger facilities as a result of growth. The program also provides for the recovery of the negative reserve fund balance as well as new vehicles and equipment (e.g. opticom, dispatch and firefighting equipment).
The development-related capital forecast for Library Services totals about $70.89 million (8 per cent). The program includes the construction of a new District 3 library branch. The capital forecast also includes additions to the City’s library collections.
Parking services represents $23.55 million (3 per cent) of the capital program and is solely related to a proportion of the annual lease payments associated with the construction of a new building and parking lot associated with the new South West Quadrant (City Hall Expansion) project.
General Government is included at $16.60 million (2 per cent). General Government service consists of two components, general government services relating to buildings (e.g. animal control, courthouse) and fleet; and general government service for development-related studies.
In addition to the development-related capital forecast for general services, approximately $1.44 billion in net roads and related works are planned to 2041. In addition to roads, the program also provides for grade separations, structures, sidewalks, streetlights, intersection improvements, traffic signalization, streetscaping and development-related studies. Of the $1.44 billion in costs, $63.29 million relates to the Bramwest Parkway, which has a separate reserve fund.
HEMSON
30

VI PROPOSED DEVELOPMENT CHARGES ARE CALCULATED IN ACCORDANCE WITH THE DCA
This section summarizes the calculation of development charges for each service category and the resulting total development charge by type of development. For City-wide services, the calculation of the “unadjusted” per capita (residential) and per square metre (non-residential) charges is reviewed. Adjustments to these amounts resulting from a cash flow analysis that takes interest earnings and borrowing costs into account are also discussed.
For residential development, the adjusted total per capita amount is then converted to a variable charge by housing unit type using various unit occupancy factors. For non-residential development, the charge is differentiated by use (industrial/office and non-office/non-industrial). The calculated non-residential charges are based on gross floor area (GFA) of building space.
It is noted that the calculation of the City-wide development charges does not include any provision for exemptions required under the DCA, such as the exemption for enlargements of up to 50 per cent on existing industrial buildings. Such legislated exemptions, or other exemptions which Council may choose to provide, will result in loss of development charge revenue for the affected types of development. Any such revenue loss may not be made up, however, by offsetting increases in other portions of the calculated charge.
A. UNADJUSTED DEVELOPMENT CHARGE CALCULATION FOR CITY-WIDE SERVICES
A summary of the “unadjusted” residential and non-residential development charges for City-wide services is presented in Tables 5 and 6. The totals in the table separate the ten-year City-wide general services from the City-wide Roads Services which are analysed to ultimate development. Further details of the calculation for each individual City service category are available in Appendices B–C.
HEMSON
31

HEMSON
CITY OF BRAMPTONSUMMARY OF UNADJUSTED RESIDENTIAL AND NON-RESIDENTIAL DEVELOPMENT CHARGES
10 Year Growth in Population in New Units 162,396 10 Year Growth in Square Meters 4,967,120
Total DCNet Replacement Legislated Eligible
Service Municipal & Benefit to Service Available Post-2023 Costs forCost Existing Discount DC Reserves Benefit Recovery
($000) ($000) ($000) ($000) ($000) ($000) % $000 % $000
1.00 GENERAL GOVERNMENT $16,599.6 $1,611.0 $1,498.9 $1,854.4 $968.7 $10,666.6 71% $7,573.3 29% $3,093.3
Unadjusted Development Charge Per Capita ($) $46.63Unadjusted Development Charge Per Sq. M. ($) $0.62
2.00 LIBRARY SERVICES $70,887.0 $26,500.0 $4,438.7 $0.0 $17,997.0 $21,951.3 100% $21,951.3 0% $0.0
Unadjusted Development Charge Per Capita ($) $135.17Unadjusted Development Charge Per Sq. M. ($) $0.00
3.00 FIRE SERVICES $82,519.5 $14,465.0 $0.0 $0.0 $38,932.3 $29,122.2 71% $20,676.8 29% $8,445.5
Unadjusted Development Charge Per Capita ($) $127.32Unadjusted Development Charge Per Sq. M. ($) $1.70
4.00 RECREATION AND PARKS $414,730.7 $22,374.0 $39,235.7 $3,205.1 $3,714.3 $346,201.6 100% $346,201.6 0% $0.0
Unadjusted Development Charge Per Capita ($) $2,131.83Unadjusted Development Charge Per Sq. M. ($) $0.00
5.00 PUBLIC WORKS: BUILDINGS AND FLEET $113,459.2 $0.0 $0.0 $0.0 $84,066.2 $29,393.0 71% $20,869.0 29% $8,524.0
Unadjusted Development Charge Per Capita ($) $128.51Unadjusted Development Charge Per Sq. M. ($) $1.72
6.00 PARKING $23,550.2 $19,009.1 $454.1 $4,087.0 $0.0 $0.0 71% $0.0 29% $0.0
Unadjusted Development Charge Per Capita ($) $0.00Unadjusted Development Charge Per Sq. M. ($) $0.00
7.00 TRANSIT $181,726.6 $0.0 $18,172.7 $0.0 $90,855.2 $72,698.8 71% $51,616.2 29% $21,082.7
Unadjusted Development Charge Per Capita $317.84Unadjusted Development Charge Per Sq. M. $4.24
Total - 10 Year City-Wide General Services $903,472.8 $83,959.1 $63,800.0 $9,146.4 $236,533.6 $510,033.7 $468,888.3 $41,145.4
Unadjusted Development Charge Per Capita ($) $2,887.30Unadjusted Development Charge Per Sq. M. ($) $8.28
Share Share
TABLE 5
10-YEAR CAPITAL PROGRAM FOR GENERAL SERVICES
Residential Non-Residential
Development-Related Capital Forecast (2014 - 2023)
HEMSON
32
Population in New Units (2014-2041) 311,666
Non-residential Floor Space Growth in Square Meters (2014-2041) 9,523,450
Industrial and Major Office 7,491,150
Population Related 2,032,300
Total DCNet Replacement Legislated Eligible
Municipal & Benefit to Service Available Post-2041 Costs forCost Existing Discount DC Reserves Benefit Recovery
($000) ($000) ($000) ($000) ($000) ($000) % $000 % $000
1.0 ROADS - EXCLUDING BRAMWEST NSTC 1,378,793.0$ 64,958.6$ -$ -$ -$ 1,313,834.4$ 70% 919,684.1$ 30% 394,150.3$
Unadjusted Development Charge Per Capita $2,950.86
Industrial/Office Unadjusted Development Charge Per Sq. M $31.95Non-Industrial/Office Unadjusted Development Charge Per Sq. M $76.18
2.0 ROADS - BRAMWEST PARKWAY / NSTC 63,287.8$ -$ -$ 11,295.9$ -$ 51,991.9$ 70% 36,394.3$ 30% 15,597.6$
Unadjusted Development Charge Per Capita $116.77
Industrial/Office Unadjusted Development Charge Per Sq. M $1.26Non-Industrial/Office Unadjusted Development Charge Per Sq. M $3.01
Total - City-Wide Hard Services (to 2041) $1,442,080.8 $64,958.6 $0.0 $11,295.9 $0.0 $1,365,826.3 $956,078.4 $409,747.9
Unadjusted Development Charge Per Capita ($) $3,067.64
Industrial/Office Unadjusted Development Charge Per Sq. M $33.21Non-Industrial/Office Unadjusted Development Charge Per Sq. M $79.20
Residential Non-ResidentialShare Share
TABLE 6
CITY OF BRAMPTON
SUMMARY OF RESIDENTIAL AND NON-RESIDENTIAL DEVELOPMENT CHARGES
CAPITAL PROGRAM FOR ROADS AND RELATED INFRASTRUCTURE: 2014 - 2041
Development-Related Capital Program
HEMSON
HEMSON
33

1. General Services
A summary of the “unadjusted” residential and non-residential development charges for the City-wide general services is presented in Table 5.
The capital forecast for the general services incorporates those projects identified to be related to development anticipated in the next ten years. However, not all of the capital costs are to be recovered from new development by way of development charges. Table 5 shows that $83.96 million of the capital forecast relates to replacement of existing capital facilities or for shares of projects that provide benefit to the existing community. This amount results from the replacement of two fire stations, the portions of library collections materials, portion of the parking lease relating to non-public parking spaces and shares of development-related studies. These portions of capital costs will have to be funded from non-development charge revenue sources.
An additional share of $9.15 million has been identified as available development charges reserves and represents the revenues collected from previous development charges. This portion has been netted out of the chargeable capital costs. Another share of the forecast, $236.53 million, is attributable to development beyond the 2023 period (and may therefore be recovered under future development charge studies).
The DCA, s. 5 (1) 8 requires that development-related net capital costs for “soft” services be reduced by 10 per cent in calculating the applicable development charge. The discount does not apply to the Fire Services or services related to a highway. The 10 per cent share of development-related net capital costs not included in the development charge calculations must be funded from non-development charge sources. In total, about $63.80 million is identified as the required 10 per cent reduction.
The total costs eligible for recovery through development for general services is $510.03 million. This amount is allocated between the residential and non-residential sectors to derive the unadjusted development charges. Library and Recreation Services are all deemed to benefit residential development only, while the General Government, Fire Services, Public Works: Buildings & Fleet, Parking and Transit services are allocated between both sectors based on shares of population and employment growth. Approximately $468.89 million of the general services
HEMSON
34
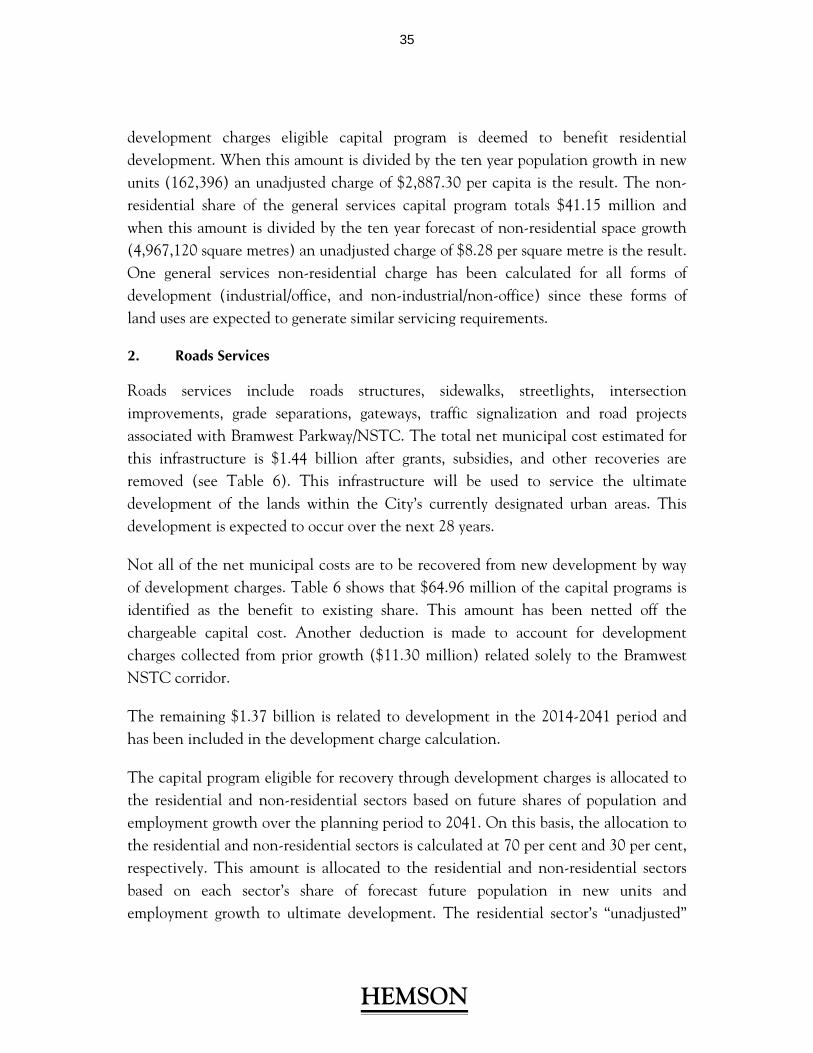
development charges eligible capital program is deemed to benefit residential development. When this amount is divided by the ten year population growth in new units (162,396) an unadjusted charge of $2,887.30 per capita is the result. The non-residential share of the general services capital program totals $41.15 million and when this amount is divided by the ten year forecast of non-residential space growth (4,967,120 square metres) an unadjusted charge of $8.28 per square metre is the result. One general services non-residential charge has been calculated for all forms of development (industrial/office, and non-industrial/non-office) since these forms of land uses are expected to generate similar servicing requirements.
2. Roads Services
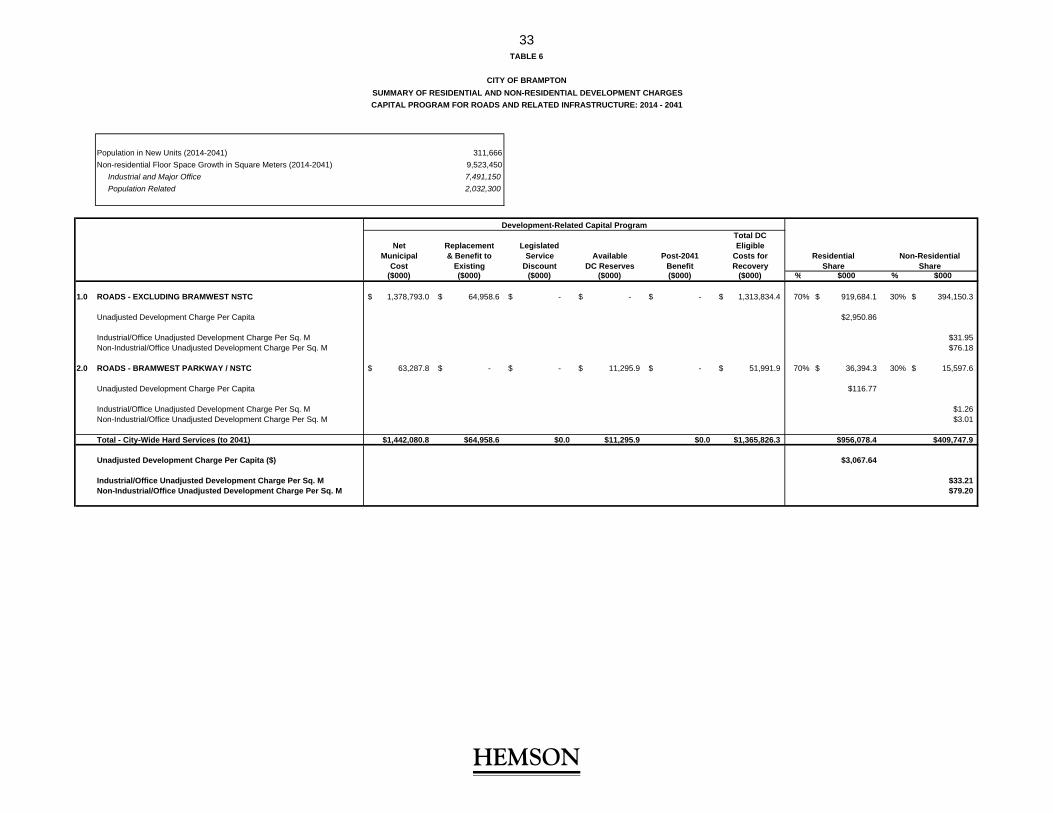
Roads services include roads structures, sidewalks, streetlights, intersection improvements, grade separations, gateways, traffic signalization and road projects associated with Bramwest Parkway/NSTC. The total net municipal cost estimated for this infrastructure is $1.44 billion after grants, subsidies, and other recoveries are removed (see Table 6). This infrastructure will be used to service the ultimate development of the lands within the City’s currently designated urban areas. This development is expected to occur over the next 28 years.
Not all of the net municipal costs are to be recovered from new development by way of development charges. Table 6 shows that $64.96 million of the capital programs is identified as the benefit to existing share. This amount has been netted off the chargeable capital cost. Another deduction is made to account for development charges collected from prior growth ($11.30 million) related solely to the Bramwest NSTC corridor.
The remaining $1.37 billion is related to development in the 2014-2041 period and has been included in the development charge calculation.
The capital program eligible for recovery through development charges is allocated to the residential and non-residential sectors based on future shares of population and employment growth over the planning period to 2041. On this basis, the allocation to the residential and non-residential sectors is calculated at 70 per cent and 30 per cent, respectively. This amount is allocated to the residential and non-residential sectors based on each sector’s share of forecast future population in new units and employment growth to ultimate development. The residential sector’s “unadjusted”
HEMSON
35

development charge is calculated at $3,067.64 per capita. This charge is based on population in new units to growth to 2041 of 311,666.
The non-residential share of the capital program costs has been allocated according to each use’s share of total employment growth to 2041.
The industrial and major office development sector’s share results in an “unadjusted” development charge of $33.21 per square metre. This charge is based on growth in industrial and office floor space to 2041 of 7,491,150 square metres.
The population related (i.e. non-industrial and non-office developments) sector’s share results in an “unadjusted” development charge of $79.20 per square metre. This charge is based on growth in population related floor space to 2041 of 2,032,300 square metres.
3. Adjusted Rates for City-Wide Residential and Non-Residential Development Charges
Final adjustments to the “unadjusted” development charge rates summarized above are made through a cash flow analysis. The analysis, details of which are included in the Appendices, considers the borrowing cost and interest earnings associated with the timing of expenditures and development charge receipts for each service.
Tables 7, 8 and 9 summarize the results of the adjustment for the residential and non-residential components of the City-wide rates respectively. As shown on Table 7, the adjusted per capita rate for general services increases from $2,887.30 to $3,021.08 after the cash flow analysis. For all roads, the charge increases after the cash flow analysis, from $3,067.64 to $3,331.71 per capita. Residential City-wide development charges are proposed to vary by dwelling unit type to reflect their different occupancy factors and resulting demand for services. As shown in the Table, the proposed residential charge for City services ranges from $9,529 for small apartments (<=750 sq.ft) to $26,935 for single detached and semi-detached units. The proposed charge for rows (and other multiple units) is $21,726 and $15,225 for large apartments (>750 sq.ft).
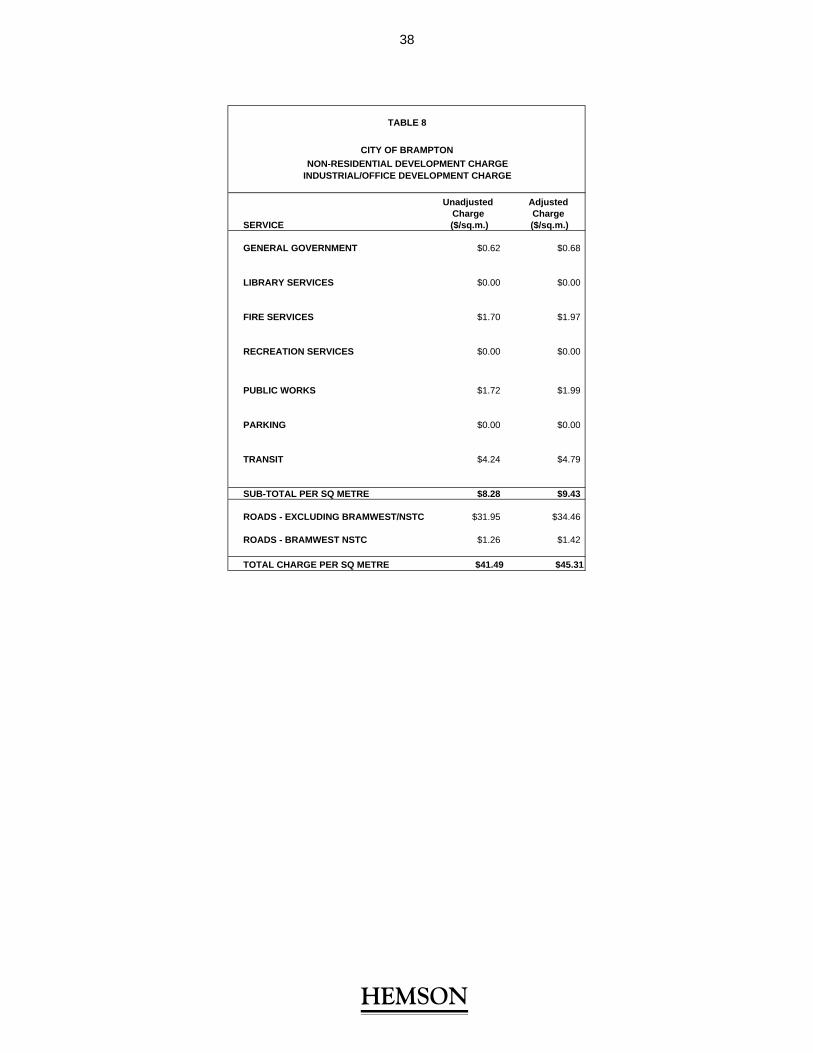
Table 8 shows that the adjusted rate for Industrial and Office development increases from $41.49 to $45.31 per square metre. Table 9 shows that the adjusted rate for other non-residential development increases from $87.48 to $96.70 per square metre.
HEMSON
36

Unadjusted Adjusted ChargeCharge Per Per Capita Singles/ Rows / Other Large Apts Small Apts
SERVICE Capita After Cashflow Semis Multiples > 750 sq.ft < = 750 sq.ft
GENERAL GOVERNMENT $46.63 $50.95 $216 $174 $122 $76
LIBRARY SERVICES $135.17 $155.97 $661 $533 $374 $234
FIRE SERVICES $127.32 $148.79 $631 $509 $357 $223
RECREATION SERVICES $2,131.83 $2,153.53 $9,131 $7,365 $5,161 $3,230
PUBLIC WORKS $128.51 $150.17 $637 $514 $360 $225
PARKING $0.00 $0.00 $0 $0 $0 $0
TRANSIT $317.84 $361.67 $1,533 $1,237 $867 $543
SUB-TOTAL PER CAPITA $2,887.30 $3,021.08 $12,809 $10,332 $7,241 $4,531
ROADS - EXCLUDING BRAMWEST/NSTC $2,950.86 $3,201.00 $13,572 $10,947 $7,671 $4,802
ROADS - BRAMWEST/NSTC $116.77 $130.71 $554 $447 $313 $196
TOTAL CHARGE PER CAPITA $5,954.94 $6,352.79 $26,935 $21,726 $15,225 $9,529
1: Person per unit: 4.24 3.42 2.40 1.50
CITY OF BRAMPTON
RESIDENTIAL DEVELOPMENT CHARGE
TABLE 7
Charge Per Unit Type (1)
HEMSON
37
Unadjusted Adjusted Charge Charge
SERVICE ($/sq.m.) ($/sq.m.)
GENERAL GOVERNMENT $0.62 $0.68
LIBRARY SERVICES $0.00 $0.00
FIRE SERVICES $1.70 $1.97
RECREATION SERVICES $0.00 $0.00
PUBLIC WORKS $1.72 $1.99
PARKING $0.00 $0.00
TRANSIT $4.24 $4.79
SUB-TOTAL PER SQ METRE $8.28 $9.43
ROADS - EXCLUDING BRAMWEST/NSTC $31.95 $34.46
ROADS - BRAMWEST NSTC $1.26 $1.42
TOTAL CHARGE PER SQ METRE $41.49 $45.31
TABLE 8
INDUSTRIAL/OFFICE DEVELOPMENT CHARGE
CITY OF BRAMPTON
NON-RESIDENTIAL DEVELOPMENT CHARGE
HEMSON
38

Unadjusted Adjusted Charge Charge
SERVICE ($/sq.m.) ($/sq.m.)
GENERAL GOVERNMENT $0.62 $0.68
LIBRARY SERVICES $0.00 $0.00
FIRE SERVICES $1.70 $1.97
RECREATION SERVICES $0.00 $0.00
PUBLIC WORKS $1.72 $1.99
PARKING $0.00 $0.00
TRANSIT $4.24 $4.79
SUB-TOTAL PER SQ METRE $8.28 $9.43
ROADS - EXCLUDING BRAMWEST/NSTC $76.18 $83.82
ROADS - BRAMWEST NSTC $3.01 $3.45
TOTAL CHARGE PER SQ METRE $87.48 $96.70
TABLE 9
CITY OF BRAMPTON
NON-RESIDENTIAL DEVELOPMENT CHARGENON-INDUSTRIAL/NON-OFFICE DEVELOPMENT CHARGE
HEMSON
39

VII COMPARISON OF CALCULATED AND CURRENT DEVELOPMENT CHARGES
Tables 10, 11 and 12 present a comparison of total proposed City-wide development charges for a single/semi-detached housing unit and per square metre respectively with the City’s existing charges (as of February 1, 2014).
Table 10 shows that the calculated charge per single/semi detached unit of $26,935 will produce an increase of $1,349, or 5.3 per cent, over the present development charge.
Table 11 shows the calculated charge for the non-residential Industrial and Office sectors. The calculated charge of $45.31 per square metre represents a decrease of about 7.9 per cent ($3.90) from the existing rate of $49.21.
Table 12 shows the calculated charge for the other non-residential uses. The calculated charge of $96.70 per square metre represents a decrease of about 6.7 per cent ($6.96) over the existing rate of $103.66.
HEMSON
40

CITY OF BRAMPTON
RESIDENTIAL DEVELOPMENT CHARGE PER SINGLE/SEMI DETACHED UNIT
SERVICE $ %
GENERAL GOVERNMENT $47 $216 $169 362.6%
LIBRARY SERVICES $716 $661 ($55) -7.7%
FIRE SERVICES $485 $631 $146 30.2%
RECREATION SERVICES $8,261 $9,131 $870 10.5%
PUBLIC WORKS $552 $637 $85 15.4%
PARKING $343 $0 ($343) -100.0%
TRANSIT $1,307 $1,533 $226 17.3%
SUB-TOTAL GENERAL SERVICES $11,711 $12,809 $1,098 9.4%
ROADS - EXCLUDING BRAMWEST/NSTC $13,291 $13,572 $281 2.1%
ROADS - BRAMWEST NSTC $584 $554 ($30) -5.1%
TOTAL CHARGE PER UNIT $25,586 $26,935 $1,349 5.3%
$/Unit
TABLE 10
Calculated Charge per Single/Semi
Current Charge per Single/Semi
Difference in Calculated & Current
Charge
HEMSON
41

CITY OF BRAMPTON
NON-RESIDENTIAL DEVELOPMENT CHARGE PER SQUARE METRE
SERVICE $ %
GENERAL GOVERNMENT $0.15 $0.68 $0.53 343.7%
LIBRARY SERVICES $0.00 $0.00 - -
FIRE SERVICES $1.61 $1.97 $0.36 22.4%
RECREATION SERVICES $0.00 $0.00 - -
PUBLIC WORKS $1.84 $1.99 $0.15 8.2%
PARKING $1.14 $0.00 ($1.14) -100.0%
TRANSIT $4.34 $4.79 $0.45 10.4%
SUB-TOTAL GENERAL SERVICES $9.08 $9.43 $0.35 3.8%
ROADS - EXCLUDING BRAMWEST/NSTC $38.47 $34.46 ($4.01) -10.4%
ROADS - BRAMWEST NSTC $1.66 $1.42 ($0.24) -14.3%
TOTAL CHARGE PER SQUARE METRE $49.21 $45.31 ($3.90) -7.9%
$/sq. m
INDUSTRIAL/OFFICE DEVELOPMENT
Current Industrial and Office Charge
Difference in Calculated & Current
Charge
TABLE 11
Calculated Industrial and Office Charge
HEMSON
42

CITY OF BRAMPTON
NON-RESIDENTIAL DEVELOPMENT CHARGE PER SQUARE METRE
SERVICE $ %
GENERAL GOVERNMENT $0.18 $0.68 $0.50 287.2%
LIBRARY SERVICES $0.00 $0.00 - -
FIRE SERVICES $1.84 $1.97 $0.13 6.8%
RECREATION SERVICES $0.00 $0.00 - -
PUBLIC WORKS $2.11 $1.99 ($0.12) -5.6%
PARKING $1.31 $0.00 ($1.31) -100.0%
TRANSIT $4.97 $4.79 ($0.18) -3.7%
SUB-TOTAL GENERAL SERVICES $10.41 $9.43 ($0.98) -9.4%
ROADS - EXCLUDING BRAMWEST/NSTC $88.74 $83.82 ($4.92) -5.5%
ROADS - BRAMWEST NSTC $4.51 $3.45 ($1.06) -23.5%
TOTAL CHARGE PER SQUARE METRE $103.66 $96.70 ($6.96) -6.7%
$/sq. m
NON-INDUSTRIAL AND NON-OFFICE DEVELOPMENT
TABLE 12
Calculated Non-Industrial and
Non-Office Charge
Current Non-Industrial and
Non-Office Charge
Difference in Calculated & Current
Charge
HEMSON
43

VIII LONG-TERM CAPITAL AND OPERATING COSTS
This section provides a brief examination of the long-term capital and operating costs for the capital facilities and infrastructure to be included in the development charges by-law. This examination is required as one of the features of the Development Charges Act, 1997.
A. NET OPERATING COSTS FOR THE CITY’S SERVICES ESTIMATED TO INCREASE BY $56.17 MILLION OVER 10 YEARS
Table 13 summarizes the estimated increase in net operating costs that the City will experience for additions associated with the planned capital program. These estimates were provided by City Finance based on the 2014 Capital Budget
As shown in Table 13, by 2023, the City’s net operating costs for general services are estimated to increase by $53.10 million. Significant increases in net operating costs will be experienced as new facilities such as fire stations, community centres and busses are added. Operating and maintenance costs will also increase as additions to the City’s road network are made. Page 2 of the table shows that $3.07 million in additional operating costs are anticipated over the first 10 years of the program.
B. LONG-TERM CAPITAL FINANCING FROM NON-DEVELOPMENT CHARGE SOURCES FOR GENERAL SERVICES TOTALS $393.43 MILLION
Table 13 also summarizes the components of the development-related capital program that will require funding from non-development charge sources as discussed above in Section VI. In total $393.43 million will need to be financed from non-development charge sources over the next ten years for General Services. This includes $236.53 million in interim financing, would be addressed through the City’s annual budget process. Because the by-laws must be revisited at least every five years, however, it is difficult to determine the quantum of interim financing that may be required. This also includes $9.15 million in development charges reserves which can offset a portion of the capital program.
Appendix E provides a breakdown of the non-development charge financing requirements by service.
HEMSON
44

C. LONG-TERM CAPITAL FINANCING FROM NON-DEVELOPMENT CHARGE SOURCES FOR ENGINEERED SERVICES TOTALS $76.25 MILLION TO 2041
Page 2 of Table 13 provides a summary of non-development charges funding for road infrastructure. Most notably, $64.96 million in taxation funding is required for the replacement share of projects. In addition, $11.30 million in development charges reserves are on hand to fund a portion of program.
HEMSON
45

TABLE 13 - PAGE 1
CITY OF BRAMPTONSUMMARY OF LONG TERM CAPITAL AND OPERATING COST IMPACTS
GENERAL SERVICES($000)
NET OPERATING IMPACTS 2014 2015 2016 2017 2018 2019 2020 2021 2022 2023 TOTAL
General Government $0.0 $1,883.8 $1,883.8 $1,883.8 $1,883.8 $1,883.8 $1,883.8 $1,883.8 $1,883.8 $1,883.8 n/aLibrary Services $0.0 $0.0 $0.0 $0.0 $0.0 $0.0 $0.0 $0.0 $0.0 $0.0 n/aFire Services $15.0 $60.0 $2,780.0 $5,460.0 $10,870.0 $10,920.0 $13,336.0 $13,336.0 $13,336.0 $13,336.0 n/aRecreation $644.7 $3,594.8 $5,036.7 $6,243.9 $6,827.2 $7,410.6 $8,235.6 $8,485.6 $9,060.6 $9,560.6 n/aTransit $1,605.1 $8,227.3 $11,668.9 $13,690.7 $15,712.5 $17,734.3 $19,756.1 $21,777.9 $23,799.7 $25,821.5 n/aPublic Works $21.0 $413.0 $1,401.0 $2,289.0 $2,331.0 $2,373.0 $2,415.0 $2,457.0 $2,499.0 $2,499.0 n/a
TOTAL OPERATING IMPACTS $2,286 $14,179 $22,770 $29,567 $37,625 $40,322 $45,626 $47,940 $50,579 $53,101 n.a.
LONG-TERM CAPITAL IMPACTS
GENERAL SERVICES Total Net Cost $189,281.7 $150,463.3 $56,126.3 $59,780.3 $152,365.3 $57,913.4 $81,014.4 $50,879.4 $38,608.4 $67,040.4 $903,472.8 Net Cost From Development Charges $140,883.0 $108,488.5 $26,171.3 $24,747.5 $52,026.0 $29,429.3 $23,806.1 $28,777.7 $25,068.8 $50,635.1 $510,033.7 Net Cost From Non-DC Sources $48,398.6 $41,974.8 $29,954.9 $35,032.7 $100,339.3 $28,484.0 $57,208.2 $22,101.6 $13,539.5 $16,405.2 $393,439.2 - Discount Portion $9,887.4 $12,577.5 $3,287.2 $3,129.0 $13,721.1 $3,704.6 $4,579.8 $3,632.2 $3,220.1 $6,060.8 $63,800.0 - Replacement/BTE $6,671.9 $12,045.9 $7,375.9 $7,734.9 $5,350.9 $6,085.9 $13,935.9 $13,510.9 $5,610.9 $5,635.9 $83,959.1 - Available DC Reserves (1) $3,911.8 $1,905.4 $416.2 $416.2 $416.2 $416.2 $416.2 $416.2 $416.2 $416.2 $9,146.4 - For Post 2023 Development (2) $27,927.5 $15,445.9 $18,875.7 $23,752.7 $80,851.1 $18,277.3 $38,276.3 $4,542.3 $4,292.3 $4,292.3 $236,533.6
TOTAL LONG-TERM CAPITAL IMPACTS $48,398.6 $41,974.8 $29,954.9 $35,032.7 $100,339.3 $28,484.0 $57,208.2 $22,101.6 $13,539.5 $16,405.2 $393,439.2
TOTAL NET OPERATING & CAPITAL IMPACTS $50,684.5 $56,153.7 $52,725.3 $64,600.2 $137,963.9 $68,805.7 $102,834.7 $70,041.9 $64,118.6 $69,506.1 n.a.
Notes:
(1) To extent possible costs have been offset by existing DC Reserve Fund Balances.
(2) Costs for growth beyond 2023 may be recovered from future DC and therefore may only be an interim financing requirement.
HEMSON
HEMSON
46

TABLE 13 - PAGE 2
CITY OF BRAMPTONSUMMARY OF LONG TERM CAPITAL AND OPERATING COST IMPACTS
ENGINEERED SERVICES($000)
NET OPERATING IMPACTS 2014 2015 2016 2017 2018 2019 2020 2021 2022 2023 TOTAL
Roads $1,040.0 $1,131.5 $1,875.5 $2,423.5 $2,626.5 $2,804.5 $2,859.5 $3,006.5 $3,067.5 $3,067.5 n/a
TOTAL OPERATING IMPACTS $1,040.0 $1,131.5 $1,875.5 $2,423.5 $2,626.5 $2,804.5 $2,859.5 $3,006.5 $3,067.5 $3,067.5 n.a.
LONG-TERM CAPITAL IMPACTS2014-2041
ROADS Total Net Cost $1,442,080.8 Net Cost From Development Charges $1,365,826.3 Net Cost From Non-DC Sources $76,254.4 - Discount Portion $0.0 - Replacement/BTE $64,958.6 - Available DC Reserves (1) $11,295.9 - For Post 2041 Development (2) $0.0
TOTAL LONG-TERM CAPITAL IMPACTS $76,254.4Notes:
(1) To extent possible costs have been offset by existing DC Reserve Fund Balances.
(2) Costs for growth beyond 2041 may be recovered from future DC and therefore may only be an interim financing requirement.
HEMSON
HEMSON
47

IX DEVELOPMENT CHARGES ADMINISTRATION
No significant changes are recommended to the City’s current policies and practices regarding development charge administration. In this regard:
It is recommended that practices regarding collection of development charges and by-law administration continue to the extent possible.
It is further recommended that the collection and administration policies be as
consistent as practicable with those of the Regional Municipality of Peel in order to simplify by-law administration and aid understanding for those required to pay the charges.
It is recommended that the by-law permit the payment of a development
charge in cash or through services in lieu agreements. The municipality is not obligated to enter into services in lieu agreements.
As required under the DCA, the City should codify any rules regarding application of the by-laws and exemptions within the development charges by-laws proposed for adoption.
It is recommended that no exemptions, other than those required in the
Development Charges Act, 1997, be formally adopted in the by-laws.
The current non-statutory discount for industrial development is proposed to be eliminated since the calculated rate is lower than the City’s current discounted rate.
City Staff have proposed that exemptions on portions of ‘places of worship’ and ‘full service hotels’ be maintained.
City Staff have proposed a change in by-law wording that would waive development charges on the work portion of ‘live-work’ units
It is recommended that the City continue to pursue cost-sharing and uploading with the Regional Municipality of Peel for road-related infrastructure that meets the criteria of Regional significance.
HEMSON
48

It is proposed that conservation authorities be removed from the definition of a ‘local board’
It is recommended that Council adopt a set of Local Service Guidelines that
will be presented through a Corporate Report.
It is recommended that Council adopt the development-related capital forecast included in this background study, subject to annual review through the City’s normal capital budget process.
HEMSON
49

APPENDIX A
DEVELOPMENT FORECAST
HEMSON
50

APPENDIX A
RESIDENTIAL AND NON-RESIDENTIAL DEVELOPMENT FORECAST
This appendix provides the details of the development forecast used in the preparation of the Development Charges Background Study for the City of Brampton. The development forecast in the development charges background study is based on estimates of growth occurring within approved Official Plan designated urban areas. This forecast is consistent with the population and employment forecasts endorsed by City Council in April 2014 for use in completing the City’s 2014 Development Charges By-law update.
Historical Activities A.1 Historic Population, Households & Employment A.2 Household Size by Unit Type by Period of Construction Forecast Tables A.3 Population, Household & Employment Forecast Summary A.4 Forecast Population & Household Growth Summary A.5 Households By Unit Type A.6 Household Growth By Unit Type A.7 Persons-per-unit (PPU) in New Units A.8 Forecast Population in New Units A.9 Forecast Employment Growth A.10 Non-Residential Space Forecast The appendix begins with a brief discussion of the forecast key inputs and results in the context of recent development activity. This is followed by more detailed methodological discussions of the residential and non-residential forecast.
A. FORECAST KEY INPUTS
In preparing updated forecast for the City of Brampton’s land use and infrastructure planning needs and Development Charges Background Study, the following were incorporated:
HEMSON
51

Amendment 2 to the Growth Plan and its background work contained in Greater Golden Horseshoe Forecasts to 2041, Technical Report, November 2012 and its June 2013 Addendum;
Region of Peel and City of Brampton Official Plans 2011 Census data on population and housing; 2011 National Household Survey on housing occupancy (persons per unit) and
employment by place of work; City of Brampton Employment Survey to 2013; A full update of the City of Brampton´s land use databases including existing and
potential housing unit counts and existing and potential employment land development;
Changes to new secondary plan areas resulting from revised draft secondary plans and newly submitted block plans. These revisions include: SPA 40 (Bram West); SPA 47 (Highway 427 Industrial); SPA 48 (Sandringham Wellington North) and SPA 51 (Mount Pleasant);
An emerging planning framework for the Heritage Heights area as a result of Official Plan Amendment 43 and more work by the land owners on their Heritage Heights Vision Plan prepared in early 2013
B. FORECASTS PROJECT SLIGHTLY LESS GROWTH THAN RECENT ACTIVITY
During the 10-year period from 2004 to 2013 the City of Brampton experienced rapid population and employment growth. This growth was fuelled by a strong GTA economy and continued migration into the metropolitan region. Moving forward, Brampton is expected to continue to experience rapid housing growth until its greenfield housing capacity becomes largely exhausted at some point during the 2030s. However, the rate of growth is expected to slow from the levels experienced over the past 10 years.
1. Historical Growth in Population and Housing Units in Brampton Has Been Rapid (Table A.1)
Brampton’s population and housing growth has well exceeded the GTA average in recent years. Between the 2001 and 2011 Census, the population of the GTA grew by 972,200 people or 19 per cent. During this same period the City of Brampton’s population grew by approximately 61 per cent per cent to a 2011 Census value of 523,900.
HEMSON
52

Population Growth in Brampton, Peel Region and the GTA 2001-2011
2001 Population
2006 Population
2011 Population
2002-2011 Population
Growth Brampton 325,400 433,800 523,900 198,500
61% Peel Region 989,000 1,159,500 1,296,800 307,800
31% GTA 5,081,800 5,556,000 6,054,000 972,200
19% Note: See Appendix A Table 1
Source: Statistics Canada, 2001, 2006, 2011 Census
The number of housing units in Brampton has grown at a lower rate than population; likely as a result of the increase in the average number of persons residing in dwelling units. In contrast to other parts of the GTA, average household sizes in Brampton have grown over the course of the last decade, from an average household size of 3.4 in 2004 to 3.53 in 2013.
The City of Brampton has experienced stable employment growth over the past decade. In early years the City’s employment growth rate slowed from 3.1% per year from 2004 to 2006 to 2% from 2007 to 2011. In recent years, however, the growth rate has rebounded to approximately 3.8% in 2012 and 2013.
Employment Growth in Brampton, Peel Region and the GTA 2002 to 2011 2001
Employment 2006 Employment
2011 Employment
2002-2011 Employment Growth
Brampton 133,640 155,890 172,120 38,480 29%
Peel Region 534,300 608,000 649,400 154,300 22%
GTA 2,732,800 2,965,000 3,109,800 377,000 14%
Note: See Appendix A Table 3 Source: Statistics Canada, 2001, 2006 Census, 2011 Census
Over the 10-year period from 2004-2013, the City’s employment base increased by 30.6%. Brampton added 43,439 new employees in the 2004–2013 period. These figures are slightly higher than the 10-year growth rates for the 2002-2011 Census periods, where the City’s employment base grew by 28.8%. In the past 10 years, the City of Brampton accommodated 25 per cent of Peel Region’s and 10 per cent of the GTA’s employment growth during the period.
HEMSON
53

2. Brampton Households Have High Occupancy Levels (Table A.2)
Occupancy levels for single and semi detached, row and other multiple and apartment units in Brampton by period of construction are provided in Table A.2. In 2011, the average Brampton dwelling contained approximately 3.5 persons, which is significantly higher than the GTA average The values are from the National Household Survey (NHS). The 2001-2011 PPU values for each new dwelling type are: Single detached 4.31; Semis 3.87; Rows 3.31; and Apartments 2.10. These values are forecasted to remain relatively similar over time (see Table A.7).
C. RESIDENTIAL FORECAST HAS BEEN UPDATED TO REFLECT THE LATEST AVAILABLE INFORMATION
Much of the residential growth forecast is based on the City’s Official Plan growth targets and 2011 Census data. In 2013, the Province updated Schedule 3 population and employment targets at the Regional level through Amendment 2 to the Growth Plan for the Greater Golden Horseshoe.
The residential growth forecast incorporates 2011 Census data including population and the 2011 National Household Survey for data on occupied dwelling unit types, and average household size by dwelling unit type Hemson has also utilized updates of the City of Brampton’s land use databases to supplement the Census and NHS data.
D. FORECAST OF RESIDENTIAL UNITS BY STRUCTURE TYPE IS USED TO DISTRIBUTE POPULATION GROWTH IN NEW UNITS
The residential unit and population in new units forecast for the City is based on the forecast of three unit structure types: singles and semis; rows and other multiples; and apartments. The population in new units are estimated using person per unit factors.
The attached series of tables provide all of the assumptions and results for the forecasts. The purpose of each table and key assumptions are provided in the descriptions below:
1. Forecast of Households and Population (Tables A.3 and A.4)
Table A.3 provides a summary of the total City-wide household, population and employment forecast from 2014 to ultimate development. Ultimate development for
HEMSON
54

the purposes of this development charges study is 2041. Table A.4 details the annual growth of population, housing, population in new units and employment to 2041
The City’s Census population is forecast to rise from approximately 557,800 in 2013 to 701,900 in 2023 and to 855,000 at ultimate development (in 2041). This represents respective increases of 26 per cent and 53 per cent when measured against the 2013 population. The City’s Census population estimates are slightly lower than the Official Plan targets due to Census undercoverage. This undercoverage is commonly estimated at 4%.
Households are forecast to increase from approximately 158,240 in 2013 to 201,405 in 2023 and to 248,326 at ultimate development. These are increases of 27 per cent and 57 per cent respectively. The higher rate of household growth compared to population growth reflects a decline in occupancy levels expected in existing housing units and a significant shift to higher density development with lower persons per unit.
The population estimated to reside in the new dwelling units is 162,396 over the 10-year period and 311,666 over the longer period to ultimate development (in 2041). These estimates are based on application of person per unit factors to each dwelling type. The per capita residential development charge rates are calculated based on these estimates.
Tables A.5 and A.6 detail housing unit growth for singles and semis, rows and other multiples and apartments. The forecast of residential units by unit type applies an assumption of the mix of development during each of the five year Census periods. In the initial 10-year forecast period from 2014–2023, which applies to “soft services,” approximately 66 per cent of new housing units are anticipated to be single and semi detached units, 20 per cent rows and other multiples and 13 per cent apartments. This mix is expected to change over the course of the forecast so that over the 2024–2041 period about 43 per cent of new housing units are expected to be singles/semis, 19 per cent rows and other multiples and 38 per cent apartments. The higher share of apartment units in the later part of the forecast reflects the shrinking of the City’s land supply and a shift towards intensification of existing urban areas within Brampton’s Urban Growth Centre. The forecast of population in new units is shown in Tables A.7 and A.8.
HEMSON
55

E. NON-RESIDENTIAL SPACE FORECAST BASED ON THE FORECAST OF EMPLOYMENT (TABLES A.9 AND A.10)
City-wide non-residential development charges are calculated on a per square metre basis. Therefore, as required by the DCA, a forecast for non-residential building space is provided. Consistent with the residential forecast, the non-residential building space forecast covers a period from 2014 to ultimate development (2041). The 10-year forecast period (2014–2023) is used for “soft” services and the forecast to ultimate development is used for engineered services (e.g. roads and related). The non-residential building space used in this study is based on the employment forecast.
The forecast of employment in the City is separated into three categories. They are:
Population-related employment – employment scattered through the community including most retail and institutional employment and home-based employment;
Major office employment – employment in office buildings of 20,000 square feet or greater; and
Employment land employment – the mix of commercial and industrial activities occurring in what are typically (but somewhat inaccurately) called industrial areas.
The non-residential space forecast prepared for development charges purposes is based on these employment forecasts and described below.
1. Population-Related Employment and Space Forecast
In 2013, approximately 80,780 or 44 per cent of the City’s 185,570 employees are employed in population-related activities. City-wide population-related employment is forecast to grow by 34 per cent between 2013 and 2023 to a total of 108,410 employees. Growth in the period following 2023 is expected to be modest with total population-related employment increasing to 134,120 at ultimate development.
It is estimated that retail and commercial employment represents a majority of the City’s current population-related employment. Retail and other commercial jobs are expected to comprise 50 per cent of population-related employment growth throughout the forecast. For converting population-related employment growth to building space a factor of 40 square metre per employee is used.
Over the 10-year planning period 2014–2023, about 1.02 million square metre of building space is forecast to be added in this category. Over the period to build-out 2.03 million square metres will be added.
HEMSON
56

2. Major Office Employment and Space Forecast
In 2013, 13,590 workers or 7 per cent of the City's total employment is employed in the major office category. In the 10-year forecast period Brampton’s major office employment is forecast to increase by 83 percent to 24,850 employees. At ultimate development 47,290 employees are forecast to be employed in the major office category.
While major office space has a high profile in the community, employment in this category is not a large part of the existing base in Brampton (7.5%). This share of total employment is expected to continue into the future with the development of the City’s Urban Growth Centre.
A ratio of 27 m2 per employee is used in the forecast to estimate future major office building space. Approximately 304,000 m2 of major office space is forecast to be added by 2023. By ultimate development about 910,000 m2 is forecast.
3. Employment Land Forecast
Employment within designated employment lands is the largest category of employment in Brampton, and this is expected to remain the case throughout the forecast. Typical operations that occur on employment lands include manufacturing, distribution and smaller offices.
In 2013, an estimated 91,200 people, or 49 per cent of the City’s total employment, were employed in the employment lands category. With the development of the west Brampton employment area this amount is expected to grow by 30 per cent over the 10-year forecast period from 2014–2023 and by 54 per cent to ultimate development.
Growth in building space on employment lands is forecast by applying a ratio of 135 m2 per employee. Approximately 3.65 million m2 are forecast to be added by 2023 and 6.58 million m2 are expected to be added by 2041.
HEMSON
57

TABLE A.1City of BramptonHistoric Population, Households & Employment
Mid-Year Population Growth Growth % Households Growth Growth % HH Size Employment Growth Growth % Activity Rate
2001 325,400 - - 97,600 - - 3.33 133,640 - - 41.1%2002 344,661 19,261 5.9% 102,699 5,099 5.2% 3.36 137,820 4,180 3.1% 40.0%2003 365,062 20,401 5.9% 108,064 5,365 5.2% 3.38 142,131 4,311 3.1% 38.9%2004 386,670 21,608 5.9% 113,709 5,645 5.2% 3.40 146,577 4,446 3.1% 37.9%2005 409,558 22,888 5.9% 119,649 5,940 5.2% 3.42 151,162 4,585 3.1% 36.9%2006 433,800 24,242 5.9% 125,900 6,251 5.2% 3.45 155,890 4,728 3.1% 35.9%2007 450,486 16,686 3.8% 130,261 4,361 3.5% 3.46 159,009 3,119 2.0% 35.3%2008 467,814 17,328 3.8% 134,773 4,512 3.5% 3.47 162,190 3,181 2.0% 34.7%2009 485,808 17,994 3.8% 139,442 4,669 3.5% 3.48 165,435 3,245 2.0% 34.1%2010 504,495 18,687 3.8% 144,272 4,830 3.5% 3.50 168,744 3,310 2.0% 33.4%2011 523,900 19,405 3.8% 149,270 4,998 3.5% 3.51 172,120 3,376 2.0% 32.9%2012 541,300 17,400 3.3% 153,930 4,660 3.1% 3.52 178,730 6,610 3.8% 33.0%2013 557,800 16,500 3.0% 158,240 4,310 2.8% 3.53 185,570 6,840 3.8% 33.3%
2004-2013 192,738 52.8% 50,176 46.4% 43,439 30.6%Source: Statistics Canada, Census of Canada
HEMSON
58

TABLE A.2
Household Size by Unit Type by Period of Construction
Geography: Brampton CY ( 26.5%)
Period of Construction
Pre 1945 1946-1960 1961-1970 1971-1980 1981-1985 1986-1990 1991-1995 1996-2000 2001-2005 2006-2011 Pre 2001 2001-2011 Total
SinglesHousehold Population 2,865 8,190 16,635 25,435 26,345 27,585 18,420 32,675 88,135 55,955 158,150 144,090 302,240
Households 975 2,890 5,870 8,065 7,655 7,435 4,745 7,960 20,365 13,035 45,595 33,400 78,995
Household Size 2.94 2.83 2.83 3.15 3.44 3.71 3.88 4.10 4.33 4.29 3.47 4.31 3.83
SemisHousehold Population 430 1,225 5,785 11,465 2,315 1,420 3,400 10,875 24,980 11,675 36,915 36,655 73,570
Households 130 385 1,805 3,630 665 440 905 2,910 6,435 3,035 10,870 9,470 20,340
Household Size 3.31 3.18 3.20 3.16 3.48 3.23 3.76 3.74 3.88 3.85 3.40 3.87 3.62
Singles & SemisHousehold Population 3,295 9,415 22,420 36,900 28,660 29,005 21,820 43,550 113,115 67,630 195,065 180,745 375,810
Households 1,105 3,275 7,675 11,695 8,320 7,875 5,650 10,870 26,800 16,070 56,465 42,870 99,335
Household Size 2.98 2.87 2.92 3.16 3.44 3.68 3.86 4.01 4.22 4.21 3.45 4.22 3.78
RowsHousehold Population 320 1,005 3,590 11,120 4,230 4,275 5,240 7,925 9,580 8,595 37,705 18,175 55,880
Households 95 340 1,125 3,760 1,290 1,335 1,605 2,495 2,705 2,790 12,045 5,495 17,540
Household Size 3.37 2.96 3.19 2.96 3.28 3.20 3.26 3.18 3.54 3.08 3.13 3.31 3.19
Apartments (no duplex) - 1BR or LessHousehold Population 230 760 1,685 2,635 1,860 1,840 1,260 915 540 1,355 11,185 1,895 13,080
Households 170 410 1,005 1,490 960 940 605 355 280 965 5,935 1,245 7,180
Household Size 1.35 1.85 1.68 1.77 1.94 1.96 2.08 2.58 1.93 1.40 1.88 1.52 1.82
Apartments (no duplex) - 2BR or MoreHousehold Population 935 2,655 5,745 13,215 7,230 5,250 3,055 1,785 1,480 2,205 39,870 3,685 43,555
Households 310 940 2,120 4,475 2,525 2,125 1,170 725 550 955 14,390 1,505 15,895
Household Size 3.02 2.82 2.71 2.95 2.86 2.47 2.61 2.46 2.69 2.31 2.77 2.45 2.74
All Apartments (no duplex)Household Population 1,495 3,645 7,675 16,355 9,130 7,245 4,085 2,445 2,040 3,780 52,075 5,820 57,895
Households 645 1,460 3,275 6,225 3,540 3,105 1,720 1,020 800 1,965 20,990 2,765 23,755
Household Size 2.32 2.50 2.34 2.63 2.58 2.33 2.38 2.40 2.55 1.92 2.48 2.10 2.44
Duplex UnitsHousehold Population 305 810 1,435 2,920 4,805 6,655 4,080 4,545 4,945 1,120 25,555 6,065 31,620
Households 135 360 520 875 1,270 1,780 1,070 1,115 1,185 335 7,125 1,520 8,645
Household Size 2.26 2.25 2.76 3.34 3.78 3.74 3.81 4.08 4.17 3.34 3.59 3.99 3.66
All UnitsHousehold Population 5,110 14,065 33,685 64,375 42,020 40,525 31,145 53,920 124,735 80,005 284,845 204,740 489,585
Households 1,845 5,075 12,075 21,680 13,150 12,315 8,975 14,385 30,305 20,825 89,500 51,130 140,630
Household Size 2.77 2.77 2.79 2.97 3.20 3.29 3.47 3.75 4.12 3.84 3.18 4.00 3.48
Source: Statistics Canada, 2011 National Household Survey Special Run. HEMSON
59

TABLE A.3 TABLE A.4Population, Household & Employment Forecast Summary Forecast Population & Household Growth Summary
Population Population Household Household Pop'n in Employment Employment Mid-Year Population Households Employment PPU Activity Rate Mid-Year Growth Growth % Growth Growth % New HHs Growth Growth %
2011 523,900 149,270 172,120 3.51 32.9% 20112012 541,300 153,930 178,730 3.52 33.0% 20122013 557,800 158,240 185,570 3.53 33.3% 20132014 571,700 161,875 192,370 3.53 33.6% 2014 13,900 2.3% 3,635 2.3% 14,619 6,800 3.7%2015 587,300 165,995 199,590 3.54 34.0% 2015 15,600 2.5% 4,120 2.5% 16,034 7,220 3.8%2016 603,200 170,287 206,800 3.54 34.3% 2016 15,900 2.6% 4,292 2.6% 16,131 7,210 3.6%2017 617,700 174,787 213,720 3.53 34.6% 2017 14,500 2.6% 4,500 2.6% 17,281 6,920 3.3%2018 632,500 179,437 220,520 3.52 34.9% 2018 14,800 2.7% 4,650 2.7% 17,586 6,800 3.2%2019 647,300 184,137 227,250 3.52 35.1% 2019 14,800 2.6% 4,700 2.6% 17,523 6,730 3.1%2020 661,500 188,687 233,830 3.51 35.3% 2020 14,200 2.5% 4,550 2.5% 16,894 6,580 2.9%2021 675,000 193,065 240,230 3.50 35.6% 2021 13,500 2.3% 4,378 2.3% 16,135 6,400 2.7%2022 688,400 197,220 245,820 3.49 35.7% 2022 13,400 2.2% 4,155 2.2% 15,096 5,590 2.3%2023 701,900 201,405 251,480 3.49 35.8% 2023 13,500 2.1% 4,185 2.1% 15,097 5,660 2.3%2024 715,100 205,560 257,180 3.48 36.0% 2024 13,200 2.1% 4,155 2.1% 14,846 5,700 2.3%2025 728,500 209,765 262,920 3.47 36.1% 2025 13,400 2.0% 4,205 2.0% 14,925 5,740 2.2%2026 741,900 214,021 268,560 3.47 36.2% 2026 13,400 2.0% 4,256 2.0% 14,983 5,640 2.1%2027 756,100 218,256 274,100 3.46 36.3% 2027 14,200 2.0% 4,235 2.0% 14,812 5,540 2.1%2028 770,400 222,481 279,510 3.46 36.3% 2028 14,300 1.9% 4,225 1.9% 14,771 5,410 2.0%2029 784,300 226,631 284,540 3.46 36.3% 2029 13,900 1.9% 4,150 1.9% 14,515 5,030 1.8%2030 796,800 230,381 289,170 3.46 36.3% 2030 12,500 1.7% 3,750 1.7% 12,879 4,630 1.6%2031 804,200 232,771 292,830 3.45 36.4% 2031 7,400 1.0% 2,390 1.0% 7,275 3,660 1.3%2032 811,400 234,936 296,260 3.45 36.5% 2032 7,200 0.9% 2,165 0.9% 6,441 3,430 1.2%2033 817,200 236,706 299,150 3.45 36.6% 2033 5,800 0.8% 1,770 0.8% 4,804 2,890 1.0%2034 822,200 238,291 301,660 3.45 36.7% 2034 5,000 0.7% 1,585 0.7% 4,043 2,510 0.8%2035 827,200 239,861 304,080 3.45 36.8% 2035 5,000 0.7% 1,570 0.7% 3,992 2,420 0.8%2036 832,100 241,394 306,540 3.45 36.8% 2036 4,900 0.6% 1,534 0.6% 3,866 2,460 0.8%2037 837,000 242,869 309,410 3.45 37.0% 2037 4,900 0.6% 1,475 0.6% 3,686 2,870 0.9%2038 841,600 244,279 312,310 3.45 37.1% 2038 4,600 0.6% 1,410 0.6% 3,479 2,900 0.9%2039 846,200 245,679 315,400 3.44 37.3% 2039 4,600 0.6% 1,400 0.6% 3,461 3,090 1.0%2040 850,800 247,049 318,480 3.44 37.4% 2040 4,600 0.6% 1,370 0.6% 3,380 3,080 1.0%2041 855,000 248,326 321,360 3.44 37.6% 2041 4,200 0.5% 1,276 0.5% 3,111 2,880 0.9%
2014-2023 144,100 25.8% 43,165 27.3% 162,396 65,910 35.5%2024-2031 102,300 14.6% 31,366 15.6% 109,006 41,350 16.4%2014-2031 246,400 44.2% 74,531 47.1% 271,403 107,260 57.8%2032-2041 50,800 6.3% 15,555 6.7% 40,263 28,530 9.7%2014-2041 297,200 53.3% 90,086 56.9% 311,666 135,790 73.2%
HEMSON
60

TABLE A.5 TABLE A.6Households By Unit Type Household Growth By Unit Type
Singles Semis Rows Apts Total HHs Singles Semis Rows Apts Total HHs
2011 79,005 20,240 17,215 32,810 149,270 2011 - - - - -2012 81,955 20,820 17,895 33,260 153,930 2012 2,950 580 680 450 4,660 2013 84,710 21,700 18,419 33,410 158,240 2013 2,755 880 524 150 4,310 2014 86,870 22,420 19,094 33,490 161,875 2014 2,160 720 675 80 3,635 2015 89,120 23,070 19,994 33,810 165,995 2015 2,250 650 900 320 4,120 2016 91,323 23,629 20,885 34,449 170,287 2016 2,202 559 891 639 4,292 2017 93,823 24,229 21,785 34,949 174,787 2017 2,500 600 900 500 4,500 2018 96,273 24,879 22,735 35,549 179,437 2018 2,450 650 950 600 4,650 2019 98,673 25,529 23,685 36,249 184,137 2019 2,400 650 950 700 4,700 2020 101,023 26,129 24,585 36,949 188,687 2020 2,350 600 900 700 4,550 2021 103,254 26,720 25,427 37,664 193,065 2021 2,232 590 842 715 4,378 2022 105,254 27,300 26,252 38,414 197,220 2022 2,000 580 825 750 4,155 2023 107,254 27,860 27,077 39,214 201,405 2023 2,000 560 825 800 4,185 2024 109,204 28,390 27,902 40,064 205,560 2024 1,950 530 825 850 4,155 2025 111,154 28,920 28,727 40,964 209,765 2025 1,950 530 825 900 4,205 2026 113,107 29,435 29,552 41,927 214,021 2026 1,953 515 825 963 4,256 2027 115,007 29,945 30,377 42,927 218,256 2027 1,900 510 825 1,000 4,235 2028 116,907 30,445 31,202 43,927 222,481 2028 1,900 500 825 1,000 4,225 2029 118,807 30,945 31,952 44,927 226,631 2029 1,900 500 750 1,000 4,150 2030 120,407 31,395 32,652 45,927 230,381 2030 1,600 450 700 1,000 3,750 2031 120,895 31,793 33,139 46,944 232,771 2031 488 397 487 1,018 2,390 2032 121,395 32,068 33,489 47,984 234,936 2032 500 275 350 1,040 2,165 2033 121,620 32,218 33,839 49,029 236,706 2033 225 150 350 1,045 1,770 2034 121,720 32,308 34,189 50,074 238,291 2034 100 90 350 1,045 1,585 2035 121,810 32,398 34,539 51,114 239,861 2035 90 90 350 1,040 1,570 2036 121,892 32,479 34,873 52,150 241,394 2036 82 81 334 1,035 1,534 2037 121,972 32,554 35,173 53,170 242,869 2037 80 75 300 1,020 1,475 2038 122,052 32,624 35,423 54,180 244,279 2038 80 70 250 1,010 1,410 2039 122,132 32,694 35,673 55,180 245,679 2039 80 70 250 1,000 1,400 2040 122,202 32,764 35,923 56,160 247,049 2040 70 70 250 980 1,370 2041 122,270 32,831 36,120 57,104 248,326 2041 68 67 197 944 1,276
HEMSON
61

TABLE A.7 TABLE A.8PPU in New Units Population in New Units
Total PopSingles Semis Rows Apts Total HHs Singles Semis Rows Apts In New Units
2011 4.31 3.87 3.31 2.10 4.00 20112012 4.32 3.88 3.33 2.09 20122013 4.32 3.89 3.36 2.08 20132014 4.33 3.91 3.39 2.07 2014 9,354 2,812 2,288 165 14,619 2015 4.34 3.92 3.42 2.05 2015 9,756 2,546 3,075 657 16,034 2016 4.34 3.93 3.44 2.04 2016 9,561 2,197 3,070 1,303 16,131 2017 4.33 3.92 3.44 2.03 2017 10,821 2,351 3,092 1,017 17,281 2018 4.32 3.91 3.43 2.03 2018 10,573 2,540 3,255 1,217 17,586 2019 4.30 3.90 3.42 2.02 2019 10,327 2,534 3,246 1,417 17,523 2020 4.29 3.89 3.41 2.02 2020 10,082 2,332 3,067 1,413 16,894 2021 4.28 3.88 3.40 2.01 2021 9,545 2,289 2,862 1,439 16,135 2022 4.27 3.87 3.39 2.01 2022 8,541 2,246 2,800 1,509 15,096 2023 4.26 3.87 3.39 2.01 2023 8,528 2,165 2,796 1,607 15,097 2024 4.26 3.86 3.39 2.01 2024 8,302 2,047 2,793 1,705 14,846 2025 4.25 3.86 3.38 2.00 2025 8,289 2,044 2,789 1,803 14,925 2026 4.24 3.85 3.38 2.00 2026 8,287 1,985 2,784 1,927 14,983 2027 4.24 3.85 3.38 2.00 2027 8,062 1,964 2,785 2,000 14,812 2028 4.24 3.85 3.38 2.00 2028 8,061 1,925 2,785 2,000 14,771 2029 4.24 3.85 3.38 2.00 2029 8,059 1,925 2,531 1,999 14,515 2030 4.24 3.85 3.37 2.00 2030 6,785 1,732 2,362 1,999 12,879 2031 4.24 3.85 3.37 2.00 2031 2,068 1,530 1,644 2,034 7,275 2032 4.24 3.85 3.38 2.00 2032 2,122 1,059 1,181 2,079 6,441 2033 4.25 3.85 3.38 2.00 2033 955 578 1,182 2,089 4,804 2034 4.25 3.86 3.38 2.00 2034 425 347 1,182 2,090 4,043 2035 4.25 3.86 3.38 2.00 2035 383 347 1,182 2,080 3,992 2036 4.26 3.86 3.38 2.00 2036 350 315 1,130 2,071 3,866 2037 4.26 3.86 3.38 2.00 2037 341 290 1,014 2,042 3,686 2038 4.26 3.86 3.38 2.00 2038 341 271 845 2,023 3,479 2039 4.27 3.87 3.38 2.00 2039 341 271 846 2,003 3,461 2040 4.27 3.87 3.38 2.00 2040 299 271 846 1,964 3,380 2041 4.27 3.87 3.39 2.01 2041 291 259 667 1,893 3,111
2014-2023 97,088 24,013 29,551 11,744 162,3962024-2031 57,914 15,152 20,473 15,467 109,0062014-2031 155,002 39,165 50,024 27,211 271,403
2032-2041 5,847 4,007 10,075 20,334 40,2632014-2041 160,849 43,172 60,099 47,545 311,666
HEMSON
62
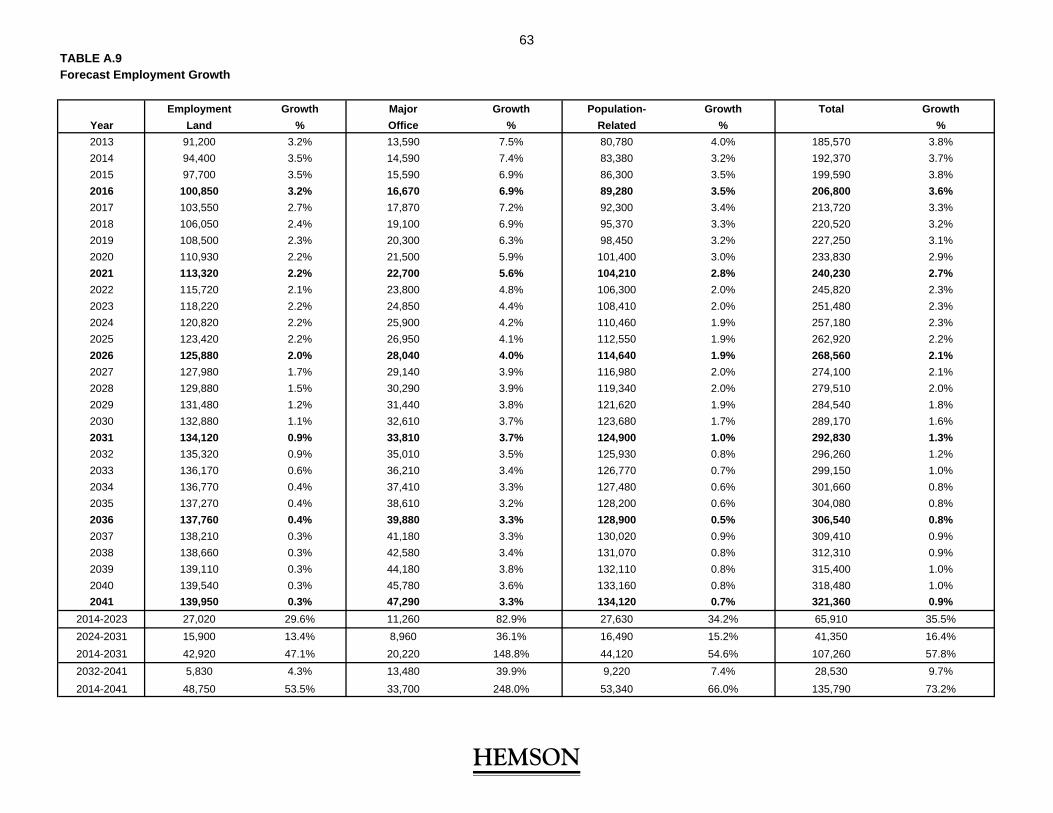
TABLE A.9Forecast Employment Growth
Employment Growth Major Growth Population- Growth Total Growth
Year Land % Office % Related % %
2013 91,200 3.2% 13,590 7.5% 80,780 4.0% 185,570 3.8%
2014 94,400 3.5% 14,590 7.4% 83,380 3.2% 192,370 3.7%
2015 97,700 3.5% 15,590 6.9% 86,300 3.5% 199,590 3.8%
2016 100,850 3.2% 16,670 6.9% 89,280 3.5% 206,800 3.6%
2017 103,550 2.7% 17,870 7.2% 92,300 3.4% 213,720 3.3%
2018 106,050 2.4% 19,100 6.9% 95,370 3.3% 220,520 3.2%
2019 108,500 2.3% 20,300 6.3% 98,450 3.2% 227,250 3.1%
2020 110,930 2.2% 21,500 5.9% 101,400 3.0% 233,830 2.9%
2021 113,320 2.2% 22,700 5.6% 104,210 2.8% 240,230 2.7%
2022 115,720 2.1% 23,800 4.8% 106,300 2.0% 245,820 2.3%
2023 118,220 2.2% 24,850 4.4% 108,410 2.0% 251,480 2.3%
2024 120,820 2.2% 25,900 4.2% 110,460 1.9% 257,180 2.3%
2025 123,420 2.2% 26,950 4.1% 112,550 1.9% 262,920 2.2%
2026 125,880 2.0% 28,040 4.0% 114,640 1.9% 268,560 2.1%
2027 127,980 1.7% 29,140 3.9% 116,980 2.0% 274,100 2.1%
2028 129,880 1.5% 30,290 3.9% 119,340 2.0% 279,510 2.0%
2029 131,480 1.2% 31,440 3.8% 121,620 1.9% 284,540 1.8%
2030 132,880 1.1% 32,610 3.7% 123,680 1.7% 289,170 1.6%
2031 134,120 0.9% 33,810 3.7% 124,900 1.0% 292,830 1.3%
2032 135,320 0.9% 35,010 3.5% 125,930 0.8% 296,260 1.2%
2033 136,170 0.6% 36,210 3.4% 126,770 0.7% 299,150 1.0%
2034 136,770 0.4% 37,410 3.3% 127,480 0.6% 301,660 0.8%
2035 137,270 0.4% 38,610 3.2% 128,200 0.6% 304,080 0.8%
2036 137,760 0.4% 39,880 3.3% 128,900 0.5% 306,540 0.8%
2037 138,210 0.3% 41,180 3.3% 130,020 0.9% 309,410 0.9%
2038 138,660 0.3% 42,580 3.4% 131,070 0.8% 312,310 0.9%
2039 139,110 0.3% 44,180 3.8% 132,110 0.8% 315,400 1.0%
2040 139,540 0.3% 45,780 3.6% 133,160 0.8% 318,480 1.0%
2041 139,950 0.3% 47,290 3.3% 134,120 0.7% 321,360 0.9%
2014-2023 27,020 29.6% 11,260 82.9% 27,630 34.2% 65,910 35.5%
2024-2031 15,900 13.4% 8,960 36.1% 16,490 15.2% 41,350 16.4%
2014-2031 42,920 47.1% 20,220 148.8% 44,120 54.6% 107,260 57.8%
2032-2041 5,830 4.3% 13,480 39.9% 9,220 7.4% 28,530 9.7%
2014-2041 48,750 53.5% 33,700 248.0% 53,340 66.0% 135,790 73.2%
HEMSON
63
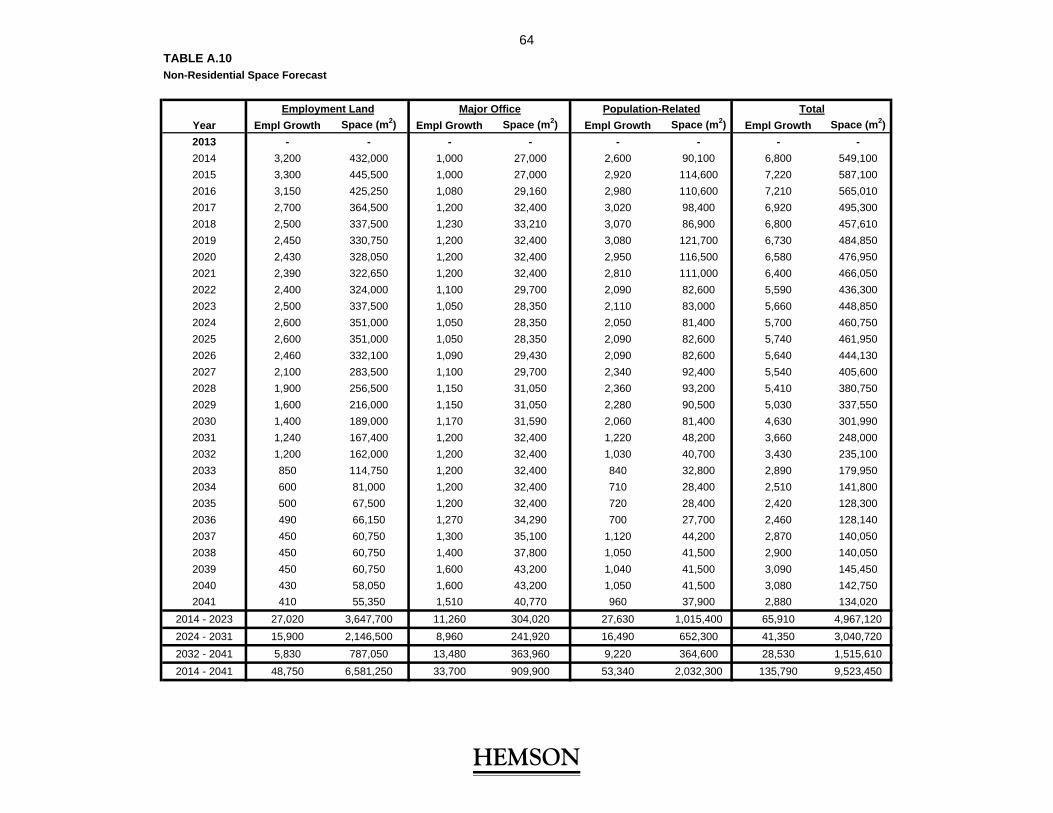
TABLE A.10Non-Residential Space Forecast
Year Empl Growth Space (m2) Empl Growth Space (m2) Empl Growth Space (m2) Empl Growth Space (m2)
2013 - - - - - - - -
2014 3,200 432,000 1,000 27,000 2,600 90,100 6,800 549,100
2015 3,300 445,500 1,000 27,000 2,920 114,600 7,220 587,100
2016 3,150 425,250 1,080 29,160 2,980 110,600 7,210 565,010
2017 2,700 364,500 1,200 32,400 3,020 98,400 6,920 495,300
2018 2,500 337,500 1,230 33,210 3,070 86,900 6,800 457,610
2019 2,450 330,750 1,200 32,400 3,080 121,700 6,730 484,850
2020 2,430 328,050 1,200 32,400 2,950 116,500 6,580 476,950
2021 2,390 322,650 1,200 32,400 2,810 111,000 6,400 466,050
2022 2,400 324,000 1,100 29,700 2,090 82,600 5,590 436,300
2023 2,500 337,500 1,050 28,350 2,110 83,000 5,660 448,850
2024 2,600 351,000 1,050 28,350 2,050 81,400 5,700 460,750
2025 2,600 351,000 1,050 28,350 2,090 82,600 5,740 461,950
2026 2,460 332,100 1,090 29,430 2,090 82,600 5,640 444,130
2027 2,100 283,500 1,100 29,700 2,340 92,400 5,540 405,600
2028 1,900 256,500 1,150 31,050 2,360 93,200 5,410 380,750
2029 1,600 216,000 1,150 31,050 2,280 90,500 5,030 337,550
2030 1,400 189,000 1,170 31,590 2,060 81,400 4,630 301,990
2031 1,240 167,400 1,200 32,400 1,220 48,200 3,660 248,000
2032 1,200 162,000 1,200 32,400 1,030 40,700 3,430 235,100
2033 850 114,750 1,200 32,400 840 32,800 2,890 179,950
2034 600 81,000 1,200 32,400 710 28,400 2,510 141,800
2035 500 67,500 1,200 32,400 720 28,400 2,420 128,300
2036 490 66,150 1,270 34,290 700 27,700 2,460 128,140
2037 450 60,750 1,300 35,100 1,120 44,200 2,870 140,050
2038 450 60,750 1,400 37,800 1,050 41,500 2,900 140,050
2039 450 60,750 1,600 43,200 1,040 41,500 3,090 145,450
2040 430 58,050 1,600 43,200 1,050 41,500 3,080 142,750
2041 410 55,350 1,510 40,770 960 37,900 2,880 134,020
2014 - 2023 27,020 3,647,700 11,260 304,020 27,630 1,015,400 65,910 4,967,120
2024 - 2031 15,900 2,146,500 8,960 241,920 16,490 652,300 41,350 3,040,720
2032 - 2041 5,830 787,050 13,480 363,960 9,220 364,600 28,530 1,515,610
2014 - 2041 48,750 6,581,250 33,700 909,900 53,340 2,032,300 135,790 9,523,450
Employment Land Major Office Population-Related Total
HEMSON
64

APPENDIX B
GENERAL SERVICES TECHNICAL APPENDIX
HEMSON
65

GENERAL SERVICES TECHNICAL APPENDICES INTRODUCTION
AND OVERVIEW
The following seven appendices provide the detailed analysis undertaken to establish the development charge rates for each of the general services in the City of Brampton:
Appendix B.1 General Government
Appendix B.2 Library Services
Appendix B.3 Fire Services
Appendix B.4 Recreation Services
Appendix B.5 Public Works: Buildings & Fleet
Appendix B.6 Parking
Appendix B.7 Transit
Every appendix contains a set of three tables. The tables provide the background data and analysis undertaken to arrive at the calculated development charge rates for that particular service. An overview of the content and purpose of each of the tables is given below.
TABLE 1 HISTORIC SERVICE LEVELS
Table 1 presents the data used to determine the 10-year historic service level. The DCA and Ontario Regulation 82/98 require that development charges be set at a level no higher than the average service level provided in the municipality over the 10-year period immediately preceding the preparation of the background study, on a service by service basis. For the purpose of this study, the historic inventory period is defined as 2004–2013.
O. Reg. 82/98 requires that, when defining and determining historic service levels, both the quantity and quality of service be taken into consideration. In most cases, the service levels are initially established in quantitative terms. For example, service levels for buildings are presented in terms of square feet. The qualitative aspect is introduced
HEMSON
66

by considering the monetary value of the facility or service. In the case of buildings, for example, the cost would be shown in terms of cost per square foot to replace or construct a facility of the same quality. This approach helps to ensure that the development-related capital facilities that are to be funded by new growth reflect, not only the quantity (number and size), but also the quality (replacement value or cost) of service provided by the municipality in the past. Both the quantitative and qualitative aspects of service levels used in the current analysis are based on information provided by City staff in consultation with Hemson. This information is generally based on historical records and experience with costs to acquire or construct similar facilities, equipment and infrastructure.
Table 1 also shows the calculation of the “maximum allowable” funding envelope, net of uncommitted excess capacity and the legislated ten per cent reduction (for all applicable services). The maximum allowable is defined as the 10-year historic service level (expressed as either $/capita, $/household or $/population & employment) multiplied by the forecast increase in net population growth, net household growth, or net population and employment growth, over the future planning period. The resulting figure is the value of capital infrastructure that would have to be constructed for that particular service so that the 10-year historic service level is maintained.
There is also a requirement in the DCA to consider “excess capacity” within the City’s existing infrastructure that may be available to partially meet the future servicing requirements. If Council has expressed its intent, before or at the time the capacity was created, to recoup the cost of providing the capacity from new development, it is considered “committed excess capacity” under the DCA, and the associated capital cost is eligible for recovery. Should notional “uncommitted excess capacity” exist, if it is determined to be available to service new development, appropriate adjustments are made to the calculations.
TABLE 2 2014 – 2023 PROVISIONAL DEVELOPMENT-RELATED CAPITAL BUDGET AND CALCULATION OF THE “UNADJUSTED” DEVELOPMENT CHARGES
In order to impose a development charge, it is not sufficient to merely base the charge on historic service levels. The DCA requires that Council express its intent to provide future capital facilities to support future growth. Based on the growth forecasts presented in Appendix A, City staff, in collaboration with consultants, have
HEMSON
67

developed a development-related capital forecast which sets out the projects required to service anticipated growth for the 10-year period from 2014–2023.
To determine the share of the program that is eligible for recovery through development charges, the project costs are reduced by any anticipated grants, subsidies or other recoveries, “replacement” shares and benefit to existing shares, and the legislated “10 per cent reduction” for any eligible service.
A replacement share occurs when a new facility will, at least in part, replace a facility that is demolished, redeployed or will otherwise not be available to serve its former function. The replacement share of the capital program is not deemed to be development-related and is therefore removed from the development charge calculation. The capital cost for replacement will require funding from non-development charge sources, typically property taxes.
When calculating development charges, the development-related net capital cost must be reduced by 10 per cent for all services except fire services and engineered services (DCA s.5.(1)8.). The 10 per cent discount is therefore applied to all general services considered in this appendix with the exception of Fire Services and Public Works: Buildings and Fleet. As with replacement shares, the 10 per cent mandatory reduction must be funded from non-development charge sources.
The capital program less any replacement shares or benefit to existing shares, 10 per cent discounts, yields the development-related costs. Although deemed development-related, not all of the net development-related capital program may be recoverable from development charges in the period from 2014–2023. For some services, reserve fund balances may be available to fund a share of the program. In addition, for some services, a portion of the capital program may service growth occurring after 2023. This portion of the capital program is deemed “pre-built” service capacity and is considered as committed excess capacity to be recovered under future development charges. The capital costs associated with pre-built service capacity are also removed from the development charge calculation.
The remaining portion of the net capital program represents the development-related cost that may be included in the development charge. In all cases, as required, this amount is equal to or less than the maximum allowable capital amount as calculated
HEMSON
68
at the end of Table 1. The result is the discounted development-related net capital costs eligible for recovery against growth over the forecast period from 2014–2023.
Calculation of the Unadjusted Development Charges Rates
The section below the capital program displays the calculation of the “unadjusted” development charge rates. The term “unadjusted” development charge is used to distinguish the charge that is calculated prior to cash flow financing considerations. The cash flow analysis is shown in Table 3.
The first step in determining the unadjusted development charge rate is to allocate the development-related net capital cost between the residential and non-residential sectors. For General Government, Fire Services, Public Works, Parking and Transit, the development-related costs have been apportioned as 71 per cent residential and 29 per cent non-residential. This apportionment is based on the anticipated shares of population in new units and employment growth over the 10-year forecast period.
The development-related costs associated with the Library Services and Recreation Services have been allocated 100 per cent to the residential sector, as the need for these services is generally driven by residential development.
The residential share of the 2014–2023 DC eligible costs are then divided by the forecast population growth in new units. This gives the unadjusted residential development charge per capita. The non-residential development-related net capital costs are divided by the forecast increase in non-residential gross floor area (GFA). This yields a charge per square metre of new non-residential development.
TABLE 3 CASH FLOW ANALYSIS
A cash flow analysis is also undertaken to account for the timing of projects and receipt of development charges. Interest earnings or borrowing costs, therefore, are accounted for in the calculation as allowed under the DCA. Based on the growth forecast, the analysis calculates the development charge rate required to finance the net development-related capital spending plan, including provisions for any borrowing costs or interest earnings on the reserve funds. The cash flow analysis is designed so that the closing cash balance at the end of the planning period is as close to nil as possible.
HEMSON
69

In order to determine appropriate development charge rates reflecting borrowing and earnings necessary to support the net development-related funding requirement, assumptions are used for the inflation rate and interest rate. An inflation rate of 2 per cent is used for the funding requirements, an interest rate of 5.5 per cent is used for borrowing on the funds, and an interest rate of 3.5 per cent is applied to positive balances.
Table 3 displays the results of the cash flow analysis and provides the adjusted or final per capita residential and per square metre (of GFA) non-residential development charges.
HEMSON
70
APPENDIX B.1
GENERAL GOVERNMENT
HEMSON
71

APPENDIX B.1
GENERAL GOVERNMENT
The DCA allows the cost of development-related studies and other general government functions to be included in the calculation of the development charges, as long as they are permitted under the legislation. Consistent with s. 5 (1) 7 of the DCA, the eligible development-related net capital cost for the provision of studies and permitted general government expenditures is reduced by 10 per cent in calculating the development charges.
TABLE 1 HISTORIC SERVICE LEVELS
General Government service consists of two components, general government services relating to buildings (e.g. animal control, courthouse) and fleet; and general government service for development-related studies.
General Government services for buildings in Brampton are currently provided out of two City owned facilities valued at $19.91 million. The land associated with this space totals 4.16 acres and is valued at $4.79 million. Materials and equipment are valued at $529,100. Fleet and maintenance equipment add another $2.34 million to the value of the inventory.
The replacement value of the 2013 inventory of capital assets for General Government is $27.57 million and the average historic service level over 10 years is $42.34 per population and employment. The historic service level, multiplied by the ten-year forecast of net population and employment growth, results in a ten-year maximum allowable funding envelope of $8.89 million (210,010 net population and employment growth x historic service level of $42.34/population and employment).
No uncommitted excess capacity has been identified in this service. The general government funding envelope must be reduced by ten per cent as required under the DCA. The resulting net maximum allowable funding envelope brought forward to the development charges calculation is reduced to $8.00 million.
The historic service level cap does not apply to development-related studies.
HEMSON
72
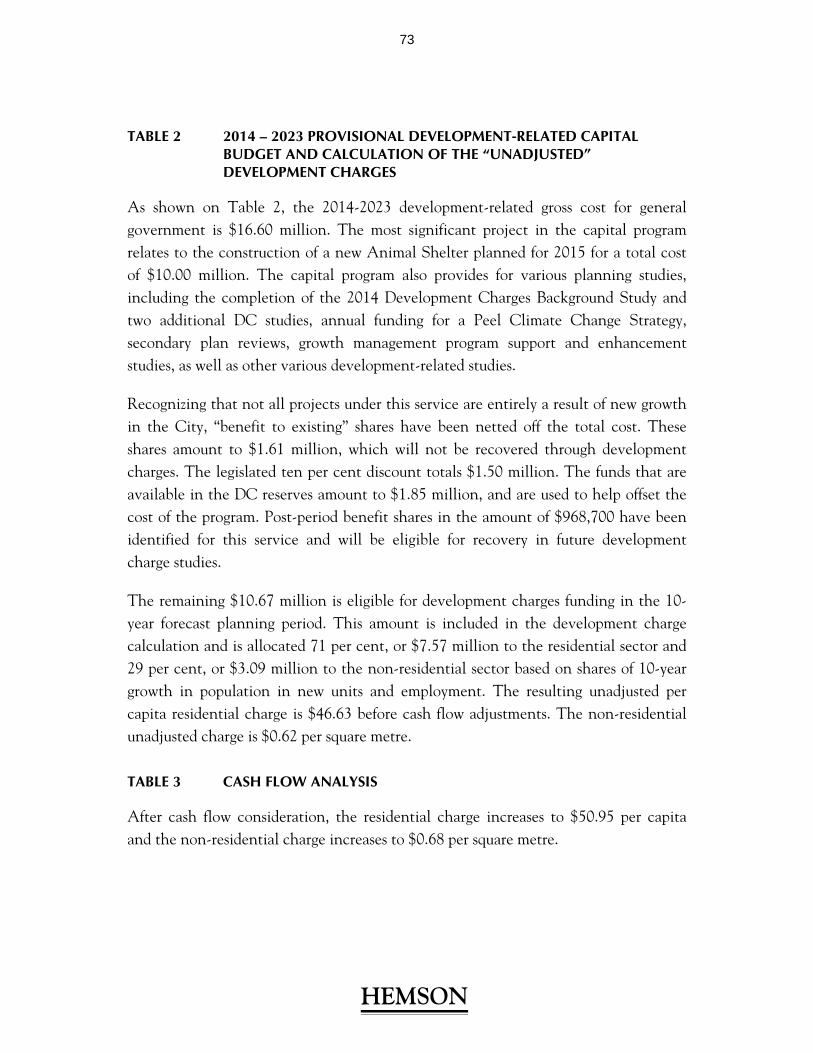
TABLE 2 2014 – 2023 PROVISIONAL DEVELOPMENT-RELATED CAPITAL BUDGET AND CALCULATION OF THE “UNADJUSTED” DEVELOPMENT CHARGES
As shown on Table 2, the 2014-2023 development-related gross cost for general government is $16.60 million. The most significant project in the capital program relates to the construction of a new Animal Shelter planned for 2015 for a total cost of $10.00 million. The capital program also provides for various planning studies, including the completion of the 2014 Development Charges Background Study and two additional DC studies, annual funding for a Peel Climate Change Strategy, secondary plan reviews, growth management program support and enhancement studies, as well as other various development-related studies.
Recognizing that not all projects under this service are entirely a result of new growth in the City, “benefit to existing” shares have been netted off the total cost. These shares amount to $1.61 million, which will not be recovered through development charges. The legislated ten per cent discount totals $1.50 million. The funds that are available in the DC reserves amount to $1.85 million, and are used to help offset the cost of the program. Post-period benefit shares in the amount of $968,700 have been identified for this service and will be eligible for recovery in future development charge studies.
The remaining $10.67 million is eligible for development charges funding in the 10-year forecast planning period. This amount is included in the development charge calculation and is allocated 71 per cent, or $7.57 million to the residential sector and 29 per cent, or $3.09 million to the non-residential sector based on shares of 10-year growth in population in new units and employment. The resulting unadjusted per capita residential charge is $46.63 before cash flow adjustments. The non-residential unadjusted charge is $0.62 per square metre.
TABLE 3 CASH FLOW ANALYSIS
After cash flow consideration, the residential charge increases to $50.95 per capita and the non-residential charge increases to $0.68 per square metre.
HEMSON
73

10-year Hist.Service Level$/pop & emp Total Net DC Recoverable $/capita $/sq.m $/capita $/sq.m
$42.34 $16,600 $10,667 $46.63 $0.62 $50.95 $0.68
2014-2023 Unadjusted AdjustedDevelopment Charge Development ChargeDevelopment-Related Capital Program ($000's)
GENERAL GOVERNMENT SUMMARY
HEMSON
74

GENERAL GOVERNMENT
INVENTORY OF CAPITAL ASSETS
BUILDINGS UNIT COST
Facility Name 2004 2005 2006 2007 2008 2009 2010 2011 2012 2013 ($/sq.ft)
Court House 58,488 58,488 58,488 58,488 58,488 58,488 58,488 58,488 58,488 58,488 $300
Animal Shelter $2,361.0 $2,361.0 $2,361.0 $2,361.0 $2,361.0 $2,361.0 $2,361.0 $2,361.0 $2,361.0 $2,361.0
Total (#) 58,488 58,488 58,488 58,488 58,488 58,488 58,488 58,488 58,488 58,488
Total ($000) $19,907.4 $19,907.4 $19,907.4 $19,907.4 $19,907.4 $19,907.4 $19,907.4 $19,907.4 $19,907.4 $19,907.4
LAND UNIT COST
Facility Name 2004 2005 2006 2007 2008 2009 2010 2011 2012 2013 ($/acre)
Court House 1.93 1.93 1.93 1.93 1.93 1.93 1.93 1.93 1.93 1.93 $1,500,000
Animal Shelter 2.23 2.23 2.23 2.23 2.23 2.23 2.23 2.23 2.23 2.23 $850,000
Total (acres) 4.16 4.16 4.16 4.16 4.16 4.16 4.16 4.16 4.16 4.16
Total ($000) $4,790.5 $4,790.5 $4,790.5 $4,790.5 $4,790.5 $4,790.5 $4,790.5 $4,790.5 $4,790.5 $4,790.5
MATERIALS AND EQUIPMENT
Description 2004 2005 2006 2007 2008 2009 2010 2011 2012 2013
Court House $497.5 $497.5 $497.5 $497.5 $497.5 $497.5 $497.5 $497.5 $497.5 $497.5
Animal Shelter $31.6 $31.6 $31.6 $31.6 $31.6 $31.6 $31.6 $31.6 $31.6 $31.6
Total ($000) $529.1 $529.1 $529.1 $529.1 $529.1 $529.1 $529.1 $529.1 $529.1 $529.1
APPENDIX B.1
TABLE 1 - PAGE 1
# of Square Feet
# of Acres
Total Value of Materials and Equipment ($000)
HEMSON
75

GENERAL GOVERNMENT
INVENTORY OF CAPITAL ASSETS
OTHER DEPT. FLEET & MAINTENANCE EQUIPMENT (#) UNIT COST
City-Owned Items 2004 2005 2006 2007 2008 2009 2010 2011 2012 2013 ($/Item)
CAR, STATION WAGONS - - - 20 19 19 19 18 14 9 $40,478
COMPACT PICKUPS - - - 1 1 1 1 1 1 - $25,667
COMPACT 4X4 - - - 21 24 28 28 27 39 38 $38,414
3/4 & 1 TON PICKUP - - - 2 2 2 2 2 2 2 $54,028
3/4 & 1 TON 4X4 PICKUPS - - - - - - - - 5 5 $47,810
COMPACT VANS - - - 1 1 2 2 2 2 2 $26,150
3/4 & 1 TON VANS - - - 1 1 1 2 2 2 1 $50,700
TRAILER 1 1 1 1 2 2 2 2 3 3 $19,048
SIDEWALK PLOWS AND SKID STEER LOADERS 3 2 2 1 1 1 - - - - $99,143
TURF EQUIPMENT MOWERS, TRIMMERS, GATORS 1 1 2 2 2 2 - - - - $36,446
SPECIALTY EQUIPMENT NOT CLASSIFIED - - 1 1 1 1 - - - - $65,959
Sub-total (#) 5 4 6 51 54 59 56 55 69 61
Sub-total ($000) $352.9 $253.8 $356.2 $2,083.9 $2,177.7 $2,357.5 $2,170.2 $2,091.3 $2,648.5 $2,331.3
OTHER DEPT. FLEET & MAINTENANCE EQUIPMENT (#) UNIT COST Percentage of Year
Rented Items 2004 2005 2006 2007 2008 2009 2010 2011 2012 2013 ($/Item) Rented (%)
CAR, STATION WAGONS 6 6 6 6 6 6 6 6 5 6 $3,412 33%
COMPACT PICKUPS 5 5 5 5 5 5 - - - 1 $5,124 54%
COMPACT 4X4 - - - - - - 2 2 1 - $4,713 47%
Sub-total (#) 11 11 11 11 11 11 8 8 6 7
Sub-total City's Share ($000) $20.8 $20.8 $20.8 $20.8 $20.8 $20.8 $11.3 $11.3 $7.9 $9.6
Total General Government Fleet (#) 16 15 17 62 65 70 64 63 75 68
Total General Government Fleet ($000) $373.7 $274.6 $377.0 $2,104.7 $2,198.5 $2,378.3 $2,181.5 $2,102.6 $2,656.4 $2,340.9
APPENDIX B.1
TABLE 1 - PAGE 2
# of Vehicles or Pieces of Equipment
# of Vehicles or Pieces of Equipment
HEMSON
76

GENERAL GOVERNMENT
SERVICE LEVEL ANALYSIS
2004 2005 2006 2007 2008 2009 2010 2011 2012 2013
Historic Population 386,670 409,558 433,800 450,486 467,814 485,808 504,495 523,900 541,300 557,800
Historic Employment 146,577 151,162 155,890 159,009 162,190 165,435 168,744 172,120 178,730 185,570
Total Historic Population & Employment 533,247 560,719 589,690 609,495 630,004 651,243 673,239 696,020 720,030 743,370
INVENTORY SUMMARY ($000)
Buildings $19,907.4 $19,907.4 $19,907.4 $19,907.4 $19,907.4 $19,907.4 $19,907.4 $19,907.4 $19,907.4 $19,907.4
Land $4,790.5 $4,790.5 $4,790.5 $4,790.5 $4,790.5 $4,790.5 $4,790.5 $4,790.5 $4,790.5 $4,790.5
Materials $529.1 $529.1 $529.1 $529.1 $529.1 $529.1 $529.1 $529.1 $529.1 $529.1
General Government Fleet $373.7 $274.6 $377.0 $2,104.7 $2,198.5 $2,378.3 $2,181.5 $2,102.6 $2,656.4 $2,340.9
Total ($000) $25,600.8 $25,501.6 $25,604.0 $27,331.7 $27,425.5 $27,605.3 $27,408.5 $27,329.6 $27,883.4 $27,568.0
Average
SERVICE LEVELS ($/pop & employ) Service
Level
Buildings $37.33 $35.50 $33.76 $32.66 $31.60 $30.57 $29.57 $28.60 $27.65 $26.78 $31.40
Land $8.98 $8.54 $8.12 $7.86 $7.60 $7.36 $7.12 $6.88 $6.65 $6.44 $7.56
Materials $0.99 $0.94 $0.90 $0.87 $0.84 $0.81 $0.79 $0.76 $0.73 $0.71 $0.83
General Government Fleet $0.70 $0.49 $0.64 $3.45 $3.49 $3.65 $3.24 $3.02 $3.69 $3.15 $2.55
Total ($/pop & employ) $48.00 $45.47 $43.42 $44.84 $43.53 $42.39 $40.72 $39.26 $38.72 $37.08 $42.34
CALCULATION OF MAXIMUM ALLOWABLE
GENERAL GOVERNMENT
10-Year Funding Envelope Calculation Excess Capacity Calculation
10 Year Average Service Level 2004 - 2013 $42.34 Total Value of Inventory in 2013 $27,567,963
Net Population & Employment Growth 2014 - 2023 210,010 Inventory Using Average Service Level $31,474,286
Maximum Allowable Funding Envelope 8,891,823 Excess Capacity $0
Less: Uncommitted Excess Capacity $0 Excess Capacity: Uncommitted
Less: 10% Legislated Reduction $889,182
Discounted Maximum Allowable Funding Envelope $8,002,641
APPENDIX B.1
TABLE 1 - PAGE 3
HEMSON
77

Gross Grants/ Net Total
Service Project Description Timing Project Subsidies/Other Municipal Replacement 10% DC Eligble Available DC 2014- PostCost Recoveries Cost and BTE Share Reduction Costs Reserves 2023 2023
1.0 GENERAL GOVERNMENT
1.1 Buildings and Fleet
1.1.1 New Vehicles and Equipment various 414,111$ -$ 414,111$ -$ 41,411$ 372,700$ 74,540$ 298,160$ -$
1.1.2 Recovery of Oversized Courthouse 2014-2018 Share 2014 322,900$ -$ 322,900$ -$ 32,290$ 290,610$ 290,610$ -$ -$
1.1.3 Recovery of Oversized Courthouse 2014-2018 Share 2015 322,900$ -$ 322,900$ -$ 32,290$ 290,610$ 290,610$ -$ -$ 1.1.4 Animal Shelter 2015 10,000,000$ -$ 10,000,000$ -$ 1,000,000$ 9,000,000$ 1,198,648$ 7,704,481$ 96,871$
1.1.5 Recovery of Oversized Courthouse 2014-2018 Share 2016 322,900$ -$ 322,900$ -$ 32,290$ 290,610$ -$ -$ 290,610$
1.1.6 Recovery of Oversized Courthouse 2014-2018 Share 2017 322,900$ -$ 322,900$ -$ 32,290$ 290,610$ -$ -$ 290,610$ 1.1.7 Recovery of Oversized Courthouse 2014-2018 Share 2018 322,900$ -$ 322,900$ -$ 32,290$ 290,610$ -$ -$ 290,610$
12,028,611$ -$ 12,028,611$ -$ 1,202,861$ 10,825,750$ 1,854,408$ 8,002,641$ 968,701$
1.2 Development-Related Studies
1.2.1 Natural Heritage Inventory 2014 71,000$ -$ 71,000$ 36,000$ 3,500$ 31,500$ -$ 31,500$ -$
1.2.2 Development Charges Study 2014 100,000$ -$ 100,000$ -$ 10,000$ 90,000$ -$ 90,000$ -$
1.2.3 Central Area Study 2015 150,000$ -$ 150,000$ 75,000$ 7,500$ 67,500$ -$ 67,500$ -$
1.2.4 Growth Management Program Support and Enhancement 2015 50,000$ -$ 50,000$ 25,000$ 2,500$ 22,500$ -$ 22,500$ -$
1.2.5 Miscellaneous Planning Studies 2015 200,000$ -$ 200,000$ 100,000$ 10,000$ 90,000$ -$ 90,000$ -$
1.2.6 Peel Climate Change Strategy 2015 100,000$ -$ 100,000$ 50,000$ 5,000$ 45,000$ -$ 45,000$ -$
1.2.7 Secondary Plan Reviews 2015 50,000$ -$ 50,000$ -$ 5,000$ 45,000$ -$ 45,000$ -$
1.2.8 Growth Management Program Support and Enhancement 2016 50,000$ -$ 50,000$ 25,000$ 2,500$ 22,500$ -$ 22,500$ -$
1.2.9 Miscellaneous Planning Studies 2016 200,000$ -$ 200,000$ 100,000$ 10,000$ 90,000$ -$ 90,000$ -$
1.2.10 Peel Climate Change Strategy 2016 100,000$ -$ 100,000$ 50,000$ 5,000$ 45,000$ -$ 45,000$ -$
1.2.11 Secondary Plan Reviews 2016 50,000$ -$ 50,000$ -$ 5,000$ 45,000$ -$ 45,000$ -$
1.2.12 Growth Management Program Support and Enhancement 2017 50,000$ -$ 50,000$ 25,000$ 2,500$ 22,500$ -$ 22,500$ -$
1.2.13 Miscellaneous Planning Studies 2017 200,000$ -$ 200,000$ 100,000$ 10,000$ 90,000$ -$ 90,000$ -$
1.2.14 Peel Climate Change Strategy 2017 100,000$ -$ 100,000$ 50,000$ 5,000$ 45,000$ -$ 45,000$ -$
1.2.15 Secondary Plan Reviews 2017 50,000$ -$ 50,000$ -$ 5,000$ 45,000$ -$ 45,000$ -$
1.2.16 Growth Management Program Support and Enhancement 2018 50,000$ -$ 50,000$ 25,000$ 2,500$ 22,500$ -$ 22,500$ -$
1.2.17 Miscellaneous Planning Studies 2018 200,000$ -$ 200,000$ 100,000$ 10,000$ 90,000$ -$ 90,000$ -$
1.2.18 Peel Climate Change Strategy 2018 100,000$ -$ 100,000$ 50,000$ 5,000$ 45,000$ -$ 45,000$ -$
1.2.19 Secondary Plan Reviews 2018 50,000$ -$ 50,000$ -$ 5,000$ 45,000$ -$ 45,000$ -$
1.2.20 Development Charges Study 2018 425,000$ -$ 425,000$ -$ 42,500$ 382,500$ -$ 382,500$ -$
1.2.21 Miscellaneous Planning Studies 2019 200,000$ -$ 200,000$ 100,000$ 10,000$ 90,000$ -$ 90,000$ -$
1.2.22 Peel Climate Change Strategy 2019 100,000$ -$ 100,000$ 50,000$ 5,000$ 45,000$ -$ 45,000$ -$
1.2.23 Secondary Plan Reviews 2019 50,000$ -$ 50,000$ -$ 5,000$ 45,000$ -$ 45,000$ -$
1.2.24 Growth Management Program Support and Enhancement 2019 50,000$ -$ 50,000$ 25,000$ 2,500$ 22,500$ -$ 22,500$ -$
1.2.25 Central Area Study 2020 100,000$ -$ 100,000$ 50,000$ 5,000$ 45,000$ -$ 45,000$ -$
1.2.26 Growth Management Program Support and Enhancement 2020 50,000$ -$ 50,000$ 25,000$ 2,500$ 22,500$ -$ 22,500$ -$
1.2.27 Miscellaneous Planning Studies 2020 200,000$ -$ 200,000$ 100,000$ 10,000$ 90,000$ -$ 90,000$ -$
1.2.28 Peel Climate Change Strategy 2020 100,000$ -$ 100,000$ 50,000$ 5,000$ 45,000$ -$ 45,000$ -$
1.2.29 Secondary Plan Reviews 2020 50,000$ -$ 50,000$ -$ 5,000$ 45,000$ -$ 45,000$ -$
1.2.30 Central Area Study 2021 100,000$ -$ 100,000$ 50,000$ 5,000$ 45,000$ -$ 45,000$ -$
1.2.31 Growth Management Program Support and Enhancement 2021 50,000$ -$ 50,000$ 25,000$ 2,500$ 22,500$ -$ 22,500$ -$
1.2.32 Miscellaneous Planning Studies 2021 200,000$ -$ 200,000$ 100,000$ 10,000$ 90,000$ -$ 90,000$ -$
1.2.33 Peel Climate Change Strategy 2021 100,000$ -$ 100,000$ 50,000$ 5,000$ 45,000$ -$ 45,000$ -$
1.2.34 Secondary Plan Reviews 2021 50,000$ -$ 50,000$ -$ 5,000$ 45,000$ -$ 45,000$ -$
1.2.35 Growth Management Program Support and Enhancement 2022 50,000$ -$ 50,000$ 25,000$ 2,500$ 22,500$ -$ 22,500$ -$
1.2.36 Miscellaneous Planning Studies 2022 200,000$ -$ 200,000$ 100,000$ 10,000$ 90,000$ -$ 90,000$ -$
1.2.37 Peel Climate Change Strategy 2022 100,000$ -$ 100,000$ 50,000$ 5,000$ 45,000$ -$ 45,000$ -$
1.2.38 Secondary Plan Reviews 2022 50,000$ -$ 50,000$ -$ 5,000$ 45,000$ -$ 45,000$ -$ 1.2.39 Development Charges Study 2023 425,000$ -$ 425,000$ -$ 42,500$ 382,500$ -$ 382,500$ -$
4,571,000$ -$ 4,571,000$ 1,611,000$ 296,000$ 2,664,000$ -$ 2,664,000$ -$
TOTAL GENERAL GOVERNMENT 16,599,611$ -$ 16,599,611$ 1,611,000$ 1,498,861$ 13,489,750$ 1,854,408$ 10,666,641$ 968,701$
Residential Development Charge CalculationResidential Share of 2014-2023 DC Eligible Costs 71.0% $7,573,315 2014 - 2023 Net Funding Envelope for Facilities $8,002,64110 Year Growth in Population in New Units 162,396 Unadjusted Development Charge Per Capita ($) $46.63 Reserve Fund Balance $1,854,408
Non-Residential Development Charge CalculationNon-Residential Share of 2014-2023 DC Eligible Costs 29.0% 3,093,326$ 10 Year Growth in Square Meters 4,967,120 Unadjusted Development Charge Per Sq.M ($) $0.62
APPENDIX B-1TABLE 2
CITY OF BRAMPTON2014 DEVELOPMENT CHARGES BACKGROUND STUDY
DEVELOPMENT-RELATED CAPITAL PROGRAM
DC Eligible CostsIneligible Cost
HEMSON
78

TABLE 3 - PAGE 1
1.00 GENERAL GOVERNMENT
OPENING CASH BALANCE FROM APPLICABLE RESERVES 2014 2015 2016 2017 2018 2019 2020 2021 2022 2023 TOTAL
OPENING CASH BALANCE ($000) 0.0 648.5 (4,428.7) (3,976.8) (3,422.9) (3,105.0) (2,458.2) (1,832.6) (1,202.7) (548.5)
2014-2023 RESIDENTIAL FUNDING REQUIREMENTS
1.00 General Government : Non Inflated $107.43 $5,683.05 $164.94 $164.94 $436.52 $164.94 $196.89 $196.89 $164.94 $292.74 $7,573.32
1.00 General Government: Inflated $107.43 $5,796.71 $171.61 $175.04 $472.50 $182.11 $221.74 $226.17 $193.26 $349.86 $7,896.43
POPULATION GROWTH
- Population in New Units 14,619 16,034 16,131 17,281 17,586 17,523 16,894 16,135 15,096 15,097 162,396
REVENUE - current ($000)
- Dev. Charge Receipts 744.8 833.3 855.1 934.4 969.9 985.7 969.4 944.3 901.2 919.2 $9,057.30
- Interest on Opening Balance 0.0 22.7 (243.6) (218.7) (188.3) (170.8) (135.2) (100.8) (66.1) (30.2) ($1,130.95)
- Interest on In-year Transactions (excl.int.) 11.2 (136.5) 12.0 13.3 8.7 14.1 13.1 12.6 12.4 10.0 ($29.32)
TOTAL REVENUE 756.0 719.5 623.5 729.0 790.3 829.0 847.3 856.1 847.4 899.0 $7,897.03
CLOSING CASH BALANCE 648.5 (4,428.7) (3,976.8) (3,422.9) (3,105.0) (2,458.2) (1,832.6) (1,202.7) (548.5) 0.6
2014 Adjusted Charge Per Capita $50.95 Allocation of Capital Program
Residential Sector 71.0%
Non-Residential Sector 29.0%
Rates for 2014
Inflation Rate 2.0%
Interest Rate on Positive Balances 3.5%
Interest Rate on Negative Balances 5.5%
APPENDIX B.1
CITY OF BRAMPTONCASHFLOW AND DETERMINATION OF DEVELOPMENT CHARGE
GENERAL GOVERNMENTRESIDENTIAL DEVELOPMENT CHARGE
HEMSON
79

TABLE 3 - PAGE 2
1.00 GENERAL GOVERNMENT
OPENING CASH BALANCE FROM APPLICABLE RESERVES 2014 2015 2016 2017 2018 2019 2020 2021 2022 2023 TOTAL
OPENING CASH BALANCE ($000) $0.00 $335.28 ($1,667.36) ($1,423.69) ($1,211.09) ($1,131.38) ($898.92) ($668.92) ($429.34) ($179.59)
2009-2018 NON-RESIDENTIAL FUNDING REQUIREMENTS
1.00 General Government : Non Inflated $43.88 $2,321.25 $67.37 $67.37 $178.30 $67.37 $80.42 $80.42 $67.37 $119.57 $3,093.33
1.00 General Government: Inflated $43.88 $2,367.67 $70.09 $71.50 $192.99 $74.38 $90.57 $92.38 $78.94 $142.90 $3,225.30
NON-RESIDENTIAL GROWTH
- Sq. Metres in New Buildings 549,100 587,100 565,010 495,300 457,610 484,850 476,950 466,050 436,300 448,850 4,967,120
REVENUE - current ($000)
- Dev. Charge Receipts 373.4 407.2 399.7 357.4 336.8 364.0 365.2 364.0 347.6 364.8 $3,680.10
- Interest on Opening Balance 0.0 11.7 (91.7) (78.3) (66.6) (62.2) (49.4) (36.8) (23.6) (9.9) ($406.83)
- Interest on In-year Transactions (excl.int.) 5.8 (53.9) 5.8 5.0 2.5 5.1 4.8 4.8 4.7 3.9 ($11.65)
TOTAL REVENUE 379.2 365.0 313.8 284.1 272.7 306.8 320.6 332.0 328.7 358.8 $3,261.62
CLOSING CASH BALANCE 335.3 (1,667.4) (1,423.7) (1,211.1) (1,131.4) (898.9) (668.9) (429.3) (179.6) 36.3
Allocation of Capital Program
2014 Adjusted Charge Per Capita $0.68 Residential Sector 71.0%
Non-Residential Sector 29.0%
Rates for 2014
Inflation Rate: 2.0%
Interest Rate on Positive Balances 3.5%
Interest Rate on Negative Balances 5.5%
APPENDIX B.1
CITY OF BRAMPTONCASHFLOW AND DETERMINATION OF DEVELOPMENT CHARGE
GENERAL GOVERNMENTNON-RESIDENTIAL DEVELOPMENT CHARGE
HEMSON
80

APPENDIX B.2
LIBRARY SERVICES
HEMSON
81

APPENDIX B.2
LIBRARY SERVICES
The Brampton Public Library is responsible for the provision of library services in the City of Brampton. Brampton Library offers a variety of programming and servicing, including special programs for adults, seniors, teens and children. In 2013, the Library operated out of seven branches throughout the City and the Library expects to expand its service over the next 10 years.
TABLE 1 HISTORIC SERVICE LEVELS
The total space used to provide Library Services in Brampton totals 184,700 square feet in 2013 with a replacement value of $69.69 million. The land associated with this space totals 10.79 acres and is valued at $12.80 million. Materials total $16.87 million and furniture and equipment add another $7.79 million to the value of the inventory. Personal computer related equipment is excluded in this total as required by the DCA.
The replacement value of the 2013 inventory of capital assets for Library Services is $107.15 million, and the average historic service level over 10 years is $169.26 per capita. The historic service level multiplied by the ten-year forecast of net population growth results in a ten-year maximum allowable funding envelope of $24.39 million (144,100 net population growth x historic service level of $169.26/capita).
Finally, the Library Services funding envelope must be reduced by ten per cent as required under the DCA. The resulting net maximum allowable funding envelope brought forward to the development charges calculation is reduced to $21.95 million.
TABLE 2 2014–2023 PROVISIONAL DEVELOPMENT-RELATED CAPITAL BUDGET & CALCULATION OF THE “UNADJUSTED” DEVELOPMENT CHARGES
The first project in Library Services capital program is for the recovery of the negative reserve fund balance. The negative reserve fund relates to the previously committed excess capacity. The negative DC reserve fund balance for library services amounts to $18.02 million (after the 10 per cent statutory discount) and this full amount is brought forward for recovery through development charges.
HEMSON
82

The development-related capital program also includes the construction of a new District 3 library branch in 2020 for a cost of $15.00 million. The Brampton Public Library also plans to expand its collections over the ten-year planning horizon. An amount of $35.37 million has been included to reflect the acquisition of new collection materials. Recognizing that approximately 75 per cent of all collection material acquisitions are considered to be a replacement and provide a benefit to the existing community, $26.50 million has been removed from the DC calculation.
The total gross cost of the library DC capital program is $70.89 million. No grants, subsidies or other recoveries are anticipated to fund any shares of the above mentioned projects, and as such the net cost to the municipality remains at $70.89 million. Benefit-to-existing and replacement shares in the amount of $26.50 million related to the additional collection materials have been removed from the DC calculations.
The legislated 10 per cent discount totals $4.44 million and is netted off of the net municipal costs, leaving $39.95 million as the total development related costs. An amount of $18.0 million, the amount by which the remaining DC eligible costs exceed the maximum allowable funding envelope, is deemed a post-period benefit, and will be considered for recovery in subsequent development charge by-laws.
The 2014–2023 DC costs eligible for recovery amount to $21.95 million, which is allocated entirely against future residential development in the City of Brampton. This results in an unadjusted development charge of $135.17 per capita.
TABLE 3 CASH FLOW ANALYSIS
The cash flow analysis is displayed in Table 3. It considers the timing of the projects against the timing of the development charge revenues to determine adjusted calculated rates. After cash flow analysis, the residential charge increases to $155.97 per capita.
10-year Hist.Service Level
$/capita Total Net DC Recoverable $/capita $/sq.m $/capita $/sq.m
$169.26 $70,887 $21,951 $135.17 $0.00 $155.97 $0.00
Development Charge Development Charge
LIBRARY SERVICES SUMMARY2014-2023 Unadjusted Adjusted
Development-Related Capital Program ($000's)
HEMSON
83

LIBRARY SERVICES
INVENTORY OF CAPITAL ASSETS
BUILDINGS UNIT COST
Branch Name 2004 2005 2006 2007 2008 2009 2010 2011 2012 2013 ($/sq.ft)
Four Corners 38,939 38,939 38,939 38,939 38,939 38,939 38,939 38,939 38,939 38,939 $368
Chinguacousy 50,283 50,283 50,283 50,283 50,283 52,724 52,724 52,724 52,724 52,724 $368
Cyril Clark 17,650 17,650 17,650 17,650 17,650 25,354 25,354 25,354 25,354 25,354 $368
South Fletcher's Branch 12,754 12,754 12,754 12,754 12,754 12,754 12,754 12,754 12,754 12,754 $368
Gore Meadows (formerly Springdale) - - - - - - - - - 30,156 $378
Mount Pleasant Village - - - - - - - 22,112 22,112 22,112 $450
Temporary Locations:
North West Interim Branch (Creditview) - 3,188 3,188 3,188 3,188 3,188 3,188 - - - $221
North East Interim Branch (Mountainash) - - 2,632 2,632 2,632 2,632 2,632 2,632 2,632 2,632 $221
Total (sq.ft.) 119,626 122,814 125,446 125,446 125,446 135,591 135,591 154,515 154,515 184,671
Total ($000) $44,022.4 $44,726.9 $45,308.6 $45,308.6 $45,308.6 $49,041.9 $49,041.9 $58,287.8 $58,287.8 $69,686.8
LAND UNIT COST
Branch Name 2004 2005 2006 2007 2008 2009 2010 2011 2012 2013 ($/acre)
Four Corners 1.33 1.33 1.33 1.33 1.33 1.33 1.33 1.33 1.33 1.33 $2,000,000
Chinguacousy 2.67 2.67 2.67 2.67 2.67 2.67 2.67 2.67 2.67 2.67 $2,000,000
Cyril Clark 1.06 1.06 1.06 1.06 1.06 1.06 1.06 1.06 1.06 1.06 $700,000
South Fletcher's Branch 0.42 0.42 0.42 0.42 0.42 0.42 0.42 0.42 0.42 0.42 $700,000
Gore Meadows (formerly Springdale) - - - - - - - - - 4.80 $700,000
Mount Pleasant Village - - - - - - - 0.45 0.45 0.45 $700,000
Temporary Locations:
North West Interim Branch (Creditview) - 1.26 1.26 1.26 1.26 1.26 1.26 - - - $700,000
North East Interim Branch (Mountainash) - - 0.06 0.06 0.06 0.06 0.06 0.06 0.06 0.06 $1,500,000
Total (acres) 5.48 6.74 6.80 6.80 6.80 6.80 6.80 5.99 5.99 10.79
Total ($000) $9,036.0 $9,918.0 $10,008.0 $10,008.0 $10,008.0 $10,008.00 $10,008.00 $9,441.00 $9,441.00 $12,801.00
APPENDIX B.2
TABLE 1 - PAGE 1
# of Square Feet
# of Acres
HEMSON
84

LIBRARY SERVICES
INVENTORY OF CAPITAL ASSETS
MATERIALS UNIT COST
Collection 2004 2005 2006 2007 2008 2009 2010 2011 2012 2013 ($/item)
Material Inventory 607,094 577,094 581,608 585,343 554,354 543,955 599,061 636,630 679,818 720,897 $23
Total All Materials (#) 607,094 577,094 581,608 585,343 554,354 543,955 599,061 636,630 679,818 720,897
Total ($000) $14,206.0 $13,504.0 $13,609.6 $13,697.0 $12,971.9 $12,728.5 $14,018.0 $14,897.1 $15,907.7 $16,869.0
FURNITURE AND EQUIPMENT
Branch Name 2004 2005 2006 2007 2008 2009 2010 2011 2012 2013
Four Corners $1,367.0 $1,367.0 $1,367.0 $1,367.0 $1,367.0 $1,395.7 $1,467.1 $1,483.0 $1,487.6 $1,501.0
Chinguacousy $1,669.0 $1,669.0 $1,669.0 $1,669.0 $1,669.0 $2,212.9 $2,315.7 $2,337.2 $2,431.4 $2,464.2
Cyril Clark $586.0 $586.0 $586.0 $586.0 $586.0 $609.5 $1,445.3 $1,447.7 $1,452.2 $1,466.8
South Fletcher's Branch $428.0 $428.0 $428.0 $428.0 $428.0 $538.9 $898.2 $899.8 $917.7 $922.8
Gore Meadows (formerly Springdale) $0.0 $0.0 $0.0 $0.0 $0.0 $0.0 $0.0 $0.0 $129.5 $806.1
Mount Pleasant Village $0.0 $0.0 $0.0 $0.0 $0.0 $0.0 $0.0 $375.5 $381.7 $523.3
Temporary Locations:
North West Interim Branch (Creditview) $0.0 $109.0 $109.0 $109.0 $109.0 $130.9 $135.1 $0.0 $0.0 $0.0
North East Interim Branch (Mountainash) $0.0 $0.0 $84.0 $84.0 $84.0 $99.5 $103.7 $104.7 $104.7 $104.7
Total ($000) $4,050.0 $4,159.0 $4,243.0 $4,243.0 $4,243.0 $4,987.4 $6,365.1 $6,647.8 $6,904.6 $7,788.9
# of Collection Materials
Total Value of Furniture and Equipment ($000)
APPENDIX B.2
TABLE 1 - PAGE 2
HEMSON
85

LIBRARY SERVICES
SERVICE LEVEL ANALYSIS
2004 2005 2006 2007 2008 2009 2010 2011 2012 2013
Historic Population 386,670 409,558 433,800 450,486 467,814 485,808 504,495 523,900 541,300 557,800
INVENTORY SUMMARY ($000)
Buildings $44,022.4 $44,726.9 $45,308.6 $45,308.6 $45,308.6 $49,041.9 $49,041.9 $58,287.8 $58,287.8 $69,686.8
Land $9,036.0 $9,918.0 $10,008.0 $10,008.0 $10,008.0 $10,008.0 $10,008.0 $9,441.0 $9,441.0 $12,801.0
Materials $14,206.0 $13,504.0 $13,609.6 $13,697.0 $12,971.9 $12,728.5 $14,018.0 $14,897.1 $15,907.7 $16,869.0
Furniture and Equipment $4,050.0 $4,159.0 $4,243.0 $4,243.0 $4,243.0 $4,987.4 $6,365.1 $6,647.8 $6,904.6 $7,788.9
Total ($000) $71,314.4 $72,307.9 $73,169.2 $73,256.6 $72,531.5 $76,765.9 $79,433.1 $89,273.8 $90,541.2 $107,145.7
Average
SERVICE LEVEL ($/capita) Service
Level
Buildings $113.85 $109.21 $104.45 $100.58 $96.85 $100.95 $97.21 $111.26 $107.68 $124.93 $106.70
Land $23.37 $24.22 $23.07 $22.22 $21.39 $20.60 $19.84 $18.02 $17.44 $22.95 $21.31
Materials $36.74 $32.97 $31.37 $30.40 $27.73 $26.20 $27.79 $28.44 $29.39 $30.24 $30.13
Furniture and Equipment $10.47 $10.15 $9.78 $9.42 $9.07 $10.27 $12.62 $12.69 $12.76 $13.96 $11.12
Total ($/capita) $184.43 $176.55 $168.67 $162.62 $155.04 $158.02 $157.46 $170.41 $167.27 $192.08 $169.26
CALCULATION OF MAXIMUM ALLOWABLE
LIBRARY SERVICES
10-Year Funding Envelope Calculation Excess Capacity Calculation
10 Year Average Service Level 2004 - 2013 $169.26 Total Value of Inventory in 2013 107,145,688$
Net Population Growth 2014 - 2023 144,100 Inventory Using Average Service Level 94,413,228$
Maximum Allowable Funding Envelope 24,390,366 Excess Capacity $12,732,460
Less: Uncommitted Excess Capacity $0 Excess Capacity: Committed
Less: 10% Legislated Reduction $2,439,037
Discounted Maximum Allowable Funding Envelope $21,951,329
TABLE 1 - PAGE 3
APPENDIX B.2
HEMSON
86

Gross Grants/ Net Total
Service Project Description Timing Project Subsidies/Other Municipal Replacement 10% DC Eligble Available DC 2014- Post
Cost Recoveries Cost and BTE Share Reduction Costs Reserves 2023 2023
2.0 LIBRARY SERVICES
2.1 Recovery of Negative Reserve Fund Balance 2014 20,016,994$ -$ 20,016,994$ -$ 2,001,699$ 18,015,294$ -$ 18,015,294$ -$
2.2 Buildings, Land & Furnishings
2.2.1 Automation Software Upgrades various 500,000$ -$ 500,000$ -$ 50,000$ 450,000$ -$ 450,000$ -$
2.2.2 District 3 Library 2020 15,000,000$ -$ 15,000,000$ -$ 1,500,000$ 13,500,000$ -$ -$ 13,500,000$ 2.2.3 -$ -$ -$ -$ -$ -$ -$ -$ -$
15,500,000$ -$ 15,500,000$ -$ 1,550,000$ 13,950,000$ -$ 450,000$ 13,500,000$
2.3 Material Acquisitions
2.3.1 Additional Collection Materials 2014 2,627,000$ -$ 2,627,000$ 1,750,000$ 87,700$ 789,300$ -$ 789,300$ -$
2.3.2 Additional Collection Materials 2015 2,927,000$ -$ 2,927,000$ 1,950,000$ 97,700$ 879,300$ -$ 879,300$ -$
2.3.3 Additional Collection Materials 2016 3,027,000$ -$ 3,027,000$ 2,150,000$ 87,700$ 789,300$ -$ 789,300$ -$
2.3.4 Additional Collection Materials 2017 3,227,000$ -$ 3,227,000$ 2,350,000$ 87,700$ 789,300$ -$ 789,300$ -$
2.3.5 Additional Collection Materials 2018 3,427,000$ -$ 3,427,000$ 2,550,000$ 87,700$ 789,300$ -$ 238,835$ 550,465$
2.3.6 Additional Collection Materials 2019 3,627,000$ -$ 3,627,000$ 2,750,000$ 87,700$ 789,300$ -$ -$ 789,300$
2.3.7 Additional Collection Materials 2020 3,827,000$ -$ 3,827,000$ 2,950,000$ 87,700$ 789,300$ -$ -$ 789,300$
2.3.8 Additional Collection Materials 2021 4,027,000$ -$ 4,027,000$ 3,150,000$ 87,700$ 789,300$ -$ -$ 789,300$
2.3.9 Additional Collection Materials 2022 4,227,000$ -$ 4,227,000$ 3,350,000$ 87,700$ 789,300$ -$ -$ 789,300$ 2.3.10 Additional Collection Materials 2023 4,427,000$ -$ 4,427,000$ 3,550,000$ 87,700$ 789,300$ -$ -$ 789,300$
35,370,000$ -$ 35,370,000$ 26,500,000$ 887,000$ 7,983,000$ -$ 3,486,035$ 4,496,965$
TOTAL LIBRARY SERVICES 70,886,994$ -$ 70,886,994$ 26,500,000$ 4,438,699$ 39,948,294$ -$ 21,951,329$ 17,996,965$
Residential Development Charge CalculationResidential Share of 2014-2023 DC Eligible Costs 100% $21,951,329 2014 - 2023 Net Funding Envelope for Library $21,951,32910 Year Growth in Population in New Units 162,396 Unadjusted Development Charge Per Capita ($) $135.17 Reserve Fund Balance ($18,015,294)
Non-Residential Development Charge CalculationNon-Residential Share of 2014-2023 DC Eligible Costs 0% -$ 10 Year Growth in Square Meters 4,967,120 Unadjusted Development Charge Per Sq.M ($) $0.00
APPENDIX B-2TABLE 2
CITY OF BRAMPTON2014 DEVELOPMENT CHARGES BACKGROUND STUDY
DEVELOPMENT-RELATED CAPITAL PROGRAM
DC Eligible CostsIneligible Cost
HEMSON
87

TABLE 3
2.00 LIBRARY SERVICES
OPENING CASH BALANCE FROM APPLICABLE RESERVES 2014 2015 2016 2017 2018 2019 2020 2021 2022 2023 TOTAL
OPENING CASH BALANCE ($000) 0.0 (17,025.2) (16,325.4) (15,443.1) (14,282.8) (12,360.0) (10,020.0) (7,603.2) (5,132.7) (2,661.7)
2014-2023 RESIDENTIAL FUNDING REQUIREMENTS
2.00 Library Services : Non Inflated $18,849.59 $924.30 $834.30 $834.30 $283.84 $45.00 $45.00 $45.00 $45.00 $45.00 $21,951.33
2.00 Library Services: Inflated $18,849.59 $942.79 $868.01 $885.37 $307.23 $49.68 $50.68 $51.69 $52.72 $53.78 $22,111.54
POPULATION GROWTH
- Population in New Units 14,619 16,034 16,131 17,281 17,586 17,523 16,894 16,135 15,096 15,097 162,396
REVENUE - current ($000)
- Dev. Charge Receipts 2,280.1 2,550.8 2,617.6 2,860.4 2,969.0 3,017.6 2,967.5 2,890.7 2,758.7 2,814.0 $27,726.40
- Interest on Opening Balance 0.0 (936.4) (897.9) (849.4) (785.6) (679.8) (551.1) (418.2) (282.3) (146.4) ($5,546.98)
- Interest on In-year Transactions (excl.int.) (455.7) 28.1 30.6 34.6 46.6 51.9 51.0 49.7 47.4 48.3 ($67.43)
TOTAL REVENUE 1,824.4 1,642.6 1,750.3 2,045.6 2,230.0 2,389.7 2,467.4 2,522.2 2,523.8 2,715.9 $22,111.99
CLOSING CASH BALANCE (17,025.2) (16,325.4) (15,443.1) (14,282.8) (12,360.0) (10,020.0) (7,603.2) (5,132.7) (2,661.7) 0.4
2014 Adjusted Charge Per Capita $155.97 Allocation of Capital Program
Residential Sector 100.0%
Non-Residential Sector 0.0%
Rates for 2014
Inflation Rate 2.0%
Interest Rate on Positive Balances 3.5%
Interest Rate on Negative Balances 5.5%
APPENDIX B.2
CITY OF BRAMPTONCASHFLOW AND DETERMINATION OF DEVELOPMENT CHARGE
RESIDENTIAL DEVELOPMENT CHARGELIBRARY BOARD
HEMSON
88

APPENDIX B.3
FIRE SERVICES
HEMSON
89

APPENDIX B.3
FIRE SERVICES
Brampton’s Fire and Emergency Services is responsible for the provision of fire protection and prevention services across the City. The Fire Protection and Prevention Act defines fire protection services as “...fire suppression, fire prevention, fire safety education, communication, training of persons involved in the provision of fire protection services, rescue and emergency services and the delivery of all those services.” The City’s Fire and Emergency Services has a full time equivalent staff complement of approximately 386 responding to fires, medical emergencies, transportation accidents, industrial accidents, rescues, and a wide range of other life-threatening emergencies.
TABLE 1 HISTORIC SERVICE LEVELS
Table 1 displays the ten year historic inventory for buildings, land, vehicles and equipment. Fire and Emergency Services currently operates out of sixteen stations plus a fire life safety centre. The total building area for all fire related buildings is 129,800 square feet with a replacement value of $47.95 million.
The land associated with the fire stations totals 27.05 acres, worth $22.09 million. The 2013 fleet totals 83 vehicles with a replacement value of $24.48 million. Equipment in all stations is valued at approximately $6.67 million.
The 2013 total replacement value of the inventory of capital assets for Fire and Emergency Services is $101.18 million, resulting in a ten year historic average service level of $674.67 per household. The historic service level, multiplied by the ten year forecast in household growth (43,165), results in a ten year maximum allowable funding envelope of $29.12 million. No uncommitted excess capacity exists for this service; therefore, the full funding envelope is brought forward to the development charges calculation.
HEMSON
90

TABLE 2 2014–2023 PROVISIONAL DEVELOPMENT-RELATED CAPITAL BUDGET& CALCULATION OF THE “UNADJUSTED” DEVELOPMENT CHARGES
The first project in the Fire and Emergency Services capital program is for the recovery of the negative reserve fund balance. The negative reserve fund relates to the previously committed excess capacity. The negative DC reserve fund balance for fire services amounts to $23.68 million and this full amount is brought forward for recovery through development charges.
Over the 10-year forecast period Fire and Emergency Services is expected to add two new stations, one training facility, an apparatus and maintenance facility and replace two stations (#201 and #203) with larger facilities as a result of growth. These new building projects combined amount to $46.82 million. The City anticipates funding the remaining portion ($3.53 million) of the new Apparatus and Maintenance Facility in 2014. The two new stations (station #14 and #15) are expected to be developed in 2018 and 2019 respectively, for a combined cost of $9.38 million. The new training facility will be constructed for a total cost of $19.96 million. A deduction of $220,000 is made to the training facility amount to reflect a benefit to the existing community.
Stations 201 (Headquarters) and Station #203 are expected to be reconstructed and expanded for a total cost of $13.95 million. A deduction of $10.70 million is made to this amount to account for the replacement shares equivalent to the current stations.
The remainder ($12.02 million) of the development-related capital program consists of new vehicles and equipment (e.g. opticom, dispatch and firefighting equipment).
Altogether, the ten year capital forecast for fire services amounts to $82.52 million. A deduction of $14.47 million is made to this amount to account for the replacement shares, which are largely associated with the replacement of stations 201 and 203, as well as annual equipment acquisitions. A significant portion of the capital program, $38.93 million, is deemed to benefit development post 2023, and will be considered for recovery in subsequent development charge by-laws.
The remaining $29.12 million is related to development in the 2014–2023 planning period and is eligible for DC recovery in this period. The DCA does not require a 10 per cent statutory discount for fire and protection services.
HEMSON
91

The development-related net capital cost of $29.12 million is allocated 71 per cent to residential development ($20.68 million) and 29 per cent to non-residential development ($8.45 million). This apportionment is based on the anticipated shares of population in new units and employment growth over the ten-year forecast period. The residential share of the net development-related capital cost is divided by the 10-year forecast growth in population in new units to derive an unadjusted charge of $127.32 per capita. The non-residential share of the net growth related capital cost is divided by the 10-year forecast growth in floor space, resulting in an unadjusted charge of $1.70 per square metre.
TABLE 3 CASH FLOW ANALYSIS
After cash flow consideration, the residential calculated charge increases to $148.79 per capita and the non-residential charge increases to $1.97 per square metre.
10-year Hist.Service Level$/household Total Net DC Recoverable $/capita $/sq.m $/capita $/sq.m
$674.67 $82,520 $29,122 $127.32 $1.70 $148.79 $1.97
2014-2023 Unadjusted AdjustedDevelopment-Related Capital Program ($000's) Development Charge Development Charge
FIRE SERVICES SUMMARY
HEMSON
92

FIRE SERVICES
INVENTORY OF CAPITAL ASSETS
BUILDINGS UNIT COST
Station Name 2004 2005 2006 2007 2008 2009 2010 2011 2012 2013 ($/sq.ft)
Station #201 Headquarters 13,544 13,544 13,544 13,544 13,544 13,544 13,544 13,544 13,544 13,544 $366
Station #202 6,745 6,745 6,745 6,745 6,745 6,745 6,745 6,745 6,745 6,745 $366
Station #203 17,981 17,981 17,981 17,981 17,981 17,981 17,981 21,694 21,694 21,694 $366
Station #204 5,900 5,900 5,900 5,900 5,900 5,900 5,900 5,900 5,900 5,900 $366
Station #205 5,900 5,900 5,900 5,900 5,900 5,900 8,239 8,239 8,239 8,239 $366
Station #206 6,711 6,711 6,711 6,711 6,711 6,711 6,711 6,711 6,711 6,711 $366
Station #207 7,194 7,194 7,194 7,194 7,194 7,194 7,194 7,194 7,194 7,194 $366
Station #208 6,747 6,747 6,747 6,747 6,747 6,747 6,747 6,747 6,747 6,747 $366
Station #209 9,608 9,608 9,608 9,608 9,608 9,608 9,608 9,608 9,608 9,608 $366
Station #210 9,668 9,668 9,668 9,668 9,668 9,668 9,668 9,668 9,668 9,668 $366
Station #212 - - - - - - - 11,068 11,068 11,068 $412
Station #213 8,919 8,919 8,919 8,919 8,919 8,919 8,919 8,919 8,919 8,919 $412
Churchville Station #217 962 962 962 962 962 962 962 962 - - $200
Huttonville Station #218 1,269 1,269 1,269 1,269 1,269 1,269 1,269 1,269 1,269 1,269 $200
Castlemore Station #219 1,626 1,626 1,626 1,626 1,626 1,626 1,626 1,626 1,626 1,626 $217
Fire Life Safety Centre 10,847 10,847 10,847 10,847 10,847 10,847 10,847 10,847 10,847 10,847 $366
Total (sq.ft.) 113,621 113,621 113,621 113,621 113,621 113,621 115,960 130,741 129,779 129,779
Total ($000) $41,374.7 $41,374.7 $41,374.7 $41,374.7 $41,374.7 $41,374.7 $42,230.6 $48,145.9 $47,953.5 $47,953.5
LAND UNIT COST
Station Name 2004 2005 2006 2007 2008 2009 2010 2011 2012 2013 ($/acre)
A&M Facility - 52 Rutherford Rd - - - - - - - - 2.5 2.5 $700,000
Station #201 Headquarters 2.16 2.16 2.16 2.16 2.16 2.16 2.16 2.16 2.16 2.16 $1,500,000
Station #202 0.75 0.75 0.75 0.75 0.75 0.75 0.75 0.75 0.75 0.75 $700,000
Station #203 4.36 4.36 4.36 4.36 4.36 4.36 4.36 4.36 4.36 4.36 $850,000
Station #204 3.01 3.01 3.01 3.01 3.01 3.01 3.01 3.01 3.01 3.01 $700,000
Station #205 1.48 1.48 1.48 1.48 1.48 1.48 1.48 1.48 1.48 1.48 $700,000
Station #206 0.96 0.96 0.96 0.96 0.96 0.96 0.96 0.96 0.96 0.96 $1,500,000
Station #207 0.99 0.99 0.99 0.99 0.99 0.99 0.99 0.99 0.99 0.99 $700,000
Station #208 0.74 0.74 0.74 0.74 0.74 0.74 0.74 0.74 0.74 0.74 $700,000
Station #209 1.51 1.51 1.51 1.51 1.51 1.51 1.51 1.51 1.51 1.51 $700,000
Station #210 1.50 1.50 1.50 1.50 1.50 1.5 1.5 1.5 1.5 1.5 $700,000
Station #211 - - - - - - - 1.84 1.84 1.84 $700,000
Station #212 - - - 1.40 1.40 1.40 1.40 1.40 1.40 1.40 $700,000
Station #213 1.61 1.61 1.61 1.61 1.61 1.61 1.61 1.61 1.61 1.61 $700,000
Churchville Station #217 0.14 0.14 0.14 0.14 0.14 0.14 0.14 0.14 - - $700,000
Huttonville Station #218 0.49 0.49 0.49 0.49 0.49 0.49 0.49 0.49 0.49 0.49 $700,000
Castlemore Station #219 0.51 0.51 0.51 0.51 0.51 0.51 0.51 0.51 0.51 0.51 $700,000
Fire Life Safety Centre 1.24 1.24 1.24 1.24 1.24 1.24 1.24 1.24 1.24 1.24 $700,000
Total (acres) 21.45 21.45 21.45 22.85 22.85 22.85 22.85 24.69 27.05 27.05
Total ($000) $18,163.8 $18,163.8 $18,163.8 $19,143.8 $19,143.8 $19,145.0 $19,145.0 $20,433.0 $22,085.0 $22,085.0
APPENDIX B.3
TABLE 1 - PAGE 1
# of Square Feet
# of Acres
HEMSON
93

FIRE SERVICES
INVENTORY OF CAPITAL ASSETS
VEHICLES UNIT COST
Vehicle Type 2004 2005 2006 2007 2008 2009 2010 2011 2012 2013 ($/vehicle)
Aerials/Towers 6 7 7 8 8 8 8 8 7 7 $1,100,000
Air/Light Vehicle 1 1 1 1 1 1 1 1 1 1 $400,000
Chief/Training Vehicle 11 13 16 18 18 18 18 20 20 21 $35,000
Command Post 1 1 1 1 1 1 1 1 1 1 $650,000
Fire Prevention cars 16 16 17 18 19 19 20 20 20 25 $25,000
Flashover 1 1 1 1 1 1 1 1 1 1 $87,000
Hazardous Materials Unit 0 0 1 1 1 1 1 1 1 1 $650,000
Platon Chiefs Vehicle 0 0 0 4 4 4 4 4 4 4 $65,000
Pumper/ Rescue 4 4 4 4 5 6 6 6 6 7 $700,000
Pumpers/Tankers 13 13 13 13 12 11 12 12 13 13 $600,000
Rehabilitation unit 1 1 1 1 1 1 1 1 1 1 $220,000
Technical rescue 1 1 1 1 1 1 1 1 1 1 $450,000
Total (#) 55 58 63 71 72 72 74 76 76 83
Total ($000) $19,792.0 $20,962.0 $21,742.0 $23,197.0 $23,322.0 $23,422.0 $24,047.0 $24,117.0 $23,617.0 $24,477.0
FURNITURE & EQUIPMENT (excluding computers) UNIT COST
Description 2004 2005 2006 2007 2008 2009 2010 2011 2012 2013 $/Unit
- Opticom Traffic Controller Pre-Emption Device (# intersections) 294 326 370 405 429 449 468 492 512 316 $6,000
- Opticom Traffic Controller Pre-Emption Device ($000) $1,764.0 $1,956.0 $2,220.0 $2,430.0 $2,574.0 $2,694.0 $2,808.0 $2,952.0 $3,072.0 $1,896.0
Emtrac Traffic Controller Pre-Emption Device (# of Intersections) - - - - - - - - - 207 $4,418
- Furniture & Equipment - all stations ($000) $1,704.3 $1,704.3 $1,704.3 $1,704.3 $1,704.3 $1,704.3 $1,739.4 $1,961.1 $1,946.7 $1,946.7 $15
-# of Firefighters 324 334 334 360 361 370 370 361 361 382 $5,000
Total ($000) $5,088.3 $5,330.3 $5,594.3 $5,934.3 $6,083.3 $6,248.3 $6,397.4 $6,718.1 $6,823.7 $6,667.2
Total Value of Furniture & Equipment ($)
APPENDIX B.3
TABLE 1 - PAGE 2
# of Vehicles
HEMSON
94

FIRE SERVICES
SERVICE LEVEL ANALYSIS
2004 2005 2006 2007 2008 2009 2010 2011 2012 2013
Historic Households 113,709 119,649 125,900 130,261 134,773 139,442 144,272 149,270 153,930 158,240
INVENTORY SUMMARY ($000)
Buildings $41,375 $41,375 $41,375 $41,375 $41,375 $41,375 $42,231 $48,146 $47,953 $47,953
Land $18,164 $18,164 $18,164 $19,144 $19,144 $19,145 $19,145 $20,433 $22,085 $22,085
Vehicles $19,792 $20,962 $21,742 $23,197 $23,322 $23,422 $24,047 $24,117 $23,617 $24,477
Equipment $5,088 $5,330 $5,594 $5,934 $6,083 $6,248 $6,397 $6,718 $6,824 $6,667
Total ($000) $84,419 $85,831 $86,875 $89,650 $89,924 $90,190 $91,820 $99,414 $100,479 $101,183
Average
SERVICE LEVEL ($/household) Service
Level
Buildings $363.86 $345.80 $328.63 $317.63 $306.99 $296.72 $292.71 $322.54 $311.53 $303.04 $318.95
Land $159.74 $151.81 $144.27 $146.96 $142.04 $137.30 $132.70 $136.89 $143.47 $139.57 $143.48
Vehicles $174.06 $175.20 $172.69 $178.08 $173.05 $167.97 $166.68 $161.57 $153.43 $154.68 $167.74
Equipment $44.75 $44.55 $44.43 $45.56 $45.14 $44.81 $44.34 $45.01 $44.33 $42.13 $44.50
Total ($/household) $742.41 $717.35 $690.03 $688.23 $667.22 $646.79 $636.44 $666.00 $652.76 $639.43 $674.67
CALCULATION OF MAXIMUM ALLOWABLE
FIRE SERVICES
10-Year Funding Envelope Calculation Excess Capacity Calculation
10 Year Average Service Level 2004 - 2013 $674.67 Total Value of Inventory in 2013 101,182,676$
Net Household Growth 2014 - 2023 43,165 Inventory Using Average Service Level 106,759,646$
Maximum Allowable Funding Envelope 29,122,244 Excess Capacity -$
Less: Uncommitted Excess Capacity $0 Excess Capacity: Uncommitted
Discounted Maximum Allowable Funding Envelope $29,122,244 Excess Calculation ($000)
APPENDIX B.3
TABLE 1 - PAGE 3
HEMSON
95
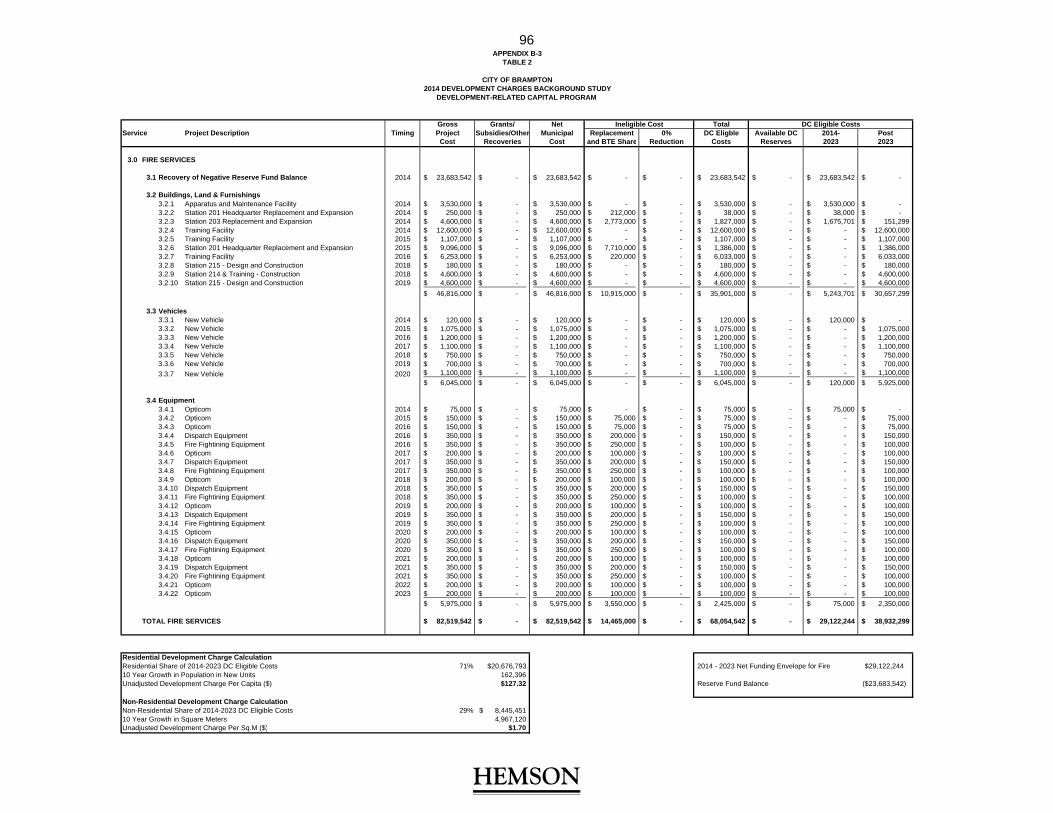
Gross Grants/ Net TotalService Project Description Timing Project Subsidies/Other Municipal Replacement 0% DC Eligble Available DC 2014- Post
Cost Recoveries Cost and BTE Share Reduction Costs Reserves 2023 2023
3.0 FIRE SERVICES
3.1 Recovery of Negative Reserve Fund Balance 2014 23,683,542$ -$ 23,683,542$ -$ -$ 23,683,542$ -$ 23,683,542$ -$
3.2 Buildings, Land & Furnishings3.2.1 Apparatus and Maintenance Facility 2014 3,530,000$ -$ 3,530,000$ -$ -$ 3,530,000$ -$ 3,530,000$ -$ 3.2.2 Station 201 Headquarter Replacement and Expansion 2014 250,000$ -$ 250,000$ 212,000$ -$ 38,000$ -$ 38,000$ -$ 3.2.3 Station 203 Replacement and Expansion 2014 4,600,000$ -$ 4,600,000$ 2,773,000$ -$ 1,827,000$ -$ 1,675,701$ 151,299$ 3.2.4 Training Facility 2014 12,600,000$ -$ 12,600,000$ -$ -$ 12,600,000$ -$ -$ 12,600,000$ 3.2.5 Training Facility 2015 1,107,000$ -$ 1,107,000$ -$ -$ 1,107,000$ -$ -$ 1,107,000$ 3.2.6 Station 201 Headquarter Replacement and Expansion 2015 9,096,000$ -$ 9,096,000$ 7,710,000$ -$ 1,386,000$ -$ -$ 1,386,000$ 3.2.7 Training Facility 2016 6,253,000$ -$ 6,253,000$ 220,000$ -$ 6,033,000$ -$ -$ 6,033,000$ 3.2.8 Station 215 - Design and Construction 2018 180,000$ -$ 180,000$ -$ -$ 180,000$ -$ -$ 180,000$ 3.2.9 Station 214 & Training - Construction 2018 4,600,000$ -$ 4,600,000$ -$ -$ 4,600,000$ -$ -$ 4,600,000$ 3.2.10 Station 215 - Design and Construction 2019 4,600,000$ -$ 4,600,000$ -$ -$ 4,600,000$ -$ -$ 4,600,000$
46,816,000$ -$ 46,816,000$ 10,915,000$ -$ 35,901,000$ -$ 5,243,701$ 30,657,299$
3.3 Vehicles3.3.1 New Vehicle 2014 120,000$ -$ 120,000$ -$ -$ 120,000$ -$ 120,000$ -$ 3.3.2 New Vehicle 2015 1,075,000$ -$ 1,075,000$ -$ -$ 1,075,000$ -$ -$ 1,075,000$ 3.3.3 New Vehicle 2016 1,200,000$ -$ 1,200,000$ -$ -$ 1,200,000$ -$ -$ 1,200,000$ 3.3.4 New Vehicle 2017 1,100,000$ -$ 1,100,000$ -$ -$ 1,100,000$ -$ -$ 1,100,000$ 3.3.5 New Vehicle 2018 750,000$ -$ 750,000$ -$ -$ 750,000$ -$ -$ 750,000$ 3.3.6 New Vehicle 2019 700,000$ -$ 700,000$ -$ -$ 700,000$ -$ -$ 700,000$
3.3.7 New Vehicle 2020 1,100,000$ -$ 1,100,000$ -$ -$ 1,100,000$ -$ -$ 1,100,000$
6,045,000$ -$ 6,045,000$ -$ -$ 6,045,000$ -$ 120,000$ 5,925,000$
3.4 Equipment3.4.1 Opticom 2014 75,000$ -$ 75,000$ -$ -$ 75,000$ -$ 75,000$ -$ 3.4.2 Opticom 2015 150,000$ -$ 150,000$ 75,000$ -$ 75,000$ -$ -$ 75,000$ 3.4.3 Opticom 2016 150,000$ -$ 150,000$ 75,000$ -$ 75,000$ -$ -$ 75,000$ 3.4.4 Dispatch Equipment 2016 350,000$ -$ 350,000$ 200,000$ -$ 150,000$ -$ -$ 150,000$ 3.4.5 Fire Fightining Equipment 2016 350,000$ -$ 350,000$ 250,000$ -$ 100,000$ -$ -$ 100,000$ 3.4.6 Opticom 2017 200,000$ -$ 200,000$ 100,000$ -$ 100,000$ -$ -$ 100,000$ 3.4.7 Dispatch Equipment 2017 350,000$ -$ 350,000$ 200,000$ -$ 150,000$ -$ -$ 150,000$ 3.4.8 Fire Fightining Equipment 2017 350,000$ -$ 350,000$ 250,000$ -$ 100,000$ -$ -$ 100,000$ 3.4.9 Opticom 2018 200,000$ -$ 200,000$ 100,000$ -$ 100,000$ -$ -$ 100,000$ 3.4.10 Dispatch Equipment 2018 350,000$ -$ 350,000$ 200,000$ -$ 150,000$ -$ -$ 150,000$ 3.4.11 Fire Fightining Equipment 2018 350,000$ -$ 350,000$ 250,000$ -$ 100,000$ -$ -$ 100,000$ 3.4.12 Opticom 2019 200,000$ -$ 200,000$ 100,000$ -$ 100,000$ -$ -$ 100,000$ 3.4.13 Dispatch Equipment 2019 350,000$ -$ 350,000$ 200,000$ -$ 150,000$ -$ -$ 150,000$ 3.4.14 Fire Fightining Equipment 2019 350,000$ -$ 350,000$ 250,000$ -$ 100,000$ -$ -$ 100,000$ 3.4.15 Opticom 2020 200,000$ -$ 200,000$ 100,000$ -$ 100,000$ -$ -$ 100,000$ 3.4.16 Dispatch Equipment 2020 350,000$ -$ 350,000$ 200,000$ -$ 150,000$ -$ -$ 150,000$ 3.4.17 Fire Fightining Equipment 2020 350,000$ -$ 350,000$ 250,000$ -$ 100,000$ -$ -$ 100,000$ 3.4.18 Opticom 2021 200,000$ -$ 200,000$ 100,000$ -$ 100,000$ -$ -$ 100,000$ 3.4.19 Dispatch Equipment 2021 350,000$ -$ 350,000$ 200,000$ -$ 150,000$ -$ -$ 150,000$ 3.4.20 Fire Fightining Equipment 2021 350,000$ -$ 350,000$ 250,000$ -$ 100,000$ -$ -$ 100,000$ 3.4.21 Opticom 2022 200,000$ -$ 200,000$ 100,000$ -$ 100,000$ -$ -$ 100,000$ 3.4.22 Opticom 2023 200,000$ -$ 200,000$ 100,000$ -$ 100,000$ -$ -$ 100,000$
5,975,000$ -$ 5,975,000$ 3,550,000$ -$ 2,425,000$ -$ 75,000$ 2,350,000$
TOTAL FIRE SERVICES 82,519,542$ -$ 82,519,542$ 14,465,000$ -$ 68,054,542$ -$ 29,122,244$ 38,932,299$
Residential Development Charge CalculationResidential Share of 2014-2023 DC Eligible Costs 71% $20,676,793 2014 - 2023 Net Funding Envelope for Fire $29,122,24410 Year Growth in Population in New Units 162,396 Unadjusted Development Charge Per Capita ($) $127.32 Reserve Fund Balance ($23,683,542)
Non-Residential Development Charge CalculationNon-Residential Share of 2014-2023 DC Eligible Costs 29% 8,445,451$ 10 Year Growth in Square Meters 4,967,120 Unadjusted Development Charge Per Sq.M ($) $1.70
DC Eligible CostsIneligible Cost
APPENDIX B-3TABLE 2
CITY OF BRAMPTON2014 DEVELOPMENT CHARGES BACKGROUND STUDY
DEVELOPMENT-RELATED CAPITAL PROGRAM
HEMSON
96

TABLE 3 - PAGE 1
3.00 FIRE SERVICES
OPENING CASH BALANCE FROM APPLICABLE RESERVES 2014 2015 2016 2017 2018 2019 2020 2021 2022 2023 TOTAL
OPENING CASH BALANCE ($000) 0.0 (19,010.5) (17,580.1) (16,006.2) (14,110.1) (12,004.3) (9,735.4) (7,390.4) (4,991.0) (2,587.8)
2014-2023 RESIDENTIAL FUNDING REQUIREMENTS3.00 Fire Services : Non Inflated $20,676.79 $0.00 $0.00 $0.00 $0.00 $0.00 $0.00 $0.00 $0.00 $0.00 $20,676.83.00 Fire Services: Inflated $20,676.79 $0.00 $0.00 $0.00 $0.00 $0.00 $0.00 $0.00 $0.00 $0.00 $20,676.8
POPULATION GROWTH - Population in New Units 14,619 16,034 16,131 17,281 17,586 17,523 16,894 16,135 15,096 15,097 162,396
REVENUE - current ($000) - Dev. Charge Receipts 2,175.1 2,433.4 2,497.1 2,728.7 2,832.3 2,878.7 2,830.9 2,757.6 2,631.7 2,684.5 $26,450.0
- Interest on Opening Balance 0.0 (1,045.6) (966.9) (880.3) (776.1) (660.2) (535.4) (406.5) (274.5) (142.3) ($5,687.9) - Interest on In-year Transactions (excl.int.) (508.8) 42.6 43.7 47.8 49.6 50.4 49.5 48.3 46.1 47.0 ($84.0)
TOTAL REVENUE 1,666.3 1,430.4 1,573.9 1,896.1 2,105.8 2,268.8 2,345.0 2,399.4 2,403.2 2,589.1 $20,678.1
CLOSING CASH BALANCE (19,010.5) (17,580.1) (16,006.2) (14,110.1) (12,004.3) (9,735.4) (7,390.4) (4,991.0) (2,587.8) 1.4
2014 Adjusted Charge Per Capita $148.79 Allocation of Capital Program
Residential Sector 71.0%
Non-Residential Sector 29.0%
Rates for 2014
Inflation Rate 2.0%
Interest Rate on Positive Balances 3.5%
Interest Rate on Negative Balances 5.5%
APPENDIX B.3
CITY OF BRAMPTONCASHFLOW AND DETERMINATION OF DEVELOPMENT CHARGE
FIRE SERVICESRESIDENTIAL DEVELOPMENT CHARGE
HEMSON
97

TABLE 3 - PAGE 2
3.00 FIRE DEPARTMENT
OPENING CASH BALANCE FROM APPLICABLE RESERVES 2014 2015 2016 2017 2018 2019 2020 2021 2022 2023 TOTAL
OPENING CASH BALANCE ($000) $0.00 ($7,566.25) ($6,782.05) ($5,976.80) ($5,251.90) ($4,547.88) ($3,724.96) ($2,853.22) ($1,937.09) ($1,018.90)
2009-2018 NON-RESIDENTIAL FUNDING REQUIREMENTS
3.00 Fire Department : Non Inflated $8,445.45 $0.00 $0.00 $0.00 $0.00 $0.00 $0.00 $0.00 $0.00 $0.00 $8,445.45
3.00 Fire Department: Inflated $8,445.45 $0.00 $0.00 $0.00 $0.00 $0.00 $0.00 $0.00 $0.00 $0.00 $8,445.45
NON-RESIDENTIAL GROWTH
- Sq. Metres in New Buildings 549,100 587,100 565,010 495,300 457,610 484,850 476,950 466,050 436,300 448,850 4,967,120
REVENUE - current ($000)
- Dev. Charge Receipts 1,081.7 1,179.7 1,158.0 1,035.5 975.8 1,054.6 1,058.1 1,054.6 1,007.1 1,056.7 $10,661.80
- Interest on Opening Balance 0.0 (416.1) (373.0) (328.7) (288.9) (250.1) (204.9) (156.9) (106.5) (56.0) ($2,181.25)
- Interest on In-year Transactions (excl.int.) (202.5) 20.6 20.3 18.1 17.1 18.5 18.5 18.5 17.6 18.5 ($34.85)
TOTAL REVENUE 879.2 784.2 805.3 724.9 704.0 822.9 871.7 916.1 918.2 1,019.2 $8,445.70
CLOSING CASH BALANCE (7,566.3) (6,782.1) (5,976.8) (5,251.9) (4,547.9) (3,725.0) (2,853.2) (1,937.1) (1,018.9) 0.2
Allocation of Capital Program
2014 Adjusted Charge Per Capita $1.97 Residential Sector 71.0%
Non-Residential Sector 29.0%
Rates for 2014
Inflation Rate: 2.0%
Interest Rate on Positive Balances 3.5%
Interest Rate on Negative Balances 5.5%
APPENDIX B.3
FIRE DEPARTMENTNON-RESIDENTIAL DEVELOPMENT CHARGE
CITY OF BRAMPTONCASHFLOW AND DETERMINATION OF DEVELOPMENT CHARGE
HEMSON
98

APPENDIX B.4
RECREATION SERVICES
HEMSON
99

APPENDIX B.4
RECREATION SERVICES
The Public Services Department is responsible for the provision of Recreation services in the City of Brampton. Recreation services are delivered through a variety of indoor facilities including community centres, gymnasiums and arenas, as well as parkland and outdoor facilities. Cultural facilities are not eligible to be recovered through development charges and are excluded from this study.
TABLE 1 HISTORIC SERVICE LEVELS
The City operates 48 indoor recreation facilities of various types. The inventory includes 12 major community centres and 7 minor community centres. These centres total 1.11 million and 184,900 square feet, respectively, with a combined value of $505.34 million. The 30,500 square feet of gymnasiums are valued at $8.53 million and seniors centres, which occupy 39,900 square feet totalling $11.93 million. There are two stand-alone arenas in the City of Brampton, which are valued at $18.40 million. The remaining 141,300 square feet of indoor recreation space add $49.33 million to the total value of the inventory.
The City owns a substantial amount of equipment used to provide recreation services. This includes fitness equipment, ice resurfacers, operations equipment, audio/video equipment, furniture and miscellaneous equipment. The total replacement value of all indoor recreation equipment in 2013 was $41.34 million.
The land associated with these indoor facilities totals 140.88 acres, valued at $99.49 million.
The City of Brampton also provides outdoor recreation facilities to the local population. In total, there are over 700 park facilities offered, including soccer fields, baseball diamonds, football fields, tennis courts, bocce courts, batting cages, cricket pitches, rugby fields, running tracks, splash pads, skateboard parks, lacrosse fields, and playgrounds. The total value of these facilities in 2013 was $122.82 million.
Also included in the outdoor recreation inventory of capital assets are outdoor buildings, park equipment and special park facilities. In total, there are 132,000square feet of outdoor building space occupying 17.79 acres of land in Brampton. The total
HEMSON
100

value of the buildings and land for these structures is valued at approximately $37.88 million. Equipment associated with outdoor park buildings totals $3.72 million. Outdoor maintenance equipment, which includes miscellaneous tools, mowers, forklifts, and generators totals $2.11 million. The remaining special park facilities include various club houses and infrastructure, such as lawn bowling clubs, band shells, boathouses, mini-golf courses, greenhouses, outdoor swimming pools and rinks, and golf clubs. These facilities, as well as the 100.19 acres of land with which they are associated, are valued at $89.04 million.
The City of Brampton’s recreation inventory also includes tableland parkland, valleylands and other non-developable natural heritage lands. Together, these items amount to almost 3,700 acres of developed parkland, valued at $462.89 million.
Finally, the parks and recreation fleet and maintenance equipment inventory includes both City-owned items and rented items that provide services to the residents of Brampton. The total recreation related fleet and equipment is valued at approximately $24.18 million.
The combined value of capital assets for Recreation is valued at $1.47 billion. The ten year historic average service level is $2,669.46 per capita, and this, multiplied by the ten-year forecast of net population growth, results in a ten year maximum allowable funding envelope of $384.67 million. No uncommitted excess capacity has been identified for this service.
Recreation is a service for which development-related capital costs must be reduced by ten per cent under the DCA. The resulting net maximum allowable funding envelope brought forward to the development charges calculation is reduced to $346.20 million.
TABLE 2 2014–2023 PROVISIONAL DEVELOPMENT-RELATED CAPITAL BUDGET& CALCULATION OF THE “UNADJUSTED” DEVELOPMENT CHARGES
The largest project of the Major Facilities component of the Recreation capital program related to the construction of the new Mississauga/Embleton Community Recreation Centre. This is proposed as a four year phased development project to occur between 2014 and 2018 for a total gross project cost of $51.21 million. No other recreation centres will be decommissioned as a result of the construction of this new centre, therefore, no replacement shares have been removed from the total project
HEMSON
101

cost. The remaining major facilities projects include the repurposing of the Old Flower City Community Campus Building for a total cost of $11.80 million, and the modernization of existing facilities, for a total cost of $41.10 million. Recognizing that a portion of the facility modernizations will benefit the existing community, approximately 40 per cent, or $16.44 million, is considered to be the replacement and benefit to existing share, which will not be recovered through development charges.
The park facility and equipment/fleet amounts to a total gross cost of $10.45 million. This provides for new indoor fields (FCCC Lawn Bowling) in 2016 for a total gross cost of $4.00 million. The capital program also includes a provision of $6.45 million to cover the cost of acquiring recreation related fleet and equipment over the ten-year planning period while maintaining the average historic level of service. All of these projects are deemed to be entirely development-related and neither replacement nor benefit to existing shares has been deducted.
The City also intends to continue the development of parkland. This program totals $310.60 million and includes various developments such as Gore Meadows, Northwest Brampton Community Park, Eldorado Park, Loafers Lake, Torbram/Sandalwood, City valleylands and the Heritage/Bovaird City-wide Park. In addition, new community and neighbourhood parks are planned throughout the planning period. However, the City anticipates receiving about $10.68 million in CIL to offset the cost of acquiring the North West Brampton Community Park in 2016. Additionally, $5.93 million in replacement and benefit to existing shares have been identified, and therefore, this amount will not be recovered through development charges.
The ten year capital forecast for Recreation totals $425.41 million, of which $10.68 million is to be funded by CIL. $22.37 million is identified as a replacement or benefit to existing share, and the legislated ten per cent discount totals $39.24 million. These shares are netted off of the net municipal costs, leaving $353.12 million as the total development related costs. $3.21 million is available in the Recreation DC reserve fund balance to fund development-related projects. An amount of $3.71 million represents the portion of the development-related cost which exceeds the maximum allowable funding envelope and is deemed to benefit growth beyond the 2014–2023 period. This share can be recovered through subsequent development charges studies.
HEMSON
102

The 2014–2023 DC costs eligible for recovery amount to $346.20 million which is allocated entirely against future residential development in the City. This results in an unadjusted development charge of $2,131.83 per capita.
TABLE 3 CASH FLOW ANALYSIS
After cash flow consideration, the residential calculated charge increases to $2,153.53 per capita. The following table summarizes the calculation of the Recreation development charge.
10-year Hist.Service Level
$/capita Total Net DC Recoverable $/capita $/sq.m $/capita $/sq.m
$2,669.46 $425,411 $346,202 $2,131.83 $0.00 $2,153.53 $0.00
RECREATION SERVICES SUMMARY2014-2023 Unadjusted Adjusted
Development-Related Capital Program ($000's) Development Charge Development Charge
HEMSON
103

RECREATION
FACILITIES
INVENTORY OF CAPITAL ASSETS
MAJOR COMMUNITY CENTRES UNIT COST
Facility Name 2004 2005 2006 2007 2008 2009 2010 2011 2012 2013 ($/sq.ft)
Brampton Soccer Centre - - - 134,309 134,309 134,309 134,309 134,309 134,309 134,309 $346
Cassie Campell Community Centre - - - - 166,355 166,355 166,355 166,355 166,355 166,355 $407
Century Gardens Recreation Complex 77,129 77,129 77,129 77,129 114,904 114,904 114,904 114,904 114,904 114,904 $444
Chinguacousy Wellness Centre 43,188 43,188 43,188 43,188 43,188 43,188 43,188 43,188 43,188 43,188 $444
Chris Gibson Recreation Centre 51,272 51,272 51,272 51,272 51,272 51,272 51,272 51,272 51,272 51,272 $444
Earnscliffe Recreation Centre 47,699 47,699 47,699 90,493 90,493 90,493 90,493 90,493 90,493 90,493 $444
Gore Meadows Community Centre - - - - - - - - - 43,394 $378
Greenbriar Recreation Centre 44,575 44,575 44,575 44,575 44,575 44,575 44,575 44,575 44,575 44,575 $317
Jim Archdekin Recreation Centre 47,052 47,052 47,052 47,052 47,052 47,052 47,052 47,052 47,052 47,052 $375
PowerAde Centre 152,040 152,040 152,040 152,040 152,040 152,040 152,040 152,040 152,040 152,040 $375
South Fletcher's Sportsplex 159,642 159,642 159,642 159,642 159,642 159,642 159,642 159,642 159,642 159,642 $359
Terry Miller Recreation Centre 60,344 60,344 60,344 60,344 60,344 60,344 60,344 60,344 60,344 60,344 $317
Total (sq.ft.) 682,941 682,941 682,941 860,044 1,064,174 1,064,174 1,064,174 1,064,174 1,064,174 1,107,568
Total ($000) $262,562.4 $262,562.4 $262,562.4 $328,049.7 $412,569.0 $412,569.0 $412,569.0 $412,569.0 $412,569.0 $428,972.0
MINOR COMMUNITY CENTRES UNIT COST
Facility Name 2004 2005 2006 2007 2008 2009 2010 2011 2012 2013 ($/sq.ft)
Balmoral Recreation Centre 17,439 17,439 17,439 17,439 17,439 17,439 17,439 17,439 17,439 17,439 $317
Brampton Curling Club 28,258 28,258 28,258 28,258 28,258 28,258 28,258 28,258 28,258 28,258 $386
Centre for Sports Excellence (formerly McMurchy Pool) 38,527 38,527 38,527 38,527 38,527 38,527 38,527 38,527 38,527 38,527 $444
Chinguacousy Curling Club 26,857 26,857 26,857 26,857 26,857 26,857 26,857 32,539 32,539 32,539 $386
Ellen Mitchell Recreation Centre 14,178 14,178 14,178 14,178 14,178 14,178 14,178 14,178 14,178 14,178 $444
Howden Recreation Centre 23,080 23,080 23,080 23,080 23,080 23,080 23,080 23,080 23,080 23,080 $444
Loafer's Lake Recreation Centre 30,913 30,913 30,913 30,913 30,913 30,913 30,913 30,913 30,913 30,913 $444
Total (sq.ft.) 179,252 179,252 179,252 179,252 179,252 179,252 179,252 184,934 184,934 184,934
Total ($000) $74,172.8 $74,172.8 $74,172.8 $74,172.8 $74,172.8 $74,172.8 $74,172.8 $76,366.0 $76,366.0 $76,366.0
APPENDIX B.4
TABLE 1 - PAGE 1
# of Square Feet
# of Square Feet
HEMSON
104

RECREATION
FACILITIES
INVENTORY OF CAPITAL ASSETS
SHARED GYMASIUM FACILITIES UNIT COST
Facility Name 2004 2005 2006 2007 2008 2009 2010 2011 2012 2013 ($/sq.ft)
Century Gardens Rec Ctr / Gordon Graydon Senior Elem. 4,639 4,639 4,639 4,639 4,639 4,639 4,639 4,639 4,639 4,639 $280
Huttonville Community Centre / Huttonville Elem. School 10,637 10,637 10,637 10,637 10,637 10,637 10,637 10,637 10,637 10,637 $280
Jim Archdekin Rec Ctr / Heart Lake Secondary School 5,753 5,753 5,753 5,753 5,753 5,753 5,753 5,753 5,753 5,753 $280
Ken Giles Community Ctr / Sir Wilfred Laurier Elem. School 2,666 2,666 2,666 2,666 2,666 2,666 2,666 2,666 2,666 2,666 $280
Mount Pleasant Comm Ctr / MP Village Elementary School - - - - - - - 2,543 2,543 2,543 $280
Terry Miller Rec Ctr / Judith Nyman Secondary School 4,216 4,216 4,216 4,216 4,216 4,216 4,216 4,216 4,216 4,216 $280
Total (sq.ft.) 27,911 27,911 27,911 27,911 27,911 27,911 27,911 30,454 30,454 30,454
Total ($000) $7,815.1 $7,815.1 $7,815.1 $7,815.1 $7,815.1 $7,815.1 $7,815.1 $8,527.1 $8,527.1 $8,527.1
SENIOR CENTRES UNIT COST
Facility Name 2004 2005 2006 2007 2008 2009 2010 2011 2012 2013 ($/sq.ft)
Centennial Recreation Centre 7,766 7,766 7,766 - - - - - - - $279
FCCC Seniors Centre - - 15,224 15,224 15,224 15,224 15,224 15,224 15,224 15,224 $301
FCCC Seniors Centre Gymnasium 10,939 10,939 10,939 10,939 $322
Knightbridge Community Centre 6,567 6,567 6,567 6,567 6,567 6,567 6,567 6,567 6,567 6,567 $279
Snelgrove Community Centre 7,153 7,153 7,153 7,153 7,153 7,153 7,153 7,153 7,153 7,153 $278
Total (sq.ft.) 21,486 21,486 36,710 28,944 28,944 28,944 39,883 39,883 39,883 39,883
Total ($000) $5,995.1 $5,995.1 $10,579.0 $8,409.4 $8,409.4 $8,409.4 $11,931.8 $11,931.8 $11,931.8 $11,931.8
ARENAS UNIT COST
Facility Name 2004 2005 2006 2007 2008 2009 2010 2011 2012 2013 ($/sq.ft)
Memorial Arena 33,128 33,128 33,128 33,128 33,128 33,128 33,128 33,128 33,128 33,128 $265
Victoria Park Arena 35,379 35,379 35,379 35,379 35,379 35,379 35,379 35,379 35,379 35,379 $272
Total (sq.ft.) 68,507 68,507 68,507 68,507 68,507 68,507 68,507 68,507 68,507 68,507
Total ($000) $18,402.5 $18,402.5 $18,402 $18,402 $18,402.5 $18,402.5 $18,402.5 $18,402.5 $18,402.5 $18,402.5
APPENDIX B.4
TABLE 1 - PAGE 2
# of Square Feet
# of Square Feet
# of Square Feet
HEMSON
105

RECREATION
FACILITIES
INVENTORY OF CAPITAL ASSETS
OTHER INDOOR FACILITIES UNIT COST
Facility Name 2004 2005 2006 2007 2008 2009 2010 2011 2012 2013 ($/sq.ft)
Alderlea - - - - - - - - - 10,153 $741
Avondale Community Centre 6,928 6,928 6,928 6,928 6,928 6,928 6,928 6,928 6,928 6,928 $350
Brampton Tennis Club 1,118 1,118 1,118 1,118 1,118 1,118 1,118 1,118 1,118 1,118 $108
Castlemore Bocce Courts 5,647 5,647 5,647 5,647 5,647 5,647 5,647 5,647 5,647 5,647 $167
Castlemore Community Centre (former Fire Station 217) - - - - - - - - 962 962 $210
Central Public School Recreation Centre 25,930 25,930 25,930 25,930 25,930 25,930 25,930 25,930 25,930 25,930 $352
Chinguacousy Park Optimist Club and Ski Chalet (New) - - - - - - - - 18,428 18,428 $437
Ebenezer Hall 1,500 1,500 1,500 1,500 1,500 1,500 1,500 2,798 2,798 2,798 $445
FCCC - Dorm Building "D" 8,045 8,045 8,045 8,045 8,045 8,045 8,045 8,045 8,045 8,045 $286
FCCC - Dorm Building "E" 7,415 7,415 7,415 7,415 7,415 7,415 7,415 7,415 7,415 7,415 $286
FCCC - Dorm Building "F" 8,045 8,045 8,045 8,045 8,045 8,045 8,045 8,045 8,045 8,045 $286
FCCC - Gymnasium 21,538 21,538 21,538 21,538 - - - - - - $267
Ken Giles Recreation Centre 28,907 28,907 28,907 28,907 28,907 28,907 28,907 28,907 28,907 28,907 $267
Mount Pleasant Community Centre - - - - - - - 2,523 2,523 2,523 $450
Norton Place Recreation Centre 1,341 1,341 1,341 1,341 1,341 1,341 1,341 1,341 1,341 1,341 $267
Old Optimist Community Centre (Chinguacousy) 6,985 6,985 6,985 6,985 6,985 6,985 6,985 - - - $276
Professor's Lake Recreation Centre 13,061 13,061 13,061 13,061 13,061 13,061 13,061 13,061 13,061 13,061 $289
Total (sq.ft.) 136,460 136,460 136,460 136,460 114,922 114,922 114,922 111,758 131,148 141,301
Total ($000) $39,513.7 $39,513.7 $39,513.7 $39,513.7 $33,764.1 $33,764.1 $33,764.1 $33,547.4 $41,802.6 $49,326.0
# of Square Feet
APPENDIX B.4
TABLE 1 - PAGE 3
HEMSON
106

RECREATION
FACILITIES - EQUIPMENT
INVENTORY OF CAPITAL ASSETS
MAJOR COMMUNITY CENTRES ($) UNIT COST
Facility Name 2004 2005 2006 2007 2008 2009 2010 2011 2012 2013 ($/sq.ft)
Brampton Soccer Centre $0 $0 $0 $3,224,405 $3,224,405 $3,224,405 $3,224,405 $3,224,405 $3,224,405 $3,224,405 $24
Cassie Campell Community Centre $0 $0 $0 $0 $4,561,299 $4,561,299 $4,561,299 $4,561,299 $4,561,299 $4,561,299 $27
Century Gardens Recreation Complex $2,092,404 $2,092,404 $2,092,404 $2,092,404 $3,117,188 $3,117,188 $3,117,188 $3,117,188 $3,117,188 $3,117,188 $27
Chinguacousy Wellness Centre $1,177,206 $1,177,206 $1,177,206 $1,177,206 $1,177,206 $1,177,206 $1,177,206 $1,177,206 $1,177,206 $1,177,206 $27
Chris Gibson Recreation Centre $1,353,987 $1,353,987 $1,353,987 $1,353,987 $1,353,987 $1,353,987 $1,353,987 $1,353,987 $1,353,987 $1,353,987 $26
Earnscliffe Recreation Centre $1,298,113 $1,298,113 $1,298,113 $2,462,739 $2,462,739 $2,462,739 $2,462,739 $2,462,739 $2,462,739 $2,462,739 $27
Gore Meadows Community Centre $0 $0 $0 $0 $0 $0 $0 $0 $0 $943,830 $22
Greenbriar Recreation Centre $1,144,049 $1,144,049 $1,144,049 $1,144,049 $1,144,049 $1,144,049 $1,144,049 $1,144,049 $1,144,049 $1,144,049 $26
Jim Archdekin Recreation Centre $1,174,218 $1,174,218 $1,174,218 $1,174,218 $1,174,218 $1,174,218 $1,174,218 $1,174,218 $1,174,218 $1,174,218 $25
PowerAde Centre $3,972,539 $3,972,539 $3,972,539 $3,972,539 $3,972,539 $3,972,539 $3,972,539 $3,972,539 $3,972,539 $3,972,539 $26
South Fletcher's Sportsplex $4,430,469 $4,430,469 $4,430,469 $4,430,469 $4,430,469 $4,430,469 $4,430,469 $4,430,469 $4,430,469 $4,430,469 $28
Terry Miller Recreation Centre $1,654,576 $1,654,576 $1,654,576 $1,654,576 $1,654,576 $1,654,576 $1,654,576 $1,654,576 $1,654,576 $1,654,576 $27
Total ($000) $18,297.6 $18,297.6 $18,297.6 $22,686.6 $28,272.7 $28,272.7 $28,272.7 $28,272.7 $28,272.7 $29,216.5
MINOR COMMUNITY CENTRES ($) UNIT COST
Facility Name 2004 2005 2006 2007 2008 2009 2010 2011 2012 2013 ($/sq.ft)
Balmoral Recreation Centre $618,102 $618,102 $618,102 $618,102 $618,102 $618,102 $618,102 $618,102 $618,102 $618,102 $35
Brampton Curling Club $615,185 $615,185 $615,185 $615,185 $615,185 $615,185 $615,185 $615,185 $615,185 $615,185 $22
Centre for Sports Excellence (formerly McMurchy Pool) $1,377,555 $1,377,555 $1,377,555 $1,377,555 $1,377,555 $1,377,555 $1,377,555 $1,377,555 $1,377,555 $1,377,555 $36
Chinguacousy Curling Club $584,684 $584,684 $584,684 $584,684 $584,684 $584,684 $584,684 $708,383 $708,383 $708,383 $22
Ellen Mitchell Recreation Centre $462,105 $462,105 $462,105 $462,105 $462,105 $462,105 $462,105 $462,105 $462,105 $462,105 $33
Howden Recreation Centre $740,580 $740,580 $740,580 $740,580 $740,580 $740,580 $740,580 $740,580 $740,580 $740,580 $32
Loafer's Lake Recreation Centre $925,749 $925,749 $925,749 $925,749 $925,749 $925,749 $925,749 $925,749 $925,749 $925,749 $30
Total ($000) $5,324.0 $5,324.0 $5,324.0 $5,324.0 $5,324.0 $5,324.0 $5,324.0 $5,447.7 $5,447.7 $5,447.7
Value of Equipment ($)
TABLE 1 - PAGE 4
Value of Equipment ($)
APPENDIX B.4
HEMSON
107

RECREATION
FACILITIES - EQUIPMENT
INVENTORY OF CAPITAL ASSETS
SENIOR CENTRES ($) UNIT COST
Facility Name 2004 2005 2006 2007 2008 2009 2010 2011 2012 2013 ($/sq.ft)
Centennial Recreation Centre $198,568 $198,568 $198,568 $0 $0 $0 $0 $0 $0 $0 $26
FCCC Seniors Centre $0 $0 $389,261 $389,261 $389,261 $389,261 389260.8806 $389,261 $389,261 $389,261 $26
FCCC Seniors Centre Gymnasium $0 $0 $0 $0 $0 $0 $279,580 $279,580 $279,580 $279,580 $26
Knightbridge Community Centre $182,321 $182,321 $182,321 $182,321 $182,321 $182,321 $182,321 $182,321 $182,321 $182,321 $28
Snelgrove Community Centre $198,591 $198,591 $198,591 $198,591 $198,591 $198,591 $198,591 $198,591 $198,591 $198,591 $28
Total ($000) $579.5 $579.5 $968.7 $770.2 $770.2 $770.2 $1,049.8 $1,049.8 $1,049.8 $1,049.8
ARENAS ($) UNIT COST
Facility Name 2004 2005 2006 2007 2008 2009 2010 2011 2012 2013 ($/sq.ft)
Memorial Arena $810,238 $810,238 $810,238 $810,238 $810,238 $810,238 $810,238 $810,238 $810,238 $810,238 $24
Victoria Park Arena $865,292 $865,292 $865,292 $865,292 $865,292 $865,292 $865,292 $865,292 $865,292 $865,292 $24
Total ($000) $1,675.5 $1,675.5 $1,675.5 $1,675.5 $1,675.5 $1,675.5 $1,675.5 $1,675.5 $1,675.5 $1,675.5
OTHER INDOOR FACILITIES ($) UNIT COST
Facility Name 2004 2005 2006 2007 2008 2009 2010 2011 2012 2013 ($/sq.ft)
Alderlea $0 $0 $0 $0 $0 $0 $0 $0 $0 $304,590 $30
Avondale Community Centre $145,469 $145,469 $145,469 $145,469 $145,469 $145,469 $145,469 $145,469 $145,469 $145,469 $21
Brampton Tennis Club $29,572 $29,572 $29,572 $29,572 $29,572 $29,572 $29,572 $29,572 $29,572 $29,572 $26
Castlemore Bocce Courts $110,796 $110,796 $110,796 $110,796 $110,796 $110,796 $110,796 $110,796 $110,796 $110,796 $20
Castlemore Community Centre (former Fire Station 217) $0 $0 $0 $0 $0 $0 $0 $0 $23,635 $23,635 $25
Central Public School Recreation Centre $685,873 $685,873 $685,873 $685,873 $685,873 $685,873 $685,873 $685,873 $685,873 $685,873 $26
Chinguacousy Park Optimist Club and Ski Chalet (New) $0 $0 $0 $0 $0 $0 $0 $0 $584,569 $584,569 $32
Ebenezer Hall $39,547 $39,547 $39,547 $39,547 $39,547 $39,547 $39,547 $73,768 $73,768 $73,768 $26
FCCC - Dorm Building "D" $205,097 $205,097 $205,097 $205,097 $205,097 $205,097 $205,097 $205,097 $205,097 $205,097 $25
FCCC - Dorm Building "E" $198,208 $198,208 $198,208 $198,208 $198,208 $198,208 $198,208 $198,208 $198,208 $198,208 $27
FCCC - Dorm Building "F" $157,846 $157,846 $157,846 $157,846 $157,846 $157,846 $157,846 $157,846 $157,846 $157,846 $20
FCCC - Gymnasium $575,724 $575,724 $575,724 $575,724 $0 $0 $0 $0 $0 $0 $27
Ken Giles Recreation Centre $916,982 $916,982 $916,982 $916,982 $916,982 $916,982 $916,982 $916,982 $916,982 $916,982 $32
Mount Pleasant Community Centre $0 $0 $0 $0 $0 $0 $0 $66,518 $66,518 $66,518 $26
Norton Place Recreation Centre $35,846 $35,846 $35,846 $35,846 $35,846 $35,846 $35,846 $35,846 $35,846 $35,846 $27
Old Optimist Community Centre (Chinguacousy) $186,713 $186,713 $186,713 $186,713 $186,713 $186,713 $186,713 $0 $0 $0 $27
Professor's Lake Recreation Centre $414,318 $414,318 $414,318 $414,318 $414,318 $414,318 $414,318 $414,318 $414,318 $414,318 $32
Total ($000) $3,702.0 $3,702.0 $3,702.0 $3,702.0 $3,126.3 $3,126.3 $3,126.3 $3,040.3 $3,648.5 $3,953.1
Value of Equipment ($)
Value of Equipment ($)
Value of Equipment ($)
TABLE 1 - PAGE 5
APPENDIX B.4
HEMSON
108

RECREATION
FACILITIES - LAND
INVENTORY OF CAPITAL ASSETS
MAJOR COMMUNITY CENTRES UNIT COST
Facility Name 2004 2005 2006 2007 2008 2009 2010 2011 2012 2013 ($/acre)
Brampton Soccer Centre - - - 9.97 9.97 9.97 9.97 9.97 9.97 9.97 $700,000
Cassie Campell Community Centre - - - - 10.83 10.83 10.83 10.83 10.83 10.83 $700,000
Century Gardens Recreation Complex 4.69 4.69 4.69 4.69 7.93 7.93 7.93 7.93 7.93 7.93 $700,000
Chinguacousy Wellness Centre 6.06 6.06 6.06 6.06 6.06 6.06 6.06 6.06 6.06 6.06 $700,000
Chris Gibson Recreation Centre 3.48 3.48 3.48 3.48 3.48 3.48 3.48 3.48 3.48 3.48 $700,000
Earnscliffe Recreation Centre 2.72 2.72 2.72 5.87 5.87 5.87 5.87 5.87 5.87 5.87 $700,000
Gore Meadows Community Centre - - - - - - - - - 5.20 $700,000
Greenbriar Recreation Centre 2.57 2.57 2.57 2.57 2.57 2.57 2.57 2.57 2.57 2.57 $700,000
Jim Archdekin Recreation Centre 4.89 4.89 4.89 4.89 4.89 4.89 4.89 4.89 4.89 4.89 $700,000
PowerAde Centre 25.96 25.96 25.96 25.96 25.96 25.96 25.96 25.96 25.96 25.96 $700,000
South Fletcher's Sportsplex 10.82 10.82 10.82 10.82 10.82 10.82 10.82 10.82 10.82 10.82 $700,000
Terry Miller Recreation Centre 2.50 2.50 2.50 2.50 2.50 2.50 2.50 2.50 2.50 2.50 $700,000
Total (acres) 63.70 63.70 63.70 76.82 90.89 90.88 90.88 90.88 90.88 96.08
Total ($000) $44,590.2 $44,590.2 $44,590.2 $53,774.2 $63,619.8 $63,616.0 $63,616.0 $63,616.0 $63,616.0 $67,256.0
MINOR COMMUNITY CENTRES (acres) UNIT COST
Facility Name 2004 2005 2006 2007 2008 2009 2010 2011 2012 2013 ($/acre)
Balmoral Recreation Centre 1.68 1.68 1.68 1.68 1.68 1.68 1.68 1.68 1.68 1.68 $700,000
Brampton Curling Club 2.54 2.54 2.54 2.54 2.54 2.54 2.54 2.54 2.54 2.54 $700,000
Centre for Sports Excellence (formerly McMurchy Pool) 2.64 2.64 2.64 2.64 2.64 2.64 2.64 2.64 2.64 2.64 $700,000
Chinguacousy Curling Club 2.08 2.08 2.08 2.08 2.08 2.08 2.08 2.08 2.08 2.08 $700,000
Ellen Mitchell Recreation Centre 1.50 1.50 1.50 1.50 1.50 1.50 1.50 1.50 1.50 1.50 $700,000
Howden Recreation Centre 2.03 2.03 2.03 2.03 2.03 2.03 2.03 2.03 2.03 2.03 $700,000
Loafer's Lake Recreation Centre 2.83 2.83 2.83 2.83 2.83 2.83 2.83 2.83 2.83 2.83 $700,000
Total (acres) 15.30 15.30 15.30 15.30 15.30 15.30 15.30 15.30 15.30 15.30
Total ($000) $10,710.0 $10,710.0 $10,710.0 $10,710.0 $10,710.0 $10,710.0 $10,710.0 $10,710.0 $10,710.0 $10,710.0
APPENDIX B.4
TABLE 1 - PAGE 6
# of Acres
# of Acres
HEMSON
109

RECREATION
FACILITIES - LAND
INVENTORY OF CAPITAL ASSETS
OTHER INDOOR FACILITIES UNIT COST
Facility Name 2004 2005 2006 2007 2008 2009 2010 2011 2012 2013 ($/acre)
Alderlea - - - - - - - 1.38 1.38 1.38 $700,000
Avondale Community Centre 0.37 0.37 0.37 0.37 0.37 0.37 0.37 0.37 0.37 0.37 $700,000
Brampton Tennis Club 2.01 2.01 2.01 2.01 2.01 2.01 2.91 2.91 2.91 2.91 $1,000,000
Castlemore Bocce Courts 0.51 0.51 0.51 0.51 0.51 0.51 0.51 0.51 0.51 0.51 $700,000
Castlemore Community Centre (former Fire Station 217) - - - - - - - - 0.14 0.14 $700,000
Central Public School Recreation Centre 1.41 1.41 1.41 1.41 1.41 1.41 1.41 1.41 1.41 1.41 $700,000
Ebenezer Hall 0.74 0.74 0.74 0.74 0.74 0.74 0.74 0.74 0.74 0.74 $700,000
FCCC - Dorm Building "D" 0.69 0.69 0.69 0.69 0.69 0.69 0.69 0.69 0.69 0.69 $700,000
FCCC - Dorm Building "E" 0.64 0.64 0.64 0.64 0.64 0.64 0.64 0.64 0.64 0.64 $700,000
FCCC - Dorm Building "F" 0.77 0.77 0.77 0.77 0.77 0.77 0.77 0.77 0.77 0.77 $700,000
FCCC - Gymnasium 1.98 1.98 1.98 1.98 - - - - - - $700,000
Ken Giles Recreation Centre 1.71 1.71 1.71 1.71 1.71 1.71 1.71 1.71 1.71 1.71 $700,000
Mount Pleasant Community Centre - - - - - - - 0.36 0.36 0.36 $700,000
Norton Place Recreation Centre 0.84 0.84 0.84 0.84 0.84 0.84 0.84 0.84 0.84 0.84 $700,000
Optimist Community Centre 0.89 0.89 0.89 0.89 0.89 0.89 0.89 1.12 1.12 1.12 $700,000
Professor's Lake Recreation Centre 1.77 1.77 1.77 1.77 1.77 1.77 1.77 1.77 1.77 1.77 $700,000
Total (acres) 14.33 14.33 14.33 14.33 12.35 12.35 13.25 15.22 15.36 15.36
Total ($000) $10,634.0 $10,634.0 $10,634.0 $10,634.0 $9,248.0 $9,248.0 $10,148.0 $11,527.0 $11,625.0 $11,625.0
SHARED GYMNASIUM FACILITIES UNIT COST
Facility Name 2004 2005 2006 2007 2008 2009 2010 2011 2012 2013 ($/acre)
Century Gardens Rec Ctr / Gordon Graydon Senior Elem. 0.40 0.40 0.40 0.40 0.40 0.40 0.40 0.40 0.40 0.40 $700,000
Huttonville Community Centre / Huttonville Elem. School 0.92 0.92 0.92 0.92 0.92 0.92 0.92 0.92 0.92 0.92 $700,000
Jim Archdekin Rec Ctr / Heart Lake Secondary School 0.49 0.49 0.49 0.49 0.49 0.49 0.49 0.49 0.49 0.49 $700,000
Ken Giles Community Ctr / Sir Wilfred Laurier Elem. School 0.23 0.23 0.23 0.23 0.23 0.23 0.23 0.23 0.23 0.23 $700,000
Mount Pleasant Comm Ctr / MP Village Elementary School - - - - - - - 0.22 0.22 0.22 $700,000
Terry Miller Rec Ctr / Judith Nyman Secondary School 0.36 0.36 0.36 0.36 0.36 0.36 0.36 0.36 0.36 0.36 $700,000
Total (acres) 2.40 2.40 2.40 2.40 2.40 2.40 2.40 2.62 2.62 2.62
Total ($000) $1,680.0 $1,680.0 $1,680.0 $1,680.0 $1,680.0 $1,680.0 $1,680.0 $1,834.0 $1,834.0 $1,834.0
# of Acres
APPENDIX B.4
TABLE 1 - PAGE 7
# of Acres
HEMSON
110

RECREATION
FACILITIES - LAND
INVENTORY OF CAPITAL ASSETS
SENIOR CENTRES UNIT COST
Facility Name 2004 2005 2006 2007 2008 2009 2010 2011 2012 2013 ($/acre)
Centennial Recreation Centre 1.01 1.01 1.01 - - - - - - - $700,000
FCCC Seniors Centre Gymnasium - - - - - - 1.01 1.01 1.01 1.01 $700,000
FCCC Seniors Centre - - 2.25 2.25 2.25 2.25 2.25 2.25 2.25 2.25 $700,000
Knightbridge Community Centre 0.30 0.30 0.30 0.30 0.30 0.30 0.30 0.30 0.30 0.30 $700,000
Snelgrove Community Centre 2.00 2.00 2.00 2.00 2.00 2.00 2.00 2.00 2.00 2.00 $700,000
Total (acres) 3.31 3.31 5.56 4.55 4.55 4.55 5.56 5.56 5.56 5.56
Total ($000) $2,317.0 $2,317.0 $3,892.0 $3,185.0 $3,185.0 $3,185.0 $3,892.0 $3,892.0 $3,892.0 $3,892.0
ARENAS UNIT COST
Facility Name 2004 2005 2006 2007 2008 2009 2010 2011 2012 2013 ($/acre)
Memorial Arena 2.62 2.62 2.62 2.62 2.62 2.62 2.62 2.62 2.62 2.62 $700,000
Victoria Park Arena 3.34 3.34 3.34 3.34 3.34 3.34 3.34 3.34 3.34 3.34 $700,000
Total (acres) 5.96 5.96 5.96 5.96 5.96 5.96 5.96 5.96 5.96 5.96
Total ($000) $4,172.0 $4,172.0 $4,172.0 $4,172.0 $4,172.0 $4,172.0 $4,172.0 $4,172.0 $4,172.0 $4,172.0
# of Acres
# of Acres
APPENDIX B.4
TABLE 1 - PAGE 8
HEMSON
111

RECREATION
PARK FACILITIES
INVENTORY OF CAPITAL ASSETS
Major Soccer - Lighted # of Fields UNIT COST
Park Name 2004 2005 2006 2007 2008 2009 2010 2011 2012 2013 ($/Field)
Avondale (Stadium) - - 1 1 1 1 1 1 1 1 $573,730
Century Gardens Park 1 1 1 1 1 1 1 1 1 1 $466,585
Chinguacousy 2 2 2 2 2 2 - - - - $395,300
Chris Gibson Park 1 1 1 1 1 1 1 1 1 1 $300,600
Creditview Sandalwood - - - - 2 2 2 2 2 2 $300,600
Morris Kerbel District Park 1 1 1 1 1 1 1 1 1 1 $466,585
Norton Place 1 1 1 1 1 1 1 1 1 1 $395,300
Victoria Park (Stadium) 1 1 1 1 1 1 1 1 1 1 $627,860
Subtotal (#) 7 7 8 8 10 10 8 8 8 8
Subtotal ($) $3,047,530 $3,047,530 $3,621,260 $3,621,260 $4,222,460 $4,222,460 $3,431,860 $3,431,860 $3,431,860 $3,431,860
Major Diamond - Lighted # of Fields UNIT COST
Park Name 2004 2005 2006 2007 2008 2009 2010 2011 2012 2013 ($/Diamond)
Blue Oak Park 1 1 1 1 1 1 1 1 1 1 $710,520
Bramalea Community 2 2 2 2 2 2 2 2 2 2 $710,520
Brampton Sports Park 5 5 5 5 5 5 5 5 5 5 $710,520
Caterpillar Lands 2 2 - - - - - - - - $465,565
Carabram Park 1 1 1 1 1 1 1 1 1 1 $465,565
Century Gardens 1 1 1 1 - - - - - - $465,565
Chinguacousy Park 2 2 2 2 2 2 - - - - $465,565
Chris Gibson 2 2 2 2 2 2 2 2 2 2 $465,565
Chris Gibson 1 1 1 1 1 1 1 1 1 1 $974,465
Dave Dash (Fairgrounds) 1 1 1 1 1 1 1 1 1 1 $974,465
Drinkwater Community Park 2 2 2 2 2 2 2 2 2 2 $465,565
Duggan Park 2 2 2 2 2 2 2 2 2 2 $465,565
Earnscliffe 1 1 1 1 1 1 1 1 1 1 $710,520
Fairgrounds Park 2 2 2 2 2 2 2 2 2 2 $710,520
Fletchers Green Park 2 2 2 2 2 2 2 2 2 2 $465,565
FCCC - - - - 1 1 1 1 1 1 $974,465
Moorehead Park 1 1 1 1 1 1 1 1 1 1 $465,565
Morris Kerbel District Park 1 1 1 1 1 1 1 1 1 1 $465,565
Morris Kerbel District Park 1 1 1 1 1 1 1 1 1 1 $974,465
Norton Place Park 1 1 1 1 1 1 1 1 1 - $710,520
Rosalea Park 1 1 1 1 1 1 1 1 1 1 $465,565
Sesquicentennial Park 3 7 7 7 7 7 7 7 7 7 $710,520
Teramoto Park - - - - - - - - - 2 $974,465
Victoria Park 2 2 - - - - - - - - $465,565
Subtotal (#) 37 41 37 37 37 37 35 35 35 36
Subtotal ($) $22,426,930 $25,269,010 $23,406,750 $23,406,750 $23,915,650 $23,915,650 $22,984,520 $22,984,520 $22,984,520 $24,222,930
APPENDIX B.4
TABLE 1 - PAGE 9
HEMSON
112

RECREATION
PARK FACILITIES
INVENTORY OF CAPITAL ASSETS
Artificial Turf Fields # of Fields UNIT COST
Park Name 2004 2005 2006 2007 2008 2009 2010 2011 2012 2013 ($/Field)
Creditview Sandalwood (Major Lit Soccer) - - - - - - - - - 2 $953,680
Chinguacousy Park (Terry Fox Stadium / Lit Football) - - - - - - - 1 1 1 $1,726,010
Teramoto Park (Lit Football / Soccer) - - - - - - - - - 1 $437,500
Subtotal (#) - 0 0 0 0 - 0 1 1 4
Subtotal ($) $0 $0 $0 $0 $0 $0 $0 $1,726,010 $1,726,010 $4,070,870
Football # of Fields UNIT COST
Park Name 2004 2005 2006 2007 2008 2009 2010 2011 2012 2013 ($/Field)
Lighted
Chinguacousy Park 1 1 1 - - - - - - - $410,840
Creditview Sandalwood - - - - 2 2 2 2 2 2 $371,770
Unlighted
Chinguacousy Park 1 - - - - - - - - - $237,780
Creditview Sandalwood - - 2 2 - - - - - - $198,710
Subtotal (#) 2 1 3 2 2 2 2 2 2 2
Subtotal ($) $648,620 $410,840 $808,260 $397,420 $743,540 $743,540 $743,540 $743,540 $743,540 $743,540
Major Soccer - Unlighted # of Fields UNIT COST
Park Name 2004 2005 2006 2007 2008 2009 2010 2011 2012 2013 ($/Field)
Blue Oak Park 1 1 1 1 1 1 1 1 1 1 $70,130
Bramalea Ltd. Community Park 2 2 2 2 2 2 2 2 2 2 $287,085
Cherrytree Park 1 1 1 - - - - - - - $70,130
Ching Sandalwood (Cassie Campbell) - - - - 2 2 2 2 2 2 $287,085
Chinguacousy Park 1 1 2 2 2 2 - - - - $241,790
Chris Gibson Park 1 1 1 1 1 1 1 1 1 1 $91,100
Creditview Sandalwood - - 8 8 6 6 6 6 6 4 $241,790
Dixie HWY 407 park - 7 7 7 7 7 7 7 7 7 $185,800
Dixie/Sandalwood 4 4 4 4 4 4 4 4 4 4 $241,790
Eldorado Park 1 1 1 1 1 1 - - - - $241,790
FCCC 2 2 1 1 1 1 1 1 1 1 $241,790
Greenbriar Park S 1 1 1 1 1 1 1 1 1 1 $241,790
Homestead Park 1 1 1 1 1 1 1 1 1 1 $70,130
Leander Park 1 1 1 1 1 1 1 1 1 1 $70,130
Loafer's Lake Park 1 1 1 1 1 1 1 1 1 1 $241,790
Major Oaks Park 1 1 1 1 1 1 1 1 1 1 $185,800
Northampton Park 1 1 2 2 2 2 2 2 2 2 $70,130
Richvale Park 2 2 2 2 2 2 2 2 2 2 $70,130
Subtotal (#) 21 28 37 36 36 36 33 33 33 31
Subtotal ($) $3,759,880 $5,060,480 $7,064,930 $6,994,800 $7,085,390 $7,085,390 $6,360,020 $6,360,020 $6,360,020 $5,876,440
APPENDIX B.4
TABLE 1 - PAGE 10
HEMSON
113

RECREATION
PARK FACILITIES
INVENTORY OF CAPITAL ASSETS
Minor Soccer - Unlighted # of Fields UNIT COST
Park Name 2004 2005 2006 2007 2008 2009 2010 2011 2012 2013 ($/Field)
Balmoral Park 1 1 1 1 1 1 1 1 1 1 $157,425
Batsman Park - - - - - - - - - 4 $157,425
Carabram Park 2 2 2 2 2 2 2 2 2 2 $96,320
Centennial Park 1 1 1 1 1 1 1 1 1 1 $157,425
Earnscliffe Park 2 2 1 1 1 1 1 1 1 1 $157,425
FCCC 2 2 2 2 2 2 2 2 2 2 $157,425
Fred Kline Park 1 1 1 1 1 1 1 1 1 1 $157,425
Greenbriar Park S 1 1 1 1 1 1 1 1 1 1 $157,425
Hilldale Park N 1 1 1 1 1 1 1 1 1 1 $157,425
Jefferson park 2 2 2 2 2 2 2 2 2 2 $16,990
Kingswood Park 1 1 1 1 1 1 1 1 1 1 $96,320
Lafrance Park 1 1 1 1 1 1 1 1 1 1 $16,990
Loafer's Lake Park 1 1 1 1 1 1 1 1 1 1 $157,425
Mosswood Park 1 1 1 1 1 1 1 1 1 1 $16,990
Sandalwood Park 1 1 1 1 1 1 1 1 1 1 $96,320
Torbram Sandalwood Park - - - - 1 1 1 1 1 1 $157,425
Valleybrook Park 1 1 1 1 1 1 1 1 1 1 $96,320
Valleydown Park 1 1 1 1 1 1 1 1 1 1 $16,990
Victoria Park 1 1 1 1 1 1 1 1 1 1 $191,730
South Fletcher's - - - - - - - - 1 1 $157,425
St. John Bosco 1 1 1 1 1 1 1 1 1 1 $16,990
Grenoble 1 1 1 1 1 1 1 1 1 1 $16,990
Subtotal (#) 23 23 22 22 23 23 23 23 24 28
Subtotal ($) $2,366,510 $2,366,510 $2,209,085 $2,209,085 $2,366,510 $2,366,510 $2,366,510 $2,366,510 $2,523,935 $3,153,635
Mini Soccer - Unlighted # of Fields UNIT COST
Park Name 2004 2005 2006 2007 2008 2009 2010 2011 2012 2013 ($/Field)
Armbro Park 1 1 1 1 1 1 1 1 1 1 $16,990
Ashurst Park 2 2 2 2 2 2 2 2 2 2 $16,990
Centennial Park 1 1 1 1 1 1 1 1 1 1 $157,245
Central Public 4 4 4 4 4 4 4 4 4 4 $157,245
Century Gardens Park 2 2 2 2 2 2 2 2 2 2 $191,730
Ching Sandalwood (Cassie Campbell) - - - - 2 2 2 2 2 - $191,730
Chris Gibson Park 2 2 2 2 2 2 2 2 2 2 $101,565
Creditview Sandalwood - 1 8 8 8 8 8 8 8 4 $101,565
D.M.G Ching Park 2 2 2 2 2 2 2 - - - $157,245
Dearborne Park 6 6 6 6 6 6 6 6 6 6 $16,990
Dixie HWY 407 Park - 6 6 6 6 6 6 6 6 6 $101,565
Earnscliffe 4 4 3 3 3 3 3 3 3 3 $157,245
FCCC - - 4 4 4 5 5 5 5 5 $157,245
Fred Kee Park 2 2 2 2 2 2 2 2 2 2 $157,245
APPENDIX B.4
TABLE 1 - PAGE 11
HEMSON
114

RECREATION
PARK FACILITIES
INVENTORY OF CAPITAL ASSETS
Mini Soccer - Unlighted CONT'D # of Fields UNIT COST
Park Name 2004 2005 2006 2007 2008 2009 2010 2011 2012 2013 ($/Field)
Hilldale Park N 1 1 1 1 1 1 1 1 1 1 $157,245
Meadowlands Park 2 2 2 2 2 2 2 2 2 2 $101,565
Seaborn Park 2 2 2 2 2 2 2 2 2 2 $16,990
Sheridan Woodlands 1 1 1 1 1 1 1 1 1 1 $16,990
South Fletcher's 2 2 2 2 2 2 2 2 - - $157,245
Tobram Sandalwood - - - - 12 12 12 12 12 12 $157,245
Weybridge Park 2 2 2 2 2 2 2 2 2 2 $16,990
Subtotal (#) 36 43 53 53 67 68 68 66 64 58
Subtotal ($) $3,543,500 $4,254,455 $5,437,145 $5,437,145 $7,707,545 $7,864,790 $7,864,790 $7,550,300 $7,235,810 $6,446,090
Major Diamond - Unlighted # of Fields UNIT COST
Park Name 2004 2005 2006 2007 2008 2009 2010 2011 2012 2013 ($/Diamond)
Caterpillar Lands 1 1 - - - - - - - - $196,715
Century Gardens Park 1 1 1 1 1 1 1 1 1 1 $544,135
Conservation Drive Park 2 2 2 2 2 2 2 2 2 2 $430,650
County Court Park 3 3 3 3 3 3 3 3 3 3 $430,650
Duggan Park 1 1 1 1 1 1 1 1 1 1 $430,650
Earnscliffe Park 1 1 1 1 1 1 1 1 1 1 $196,715
Fallen Oak Park 1 1 1 1 1 1 1 1 1 1 $430,650
Fred Kline Park 1 1 1 1 1 1 1 1 1 1 $430,650
Madoc Drive Park 1 1 1 1 1 1 1 1 1 1 $196,715
Major William Sharpe 1 1 1 1 1 1 1 1 1 1 $196,715
Moorehead Park 1 1 1 1 1 1 1 1 1 1 $430,650
Ray Lawson 2 2 2 2 2 - - - - - $196,715
Richvale Park 2 2 2 2 2 2 2 2 2 2 $196,715
Sesquicentennial Park 1 1 1 1 1 1 1 1 1 1 $544,135
Subtotal (#) 19 19 18 18 18 16 16 16 16 16
Subtotal ($) $6,537,840 $6,537,840 $6,341,125 $6,341,125 $6,341,125 $5,947,695 $5,947,695 $5,947,695 $5,947,695 $5,947,695
Minor Diamond - Unlighted # of Fields UNIT COST
Park Name 2004 2005 2006 2007 2008 2009 2010 2011 2012 2013 ($/Diamond)
Allan Kerbell Park 1 1 1 1 1 1 1 1 1 1 $199,115
Armbro Park 1 1 1 1 1 1 - - - - $96,705
Ashurst Park 1 1 1 1 1 1 1 1 1 1 $96,705
Bach Park 1 1 1 1 1 1 1 1 1 1 $96,705
Beatty -Fleming Park 1 1 1 1 1 1 1 1 1 1 $96,705
Burton Park 2 2 2 2 2 2 2 2 2 2 $199,115
Castlehill Park 1 1 1 1 1 1 1 1 1 1 $96,705
Central Public 2 2 2 2 2 2 2 2 2 2 $199,115
Cherrytree Park 1 1 1 1 1 1 1 1 1 1 $96,705
Chris Gibson Park 1 1 1 1 1 1 1 1 1 1 $168,880
Donnelly East Park 1 1 1 1 1 1 1 1 1 1 $199,115
Earnscliffe Park 2 2 2 2 2 2 2 2 2 2 $220,085
APPENDIX B.4
TABLE 1 - PAGE 12
HEMSON
115

RECREATION
PARK FACILITIES
INVENTORY OF CAPITAL ASSETS
Minor Diamond - Unlighted CONT'D # of Fields UNIT COST
Park Name 2004 2005 2006 2007 2008 2009 2010 2011 2012 2013 ($/Diamond)
Fred Kee Park 1 1 1 1 1 1 1 1 1 1 $199,115
Fred Kline Park 3 3 3 3 3 3 3 3 3 3 $199,115
Gatesgill 1 1 1 1 1 1 1 1 1 1 $147,910
Greenbriar 1 1 1 1 1 1 1 1 1 1 $220,085
Havelock Park 1 1 1 1 1 1 1 1 1 1 $96,705
Hickory Wood Park 2 2 2 2 2 2 2 2 2 2 $96,705
Jefferson Park 1 1 1 1 1 1 1 1 1 1 $96,705
Kaneff Park 1 1 1 1 1 1 1 1 1 1 $96,705
Kingswood Park 1 1 1 1 1 1 1 1 1 1 $147,910
Knightsbridge Park 1 1 1 1 1 1 1 1 1 1 $147,910
Loafer's Lake Park 1 1 1 1 1 1 1 1 1 1 $199,115
Meadowlands Park 1 1 1 1 1 1 1 1 1 1 $96,705
Nasmith Park 1 1 1 1 1 1 1 1 1 1 $96,705
Notre Dame Park 1 1 1 1 1 1 1 1 1 1 $96,705
Richvale Park 2 2 2 2 2 2 2 2 2 2 $96,705
Sandalwood Park 1 1 1 1 1 1 1 1 1 1 $147,910
Timberlane Park 1 1 1 - - - - - - - $96,705
White Spruce Park 1 1 1 1 1 1 1 1 1 1 $147,910
Subtotal (#) 37 37 37 36 36 36 35 35 35 35
Subtotal ($) $5,402,935 $5,402,935 $5,402,935 $5,306,230 $5,306,230 $5,306,230 $5,209,525 $5,209,525 $5,209,525 $5,209,525
Lighted Tennis UNIT COST
Park Name 2004 2005 2006 2007 2008 2009 2010 2011 2012 2013 ($/Court)
Century Gardens Park 4 4 4 4 4 4 4 4 4 4 $87,350
Chinguacousy Park 6 6 6 6 6 6 6 6 6 6 $85,780
County Court Park 2 2 2 2 2 2 2 2 2 2 $101,120
Drinkwater Community Park 3 3 3 3 3 3 3 3 3 3 $81,235
Earnscliffe Park 4 4 0 3 3 3 3 3 3 3 $90,340
Greenbriar Park S. 3 3 3 1 1 1 1 1 1 1 $109,640
Howden 1 1 1 1 1 - - - - - $109,640
Morris Kerbel District Park 4 4 4 4 4 4 4 4 4 4 $87,350
Richvale 2 2 2 2 2 2 2 2 2 2 $92,015
Sandalwood Park 2 2 2 2 2 2 2 2 2 2 $101,120
Steacy Park 3 3 3 3 3 3 3 3 3 3 $90,340
Valleybrook 2 2 2 2 2 2 2 2 2 2 $101,120
White Spruce Park 2 2 2 2 2 2 2 2 2 2 $94,745
Cassie Campell 0 0 0 0 4 4 4 4 4 4 $87,350
Subtotal (#) 38 38 34 35 39 38 38 38 38 38
Subtotal ($) $3,508,365 $3,508,365 $3,147,005 $3,198,745 $3,548,145 $3,438,505 $3,438,505 $3,438,505 $3,438,505 $3,438,505
# of Courts
APPENDIX B.4
TABLE 1 - PAGE 13
HEMSON
116

RECREATION
PARK FACILITIES
INVENTORY OF CAPITAL ASSETS
Unlighted Tennis UNIT COST
Park Name 2004 2005 2006 2007 2008 2009 2010 2011 2012 2013 ($/Court)
Allen Kerbel Park 2 2 2 2 2 2 2 2 2 2 $67,015
Centennial Park 3 3 3 3 3 3 3 3 3 3 $67,015
Clark Park 2 2 2 2 2 2 2 2 2 2 $57,910
English St. 2 2 2 2 2 2 2 2 2 2 $57,910
Ken Park 2 2 2 2 2 2 2 2 2 2 $57,910
Knightsbridge Park 2 2 2 2 2 2 2 2 2 2 $57,910
Northwood Park 2 2 2 2 2 2 2 2 2 2 $57,910
Peel Village Park 2 2 2 2 2 2 2 2 2 2 $57,910
Vanier Park 2 2 2 2 2 2 2 2 2 2 $57,910
Subtotal (#) 19 19 19 19 19 19 19 19 19 19
Subtotal ($) $1,145,815 $1,145,815 $1,145,815 $1,145,815 $1,145,815 $1,145,815 $1,145,815 $1,145,815 $1,145,815 $1,145,815
Bocce UNIT COST
Park Name 2004 2005 2006 2007 2008 2009 2010 2011 2012 2013 ($/Court)
Lighted
Calvert 4 4 4 4 4 4 4 4 4 4 $19,120
Castlemore 4 4 4 4 4 4 4 4 4 4 $30,410
Flower City COM - - - - 1 1 1 1 1 1 $41,970
Wildfield- St.Johns 1 1 1 1 1 1 1 1 1 1 $26,450
Unlighted
County Court Park 3 3 3 3 3 3 3 3 3 3 $31,690
Subtotal (#) 12 12 12 12 13 13 13 13 13 13
Subtotal ($) $319,640 $319,640 $319,640 $319,640 $361,610 $361,610 $361,610 $361,610 $361,610 $361,610
Batting Cages UNIT COST
Park Name 2004 2005 2006 2007 2008 2009 2010 2011 2012 2013 ($/Cage)
Century Gardens Park 1 1 1 - - - - - - - $63,445
Chinguacousy Park 2 2 1 1 1 1 1 - - - $63,445
Flower City Community Campus - - - - 1 1 1 1 1 1 $63,445
Old Fair Grounds 1 1 1 1 1 1 1 1 1 1 $63,445
Subtotal (#) 4 4 3 2 3 3 3 2 2 2
Subtotal ($) $253,780 $253,780 $190,335 $126,890 $190,335 $190,335 $190,335 $126,890 $126,890 $126,890
# of Courts
# of Courts
# of Facilities
TABLE 1 - PAGE 14
APPENDIX B.4
HEMSON
117

RECREATION
PARK FACILITIES
INVENTORY OF CAPITAL ASSETS
Cricket UNIT COST
Park Name 2004 2005 2006 2007 2008 2009 2010 2011 2012 2013 ($/Facility)
Brampton Sports Park 3 3 3 3 3 3 3 3 3 3 $56,660
Batsman Park - - - - - - - - - 2 $162,490
Camden Park 1 1 1 1 1 1 1 1 1 1 $15,280
Ching Sandalwood (Cassie Campbell) - - - - 1 1 1 1 1 1 $162,490
Creditview/Sandalwood - 2 2 2 2 2 2 2 2 1 $104,980
Dixie/407 - 2 2 2 2 2 2 2 2 2 $104,980
Dixie/Sandalwood 2 2 2 2 2 2 2 2 2 2 $162,490
Earnscliffe - - 2 2 2 2 2 2 2 2 $104,980
Flower City Community Campus - - - - - - 1 1 1 1 $104,980
Teramoto Park - - - - - - - - - 1 $104,980
Torbram/Sandalwood - - - - 1 1 1 1 1 1 $162,490
Subtotal (#) 6 10 12 12 14 14 15 15 15 17
Subtotal ($) $510,240 $930,160 $1,140,120 $1,140,120 $1,465,100 $1,465,100 $1,570,080 $1,570,080 $1,570,080 $1,895,060
Rugby UNIT COST
Park Name 2004 2005 2006 2007 2008 2009 2010 2011 2012 2013 ($/Facility)
Brampton Sports Park 2 2 2 2 2 2 2 2 2 2 $157,430
Subtotal (#) 2 2 2 2 2 2 2 2 2 2
Subtotal ($) $314,860 $314,860 $314,860 $314,860 $314,860 $314,860 $314,860 $314,860 $314,860 $314,860
Multi Purpose Courts UNIT COST
Park Name 2004 2005 2006 2007 2008 2009 2010 2011 2012 2013 ($/Court)
Allan Kerbel Park 1 1 1 1 1 1 1 1 1 1 $29,605
Aloma Park 1 1 1 1 1 - - - - - $68,350
Blue Lake Parkette 1 1 1 1 1 1 1 1 1 1 $68,350
Burnt Elm Park 1 1 1 1 1 1 1 1 1 1 $68,350
Ching Sandalwood 0 0 0 0 1 1 1 1 1 1 $68,350
Dearbourne Park 1 1 1 1 1 1 1 1 1 1 $29,605
Dixie Sandalwood Park (west) 0 0 0 1 1 1 1 1 1 1 $114,530
Dixie Sandalwood Park (east) 0 0 0 1 1 1 1 1 1 1 $48,795
Earnscliffe Park 1 1 1 1 1 1 1 1 1 1 $29,605
McMicking Park 1 1 1 1 1 1 1 1 1 1 $68,350
Fairlawn Park 0 0 0 1 1 1 1 1 1 1 $68,350
Fiddlers Parkette 1 1 1 1 1 1 1 1 1 1 $29,605
Flower City Community Campus 0 0 1 1 1 1 1 1 1 1 $68,350
Gore Meadows East 0 0 0 0 0 - - - - 2 $48,795
Howden Park 1 1 1 1 1 1 1 1 1 1 $90,120
Minaker Park 1 1 1 1 1 1 1 1 1 1 $68,350
Morris Kerbel Park 1 1 1 1 1 1 1 1 1 1 $29,605
Peelton Park 1 1 1 1 1 1 1 1 1 1 $29,605
Teramoto Park 0 0 0 0 0 - - - - 1 $90,120
# of Facilities
# of Courts
# of Facilities
APPENDIX B.4
TABLE 1 - PAGE 15
HEMSON
118

RECREATION
PARK FACILITIES
INVENTORY OF CAPITAL ASSETS
Multi Purpose Courts CONT'D UNIT COST
Park Name 2004 2005 2006 2007 2008 2009 2010 2011 2012 2013 ($/Court)
Timberlane Park 0 0 0 1 1 1 1 1 1 1 $29,605
Todd Edward Baylis Park 1 1 1 1 1 1 1 1 1 1 $48,795
Treeline Park 1 1 1 1 1 1 1 1 1 1 $68,350
Van Scott Parkette 1 1 1 1 1 1 1 1 1 1 $68,350
Wiggins Park 1 1 1 1 1 1 1 1 1 1 $68,350
Subtotal (#) 16 16 17 21 22 21 21 21 21 24
Subtotal ($) $863,345 $863,345 $931,695 $1,192,975 $1,261,325 $1,192,975 $1,192,975 $1,192,975 $1,192,975 $1,380,685
Track UNIT COST
Location 2004 2005 2006 2007 2008 2009 2010 2011 2012 2013 ($/Track)
Chinguacousy Park 1 1 1 1 1 1 - - - - $246,280
Chinguacousy Park (in Terry Fox Stadium) - - - - - - - 1 1 1 $1,106,040
Teramoto Park - - - - - - - - - 1 $437,500
Subtotal (#) 1 1 1 1 1 1 0 1 1 2
Subtotal ($) $246,280 $246,280 $246,280 $246,280 $246,280 $246,280 $0 $1,106,040 $1,106,040 $1,543,540
Wading Pools / Splashpads UNIT COST
Location 2004 2005 2006 2007 2008 2009 2010 2011 2012 2013 ($/Facility)
Batsman - - - - - - - - - 1 $160,700
Brampton Soccer Center - - - 1 1 1 1 1 1 1 $318,100
Cassie Campell - - - - 1 1 1 1 1 1 $318,100
Century Gardens - - - - - - - 1 1 1 $318,100
Chinguacousy Park 1 1 1 1 1 1 1 1 1 1 $498,300
Ernest Majury Park 1 1 1 1 1 1 1 1 1 1 $160,700
Gage Park 1 1 1 1 1 1 1 1 1 1 $160,700
Peel Village Park 1 1 1 1 1 1 1 1 1 1 $160,700
Subtotal (#) 4 4 4 5 6 6 6 7 7 8
Subtotal ($) $980,400 $980,400 $980,400 $1,298,500 $1,616,600 $1,616,600 $1,616,600 $1,934,700 $1,934,700 $2,095,400
Skateboard Parks UNIT COST
Location 2004 2005 2006 2007 2008 2009 2010 2011 2012 2013 ($/Facility)
Ching Park E Skate Park 1 1 1 - - - - - - - $223,300
Ching Park E Skate Park - - - 1 1 1 1 1 1 1 $907,175
Gore Meadows Community Park - East - - - - - - - - - 1 $223,300
Jim Archdekin Recreation Ctr 1 1 1 1 1 1 1 1 1 1 $109,300
Memorial Fairgrounds 1 1 1 1 1 1 1 1 1 1 $223,300
South Fletchers Sports Complex 1 1 1 1 1 1 1 1 1 1 $109,300
Worthington Park 1 1 1 1 1 1 1 1 1 1 $109,300
Subtotal (#) 5 5 5 5 5 5 5 5 5 6
Subtotal ($) $774,500 $774,500 $774,500 $1,458,375 $1,458,375 $1,458,375 $1,458,375 $1,458,375 $1,458,375 $1,681,675
# of Tracks
# of Pools/Splashpads
# of Skateboard Parks
TABLE 1 - PAGE 16
APPENDIX B.4
# of Courts
HEMSON
119

RECREATION
PARK FACILITIES
INVENTORY OF CAPITAL ASSETS
Lacrosse UNIT COST
Park Name 2004 2005 2006 2007 2008 2009 2010 2011 2012 2013 ($/Facility)
Creditview Sandalwood - - 2 2 - - - - - - $42,975
Creditview Sandalwood Lit - - - - 2 2 2 2 2 2 $210,510
FCCC 2 2 2 - - - - - - - $42,975
FCCC - Box Lacrosse - - - - 1 1 1 1 1 1 $656,000
Subtotal (#) 2 2 4 2 3 3 3 3 3 3
Subtotal ($) $85,950 $85,950 $171,900 $85,950 $1,077,020 $1,077,020 $1,077,020 $1,077,020 $1,077,020 $1,077,020
SHADE STRUCTURES # of Facilities UNIT COST
Park Name 2004 2005 2006 2007 2008 2009 2010 2011 2012 2013 ($/Structure)
Albert Callaghan Memorial Park - 1 1 1 1 1 1 1 1 1 $59,000
Anne Nash Park - 1 1 1 1 1 1 1 1 1 $59,000
Barbreh Brown Park - - - 1 1 1 1 1 1 1 $59,000
Bayridge Park - - - - - - - - 1 1 $59,000
Black Forest Park N 1 1 1 1 1 1 1 1 1 1 $59,000
Black Forest Park S 1 1 1 1 1 1 1 1 1 1 $59,000
Blue Lake Parkette 1 1 1 1 1 1 1 1 1 1 $52,000
Blue Oak Park - - - - 1 1 1 1 - - $59,000
Blue Oak Park - - - - - - - - 1 1 $107,000
Bottomwood Park - 1 1 1 1 1 1 1 1 1 $59,000
Bramalea Ltd Com Pk 1 1 1 1 1 1 1 1 1 1 $52,000
Bramalea Ltd Com Pk - - - 1 1 1 1 1 1 1 $59,000
Brampton-Marikina Friendship Park - - - 1 1 1 1 1 1 1 $59,000
Brampton Sports Park 1 1 1 1 1 1 1 1 1 1 $59,000
Burnt Elm Park 1 1 1 1 1 1 1 1 1 1 $59,000
Calderstone Park - 1 1 1 1 1 1 1 1 1 $59,000
Carabram Park - - - 1 1 1 1 1 1 1 $59,000
Castlehill Park - - - - - - - 1 1 1 $59,000
Centennial Park - - 2 2 2 2 2 3 3 3 $59,000
Chris Gibson Park 1 1 1 1 1 1 1 1 1 1 $59,000
Chudleigh Park - - - 1 1 1 1 1 1 1 $59,000
Cobblehill Park - - - 1 1 1 1 1 1 1 $59,000
Crystalview Park - - - - 1 1 1 1 1 1 $59,000
Cunnington Parkette 1 1 1 1 1 1 1 1 1 1 $59,000
D.M.G.Ching Pk 3 3 3 3 3 3 1 1 1 1 $52,000
Damatta Park - - - - - - - - 1 1 $59,000
Dixie / 407 City Park - - - 1 1 1 1 1 1 1 $79,000
Dixie Sandalwood Park - - - 1 1 1 1 1 1 1 $59,000
Earl Cook Parkette 1 1 1 1 1 1 1 1 1 1 $59,000
Eldorado Park 2 2 2 2 2 2 2 2 2 2 $79,000
Evening Stars Park - - 1 1 1 1 1 1 1 1 $59,000
Fairlawn Park - - - 1 1 1 1 1 1 1 $59,000
Fallen Oak Park - - - - - - - 1 1 1 $59,000
# of Facilities
APPENDIX B.4
TABLE 1 - PAGE 17
HEMSON
120

RECREATION
PARK FACILITIES
INVENTORY OF CAPITAL ASSETS
SHADE STRUCTURES CONT'D # of Facilities UNIT COST
Park Name 2004 2005 2006 2007 2008 2009 2010 2011 2012 2013 ($/Structure)
Fiddlers Parkette 1 1 1 1 1 1 1 1 1 1 $59,000
Flower City Community Campus - - - - - - - 1 1 1 $59,000
Francis H. Taylor Pk - - - - - - - 1 1 1 $59,000
Gage Park (Bandshell) 1 1 1 1 1 1 1 1 1 1 $107,000
George M. Lee Park - - - - - 1 1 1 1 1 $59,000
Giffen Family Park - 1 1 1 1 1 1 1 1 1 $59,000
Gladys And George Gray - - - - - 1 1 1 1 1 $59,000
Gold Parkette - - - - - - - 1 1 1 $59,000
Grey Whale Park - - 1 1 1 1 1 1 1 1 $59,000
Halldorson Park - - - - - - - - 1 1 $59,000
Harry A Sheilds Pkt 1 1 1 1 1 1 1 1 1 1 $59,000
Havelock Park - - - - - - - 1 1 1 $59,000
Heartview Marsh - - - 1 1 1 1 1 1 1 $59,000
Hedgeline Parkette - 1 1 1 1 1 1 1 1 1 $59,000
Hickory Wood Park - - - - - - - - 1 1 $79,000
Homestead Park 1 1 1 1 1 1 1 1 1 1 $59,000
Iceland Park - - - - - 1 1 1 1 1 $59,000
J. And M. Mcgie Pk. - 1 1 1 1 1 1 1 1 1 $59,000
James & Edna Davis Pk - - - - 1 1 1 1 1 1 $59,000
James William Hewson 1 1 1 1 1 - - - - - $52,000
James William Hewson - - 1 1 1 2 2 2 2 2 $59,000
Johnstone Park - - - - - - - - 1 1 $59,000
Kanashiro Parkette 1 1 1 1 1 1 1 1 1 1 $59,000
Kiwanis Memorial Park 1 1 1 1 1 1 1 1 1 1 $79,000
Koretz Park 1 1 1 1 1 1 1 1 1 3 $59,000
Lakelands Park - - 1 1 1 1 1 1 1 1 $59,000
Lightcatcher Park - - - - - - - - 1 1 $59,000
Lillie Roberts Park - - - 1 1 1 1 1 1 1 $79,000
Lloyd Sanderson Park - - - - - - - - 1 1 $79,000
Lorenzo Park - - - - - - - - - 1 $59,000
Lougheed Park - 1 1 1 1 1 1 1 1 1 $59,000
Major William Sharpe - - - - - - - 1 1 1 $59,000
Matthew Cation Park 1 1 1 1 1 1 1 1 1 1 $59,000
Mckinney Parkette 1 1 1 1 1 1 1 1 1 1 $59,000
Mcmicking Park 1 1 1 1 1 1 1 1 1 1 $59,000
Minaker Park - 1 1 1 1 1 1 1 1 1 $59,000
Morrow Park - - - - 1 1 1 1 1 1 $59,000
Mountainash Park E - - - - - - - 1 1 1 $59,000
Northampton Park - - - - - - - 1 1 1 $59,000
Old Fairgrounds Park 1 1 1 1 1 1 1 1 1 1 $59,000
RC Charlton Park - - - 1 1 1 1 1 1 1 $59,000
Riversedge Park - - - - - - - 1 1 1 $59,000
APPENDIX B.4
TABLE 1 - PAGE 18
HEMSON
121

RECREATION
PARK FACILITIES
INVENTORY OF CAPITAL ASSETS
SHADE STRUCTURES CONT'D # of Facilities UNIT COST
Park Name 2004 2005 2006 2007 2008 2009 2010 2011 2012 2013 ($/Structure)
Sled Dog Park - - - - - - - 1 1 1 $59,000
Sleightholme Park - - - - - - 1 1 1 1 $59,000
Smirle Lawson Park - - - 1 1 1 1 1 1 1 $59,000
Snowcap Park - - - - - - - 1 1 1 $59,000
Teramoto Park - - - - - - - - - 1 $107,000
Timberlane Park - - - 1 1 1 1 1 1 1 $59,000
Tony Rinomato Park - - - - - - - 1 1 1 $59,000
Torbram Sandalwood - - - - - - - 1 1 1 $59,000
Treeline Park 1 1 1 1 1 1 1 1 1 1 $59,000
Trudelle Parkette - - - - - - - - 1 1 $59,000
Twin Falls Park - - - - - - - - - 1 $59,000
Upperlinks Park - - - - - - - - 1 1 $59,000
Via Romano Parkette 1 1 1 1 1 1 1 1 1 1 $59,000
Wiggins Park 1 1 1 1 1 1 1 1 - - $59,000
Wiggins Park - - - - - - - - 1 1 $79,000
Worthington Park 1 1 1 1 1 1 1 1 1 1 $59,000
Subtotal (#) Shade Structures 30 39 45 59 63 66 65 80 89 94
Subtotal ($) $1,836,000 $2,367,000 $2,721,000 $3,587,000 $3,823,000 $4,007,000 $3,962,000 $4,847,000 $5,486,000 $5,829,000
PLAY EQUIPMENT - JUNIOR # of Facilities UNIT COST
Park Name 2004 2005 2006 2007 2008 2009 2010 2011 2012 2013 ($/Structure)
Bloomingdale Park 1 1 1 1 1 1 1 1 1 1 $91,100
Bridekirk Park 1 1 1 1 1 1 1 1 1 1 $91,100
Cantrill Park 1 1 1 1 1 1 1 1 1 1 $91,100
Gladstone-Shaw Park - 1 1 1 1 1 1 1 1 1 $34,300
Hilldale Park North 1 1 1 1 1 1 1 1 1 1 $34,300
Kindle Parkette 1 1 1 1 1 1 1 1 1 1 $91,100
Richvale Park (South) 1 1 1 1 1 1 1 1 1 1 $91,100
Southwell Parkette 1 1 1 1 1 1 1 1 1 1 $34,300
Valleydown Park 1 1 1 1 1 1 1 1 1 1 $91,100
Watchman Park - - - 1 1 1 1 1 1 1 $91,100
Subtotal (#) - Play Equipment - JUNIOR 8 9 9 10 10 10 10 10 10 10
Subtotal ($) $615,200 $649,500 $649,500 $740,600 $740,600 $740,600 $740,600 $740,600 $740,600 $740,600
APPENDIX B.4
TABLE 1 - PAGE 19
HEMSON
122

RECREATION
PARK FACILITIES
INVENTORY OF CAPITAL ASSETS
PLAY EQUIPMENT - SENIOR # of Facilities UNIT COST
Park Name 2004 2005 2006 2007 2008 2009 2010 2011 2012 2013 ($/Structure)
Anderson Family Park - - - - 1 1 1 1 1 1 $139,400
Beatty Fleming Park 1 1 1 1 1 1 1 1 1 1 $139,400
Carleton Park 1 1 1 1 1 1 1 1 1 1 $139,400
Dafoe Parkette 1 1 1 1 1 1 1 1 1 1 $139,400
Donn Reynolds Parkette 1 1 1 1 1 1 1 1 1 1 $139,400
Dumfries Parkette 1 1 1 1 1 1 1 1 1 1 $139,400
Ezard Park 1 1 1 1 1 1 1 1 1 1 $139,400
Fairhill Parkette 1 1 1 1 1 1 1 1 1 1 $139,400
Francis H. Taylor Park - - - - 1 1 1 1 1 1 $139,400
Gentry Park - - - - - - - - - 1 $139,400
Greenmount Park North 1 1 1 1 1 1 1 1 1 1 $139,400
Jacksonville Park - - - - - 1 1 1 1 1 $139,400
Ken Park 1 1 1 1 1 1 1 1 1 1 $139,400
Koretz Park 1 1 1 1 1 1 1 1 1 1 $139,400
Loafer's Lake Park Loop - - - - - - - - - 1 $59,200
Maplehurst Parkette 1 1 1 1 1 1 1 1 1 1 $139,400
Meadowlark Parkette 1 1 1 1 1 1 1 1 1 1 $139,400
Newton Road Park 1 1 1 1 1 1 1 1 1 1 $139,400
Notre Dame Park 1 1 1 1 1 1 1 1 1 1 $139,400
Rollingwood Park - 1 1 1 1 1 1 1 1 1 $139,400
Rosepac Park 1 1 1 1 1 1 1 1 1 1 $139,400
Scottsdale Parkette South 1 1 1 1 1 1 1 1 1 1 $139,400
Sheridan Parkette 1 1 1 1 1 1 1 1 1 1 $139,400
Softneedle Parkette 1 1 1 1 1 1 1 1 1 1 $139,400
Suncrest Parkette 1 1 1 1 1 1 1 1 1 1 $139,400
Thorndale Park 1 1 1 1 1 1 1 1 1 1 $139,400
Turtle Creek Park 1 1 1 1 1 1 1 1 1 1 $139,400
Subtotal (#) Play Equipment - SENIOR 21 22 22 22 24 25 25 25 25 27
Subtotal ($) $2,927,400 $3,066,800 $3,066,800 $3,066,800 $3,345,600 $3,485,000 $3,485,000 $3,485,000 $3,485,000 $3,683,600
PLAY EQUIPMENT - COMBINED (JUNIOR / SENIOR) # of Facilities UNIT COST
Park Name 2004 2005 2006 2007 2008 2009 2010 2011 2012 2013 ($/Structure)
Albert Callaghan Memorial Park - 1 1 1 1 1 1 1 1 1 152,900$
Allan Kerbel Park 1 1 1 1 1 1 1 1 1 1 152,900$
Aloma Park 1 1 1 1 1 1 1 1 1 1 152,900$
Anne Nash Park - 1 1 1 1 1 1 1 1 1 152,900$
Asa Hall Parkette - - - - - - - - - 1 152,900$
Bach Park 1 1 1 1 1 1 1 1 1 1 152,900$
Banting Park 1 1 1 1 1 1 1 1 1 1 152,900$
Barbreh Brown Park - - - 1 1 1 1 1 1 1 152,900$
APPENDIX B.4
TABLE 1 - PAGE 20
HEMSON
123
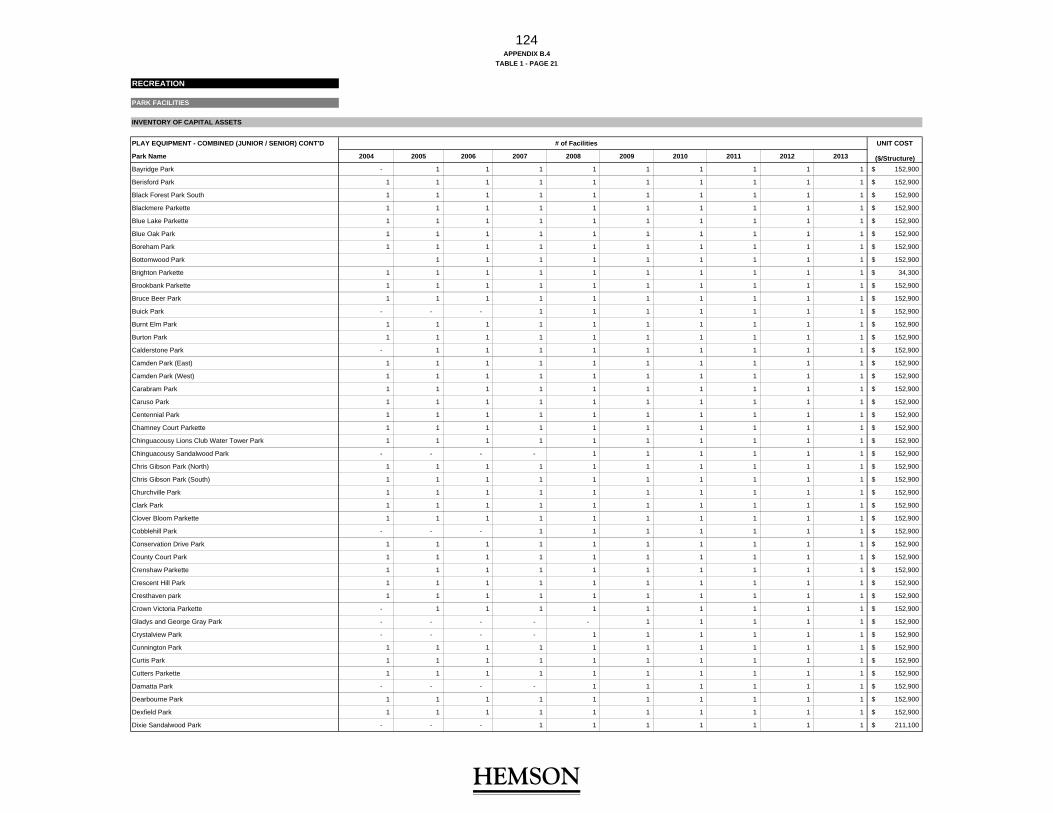
RECREATION
PARK FACILITIES
INVENTORY OF CAPITAL ASSETS
PLAY EQUIPMENT - COMBINED (JUNIOR / SENIOR) CONT'D # of Facilities UNIT COST
Park Name 2004 2005 2006 2007 2008 2009 2010 2011 2012 2013 ($/Structure)
Bayridge Park - 1 1 1 1 1 1 1 1 1 152,900$
Berisford Park 1 1 1 1 1 1 1 1 1 1 152,900$
Black Forest Park South 1 1 1 1 1 1 1 1 1 1 152,900$
Blackmere Parkette 1 1 1 1 1 1 1 1 1 1 152,900$
Blue Lake Parkette 1 1 1 1 1 1 1 1 1 1 152,900$
Blue Oak Park 1 1 1 1 1 1 1 1 1 1 152,900$
Boreham Park 1 1 1 1 1 1 1 1 1 1 152,900$
Bottomwood Park 1 1 1 1 1 1 1 1 1 152,900$
Brighton Parkette 1 1 1 1 1 1 1 1 1 1 34,300$
Brookbank Parkette 1 1 1 1 1 1 1 1 1 1 152,900$
Bruce Beer Park 1 1 1 1 1 1 1 1 1 1 152,900$
Buick Park - - - 1 1 1 1 1 1 1 152,900$
Burnt Elm Park 1 1 1 1 1 1 1 1 1 1 152,900$
Burton Park 1 1 1 1 1 1 1 1 1 1 152,900$
Calderstone Park - 1 1 1 1 1 1 1 1 1 152,900$
Camden Park (East) 1 1 1 1 1 1 1 1 1 1 152,900$
Camden Park (West) 1 1 1 1 1 1 1 1 1 1 152,900$
Carabram Park 1 1 1 1 1 1 1 1 1 1 152,900$
Caruso Park 1 1 1 1 1 1 1 1 1 1 152,900$
Centennial Park 1 1 1 1 1 1 1 1 1 1 152,900$
Chamney Court Parkette 1 1 1 1 1 1 1 1 1 1 152,900$
Chinguacousy Lions Club Water Tower Park 1 1 1 1 1 1 1 1 1 1 152,900$
Chinguacousy Sandalwood Park - - - - 1 1 1 1 1 1 152,900$
Chris Gibson Park (North) 1 1 1 1 1 1 1 1 1 1 152,900$
Chris Gibson Park (South) 1 1 1 1 1 1 1 1 1 1 152,900$
Churchville Park 1 1 1 1 1 1 1 1 1 1 152,900$
Clark Park 1 1 1 1 1 1 1 1 1 1 152,900$
Clover Bloom Parkette 1 1 1 1 1 1 1 1 1 1 152,900$
Cobblehill Park - - - 1 1 1 1 1 1 1 152,900$
Conservation Drive Park 1 1 1 1 1 1 1 1 1 1 152,900$
County Court Park 1 1 1 1 1 1 1 1 1 1 152,900$
Crenshaw Parkette 1 1 1 1 1 1 1 1 1 1 152,900$
Crescent Hill Park 1 1 1 1 1 1 1 1 1 1 152,900$
Cresthaven park 1 1 1 1 1 1 1 1 1 1 152,900$
Crown Victoria Parkette - 1 1 1 1 1 1 1 1 1 152,900$
Gladys and George Gray Park - - - - - 1 1 1 1 1 152,900$
Crystalview Park - - - - 1 1 1 1 1 1 152,900$
Cunnington Park 1 1 1 1 1 1 1 1 1 1 152,900$
Curtis Park 1 1 1 1 1 1 1 1 1 1 152,900$
Cutters Parkette 1 1 1 1 1 1 1 1 1 1 152,900$
Damatta Park - - - - 1 1 1 1 1 1 152,900$
Dearbourne Park 1 1 1 1 1 1 1 1 1 1 152,900$
Dexfield Park 1 1 1 1 1 1 1 1 1 1 152,900$
Dixie Sandalwood Park - - - 1 1 1 1 1 1 1 211,100$
APPENDIX B.4
TABLE 1 - PAGE 21
HEMSON
124

RECREATION
PARK FACILITIES
INVENTORY OF CAPITAL ASSETS
PLAY EQUIPMENT - COMBINED (JUNIOR / SENIOR) CONT'D # of Facilities UNIT COST
Park Name 2004 2005 2006 2007 2008 2009 2010 2011 2012 2013 ($/Structure)
Donnelly Park 1 1 1 1 1 1 1 1 1 1 152,900$
Donwoods Parkette - - - - - - - 1 1 1 152,900$
Dorchester Park 1 1 1 1 1 1 1 1 1 1 152,900$
Dorset Park 1 1 1 1 1 1 1 1 1 1 152,900$
Drinkwater Community Park 1 1 1 1 1 1 1 1 1 1 152,900$
Duggan Park 1 1 1 1 1 1 1 1 1 1 152,900$
Earl Cook Parkette 1 1 1 1 1 1 1 1 1 1 152,900$
Earnscliffe Park 1 1 1 1 1 1 1 1 1 1 152,900$
Eastbourne Park 1 1 1 1 1 1 1 1 1 1 152,900$
Egerton Park - - - - - - - - - 1 152,900$
English Street Park 1 1 1 1 1 1 1 1 1 1 152,900$
Ernest and Edith Parr Parkette - 1 1 1 1 1 1 1 1 1 152,900$
Ernest Majury Park 1 1 1 1 1 1 1 1 1 1 152,900$
Evening Stars Park - - 1 1 1 1 1 1 1 1 152,900$
Fairgrounds Park 1 1 1 1 1 1 1 1 1 1 152,900$
Fairlawn Park - - - 1 1 1 1 1 1 1 152,900$
Fallen Oak Park 1 1 1 1 1 1 1 1 1 1 152,900$
Fallingdale Park 1 1 1 1 1 1 1 1 1 1 152,900$
Fanshawe Parkette 1 1 1 1 1 1 1 1 1 1 152,900$
Fern Valley Parkette 1 1 1 1 1 1 1 1 1 1 152,900$
Fernforest Way West 1 1 1 1 1 1 1 1 1 1 152,900$
Ferri Parkette 1 1 1 1 1 1 1 1 1 1 152,900$
Fiddlers Parkette 1 1 1 1 1 1 1 1 1 1 152,900$
Fletcher's Parkette 1 1 1 1 1 1 1 1 1 1 152,900$
Frank Harkema Park - - 1 1 1 1 1 1 1 1 152,900$
Fred Kee Park 1 1 1 1 1 1 1 1 1 1 152,900$
Fred Kline Park 1 1 1 1 1 1 1 1 1 1 152,900$
Gage Park 1 1 1 1 1 1 1 1 1 1 152,900$
Gatesgill Park 1 1 1 1 1 1 1 1 1 1 152,900$
George M. Lee Park - - - - - 1 1 1 1 1 152,900$
George Ransier Park 1 1 1 1 1 1 1 1 1 152,900$
Giffen Family Park 1 1 1 1 1 1 1 1 1 1 152,900$
Glenforest Park South 1 1 1 1 1 1 1 1 1 1 152,900$
Glenmanor Park 1 1 1 1 1 1 1 1 1 1 152,900$
Gold Parkette 1 1 1 1 1 1 1 1 1 1 152,900$
Greenbriar Park South 1 1 1 1 1 1 1 1 1 1 152,900$
Harry A. Shields Parkette 1 1 1 1 1 1 1 1 1 1 152,900$
Havelock Park 1 1 1 1 1 1 1 1 1 1 152,900$
Hazelwood Park South 1 1 1 1 1 1 1 1 1 1 152,900$
Heartview Marsh - - - 1 1 1 1 1 1 1 152,900$
Hedgeline Parkette - 1 1 1 1 1 1 1 1 1 152,900$
Hickory Wood Park 1 1 1 1 1 1 1 1 1 1 152,900$
Hilldale Park South 1 1 1 1 1 1 1 1 1 1 152,900$
Homestead Park 1 1 1 1 1 1 1 1 1 1 152,900$
APPENDIX B.4
TABLE 1 - PAGE 22
HEMSON
125

RECREATION
PARK FACILITIES
INVENTORY OF CAPITAL ASSETS
PLAY EQUIPMENT - COMBINED (JUNIOR / SENIOR) CONT'D # of Facilities UNIT COST
Park Name 2004 2005 2006 2007 2008 2009 2010 2011 2012 2013 ($/Structure)
Howden Park 1 1 1 1 1 1 1 1 1 1 152,900$
Iceland Parkette - - - - - 1 1 1 1 1 152,900$
Inder Heights Park 1 1 1 1 1 1 1 1 1 1 152,900$
Ironblock Park - - - 1 1 1 1 1 1 1 152,900$
Ivy Bridge Parkette 1 1 1 1 1 1 1 1 1 1 152,900$
Jacob Shook Park - - - 1 1 1 1 1 1 1 152,900$
James and Edna Davis Park - - - - 1 1 1 1 1 1 152,900$
James and Margaret McGie Park - 1 1 1 1 1 1 1 1 1 152,900$
James William Hewson Park 1 1 1 1 1 1 1 1 1 1 152,900$
Jefferson Park 1 1 1 1 1 1 1 1 1 1 152,900$
Jellicoe Parkette 1 1 1 1 1 1 1 1 1 1 152,900$
Johnstone Park - 1 1 1 1 1 1 1 1 1 152,900$
Jordan Park 1 1 1 1 1 1 1 1 1 1 152,900$
JP Hutton Park 1 1 1 1 1 1 1 1 1 1 152,900$
Kanashiro Parkette 1 1 1 1 1 1 1 1 1 1 152,900$
Keirstead Park - - - 1 1 1 1 1 1 1 152,900$
Kincaid Parkette 1 1 1 1 1 1 1 1 1 1 152,900$
Kingfisher Park 1 1 1 1 1 1 1 1 1 1 152,900$
Kingswood Park 1 1 1 1 1 1 1 1 1 1 152,900$
Knightsbridge Park 1 1 1 1 1 1 1 1 1 1 152,900$
La France Park 1 1 1 1 1 1 1 1 1 1 152,900$
Lake Louise Parkette 1 1 1 1 1 1 1 1 1 1 152,900$
Larande Park - - - 1 1 1 1 1 1 1 152,900$
Lascelles Park 1 1 1 1 1 1 1 1 1 1 152,900$
Laurelcrest Park North 1 1 1 1 1 1 1 1 1 1 152,900$
Leander Park 1 1 1 1 1 1 1 1 1 1 152,900$
Lethbridge Park 1 1 1 1 1 1 1 1 1 1 152,900$
Lightcatcher Park - - - - - - - - 1 1 152,900$
Lloyd Sanderson Park 1 1 1 1 1 1 1 1 1 1 152,900$
Loafer's Lake Park - - - - - - - - - 1 152,900$
Lorenzo Park - - - - - - - - - 1 152,900$
Lougheed Park - 1 1 1 1 1 1 1 1 1 152,900$
Major William Sharpe Park 1 1 1 1 1 1 1 1 1 1 152,900$
Manitou Park 1 1 1 1 1 1 1 1 1 1 152,900$
Manorcrest Park 1 1 1 1 1 1 1 1 1 1 152,900$
Martindale Parkette 1 1 1 1 1 1 1 1 1 1 152,900$
Mary Goodwillie Young Park - 1 1 1 1 1 1 1 1 1 152,900$
Matthew Cation Park 1 1 1 1 1 1 1 1 1 1 152,900$
Maxwell and Lois Rice Park - - - - - - - - 1 1 152,900$
McKinney Parkette 1 1 1 1 1 1 1 1 1 1 152,900$
McMicking Park 1 1 1 1 1 1 1 1 1 1 152,900$
Meadowland Park 1 1 1 1 1 1 1 1 1 1 152,900$
Millstone Parkette 1 1 1 1 1 1 1 1 1 1 152,900$
Minaker Park - 1 1 1 1 1 1 1 1 1 152,900$
TABLE 1 - PAGE 23
APPENDIX B.4
HEMSON
126

RECREATION
PARK FACILITIES
INVENTORY OF CAPITAL ASSETS
PLAY EQUIPMENT - COMBINED (JUNIOR / SENIOR) CONT'D # of Facilities UNIT COST
Park Name 2004 2005 2006 2007 2008 2009 2010 2011 2012 2013 ($/Structure)
Morris Kerbel Park 1 1 1 1 1 1 1 1 1 1 152,900$
Morrow Park - - - - 1 1 1 1 1 1 152,900$
Mosswood Park 1 1 1 1 1 1 1 1 1 1 152,900$
Mount Pleasant Square - - - - - - - 1 1 1 152,900$
Mountainash Park - 1 1 1 1 1 1 1 1 1 152,900$
Murray Street Park 1 1 1 1 1 1 1 1 1 1 152,900$
Nancy McCredie Park 1 1 1 1 1 1 1 1 1 1 152,900$
Nasmith Park 1 1 1 1 1 1 1 1 1 1 152,900$
Native Landing Parkette 1 1 1 1 1 1 1 1 1 1 152,900$
Northampton Park (North) 1 1 1 1 1 1 1 1 1 1 152,900$
Northampton Park (South) 1 1 1 1 1 1 1 1 - - 152,900$
Norton Place Park 1 1 1 1 1 1 1 1 1 1 152,900$
Omega Parkette 1 1 1 1 1 1 1 1 1 1 152,900$
Patrick O'Leary Park - - - - - - 1 1 1 1 152,900$
Peddle Family Wood - - 1 1 1 1 1 1 1 1 152,900$
Peel Village Park 1 1 1 1 1 1 1 1 1 1 152,900$
Piane Park 1 1 1 1 1 1 1 1 1 - 152,900$
Picasso Park - - - - - - - - 1 1 152,900$
Pickard Park - - 1 1 1 1 1 1 1 1 152,900$
Professor's Lake Park (East) 1 1 1 1 1 1 1 1 1 1 152,900$
Professor's Lake Park (West) 1 1 1 1 1 1 1 1 1 1 152,900$
Professor's Lake Waterslide 1 1 1 1 1 1 1 1 1 1 152,900$
Ravenscliffe Parkette 1 1 1 1 1 1 1 1 1 1 152,900$
Reed Parkette 1 1 1 1 1 1 1 1 1 1 152,900$
Richvale Park (North) 1 1 1 1 1 1 1 1 1 1 152,900$
Ridgehill Park 1 1 1 1 1 1 1 1 1 1 152,900$
River Heights Park - - - - - - - - - 1 152,900$
Robert Reid Park & Trail 1 1 1 1 1 1 1 1 1 1 152,900$
Roehampton Park 1 1 1 1 1 1 1 1 1 1 152,900$
Royal Salisbury Parkette 1 1 1 1 1 1 1 1 1 1 152,900$
RM Wells Park - - - - - - - 1 1 1 152,900$
Rushmore Parkette 1 1 1 1 1 1 1 1 1 1 152,900$
Salisbury Circle Parkette 1 1 1 1 1 1 1 1 1 1 152,900$
Seaborn Park 1 1 1 1 1 1 1 1 1 1 152,900$
Sheridan Woodlands 1 1 1 1 1 1 1 1 1 1 152,900$
Sid Manser Park - 1 1 1 1 1 1 1 1 1 152,900$
Sled Dog Park - - 1 1 1 1 1 1 1 1 152,900$
Sleightholme Park - - - - - - 1 1 1 1 152,900$
Snowcap Park 1 1 1 1 1 1 1 1 1 1 152,900$
Sparrow Park 1 1 1 1 1 1 1 1 1 1 152,900$
Stillman Park - - - - - - - 1 1 1 152,900$
Summer Valley Parkette 1 1 1 1 1 1 1 1 1 1 152,900$
Sunforest Parkette 1 1 1 1 1 1 1 1 1 1 152,900$
Sunny Meadow Parkette 1 1 1 1 1 1 1 1 1 1 152,900$
APPENDIX B.4
TABLE 1 - PAGE 24
HEMSON
127

RECREATION
PARK FACILITIES
INVENTORY OF CAPITAL ASSETS
PLAY EQUIPMENT - COMBINED (JUNIOR / SENIOR) CONT'D # of Facilities UNIT COST
Park Name 2004 2005 2006 2007 2008 2009 2010 2011 2012 2013 ($/Structure)
Talbot Park 1 1 1 1 1 1 1 1 1 1 152,900$
Tara Park 1 1 1 1 1 1 1 1 1 1 152,900$
Timberlane Park 1 1 1 1 1 1 1 1 1 1 152,900$
Todd Edward Baylis Park 1 1 1 1 1 1 1 1 1 1 152,900$
Tony Rinomato Park - - - - - - - 1 1 1 152,900$
Torbram Sandalwood Community Park - - - - - 1 1 1 1 1 152,900$
Trailside Park - 1 1 1 1 1 1 1 1 1 152,900$
Treeline Park 1 1 1 1 1 1 1 1 1 1 152,900$
Treleaven Park 1 1 1 1 1 1 1 1 1 1 152,900$
Trudelle Parkette 1 1 1 1 1 1 1 1 1 1 152,900$
Tumbleweed Parkette 1 1 1 1 1 1 1 1 1 1 152,900$
Twin Falls Park - - - - - - - - - 1 152,900$
Upperlink Park - - - - - - 1 1 1 1 152,900$
Upwood Park 1 1 1 1 1 1 1 1 1 1 152,900$
Valleybrook Park 1 1 1 1 1 1 1 1 1 1 152,900$
Van Scott Parkette 1 1 1 1 1 1 1 1 1 1 152,900$
Via Romano Parkette 1 1 1 1 1 1 1 1 1 1 152,900$
W.A. Russell Parkette 1 1 1 1 1 1 1 1 1 1 152,900$
Watson Valley (East) 1 1 1 1 1 1 1 1 1 - 152,900$
Watson Valley (West) 1 1 1 1 1 1 1 1 1 1 152,900$
Weybridge Park 1 1 1 1 1 1 1 1 1 1 152,900$
Whitewash Parkette 1 1 1 1 1 1 1 1 1 1 152,900$
Wiggins Park 1 1 1 1 1 1 1 1 1 1 152,900$
William Porter Park - - - - - - - 1 1 1 82,200$
William Sheard Park 1 1 1 1 1 1 1 1 1 1 152,900$
Winterfold Park 1 1 1 1 1 1 1 1 1 1 152,900$
Woodview Park 1 1 1 1 1 1 1 1 1 1 152,900$
Subtotal (#) Play Equipment - COMBINED (JUNIOR / SENIOR) 152 169 174 184 189 193 196 202 204 208
Subtotal ($) $23,122,200 $25,721,500 $26,486,000 $28,073,200 $28,837,700 $29,449,300 $29,908,000 $30,754,700 $31,060,500 $31,672,100
APPENDIX B.4
TABLE 1 - PAGE 25
HEMSON
128

RECREATION
PARK FACILITIES
INVENTORY OF CAPITAL ASSETS
PLAY EQUIPMENT - BARRIER FREE # of Facilities UNIT COST
Park Name 2004 2005 2006 2007 2008 2009 2010 2011 2012 2013 ($/Structure)
Armbro Park 1 1 1 1 1 1 1 1 1 1 160,700$
Batsman Park - - - - - - - - 1 1 236,200$
Beaconsfield Park 1 1 1 1 1 1 1 1 1 1 160,700$
Bramalea Ltd. Community Park 1 1 1 1 1 1 1 1 1 1 160,700$
Brampton-Marikina Friendship Park - - - 1 1 1 1 1 1 1 160,700$
Castlehill Park 1 1 1 1 1 1 1 1 1 1 160,700$
Century Gardens Park - - - - - - - 1 1 1 236,200$
Chudliegh Park - - - 1 1 1 1 1 1 1 160,700$
Donald M. Gordon Chinguacousy Park (East) 1 1 1 1 1 1 1 1 1 1 236,200$
Donald M. Gordon Chinguacousy Park (West) 1 1 1 1 1 1 1 1 1 1 160,700$
Durham Park 1 1 1 1 1 1 1 1 1 1 160,700$
Eldorado Park (East) 1 1 1 1 1 1 1 1 1 1 160,700$
Eldorado Park (West) 1 1 1 1 1 1 1 1 1 1 160,700$
Folkstone Park 1 1 1 1 1 1 1 1 1 1 160,700$
Goldcrest Park 1 1 1 1 1 1 1 1 1 1 160,700$
Gore Meadows Community Park - East - - - - - - - - - 1 160,700$
Great Lakes Park 1 1 1 1 1 1 1 1 1 1 160,700$
Grey Whale Park - - 1 1 1 1 1 1 1 1 160,700$
Halldorson Park 1 1 1 1 1 1 1 1 1 1 160,700$
Haverty Parkette - - - - - - - - 1 1 160,700$
Henry Verschuren Park - - - - - - - - 1 1 160,700$
Joseph Lawson Park - - - - 1 1 1 1 1 1 160,700$
Kingknoll Park 1 1 1 1 1 1 1 1 1 1 160,700$
Lakelands Park - - 1 1 1 1 1 1 1 1 160,700$
Lillie Roberts Park - - - 1 1 1 1 1 1 1 160,700$
Lorenville Park - - - - - - - - - 1 160,700$
Luongo Park - - - - - - - - 1 1 160,700$
Massey Park 1 1 1 1 1 1 1 1 1 1 160,700$
Maybeck Park - - - - - - - - 1 1 160,700$
Merganser Parkette 1 1 1 1 1 1 1 1 1 1 160,700$
Moorehead Park 1 1 1 1 1 1 1 1 1 1 160,700$
Northwood Park 1 1 1 1 1 1 1 1 1 1 160,700$
Purple Lilac Park - - - - - - - - - 1 160,700$
RC Charlton Park - - - 1 1 1 1 1 1 1 160,700$
Riversedge Park - - - - - - - 1 1 1 160,700$
Smirle 'Big Train' Lawson Park - - - - 1 1 1 1 1 1 160,700$
Stemford Parkette - - - - - - - - 1 1 160,700$
Teramoto Park - - - - - - - - - 1 236,200$
Vanier Park 1 1 1 1 1 1 1 1 1 1 160,700$
Worthington Park 1 1 1 1 1 1 1 1 1 1 160,700$
Subtotal (#) Play Equipment - BARRIER FREE 20 20 22 26 28 28 28 30 36 40
Subtotal ($) $3,289,500 $3,289,500 $3,610,900 $4,253,700 $4,575,100 $4,575,100 $4,575,100 $4,972,000 $6,011,700 $6,730,000
Total All Facilities (#) 522 571 600 629 670 675 669 692 708 731Total All Facilities ($) $88,527,220 $96,866,995 $100,188,240 $103,963,265 $111,695,915 $112,216,740 $109,945,335 $114,846,150 $116,673,585 $122,818,945
APPENDIX B.4
TABLE 1 - PAGE 26
HEMSON
129

RECREATION
OUTDOOR BUILDINGS
INVENTORY OF CAPITAL ASSETS
UNIT COST
OUTDOOR BUILDINGS (sq.ft.) 2004 2005 2006 2007 2008 2009 2010 2011 2012 2013 ($/sq.ft)
Batsman Park Comfort Station - - - - - - - - - 2,142 $320
Brampton Cemetery Mtce Bldg 950 950 950 950 950 950 950 950 950 2,470 $360
Brampton Cemetary Office 762 762 762 762 762 762 762 762 762 762 $248
Century Gardens Fieldhouse 4,141 4,141 4,141 4,141 330 330 330 330 - - $247
Chinguacousy Park Parks building 3,502 3,502 3,502 3,502 3,502 3,502 3,502 3,502 3,502 3,502 $186
Ching. Ski-hill Pump House 506 506 506 506 506 506 506 506 506 506 $186
Ching. Ski-hill Rope-tow Hut 152 152 152 152 152 152 152 - - - $186
Ching. Ski-hill T-bar Line Hut 59 59 - - - - - - - - $186
Chinguacousy Park Mini Golf / Snack Bar 3,385 3,385 3,385 3,385 3,385 3,385 3,385 3,385 3,385 3,385 $186
Chinguacousy Park Garage 2,625 2,625 2,625 2,625 2,625 2,625 2,625 2,625 2,625 2,625 $186
Chinguacousy Park Tennis & Baseball Storage 613 613 613 613 613 613 613 613 613 613 $186
Chinguacousy Park Splash Pad Buildings 285 285 285 285 285 285 84 84 84 84 $186
Chinguacousy Sports Box 450 450 450 450 450 450 450 - - - $186
Chinguacousy Park Track Building 2,200 2,200 2,200 2,200 2,200 2,200 2,200 2,200 $186
Chinguacousy Park Track and Field Bleachers / Scorebox - - - - - - - 10,136 10,136 10,136 $186
Chinguacousy Wellness Centre Fieldhouse 249 249 249 249 249 249 249 249 249 249 $186
County Court Field House 1,299 1,299 1,299 1,299 1,299 1,299 1,299 1,299 1,299 1,299 $296
Crescent Hill Storage Bldg 2,724 - - - - - - - - - $186
Duggan Park Field House 1,681 1,681 1,681 1,681 1,681 1,681 1,681 1,681 1,681 1,681 $273
Earnscliffe Storage Shed 931 931 931 - - - - - - - $186
Eldorado Parks Shed 921 921 921 921 921 921 921 921 921 921 $186
Eldorado Storage Well Building 36 36 36 36 36 36 36 36 36 36 $186
Ellen Street Parks Garage 898 898 898 898 898 898 898 898 898 898 $186
Fairgrounds Park Indoor Batting Cages 2,354 2,354 2,354 2,354 2,354 2,354 2,354 2,354 2,354 2,354 $186
Fairgrounds Park Scorebox / Snack Bar / Washrooms 681 681 681 681 681 681 681 681 681 681 $309
FCCC … Parks Warehouse 4,718 4,718 4,718 4,718 4,718 4,718 4,718 4,718 4,718 4,718 $186
FCCC … OPP - Greenhouse (Chapel Building) 4,162 4,162 4,162 4,162 4,162 - - - - - $186
APPENDIX B.4
TABLE 1 - PAGE 27
# of Square Feet
HEMSON
130

RECREATION
OUTDOOR BUILDINGS
INVENTORY OF CAPITAL ASSETS
UNIT COST
OUTDOOR BUILDINGS (sq.ft.) CONT'D 2004 2005 2006 2007 2008 2009 2010 2011 2012 2013 ($/sq.ft)
Fred Kline Field House 756 756 756 756 756 756 756 756 756 756 $186
Glidden Parks Operation Centre - - - - - - 64,363 64,363 64,363 64,363 $195
Loafer's Lake Sheds 194 194 194 194 194 194 194 194 194 194 $186
Norton Park Shed 239 239 239 239 239 239 239 239 239 239 $186
Orenda Road Parks Operation Centre 24,698 24,698 24,698 24,698 24,698 24,698 - - - - $186
Orenda Parks West Building 7,115 7,115 7,115 7,115 7,115 7,115 7,115 7,115 7,115 7,115 $186
Peel Village Pumphouse 98 98 98 98 98 98 98 98 98 98 $186
Peel Village Golf Course Garage 1,809 1,809 1,809 1,809 1,809 1,809 1,809 1,809 1,809 1,809 $186
Quonset Hut/Ogada Wilderness Centre 3,600 3,600 3,600 3,600 3,600 3,600 3,600 - - - $186
Roselea Tennis Clubhouse & Storage 900 900 900 900 900 900 900 900 900 900 $186
Rotary Club House Sheds 529 529 529 529 529 529 529 529 529 529 $186
Sesquicentennial Park Depot 7,265 7,265 7,265 7,265 7,265 7,265 7,265 7,265 7,265 7,265 $186
Teramoto Parks Depot - - - - - - - - 9,063 9,063 $176
Valleybrook Fieldhouse 582 582 582 582 582 582 582 582 582 582 $186
Victoria Park Shed 108 108 108 108 108 108 108 108 108 108 $186
Total (sq.ft.) 88,177 85,453 85,394 84,463 80,652 76,490 115,954 121,888 128,421 132,083
Total ($000) $17,258.2 $16,750.8 $16,739.8 $16,566.4 $15,625.1 $14,850.0 $22,763.5 $23,868.7 $24,972.1 $26,204.1
APPENDIX B.4
TABLE 1 - PAGE 28
# of Square Feet
HEMSON
131

RECREATION
OUTDOOR BUILDINGS
INVENTORY OF CAPITAL ASSETS
UNIT COST
LAND FOR OUTDOOR BUILDINGS (acres) 2004 2005 2006 2007 2008 2009 2010 2011 2012 2013 ($/acre)
Batsman Park Comfort Station - - - - - - - - - 0.20 700,000
Brampton Cemetery Mtce Bldg 0.14 0.14 0.14 0.14 0.14 0.14 0.14 0.14 0.14 0.14 700,000
Brampton Cemetary Office 0.10 0.10 0.10 0.10 0.10 0.10 0.10 0.10 0.10 0.10 700,000
Century Gardens Fieldhouse 0.12 0.12 0.12 0.12 0.12 0.12 0.12 0.12 - - 700,000
Chinguacousy Park Parks building 0.10 0.10 0.10 0.10 0.10 0.10 0.10 0.10 0.10 0.10 700,000
Ching. Ski-hill Pump House 0.02 0.02 0.02 0.02 0.02 0.02 0.02 0.02 0.02 0.02 700,000
Ching. Ski-hill Rope-tow Hut 0.01 0.01 0.01 0.01 0.01 0.01 0.01 0.01 0.01 0.01 700,000
Ching. Ski-hill T-bar Line Hut - - - - - - - - - - 700,000
Chinguacousy Park Mini Golf / Snack Bar 0.12 0.12 0.12 0.12 0.12 0.12 0.12 0.12 0.12 0.12 700,000
Chinguacousy Park Garage 0.08 0.08 0.08 0.08 0.08 0.08 0.08 0.08 0.08 0.08 700,000
Chinguacousy Park Tennis & Baseball Storage 0.02 0.02 0.02 0.02 0.02 0.02 0.02 0.02 0.02 0.02 700,000
Chinguacousy Park Splash Pad Buildings 0.01 0.01 0.01 0.01 0.01 0.01 0.01 - - - 700,000
Chinguacousy Sports Box 0.02 0.02 0.02 0.02 0.02 0.02 0.02 - - - 700,000
Chinguacousy Park Track Building 0.06 0.06 0.06 0.06 0.06 0.06 0.06 0.06 0.06 0.06 700,000
Chinguacousy Park Track and Field Bleachers / Scorebox - - - - - - - 0.35 0.35 0.35 700,000
Chinguacousy Wellness Centre Fieldhouse 0.02 0.02 0.02 0.02 0.02 0.02 0.02 0.02 0.02 0.02 700,000
County Court Field House 0.05 0.05 0.05 0.05 0.05 0.05 0.05 0.05 0.05 0.05 700,000
Crescent Hill Storage Bldg 0.54 - - - - - - - - - 700,000
Duggan Park Field House 0.12 0.12 0.12 0.12 0.12 0.12 0.12 0.12 0.12 0.12 700,000
Earnscliffe Storage Shed 0.05 0.05 0.05 - - - - - - - 700,000
Eldorado Parks Shed 0.05 0.05 0.05 0.05 0.05 0.05 0.05 0.05 0.05 0.05 700,000
Eldorado Storage Well Building - - - - - - - - - - 700,000
Ellen Street Parks Garage 0.13 0.13 0.13 0.13 0.13 0.13 0.13 0.13 0.13 0.13 700,000
Fairgrounds Park Indoor Batting Cages 0.17 0.17 0.17 0.17 0.17 0.17 0.17 0.17 0.17 0.17 700,000
Fairgrounds Scorebox / Snack Bar / Washrooms 0.03 0.03 0.03 0.03 0.03 0.03 0.03 0.03 0.03 0.03 700,000
FCCC … Parks Warehouse 0.44 0.44 0.44 0.44 0.44 0.44 0.44 0.44 0.44 0.44 700,000
FCCC … OPP - Greenhouse (Chapel Building) 0.27 0.27 0.27 0.27 0.27 - - - - - 700,000
APPENDIX B.4
TABLE 1 - PAGE 29
# of Acres
HEMSON
132

RECREATION
OUTDOOR BUILDINGS
INVENTORY OF CAPITAL ASSETS
UNIT COST
LAND FOR OUTDOOR BUILDINGS (acres) CONT'D 2004 2005 2006 2007 2008 2009 2010 2011 2012 2013 ($/acre)
Fred Kline Field House 0.02 0.02 0.02 0.02 0.02 0.02 0.02 0.02 0.02 0.02 700,000
Glidden Parks Operations Centre - - - - - - 5.15 5.15 5.15 5.15 700,000
Loafer's Lake Sheds 0.01 0.01 0.01 0.01 0.01 0.01 0.01 0.01 0.01 0.01 700,000
Norton Park Shed 0.06 0.06 0.06 0.06 0.06 0.06 0.06 0.06 0.06 0.06 700,000
Orenda Road Parks Operation Centre 3.08 3.08 3.08 3.08 3.08 3.08 - - - - 700,000
Orenda Parks West Building 1.76 1.76 1.76 1.76 1.76 1.76 1.76 1.76 1.76 1.76 700,000
Peel Village Pumphouse - - - - - - - - - - 700,000
Peel Village Golf Course Garage 0.32 0.32 0.32 0.32 0.32 0.32 0.32 0.32 0.32 0.32 700,000
Quonset Hut/Ogada Wilderness Centre 0.33 0.33 0.33 0.33 0.33 0.33 0.33 - - - 700,000
Roselea Tennis Clubhouse & Storage 2.06 2.06 2.06 2.06 2.06 2.06 2.06 2.06 2.06 2.06 1,000,000
Rotary Club House Sheds 0.25 0.25 0.25 0.25 0.25 0.25 0.25 0.25 0.25 0.25 700,000
Sesquicentennial Park Depot 1.39 1.39 1.39 1.39 1.39 1.39 1.39 1.39 1.39 1.39 700,000
Teramoto Parks Depot - - - - - - - - 2.51 2.51 700,000
Valleybrook Field House 0.04 0.04 0.04 0.04 0.04 0.04 0.04 0.04 0.04 0.04 700,000
Victoria Park Shed 0.01 0.01 0.01 0.01 0.01 0.01 0.01 0.01 0.01 0.01 700,000
Total (acres) 12.00 11.46 11.46 11.41 11.41 11.14 13.21 13.20 15.59 15.79
Total ($000) $9,018.0 $8,640.0 $8,640.0 $8,605.0 $8,605.0 $8,416.0 $9,865.0 $9,858.0 $11,531.0 $11,671.0
APPENDIX B.4
TABLE 1 - PAGE 30
# of Acres
HEMSON
133

RECREATION
OUTDOOR BUILDINGS
INVENTORY OF CAPITAL ASSETS
EQUIPMENT FOR OUTDOOR BUILDINGS
Description 2004 2005 2006 2007 2008 2009 2010 2011 2012 2013
Brampton Cemetery Mtce Bldg $13.1 $13.1 $13.1 $13.1 $13.1 $13.1 $13.1 $13.1 $13.1 $13.1
Brampton Cemetary Office $21.5 $21.5 $21.5 $21.5 $21.5 $21.5 $21.5 $21.5 $21.5 $21.5
Ellen Street Parks Garage $15.5 $15.5 $15.5 $15.5 $15.5 $15.5 $15.5 $15.5 $15.5 $15.5
Century Gardens Fieldhouse $71.3 $71.3 $71.3 $71.3 $5.7 $5.7 $5.7 $5.7 $0.0 $0.0
Chinguacousy Park Parks building $60.3 $60.3 $60.3 $60.3 $60.3 $60.3 $60.3 $60.3 $60.3 $60.3
Ching. Ski-hill Pump House $8.7 $8.7 $8.7 $8.7 $8.7 $8.7 $8.7 $8.7 $8.7 $8.7
Ching. Ski-hill Rope-tow Hut $2.6 $2.6 $2.6 $2.6 $2.6 $2.6 $2.6 $0.0 $0.0 $0.0
Ching. Ski-hill T-bar Line Hut $1.0 $1.0 $0.0 $0.0 $0.0 $0.0 $0.0 $0.0 $0.0 $0.0
Chinguacousy Park Mini Golf / Snack Bar $58.3 $58.3 $58.3 $58.3 $58.3 $58.3 $58.3 $58.3 $58.3 $58.3
Chinguacousy Park Garage $45.2 $45.2 $45.2 $45.2 $45.2 $45.2 $45.2 $45.2 $45.2 $45.2
Chinguacousy Park Wading Pool Buildings $4.9 $4.9 $4.9 $4.9 $4.9 $4.9 $4.9 $4.9 $4.9 $4.9
Chinguacousy Sports Box $7.7 $7.7 $7.7 $7.7 $7.7 $7.7 $7.7 $0.0 $0.0 $0.0
Chinguacousy Park Track Building $0.0 $0.0 $0.0 $0.0 $0.0 $0.0 $0.0 $0.0 $0.0 $0.0
County Court Field House $22.4 $22.4 $22.4 $22.4 $22.4 $22.4 $22.4 $22.4 $22.4 $22.4
Crescent Hill Storage Bldg $46.9 $0.0 $0.0 $0.0 $0.0 $0.0 $0.0 $0.0 $0.0 $0.0
Duggan Park Fieldhouse $28.9 $28.9 $28.9 $28.9 $28.9 $28.9 $28.9 $28.9 $28.9 $28.9
Earnscliffe Storage Shed $16.0 $16.0 $16.0 $0.0 $0.0 $0.0 $0.0 $0.0 $0.0 $0.0
Eldorado Parks Shed $8.6 $8.6 $8.6 $8.6 $8.6 $8.6 $8.6 $8.6 $8.6 $8.6
Eldorado Storage Well Building $0.6 $0.6 $0.6 $0.6 $0.6 $0.6 $0.6 $0.6 $0.6 $0.6
Eldorado Well Holding Tank Building $0.0 $0.0 $0.0 $0.0 $0.0 $0.0 $0.0 $0.0 $0.0 $0.0
Fred Kline Fieldhouse $8.6 $8.6 $8.6 $8.6 $8.6 $8.6 $8.6 $8.6 $8.6 $8.6
Glidden Parks Operations Centre $0.0 $0.0 $0.0 $0.0 $0.0 $0.0 $511.1 $511.1 $511.1 $511.1
Loafer's Lake Sheds $8.6 $8.6 $8.6 $8.6 $8.6 $8.6 $8.6 $8.6 $8.6 $8.6
Northwood Park Wading Pool $0.0 $0.0 $0.0 $0.0 $0.0 $0.0 $0.0 $0.0 $0.0 $0.0
Norton Park Shed $27.2 $27.2 $27.2 $27.2 $27.2 $27.2 $27.2 $27.2 $27.2 $27.2
Orenda Road Parks Operation Centre $511.1 $511.1 $511.1 $511.1 $511.1 $511.1 $0.0 $0.0 $0.0 $0.0
OPP - Helicopter Hanger (Park Maintenance) $81.2 $81.2 $81.2 $81.2 $0.0 $0.0 $0.0 $0.0 $0.0 $0.0
OPP - Greenhouse (Chapel Building) $71.6 $71.6 $71.6 $71.6 $71.6 $0.0 $0.0 $0.0 $0.0 $0.0
Peel Village Golf Course Garage $31.1 $31.1 $31.1 $31.1 $31.1 $31.1 $31.1 $31.1 $31.1 $31.1
Rotary Club House & Shed $22.0 $22.0 $22.0 $22.0 $22.0 $22.0 $22.0 $22.0 $22.0 $22.0
Valleybrook Field House $3.6 $3.6 $3.6 $3.6 $3.6 $3.6 $3.6 $3.6 $3.6 $3.6
Victoria Park Shed $1.9 $1.9 $1.9 $1.9 $1.9 $1.9 $1.9 $1.9 $1.9 $1.9
White Spruce Park Storage Bldg. $0.0 $0.0 $0.0 $0.0 $0.0 $0.0 $0.0 $0.0 $0.0 $0.0
Chinguacousy Wellness Centre Fieldhouse $8.6 $8.6 $8.6 $8.6 $8.6 $8.6 $8.6 $8.6 $8.6 $8.6
Memorial Snack Bar/Washrooms $8.6 $8.6 $8.6 $8.6 $8.6 $8.6 $8.6 $8.6 $8.6 $8.6
Quonset Hut/Ogada Wilderness Centre $62.0 $62.0 $62.0 $62.0 $62.0 $62.0 $62.0 $0.0 $0.0 $0.0
Chinguacousy Park Tennis & Baseball Storage $10.6 $10.6 $10.6 $10.6 $10.6 $10.6 $10.6 $10.6 $10.6 $10.6
Sesquicentennial Park Fieldhouse $0.0 $0.0 $0.0 $0.0 $80.9 $80.9 $80.9 $80.9 $80.9 $80.9
Park Maintenance Equipment $1,728.1 $2,009.8 $2,228.6 $2,499.0 $2,708.4 $2,708.4 $2,708.4 $2,708.4 $2,708.4 $2,708.4
Total ($000) $3,018.2 $3,253.1 $3,470.9 $3,725.3 $3,868.7 $3,797.1 $3,797.1 $3,724.8 $3,719.1 $3,719.1
Total Value of Equipment for Outdoor Buildings ($000)
APPENDIX B.5
TABLE 1 - PAGE 31
HEMSON
134

RECREATION
OUTDOOR MAINTENANCE EQUIPMENT
INVENTORY OF CAPITAL ASSETS
UNIT COST
MAINTENANCE EQUIPMENT (#'s) 2004 2005 2006 2007 2008 2009 2010 2011 2012 2013 ($/equip)
Aerator 7 7 8 8 11 11 11 11 12 12 $4,400
Aerator (Verti Drain) - - - - - - - 1 2 2 $24,750
Air Compressor 1 1 1 1 1 1 3 3 3 3 $810
Aquacide - - - 1 1 2 5 5 5 5 $20,100
Att - Aerator 3 5 5 5 6 6 6 6 4 4 $6,300
Att - Blower 1 1 1 1 1 1 1 - - - $2,100
Att - Edger 2 2 2 2 2 2 2 2 2 2 $1,530
Att - Mott 4 4 4 5 4 4 3 3 1 1 $5,000
Att - Mower 1 1 1 1 2 1 1 1 1 1 $2,000
Att - Overseeder 2 2 2 3 3 3 3 3 3 3 $16,000
Att - Renovator - - - - - - 1 1 1 1 $26,800
Att - Roller 2 2 2 2 2 2 2 2 2 2 $3,600
Att - Trailer Roller 1 1 1 1 1 1 1 1 1 1 $8,800
Att - Rotary Mower - - - - 1 1 1 1 1 1 $2,200
Att - Spreader 4 4 4 5 5 7 7 7 5 5 $5,700
Att - Tiller 1 1 1 1 1 1 1 1 1 1 $7,200
Att - Topdresser 4 4 5 6 6 5 5 5 5 5 $31,400
Att - Groomer 5 5 5 5 5 5 5 5 5 5 $5,500
Auger 1 1 1 1 1 1 2 2 2 2 $890
Auger - Power - - - - 1 1 1 1 1 1 $5,400
Backpack Blower 13 14 14 24 31 31 31 30 30 34 $410
Blower - Handheld - - - - - - - - - 2 $190
Blower - Little Wonder 1 1 1 1 1 1 1 - - 2 $1,300
Boat Motor 1 1 1 1 1 1 1 1 1 1 $1,800
Box Blade - - - - - - - - 1 1 $3,750
Brush Trimmer 1 1 1 1 1 2 3 4 4 4 $1,200
Chainsaw - Regular 48 69 70 75 88 90 91 77 76 92 $470
Concrete Saw 6 7 7 8 10 12 13 12 12 12 $1,200
APPENDIX B.4
TABLE 1 - PAGE 32
# of Equipment
HEMSON
135

RECREATION
OUTDOOR MAINTENANCE EQUIPMENT
INVENTORY OF CAPITAL ASSETS
UNIT COST
MAINTENANCE EQUIPMENT (#'s) CONT'D 2004 2005 2006 2007 2008 2009 2010 2011 2012 2013 ($/equip)
Dethatcher 1 1 1 1 1 1 1 1 1 - $2,400
Drill 1 1 1 1 1 1 1 1 1 1 $700
Edger 11 11 11 11 11 12 13 11 11 9 $940
Forklift - - - - - - 1 1 1 1 $16,700
Gator 4 4 4 4 5 6 6 6 6 4 $14,200
Gator Pro 3 3 3 3 3 3 3 3 3 3 $44,200
Generator 12 14 14 16 20 20 20 26 26 26 $3,000
Gill 5 5 5 5 5 5 5 4 3 2 $2,800
Golf Cart 7 7 7 7 7 7 7 7 4 3 $4,900
Groomer 5 5 5 5 5 6 6 6 2 2 $5,400
Handheld Blower 14 27 35 37 43 50 55 54 54 61 $190
Hedge Trimmer 11 17 18 19 22 27 27 26 27 36 $370
Ice Edger 9 11 11 14 16 17 14 14 14 14 $5,800
Infielder - - - - - - - - - 1 $6,280
Lawn Mower 48 59 61 66 76 80 83 86 82 83 $540
Lazer - - - - 1 1 1 1 1 1 $2,800
Lely Spreader - - - - - 1 1 1 1 1 $5,400
Madvac 4 4 4 4 4 4 4 4 - - $50,400
Mower - Walker 2 2 2 2 2 2 2 2 2 2 $16,900
Painter 1 1 1 1 1 1 1 1 1 1 $200
Polesaw 12 25 30 30 32 37 39 36 34 41 $440
Post Pounder 2 2 2 2 2 2 2 2 2 2 $1,500
Power Broom 3 4 5 5 5 5 5 4 4 9 $530
Power Sweeper 4 4 8 8 8 8 8 6 6 5 $690
Pressure Washer 5 5 8 9 10 11 11 8 8 10 $870
Pump 9 9 9 9 9 9 9 9 9 9 $1,640
APPENDIX B.4
TABLE 1 - PAGE 33
# of Equipment
HEMSON
136

RECREATION
OUTDOOR MAINTENANCE EQUIPMENT
INVENTORY OF CAPITAL ASSETS
UNIT COST
MAINTENANCE EQUIPMENT (#'s) CONT'D 2004 2005 2006 2007 2008 2009 2010 2011 2012 2013 ($/equip)
Rainboy 5 5 5 5 5 5 5 5 5 4 $6,650
Roller 8 8 8 8 8 8 8 7 7 9 $6,290
Sandsifter 1 2 5 6 6 6 6 6 6 6 $13,960
Seeder - walk behind - - - - - - 1 1 1 1 $1,800
Snowblower 23 32 34 42 48 49 50 50 50 52 $1,900
Snowmobile 1 1 1 1 - - - - - - $2,400
Sod Cutter 6 7 10 11 11 14 16 13 13 11 $4,900
Soil Pulverizer - - - - - - - - - 2 $2,300
Sprayer 14 15 15 15 15 16 16 20 16 16 $7,500
Spreader - walk behind 1 1 2 3 3 3 3 2 1 1 $240
Steamer - - - - - 1 1 1 1 1 $7,000
String Trimmer 111 128 133 144 160 169 174 163 166 182 $310
Stump Grinder 2 2 2 2 2 2 3 3 3 3 $5,900
Sweeper - - - 1 1 1 1 1 1 1 $43,300
Tamper 2 3 3 4 6 8 8 8 8 8 $1,500
Tiller 15 27 31 35 39 43 42 40 40 41 $1,710
Topdresser 2 2 2 2 2 2 2 2 2 2 $12,850
Tractor 2 2 3 3 4 4 5 5 5 5 $23,800
Trailer 1 1 1 1 1 1 1 1 1 1 $11,600
Trencher 1 1 1 1 1 1 1 1 1 1 $8,700
Verti Drain - - - - - - - - - 2 $23,900
Walk Behind Blower 4 5 8 9 9 10 10 9 9 8 $1,420
Walk Behind Sweeper - 1 1 1 1 1 1 1 1 1 $3,880
Water Cart - - - - 1 1 2 2 3 3 $1,380
Winch - - - 1 1 1 1 1 1 1 $1,700
Total (#) 481 598 647 712 799 854 883 847 825 894
Total ($000) $1,467.8 $1,602.4 $1,746.8 $1,952.9 $2,087.3 $2,175.3 $2,310.8 $2,334.3 $2,061.4 $2,109.0
# of Equipment
APPENDIX B.4
TABLE 1 - PAGE 34
HEMSON
137

RECREATION
SPECIAL FACILITIES
INVENTORY OF CAPITAL ASSETS
Miscellaneous Special Facilities ($000) 2004 2005 2006 2007 2008 2009 2010 2011 2012 2013
Brampton Sports Park Box Ball Hockey $0.0 $0.0 $0.0 $0.0 $597.0 $597.0 $597.0 $597.0 $597.0 $597.0
Century Gardens Lawn Bowling Club $1,274.0 $1,274.0 $1,274.0 $1,274.0 $1,274.0 $1,274.0 $1,274.0 $1,274.0 $1,274.0 $1,274.0
Chinguacousy Bandshell $776.0 $776.0 $776.0 $0.0 $0.0 $0.0 $0.0 $0.0 $0.0 $0.0
Chinguacousy Boathouse $0.0 $0.0 $0.0 $0.0 $0.0 $0.0 $0.0 $0.0 $2,316.0 $2,316.0
Chinguacousy Formal Gardens $4,580.0 $4,580.0 $4,580.0 $4,580.0 $4,580.0 $4,580.0 $4,580.0 $4,580.0 $4,580.0 $4,580.0
Chinguacousy Greenhouses/ Barns, Paddocks, Parks Ops $3,738.0 $3,738.0 $3,738.0 $3,738.0 $3,738.0 $3,738.0 $3,738.0 $3,738.0 $3,738.0 $3,738.0
Chinguacousy Mini-Golf $326.0 $326.0 $326.0 $326.0 $326.0 $326.0 $585.0 $585.0 $585.0 $585.0
Chinguacousy Winter Tennis Centre $3,590.0 $3,590.0 $3,590.0 $3,590.0 $3,590.0 $3,590.0 $3,590.0 $4,265.0 $4,265.0 $4,265.0
Chinguacousy Sandalwood Wet Field Hockey $0.0 $0.0 $0.0 $0.0 $0.0 $0.0 $0.0 $0.0 $0.0 $1,631.4
Civic Centre Outdoor Rink $1,042.0 $1,042.0 $1,042.0 $1,042.0 $1,042.0 $1,042.0 $1,042.0 $0.0 $0.0 $0.0
Creditview Sandalwood Field House $1,800.0 $1,800.0 $1,800.0 $1,800.0 $1,800.0 $1,800.0
Eldorado Outdoor Pool $866.0 $866.0 $866.0 $866.0 $866.0 $866.0 $866.0 $866.0 $866.0 $866.0
Eldorado Pavillion $954.5 $954.5 $954.5 $954.5 $954.5 $954.5 $954.5 $954.5 $954.5 $954.5
Ezard Park Silo $173.1 $173.1 $173.1 $173.1 $173.1 $173.1 $173.1 $173.1 $173.1 $173.1
FCCC Lawn Bowling $0.0 $0.0 $0.0 $0.0 $0.0 $0.0 $0.0 $3,864.0 $3,864.0 $3,864.0
Gage Park Artif. Ice/Fieldhse $3,464.0 $3,464.0 $3,464.0 $3,464.0 $3,464.0 $3,464.0 $3,464.0 $3,464.0 $3,464.0 $3,464.0
Mount Pleasant Ice Skating / Reflecting Pond $0.0 $0.0 $0.0 $0.0 $0.0 $0.0 $0.0 $806.0 $806.0 $806.0
Peel Village Golf
- Clubhouse $810.0 $810.0 $810.0 $810.0 $810.0 $810.0 $810.0 $810.0 $810.0 $810.0
- Development (# holes) $2,673.0 $2,673.0 $2,673.0 $2,673.0 $2,673.0 $2,673.0 $2,673.0 $2,673.0 $2,673.0 $2,673.0
Sesquicentennial Park Field House $2,902.5 $2,902.5 $2,902.5 $2,902.5 $2,902.5 $2,902.5
Teramoto Comfort Station $0.0 $0.0 $0.0 $0.0 $0.0 $0.0 $0.0 $0.0 $684.3 $684.3
Total ($000) $24,266.6 $24,266.6 $24,266.6 $23,490.6 $28,790.1 $28,790.1 $29,049.1 $33,352.1 $36,352.3 $37,983.7
Total Value of Miscellaneous Special Facilities ($000)
APPENDIX B.4
TABLE 1 - PAGE 35
HEMSON
138
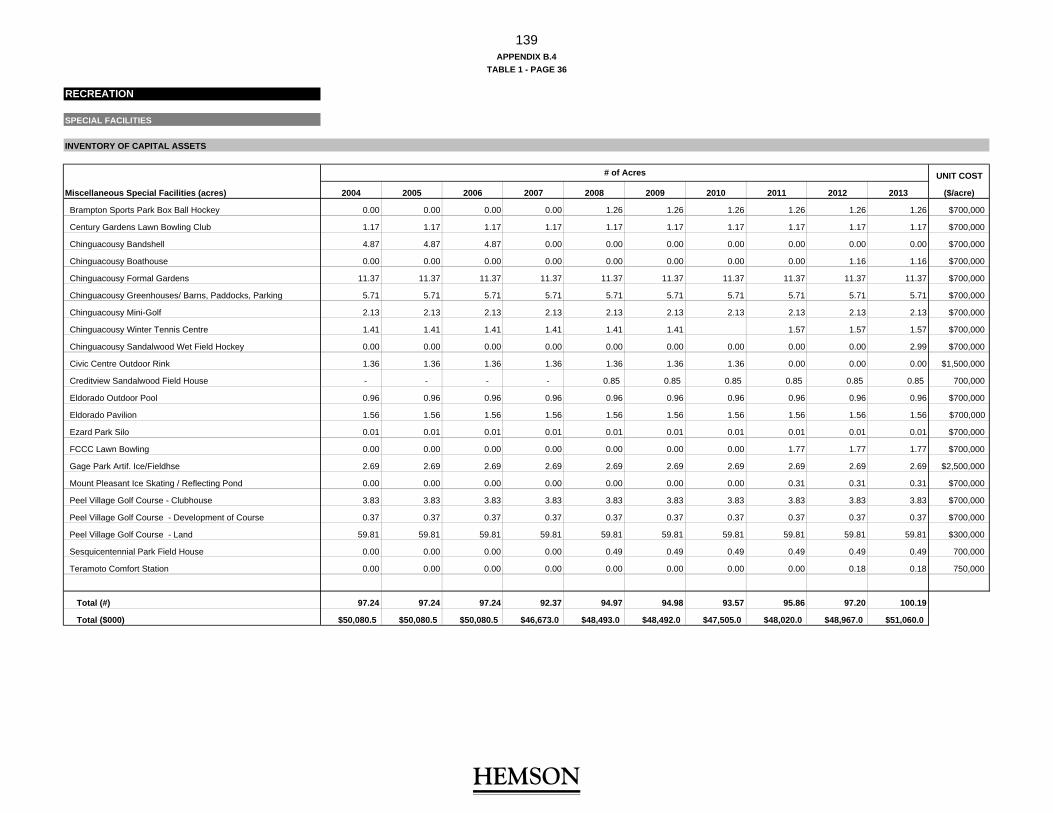
RECREATION
SPECIAL FACILITIES
INVENTORY OF CAPITAL ASSETS
UNIT COST
Miscellaneous Special Facilities (acres) 2004 2005 2006 2007 2008 2009 2010 2011 2012 2013 ($/acre)
Brampton Sports Park Box Ball Hockey 0.00 0.00 0.00 0.00 1.26 1.26 1.26 1.26 1.26 1.26 $700,000
Century Gardens Lawn Bowling Club 1.17 1.17 1.17 1.17 1.17 1.17 1.17 1.17 1.17 1.17 $700,000
Chinguacousy Bandshell 4.87 4.87 4.87 0.00 0.00 0.00 0.00 0.00 0.00 0.00 $700,000
Chinguacousy Boathouse 0.00 0.00 0.00 0.00 0.00 0.00 0.00 0.00 1.16 1.16 $700,000
Chinguacousy Formal Gardens 11.37 11.37 11.37 11.37 11.37 11.37 11.37 11.37 11.37 11.37 $700,000
Chinguacousy Greenhouses/ Barns, Paddocks, Parking 5.71 5.71 5.71 5.71 5.71 5.71 5.71 5.71 5.71 5.71 $700,000
Chinguacousy Mini-Golf 2.13 2.13 2.13 2.13 2.13 2.13 2.13 2.13 2.13 2.13 $700,000
Chinguacousy Winter Tennis Centre 1.41 1.41 1.41 1.41 1.41 1.41 1.57 1.57 1.57 $700,000
Chinguacousy Sandalwood Wet Field Hockey 0.00 0.00 0.00 0.00 0.00 0.00 0.00 0.00 0.00 2.99 $700,000
Civic Centre Outdoor Rink 1.36 1.36 1.36 1.36 1.36 1.36 1.36 0.00 0.00 0.00 $1,500,000
Creditview Sandalwood Field House - - - - 0.85 0.85 0.85 0.85 0.85 0.85 700,000
Eldorado Outdoor Pool 0.96 0.96 0.96 0.96 0.96 0.96 0.96 0.96 0.96 0.96 $700,000
Eldorado Pavilion 1.56 1.56 1.56 1.56 1.56 1.56 1.56 1.56 1.56 1.56 $700,000
Ezard Park Silo 0.01 0.01 0.01 0.01 0.01 0.01 0.01 0.01 0.01 0.01 $700,000
FCCC Lawn Bowling 0.00 0.00 0.00 0.00 0.00 0.00 0.00 1.77 1.77 1.77 $700,000
Gage Park Artif. Ice/Fieldhse 2.69 2.69 2.69 2.69 2.69 2.69 2.69 2.69 2.69 2.69 $2,500,000
Mount Pleasant Ice Skating / Reflecting Pond 0.00 0.00 0.00 0.00 0.00 0.00 0.00 0.31 0.31 0.31 $700,000
Peel Village Golf Course - Clubhouse 3.83 3.83 3.83 3.83 3.83 3.83 3.83 3.83 3.83 3.83 $700,000
Peel Village Golf Course - Development of Course 0.37 0.37 0.37 0.37 0.37 0.37 0.37 0.37 0.37 0.37 $700,000
Peel Village Golf Course - Land 59.81 59.81 59.81 59.81 59.81 59.81 59.81 59.81 59.81 59.81 $300,000
Sesquicentennial Park Field House 0.00 0.00 0.00 0.00 0.49 0.49 0.49 0.49 0.49 0.49 700,000
Teramoto Comfort Station 0.00 0.00 0.00 0.00 0.00 0.00 0.00 0.00 0.18 0.18 750,000
Total (#) 97.24 97.24 97.24 92.37 94.97 94.98 93.57 95.86 97.20 100.19
Total ($000) $50,080.5 $50,080.5 $50,080.5 $46,673.0 $48,493.0 $48,492.0 $47,505.0 $48,020.0 $48,967.0 $51,060.0
APPENDIX B.4
TABLE 1 - PAGE 36
# of Acres
HEMSON
139

RECREATION
PARK DEVELOPMENT
INVENTORY OF CAPITAL ASSETS
UNIT COST
TABLELAND (acre) 2004 2005 2006 2007 2008 2009 2010 2011 2012 2013 ($/acre)
Active Tableland 1,596 1,662 1,670 1,700 1,775 1,876 1,954 1,954 1,992 2,048 $164,746
Other Tableland 252 257 257 260 261 266 273 290 297 305 $125,068
Cemeteries 27 27 28 28 28 29 29 29 29 29 $82,534
Total (acre) 1,875 1,946 1,955 1,989 2,064 2,171 2,257 2,273 2,318 2,382
Total ($000) $296,725.5 $308,224.0 $309,622.1 $314,945.9 $327,365.4 $344,690.3 $358,524.3 $360,546.7 $367,730.9 $377,995.2
UNIT COST
HAZARDLAND (acre) 2004 2005 2006 2007 2008 2009 2010 2011 2012 2013 ($/acre)
Various Hazardland 683 717 764 817 872 928 1,002 1,135 1,214 1,276 $66,523
Total (acre) 683 717 764 817 872 928 1,002 1,135 1,214 1,276
Total ($000) $45,430.2 $47,697.0 $50,854.8 $54,344.6 $58,020.2 $61,714.7 $66,666.7 $75,515.6 $80,732.3 $84,896.0
# of acres
# of acres
APPENDIX B.4
TABLE 1 - PAGE 37
HEMSON
140
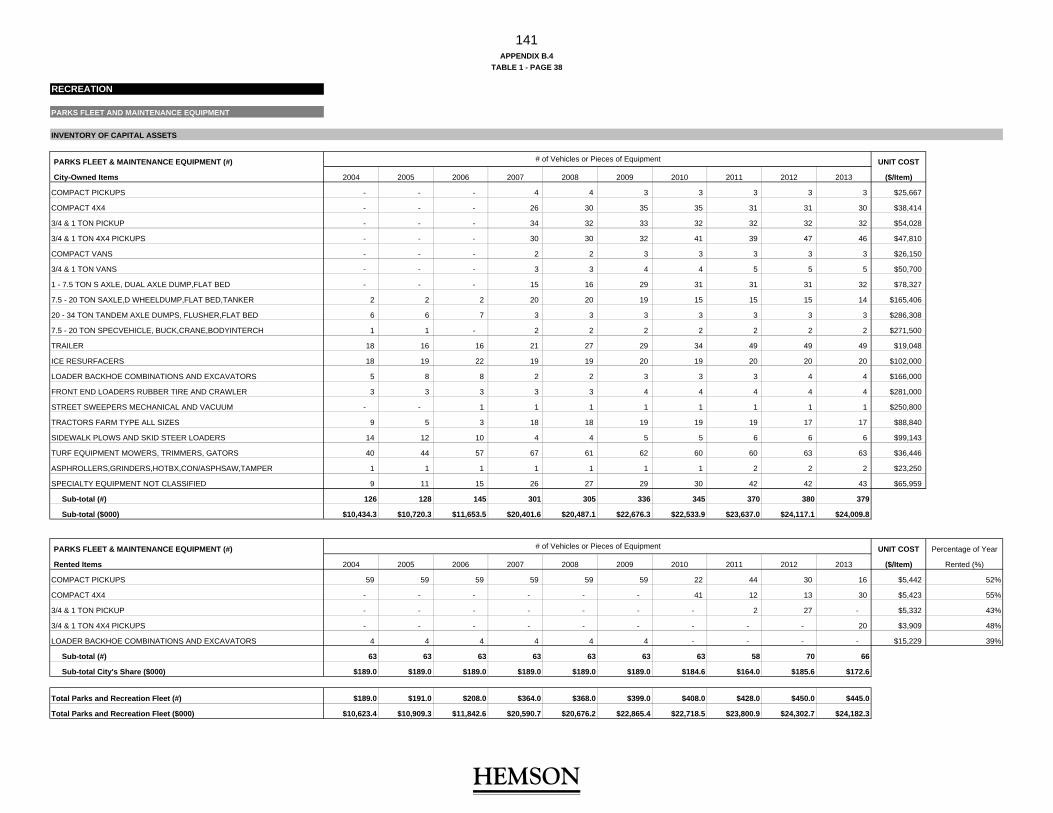
RECREATION
PARKS FLEET AND MAINTENANCE EQUIPMENT
INVENTORY OF CAPITAL ASSETS
PARKS FLEET & MAINTENANCE EQUIPMENT (#) UNIT COST
City-Owned Items 2004 2005 2006 2007 2008 2009 2010 2011 2012 2013 ($/Item)
COMPACT PICKUPS - - - 4 4 3 3 3 3 3 $25,667
COMPACT 4X4 - - - 26 30 35 35 31 31 30 $38,414
3/4 & 1 TON PICKUP - - - 34 32 33 32 32 32 32 $54,028
3/4 & 1 TON 4X4 PICKUPS - - - 30 30 32 41 39 47 46 $47,810
COMPACT VANS - - - 2 2 3 3 3 3 3 $26,150
3/4 & 1 TON VANS - - - 3 3 4 4 5 5 5 $50,700
1 - 7.5 TON S AXLE, DUAL AXLE DUMP,FLAT BED - - - 15 16 29 31 31 31 32 $78,327
7.5 - 20 TON SAXLE,D WHEELDUMP,FLAT BED,TANKER 2 2 2 20 20 19 15 15 15 14 $165,406
20 - 34 TON TANDEM AXLE DUMPS, FLUSHER,FLAT BED 6 6 7 3 3 3 3 3 3 3 $286,308
7.5 - 20 TON SPECVEHICLE, BUCK,CRANE,BODYINTERCH 1 1 - 2 2 2 2 2 2 2 $271,500
TRAILER 18 16 16 21 27 29 34 49 49 49 $19,048
ICE RESURFACERS 18 19 22 19 19 20 19 20 20 20 $102,000
LOADER BACKHOE COMBINATIONS AND EXCAVATORS 5 8 8 2 2 3 3 3 4 4 $166,000
FRONT END LOADERS RUBBER TIRE AND CRAWLER 3 3 3 3 3 4 4 4 4 4 $281,000
STREET SWEEPERS MECHANICAL AND VACUUM - - 1 1 1 1 1 1 1 1 $250,800
TRACTORS FARM TYPE ALL SIZES 9 5 3 18 18 19 19 19 17 17 $88,840
SIDEWALK PLOWS AND SKID STEER LOADERS 14 12 10 4 4 5 5 6 6 6 $99,143
TURF EQUIPMENT MOWERS, TRIMMERS, GATORS 40 44 57 67 61 62 60 60 63 63 $36,446
ASPHROLLERS,GRINDERS,HOTBX,CON/ASPHSAW,TAMPER 1 1 1 1 1 1 1 2 2 2 $23,250
SPECIALTY EQUIPMENT NOT CLASSIFIED 9 11 15 26 27 29 30 42 42 43 $65,959
Sub-total (#) 126 128 145 301 305 336 345 370 380 379
Sub-total ($000) $10,434.3 $10,720.3 $11,653.5 $20,401.6 $20,487.1 $22,676.3 $22,533.9 $23,637.0 $24,117.1 $24,009.8
PARKS FLEET & MAINTENANCE EQUIPMENT (#) UNIT COST Percentage of Year
Rented Items 2004 2005 2006 2007 2008 2009 2010 2011 2012 2013 ($/Item) Rented (%)
COMPACT PICKUPS 59 59 59 59 59 59 22 44 30 16 $5,442 52%
COMPACT 4X4 - - - - - - 41 12 13 30 $5,423 55%
3/4 & 1 TON PICKUP - - - - - - - 2 27 - $5,332 43%
3/4 & 1 TON 4X4 PICKUPS - - - - - - - - - 20 $3,909 48%
LOADER BACKHOE COMBINATIONS AND EXCAVATORS 4 4 4 4 4 4 - - - - $15,229 39%
Sub-total (#) 63 63 63 63 63 63 63 58 70 66
Sub-total City's Share ($000) $189.0 $189.0 $189.0 $189.0 $189.0 $189.0 $184.6 $164.0 $185.6 $172.6
Total Parks and Recreation Fleet (#) $189.0 $191.0 $208.0 $364.0 $368.0 $399.0 $408.0 $428.0 $450.0 $445.0
Total Parks and Recreation Fleet ($000) $10,623.4 $10,909.3 $11,842.6 $20,590.7 $20,676.2 $22,865.4 $22,718.5 $23,800.9 $24,302.7 $24,182.3
TABLE 1 - PAGE 38
APPENDIX B.4
# of Vehicles or Pieces of Equipment
# of Vehicles or Pieces of Equipment
HEMSON
141

RECREATION
SUMMARY OF SERVICE LEVEL ANALYSIS
2004 2005 2006 2007 2008 2009 2010 2011 2012 2013
Historic Population 386,670 409,558 433,800 450,486 467,814 485,808 504,495 523,900 541,300 557,800
INVENTORY SUMMARY ($000)
Indoor Recreation - Major Facilities $408,461 $408,461 $413,045 $476,363 $555,133 $555,133 $558,655 $561,344 $569,599 $593,525
Indoor Recreation - Equipment $29,579 $29,579 $29,968 $34,158 $39,169 $39,169 $39,448 $39,486 $40,094 $41,343
Indoor Recreation - Land $74,103 $74,103 $75,678 $84,155 $92,615 $92,611 $94,218 $95,751 $95,849 $99,489
Park Facilities $88,527 $96,867 $100,188 $103,963 $111,696 $112,217 $109,945 $114,846 $116,674 $122,819
Outdoor Buildings $17,258 $16,751 $16,740 $16,566 $15,625 $14,850 $22,764 $23,869 $24,972 $26,204
Land for Outdoor Buildings $9,018 $8,640 $8,640 $8,605 $8,605 $8,416 $9,865 $9,858 $11,531 $11,671
Equipment for Outdoor Buildings $3,018 $3,253 $3,471 $3,725 $3,869 $3,797 $3,797 $3,725 $3,719 $3,719
Parkland $342,156 $355,921 $360,477 $369,290 $385,386 $406,405 $425,191 $436,062 $448,463 $462,891
Special Facilities Buildings $24,267 $24,267 $24,267 $23,491 $28,790 $28,790 $29,049 $33,352 $36,352 $37,984
Special Facilities Land $50,080 $50,080 $50,080 $46,673 $48,493 $48,492 $47,505 $48,020 $48,967 $51,060
Parks Fleet and Maintenance Equipment $10,623 $10,909 $11,843 $20,591 $20,676 $22,865 $22,718 $23,801 $24,303 $24,182
Total ($000) $1,057,091 $1,078,831 $1,094,397 $1,187,581 $1,310,056 $1,332,745 $1,363,156 $1,390,114 $1,420,523 $1,474,887
Average
SERVICE LEVEL ($/capita) Service
Level
Indoor Recreation - Major Facilities $1,056.36 $997.32 $952.16 $1,057.44 $1,186.65 $1,142.70 $1,107.36 $1,071.47 $1,052.28 $1,064.05 $1,068.78
Indoor Recreation - Equipment $76.50 $72.22 $69.08 $75.83 $83.73 $80.63 $78.19 $75.37 $74.07 $74.12 $75.97
Indoor Recreation - Land $191.64 $180.93 $174.45 $186.81 $197.97 $190.63 $186.76 $182.77 $177.07 $178.36 $184.74
Park Facilities $228.95 $236.52 $230.95 $230.78 $238.76 $230.99 $217.93 $219.21 $215.54 $220.18 $226.98
Outdoor Buildings $44.63 $40.90 $38.59 $36.77 $33.40 $30.57 $45.12 $45.56 $46.13 $46.98 $40.87
Land for Outdoor Buildings $23.32 $21.10 $19.92 $19.10 $18.39 $17.32 $19.55 $18.82 $21.30 $20.92 $19.98
Equipment for Outdoor Buildings $7.81 $7.94 $8.00 $8.27 $8.27 $7.82 $7.53 $7.11 $6.87 $6.67 $7.63
Parkland $884.88 $869.04 $830.97 $819.76 $823.80 $836.55 $842.81 $832.34 $828.49 $829.85 $839.85
Special Facilities Buildings $62.76 $59.25 $55.94 $52.15 $61.54 $59.26 $57.58 $63.66 $67.16 $68.10 $60.74
Special Facilities Land $129.52 $122.28 $115.45 $103.61 $103.66 $99.82 $94.16 $91.66 $90.46 $91.54 $104.21
Fleet and Maintenance Equipment $27.47 $26.64 $27.30 $45.71 $44.20 $47.07 $45.03 $45.43 $44.90 $43.35 $39.71
Total ($/capita) $2,733.83 $2,634.14 $2,522.81 $2,636.22 $2,800.38 $2,743.36 $2,702.02 $2,653.39 $2,624.28 $2,644.11 $2,669.46
CALCULATION OF MAXIMUM ALLOWABLE
RECREATION
10-Year Funding Envelope Calculation Excess Capacity Calculation
10 Year Average Service Level 2004 - 2013 $2,669.46 Total Value of Inventory in 2013 1,474,887,259$
Net Population Growth 2014 - 2023 144,100 Inventory Using Average Service Level 1,489,022,057$
Maximum Allowable Funding Envelope 384,668,481 Excess Capacity $0
Less: Uncommitted Excess Capacity $0 Excess Capacity: uncommitted
Less: 10% Legislated Reduction $38,466,848
Discounted Maximum Allowable Funding Envelope $346,201,632
APPENDIX B.4
TABLE 1 - PAGE 39
HEMSON
142

Gross Grants/ Net TotalService Project Description Timing Project Subsidies/Other Municipal Replacement 10% DC Eligble Available DC 2014- Post
Cost Recoveries Cost and BTE Share Reduction Costs Reserves 2023 2023
4.0 RECREATION AND PARKS
4.1 Major Facilities4.1.1 Indoor Asset Replacement & Expansion (remaining cost) 2014 250,000$ -$ 250,000$ -$ 25,000$ 225,000$ 225,000$ -$ -$ 4.1.2 Mississauga/Embleton Facility 2014 780,000$ -$ 780,000$ -$ 78,000$ 702,000$ 702,000$ -$ -$ 4.1.3 Facility Repurposing (Old FCC - Admin Building) 2015 550,000$ -$ 550,000$ -$ 55,000$ 495,000$ -$ 495,000$ -$ 4.1.4 Mississauga/Embleton Facility 2015 5,330,000$ -$ 5,330,000$ -$ 533,000$ 4,797,000$ -$ 4,797,000$ -$ 4.1.5 Facility Repurposing (Old FCC - Admin Building) 2016 750,000$ -$ 750,000$ -$ 75,000$ 675,000$ -$ 675,000$ -$ 4.1.6 Mississauga/Embleton Facility 2016 100,000$ -$ 100,000$ -$ 10,000$ 90,000$ -$ 90,000$ -$ 4.1.7 Facility Repurposing (Old FCC - Admin Building) 2017 9,000,000$ -$ 9,000,000$ -$ 900,000$ 8,100,000$ -$ 8,100,000$ -$ 4.1.8 Mississauga/Embleton Facility 2017 4,500,000$ -$ 4,500,000$ -$ 450,000$ 4,050,000$ -$ 4,050,000$ -$ 4.1.9 Facility Repurposing (Old FCC - Admin Building) 2018 1,500,000$ -$ 1,500,000$ -$ 150,000$ 1,350,000$ -$ 1,350,000$ -$ 4.1.10 Mississauga/Embleton Facility 2018 40,500,000$ -$ 40,500,000$ -$ 4,050,000$ 36,450,000$ -$ 36,450,000$ -$ 4.1.11 Recreation Facility Modernizations 2018 100,000$ -$ 100,000$ 40,000$ 6,000$ 54,000$ -$ 54,000$ -$ 4.1.12 Recreation Facility Modernizations 2019 1,500,000$ -$ 1,500,000$ 600,000$ 90,000$ 810,000$ -$ 810,000$ -$ 4.1.13 Recreation Facility Modernizations 2020 20,500,000$ -$ 20,500,000$ 8,200,000$ 1,230,000$ 11,070,000$ -$ 11,070,000$ -$
4.1.14 Recreation Facility Modernizations 2021 19,000,000$ -$ 19,000,000$ 7,600,000$ 1,140,000$ 10,260,000$ -$ 10,260,000$ -$
Subtotal Major Facilities 104,360,000$ -$ 104,360,000$ 16,440,000$ 8,792,000$ 79,128,000$ 927,000$ 78,201,000$ -$
4.2 Park Facilities and Equipment/Fleet4.2.1 Indoor Fields - FCCC Lawn Bowling 2016 4,000,000$ -$ 4,000,000$ -$ 400,000$ 3,600,000$ -$ 3,600,000$ -$ 4.2.2 Addition of new fleet/equipment Various 6,448,673$ -$ 6,448,673$ -$ 644,867$ 5,803,805$ -$ 2,089,490$ 3,714,316$
Subtotal Park Facilities and Equipment/Fleet 10,448,673$ -$ 10,448,673$ -$ 1,044,867$ 9,403,805$ -$ 5,689,490$ 3,714,316$
DEVELOPMENT-RELATED CAPITAL PROGRAM
DC Eligible CostsIneligible Cost
TABLE 2 - PAGE 1APPENDIX B-4
2014 DEVELOPMENT CHARGES BACKGROUND STUDYCITY OF BRAMPTON
HEMSON
143

Gross Grants/ Net TotalService Project Description Timing Project Subsidies/Other Municipal Replacement 10% DC Eligble Available DC 2014- Post
Cost Recoveries Cost and BTE Share Reduction Costs Reserves 2023 2023
4.3 Parkland Development4.3.1 Alderlea 2014 71,000$ -$ 71,000$ -$ 7,100$ 63,900$ 63,900$ -$ -$ 4.3.2 Chinguacousy Park Enhancements 2014 350,000$ -$ 350,000$ -$ 35,000$ 315,000$ 315,000$ -$ -$ 4.3.3 Creditview/Sandalwood City wide Park 2014 3,908,000$ -$ 3,908,000$ -$ 390,800$ 3,517,200$ 1,899,157$ 1,618,043$ -$ 4.3.4 Gore Meadows 2014 7,500,000$ -$ 7,500,000$ -$ 750,000$ 6,750,000$ -$ 6,750,000$ -$ 4.3.5 Civic Design 2014 353,000$ -$ 353,000$ -$ 35,300$ 317,700$ -$ 317,700$ -$ 4.3.6 Heritage Program 2014 250,000$ -$ 250,000$ -$ 25,000$ 225,000$ -$ 225,000$ -$ 4.3.7 Mississauga / Bovaird Community Park 2014 250,000$ -$ 250,000$ -$ 25,000$ 225,000$ -$ 225,000$ -$ 4.3.8 Neighbourhood Parks 2014 2,149,000$ -$ 2,149,000$ -$ 214,900$ 1,934,100$ -$ 1,934,100$ -$ 4.3.9 Pathways Implementation Program 2014 195,000$ -$ 195,000$ -$ 19,500$ 175,500$ -$ 175,500$ -$ 4.3.10 Valleyland Development 2014 2,816,000$ -$ 2,816,000$ -$ 281,600$ 2,534,400$ -$ 2,534,400$ -$ 4.3.11 Alderlea 2015 175,000$ -$ 175,000$ -$ 17,500$ 157,500$ -$ 157,500$ -$ 4.3.12 Gore Meadows 2015 75,000,000$ -$ 75,000,000$ -$ 7,500,000$ 67,500,000$ -$ 67,500,000$ -$ 4.3.13 Civic Design 2015 250,000$ -$ 250,000$ -$ 25,000$ 225,000$ -$ 225,000$ -$ 4.3.14 Heritage Program 2015 500,000$ -$ 500,000$ -$ 50,000$ 450,000$ -$ 450,000$ -$ 4.3.15 Mississauga / Bovaird Community Park 2015 2,000,000$ -$ 2,000,000$ -$ 200,000$ 1,800,000$ -$ 1,800,000$ -$ 4.3.16 Neighbourhood Parks 2015 4,000,000$ -$ 4,000,000$ -$ 400,000$ 3,600,000$ -$ 3,600,000$ -$ 4.3.17 Torbram/Sandalwood Community Park 2015 5,000,000$ -$ 5,000,000$ -$ 500,000$ 4,500,000$ -$ 4,500,000$ -$ 4.3.18 Pathways Implementation Program 2015 562,000$ -$ 562,000$ 10,000$ 55,200$ 496,800$ -$ 496,800$ -$ 4.3.19 Valleyland Development 2015 4,820,000$ -$ 4,820,000$ -$ 482,000$ 4,338,000$ -$ 4,338,000$ -$
4.3.20 Wayfinding & Signage Program 2015 300,000$ -$ 300,000$ 150,000$ 15,000$ 135,000$ -$ 135,000$ -$ 4.3.21 Alderlea 2016 150,000$ -$ 150,000$ -$ 15,000$ 135,000$ -$ 135,000$ -$ 4.3.22 Eldorado Park Development 2016 3,000,000$ -$ 3,000,000$ 2,250,000$ 75,000$ 675,000$ -$ 675,000$ -$ 4.3.23 Civic Design 2016 250,000$ -$ 250,000$ -$ 25,000$ 225,000$ -$ 225,000$ -$ 4.3.24 Heritage Program 2016 3,996,000$ -$ 3,996,000$ -$ 399,600$ 3,596,400$ -$ 3,596,400$ -$ 4.3.25 Neighbourhood Parks 2016 4,250,000$ -$ 4,250,000$ -$ 425,000$ 3,825,000$ -$ 3,825,000$ -$ 4.3.26 NW Brampton Community Park 2016 14,280,000$ 10,680,000$ 3,600,000$ -$ 360,000$ 3,240,000$ -$ 3,240,000$ -$ 4.3.27 Pathways Implementation Program 2016 617,000$ -$ 617,000$ 5,000$ 61,200$ 550,800$ -$ 550,800$ -$ 4.3.28 Valleyland Development 2016 2,910,000$ -$ 2,910,000$ -$ 291,000$ 2,619,000$ -$ 2,619,000$ -$
4.3.29 Wayfinding & Signage Program 2016 300,000$ -$ 300,000$ 150,000$ 15,000$ 135,000$ -$ 135,000$ -$ 4.3.30 Civic Design 2017 250,000$ -$ 250,000$ -$ 25,000$ 225,000$ -$ 225,000$ -$ 4.3.31 Loafers Lake Park Development 2017 3,500,000$ -$ 3,500,000$ 2,624,000$ 87,600$ 788,400$ -$ 788,400$ -$ 4.3.32 New Community Park 1 2017 500,000$ -$ 500,000$ -$ 50,000$ 450,000$ -$ 450,000$ -$ 4.3.33 Neighbourhood Parks 2017 4,500,000$ -$ 4,500,000$ -$ 450,000$ 4,050,000$ -$ 4,050,000$ -$ 4.3.34 Pathways Implementation Program 2017 500,000$ -$ 500,000$ 10,000$ 49,000$ 441,000$ -$ 441,000$ -$
4.3.35 Valleyland Development 2017 2,640,000$ -$ 2,640,000$ -$ 264,000$ 2,376,000$ -$ 2,376,000$ -$
4.3.36 Wayfinding & Signage Program 2017 250,000$ -$ 250,000$ 125,000$ 12,500$ 112,500$ -$ 112,500$ -$ 4.3.37 Civic Design 2018 250,000$ -$ 250,000$ -$ 25,000$ 225,000$ -$ 225,000$ -$ 4.3.38 Neighbourhood Parks 2018 4,750,000$ -$ 4,750,000$ -$ 475,000$ 4,275,000$ -$ 4,275,000$ -$ 4.3.39 New Community Park 1 2018 2,875,000$ -$ 2,875,000$ -$ 287,500$ 2,587,500$ -$ 2,587,500$ -$ 4.3.40 Pathways Implementation Program 2018 500,000$ -$ 500,000$ 10,000$ 49,000$ 441,000$ -$ 441,000$ -$
4.3.41 Valleyland Development 2018 4,400,000$ -$ 4,400,000$ -$ 440,000$ 3,960,000$ -$ 3,960,000$ -$
4.3.42 Wayfinding & Signage Program 2018 250,000$ -$ 250,000$ 125,000$ 12,500$ 112,500$ -$ 112,500$ -$ 4.3.43 Civic Design 2019 200,000$ -$ 200,000$ -$ 20,000$ 180,000$ -$ 180,000$ -$ 4.3.44 Gore / Castlemore Community Park 2019 675,000$ -$ 675,000$ -$ 67,500$ 607,500$ -$ 607,500$ -$ 4.3.45 Neighbourhood Parks 2019 5,000,000$ -$ 5,000,000$ -$ 500,000$ 4,500,000$ -$ 4,500,000$ -$ 4.3.46 New Community Park 1 2019 21,888,000$ -$ 21,888,000$ -$ 2,188,800$ 19,699,200$ -$ 19,699,200$ -$ 4.3.47 Pathways Implementation Program 2019 500,000$ -$ 500,000$ 10,000$ 49,000$ 441,000$ -$ 441,000$ -$
4.3.48 Valleyland Development 2019 2,330,000$ -$ 2,330,000$ -$ 233,000$ 2,097,000$ -$ 2,097,000$ -$
4.3.49 Wayfinding & Signage Program 2019 200,000$ -$ 200,000$ 100,000$ 10,000$ 90,000$ -$ 90,000$ -$
CITY OF BRAMPTON
DC Eligible Costs
2014 DEVELOPMENT CHARGES BACKGROUND STUDYDEVELOPMENT-RELATED CAPITAL PROGRAM
Ineligible Cost
TABLE 2 - PAGE 2APPENDIX B-4
HEMSON
144

Gross Grants/ Net Total
Service Project Description Timing Project Subsidies/Other Municipal Replacement 10% DC Eligble Available DC 2014- Post
Cost Recoveries Cost and BTE Share Reduction Costs Reserves 2023 2023
4.3 Parkland Development (Cont'd)4.3.50 Civic Design 2020 200,000$ -$ 200,000$ -$ 20,000$ 180,000$ -$ 180,000$ -$ 4.3.51 Gore Meadows 2020 1,000,000$ -$ 1,000,000$ -$ 100,000$ 900,000$ -$ 900,000$ -$ 4.3.52 Gore / Castlemore Community Park 2020 4,835,000$ -$ 4,835,000$ -$ 483,500$ 4,351,500$ -$ 4,351,500$ -$ 4.3.53 Neighbourhood Parks 2020 4,750,000$ -$ 4,750,000$ -$ 475,000$ 4,275,000$ -$ 4,275,000$ -$ 4.3.54 Pathways Implementation Program 2020 450,000$ -$ 450,000$ 10,000$ 44,000$ 396,000$ -$ 396,000$ -$
4.3.55 Valleyland Development 2020 1,660,000$ -$ 1,660,000$ -$ 166,000$ 1,494,000$ -$ 1,494,000$ -$
4.3.56 Wayfinding & Signage Program 2020 200,000$ -$ 200,000$ 100,000$ 10,000$ 90,000$ -$ 90,000$ -$ 4.3.57 Civic Design 2021 200,000$ -$ 200,000$ -$ 20,000$ 180,000$ -$ 180,000$ -$ 4.3.58 Gore Meadows 2021 6,000,000$ -$ 6,000,000$ -$ 600,000$ 5,400,000$ -$ 5,400,000$ -$ 4.3.59 Heritage / Bovaird City Wide Park 2021 1,544,000$ -$ 1,544,000$ -$ 154,400$ 1,389,600$ -$ 1,389,600$ -$ 4.3.60 Neighbourhood Parks 2021 4,500,000$ -$ 4,500,000$ -$ 450,000$ 4,050,000$ -$ 4,050,000$ -$ 4.3.61 NW Brampton Community Park 2021 200,000$ -$ 200,000$ -$ 20,000$ 180,000$ -$ 180,000$ -$ 4.3.62 Pathways Implementation Program 2021 450,000$ -$ 450,000$ 10,000$ 44,000$ 396,000$ -$ 396,000$ -$
4.3.63 Valleyland Development 2021 6,450,000$ -$ 6,450,000$ -$ 645,000$ 5,805,000$ -$ 5,805,000$ -$
4.3.64 Wayfinding & Signage Program 2021 150,000$ -$ 150,000$ 75,000$ 7,500$ 67,500$ -$ 67,500$ -$ 4.3.65 Civic Design 2022 200,000$ -$ 200,000$ -$ 20,000$ 180,000$ -$ 180,000$ -$ 4.3.66 Heritage / Bovaird City Wide Park 2022 13,783,000$ -$ 13,783,000$ -$ 1,378,300$ 12,404,700$ -$ 12,404,700$ -$ 4.3.67 Neighbourhood Parks 2022 4,500,000$ -$ 4,500,000$ -$ 450,000$ 4,050,000$ -$ 4,050,000$ -$ 4.3.68 NW Brampton Community Park 2022 5,200,000$ -$ 5,200,000$ -$ 520,000$ 4,680,000$ -$ 4,680,000$ -$ 4.3.69 Pathways Implementation Program 2022 450,000$ -$ 450,000$ 10,000$ 44,000$ 396,000$ -$ 396,000$ -$ 4.3.70 Valleyland Development 2022 2,540,000$ -$ 2,540,000$ -$ 254,000$ 2,286,000$ -$ 2,286,000$ -$
4.3.71 Wayfinding & Signage Program 2022 150,000$ -$ 150,000$ 75,000$ 7,500$ 67,500$ -$ 67,500$ -$ 4.3.72 Civic Design 2023 200,000$ -$ 200,000$ -$ 20,000$ 180,000$ -$ 180,000$ -$ 4.3.73 Neighbourhood Parks 2023 4,250,000$ -$ 4,250,000$ -$ 425,000$ 3,825,000$ -$ 3,825,000$ -$ 4.3.74 New Community Park 2 2023 2,300,000$ -$ 2,300,000$ -$ 230,000$ 2,070,000$ -$ 2,070,000$ -$ 4.3.75 NW Brampton Community Park 2023 45,830,000$ -$ 45,830,000$ -$ 4,583,000$ 41,247,000$ -$ 41,247,000$ -$ 4.3.76 Pathways Implementation Program 2023 300,000$ -$ 300,000$ 10,000$ 29,000$ 261,000$ -$ 261,000$ -$
4.3.77 Valleyland Development 2023 2,000,000$ -$ 2,000,000$ -$ 200,000$ 1,800,000$ -$ 1,800,000$ -$ 4.3.78 Wayfinding & Signage Program 2023 150,000$ -$ 150,000$ 75,000$ 7,500$ 67,500$ -$ 67,500$ -$
Subtotal Parkland Development 310,602,000$ 10,680,000$ 299,922,000$ 5,934,000$ 29,398,800$ 264,589,200$ 2,278,057$ 262,311,143$ -$
TOTAL RECREATION AND PARKS 425,410,673$ 10,680,000$ 414,730,673$ 22,374,000$ 39,235,667$ 353,121,005$ 3,205,057$ 346,201,632$ 3,714,316$
Residential Development Charge CalculationResidential Share of 2014-2023 DC Eligible Costs 100% $346,201,632 2014 - 2023 Net Funding Envelope for Parks & Recre $346,201,63210 Year Growth in Population in New Units 162,396 Unadjusted Development Charge Per Capita ($) $2,131.83 Reserve Fund Balance $3,205,057
Non-Residential Development Charge CalculationNon-Residential Share of 2014-2023 DC Eligible Costs 0% -$ 10 Year Growth in Square Meters 4,967,120 Unadjusted Development Charge Per Sq.M ($) $0.00
CITY OF BRAMPTON2014 DEVELOPMENT CHARGES BACKGROUND STUDY
DEVELOPMENT-RELATED CAPITAL PROGRAM
DC Eligible CostsIneligible Cost
APPENDIX B-4TABLE 2 - PAGE 3
HEMSON
145

TABLE 3
4.00 RECREATION SERVICES
OPENING CASH BALANCE FROM APPLICABLE RESERVES 2014 2015 2016 2017 2018 2019 2020 2021 2022 2023 TOTAL
OPENING CASH BALANCE ($000) 0.0 17,799.3 (38,354.5) (24,411.5) (8,030.5) (21,587.1) (12,547.6) 2,136.8 10,170.7 20,345.4
2014-2023 RESIDENTIAL FUNDING REQUIREMENTS4.00 Recreation Services : Non Inflated $13,988.69 $88,703.25 $19,575.15 $20,801.85 $49,663.95 $28,633.65 $22,965.45 $27,937.05 $24,273.15 $49,659.45 $346,201.634.00 Recreation Services: Inflated $13,988.69 $90,477.31 $20,365.98 $22,075.09 $53,757.86 $31,613.86 $25,862.83 $32,090.89 $28,439.86 $59,347.64 $378,020.01
POPULATION GROWTH - Population in New Units 14,619 16,034 16,131 17,281 17,586 17,523 16,894 16,135 15,096 15,097 162,396
REVENUE - current ($000) - Dev. Charge Receipts 31,481.9 35,220.1 36,142.4 39,493.9 40,993.9 41,664.8 40,972.9 39,913.1 38,089.7 38,854.3 $382,827.00
- Interest on Opening Balance 0.0 623.0 (2,109.5) (1,342.6) (441.7) (1,187.3) (690.1) 74.8 356.0 712.1 ($4,005.38) - Interest on In-year Transactions (excl.int.) 306.1 (1,519.6) 276.1 304.8 (351.0) 175.9 264.4 136.9 168.9 (563.6) ($801.02)
TOTAL REVENUE 31,788.0 34,323.5 34,309.0 38,456.1 40,201.2 40,653.4 40,547.2 40,124.8 38,614.5 39,002.8 $378,020.60
CLOSING CASH BALANCE 17,799.3 (38,354.5) (24,411.5) (8,030.5) (21,587.1) (12,547.6) 2,136.8 10,170.7 20,345.4 0.6
2014 Adjusted Charge Per Capita $2,153.53 Allocation of Capital ProgramResidential Sector 100.0%Non-Residential Sector 0.0%
Rates for 2014Inflation Rate 2.0%Interest Rate on Positive Balances 3.5%Interest Rate on Negative Balances 5.5%
RECREATION SERVICESRESIDENTIAL DEVELOPMENT CHARGE
APPENDIX B.4
CITY OF BRAMPTONCASHFLOW AND DETERMINATION OF DEVELOPMENT CHARGE
HEMSON
146

APPENDIX B.5
PUBLIC WORKS: BUILDINGS AND FLEET
HEMSON
147

APPENDIX B.5
PUBLIC WORKS: BUILDINGS AND FLEET
This appendix covers the yards and fleet components of the City’s operations. The Public Works Department operates from several works facilities located throughout the City to provide repair and maintenance services for roads, sidewalks, streetlights and other infrastructure. Information regarding roads and related infrastructure can be found in Appendix C. Only engineering related fleet and equipment are included in this service.
TABLE 1 HISTORIC SERVICE LEVELS
The Public Works Department operates out of two primary locations: Williams Parkway Works Operation Centre and Sandalwood Yard. The current inventory of capital assets for Public Works includes building space, salt domes and sheds with a total replacement value of $46.14 million. The 55.23 acres of land associated with the Public Works yards is valued at $46.94 million. Furniture and equipment, excluding computers totals $1.25 million. The 251 Public Works vehicles and related equipment add an additional $18.86 million to the value of the capital assets.
The total value of the Public Works capital inventory is $113.19 million. The ten year historic average service level is $139.96 per population and employee, and this, multiplied by the ten year forecast growth in net population and employment, results in a ten year maximum allowable funding envelope of $29.39 million. Under the Development Charges Act, 1997, services related to a highway as defined in subsection 1(1) of the Municipal Act, 2001, need not to be reduced by the legislated 10 per cent (as with other general services). The services and capital assets of Public Works: Buildings and Fleet are considered to be related to a highway, and as such, the maximum allowable of $29.39 million is not required to be reduced by ten per cent and therefore the full amount is brought forward to the development charges calculation.
HEMSON
148

TABLE 2 2014 – 2023 PROVISIONAL DEVELOPMENT-RELATED CAPITAL BUDGET& CALCULATION OF THE “UNADJUSTED” DEVELOPMENT CHARGES
The first project in the Public Works capital program is for the recovery of the negative reserve fund balance. The negative reserve fund relates to the previously committed excess capacity. The negative DC reserve fund balance for public works services amounts to $38.02 million and this full amount is brought forward for recovery through development charges.
The capital program also provides for the construction of two new works yards and “top ups” for previously budgeted projects over a seven year period from 2014 through to 2020 for a combined gross cost of $68.48 million. Finally, a provision for additional fleet and equipment adds $6.96 million to the gross program cost.
The ten year capital forecast for Public Works totals $113.46 million. No provincial government grants or subsidies or replacement shares are anticipated to offset the cost of the program. $84.07 million, the portion of the development-related cost which exceeds the maximum allowable funding envelope and this amount is deemed to benefit growth beyond 2023 and can be recovered through subsequent development charges studies.
The 2014–2023 DC costs eligible for recovery total to $29.39 million. This development related cost is allocated 71 per cent, or $20.87 million against new residential development, and 29 per cent, or $8.52 million against non-residential development. This yields an unadjusted residential development charge of $128.51 per capita and $1.72 per square metre of new non-residential development.
HEMSON
149
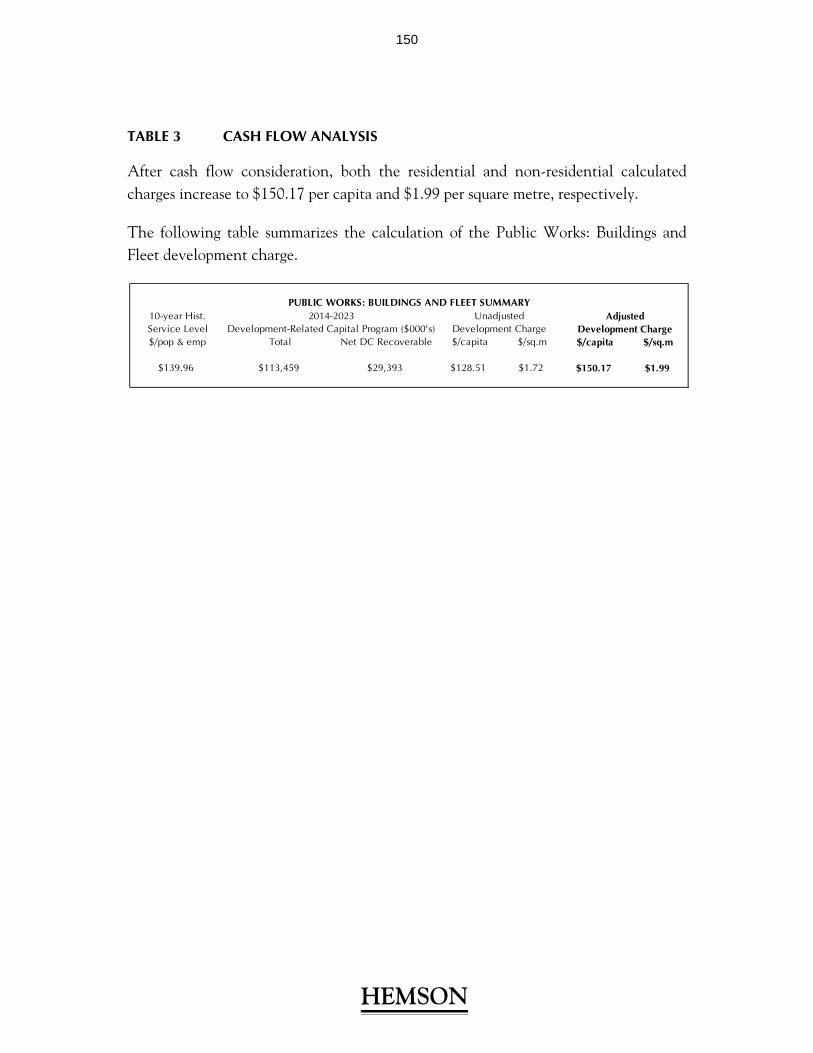
TABLE 3 CASH FLOW ANALYSIS
After cash flow consideration, both the residential and non-residential calculated charges increase to $150.17 per capita and $1.99 per square metre, respectively.
The following table summarizes the calculation of the Public Works: Buildings and Fleet development charge.
10-year Hist.Service Level$/pop & emp Total Net DC Recoverable $/capita $/sq.m $/capita $/sq.m
$139.96 $113,459 $29,393 $128.51 $1.72 $150.17 $1.99
2014-2023 Unadjusted AdjustedDevelopment-Related Capital Program ($000's) Development Charge Development Charge
PUBLIC WORKS: BUILDINGS AND FLEET SUMMARY
HEMSON
150

PUBLIC WORKS - BUILDINGS & FLEET
INVENTORY OF CAPITAL ASSETS
BUILDINGS ($000)
Facility Name 2004 2005 2006 2007 2008 2009 2010 2011 2012 2013
Williams Parkway East Storage Shed $151.0 $151.0 $151.0 $151.0 $151.0 $151.0 $151.0 $151.0 $0.0 $0.0
Williams Parkway Salt Dome $619.9 $619.9 $619.9 $619.9 $619.9 $619.9 $619.9 $619.9 $619.9 $619.9
Williams Parkway Sand Dome $619.9 $619.9 $619.9 $619.9 $619.9 $619.9 $619.9 $619.9 $619.9 $619.9
Williams Parkway South Storage Shed $80.5 $80.5 $80.5 $80.5 $80.5 $80.5 $80.5 $80.5 $80.5 $80.5
Williams Parkway Vehicle Wash $332.4 $332.4 $332.4 $332.4 $332.4 $332.4 $332.4 $332.4 $332.4 $332.4
Williams Parkway Works Operation Centre $10,502.7 $10,502.7 $10,502.7 $10,502.7 $10,502.7 $13,658.0 $13,658.0 $13,658.0 $13,658.0 $13,658.0
Sandalwood Yard $2,837.1 $2,837.1 $2,837.1 $2,837.1 $2,837.1 $2,837.1 $2,837.1 $0.0 $0.0 $0.0
Sandalwood Salt Dome (old) $440.7 $440.7 $440.7 $440.7 $440.7 $440.7 $440.7 $0.0 $0.0 $0.0
Sandalwood Sand Dome (old) $440.7 $440.7 $440.7 $440.7 $440.7 $440.7 $440.7 $0.0 $0.0 $0.0
Sandalwood Yard Storage Bays Building (old) $126.0 $126.0 $126.0 $126.0 $126.0 $126.0 $126.0 $0.0 $0.0 $0.0
New Sandalwood Yard Facilities $0.0 $0.0 $0.0 $0.0 $0.0 $0.0 $0.0 $30,825.6 $30,825.6 $30,825.6
Sandalwood Yard Storage Bays Building
Sandalwood Fabric Building
Sandalwood Pole Barn- Phase 2
Sandalwood Pole Barn- Phase 3
Sandalwood Sand & Salt Storage and Garage Building
Total ($000) $16,150.7 $16,150.7 $16,150.7 $16,150.7 $16,150.7 $19,306.00 $19,306.00 $46,287.15 $46,136.15 $46,136.15
LAND UNIT COST
Facility Name 2004 2005 2006 2007 2008 2009 2010 2011 2012 2013 ($/acre)
Sandalwood Fabric Building 1.28 1.28 1.28 1.28 1.28 1.28 1.28 1.28 1.28 1.28 $850,000
Sandalwood Pole Barn- Phase 2 4.05 4.05 4.05 4.05 4.05 4.05 4.05 4.05 4.05 4.05 $850,000
Sandalwood Yard 0.72 0.72 0.72 0.72 0.72 0.72 0.72 0.72 0.72 0.72 $850,000
Sandalwood Salt Dome 4.05 4.05 4.05 4.05 4.05 4.05 4.05 4.05 4.05 4.05 $850,000
Williams Parkway East Storage Shed 2.06 2.06 2.06 2.06 2.06 2.06 2.06 2.06 2.06 2.06 $850,000
Williams Parkway Salt Dome 4.62 4.62 4.62 4.62 4.62 4.62 4.62 4.62 4.62 4.62 $850,000
Williams Parkway Sand Dome 4.62 4.62 4.62 4.62 4.62 4.62 4.62 4.62 4.62 4.62 $850,000
Williams Parkway South Storage Shed 1.03 1.03 1.03 1.03 1.03 1.03 1.03 1.03 1.03 1.03 $850,000
Williams Parkway Vehicle Wash 0.80 0.80 0.80 0.80 0.80 0.80 0.80 0.80 0.80 0.80 $850,000
Williams Parkway Works Operation Centre 31.99 31.99 31.99 31.99 31.99 31.99 31.99 31.99 31.99 31.99 $850,000
Total (acres) 55.23 55.23 55.23 55.23 55.23 55.23 55.23 55.23 55.23 55.23
Total ($000) $46,943.0 $46,943.0 $46,943.0 $46,943.0 $46,943.0 $46,943.0 $46,943.0 $46,943.0 $46,943.0 $46,943.0
APPENDIX B.5
TABLE 1 - PAGE 1
Total Value of Buildings ($000)
# of Acres
HEMSON
151

PUBLIC WORKS - BUILDINGS & FLEET
INVENTORY OF CAPITAL ASSETS
FURNITURE AND EQUIPMENT (excluding computers) UNIT COST
Facility Name 2004 2005 2006 2007 2008 2009 2010 2011 2012 2013 ($/item)
Williams Parkway East Storage Shed $100.57 $100.57 $100.57 $100.57 $100.57 $100.57 $100.57 $100.57 $100.57 $100.57 $25.14
Williams Parkway South Storage Shed $50.81 $50.81 $50.81 $50.81 $50.81 $50.81 $50.81 $50.81 $50.81 $50.81 $25.40
Williams Parkway Vehicle Wash $207.21 $207.21 $207.21 $207.21 $207.21 $207.21 $207.21 $207.21 $207.21 $207.21 $133.69
Williams Parkway Works Operation Centre $881.91 $881.91 $881.91 $881.91 $881.91 $881.91 $881.91 $881.91 $881.91 $881.91 $14.16
Sandalwood Yard $12.16 $12.16 $12.16 $12.16 $12.16 $12.16 $12.16 $12.16 $12.16 $12.16 $6.08
Sandalwood Yard - Storage Building $0.63 $0.63 $0.63 $0.63 $0.63 $0.63 $0.63 $0.63 $0.63 $0.63 $0.18
Total ($000) $1,253 $1,253 $1,253 $1,253 $1,253 $1,253 $1,253 $1,253 $1,253 $1,253
Total Value of Furniture and Equipment ($000)
APPENDIX B.5
TABLE 1 - PAGE 2
HEMSON
152
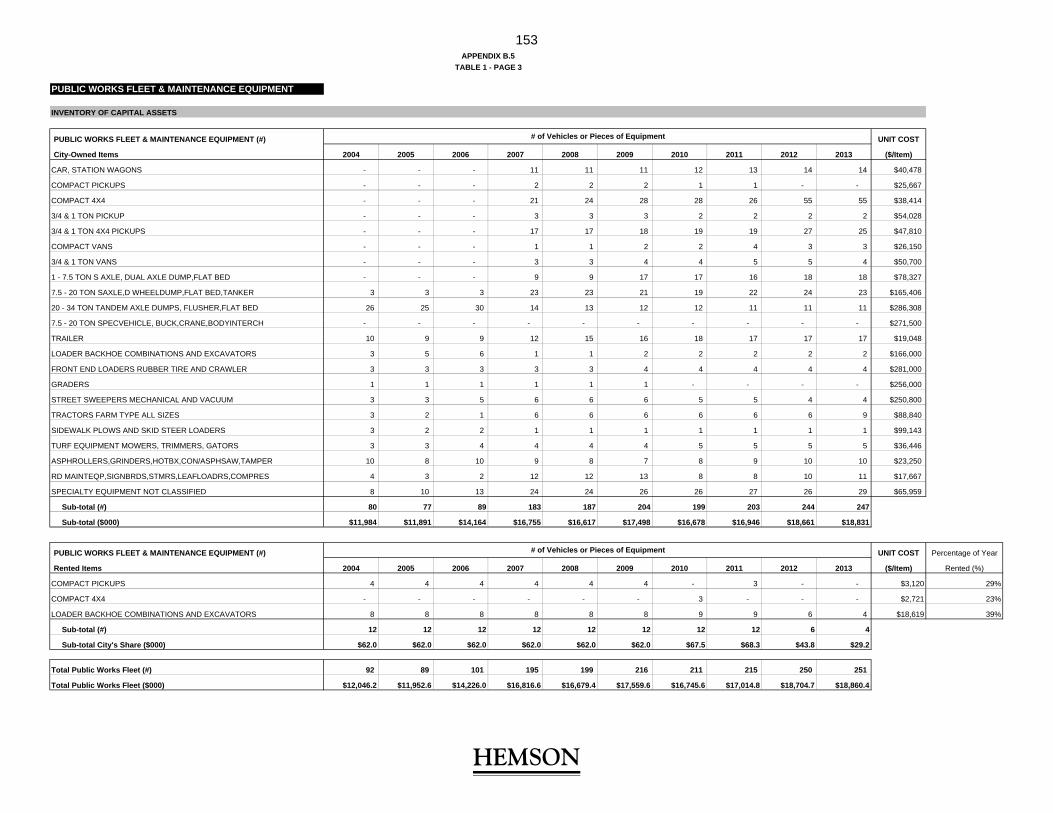
PUBLIC WORKS FLEET & MAINTENANCE EQUIPMENT
INVENTORY OF CAPITAL ASSETS
PUBLIC WORKS FLEET & MAINTENANCE EQUIPMENT (#) UNIT COST
City-Owned Items 2004 2005 2006 2007 2008 2009 2010 2011 2012 2013 ($/Item)
CAR, STATION WAGONS - - - 11 11 11 12 13 14 14 $40,478
COMPACT PICKUPS - - - 2 2 2 1 1 - - $25,667
COMPACT 4X4 - - - 21 24 28 28 26 55 55 $38,414
3/4 & 1 TON PICKUP - - - 3 3 3 2 2 2 2 $54,028
3/4 & 1 TON 4X4 PICKUPS - - - 17 17 18 19 19 27 25 $47,810
COMPACT VANS - - - 1 1 2 2 4 3 3 $26,150
3/4 & 1 TON VANS - - - 3 3 4 4 5 5 4 $50,700
1 - 7.5 TON S AXLE, DUAL AXLE DUMP,FLAT BED - - - 9 9 17 17 16 18 18 $78,327
7.5 - 20 TON SAXLE,D WHEELDUMP,FLAT BED,TANKER 3 3 3 23 23 21 19 22 24 23 $165,406
20 - 34 TON TANDEM AXLE DUMPS, FLUSHER,FLAT BED 26 25 30 14 13 12 12 11 11 11 $286,308
7.5 - 20 TON SPECVEHICLE, BUCK,CRANE,BODYINTERCH - - - - - - - - - - $271,500
TRAILER 10 9 9 12 15 16 18 17 17 17 $19,048
LOADER BACKHOE COMBINATIONS AND EXCAVATORS 3 5 6 1 1 2 2 2 2 2 $166,000
FRONT END LOADERS RUBBER TIRE AND CRAWLER 3 3 3 3 3 4 4 4 4 4 $281,000
GRADERS 1 1 1 1 1 1 - - - - $256,000
STREET SWEEPERS MECHANICAL AND VACUUM 3 3 5 6 6 6 5 5 4 4 $250,800
TRACTORS FARM TYPE ALL SIZES 3 2 1 6 6 6 6 6 6 9 $88,840
SIDEWALK PLOWS AND SKID STEER LOADERS 3 2 2 1 1 1 1 1 1 1 $99,143
TURF EQUIPMENT MOWERS, TRIMMERS, GATORS 3 3 4 4 4 4 5 5 5 5 $36,446
ASPHROLLERS,GRINDERS,HOTBX,CON/ASPHSAW,TAMPER 10 8 10 9 8 7 8 9 10 10 $23,250
RD MAINTEQP,SIGNBRDS,STMRS,LEAFLOADRS,COMPRES 4 3 2 12 12 13 8 8 10 11 $17,667
SPECIALTY EQUIPMENT NOT CLASSIFIED 8 10 13 24 24 26 26 27 26 29 $65,959
Sub-total (#) 80 77 89 183 187 204 199 203 244 247
Sub-total ($000) $11,984 $11,891 $14,164 $16,755 $16,617 $17,498 $16,678 $16,946 $18,661 $18,831
PUBLIC WORKS FLEET & MAINTENANCE EQUIPMENT (#) UNIT COST Percentage of Year
Rented Items 2004 2005 2006 2007 2008 2009 2010 2011 2012 2013 ($/Item) Rented (%)
COMPACT PICKUPS 4 4 4 4 4 4 - 3 - - $3,120 29%
COMPACT 4X4 - - - - - - 3 - - - $2,721 23%
LOADER BACKHOE COMBINATIONS AND EXCAVATORS 8 8 8 8 8 8 9 9 6 4 $18,619 39%
Sub-total (#) 12 12 12 12 12 12 12 12 6 4
Sub-total City's Share ($000) $62.0 $62.0 $62.0 $62.0 $62.0 $62.0 $67.5 $68.3 $43.8 $29.2
Total Public Works Fleet (#) 92 89 101 195 199 216 211 215 250 251
Total Public Works Fleet ($000) $12,046.2 $11,952.6 $14,226.0 $16,816.6 $16,679.4 $17,559.6 $16,745.6 $17,014.8 $18,704.7 $18,860.4
APPENDIX B.5
TABLE 1 - PAGE 3
# of Vehicles or Pieces of Equipment
# of Vehicles or Pieces of Equipment
HEMSON
153

PUBLIC WORKS - BUILDINGS & FLEET
SUMMARY OF SERVICE LEVEL ANALYSIS
2004 2005 2006 2007 2008 2009 2010 2011 2012 2013
Historic Population 386,670 409,558 433,800 450,486 467,814 485,808 504,495 523,900 541,300 557,800
Historic Employment 146,577 151,162 155,890 159,009 162,190 165,435 168,744 172,120 178,730 185,570
Total Historic Population & Employment 533,247 560,719 589,690 609,495 630,004 651,243 673,239 696,020 720,030 743,370
INVENTORY SUMMARY ($000)
Buildings $16,150.7 $16,150.7 $16,150.7 $16,150.7 $16,150.7 $19,306.0 $19,306.0 $46,287.2 $46,136.2 $46,136.2
Land $46,943.0 $46,943.0 $46,943.0 $46,943.0 $46,943.0 $46,943.0 $46,943.0 $46,943.0 $46,943.0 $46,943.0
Furniture $1,253.3 $1,253.3 $1,253.3 $1,253.3 $1,253.3 $1,253.3 $1,253.3 $1,253.3 $1,253.3 $1,253.3
Fleet $12,046.2 $11,952.6 $14,226.0 $16,816.6 $16,679.4 $17,559.6 $16,745.6 $17,014.8 $18,704.7 $18,860.4
Total ($000) $76,393.2 $76,299.6 $78,573.0 $81,163.6 $81,026.4 $85,061.9 $84,247.9 $111,498.3 $113,037.2 $113,192.9
Average
SERVICE LEVEL ($/pop & employ) Service
Level
Buildings $30.29 $28.80 $27.39 $26.50 $25.64 $29.64 $28.68 $66.50 $64.08 $62.06 $38.96
Land $88.03 $83.72 $79.61 $77.02 $74.51 $72.08 $69.73 $67.44 $65.20 $63.15 $74.05
Furniture $2.35 $2.24 $2.13 $2.06 $1.99 $1.92 $1.86 $1.80 $1.74 $1.69 $1.98
Fleet $22.59 $21.32 $24.12 $27.59 $26.48 $26.96 $24.87 $24.45 $25.98 $25.37 $24.97
Total ($/pop & employ) $143.26 $136.08 $133.25 $133.17 $128.62 $130.60 $125.14 $160.19 $157.00 $152.27 $139.96
CALCULATION OF MAXIMUM ALLOWABLE
PUBLIC WORKS - BUILDINGS & FLEET
10-Year Funding Envelope Calculation Excess Capacity Calculation
10 Year Average Service Level 2004 - 2013 $139.96 Total Value of Inventory in 2013 $113,192,910
Net Population & Employment Growth 2004 - 2013 210,010 Inventory Using Average Service Level $104,042,065
Maximum Allowable Funding Envelope $29,393,000 Excess Capacity $9,150,845
Less: Uncommitted Excess Capacity $0 Excess Capacity: Committed
Discounted Maximum Allowable Funding Envelope $29,393,000
APPENDIX B.5
TABLE 1 - PAGE 4
HEMSON
154

Gross Grants/ Net Total
Service Project Description Timing Project Subsidies/Other Municipal Replacement 0% DC Eligble Available DC 2014- Post
Cost Recoveries Cost and BTE Share Reduction Costs Reserves 2023 2023
5.0 PUBLIC WORKS: BUILDINGS AND FLEET
5.1 Recovery of Negative Reserve Fund Balance 2014 38,016,181$ -$ 38,016,181$ -$ -$ 38,016,181$ -$ 29,393,000$ 8,623,181$
5.2 Buildings, Land & Equipment
5.1.1 New Works Yard 2014 3,150,000$ -$ 3,150,000$ -$ -$ 3,150,000$ -$ -$ 3,150,000$
5.1.2 New Works Yard 2015 8,303,000$ -$ 8,303,000$ -$ -$ 8,303,000$ -$ -$ 8,303,000$
5.1.3 New Works Yard 2016 7,624,000$ -$ 7,624,000$ -$ -$ 7,624,000$ -$ -$ 7,624,000$
5.1.4 New Works Yard 2017 18,609,000$ -$ 18,609,000$ -$ -$ 18,609,000$ -$ -$ 18,609,000$
5.1.5 New Works Yard 2018 3,227,000$ -$ 3,227,000$ -$ -$ 3,227,000$ -$ -$ 3,227,000$
5.1.6 New Works Yard 2019 8,435,000$ -$ 8,435,000$ -$ -$ 8,435,000$ -$ -$ 8,435,000$ 5.1.7 New Works Yard 2020 19,134,000$ -$ 19,134,000$ -$ -$ 19,134,000$ -$ -$ 19,134,000$
Subtotal Buildings, Land & Equipment 68,482,000$ -$ 68,482,000$ -$ -$ 68,482,000$ -$ -$ 68,482,000$
5.2 Equipment
5.3.1 Additional Fleet and Equipment Various $6,961,000 -$ 6,961,000$ -$ -$ 6,961,000$ -$ -$ 6,961,000$
5.3.2 -$ -$ -$ -$ -$ -$ -$ -$ -$ -$ -$ -$ -$ -$ -$ -$ -$ -$
Subtotal Equipment 6,961,000$ -$ 6,961,000$ -$ -$ 6,961,000$ -$ -$ 6,961,000$
TOTAL PUBLIC WORKS: BUILDINGS AND FLEET 113,459,181$ -$ 113,459,181$ -$ -$ 113,459,181$ -$ 29,393,000$ 84,066,181$
Residential Development Charge CalculationResidential Share of 2014-2023 DC Eligible Costs 71% $20,869,030 2014 - 2023 Net Funding Envelope for Public Works $29,393,00010 Year Growth in Population in New Units 162,396 Unadjusted Development Charge Per Capita ($) $128.51 Reserve Fund Balance ($38,016,181)
Non-Residential Development Charge CalculationNon-Residential Share of 2014-2023 DC Eligible Costs 29% 8,523,970$ 10 Year Growth in Square Meters 4,967,120 Unadjusted Development Charge Per Sq.M ($) $1.72
APPENDIX B-5TABLE 2
CITY OF BRAMPTON2014 DEVELOPMENT CHARGES BACKGROUND STUDY
Ineligible Cost
DEVELOPMENT-RELATED CAPITAL PROGRAM
DC Eligible Costs
HEMSON
155

TABLE 3 - PAGE 1
5.00 PUBLIC WORKS: BUILDINGS & FLEET
OPENING CASH BALANCE FROM APPLICABLE RESERVES 2014 2015 2016 2017 2018 2019 2020 2021 2022 2023 TOTAL
OPENING CASH BALANCE ($000) 0.0 (19,187.3) (17,743.6) (16,155.1) (14,241.4) (12,116.1) (9,826.2) (7,459.5) (5,037.9) (2,612.4)
2014-2023 RESIDENTIAL FUNDING REQUIREMENTS5.00 Public Works: Buildings & Fleet : Non Inflated $20,869.03 $0.00 $0.00 $0.00 $0.00 $0.00 $0.00 $0.00 $0.00 $0.00 $20,869.035.00 Public Works: Buildings & Fleet: Inflated $20,869.03 $0.00 $0.00 $0.00 $0.00 $0.00 $0.00 $0.00 $0.00 $0.00 $20,869.03
POPULATION GROWTH - Population in New Units 14,619 16,034 16,131 17,281 17,586 17,523 16,894 16,135 15,096 15,097 162,396
REVENUE - current ($000) - Dev. Charge Receipts 2,195.3 2,456.0 2,520.3 2,754.0 2,858.6 2,905.4 2,857.1 2,783.2 2,656.1 2,709.4 $26,695.40
- Interest on Opening Balance 0.0 (1,055.3) (975.9) (888.5) (783.3) (666.4) (540.4) (410.3) (277.1) (143.7) ($5,740.87) - Interest on In-year Transactions (excl.int.) (513.5) 43.0 44.1 48.2 50.0 50.8 50.0 48.7 46.5 47.4 ($84.78)
TOTAL REVENUE 1,681.8 1,443.7 1,588.5 1,913.7 2,125.3 2,289.9 2,366.7 2,421.6 2,425.5 2,613.1 $20,869.76
CLOSING CASH BALANCE (19,187.3) (17,743.6) (16,155.1) (14,241.4) (12,116.1) (9,826.2) (7,459.5) (5,037.9) (2,612.4) 0.7
2014 Adjusted Charge Per Capita $150.17 Allocation of Capital ProgramResidential Sector 71.0%Non-Residential Sector 29.0%
Rates for 2014Inflation Rate 2.0%Interest Rate on Positive Balances 3.5%Interest Rate on Negative Balances 5.5%
APPENDIX B.5
CITY OF BRAMPTONCASHFLOW AND DETERMINATION OF DEVELOPMENT CHARGE
PUBLIC WORKS: BUILDINGS AND FLEETRESIDENTIAL DEVELOPMENT CHARGE
HEMSON
156

TABLE 3 - PAGE 2
5.00 PUBLIC WORKS: BUILDINGS AND FLEET
OPENING CASH BALANCE FROM APPLICABLE RESERVES 2014 2015 2016 2017 2018 2019 2020 2021 2022 2023 TOTAL
OPENING CASH BALANCE ($000) $0.00 ($7,635.63) ($6,843.03) ($6,029.13) ($5,296.43) ($4,584.78) ($3,753.00) ($2,871.81) ($1,945.82) ($1,017.73)
2009-2018 NON-RESIDENTIAL FUNDING REQUIREMENTS
5.00 Public Works: Buildings And Fleet : Non Inflated $8,523.97 $0.00 $0.00 $0.00 $0.00 $0.00 $0.00 $0.00 $0.00 $0.00 $8,523.97
5.00 Public Works: Buildings And Fleet: Inflated $8,523.97 $0.00 $0.00 $0.00 $0.00 $0.00 $0.00 $0.00 $0.00 $0.00 $8,523.97
NON-RESIDENTIAL GROWTH
- Sq. Metres in New Buildings 549,100 587,100 565,010 495,300 457,610 484,850 476,950 466,050 436,300 448,850 4,967,120
REVENUE - current ($000)
- Dev. Charge Receipts 1,092.7 1,191.7 1,169.8 1,046.0 985.7 1,065.3 1,068.9 1,065.3 1,017.3 1,067.5 $10,770.20
- Interest on Opening Balance 0.0 (420.0) (376.4) (331.6) (291.3) (252.2) (206.4) (157.9) (107.0) (56.0) ($2,198.76)
- Interest on In-year Transactions (excl.int.) (204.4) 20.9 20.5 18.3 17.2 18.6 18.7 18.6 17.8 18.7 ($35.00)
TOTAL REVENUE 888.3 792.6 813.9 732.7 711.6 831.8 881.2 926.0 928.1 1,030.2 $8,536.44
CLOSING CASH BALANCE (7,635.6) (6,843.0) (6,029.1) (5,296.4) (4,584.8) (3,753.0) (2,871.8) (1,945.8) (1,017.7) 12.5
Allocation of Capital Program
2014 Adjusted Charge Per Capita $1.99 Residential Sector 71.0%
Non-Residential Sector 29.0%
Rates for 2014
Inflation Rate: 2.0%
Interest Rate on Positive Balances 3.5%
Interest Rate on Negative Balances 5.5%
APPENDIX B.5
CITY OF BRAMPTONCASHFLOW AND DETERMINATION OF DEVELOPMENT CHARGE
PUBLIC WORKS: BUILDINGS AND FLEETNON-RESIDENTIAL DEVELOPMENT CHARGE
HEMSON
157

APPENDIX B.6
PARKING
HEMSON
158
APPENDIX B.6
PARKING
The City of Brampton currently owns and operates four structured lots and several outdoor surface parking lots. The benefits of the parking service are deemed to be City-wide for the purpose of calculating the development charge.
TABLE 1 HISTORIC SERVICE LEVELS
The current inventory of capital assets for parking includes 1,781 parking spaces, of which 1,410 are in structured lots and 371 are on surface lots. The total cost to develop the spaces amounts to $63.23 million. Land associated with the spaces, totalling 6.67 acres, is valued at $11.55 million. The equipment associated with municipal parking lots adds an additional $993,600 to the value of the inventory.
The current total value of parking capital infrastructure is estimated to be $75.76 million. This infrastructure has provided the City with a ten year average service level of $111.81 per population and employment. The service level, when multiplied by the ten year net population and employment growth in the City, results in a ten year maximum allowable funding envelope of $23.48 million. No uncommitted excess capacity is identified for this service. The resulting development charge eligible Parking capital costs must be reduced by ten per cent ($2.35 million) under the DCA. The discounted maximum allowable funding envelope brought forward to the development charges calculation is $21.13 million.
TABLE 2 2014 – 2023 PROVISIONAL DEVELOPMENT-RELATED CAPITAL BUDGET& CALCULATION OF THE “UNADJUSTED” DEVELOPMENT CHARGES
The ten-year development-related capital program for Parking includes the annual lease payments associated with the construction of a new building and parking lot in the South West Quadrant of the City. Over the ten-year period, the total lease payments, solely related to parking infrastructure, amount to $23.55 million. No provincial government grants or subsidies are anticipated to offset the cost of the program. A benefit to existing share equivalent to the non-public parking spaces made available through the construction of the new lot is deducted from the net municipal cost. The replacement and benefit to existing share amounts to $19.01 million, and
HEMSON
159

this amount will not be recovered from development charges. The ten per cent reduction required by the DCA amounts to $454,100.
The remaining $4.09 million development-related cost will be funded entirely by available Parking DC reserve funds. Therefore, no shares remain to be brought forward to the development charge calculation. The resulting unadjusted residential and non-residential charges are $0 per capita and $0.00 per square metre of new non-residential development.
TABLE 3 CASH FLOW ANALYSIS
After cash flow analysis, both the residential and non-residential charges remain unchanged at $0.
The following table summarizes the calculation of the Parking development charge.
10-year Hist.Service Level$/pop & emp Total Net DC Recoverable $/capita $/sq.m $/capita $/sq.m
$111.81 $23,550 $0 $0.00 $0.00 $0.00 $0.00
PARKING SUMMARY2014-2023 Unadjusted Adjusted
Development-Related Capital Program ($000's) Development Charge Development Charge
HEMSON
160

PARKING
INVENTORY OF CAPITAL ASSETS
PARKING LOTS UNIT COST
Lot Name 2004 2005 2006 2007 2008 2009 2010 2011 2012 2013 ($/space)
Structured Lot
City Hall 372 372 368 368 368 368 368 368 368 368 $47,600
John Street - - - - - 225 225 225 225 225 $47,600
Market Square 586 586 542 542 542 542 542 542 542 542 $47,600
Nelson Square 278 278 278 278 278 278 278 278 278 275 $29,000
Outdoor Surface Parking Lots
Alderlea Lot 60 60 60 60 60 60 60 60 - - $3,300
Church Street Lot 136 136 136 136 136 136 136 136 136 136 $3,300
Rosalea Upper Deck 43 43 43 43 43 43 43 43 43 43 $3,300
Geroge Street Lot 38 38 38 38 38 38 38 38 - - $3,300
YMCA Lot 192 192 192 192 192 192 192 192 192 192 $3,300
Total # (spaces) 1,705 1,705 1,657 1,657 1,657 1,882 1,882 1,882 1,784 1,781
Total ($000) $55,211 $55,211 $52,926 $52,926 $52,926 $63,636 $63,636 $63,636 $63,312 $63,225
LAND UNIT COST
Lot Name 2004 2005 2006 2007 2008 2009 2010 2011 2012 2013 ($/acre)
Structured Lot
City Hall 0.98 0.98 0.98 0.98 0.98 0.98 0.98 0.98 0.98 0.98 $2,500,000
John Street - - - - - 0.56 0.56 0.56 0.56 0.56 $2,500,000
Market Square 1.32 1.32 1.32 1.32 1.32 1.32 1.32 1.32 1.32 1.32 $2,500,000
Nelson Square 0.47 0.47 0.47 0.47 0.47 0.47 0.47 0.47 0.47 0.47 $2,500,000
Outdoor Surface Parking Lots
Alderlea Lot 0.94 0.94 0.94 0.94 0.94 0.94 0.94 0.94 - - $1,000,000
Church Street Lot 1.06 1.06 1.06 1.06 1.06 1.06 1.06 1.06 1.06 1.06 $1,000,000
Rosalea Upper Deck 0.40 0.40 0.40 0.40 0.40 0.40 0.40 0.40 0.40 0.40 $700,000
Geroge Street Lot 0.34 0.34 0.34 0.34 0.34 0.34 0.34 0.34 - - $2,500,000
YMCA Lot 1.88 1.88 1.88 1.88 1.88 1.88 1.88 1.88 1.88 1.88 $1,000,000
Total # (acres) 7.39 7.39 7.39 7.39 7.39 7.95 7.95 7.95 6.67 6.67
Total ($000) $11,935 $11,935 $11,935 $11,935 $11,935 $13,335 $13,335 $13,335 $11,545 $11,545
APPENDIX B.6
TABLE 1 - PAGE 1
# of Parking Spaces
# of Acres
HEMSON
161
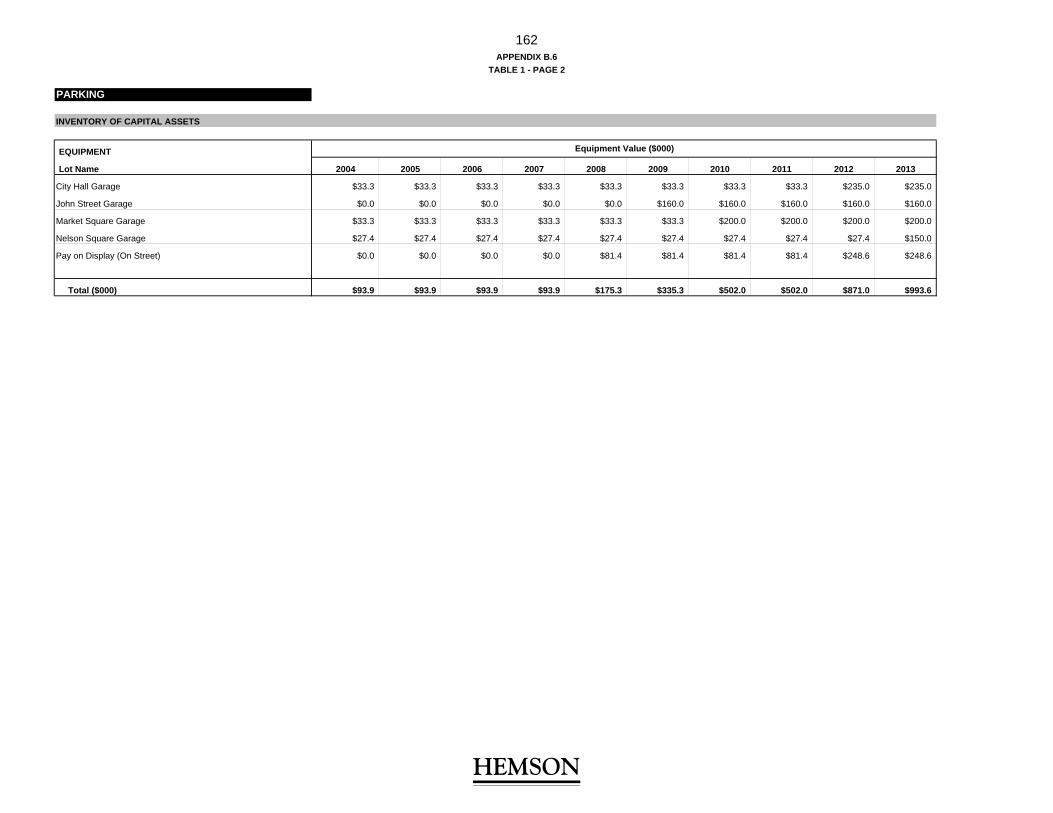
PARKING
INVENTORY OF CAPITAL ASSETS
EQUIPMENT
Lot Name 2004 2005 2006 2007 2008 2009 2010 2011 2012 2013
City Hall Garage $33.3 $33.3 $33.3 $33.3 $33.3 $33.3 $33.3 $33.3 $235.0 $235.0
John Street Garage $0.0 $0.0 $0.0 $0.0 $0.0 $160.0 $160.0 $160.0 $160.0 $160.0
Market Square Garage $33.3 $33.3 $33.3 $33.3 $33.3 $33.3 $200.0 $200.0 $200.0 $200.0
Nelson Square Garage $27.4 $27.4 $27.4 $27.4 $27.4 $27.4 $27.4 $27.4 $27.4 $150.0
Pay on Display (On Street) $0.0 $0.0 $0.0 $0.0 $81.4 $81.4 $81.4 $81.4 $248.6 $248.6
Total ($000) $93.9 $93.9 $93.9 $93.9 $175.3 $335.3 $502.0 $502.0 $871.0 $993.6
Equipment Value ($000)
APPENDIX B.6
TABLE 1 - PAGE 2
HEMSON
162
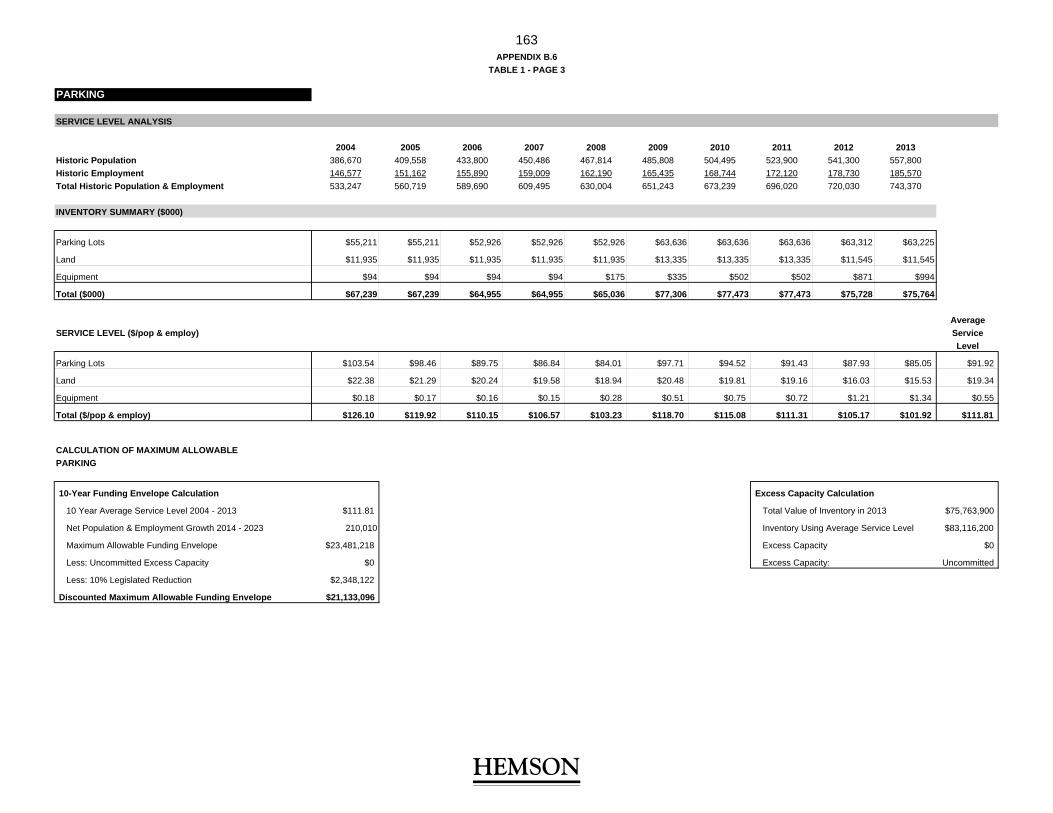
PARKING
SERVICE LEVEL ANALYSIS
2004 2005 2006 2007 2008 2009 2010 2011 2012 2013
Historic Population 386,670 409,558 433,800 450,486 467,814 485,808 504,495 523,900 541,300 557,800
Historic Employment 146,577 151,162 155,890 159,009 162,190 165,435 168,744 172,120 178,730 185,570
Total Historic Population & Employment 533,247 560,719 589,690 609,495 630,004 651,243 673,239 696,020 720,030 743,370
INVENTORY SUMMARY ($000)
Parking Lots $55,211 $55,211 $52,926 $52,926 $52,926 $63,636 $63,636 $63,636 $63,312 $63,225
Land $11,935 $11,935 $11,935 $11,935 $11,935 $13,335 $13,335 $13,335 $11,545 $11,545
Equipment $94 $94 $94 $94 $175 $335 $502 $502 $871 $994
Total ($000) $67,239 $67,239 $64,955 $64,955 $65,036 $77,306 $77,473 $77,473 $75,728 $75,764
Average
SERVICE LEVEL ($/pop & employ) Service
Level
Parking Lots $103.54 $98.46 $89.75 $86.84 $84.01 $97.71 $94.52 $91.43 $87.93 $85.05 $91.92
Land $22.38 $21.29 $20.24 $19.58 $18.94 $20.48 $19.81 $19.16 $16.03 $15.53 $19.34
Equipment $0.18 $0.17 $0.16 $0.15 $0.28 $0.51 $0.75 $0.72 $1.21 $1.34 $0.55
Total ($/pop & employ) $126.10 $119.92 $110.15 $106.57 $103.23 $118.70 $115.08 $111.31 $105.17 $101.92 $111.81
CALCULATION OF MAXIMUM ALLOWABLE
PARKING
10-Year Funding Envelope Calculation Excess Capacity Calculation
10 Year Average Service Level 2004 - 2013 $111.81 Total Value of Inventory in 2013 $75,763,900
Net Population & Employment Growth 2014 - 2023 210,010 Inventory Using Average Service Level $83,116,200
Maximum Allowable Funding Envelope $23,481,218 Excess Capacity $0
Less: Uncommitted Excess Capacity $0 Excess Capacity: Uncommitted
Less: 10% Legislated Reduction $2,348,122
Discounted Maximum Allowable Funding Envelope $21,133,096
TABLE 1 - PAGE 3
APPENDIX B.6
HEMSON
163

Gross Grants/ Net TotalService Project Description Timing Project Subsidies/Other Municipal Replacement 10% DC Eligble Available DC 2014- Post
Cost Recoveries Cost and BTE Share Reduction Costs Reserves 2023 2023
6.0 PARKING
6.1 Parking Facilities6.1.1 Parking Garage - Lease Payments 2014 2,355,019$ -$ 2,355,019$ 1,900,912$ 45,411$ 408,696$ 408,696$ -$ -$ 6.1.2 Parking Garage - Lease Payments 2015 2,355,019$ -$ 2,355,019$ 1,900,912$ 45,411$ 408,696$ 408,696$ -$ -$ 6.1.3 Parking Garage - Lease Payments 2016 2,355,019$ -$ 2,355,019$ 1,900,912$ 45,411$ 408,696$ 408,696$ -$ -$ 6.1.4 Parking Garage - Lease Payments 2017 2,355,019$ -$ 2,355,019$ 1,900,912$ 45,411$ 408,696$ 408,696$ -$ -$ 6.1.5 Parking Garage - Lease Payments 2018 2,355,019$ -$ 2,355,019$ 1,900,912$ 45,411$ 408,696$ 408,696$ -$ -$ 6.1.6 Parking Garage - Lease Payments 2019 2,355,019$ -$ 2,355,019$ 1,900,912$ 45,411$ 408,696$ 408,696$ -$ -$ 6.1.7 Parking Garage - Lease Payments 2020 2,355,019$ -$ 2,355,019$ 1,900,912$ 45,411$ 408,696$ 408,696$ -$ -$ 6.1.8 Parking Garage - Lease Payments 2021 2,355,019$ -$ 2,355,019$ 1,900,912$ 45,411$ 408,696$ 408,696$ -$ -$ 6.1.9 Parking Garage - Lease Payments 2022 2,355,019$ -$ 2,355,019$ 1,900,912$ 45,411$ 408,696$ 408,696$ -$ -$ 6.1.10 Parking Garage - Lease Payments 2023 2,355,019$ -$ 2,355,019$ 1,900,912$ 45,411$ 408,696$ 408,696$ -$ -$
TOTAL PARKING 23,550,186$ -$ 23,550,186$ 19,009,119$ 454,107$ 4,086,961$ 4,086,961$ -$ -$
Residential Development Charge CalculationResidential Share of 2014-2023 DC Eligible Costs 71% $0 2014 - 2023 Net Funding Envelope for Parking $21,133,09610 Year Growth in Population in New Units 162,396 Unadjusted Development Charge Per Capita ($) $0.00 Reserve Fund Balance $7,308,075
Non-Residential Development Charge CalculationNon-Residential Share of 2014-2023 DC Eligible Costs 29% -$ 10 Year Growth in Square Meters 4,967,120 Unadjusted Development Charge Per Sq.M ($) $0.00
2014 DEVELOPMENT CHARGES BACKGROUND STUDYDEVELOPMENT-RELATED CAPITAL PROGRAM
DC Eligible CostsIneligible Cost
CITY OF BRAMPTON
APPENDIX B-6TABLE 2
HEMSON
164
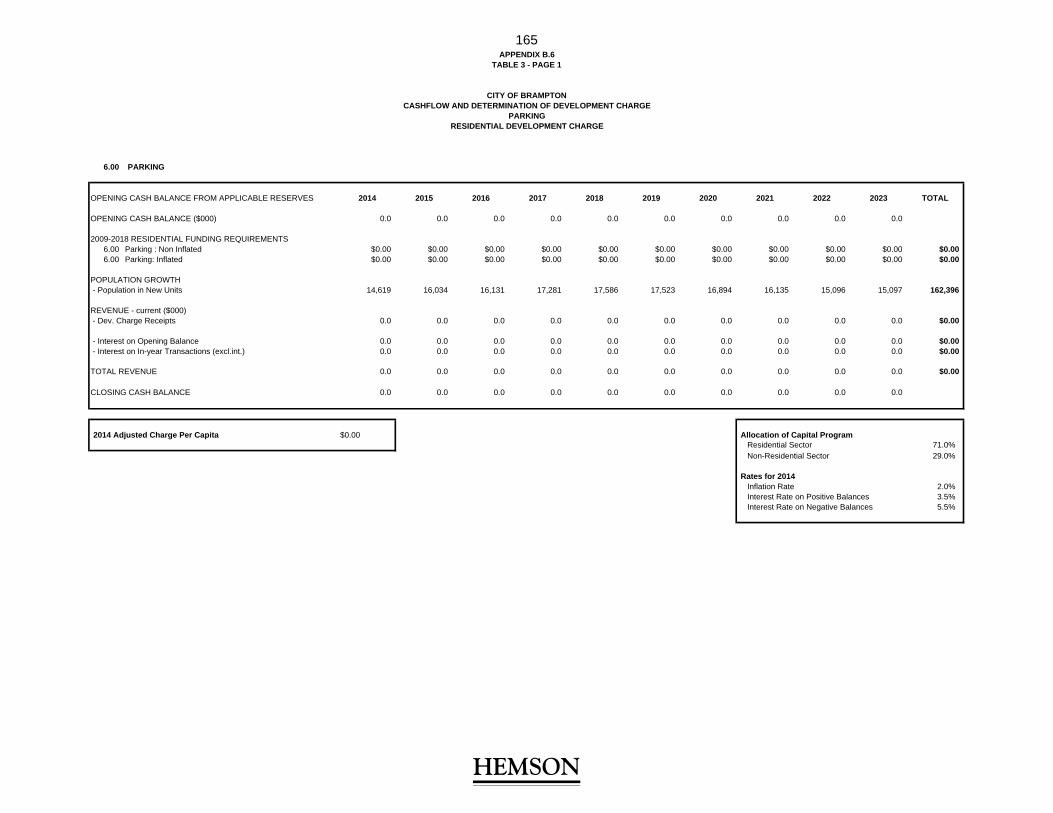
TABLE 3 - PAGE 1
6.00 PARKING
OPENING CASH BALANCE FROM APPLICABLE RESERVES 2014 2015 2016 2017 2018 2019 2020 2021 2022 2023 TOTAL
OPENING CASH BALANCE ($000) 0.0 0.0 0.0 0.0 0.0 0.0 0.0 0.0 0.0 0.0
2009-2018 RESIDENTIAL FUNDING REQUIREMENTS6.00 Parking : Non Inflated $0.00 $0.00 $0.00 $0.00 $0.00 $0.00 $0.00 $0.00 $0.00 $0.00 $0.006.00 Parking: Inflated $0.00 $0.00 $0.00 $0.00 $0.00 $0.00 $0.00 $0.00 $0.00 $0.00 $0.00
POPULATION GROWTH - Population in New Units 14,619 16,034 16,131 17,281 17,586 17,523 16,894 16,135 15,096 15,097 162,396
REVENUE - current ($000) - Dev. Charge Receipts 0.0 0.0 0.0 0.0 0.0 0.0 0.0 0.0 0.0 0.0 $0.00
- Interest on Opening Balance 0.0 0.0 0.0 0.0 0.0 0.0 0.0 0.0 0.0 0.0 $0.00 - Interest on In-year Transactions (excl.int.) 0.0 0.0 0.0 0.0 0.0 0.0 0.0 0.0 0.0 0.0 $0.00
TOTAL REVENUE 0.0 0.0 0.0 0.0 0.0 0.0 0.0 0.0 0.0 0.0 $0.00
CLOSING CASH BALANCE 0.0 0.0 0.0 0.0 0.0 0.0 0.0 0.0 0.0 0.0
2014 Adjusted Charge Per Capita $0.00 Allocation of Capital ProgramResidential Sector 71.0%Non-Residential Sector 29.0%
Rates for 2014Inflation Rate 2.0%Interest Rate on Positive Balances 3.5%Interest Rate on Negative Balances 5.5%
APPENDIX B.6
CITY OF BRAMPTONCASHFLOW AND DETERMINATION OF DEVELOPMENT CHARGE
PARKINGRESIDENTIAL DEVELOPMENT CHARGE
HEMSON
165

TABLE 3 - PAGE 2
6.00 PARKING
OPENING CASH BALANCE FROM APPLICABLE RESERVES 2014 2015 2016 2017 2018 2019 2020 2021 2022 2023 TOTAL
OPENING CASH BALANCE ($000) $0.00 $0.00 $0.00 $0.00 $0.00 $0.00 $0.00 $0.00 $0.00 $0.00
2009-2018 NON-RESIDENTIAL FUNDING REQUIREMENTS
6.00 Parking : Non Inflated $0.00 $0.00 $0.00 $0.00 $0.00 $0.00 $0.00 $0.00 $0.00 $0.00 $0.00
6.00 Parking: Inflated $0.00 $0.00 $0.00 $0.00 $0.00 $0.00 $0.00 $0.00 $0.00 $0.00 $0.00
NON-RESIDENTIAL GROWTH
- Sq. Metres in New Buildings 549,100 587,100 565,010 495,300 457,610 484,850 476,950 466,050 436,300 448,850 4,967,120
REVENUE - current ($000)
- Dev. Charge Receipts 0.0 0.0 0.0 0.0 0.0 0.0 0.0 0.0 0.0 0.0 $0.00
- Interest on Opening Balance 0.0 0.0 0.0 0.0 0.0 0.0 0.0 0.0 0.0 0.0 $0.00
- Interest on In-year Transactions (excl.int.) 0.0 0.0 0.0 0.0 0.0 0.0 0.0 0.0 0.0 0.0 $0.00
TOTAL REVENUE 0.0 0.0 0.0 0.0 0.0 0.0 0.0 0.0 0.0 0.0 $0.00
CLOSING CASH BALANCE 0.0 0.0 0.0 0.0 0.0 0.0 0.0 0.0 0.0 0.0
Allocation of Capital Program
2014 Adjusted Charge Per Capita $0.00 Residential Sector 71.0%
Non-Residential Sector 29.0%
Rates for 2014
Inflation Rate: 2.0%
Interest Rate on Positive Balances 3.5%
Interest Rate on Negative Balances 5.5%
APPENDIX B.6
CASHFLOW AND DETERMINATION OF DEVELOPMENT CHARGEPARKING
NON-RESIDENTIAL DEVELOPMENT CHARGE
CITY OF BRAMPTON
HEMSON
166

APPENDIX B.7
TRANSIT
HEMSON
167

APPENDIX B.7
TRANSIT
Brampton Transit is responsible for the provision of public transportation in the City of Brampton. Transit is provided through a surface route network that stretches across the City, with over 300 buses and a variety of associated equipment and infrastructure.
TABLE 1 HISTORIC SERVICE LEVELS
Brampton Transit operates out of 413,500 square feet of transit yards worth $68.61 million. Service centres and terminals are valued at $27.98 million. The 47.36 acres of land associated with Transit buildings and terminals are valued at $51.42 million.
There are currently about 1,600 bus shelters and pads associated with Brampton Transit valued at $21.35 million. Stops and bus loops total $23.59 million. A variety of equipment, such as; radios, fare boxes, hoists and smartbus equipment adds another $35.51 million to the inventory.
Finally, the 354 transit-related vehicles valued at $168.82 million are included. The fleet and equipment includes conventional, Brampton Rapid Transit, and articulated busses, as well as trucks and maintenance vehicles.
The total inventory of capital assets associated with Brampton Transit amounts to $397.30 million. This results in a ten-year average historic service level of $362.86 per population and employee.
This service level, multiplied by the ten-year forecast of net population and employment growth results in a ten-year maximum allowable funding envelope of $76.20 million (210,010 net population and employment growth x historic service level of $362.86/population and employee).
Recent capital investments in transit, funded through a variety of sources including property taxes, have resulted in an excess capacity of service. In consultation with staff, it has been determined that the $127.56 million in calculated excess capacity is deemed to be committed excess capacity and this amount is not deducted from the funding envelope calculation. Transit must be reduced by ten per cent as required
HEMSON
168

under the DCA. The resulting net maximum allowable funding envelope is reduced to $68.58 million.
The second component of the service level is the calculated congestion adjustment. MMM Group in consultation with City staff have calculated the adjustment at 6 per cent and applied to the maximum allowable funding envelope. A supporting memorandum on the congestion adjustment, prepared by MMM Group, is appended (Note to Draft: need to attach). The resulting funding envelope carried forwards to the development charges calculation is increased, therefore by 6 per cent, to $72.69 million.
TABLE 2 2014 – 2023 PROVISIONAL DEVELOPMENT-RELATED CAPITAL BUDGET& CALCULATION OF THE “UNADJUSTED” DEVELOPMENT CHARGES
The 2014–2023 gross development-related capital program for transit amounts to $330.82 million and accounts for the recovery of a transit service negative reserve fund balance, two new minor terminals, the construction of a new maintenance and storage facility garage, additional vehicles and new bus shelters, pads and stops.
The first project in the transit services capital program is for the recovery of the negative reserve fund balance. The negative reserve fund relates to the previously committed excess capacity. The negative DC reserve fund balance for transit services amounts to $40.44 million (after the 10 per cent statutory discount) and this full amount is brought forward for recovery through development charges.
The capital program includes two minor transit terminals in 2014 and 2015 located in the northeast and northwest end of the City respectively. The combined cost of both of these facilities totals $1.50 million. In addition, the City anticipates constructing a new maintenance and storage facility garage in 2018 for a cost of $75.00 million.
The most significant portion of the capital program is associated with the acquisition of new buses and rapid transit vehicles throughout the forecast period. Vehicle acquisitions amount to $205.18 million. The City anticipates continuing utilizing dedicated gas tax revenue to offset the cost of acquiring new transit vehicles, and therefore, $148.00 million in grants, subsidies and other recoveries has been identified to offset the cost of acquiring new vehicles.
HEMSON
169

Lastly, over the next ten-years the City expects to add bus shelters, pads and stops for a total cost of $4.20 million. Similarly, the City anticipates continuing utilizing dedicated gas tax revenue to offset project cost, and therefore, $1.08 million in grants, subsidies and other recoveries has been identified to offset the cost of acquiring new bus shelters, pads and stops.
The ten year capital forecast for Transit service totals $330.82 million. Of the total $330.82 million in gross project costs, $149.09 million is to be funded by alternative sources. No replacement/benefit to existing shares are identified. The legislated ten per cent discount amounts to $18.17 million and will be funded from non-development charge sources. An additional portion of the program ($90.86 million) will be netted out as it is deemed to provide benefit beyond the planning period and will be eligible for funding under subsequent development charges.
The 2014–2023 DC costs eligible for recovery amounts to $72.70 million. This amount is allocated 71 per cent against residential development, or $51.62 million, and 29 per cent against non-residential development, or $21.08 million, based on the ratio of forecast growth in population in new units and employment. This yields unadjusted development charge rates of $317.84 per capita and $4.24 per square metre, respectively.
TABLE 3 CASH FLOW ANALYSIS
After cash flow and reserve fund consideration, both the residential and non-residential calculated charges increase to $361.67 per capita and $4.79 per square metre, respectively. This is a reflection of the timing of the capital program and development charges revenues.
The following table summarizes the calculation of the transit development charge:
10-year Hist.Service Level$/pop & emp Total Net DC Recoverable $/capita $/sq.m $/capita $/sq.m
$362.86 $330,818,650 $72,698,834 $317.84 $4.24 $361.67 $4.79
Unadjusted AdjustedDevelopment-Related Capital Program ($000's) Development Charge Development Charge
TRANSIT SUMMARY2014-2023
HEMSON
170

TRANSIT
INVENTORY OF CAPITAL ASSETS
TRANSIT YARDS UNIT COST
Description 2004 2005 2006 2007 2008 2009 2010 2011 2012 2013 ($/sq.ft)
Transit Yard 185 Clark Blvd 149,197 149,197 149,197 149,197 149,197 149,197 149,197 149,197 149,197 149,197 $180
Transit Yard Sandalwood Facility - - - - 264,289 264,289 264,289 264,289 264,289 264,289 $158
Total (sq.ft.) 149,197 149,197 149,197 149,197 413,486 413,486 413,486 413,486 413,486 413,486
Total ($000) $26,855 $26,855 $26,855 $26,855 $68,613 $68,613 $68,613 $68,613 $68,613 $68,613
SERVICE CENTRES/TERMINALS
Description 2004 2005 2006 2007 2008 2009 2010 2011 2012 2013
Bramalea Transit Terminal $2,821.6 $2,821.6 $2,821.6 $2,821.6 $2,821.6 $2,821.6 $7,542.2 $7,542.2 $7,542.2 $7,542.2
Downtown Terminal $2,069.1 $2,069.1 $2,069.1 $2,069.1 $2,069.1 $2,069.1 $2,069.1 $2,069.1 $2,069.1 $2,069.1
Gateway Transit Terminal (A and B) $1,823.9 $1,823.9 $1,823.9 $1,823.9 $1,823.9 $1,823.9 $1,823.9 $1,823.9 $10,190.3 $10,190.3
Heart Lake Terminal $141.1 $141.1 $141.1 $141.1 $141.1 $141.1 $141.1 $141.1 $1,034.6 $1,034.6
Mount Pleasant GO Station Drivers Room - - - - - - - $3,414 $3,414 $3,414
Mount Pleasant Village Terminal - - - - - - - $3,326 $3,326 $3,326
Trinity Common Terminal $407.4 $407.4 $407.4 $407.4 $407.4 $407.4 $407.4 $407.4 $407.4 $407.4
Total Terminals / Service Center ($000) 7,263 7,263 7,263 7,263 7,263 7,263 11,984 18,723 27,983 27,983
LAND UNIT COST
Facility Name 2004 2005 2006 2007 2008 2009 2010 2011 2012 2013 ($/acre)
Transit Yards
Transit Yard 185 Clark Blvd 8.53 8.53 8.53 8.53 8.53 8.53 8.53 8.53 8.53 8.53 $700,000
Transit Yard Sandalwood Facility - - - - 22.90 22.9 22.9 22.9 22.9 22.9 $850,000
Terminals
Bramalea Transit Terminal 1.55 1.55 1.55 1.55 1.55 1.55 8.07 8.07 8.07 8.07 $2,000,000
Downtown Terminal 0.63 0.63 0.63 0.63 0.63 0.63 0.63 0.63 0.63 0.63 $2,500,000
Gateway Transit Terminal (A and B) 1.20 1.20 1.20 1.20 1.20 1.2 1.2 1.2 1.57 1.57 $2,000,000
Heart Lake Terminal 0.37 0.37 0.37 0.37 0.37 0.37 0.37 0.37 0.37 0.37 $1,500,000
Mount Pleasant GO Station Drivers Room - - - - - 0 0 2.1 2.1 2.1 $700,000
Mount Pleasant Village Terminal - - - - - 0 0 2.1 2.1 2.1 $700,000
Trinity Common Terminal 1.09 1.09 1.09 1.09 1.09 1.09 1.09 1.09 1.09 1.09 $1,500,000
Total (acres) 13.37 13.37 13.37 13.37 36.27 36.27 42.79 46.99 47.36 47.36
Total ($000) $15,236.0 $15,236.0 $15,236.0 $15,236.0 $34,701.0 $34,701.0 $47,741.0 $50,681.0 $51,421.0 $51,421.0
APPENDIX B.7
TABLE 1 - PAGE 1
# of Square Feet
Total Value of Transit Service Centres/Terminals ($000)
# of Acres
HEMSON
171

TRANSIT
INVENTORY OF CAPITAL ASSETS
BUS SHELTERS/PADS UNIT COST
Description 2004 2005 2006 2007 2008 2009 2010 2011 2012 2013 ($/Item)
Zum Stations - Minor (with Pad) - - - - - - 10 18 25 25 $174,300
Zum Stations - Major (with Pad) - - - - - - 19 32 42 42 $257,900
Bike Shelters (4'x8') - - - - - - - - 2 8 $10,300
Bike Shelters (8'x8') - - - - - - - - 7 2 $13,600
Conventional Bus Shelters / Pads (#) 259 277 310 335 366 391 413 431 456 481 $7,800
Pads Only (#) 383 445 541 645 767 817 877 932 982 1,047 $2,200
Total (#) 642 722 851 980 1,133 1,208 1,319 1,413 1,514 1,605
Total Shelters / Pads ($000) $2,862.8 $3,139.6 $3,608.2 $4,032.0 $4,542.2 $4,847.2 $11,793.9 $16,802.4 $21,022.3 $21,354.1
STOPS/LOOPS UNIT COST
2004 2005 2006 2007 2008 2009 2010 2011 2012 2013 ($/Item)
Bus Stops (Signs) 1,530 1,709 1,812 1,889 1,958 2,021 2,095 2,165 2,235 2,299 $172
Bus Bays - - - - - - 22 36 51 51 $440,000
Bus Loops (#) - - - - - - - 1 1 1 $757,600
Total (#) 1,530 1,709 1,812 1,889 1,958 2,021 2,117 2,202 2,287 2,351
Total Stops/Loops ($000) $263.2 $293.9 $311.7 $324.9 $336.8 $347.6 $10,040.3 $16,970.0 $23,582.0 $23,593.0
APPENDIX B.7
TABLE 1 - PAGE 2
Sheters/Pads
Stops/Loops
HEMSON
172

TRANSIT
INVENTORY OF CAPITAL ASSETS
EQUIPMENT UNIT COST
Items 2004 2005 2006 2007 2008 2009 2010 2011 2012 2013 ($/Item)
Presto Equipment
MSP Bus Fare Transaction Processor - - - - - - 300 341 373 389 $2,640
Driver Control Unit - - - - - - 300 341 373 389 $9,410
Service Provider Audit Access Computer - - - - - - - - 2 2 $10,160
Station Point of Sale Device - Cash Drawer Option - - - - - - 9 9 9 9 $420
Card Query Device, Wall & Pole Mounted - - - - - - 4 4 5 5 $3,940
Station Point of Sale Device - - - - - - 9 12 14 $9,820
Third Party Terminal (TPT/TPI) - - - - - - 1 4 6 6 $3,220
Depot Data Concentrator - - - - - - 2 2 2 2 $10,160
Depot Shift Computer with Card Interface Device - - - - - - 4 4 4 4 $10,880
Depot Wireless Data Transmission System (Clark) - - - - - 1 1 1 1 1 $15,770
Wireless Bus Depot Site (Sandalwood) - - - - - - 1 1 1 1 $224,900
Fare boxes 167 185 204 216 222 250 276 314 343 358 $13,400
Receiver 1 1 1 1 4 4 4 4 4 4 $63,500
Coin Sorter 1 1 1 1 2 2 2 2 2 2 $12,000
Wrapper 1 1 1 1 2 2 2 2 2 4 $18,550
Other Equipment
Scaffolding 1 1 1 1 2 2 2 2 2 2 $8,990
40' Hoists 1 1 1 1 2 2 2 2 2 2 $168,170
60' Hoists - - - - 1 1 1 1 1 1 $258,000
Tire Balancer - - - - 1 1 1 1 1 1 $11,000
Tire Machine - - - - 1 1 1 1 1 1 $13,000
Smartbus Equipment ($000)
WiFi Switches and Equipment for all 3 Corridors $0 $0 $0 $0 $0 $5 $745 $2,384 $6,341 $6,611
Central System $0 $0 $0 $0 $0 $2,822 $2,822 $2,822 $2,822 $2,822
Other Smartbus Equipment $0 $0 $0 $0 $0 $8,688 $10,624 $12,603 $14,142 $15,099
Total (#) 172 190 209 221 237 266 922 1,048 1,134 1,197
Sub-total ($000) $2,509.0 $2,750.2 $3,004.8 $3,165.6 $3,926.2 $15,831.3 $22,871.3 $27,532.1 $33,715.0 $35,510.0
APPENDIX B.7
TABLE 1 - PAGE 3
Total Equipment
HEMSON
173

TRANSIT
INVENTORY OF CAPITAL ASSETS
VEHICLES UNIT COST
Type of Vehicle 2004 2005 2006 2007 2008 2009 2010 2011 2012 2013 ($/Item)
40' Conventional Bus 159 176 194 206 211 238 238 258 266 278 $427,000
40' BRT Bus 25 41 41 43 $712,000
60' Articulated Bus 20 20 $952,000
Mtce Trucks 4 4 4 4 5 2 2 2 2 2 $49,000
Sander 1 1 1 1 2 2 2 2 2 3 $8,325
Fork Lift 1 1 1 2 3 3 3 3 3 3 $46,620
Trailer 1 1 1 1 1 1 1 1 1 1 $7,500
Bobcat 1 1 1 1 1 1 1 1 1 1 $29,400
Washer 1 1 1 1 1 1 1 1 1 1 $12,000
Sweeper 1 1 1 1 2 2 2 2 2 2 $75,000
Sub-total (#) 169 186 204 217 226 250 275 311 339 354
Sub-total ($000) $68,267.8 $75,526.8 $83,212.8 $88,383.5 $90,697.4 $102,079.4 $119,879.4 $139,811.4 $162,267.4 $168,823.7
APPENDIX B.7
TABLE 1 - PAGE 4
# of Vehicles
HEMSON
174

TRANSIT
SUMMARY OF SERVICE LEVEL ANALYSIS
2004 2005 2006 2007 2008 2009 2010 2011 2012 2013
Historic Population 386,670 409,558 433,800 450,486 467,814 485,808 504,495 523,900 541,300 557,800
Historic Employment 146,577 151,162 155,890 159,009 162,190 165,435 168,744 172,120 178,730 185,570
Total Historic Population & Employment 533,247 560,719 589,690 609,495 630,004 651,243 673,239 696,020 720,030 743,370
INVENTORY SUMMARY ($000)
Transil Facilities $26,855 $26,855 $26,855 $26,855 $68,613 $68,613 $68,613 $68,613 $68,613 $68,613
Service Centres/Terminals $7,263 $7,263 $7,263 $7,263 $7,263 $7,263 $11,984 $18,723 $27,983 $27,983
Land $15,236 $15,236 $15,236 $15,236 $34,701 $34,701 $47,741 $50,681 $51,421 $51,421
Bus Shelters/Pads $2,863 $3,140 $3,608 $4,032 $4,542 $4,847 $11,794 $16,802 $21,022 $21,354
Stops/Loops $263 $294 $312 $325 $337 $348 $10,040 $16,970 $23,582 $23,593
Equipment $2,509 $2,750 $3,005 $3,166 $3,926 $15,831 $22,871 $27,532 $33,715 $35,510
Vehicles $68,268 $75,527 $83,213 $88,383 $90,697 $102,079 $119,879 $139,811 $162,267 $168,824
Total ($000) $123,257 $131,065 $139,492 $145,261 $210,080 $233,683 $292,923 $339,133 $388,603 $397,298
Average
SERVICE LEVEL ($/pop & employ) Service
Level
Transil Facilities $50.36 $47.89 $45.54 $44.06 $108.91 $105.36 $101.91 $98.58 $95.29 $92.30 $79.02
Service Centres/Terminals $13.62 $12.95 $12.32 $11.92 $11.53 $11.15 $17.80 $26.90 $38.86 $37.64 $19.47
Land $28.57 $27.17 $25.84 $25.00 $55.08 $53.28 $70.91 $72.82 $71.42 $69.17 $49.93
Bus Shelters/Pads $5.37 $5.60 $6.12 $6.62 $7.21 $7.44 $17.52 $24.14 $29.20 $28.73 $13.79
Stops/Loops $0.49 $0.52 $0.53 $0.53 $0.53 $0.53 $14.91 $24.38 $32.75 $31.74 $10.69
Equipment $4.71 $4.90 $5.10 $5.19 $6.23 $24.31 $33.97 $39.56 $46.82 $47.77 $21.86
Vehicles $128.02 $134.70 $141.11 $145.01 $143.96 $156.75 $178.06 $200.87 $225.36 $227.11 $168.10
Total ($/pop & employ) $231.15 $233.74 $236.55 $238.33 $333.46 $358.83 $435.09 $487.25 $539.70 $534.45 $362.86
CALCULATION OF MAXIMUM ALLOWABLE
TRANSIT
10-Year Funding Envelope Calculation Excess Capacity Calculation
10 Year Average Service Level 2004 - 2013 $362.86 Total Value of Inventory in 2013 397,297,573$
Net Population & Employment Growth 2004 - 2013 210,010 Inventory Using Average Service Level 269,739,238$
Maximum Allowable Funding Envelope 76,204,229 Excess Capacity $127,558,334
Less: Uncommitted Excess Capacity $0 Excess Capacity: Committed
Less: 10% Legislated Reduction $7,620,423
Discounted Maximum Allowable Funding Envelope $68,583,806
Congestion factor @ 6% $4,115,028
REVISED MAXIMUM ALLOWABLE $72,698,834
APPENDIX B.7
TABLE 1 - PAGE 5
HEMSON
175

Gross Grants/ Net TotalService Project Description Timing Project Subsidies/Other Municipal Replacement 10% DC Eligble Available DC 2014- Post
Cost Recoveries Cost and BTE Share Reduction Costs Reserves 2023 2023
7.0 TRANSIT
7.1 Recovery of Negative Reserve Fund Balance 2014 44,936,650$ -$ 44,936,650$ -$ 4,493,665$ 40,442,985$ -$ 40,442,985$ -$
7.2 Buildings, Land & Equipment7.2.1 Minor Terminal in Northeast End 2015 750,000$ -$ 750,000$ -$ 75,000$ 675,000$ -$ 675,000$ -$ 7.2.2 Minor Terminal in Northwest End 2014 750,000$ -$ 750,000$ -$ 75,000$ 675,000$ -$ 675,000$ -$ 7.2.3 Maintenance and Storage Facility Garage 2018 75,000,000$ -$ 75,000,000$ -$ 7,500,000$ 67,500,000$ -$ -$ 67,500,000$
76,500,000$ -$ 76,500,000$ -$ 7,650,000$ 68,850,000$ -$ 1,350,000$ 67,500,000$
7.3 Vehicles7.3.1 Bus Purchases 2014 4,725,000$ 3,150,000$ 1,575,000$ -$ 157,500$ 1,417,500$ -$ 1,417,500$ -$ 7.3.2 Bus Purchases 2015 6,825,000$ 3,675,000$ 3,150,000$ -$ 315,000$ 2,835,000$ -$ 2,835,000$ -$ 7.3.3 Bus Purchases 2016 6,825,000$ 4,725,000$ 2,100,000$ -$ 210,000$ 1,890,000$ -$ 1,890,000$ -$ 7.3.4 Bus Purchases 2017 5,775,000$ 4,725,000$ 1,050,000$ -$ 105,000$ 945,000$ -$ 945,000$ -$ 7.3.5 Bus Purchases 2018 5,775,000$ 4,725,000$ 1,050,000$ -$ 105,000$ 945,000$ -$ 945,000$ -$ 7.3.6 Queen Street LRT 2014 1,200,000$ 660,000$ 540,000$ -$ 54,000$ 486,000$ -$ 486,000$ -$ 7.3.7 Zum 2014 42,067,000$ 35,580,000$ 6,487,000$ -$ 648,700$ 5,838,300$ -$ 5,838,300$ -$ 7.3.8 Zum 2015 23,628,000$ 16,041,000$ 7,587,000$ -$ 758,700$ 6,828,300$ -$ 6,828,300$ -$ 7.3.9 Zum 2016 4,186,000$ 718,000$ 3,468,000$ -$ 346,800$ 3,121,200$ -$ 3,121,200$ -$ 7.3.10 Zum 2017 1,573,000$ -$ 1,573,000$ -$ 157,300$ 1,415,700$ -$ 1,415,700$ -$ 7.3.11 Provision for additional buses (post 2017) Various 102,600,000$ 74,010,000$ 28,590,000$ -$ 2,859,000$ 25,731,000$ -$ 2,375,849$ 23,355,151$
205,179,000$ 148,009,000$ 57,170,000$ -$ 5,717,000$ 51,453,000$ -$ 28,097,849$ 23,355,151$ 7.4 Other Transit
7.4.1 Bus Shelters/Pads/Stops 2014 459,000$ 147,000$ 312,000$ -$ 31,200$ 280,800$ -$ 280,800$ -$ 7.4.2 Bus Shelters/Pads/Stops 2015 416,000$ 104,000$ 312,000$ -$ 31,200$ 280,800$ -$ 280,800$ -$ 7.4.3 Bus Shelters/Pads/Stops 2016 416,000$ 104,000$ 312,000$ -$ 31,200$ 280,800$ -$ 280,800$ -$ 7.4.4 Bus Shelters/Pads/Stops 2017 416,000$ 104,000$ 312,000$ -$ 31,200$ 280,800$ -$ 280,800$ -$ 7.4.5 Bus Shelters/Pads/Stops 2018 416,000$ 104,000$ 312,000$ -$ 31,200$ 280,800$ -$ 280,800$ -$ 7.4.6 Bus Shelters/Pads/Stops 2019 416,000$ 104,000$ 312,000$ -$ 31,200$ 280,800$ -$ 280,800$ -$ 7.4.7 Bus Shelters/Pads/Stops 2020 416,000$ 104,000$ 312,000$ -$ 31,200$ 280,800$ -$ 280,800$ -$ 7.4.8 Bus Shelters/Pads/Stops 2021 416,000$ 104,000$ 312,000$ -$ 31,200$ 280,800$ -$ 280,800$ -$ 7.4.9 Bus Shelters/Pads/Stops 2022 416,000$ 104,000$ 312,000$ -$ 31,200$ 280,800$ -$ 280,800$ -$ 7.4.10 Bus Shelters/Pads/Stops 2023 416,000$ 104,000$ 312,000$ -$ 31,200$ 280,800$ -$ 280,800$ -$
4,203,000$ 1,083,000$ 3,120,000$ -$ 312,000$ 2,808,000$ -$ 2,808,000$ -$
TOTAL TRANSIT 330,818,650$ 149,092,000$ 181,726,650$ -$ 18,172,665$ 163,553,985$ -$ 72,698,834$ 90,855,151$
Residential Development Charge CalculationResidential Share of 2014-2023 DC Eligible Costs 71% $51,616,172 2014 - 2023 Net Funding Envelope for Transit $72,698,83410 Year Growth in Population in New Units 162,396 Unadjusted Development Charge Per Capita ($) $317.84 Reserve Fund Balance ($40,442,985)
Non-Residential Development Charge CalculationNon-Residential Share of 2014-2023 DC Eligible Costs 29% 21,082,662$ 10 Year Growth in Square Meters 4,967,120 Unadjusted Development Charge Per Sq.M ($) $4.24
DEVELOPMENT-RELATED CAPITAL PROGRAM
Ineligible Cost DC Eligible Costs
APPENDIX B-7TABLE 2
CITY OF BRAMPTON2014 DEVELOPMENT CHARGES BACKGROUND STUDY
HEMSON
176

TABLE 3 - PAGE 1
7.00 TRANSIT
OPENING CASH BALANCE FROM APPLICABLE RESERVES 2014 2015 2016 2017 2018 2019 2020 2021 2022 2023 TOTAL
OPENING CASH BALANCE ($000) 0.0 (30,590.0) (34,273.4) (34,138.5) (31,474.6) (27,345.0) (22,142.7) (16,780.7) (11,313.4) (5,865.6)
2009-2018 RESIDENTIAL FUNDING REQUIREMENTS7.00 TRANSIT - constant ($000) $35,058.50 $7,708.25 $3,926.01 $2,044.15 $1,039.00 $368.05 $368.05 $368.05 $368.05 $368.05 $51,616.177.00 TRANSIT - current ($000) $35,058.50 $7,862.41 $4,084.62 $2,169.27 $1,124.65 $406.36 $414.49 $422.78 $431.23 $439.86 $52,414.16
POPULATION GROWTH - Population in New Units 14,619 16,034 16,131 17,281 17,586 17,523 16,894 16,135 15,096 15,097 162,396
REVENUE - current ($000) - Dev. Charge Receipts 5,287.2 5,915.0 6,069.8 6,632.7 6,884.6 6,997.3 6,881.1 6,703.1 6,396.9 6,525.3 $64,293.00
- Interest on Opening Balance 0.0 (1,682.5) (1,885.0) (1,877.6) (1,731.1) (1,504.0) (1,217.8) (922.9) (622.2) (322.6) ($11,765.82) - Interest on In-year Transactions (excl.int.) (818.7) (53.6) 34.7 78.1 100.8 115.3 113.2 109.9 104.4 106.5 ($109.31)
TOTAL REVENUE 4,468.5 4,179.0 4,219.5 4,833.2 5,254.3 5,608.7 5,776.4 5,890.1 5,879.1 6,309.2 $52,417.87
CLOSING CASH BALANCE (30,590.0) (34,273.4) (34,138.5) (31,474.6) (27,345.0) (22,142.7) (16,780.7) (11,313.4) (5,865.6) 3.7
2014 Adjusted Charge Per Capita $361.67 Allocation of Capital ProgramResidential Sector 71.0%Non-Residential Sector 29.0%
Rates for 2014Inflation Rate 2.0%Interest Rate on Positive Balances 3.5%Interest Rate on Negative Balances 5.5%
TRANSITRESIDENTIAL DEVELOPMENT CHARGE
APPENDIX B.7
CITY OF BRAMPTONCASHFLOW AND DETERMINATION OF DEVELOPMENT CHARGE
HEMSON
177

TABLE 3 - PAGE 2
7.00 TRANSIT
OPENING CASH BALANCE FROM APPLICABLE RESERVES 2014 2015 2016 2017 2018 2019 2020 2021 2022 2023 TOTAL
OPENING CASH BALANCE ($000) $0.00 ($12,010.93) ($13,023.87) ($12,572.77) ($11,604.05) ($10,295.56) ($8,421.63) ($6,439.25) ($4,359.94) ($2,287.51)
2009-2018 NON-RESIDENTIAL FUNDING REQUIREMENTS7.00 Transit : Non Inflated $14,319.67 $3,148.44 $1,603.58 $834.93 $424.38 $150.33 $150.33 $150.33 $150.33 $150.33 $21,082.667.00 Transit: Inflated $14,319.67 $3,211.41 $1,668.36 $886.04 $459.36 $165.98 $169.30 $172.68 $176.14 $179.66 $21,408.60
NON-RESIDENTIAL GROWTH - Sq. Metres in New Buildings 549,100 587,100 565,010 495,300 457,610 484,850 476,950 466,050 436,300 448,850 4,967,120
REVENUE - current ($000) - Dev. Charge Receipts 2,630.2 2,868.5 2,815.7 2,517.7 2,372.6 2,564.2 2,572.8 2,564.3 2,448.6 2,569.4 $25,924.00
- Interest on Opening Balance 0.0 (660.6) (716.3) (691.5) (638.2) (566.3) (463.2) (354.2) (239.8) (125.8) ($4,455.85) - Interest on In-year Transactions (excl.int.) (321.5) (9.4) 20.1 28.6 33.5 42.0 42.1 41.9 39.8 41.8 ($41.30)
TOTAL REVENUE 2,308.7 2,198.5 2,119.5 1,854.8 1,767.9 2,039.9 2,151.7 2,252.0 2,248.6 2,485.4 $21,426.84
CLOSING CASH BALANCE (12,010.9) (13,023.9) (12,572.8) (11,604.1) (10,295.6) (8,421.6) (6,439.3) (4,359.9) (2,287.5) 18.2
Allocation of Capital Program
2014 Adjusted Charge Per Capita $4.79 Residential Sector 71.0%
Non-Residential Sector 29.0%
Rates for 2014
Inflation Rate: 2.0%
Interest Rate on Positive Balances 3.5%
Interest Rate on Negative Balances 5.5%
NON-RESIDENTIAL DEVELOPMENT CHARGE
APPENDIX B.7
CITY OF BRAMPTONCASHFLOW AND DETERMINATION OF DEVELOPMENT CHARGE
TRANSIT
HEMSON
178

179

180

181

APPENDIX C
ROADS AND RELATED
HEMSON
182

APPENDIX C
ROADS AND RELATED TECHNICAL APPENDIX
The City of Brampton’s Engineering & Construction division is responsible for the design and construction of City-owned roads, bridges, sidewalks and other related infrastructure.
This appendix provides a brief outline of the infrastructure included in the roads development charges. The development-related projects outlined in this appendix are required to service the demands of new development up to year 2041. The background information used to calculate the development charge was provided by the MMM Group in conjunction with City staff. The 2041 preferred road network was developed as part of the City’s ongoing Transportation Master Plan Update and is current as of May 2014.
TABLE 1 2004-2013 HISTORIC SERVICE LEVELS
The roads and related inventory of capital assets is extensive at a total replacement cost of $4.73 billion. This includes the roads themselves as well as traffic signals, bridges, culverts, noise barriers, sidewalks, streetlights, landscaping, grade separations, road right of ways and other related structures.
Table 1 identifies a ten-year average service level for the provision of roads of $7,369.19 per capita and employment. Based on this average service level, the maximum allowable is $3.19 billion ($7,369.19 per capita and employment x 432,990 increase in net population and employment from 2014 to 2041).
No uncommitted excess capacity has been identified in this service, nor is this serviced required to be reduced by ten per cent. As such, the fully calculated maximum allowable funding envelope brought forward to the development charges calculation remains at $3.19 billion.
HEMSON
183

TABLE 2 2014 – 2041 DEVELOPMENT-RELATED CAPITAL PROGRAM AND CALCULATION OF THE UNADJUSTED DEVELOPMENT CHARGES
Roads Program Excluding Bramwest Parkway / NSTC
The cost, quantum and timing of the projects included in the roads capital program have been developed by City staff and MMM Group Limited, consulting engineers. The Transportation Master Plan, which is well underway but not completed, sets out what capital projects are required to service future population and employment growth to 2041. The benefit to existing development shares were also developed by MMM in consultation with City staff.
The net cost of the road component of the capital program is $985.34 million and provides for the undertaking of various road widenings and new road segments on the arterial and major collection road system. Grants, subsides and recoveries from other municipalities have already been removed from this amount.
The second component of the roads capital program, $475.69 million, consists of standalone infrastructure, this includes:
Traffic Signal & Intersection work $88.50 million Sidewalks $2.87 million Gateways $5.57 million Property Acquisition $210.00 million Noise Wall Retrofit $35.63 million Grade Separations $123.12 million Hwy 410/Countryside Intersection $10.00 million
A portion of the roads capital program, $82.24 million, will be funded through recoveries. For the upgrades to the arterial and collector roads systems, the recoveries are through developers’ shares to be provided through the subdivision process.
The overall net cost of $1.38 billion includes a portion that is considered to benefit the existing community. In totality, the benefit to existing share amounts to $64.96 million and will be netted off of the development charges eligible costs. The benefiting to existing development shares are based on guidelines prepared by MMM.
HEMSON
184

Council is made aware that this share will need to be funded using non-development charges revenue sources. The costs related to this service are not required to be reduced by 10 per cent and as such, no reduction is made. Therefore, the DC eligible costs of the roads program are netted down to $1.31 billion.
A negative development charges reserve balance of $75.22 million exists for non-Bramwest Parkway/NSTC roads. Accordingly, no funds are available to offset the development charges eligible program and the cash flows begin with negative opening balances.
The development-related cost has been allocated 70 per cent ($919.68 million) to new residential development and 30 per cent ($394.15 million) to new non-residential development. The allocation of costs is based on shares of population in new units and employment growth over the planning period to 2041. An unadjusted development charge of $2,950.86 per capita is derived when the residential costs are divided by the population in new units to 2041 (311,666).
The non-residential share of costs is split between the Industrial/Office (61%) and Non-Industrial/Office (39%) sectors based on employment. The Industrial and Major Office category has a higher floor space per worker value than the population-related category; therefore the development charge per square metre is lower.
Roads Program Excluding Bramwest Parkway / NSTC
Employment#
Employment%
Share of Costs
($000)*
Floor Space Growth in
Square Meters (2014-2041)
Unadjusted Development
Charge Per Sq. m
Industrial and Major Office
82,450 61% $239,323.2 7,491,150 $31.95
Non- Industrial and Major Office (Population-Related)
53,340 39% $154,827.2 2,032,300 $76.18
Total Non-Residential 135,790 100% $394,150.3 9,523,450
*Numbers may not add precisely due to rounding.
HEMSON
185

As shown in the summary table above the calculated unadjusted Industrial and Major Office development charge is $31.95 per square metre and the Non- Industrial and Major Office charge is $76.18 per square metre.
Roads Program Excluding Bramwest Parkway / NSTC
A separate development charge, reserve fund and by-law was established for the Bramwest Parkway / North-South Transportation Corridor in the City’s 2009 development charges study. The dedicated reserve fund could be used by the City for the design and construction of a City facility or be transferred to the Region of Peel should a Regional facility be constructed. The estimated net cost of the Bramwest Parkway / North-South Transportation Corridor project is $63.29 million. After deducting the available reserves of $11.3 million, $51.99 million is carried forward to the development charges calculation.
When the residential share of the Bramwest Parkway / North-South Transportation Corridor project (70%) is divided by population in new units growth to 2041 a charge of $116.77 per capita is calculated.
Bramwest Parkway / NSTC
Employment#
Employment%
Share of Costs
($000)*
Floor Space Growth in
Square Meters
(2014-2041)
Unadjusted Development
Charge Per Sq. m
Industrial and Major Office
82,450 61% $9,470.7 7,491,150 $1.26
Non- Industrial and Major Office (Population-Related)
53,340 39% $6,126.9 2,032,300 $3.01
Total Non-Residential 135,790 100% $15,597.6 9,523,450
*Numbers may not add precisely due to rounding.
As shown in the summary table above, the calculated unadjusted Industrial and Major Office development charge is $1.26 per square metre and the Non- Industrial and Major Office charge is $3.01 per square metre.
HEMSON
186

TABLE 3 CASH FLOW AND RESERVE FUND ANALYSIS
The long-term cash-flow analysis takes into consideration expenditure timing and revenue projections and the existing positive or negative reserve fund balances. The effect of the analysis for the Roads Service (excluding Bramwest/NSTC) is an increase in the residential development charge rates to $3,201.00 per capita for residential development; $34.46 per square metre for industrial and office uses; and $83.82 per square metre for non-industrial non-residential uses (as shown in Table 3A).
The effect of the analysis for the Bramwest Parkway / NSTC Service is an increase in the residential development charge rates to $130.71 per capita for residential development; $1.42 per square metre for industrial and office uses; and $3.45 per square metre for non-industrial non-residential uses (as shown in Table 3B).
10-year Hist.Service Level Development Charge$/pop & emp Total Net DC Recoverable $/capita Indus/office Non-ind $/capita Indus/office Non-ind
$/sq.m $/sq.m $/sq.m $/sq.m
$7,369.19 $1,378,793 $1,313,834 $2,950.86 $31.95 $76.18 $3,201.00 $34.46 $83.82
ROADS SUMMARY - EXCLUDING BRAMWEST PARKWAY/NSTCAdjustedUnadjusted
Development Charge2014-2023
Development-Related Capital Program ($000's)
10-year Hist.Service Level$/pop & emp Total Net DC Recoverable $/capita Indus/office Non-ind Indus/office Non-ind
$/sq.m $/sq.m $/capita $/sq.m $/sq.m
n/a $63,288 $51,992 $116.77 $1.26 $3.01 $130.71 $1.42 $3.45
ROADS SUMMARY - BRAMWEST PARKWAY
Development-Related Capital Program ($000's) Development ChargeAdjusted
Development Charge2014-2023 Unadjusted
HEMSON
187

CITY OF BRAMPTONINVENTORY OF CAPITAL ASSETSROADS AND RELATED
ROAD NETWORK
Asset Type 2004 2005 2006 2007 2008 2009 2010 2011 2012 2013
1 - Road Network $777,179,161 $795,240,493 $785,243,917 $796,449,043 $809,746,137 $817,504,835 $818,961,075 $822,750,494 $822,750,494 $823,874,196
2 - Traffic Signals $46,690,000 $47,505,000 $46,855,000 $47,175,000 $47,670,000 $48,155,000 $48,155,000 $48,155,000 $48,155,000 $48,155,000
3a - Bridges $82,398,000 $84,344,000 $82,900,000 $83,497,500 $84,365,500 $85,201,500 $85,201,500 $85,201,500 $85,201,500 $85,201,500
3b - Culverts $84,773,000 $86,791,000 $85,295,000 $85,912,500 $86,769,500 $87,655,000 $87,655,000 $87,655,000 $87,655,000 $87,655,000
4 - Noise Barriers
5 - Sidewalks
6 - Illumination $88,694,595 $91,007,565 $89,195,975 $89,888,920 $91,026,485 $91,681,590 $91,681,590 $91,681,590 $91,681,590 $91,643,750
7 - Landscaping/Tree Planting $35,627,850 $36,556,950 $35,829,250 $36,107,600 $36,564,550 $36,827,700 $36,827,700 $36,827,700 $36,827,700 $36,812,500
8 - Rail Grade Separations $75,000,000 $75,000,000 $75,000,000 $75,000,000 $75,000,000 $75,000,000 $75,000,000 $75,000,000 $75,000,000 $75,000,000
9 - Special Items
10 - Zebra Striped Crosswalks
11 - Property ROW $3,368,261,952 $3,456,099,258 $3,387,304,245 $3,413,618,567 $3,456,817,032 $3,481,630,835 $3,481,630,835 $3,481,630,835 $3,481,630,835 $3,481,630,835
Total ($000) $4,558,624.6 $4,672,544.3 $4,587,623.4 $4,627,649.1 $4,687,959.2 $4,723,656.5 $4,725,112.7 $4,728,902.1 $4,728,902.1 $4,729,972.8
APPENDIX CTABLE 1 - PAGE 1
Total Value of Road Infrastructure
HEMSON
188

CITY OF BRAMPTONINVENTORY OF CAPITAL ASSETSPARKS & RECREATION DEPARTMENTROADS AND RELATED
2004 2005 2006 2007 2008 2009 2010 2011 2012 2013Historic Population 386,670 409,558 433,800 450,486 467,814 485,808 504,495 523,900 541,300 557,800 Historic Employment 146,577 151,162 155,890 159,009 162,190 165,435 168,744 172,120 178,730 185,570 Total Historic Population & Employment 533,247 560,719 589,690 609,495 630,004 651,243 673,239 696,020 720,030 743,370
INVENTORY SUMMARY ($000)
Total ($000) $4,558,624.6 $4,672,544.3 $4,587,623.4 $4,627,649.1 $4,687,959.2 $4,723,656.5 $4,725,112.7 $4,728,902.1 $4,728,902.1 $4,729,972.8
Average
SERVICE LEVEL ($/pop & employ) Service
Level
Total ($/pop & employ) $8,548.80 $8,333.13 $7,779.72 $7,592.60 $7,441.16 $7,253.29 $7,018.48 $6,794.20 $6,567.65 $6,362.88 $7,369.19
CALCULATION OF MAXIMUM ALLOWABLE
ROADS AND RELATED
2041 Funding Envelope Calculation Excess Capacity Calculation
10 Year Average Service Level 2004 - 2013 $7,369.19 Total Value of Inventory in 2013 $4,729,972,781
Net Population & Employment Growth 2014 - 2041 432,990 Inventory Using Average Service Level $5,478,035,368
Maximum Allowable Funding Envelope $3,190,785,926 Excess Capacity $0
Less: Uncommitted Excess Capacity $0 Excess Capacity: Uncommitted
Discounted Maximum Allowable Funding Envelope $3,190,785,926
APPENDIX CTABLE 1 - PAGE 2
HEMSON
189

Net Cost
From To ($M) % Developer %DC
2014-2041%
Non-Growth
City of Brampton RoadsC.1 Bramalea Road 2020 - 2020 Southern Boundary Queen Street $35.02 90 $31.52 10 $3.50C.2 Bramalea Road 2036 - 2036 Bovaird Drive Queen Street $13.42 90 $12.07 10 $1.34C.3 Castlemore Road 2021 - 2021 Goreway Drive McVean Drive $5.15 90 $4.63 10 $0.51C.4 Castlemore Road 2022 - 2022 McVean Drive The Gore Road $12.53 90 $11.27 10 $1.25C.5 Castlemore Road 2021 - 2021 The Gore Road Hwy 50 $7.77 90 $7.00 10 $0.78C.6 Chinguacousy Road 2023 - 2023 Bovaird Drive Wanless Drive $16.24 90 $14.62 10 $1.62C.7 Chinguacousy Road 2015 - 2015 Wanless Drive Mayfield Road $6.53 95 $6.20 5 $0.33C.8 Clark Boulevard 2017 - 2017 Rutherford Road Dixie Road $20.80 90 $18.72 10 $2.08C.9 Clark Boulevard Extension 2022 - 2022 Rutherford Road Hansen Road $4.95 50 $2.47 50 $2.47C.10 Clarkway Drive 2017 - 2017 Castlemore Road Countryside Drive $16.88 95 $16.04 5 $0.84C.11 Clarkway Drive 2036 - 2036 Countryside Drive Mayfield Road $7.08 95 $6.72 5 $0.35C.12 Clarkway Drive 2014 - 2014 Countryside Drive Mayfield Road $9.91 95 $9.42 5 $0.50C.13 Coleraine Drive 2021 - 2021 Highway 50 Mayfield Road $12.55 95 $11.92 5 $0.63C.14 Conservation Drive 2019 - 2019 Highway 10 Kennedy Road $10.83 90 $9.74 10 $1.08C.15 Cottrelle Parkway 2021 - 2021 Humberwest Parkway Goreway Drive $14.70 100 $14.70C.16 Countryside Drive 2018 - 2018 Goreway Drive The Gore Road $22.94 95 $21.80 5 $1.15C.17 Countryside Drive 2016 - 2016 The Gore Road Hwy 50 $23.85 95 $22.66 5 $1.19C.18 Countryvillage collector 2015 - 2015 Bramalae Road Countryside Drive $13.77 50 $6.88 50 $6.88C.19 Creditview Road 2018 - 2018 Bovaird Drive Mt. Pleasant Transit Spine $6.89 90 $6.20 10 $0.69C.20 Creditview Road 2017 - 2017 Wanless Drive Mayfield Road $6.51 95 $6.19 5 $0.33C.21 Denison St Extension 2021 - 2021 Park St Mill St N $1.37 50 $0.69 50 $0.69C.22 Eastern Avenue 2021 - 2021 Kennedy Road Truman St $1.95 95 $1.86 5 $0.10C.23 Eastern Avenue 2021 - 2021 Hansen Road Kennedy Road $1.78 95 $1.69 5 $0.09C.24 East-West Spine Rd (Rememberance) 2019 - 2019 Creditview Road McLaughlin Rd $13.26 50 $6.63 50 $6.63
C.25East-West Spine Rd (Rememberance Rd) NHS Structure
2022 - 2022 North Spine Road Creditview Rd $0.63 100 $0.63
C.26 Financial Drive 2022 - 2022 Southern Boundary Steeles Avenue $13.75 95 $13.06 5 $0.69C.27 Financial Drive 2023 - 2023 Heritage Rd Winston Churchill Blvd $6.68 50 $3.34 50 $3.34C.28 Goreway Drive 2025 - 2025 Humberwest Parkway Countryside Drive $36.53 95 $34.70 5 $1.83C.29 Goreway Drive 2024 - 2024 Countryside Drive Mayfield Road $23.35 95 $22.18 5 $1.17C.30 Heritage Road 2036 - 2036 Steeles Avenue New Road A $28.38 95 $26.96 5 $1.42C.31 Heritage Road 2014 - 2014 New Road A Bovaird Drive $11.04 95 $10.49 5 $0.55C.32 Heritage Road 2017 - 2017 Hwy. #7 Wanless Drive $8.47 95 $8.04 5 $0.42C.33 Heritage Road 2023 - 2023 Steeles Avenue Financial Drive $14.68 95 $13.95 5 $0.73C.34 Heritage Road 2016 - 2016 Financial Drive New Road A $14.79 95 $14.05 5 $0.74C.35 Heritage Road 2017 - 2017 New Road A Bovaird Drive $30.31 95 $28.79 5 $1.52C.36 Heritage Road 2022 - 2022 Hwy. #7/Bovaird Rd Wanless Drive $14.59 95 $13.86 5 $0.73C.37 Heritage Road 2016 - 2016 Wanless Drive Mayfield Road $2.76 95 $2.62 5 $0.14C.38 Heritage Road 2019 - 2019 Wanless Drive Mayfield Road $6.50 95 $6.18 5 $0.33
Cost Shares($M)
ROADS DEVELOPMENT-RELATED CAPITAL PROGRAM
APPENDIX CTABLE 2 - PAGE 1
CITY OF BRAMPTON2014 DEVELOPMENT CHARGES BACKGROUND STUDY
Project #
Road Name
Description
Timing
HEMSON
190

Net Cost
From To ($M) % Developer % DC 2014-2041
% Non-Growth
C.39 Humberwest Pkwy. 2017 - 2017 Airport Road Williams Pkwy $10.21 90 $9.19 10 $1.02C.40 Intermodal Drive 2018 - 2018 Airport Road CNR Bridge $15.38 95 $14.61 5 $0.77C.41 John Street 2016 - 2016 Truman St Centre Street $1.50 95 $1.43 5 $0.08C.42 Ken Whillans Drive 2020 - 2020 Church Street Nelson Street $3.68 50 $1.84 50 $1.84C.43 McLaughlin Road 2026 - 2026 Wanless Drive Mayfield Road $6.51 95 $6.18 5 $0.33C.44 McVean Drive 2020 - 2020 Castlemore Road Mayfield Road $38.44 95 $36.52 5 $1.92C.45 Merging Lanes ( Hwy 10 at Hwy 410) 2024 - 2024 - - $1.43 100 $1.43
C.46New East/West Road (Major MacKenzie extension)
2023 - 2023New North/South Road (Major MacKenzie extension)
The Gore Road $11.33 50 $5.66 50 $5.66
C.47New North/South Road (Major MacKenzie extension)
2019 - 2019 Highway 50/Coleraine Clarkway Dr $7.88 50 $3.94 50 $3.94
C.48 New Road A 2015 - 2015 Steeles Avenue Winston Churchill Blvd. $30.11 50 $15.06 50 $15.06C.49 North-South Spine Road (NHS Structure) 2019 - 2019 New Creditview Road East-West Spine Rd (Rememberance $0.63 100 $0.63C.50 Orenda Road 2019 - 2019 Dixie Road Bramalea Road $9.75 95 $9.26 5 $0.49C.51 Sandalwood Parkway 2021 - 2021 Mississauga Road Heritage Rd $6.44 50 $3.22 50 $3.22C.52 Sandalwood Parkway 2017 - 2017 McLaughlin Road Heart Lake Rd $39.45 90 $35.51 10 $3.95C.53 Sandalwood Parkway 2022 - 2022 Dixie Road Bramalea Road $4.88 90 $4.39 10 $0.49C.54 Sandalwood Parkway 2021 - 2021 Bramalea Road Torbram Road $7.27 90 $6.54 10 $0.73C.55 Sandalwood Parkway 2026 - 2026 Torbram Road Airport Road $6.55 90 $5.90 10 $0.66C.56 Sandalwood Parkway (NHS Structure) 2015 - 2015 Creditview Road Mississauga Road $0.63 100 $0.63C.57 Torbram Road 2020 - 2020 Southern Boundary Queen Street $24.61 90 $22.15 10 $2.46C.58 Torbram Road 2018 - 2018 Queen Street Bovaird Drive $16.71 90 $15.04 10 $1.67C.59 Torbram Road 2020 - 2020 Bovaird Drive Countryside Drive $13.23 90 $11.90 10 $1.32C.60 Torbram Road 2022 - 2022 Countryside Drive Mayfield Road $6.36 95 $6.04 5 $0.32C.61 Urbanization of Highway 10 2032 - 2041 Bovaird Drive Northern City boundary $19.64 95 $18.65 5 $0.98C.62 Wanless Drive 2032 - 2041 Mississauga Road Winston Churchill Blvd. $4.96 95 $4.71 5 $0.25C.63 Wanless Drive 2032 - 2041 Mississauga Road Winston Churchill Blvd. $15.41 95 $14.64 5 $0.77C.64 Wanless Drive 2032 - 2041 Creditview Road Mississauga Road $7.71 95 $7.32 5 $0.39C.65 Williams Parkway 2032 - 2041 Mississauga Road Heritage Rd $7.86 50 $3.93 50 $3.93C.66 Williams Parkway 2020 - 2020 McLaughlin Road Kennedy Road $23.63 90 $21.26 10 $2.36C.67 Williams Parkway 2032 - 2041 Kennedy Road North Park $21.00 90 $18.90 10 $2.10C.68 Williams Parkway 2032 - 2041 Torbram Road Humberwest $12.81 90 $11.52 10 $1.28C.69 Heritage Heights Connector Road 2032 - 2041 Bovaird Drive Sandalwood Pkwy $13.49 50 $6.75 50 $6.75C.70 Heritage Heights Connector Road 2032 - 2041 Sandalwood Pkwy Mayfield Road $11.97 50 $5.99 50 $5.99C.71 Sandalwood Parkway (new project) 2032 - 2041 Heritage Rd Winston Churchill Blvd. $8.30 50 $4.15 50 $4.15C.72 Williams Parkway 2020 - 2020 North Park Drive Torbram Road $12.78 90 $11.50 10 $1.28C.73 Chinguacousy Road 2032 - 2041 Wanless Drive Mayfield Road $5.21 90 $4.69 10 $0.52C.74 Torbram Road 2032 - 2041 Countryside Drive Mayfield Rd $5.06 90 $4.56 10 $0.51C.75 Ebenezer Road 2032 - 2041 Queen Street Highway 50 $15.16 90 $13.65 10 $1.52
C.76 McLaughlin Road 2032 - 2041 Steeles Avenue Queen Street $14.88 90 $13.39 10 $1.49
C.77 East West Connection 2032 - 2041 Mount Pleasant Go Station Winston Churchill Blvd $23.40 50 $11.70 50 $11.70Subtotal Road Projects $985.34 $82.24 $844.86 $58.25
APPENDIX CTABLE 2 - PAGE 2
CITY OF BRAMPTON2014 DEVELOPMENT CHARGES BACKGROUND STUDYROADS DEVELOPMENT-RELATED CAPITAL PROGRAM
Project #
Road Name TimingDescription
Cost Shares($M)
HEMSON
191

Net Cost
From To ($M) % Developer %DC
2014-2041%
Non-Growth
Standalone Items
C.78 - Traffic Signals and Intersection Improvements (Outside Roads Program)
2014 - 2041- 10 per year including intersection improvements
$88.50 100 $88.50
C.79 - Sidewalks 2014 - 2041- assume 1500m per year (42,000 m)
$2.87 100 $2.87
C.80 - Gateways 2014 - 2041- Assume 21 over 28 years at $265k per location
$5.57 90 $5.01 10 $0.56
C.81 - Property Acquisition 2014 - 2041- assumes 210M to 2041 ($11M/yr for the first 14 yrs)
$210.00 100 $210.00
C.82 - Noise Wall Retrofit 2014 - 2041 - assumes 1000m per year $35.63 100 $35.63
C.83 - Grade Separations 2014 - 2041- assumes 6 New Planned Rail Grade Separations
$123.12 95 $116.96 5 $6.16
C.84 - Completion of Hwy 410/Countryside Int 2014 - 2041 $10.00 100 $10.00
Subtotal - Standalone Improvements $475.69 $468.98 $6.71
GRAND TOTAL $1,461.04 $82.24 $1,313.8 $64.96
TABLE 2 - PAGE 3
CITY OF BRAMPTON2014 DEVELOPMENT CHARGES BACKGROUND STUDYROADS DEVELOPMENT-RELATED CAPITAL PROGRAM
APPENDIX C
Project #
Road Name TimingDescription
Cost Shares($M)
HEMSON
192

Net Cost
From To ($M) % Developer %DC
2014-2041%
Non-Growth
Bramwest Parkway / NSTCC.88 Bramwest Parkway / NSTC 2018 - 2018 Heritage Rd Steeles Avenue $33.10 100 $33.10C.89 Bramwest Parkway / NSTC 2021 - 2021 Steeles Avenue Financial Drive $13.28 100 $13.28C.90 Bramwest Parkway / NSTC 2021 - 2021 Financial Drive North of Embleton Road $7.72 100 $7.72C.91 Bramwest Parkway / NSTC 2022 - 2022 Sandalwood Parkway Mayfield Road $9.19 100 $9.19
TOTAL $63.29 $63.29
APPENDIX CTABLE 2 - PAGE 4
Cost Shares($M)
CITY OF BRAMPTON2014 DEVELOPMENT CHARGES BACKGROUND STUDYROADS DEVELOPMENT-RELATED CAPITAL PROGRAM
Project #
Road Name TimingDescription
HEMSON
193

1.0 ROADS - EXCLUDING BRAMWEST/NSTC
OPENING CASH BALANCE FROM APPLICABLE RESERVES 2014 2015 2016 2017 2018 2019 2020 2021 2022 2023 2024 2025 2026 2027 2028
OPENING CASH BALANCE ($000) (52,652.8) (36,537.8) (20,892.4) (12,585.0) (61,897.5) (63,361.5) (48,358.8) (115,557.6) (120,853.0) (129,981.5) (127,579.9) (113,738.3) (108,214.6) (81,474.3) (42,206.9)
2014-2023 RESIDENTIAL FUNDING REQUIREMENTS1.00 Roads - Excluding Bramwest/Nstc : Non Inflated $28,110.7 $34,313.4 $42,702.9 $99,907.5 $54,531.0 $39,635.7 $109,854.2 $50,740.3 $50,382.9 $40,471.0 $30,706.5 $38,464.0 $22,627.6 $14,174.5 $9,274.51.00 Roads - Excluding Bramwest/Nstc: Inflated $28,110.66 $34,999.65 $44,428.09 $106,022.67 $59,026.13 $43,760.96 $123,713.71 $58,284.64 $59,031.58 $48,366.58 $37,431.00 $47,825.12 $28,697.23 $18,336.20 $12,237.48
POPULATION GROWTH - Population in New Units 14,619 16,034 16,131 17,281 17,586 17,523 16,894 16,135 15,096 15,097 14,846 14,925 14,983 14,812 14,771
REVENUE - current ($000) - Dev. Charge Receipts 46,794.6 52,351.0 53,721.9 58,703.6 60,933.2 61,930.5 60,902.0 59,326.7 56,616.4 57,752.9 57,930.7 59,401.9 60,827.1 61,332.2 62,385.7
- Interest on Opening Balance (2,895.9) (2,009.6) (1,149.1) (692.2) (3,404.4) (3,484.9) (2,659.7) (6,355.7) (6,646.9) (7,149.0) (7,016.9) (6,255.6) (5,951.8) (4,481.1) (2,321.4) - Interest on In-year Transactions (excl.int.) 327.0 303.6 162.6 (1,301.3) 33.4 318.0 (1,727.3) 18.2 (66.4) 164.3 358.7 202.6 562.3 752.4 877.6
TOTAL REVENUE 44,225.7 50,645.1 52,735.5 56,710.1 57,562.2 58,763.6 56,514.9 52,989.3 49,903.1 50,768.2 51,272.6 53,348.9 55,437.6 57,603.5 60,941.9
CLOSING CASH BALANCE (36,537.8) (20,892.4) (12,585.0) (61,897.5) (63,361.5) (48,358.8) (115,557.6) (120,853.0) (129,981.5) (127,579.9) (113,738.3) (108,214.6) (81,474.3) (42,206.9) 6,497.5
OPENING CASH BALANCE FROM APPLICABLE RESERVES 2029 2030 2031 2032 2033 2034 2035 2036 2037 2038 2039 2040 2041 TOTAL
OPENING CASH BALANCE ($000) 6,497.5 57,650.8 104,298.3 127,915.5 134,170.5 132,855.9 127,657.0 121,823.3 64,055.7 53,991.4 42,236.4 29,699.1 15,997.1
2014-2023 RESIDENTIAL FUNDING REQUIREMENTS1.0 Roads - Excluding Bramwest/Nstc : Non Inflated 9,274.5 9,274.5 9,274.5 19,393.3 19,393.3 19,393.3 19,393.3 51,424.1 19,393.3 19,393.3 19,393.3 19,393.3 19,393.3 919,684.11.0 Roads - Excluding Bramwest/Nstc: Inflated 12,482.2 12,731.9 12,986.5 27,698.5 28,252.4 28,817.5 29,393.8 79,500.6 30,581.3 31,193.0 31,816.8 32,453.2 33,102.2 1,141,281.7
POPULATION GROWTH 0.0 0.0 0.0 0.0 0.0 0.0 0.0 0.0 0.0 0.0 0.0 0.0 0.0 0.0 - Population in New Units 14,515.0 12,879.0 7,275.5 6,440.7 4,804.1 4,043.3 3,992.0 3,865.6 3,685.7 3,479.3 3,461.1 3,380.2 3,111.3 311,666.2
REVENUE - current ($000) - Dev. Charge Receipts 62,532.2 56,594.0 32,609.9 29,445.8 22,402.8 19,232.2 19,367.8 19,129.5 18,604.4 17,913.5 18,176.3 18,106.3 16,999.5 1,222,024.6
- Interest on Opening Balance 227.4 2,017.8 3,650.4 4,477.0 4,696.0 4,650.0 4,468.0 4,263.8 2,242.0 1,889.7 1,478.3 1,039.5 559.9 (26,814.4) - Interest on In-year Transactions (excl.int.) 875.9 767.6 343.4 30.6 (160.9) (263.6) (275.7) (1,660.2) (329.4) (365.2) (375.1) (394.5) (442.8) (1,264.2)
TOTAL REVENUE 63,635.5 59,379.4 36,603.7 33,953.4 26,937.9 23,618.6 23,560.1 21,733.1 20,517.0 19,438.0 19,279.5 18,751.2 17,116.6 1,193,946.0
CLOSING CASH BALANCE 57,650.8 104,298.3 127,915.5 134,170.5 132,855.9 127,657.0 121,823.3 64,055.7 53,991.4 42,236.4 29,699.1 15,997.1 11.5
Allocation of Capital Program2014 Adjusted Charge Per Capita $3,201.00 Residential Sector 70.0%
Non-Residential Sector 30.0%
Rates for 2014Inflation Rate 2.0%Interest Rate on Positive Balances 3.5%Interest Rate on Negative Balances 5.5%
APPENDIX CTABLE 3A - PAGE 1
CITY OF BRAMPTONCASHFLOW AND DETERMINATION OF DEVELOPMENT CHARGE
ROADS - EXCLUDING BRAMWEST/NSTCRESIDENTIAL DEVELOPMENT CHARGE
HEMSON
194

1.0 ROADS - EXCLUDING BRAMWEST/NSTC
OPENING CASH BALANCE FROM APPLICABLE RESERVES 2014 2015 2016 2017 2018 2019 2020 2021 2022 2023 2024 2025 2026 2027 2028
OPENING CASH BALANCE ($000) (13,701.5) (5,804.2) 1,508.1 6,374.0 (6,837.7) (8,788.2) (6,800.1) (25,879.7) (28,446.5) (31,121.4) (30,308.9) (25,672.7) (23,209.4) (16,007.6) (7,537.0)
2014-2023 RESIDENTIAL FUNDING REQUIREMENTS1.00 Roads - Excluding Bramwest/Nstc : Non Inflated $7,315.0 $8,929.1 $11,112.3 $25,998.3 $14,190.2 $10,314.1 $28,586.6 $13,203.8 $13,110.8 $10,531.5 $7,990.5 $10,009.2 $5,888.2 $3,688.5 $2,413.41.00 Roads - Excluding Bramwest/Nstc: Inflated $7,315.05 $9,107.72 $11,561.22 $27,589.56 $15,359.97 $11,387.62 $32,193.18 $15,167.02 $15,361.39 $12,586.11 $9,740.42 $12,445.21 $7,467.69 $4,771.51 $3,184.48
Growth in Sq.M 459,000 472,500 454,410 396,900 370,710 363,150 360,450 355,050 353,700 365,850 379,350 379,350 361,530 313,200 287,550
REVENUE - current ($000) - Dev. Charge Receipts 15,817.1 16,608.0 16,291.6 14,514.3 13,827.7 13,816.6 13,988.2 14,054.2 14,280.8 15,066.8 15,935.2 16,253.9 15,800.2 13,961.7 13,074.7
- Interest on Opening Balance (753.6) (319.2) 52.8 223.1 (376.1) (483.4) (374.0) (1,423.4) (1,564.6) (1,711.7) (1,667.0) (1,412.0) (1,276.5) (880.4) (414.5) - Interest on In-year Transactions (excl.int.) 148.8 131.3 82.8 (359.6) (42.1) 42.5 (500.6) (30.6) (29.7) 43.4 108.4 66.7 145.8 160.8 173.1
TOTAL REVENUE 15,212.3 16,420.0 16,427.2 14,377.8 13,409.5 13,375.8 13,113.6 12,600.2 12,686.5 13,398.5 14,376.6 14,908.6 14,669.5 13,242.1 12,833.2
CLOSING CASH BALANCE (5,804.2) 1,508.1 6,374.0 (6,837.7) (8,788.2) (6,800.1) (25,879.7) (28,446.5) (31,121.4) (30,308.9) (25,672.7) (23,209.4) (16,007.6) (7,537.0) 2,111.8
OPENING CASH BALANCE FROM APPLICABLE RESERVES 2029 2030 2031 2032 2033 2034 2035 2036 2037 2038 2039 2040 2041 TOTAL
OPENING CASH BALANCE ($000) 2,111.8 10,539.0 18,154.7 25,161.1 28,443.1 29,474.5 28,767.3 27,276.1 12,472.0 10,083.5 7,708.5 5,509.6 3,024.4
2014-2023 RESIDENTIAL FUNDING REQUIREMENTS1.0 Roads - Excluding Bramwest/Nstc : Non Inflated 2,413.4 2,413.4 2,413.4 5,046.6 5,046.6 5,046.6 5,046.6 13,381.7 5,046.6 5,046.6 5,046.6 5,046.6 5,046.6 239,323.21.0 Roads - Excluding Bramwest/Nstc: Inflated 3,248.2 3,313.1 3,379.4 7,207.8 7,351.9 7,499.0 7,649.0 20,687.9 7,958.0 8,117.1 8,279.5 8,445.1 8,614.0 296,988.0
Growth in Sq.M 247,050.0 220,590.0 199,800.0 194,400.0 147,150.0 113,400.0 99,900.0 100,440.0 95,850.0 98,550.0 103,950.0 101,250.0 96,120.0 7,491,150.0
REVENUE - current ($000) - Dev. Charge Receipts 11,457.8 10,435.3 9,640.8 9,567.9 7,387.2 5,806.7 5,217.8 5,350.9 5,208.5 5,462.3 5,876.8 5,838.7 5,653.7 316,195.4
- Interest on Opening Balance 73.9 368.9 635.4 880.6 995.5 1,031.6 1,006.9 954.7 436.5 352.9 269.8 192.8 105.9 (5,075.1) - Interest on In-year Transactions (excl.int.) 143.7 124.6 109.6 41.3 0.6 (46.5) (66.9) (421.8) (75.6) (73.0) (66.1) (71.7) (81.4) (342.3)
TOTAL REVENUE 11,675.4 10,928.8 10,385.8 10,489.8 8,383.3 6,791.8 6,157.8 5,883.8 5,569.4 5,742.2 6,080.5 5,959.9 5,678.1 310,778.1
CLOSING CASH BALANCE 10,539.0 18,154.7 25,161.1 28,443.1 29,474.5 28,767.3 27,276.1 12,472.0 10,083.5 7,708.5 5,509.6 3,024.4 88.6
2014 Adjusted Charge Per Sq.M $34.46 Allocation of Capital ProgramResidential Sector 70.0%Non-Residential Sector 30.0%
Industrial and Major Office 61%Non-Industrial and Non-Office 39%
Rates for 2014Inflation Rate 2.0%Interest Rate on Positive Balances 3.5%Interest Rate on Negative Balances 5.5%
APPENDIX CTABLE 3A - PAGE 2
CITY OF BRAMPTONCASHFLOW AND DETERMINATION OF DEVELOPMENT CHARGE
ROADS - EXCLUDING BRAMWEST/NSTCINDUSTRIAL AND OFFICE DEVELOPMENT CHARGE
HEMSON
195

1.0 ROADS - EXCLUDING BRAMWEST/NSTC
OPENING CASH BALANCE FROM APPLICABLE RESERVES 2014 2015 2016 2017 2018 2019 2020 2021 2022 2023 2024 2025 2026 2027 2028
OPENING CASH BALANCE ($000) (8,864.0) (6,482.4) (2,864.8) (818.8) (10,210.0) (12,880.6) (9,625.3) (20,255.0) (20,478.4) (23,480.8) (24,597.3) (23,899.3) (24,646.8) (21,983.6) (16,139.4)
2014-2023 RESIDENTIAL FUNDING REQUIREMENTS1.00 Roads - Excluding Bramwest/Nstc : Non Inflated $4,732.4 $5,776.6 $7,189.0 $16,819.3 $9,180.2 $6,672.6 $18,493.8 $8,542.0 $8,481.9 $6,813.2 $5,169.4 $6,475.3 $3,809.3 $2,386.2 $1,561.31.00 Roads - Excluding Bramwest/Nstc: Inflated $4,732.38 $5,892.13 $7,479.39 $17,848.72 $9,936.94 $7,367.08 $20,826.98 $9,812.11 $9,937.86 $8,142.43 $6,301.44 $8,051.27 $4,831.13 $3,086.87 $2,060.16
Growth in Sq.M 90,100 114,600 110,600 98,400 86,900 121,700 116,500 111,000 82,600 83,000 81,400 82,600 82,600 92,400 93,200
REVENUE - current ($000) - Dev. Charge Receipts 7,552.2 9,797.9 9,645.0 8,752.7 7,884.4 11,262.6 10,997.0 10,687.4 8,112.0 8,314.3 8,317.1 8,608.5 8,780.7 10,018.9 10,307.8
- Interest on Opening Balance (487.5) (356.5) (157.6) (45.0) (561.6) (708.4) (529.4) (1,114.0) (1,126.3) (1,291.4) (1,352.9) (1,314.5) (1,355.6) (1,209.1) (887.7) - Interest on In-year Transactions (excl.int.) 49.3 68.4 37.9 (250.1) (56.4) 68.2 (270.3) 15.3 (50.2) 3.0 35.3 9.8 69.1 121.3 144.3
TOTAL REVENUE 7,114.0 9,509.7 9,525.3 8,457.5 7,266.4 10,622.3 10,197.3 9,588.7 6,935.5 7,025.9 6,999.5 7,303.8 7,494.2 8,931.1 9,564.5
CLOSING CASH BALANCE (6,482.4) (2,864.8) (818.8) (10,210.0) (12,880.6) (9,625.3) (20,255.0) (20,478.4) (23,480.8) (24,597.3) (23,899.3) (24,646.8) (21,983.6) (16,139.4) (8,635.1)
OPENING CASH BALANCE FROM APPLICABLE RESERVES 2029 2030 2031 2032 2033 2034 2035 2036 2037 2038 2039 2040 2041 TOTAL
OPENING CASH BALANCE ($000) (8,635.1) (860.1) 6,442.0 10,199.1 10,769.1 10,374.4 9,387.2 8,338.5 (1,433.2) (806.0) (500.6) (171.4) 183.0
2014-2023 RESIDENTIAL FUNDING REQUIREMENTS1.0 Roads - Excluding Bramwest/Nstc : Non Inflated $1,561.3 $1,561.3 $1,561.3 $3,264.8 $3,264.8 $3,264.8 $3,264.8 $8,657.2 $3,264.8 $3,264.8 $3,264.8 $3,264.8 $3,264.8 $154,827.21.0 Roads - Excluding Bramwest/Nstc: Inflated $2,101.36 $2,143.39 $2,186.26 $4,662.99 $4,756.25 $4,851.37 $4,948.40 $13,383.79 $5,148.31 $5,251.28 $5,356.31 $5,463.43 $5,572.70 $192,132.70
- Growth in Sq.M 90,500 81,400 48,200 40,700 32,800 28,400 28,400 27,700 44,200 41,500 41,500 41,500 37,900 2,032,300
REVENUE - current ($000) - Dev. Charge Receipts 10,209.4 9,366.4 5,657.1 4,872.4 4,005.2 3,537.3 3,608.0 3,589.5 5,842.2 5,595.0 5,706.9 5,821.0 5,422.4 212,271.3
- Interest on Opening Balance (474.9) (47.3) 225.5 357.0 376.9 363.1 328.6 291.8 (78.8) (44.3) (27.5) (9.4) 6.4 (11,230.5) - Interest on In-year Transactions (excl.int.) 141.9 126.4 60.7 3.7 (20.7) (36.1) (36.9) (269.3) 12.1 6.0 6.1 6.3 (4.1) (9.1)
TOTAL REVENUE 9,876.4 9,445.5 5,943.3 5,233.0 4,361.5 3,864.3 3,899.7 3,612.0 5,775.5 5,556.7 5,685.5 5,817.8 5,424.7 201,031.6
CLOSING CASH BALANCE (860.1) 6,442.0 10,199.1 10,769.1 10,374.4 9,387.2 8,338.5 (1,433.2) (806.0) (500.6) (171.4) 183.0 34.9
2014 Adjusted Charge Per Sq.M $83.82 Allocation of Capital ProgramResidential Sector 70.0%Non-Residential Sector 30.0%
Industrial and Major Office 60.7%Non-Industrial and Non-Office 39.3%
Rates for 2014Inflation Rate 2.0%Interest Rate on Positive Balances 3.5%Interest Rate on Negative Balances 5.5%
NON-INDUSTRIAL AND NON-OFFICE DEVELOPMENT CHARGE
APPENDIX CTABLE 3A - PAGE 3
CITY OF BRAMPTONCASHFLOW AND DETERMINATION OF DEVELOPMENT CHARGE
ROADS - EXCLUDING BRAMWEST/NSTC
HEMSON
196

2.0 ROADS - BRAMWEST PARKWAY/NSTC
OPENING CASH BALANCE FROM APPLICABLE RESERVES 2014 2015 2016 2017 2018 2019 2020 2021 2022 2023 2024 2025 2026 2027 2028
OPENING CASH BALANCE ($000) 7,907.1 10,128.1 12,657.7 15,332.8 18,308.5 (4,265.7) (1,927.1) 497.3 (14,344.3) (20,500.2) (19,228.1) (17,878.7) (16,394.0) (14,768.4) (13,032.4)
2014-2023 RESIDENTIAL FUNDING REQUIREMENTS2.00 Roads - Bramwest Parkway/Nstc : Non Inflated $0.0 $0.0 $0.0 $0.0 $23,171.8 $0.0 $0.0 $14,698.4 $6,431.3 $0.0 $0.0 $0.0 $0.0 $0.0 $0.02.00 Roads - Bramwest Parkway/Nstc: Inflated $0.00 $0.00 $0.00 $0.00 $25,081.85 $0.00 $0.00 $16,883.88 $7,535.23 $0.00 $0.00 $0.00 $0.00 $0.00 $0.00
POPULATION GROWTH - Population in New Units 14,619 16,034 16,131 17,281 17,586 17,523 16,894 16,135 15,096 15,097 14,846 14,925 14,983 14,812 14,771
REVENUE - current ($000) - Dev. Charge Receipts 1,910.8 2,137.7 2,193.7 2,397.1 2,488.2 2,528.9 2,486.9 2,422.6 2,311.9 2,358.3 2,365.6 2,425.6 2,483.8 2,504.4 2,547.5
- Interest on Opening Balance 276.7 354.5 443.0 536.6 640.8 (234.6) (106.0) 17.4 (788.9) (1,127.5) (1,057.5) (983.3) (901.7) (812.3) (716.8) - Interest on In-year Transactions (excl.int.) 33.4 37.4 38.4 41.9 (621.3) 44.3 43.5 (397.7) (143.6) 41.3 41.4 42.4 43.5 43.8 44.6
TOTAL REVENUE 2,221.0 2,529.6 2,675.1 2,975.7 2,507.7 2,338.5 2,424.4 2,042.3 1,379.3 1,272.1 1,349.5 1,484.7 1,625.6 1,736.0 1,875.3
CLOSING CASH BALANCE 10,128.1 12,657.7 15,332.8 18,308.5 (4,265.7) (1,927.1) 497.3 (14,344.3) (20,500.2) (19,228.1) (17,878.7) (16,394.0) (14,768.4) (13,032.4) (11,157.1)
OPENING CASH BALANCE FROM APPLICABLE RESERVES 2029 2030 2031 2032 2033 2034 2035 2036 2037 2038 2039 2040 2041 TOTAL
OPENING CASH BALANCE ($000) (11,157.1) (9,172.6) (7,325.7) (6,373.7) (5,500.8) (4,872.6) (4,341.5) (3,775.5) (3,188.4) (2,590.8) (1,989.0) (1,343.2) (664.7)
2014-2023 RESIDENTIAL FUNDING REQUIREMENTS2.0 Roads - Bramwest Parkway/Nstc : Non Inflated $0.0 $0.0 $0.0 $0.0 $0.0 $0.0 $0.0 $0.0 $0.0 $0.0 $0.0 $0.0 $0.0 $44,301.42.0 Roads - Bramwest Parkway/Nstc: Inflated $0.00 $0.00 $0.00 $0.00 $0.00 $0.00 $0.00 $0.00 $0.00 $0.00 $0.00 $0.00 $0.00 $49,500.96
POPULATION GROWTH - Population in New Units 14,515 12,879 7,275 6,441 4,804 4,043 3,992 3,866 3,686 3,479 3,461 3,380 3,111 311,666
REVENUE - current ($000) - Dev. Charge Receipts 2,553.4 2,311.0 1,331.6 1,202.4 914.8 785.3 790.9 781.1 759.7 731.5 742.2 739.4 694.2 49,900.5
- Interest on Opening Balance (613.6) (504.5) (402.9) (350.6) (302.5) (268.0) (238.8) (207.7) (175.4) (142.5) (109.4) (73.9) (36.6) (7,885.8) - Interest on In-year Transactions (excl.int.) 44.7 40.4 23.3 21.0 16.0 13.7 13.8 13.7 13.3 12.8 13.0 12.9 12.1 (415.8)
TOTAL REVENUE 1,984.4 1,846.9 952.0 872.9 628.3 531.1 566.0 587.1 597.6 601.8 645.8 678.5 669.8 41,598.9
CLOSING CASH BALANCE (9,172.6) (7,325.7) (6,373.7) (5,500.8) (4,872.6) (4,341.5) (3,775.5) (3,188.4) (2,590.8) (1,989.0) (1,343.2) (664.7) 5.1
2014 Adjusted Charge Per Capita $130.71 Allocation of Capital ProgramResidential Sector 70.0%Non-Residential Sector 30.0%
Rates for 2014Inflation Rate 2.0%Interest Rate on Positive Balances 3.5%Interest Rate on Negative Balances 5.5%
APPENDIX CTABLE 3B - PAGE 1
CITY OF BRAMPTONCASHFLOW AND DETERMINATION OF DEVELOPMENT CHARGE
BRAMWEST PARKWAY / NSTCRESIDENTIAL DEVELOPMENT CHARGE
HEMSON
197

2.0 ROADS - BRAMWEST PARKWAY/NSTC
OPENING CASH BALANCE FROM APPLICABLE RESERVES 2014 2015 2016 2017 2018 2019 2020 2021 2022 2023 2024 2025 2026 2027 2028
OPENING CASH BALANCE ($000) 2,057.6 2,792.8 3,587.0 4,395.6 5,158.0 (782.4) (246.2) 326.8 (3,581.2) (5,188.2) (4,841.8) (4,440.0) (4,002.7) (3,560.3) (3,170.8)
2014-2023 RESIDENTIAL FUNDING REQUIREMENTS2.00 Roads - Bramwest Parkway/Nstc : Non Inflated $0.0 $0.0 $0.0 $0.0 $6,029.8 $0.0 $0.0 $3,824.9 $1,673.6 $0.0 $0.0 $0.0 $0.0 $0.0 $0.02.00 Roads - Bramwest Parkway/Nstc: Inflated $0.00 $0.00 $0.00 $0.00 $6,526.88 $0.00 $0.00 $4,393.58 $1,960.84 $0.00 $0.00 $0.00 $0.00 $0.00 $0.00
Growth in Sq.M 459,000 472,500 454,410 396,900 370,710 363,150 360,450 355,050 353,700 365,850 379,350 379,350 361,530 313,200 287,550
REVENUE - current ($000) - Dev. Charge Receipts 651.8 684.4 671.3 598.1 569.8 569.3 576.4 579.1 588.5 620.9 656.6 669.8 651.1 575.3 538.8
- Interest on Opening Balance 72.0 97.7 125.5 153.8 180.5 (43.0) (13.5) 11.4 (197.0) (285.4) (266.3) (244.2) (220.1) (195.8) (174.4) - Interest on In-year Transactions (excl.int.) 11.4 12.0 11.7 10.5 (163.8) 10.0 10.1 (104.9) (37.7) 10.9 11.5 11.7 11.4 10.1 9.4
TOTAL REVENUE 735.2 794.1 808.6 762.4 586.5 536.2 572.9 485.6 353.8 346.4 401.8 437.3 442.3 389.5 373.8
CLOSING CASH BALANCE 2,792.8 3,587.0 4,395.6 5,158.0 (782.4) (246.2) 326.8 (3,581.2) (5,188.2) (4,841.8) (4,440.0) (4,002.7) (3,560.3) (3,170.8) (2,797.0)
OPENING CASH BALANCE FROM APPLICABLE RESERVES 2029 2030 2031 2032 2033 2034 2035 2036 2037 2038 2039 2040 2041 TOTAL
OPENING CASH BALANCE ($000) (2,797.0) (2,470.4) (2,168.8) (1,883.8) (1,586.2) (1,363.7) (1,195.2) (1,042.2) (875.2) (705.0) (514.7) (296.6) (68.1)
2014-2023 RESIDENTIAL FUNDING REQUIREMENTS2 Roads - Bramwest Parkway/Nstc : Non Inflated $0.0 $0.0 $0.0 $0.0 $0.0 $0.0 $0.0 $0.0 $0.0 $0.0 $0.0 $0.0 $0.0 $11,528.32 Roads - Bramwest Parkway/Nstc: Inflated $0.00 $0.00 $0.00 $0.00 $0.00 $0.00 $0.00 $0.00 $0.00 $0.00 $0.00 $0.00 $0.00 $12,881.30
0 Growth in Sq.M 247,050 220,590 199,800 194,400 147,150 113,400 99,900 100,440 95,850 98,550 103,950 101,250 96,120 7,491,150
REVENUE - current ($000) - Dev. Charge Receipts 472.1 430.0 397.3 394.3 304.4 239.3 215.0 220.5 214.6 225.1 242.2 240.6 233.0 13,029.6
- Interest on Opening Balance (153.8) (135.9) (119.3) (103.6) (87.2) (75.0) (65.7) (57.3) (48.1) (38.8) (28.3) (16.3) (3.7) (1,931.8) - Interest on In-year Transactions (excl.int.) 8.3 7.5 7.0 6.9 5.3 4.2 3.8 3.9 3.8 3.9 4.2 4.2 4.1 (108.8)
TOTAL REVENUE 326.5 301.7 285.0 297.6 222.5 168.5 153.0 167.0 170.2 190.3 218.1 228.5 233.3 10,988.9
CLOSING CASH BALANCE (2,470.4) (2,168.8) (1,883.8) (1,586.2) (1,363.7) (1,195.2) (1,042.2) (875.2) (705.0) (514.7) (296.6) (68.1) 165.3
2014 Adjusted Charge Per Sq.M $1.42 Allocation of Capital ProgramResidential Sector 70.0%Non-Residential Sector 30.0%
Industrial and Major Office 61%Non-Industrial and Non-Office 39%
Rates for 2014Inflation Rate 2.0%Interest Rate on Positive Balances 3.5%Interest Rate on Negative Balances 5.5%
BRAMWEST PARKWAY / NSTCINDUSTRIAL AND OFFICE DEVELOPMENT CHARGE
APPENDIX CTABLE 3B - PAGE 2
CITY OF BRAMPTONCASHFLOW AND DETERMINATION OF DEVELOPMENT CHARGE
HEMSON
198

2.00 ROADS - BRAMWEST PARKWAY/NSTC
OPENING CASH BALANCE FROM APPLICABLE RESERVES 2014 2015 2016 2017 2018 2019 2020 2021 2022 2023 2024 2025 2026 2027 2028
OPENING CASH BALANCE ($000) 1,331.1 1,694.0 2,163.6 2,643.3 3,102.4 (794.2) (366.1) 74.2 (2,391.7) (3,483.6) (3,327.0) (3,161.7) (2,975.1) (2,771.0) (2,503.8)
2014-2023 RESIDENTIAL FUNDING REQUIREMENTS2.00 Roads - Bramwest Parkway/Nstc : Non Inflated $0.0 $0.0 $0.0 $0.0 $3,900.9 $0.0 $0.0 $2,474.5 $1,082.7 $0.0 $0.0 $0.0 $0.0 $0.0 $0.02.00 Roads - Bramwest Parkway/Nstc: Inflated $0.00 $0.00 $0.00 $0.00 $4,222.48 $0.00 $0.00 $2,842.37 $1,268.54 $0.00 $0.00 $0.00 $0.00 $0.00 $0.00
Growth in Sq.M 90,100 114,600 110,600 98,400 86,900 121,700 116,500 111,000 82,600 83,000 81,400 82,600 82,600 92,400 93,200
REVENUE - current ($000) - Dev. Charge Receipts 310.8 403.3 397.0 360.3 324.5 463.6 452.6 439.9 333.9 342.2 342.3 354.3 361.4 412.4 424.3
- Interest on Opening Balance 46.6 59.3 75.7 92.5 108.6 (43.7) (20.1) 2.6 (131.5) (191.6) (183.0) (173.9) (163.6) (152.4) (137.7) - Interest on In-year Transactions (excl.int.) 5.4 7.1 6.9 6.3 (107.2) 8.1 7.9 (66.1) (25.7) 6.0 6.0 6.2 6.3 7.2 7.4
TOTAL REVENUE 362.8 469.6 479.7 459.1 325.9 428.0 440.4 376.4 176.7 156.6 165.3 186.6 204.1 267.2 294.0
CLOSING CASH BALANCE 1,694.0 2,163.6 2,643.3 3,102.4 (794.2) (366.1) 74.2 (2,391.7) (3,483.6) (3,327.0) (3,161.7) (2,975.1) (2,771.0) (2,503.8) (2,209.8)
OPENING CASH BALANCE FROM APPLICABLE RESERVES 2029 2030 2031 2032 2033 2034 2035 2036 2037 2038 2039 2040 2041 TOTAL
OPENING CASH BALANCE ($000) (2,209.8) (1,903.7) (1,616.2) (1,468.2) (1,345.0) (1,251.2) (1,171.8) (1,085.2) (994.6) (804.6) (614.5) (409.3) (188.0)
2014-2023 RESIDENTIAL FUNDING REQUIREMENTS2 Roads - Bramwest Parkway/Nstc : Non Inflated $0.0 $0.0 $0.0 $0.0 $0.0 $0.0 $0.0 $0.0 $0.0 $0.0 $0.0 $0.0 $0.0 $7,458.12 Roads - Bramwest Parkway/Nstc: Inflated $0.00 $0.00 $0.00 $0.00 $0.00 $0.00 $0.00 $0.00 $0.00 $0.00 $0.00 $0.00 $0.00 $8,333.40
Growth in Sq.M 90,500 81,400 48,200 40,700 32,800 28,400 28,400 27,700 44,200 41,500 41,500 41,500 37,900 2,032,300
REVENUE - current ($000) - Dev. Charge Receipts 420.2 385.5 232.8 200.5 164.9 145.6 148.5 147.7 240.5 230.3 234.9 239.6 223.2 8,737.0
- Interest on Opening Balance (121.5) (104.7) (88.9) (80.8) (74.0) (68.8) (64.4) (59.7) (54.7) (44.3) (33.8) (22.5) (10.3) (1,640.7) - Interest on In-year Transactions (excl.int.) 7.4 6.7 4.1 3.5 2.9 2.5 2.6 2.6 4.2 4.0 4.1 4.2 3.9 (65.3)
TOTAL REVENUE 306.0 287.5 148.0 123.3 93.8 79.3 86.6 90.6 190.0 190.1 205.2 221.3 216.8 7,031.0
CLOSING CASH BALANCE (1,903.7) (1,616.2) (1,468.2) (1,345.0) (1,251.2) (1,171.8) (1,085.2) (994.6) (804.6) (614.5) (409.3) (188.0) 28.8
2014 Adjusted Charge Per Sq.M $3.45 Allocation of Capital ProgramResidential Sector 70.0%Non-Residential Sector 30.0%
Industrial and Major Office 61%Non-Industrial and Non-Office 39%
Rates for 2014Inflation Rate 2.0%Interest Rate on Positive Balances 3.5%Interest Rate on Negative Balances 5.5%
BRAMWEST PARKWAY / NSTCNON-INDUSTRIAL AND NON-OFFICE DEVELOPMENT CHARGE
CITY OF BRAMPTONCASHFLOW AND DETERMINATION OF DEVELOPMENT CHARGE
APPENDIX CTABLE 3B - PAGE 3
HEMSON
199

APPENDIX D
RESERVE FUNDS
HEMSON
200

APPENDIX D
DEVELOPMENT CHARGES RESERVE FUNDS
The Development Charges Act requires that a reserve fund be established for each service for which development charges are collected. Table 1 presents the uncommitted reserve fund balances that are available to help fund the development-related net capital costs identified in this study. The opening balances of the development charges reserve funds as at December 31, 2013, have been adjusted to account for transitions, industrial discounts, Place of Worship discounts, and a potential for a return of funding.
HEMSON
201

Summary of Adjustments: DC Reserve Balance as of December 31st 2013
Unadjusted DC Reserve Balance at 31st December 2013 ($239,387,286)
Transition $25,896,349
Place of Worship $1,739,298
Potential Return of Funding $35,154,630
Revised DC Reserve Balance at 31st December 2013 ($171,712,905)
After accounting for the noted adjustments, the revised total DC reserve fund uncommitted balance was negative $171.71 million for all services. Table 1 shows the reserve fund balance available for each service category.
The application of the available uncommitted balance in each of the reserve funds is discussed in the appendix section related to each service. These funds are assigned to projects in the initial years of the capital program for each service. This has the effect of reducing and deferring capital costs brought forward to the development charge calculation and the cash flow analysis.
HEMSON
202

.
APPENDIX DTABLE 1
CITY OF BRAMPTON
YEAR ENDING DECEMBER 31, 2013($000's)
Reserve Fund 2014 Available Balance At Capital Budget Reserve Fund
CATEGORY Dec 31, 2013 Draws Balance
General Government $1,854,408 $1,854,408Library ($18,015,294) ($18,015,294)Fire ($23,683,542) ($23,683,542)Recreation & Parks $3,205,057 $3,205,057Public Works ($38,016,181) ($38,016,181)Parking Lots $7,308,075 $7,308,075Transit ($40,442,985) ($40,442,985)Roads ($75,218,307) ($75,218,307)New Bramwest Pkwy (N/S Transportation Corridor) $11,295,864 $11,295,864
Total Development Charge Reserves ($171,712,905) $0.0 ($171,712,905)
DEVELOPMENT CHARGE RESERVE FUND BALANCE BY ACCOUNT
HEMSON
203

APPENDIX E
LONG-TERM CAPITAL AND OPERATING IMPACTS
HEMSON
204

APPENDIX E
TABLE 1
CITY OF BRAMPTONESTIMATED NET OPERATING COST OF THE PROPOSED
DEVELOPMENT-RELATED CAPITAL PROGRAM
2014 2015 2016 2017 2018 2019 2020 2021 2022 2023General GovernmentAnimal Shelter $0.0 $1,883.8 $1,883.8 $1,883.8 $1,883.8 $1,883.8 $1,883.8 $1,883.8 $1,883.8 $1,883.8Library ServicesVarious Projects $0.0 $0.0 $0.0 $0.0 $0.0 $0.0 $0.0 $0.0 $0.0 $0.0Fire ServicesVarious Projects $15.0 $60.0 $2,780.0 $5,460.0 $10,870.0 $10,920.0 $13,336.0 $13,336.0 $13,336.0 $13,336.0RecreationVarious Projects $644.7 $3,594.8 $5,036.7 $6,243.9 $6,827.2 $7,410.6 $8,235.6 $8,485.6 $9,060.6 $9,560.6TransitVarious Projects $1,605.1 $8,227.3 $11,668.9 $13,690.7 $15,712.5 $17,734.3 $19,756.1 $21,777.9 $23,799.7 $25,821.5Public WorksVarious Projects $21.0 $413.0 $1,401.0 $2,289.0 $2,331.0 $2,373.0 $2,415.0 $2,457.0 $2,499.0 $2,499.0
Subtotal General Services $2,285.8 $14,179.0 $22,770.4 $29,567.4 $37,624.6 $40,321.7 $45,626.5 $47,940.3 $50,579.1 $53,100.9RoadsVarious Projects $1,040.0 $1,131.5 $1,875.5 $2,423.5 $2,626.5 $2,804.5 $2,859.5 $3,006.5 $3,067.5 $3,067.5
TOTAL ESTIMATED OPERATING COSTS ($000) $3,325.8 $15,310.5 $24,645.9 $31,990.9 $40,251.1 $43,126.2 $48,486.0 $50,946.8 $53,646.6 $56,168.4
Source: City of Brampton Finance
Estimated Annual Additional Operating Costs ($000)
(in constant 2013 dollars)
HEMSON
205

CITY OF BRAMPTONSUMMARY OF TAX SUPPORTED FUNDING REQUIREMENTS
Net Capital Cost ofGrowth Related Projects 2014 2015 2016 2017 2018 2019 2020 2021 2022 2023 TOTAL
($000) ($000) ($000) ($000) ($000) ($000) ($000) ($000) ($000) ($000) ($000)General Government Total Net Cost (1) 535.3 10,914.3 764.3 764.3 1,189.3 441.4 541.4 541.4 441.4 466.4 16,599.6 Net Cost From Development Charges (2) 151.3 8,004.3 232.3 232.3 614.8 232.3 277.3 277.3 232.3 412.3 10,666.6 Net Cost From Non-DC Sources 384.0 2,910.0 532.0 532.0 574.5 209.1 264.1 264.1 209.1 54.1 5,933.0 - Discount Portion (3) 49.9 1,066.4 58.9 58.9 101.4 26.6 31.6 31.6 26.6 46.6 1,498.9 - Replacement/BTE 36.0 250.0 175.0 175.0 175.0 175.0 225.0 225.0 175.0 0.0 1,611.0 - Available DC Reserves (4) 298.1 1,496.7 7.5 7.5 7.5 7.5 7.5 7.5 7.5 7.5 1,854.4 - For Post 2023 Development (5) 0.0 96.9 290.6 290.6 290.6 0.0 0.0 0.0 0.0 0.0 968.7Library Board Total Net Cost (1) 22,694.0 2,977.0 3,077.0 3,277.0 3,477.0 3,677.0 18,877.0 4,077.0 4,277.0 4,477.0 70,887.0 Net Cost From Development Charges (2) 18,849.6 924.3 834.3 834.3 283.8 45.0 45.0 45.0 45.0 45.0 21,951.3 Net Cost From Non-DC Sources 3,844.4 2,052.7 2,242.7 2,442.7 3,193.2 3,632.0 18,832.0 4,032.0 4,232.0 4,432.0 48,935.7 - Discount Portion (3) 2,094.4 102.7 92.7 92.7 92.7 92.7 1,592.7 92.7 92.7 92.7 4,438.7 - Replacement/BTE 1,750.0 1,950.0 2,150.0 2,350.0 2,550.0 2,750.0 2,950.0 3,150.0 3,350.0 3,550.0 26,500.0 - Available DC Reserves (4) 0.0 0.0 0.0 0.0 0.0 0.0 0.0 0.0 0.0 0.0 0.0 - For Post 2023 Development (5) 0.0 0.0 0.0 0.0 550.5 789.3 14,289.3 789.3 789.3 789.3 17,997.0Fire Services Total Net Cost (1) 44,858.5 11,428.0 8,303.0 2,000.0 6,430.0 6,200.0 2,000.0 900.0 200.0 200.0 82,519.5 Net Cost From Development Charges (2) 29,122.2 0.0 0.0 0.0 0.0 0.0 0.0 0.0 0.0 0.0 29,122.2 Net Cost From Non-DC Sources 15,736.3 11,428.0 8,303.0 2,000.0 6,430.0 6,200.0 2,000.0 900.0 200.0 200.0 53,397.3 - Discount Portion (3) 0.0 0.0 0.0 0.0 0.0 0.0 0.0 0.0 0.0 0.0 0.0 - Replacement/BTE 2,985.0 7,785.0 745.0 550.0 550.0 550.0 550.0 550.0 100.0 100.0 14,465.0 - Available DC Reserves (4) 0.0 0.0 0.0 0.0 0.0 0.0 0.0 0.0 0.0 0.0 0.0 - For Post 2023 Development (5) 12,751.3 3,643.0 7,558.0 1,450.0 5,880.0 5,650.0 1,450.0 350.0 100.0 100.0 38,932.3Recreation Total Net Cost (1) 19,516.9 99,131.9 24,567.9 26,284.9 55,769.9 32,937.9 34,239.9 39,138.9 27,467.9 55,674.9 414,730.7 Net Cost From Development Charges (2) 13,988.7 88,703.2 19,575.1 20,801.8 49,663.9 28,633.6 22,965.4 27,937.0 24,273.1 49,659.4 346,201.6 Net Cost From Non-DC Sources 5,528.2 10,428.6 4,992.7 5,483.0 6,105.9 4,304.2 11,274.4 11,201.8 3,194.7 6,015.4 68,529.0 - Discount Portion (3) 1,951.7 9,897.2 2,216.3 2,352.6 5,559.5 3,222.8 2,593.0 3,145.4 2,738.3 5,559.0 39,235.7 - Replacement/BTE 0.0 160.0 2,405.0 2,759.0 175.0 710.0 8,310.0 7,685.0 85.0 85.0 22,374.0 - Available DC Reserves (4) 3,205.1 0.0 0.0 0.0 0.0 0.0 0.0 0.0 0.0 0.0 3,205.1 - For Post 2023 Development (5) 371.4 371.4 371.4 371.4 371.4 371.4 371.4 371.4 371.4 371.4 3,714.3Transit Total Net Cost (1) 57,459.6 14,658.0 8,739.0 5,794.0 79,221.0 3,171.0 3,171.0 3,171.0 3,171.0 3,171.0 181,726.6 Net Cost From Development Charges (2) 49,378.2 10,856.7 5,529.6 2,879.1 1,463.4 518.4 518.4 518.4 518.4 518.4 72,698.8 Net Cost From Non-DC Sources 8,081.5 3,801.3 3,209.4 2,914.9 77,757.6 2,652.6 2,652.6 2,652.6 2,652.6 2,652.6 109,027.8 - Discount Portion (3) 5,746.0 1,465.8 873.9 579.4 7,922.1 317.1 317.1 317.1 317.1 317.1 18,172.7 - Replacement/BTE 0.0 0.0 0.0 0.0 0.0 0.0 0.0 0.0 0.0 0.0 0.0 - Available DC Reserves (4) 0.0 0.0 0.0 0.0 0.0 0.0 0.0 0.0 0.0 0.0 0.0 - For Post 2023 Development (5) 2,335.5 2,335.5 2,335.5 2,335.5 69,835.5 2,335.5 2,335.5 2,335.5 2,335.5 2,335.5 90,855.2Notes: (1) For total growth related capital forecast see Appendices B & C.
(2) Share of Capital program to be funded from development charges if calculated rates are fully implemented
(3) Mandatory 10% reduction for applicable services
(4) Portion of growth-related capital forecast identified as prior growth (to be funded from present Development Charge reserve fund balances).
(5) Post 2023 growth related net capital costs may be eligible for development charges in future DC by-laws, but interim financing of this share may be required
APPENDIX ETABLE 2 - PAGE 1
HEMSON
206

APPENDIX ETABLE 2 - PAGE 2
CITY OF BRAMPTONSUMMARY OF TAX SUPPORTED FUNDING REQUIREMENTS
Net Capital Cost ofGrowth Related Projects 2014 2015 2016 2017 2018 2019 2020 2021 2022 2023 TOTAL
($000) ($000) ($000) ($000) ($000) ($000) ($000) ($000) ($000) ($000) ($000)Public Works Total Net Cost (1) 41,862.3 8,999.1 8,320.1 19,305.1 3,923.1 9,131.1 19,830.1 696.1 696.1 696.1 113,459.2 Net Cost From Development Charges (2) 29,393.0 0.0 0.0 0.0 0.0 0.0 0.0 0.0 0.0 0.0 29,393.0 Net Cost From Non-DC Sources 12,469.3 8,999.1 8,320.1 19,305.1 3,923.1 9,131.1 19,830.1 696.1 696.1 696.1 84,066.2 - Discount Portion (3) 0.0 0.0 0.0 0.0 0.0 0.0 0.0 0.0 0.0 0.0 0.0 - Replacement/BTE 0.0 0.0 0.0 0.0 0.0 0.0 0.0 0.0 0.0 0.0 0.0 - Available DC Reserves (4) 0.0 0.0 0.0 0.0 0.0 0.0 0.0 0.0 0.0 0.0 0.0 - For Post 2023 Development (5) 12,469.3 8,999.1 8,320.1 19,305.1 3,923.1 9,131.1 19,830.1 696.1 696.1 696.1 84,066.2Parking Total Net Cost (1) 2,355.0 2,355.0 2,355.0 2,355.0 2,355.0 2,355.0 2,355.0 2,355.0 2,355.0 2,355.0 23,550.2 Net Cost From Development Charges (2) 0.0 0.0 0.0 0.0 0.0 0.0 0.0 0.0 0.0 0.0 0.0 Net Cost From Non-DC Sources 2,355.0 2,355.0 2,355.0 2,355.0 2,355.0 2,355.0 2,355.0 2,355.0 2,355.0 2,355.0 23,550.2 - Discount Portion (3) 45.4 45.4 45.4 45.4 45.4 45.4 45.4 45.4 45.4 45.4 454.1 - Replacement/BTE 1,900.9 1,900.9 1,900.9 1,900.9 1,900.9 1,900.9 1,900.9 1,900.9 1,900.9 1,900.9 19,009.1 - Available DC Reserves (4) 408.7 408.7 408.7 408.7 408.7 408.7 408.7 408.7 408.7 408.7 4,087.0 - For Post 2023 Development (5) 0.0 0.0 0.0 0.0 0.0 0.0 0.0 0.0 0.0 0.0 0.0Total General Services Total Net Cost (1) 189,281.7 150,463.3 56,126.3 59,780.3 152,365.3 57,913.4 81,014.4 50,879.4 38,608.4 67,040.4 903,472.8 Net Cost From Development Charges (2) 140,883.0 108,488.5 26,171.3 24,747.5 52,026.0 29,429.3 23,806.1 28,777.7 25,068.8 50,635.1 510,033.7 Net Cost From Non-DC Sources 48,398.6 41,974.8 29,954.9 35,032.7 100,339.3 28,484.0 57,208.2 22,101.6 13,539.5 16,405.2 393,439.2 - Discount Portion (3) 9,887.4 12,577.5 3,287.2 3,129.0 13,721.1 3,704.6 4,579.8 3,632.2 3,220.1 6,060.8 63,800.0 - Replacement/BTE 6,671.9 12,045.9 7,375.9 7,734.9 5,350.9 6,085.9 13,935.9 13,510.9 5,610.9 5,635.9 83,959.1 - Available DC Reserves (4) 3,911.8 1,905.4 416.2 416.2 416.2 416.2 416.2 416.2 416.2 416.2 9,146.4 - For Post 2023 Development (5) 27,927.5 15,445.9 18,875.7 23,752.7 80,851.1 18,277.3 38,276.3 4,542.3 4,292.3 4,292.3 236,533.6
Roads - Exluding Bramwest/NSTC 2014-2041 Total Net Cost (1) 1,385,118.5 Net Cost From Development Charges (2) 1,320,850.6 Net Cost From Non-DC Sources 64,268.0 - Discount Portion (3) 0.0 - Replacement/BTE 64,268.0 - Available DC Reserves (4) 0.0 - For Post 2041 Development (6) 0.0
Roads - Bramwest/NSTC 2014-2041 Total Net Cost (1) 62,875.0 Net Cost From Development Charges (2) 51,579.1 Net Cost From Non-DC Sources 11,295.9 - Discount Portion (3) 0.0 - Replacement/BTE 0.0 - Available DC Reserves (4) 11,295.9 - For Post 2041 Development (6) 0.0
Notes: (1) For total growth related capital forecast see Appendices B & C.
(2) Share of Capital program to be funded from development charges if calculated rates are fully implemented
(3) Mandatory 10% reduction for applicable services
(4) Portion of growth-related capital forecast identified as prior growth (to be funded from present Development Charge reserve fund balances).
(5) Post 2023 growth related net capital costs may be eligible for development charges in future DC by-laws, but interim financing of this share may be required
(6) Post 2041 growth related net capital costs may be eligible for development charges in future DC by-laws, but interim financing of this share may be required
HEMSON
207