Development and Validation of Methods for …169456/FULLTEXT01.pdf · PDEA 2- (2-pyrdinyldithio ......
50
ACTA UNIVERSITATIS UPSALIENSIS UPPSALA 2006 Digital Comprehensive Summaries of Uppsala Dissertations from the Faculty of Science and Technology 256 Development and Validation of Methods for Characterization of Multi-Component Systems in Preparative LC ROBERT ARNELL ISSN 1651-6214 ISBN 91-554-6762-8 urn:nbn:se:uu:diva-7422
Transcript of Development and Validation of Methods for …169456/FULLTEXT01.pdf · PDEA 2- (2-pyrdinyldithio ......
ACTAUNIVERSITATISUPSALIENSISUPPSALA2006
Digital Comprehensive Summaries of Uppsala Dissertationsfrom the Faculty of Science and Technology 256
Development and Validation ofMethods for Characterization ofMulti-Component Systems inPreparative LC
ROBERT ARNELL
ISSN 1651-6214ISBN 91-554-6762-8urn:nbn:se:uu:diva-7422


List of Papers
This thesis is based on the following papers, which are referred to in the text by their Roman numerals I-VI:
I Validation of the Tracer-Pulse Method for Multi-Component Liquid Chromatography. A Classical Paradox Revisited.Robert Arnell, Torgny Fornstedt. Analytical Chemistry, 78 (2006) 4615-4623.
II Invisible Analyte Peak Deformations in Single-Component Liquid Chromatography.Jörgen Samuelsson, Robert Arnell, Torgny Fornstedt. Analytical Chemistry, 78 (2006) 2765-2771.
III An Improved Algorithm for Solving Inverse Problems in Liquid Chromatography. Patrik Forssén, Robert Arnell and Torgny Fornstedt, Computers & Chemical Engineering, 30 (2006) 1381-1391.
IV Accurate and Rapid Estimation of Adsorption Isotherms in Liquid Chromatography Using the Inverse Method on Pla-teaus. Robert Arnell, Patrik Forssén and Torgny Fornstedt, Jour-nal of Chromatography A, 1099 (2005) 167-174.
V Tuneable Peak Deformations in Chiral Preparative LC.Robert Arnell, Patrik Forssén, Torgny Fornstedt, Submitted Dec 2006 to Analytical Chemistry
VI Analytical Characterisation of Chiral Drug-Protein Interac-tions: A Comparison between the Optical Biosensor (SPR) Assay and the HPLC Perturbation Method.Robert Arnell, Natalia Ferraz and Torgny Fornstedt, Analytical Chemistry, 2006, 78, 1682-1689.
Reprints were made with kind permission from publishers.

My contribution to the papers included in this thesis was:
I: I planned, performed and evaluated all experiments and wrote the paper. II: I performed some of the experiments, and did the evaluation and writing in cooperation with Jörgen Samuelsson. III: I took part in the software development, and I performed the experi-ments, evaluation and writing in cooperation with Patrik Forssén. IV and V: I planned, performed and evaluated all experiments and wrote the paper in cooperation with Patrik Forssén. VI: I planned, and performed all experiments in cooperation with Natalia Ferraz, and I did the evaluation and writing. I-VI: The study was performed under supervision of Torgny Fornstedt.
Manuscripts not included in the thesis:
Measurement of Chiral Drug-Protein Interactions using Surface Plas-mon Resonance Technology.Peter Sandblad, Robert Arnell, Torgny Fornstedt. Submitted Dec 2006 to Analytical Biochemistry.
A Biotechnological Approach to the Synthesis of 9 -hydroxylated Ster-oids.Robert Arnell, Richard Johannisson, Johan Lindholm, Torgny Fornstedt, Bo Ersson, Andras Ballagi, Karin Caldwell. Accepted Dec 2006 in Preparative Biochemistry and Biotechnology.

Contents
List of Papers ..................................................................................................3
1 Introduction..................................................................................................91.1 Aims of study .....................................................................................12
2 Theory and Methodology...........................................................................132.1 Mathematical models of LC...............................................................13
2.1.1 Analytical LC..............................................................................132.1.2 Preparative LC............................................................................13
2.2 Adsorption isotherms .........................................................................152.2.1 The Langmuir adsorption isotherm.............................................152.2.2 The bi-Langmuir adsorption isotherm ........................................16
2.3 Methods for adsorption isotherm measurement .................................162.3.1 The perturbation peak and tracer peak methods .........................172.3.2 Frontal analysis...........................................................................172.3.3 The inverse method.....................................................................182.3.4 Least-square fitting of model parameters ...................................202.3.5 Model discrimination..................................................................20
2.4 Chromatographic properties and phenomena.....................................212.4.1 Peak deformations ......................................................................212.4.2 Concentration plateaus perturbation and tracer peaks .............222.4.3 Peak deformations on concentration plateaus.............................26
2.5 Characterization of chiral drug-protein interactions using the perturbation peak method (PP) and surface plasmon resonance (SPR) technology. ...............................................................................................27
3 Results and Discussion (Summary of papers)............................................283.1 Paper I ................................................................................................283.2 Paper II ...............................................................................................313.3 Paper III..............................................................................................333.4 Paper IV..............................................................................................343.4 Paper V...............................................................................................363.6 Paper VI..............................................................................................39
4 Concluding remarks ...................................................................................41
5 Acknowledgements....................................................................................42

6 Swedish summary ......................................................................................43Utveckling och validering av metoder för karaktärisering av flerkomponentsystem vid preparativ vätskekromatografi ........................43
7 Reference list .............................................................................................46

Abbreviations
t Column total porosity Injection profile Eigenvalue of matrix A
2 Variance Data point used in parameter fit Integration space used in the calculation of the L2 error
a Initial slope of the Langmuir adsorption isotherm a Adsorption isotherm parameter vector A Matrix = I + F q (C), at C = C0ACN Acetonitrile b Equilibrium constant in the Langmuir adsorption isotherm C Concentration in the mobile phase C0 Eluent concentration, plateau concentration Cinj Sample concentration CPU Central processing unit Da Apparent dispersion constant DM Methyl-(D)-mandelate DMSO Dimethylsulfoxide ED Equilibrium-dispersive (model) F Phase ratio in the column FR Fisher ratio FA Frontal analysis (method) HOAc Acetic acid HPLC High performance liquid chromatography I Ionic strength I Unit matrix IM Inverse method IMP Inverse method on plateaus k Capacity ratio (retention factor) L Column length LC Liquid chromatography LM Methyl-(L)-mandelate LOD Limit of detection LOQ Limit of quantification MeOH Methanol n Number of components (solutes)
nd Number of data points used in the parameter fit. N Column efficiency (number of theoretical plates) p Number of parameters in an adsorption isotherm model p General experimental parameters PDEA 2-(2-pyrdinyldithio) ethaneamine (coupling reagent) PP Perturbation peak (method) q Concentration in the stationary phase Q Adsorbed amount (in moles) RSS Residual squared sum SPR Surface plasmon resonance t Time coordinate t0 Column hold-up time tR Retention time TEA Triethylamine TP Tracer-pulse (method) u Mobile phase linear flow velocity x Axial coordinate V0 Column hold-up volume VR Retention volume Vs Stationary phase volume in the column

9
1 Introduction
Chromatography is a very important separation method used in practically all disciplines related to chemistry. For many decades chromatography has had a key role in academic and industrial laboratories where it has been used to analyze or purify components from complex mixtures. Most break-throughs in biochemistry and pharmaceutical science would probably not have been possible without chromatography.
The method is based on the partitioning of solutes between two phases, and is therefore related to simple extraction. In chromatography, however, one phase (the mobile phase) is in constant movement relative the other one (the stationary phase). The sample molecules partition between the phases; those in the stationary phase are retained, whereas those in the mobile phase move. The interaction between solutes and the stationary phase is most often based on adsorption. During a chromatographic separation, a solute normally partitions between the phases thousands of times. The basis of separation is that different kinds of molecules on average spend different amount of time in the stationary phase. Due to the many partitioning steps, chromatography has the power to separate mixtures of components with very similar physical properties. In the most common format, called column chromatography, the stationary phase is a highly porous solid material packed inside a cylindrical column (steel or glass), whereas the mobile phase is a liquid, a gas or a su-percritical fluid. Chromatography is categorized after the type of mobile phase used; liquid, gas and supercritical chromatography. Of these, liquid chromatography (LC) is the dominant, and the focus of this thesis.
Chromatography is generally considered to have been developed in the beginning of the 20th. century by the Russian botanist Tswett. He found that he could separate components from a plant extract by flushing it through a glass tube packed with an adsorbent. Distinct bands of various colors evolved and migrated at different rates down the column. The bands corre-sponded to the different plant pigments and could be collected at the outlet at the bottom of the tube. Tswett chose to call his technique “chromatography”, which means “color writing” in Greek. The name has stuck for historical reasons, although it is not very descriptive of the method in general. His publication [1] had little impact, and the method fell into oblivion for some time before it was rediscovered and its potential understood.
The practice of chromatography has gone hand-in-hand with the theoreti-cal achievements. Mathematical models were formulated already in the

10
1940s [2-4] and in 1952 Martin and Synge were awarded the Nobel Prize in chemistry for their contributions to partitioning theory [5]. The works by Giddings [6] can be considered a milestone in the history of chromatogra-phy, where the causes of band broadening were first stringently described. This indicated how the equipment should be designed to allow for efficient separations. The stationary phase particles should be homogenously packed and have small diameter, uniform geometry and size distribution and the extra-column volume should be minimized. Manufacturers have followed these directions resulting in a category called High Performance Liquid Chromatography (HPLC), indicating the dramatic improvements achieved.
LC is an old method, but an enormous amount of research is still devoted to improving it further. Several current trends can be seen:
1. Development of new high-capacity, high-selective and high-efficient stationary phases for separation of chiral molecules [7], i.e. molecules that exist as different mirror image forms
2. The stationary phase particles become even smaller to increase performance further [8]; at present particles with 1.7 µm in diame-ter are commercially available. LC columns packed with such ma-terials require ultra-high pressure pumps to provide sufficient flow rates.
3. Column miniaturization [9, 10] to decrease sample and mobile phase consumption.
4. The development of monolithic stationary phases [11]. Instead of packing the column with spherical particles, a single-piece station-ary phase is synthesized by in situ polymerization.
5. Operation at very high temperatures [12] to decrease mobile phase viscosity, increase solute solubility and to enable the use of non-toxic eluents such as water.
6. Stationary phases are developed to withstand extreme conditions, such as very high or very low pH [13, 14].
The standard LC setup is described briefly here. The mobile phase is drawn from a flask and pumped through an injector, a chromatography column, and a detector(s), often by means of a pulse-damped high-pressure pump. Often a distinction is made, so that the liquid is called eluent while in the flask, mo-bile phase when it goes through the column and effluent when it has exited the column. Sometimes several pumps are used to draw eluent from the same number of flasks, and the streams are mixed before entering the injector. In this way the eluent composition can be varied through continuous or step-wise gradients. The sample is injected at the column inlet often by a robotic autosampler that can handle tens or hundreds of sample vials, and the solutes migrate with the mobile phase through the column where they are retained by interactions with the stationary phase. The effluent is then analyzed by a

11
detector, often based on UV absorption. The elution of each solute is seen as a peak in the chromatogram, which is a plot of the detector signal as a func-tion of time. Often a fraction collector is connected to the detector outlet, so that purified components can be collected.
LC has two major fields of application: In analytical LC the aim is to get qualitative and quantitative information about a mixture. Detectors are placed at the column outlet to identify and measure the concentration of the eluted components. In preparative LC the goal is to isolate as much as pos-sible of the desired component(s) in a more or less complex sample mixture and high sample concentrations are normally injected. Because of the limited surface of the stationary phase, the column often becomes overloaded; a further increase in sample load results in a lower fraction adsorbed, so that a high-concentration region of a band will migrate faster than a low-concentration region. The eluted peaks may therefore become strongly dis-torted and unsymmetrical. Another complication is that the different types of components compete with each other for the same surface, which ultimately results in strong band interference and band contaminations as described by Helfferich [15] and more recently by Guiochon [16].
The outcome of a chromatographic separation, whether analytical or preparative, is dictated by the adsorption isotherms of the solutes. Adsorp-tion isotherms are nonlinear functions that describe the partitioning of sol-utes between mobile and stationary phases at a given constant temperature. This partitioning of a solute depends on the local concentration of this com-pound and the local concentrations of all other compounds present. Multi-component adsorption isotherms are therefore mostly competitive. Analytical LC is performed at low concentrations, corresponding to a section where the adsorption isotherms are practically linear and is therefore often called linearLC. In preparative separations, on the other hand, the sample concentrations are normally very high and the adsorption isotherms exhibit strong curvature (therefore nonlinear LC). This nonlinearity may cause severe peak deforma-tion. Recent research has revealed that adsorption is surprisingly complex and that advanced models are often needed to adequately describe the proc-ess [17, 18]. A detailed understanding of nonlinear LC adsorption processes is important for the establishment of productive operating conditions both in analytical and preparative LC. If the competitive adsorption isotherms have been measured, optimal operating conditions can be found by the use of computer simulations and numerical optimization [16], as opposed to con-ventional trial-and-error methodologies. Computer-assisted optimization is becoming a standard procedure in modern continuous and semi-continuous chromatographic processes such as simulated moving bed [19, 20] and steady-state recycling [21, 22]. Simulated moving bed processes in particular are very difficult and expensive to optimize without numerical routines. Fur-thermore, simulation is a very useful tool in studies aiming at explaining the

12
extreme peak deformations that are sometimes encountered in preparative LC.
There are several methods for adsorption isotherm measurement. Frontal analysis (FA) is the oldest one, first suggested by Tiselius [23], then devel-oped and applied by James and Phillips [24]. It is considered very accurate and has been extensively used in many LC characterizations [25]. However, FA is time consuming, plenty of pure solute is required and it is difficult to analyze multi-component mixtures [26]. As a consequence, much research has been done to develop new methods. This has resulted in methods like the perturbation peak method (PP) [15, 27-31], elution by characteristic points [32, 33], the inverse method (IM) [34-37], the batch uptake method [38] and the nonlinear frequency response method [39], all of which have their advan-tages but also drawbacks, as compared to FA.
1.1 Aims of study The aims of this work were:
To develop/extend and validate new methods for multi-component ad-sorption isotherm determination. The methods available today all have some of the following disadvantages: high solute consumption, long analysis times, difficult procedures, low accuracy, unsuitable for multi-component analysis. To use these methods to characterize complex LC systems. As an applica-tion, a modern chiral stationary phase was characterized, which would have been extremely difficult to achieve using conventional methods. To study and visualize complicated phenomena in a contribution to in-crease the general understanding of nonlinear LC. One phenomenon stud-ied was that molecules migrate with a different velocity than concentra-tions, so that under certain conditions the injected sample molecules are not found in the detected peak. Different peculiar peak deformations (here, a peak is considered “deformed” if its shape deviates from normal-ity) were also discovered and their causes explained. To study how to perform detailed characterizations of chiral drug-protein interactions by measurement of adsorption isotherms. Two methods were compared; the LC-based perturbation peak method and a surface plasmon resonance-based biosensor assay.

13
2 Theory and Methodology
2.1 Mathematical models of LC
2.1.1 Analytical LC Analytical (linear) LC can be described by relatively simple models. Injec-tion of an n-component mixture will give rise to n Gaussian peaks, which are more or less separated in the chromatogram. Detailed expressions based on physicochemical properties have been derived to describe retention [40-42], but for most purposes it is sufficient to know that the retention time, tR,i of a solute i is given by:
.,...,1,10,R niktt ii (1)
Here, t0 is the column hold-up time, i.e. the retention time of an unadsorbed component. The capacity ratio, ki, describes the partitioning of solute i be-tween mobile and stationary phases and is constant at low concentrations. The variance, ,2 of a Gaussian peak corresponds to the dispersion of the solute molecules. The column efficiency, N, relates the variance to the col-umn length, L, and is a common measure of a column’s ability to produce narrow peaks:
.2
2LN (2)
2.1.2 Preparative LC In preparative (nonlinear) LC more advanced models must be used, since the migration rate of a solute through the column is concentration-dependant. The most complete and realistic model is the general rate model [16], which entails a detailed treatment of external dispersion, external mass transfer, inter-particle diffusion and adsorption-desorption kinetics. In most modern HPLC systems, however, the kinetics are very fast and the phases can be

14
assumed to be in equilibrium. The small actual non-equilibrium adds some dispersion to the solute zones, and can be lumped with other dispersive con-tributions into an apparent dispersion constant. The resulting simplified model, the Equilibrium-Dispersive (ED) model, is the one most often as-sumed in HPLC studies, as in this thesis. In the ED model, each solute i is described by a mass balance equation:
.,0,0,
,,...,1,0,0
,,,,,
,0
2
2
a
ttCCxC
nitLxx
txCDx
txCut
txqFt
txC
ii
ii
iiii
(3)
In the mass balance equation, Ci(x, t) is the mobile phase concentration of component i at a distance x from the column inlet and at time t after sample injection; qi is the stationary phase concentration as described by the adsorp-tion isotherm, u the linear flow rate and Da is the apparent dispersion con-stant, L is the column length, F the volumetric phase ratio:
t
t
0
s 1VVF , (4)
where Vs and V0 are the stationary and mobile phase partial volumes and t is the total porosity of the column. The apparent dispersion constant, Da, can be calculated from:
.2a NLuD (5)
The last two lines in equation 3 are the initial and boundary conditions. The initial condition describes the mobile phase concentration, C0 ,i, at all posi-tions, x, prior to the injection. Normally, C0 ,i = 0, but as we will see below this is not always so. The boundary condition is the injection profile, i, the shape of the injected sample zone.
LC separations can be simulated by solving equation 3 for C(L, t), i.e. the elution profile, by numerical calculations. This is usually done by the Rouchon finite difference method [43] or by orthogonal collocation [44].
15
2.2 Adsorption isotherms Adsorption isotherms describe the equilibrium distribution of solutes be-tween mobile and stationary phases, q(C), in a chromatography column. The nature of the interactions varies from system to system, so there are many adsorption isotherm models. If the adsorption isotherms can be measured and fitted to the appropriate model, a lot of information is obtained about system characteristics, which is useful in both analytical and preparative separations. Furthermore, it is then possible to perform computer simulations (by solving equation 3).
Most adsorption isotherms have a convex curvature, approaching a maximum adsorbed concentration, the saturation capacity. Such models are classified as type I according to the IUPAC standard [45]. Type III adsorp-tion isotherms are concave with increasing slope at high concentrations, whereas type II isotherms are initially convex but after an inflection point turn concave. All adsorption isotherms encountered in this study were of type I, but in papers II and V it was shown that such systems may behave like type II or III in some situations. Each model is constituted of a number of model parameters a, which define the specific adsorption isotherm for the different components.
2.2.1 The Langmuir adsorption isotherm The Langmuir adsorption isotherm [46] is a very simple model. It assumes ideal solutions, homogeneous and independent monolayer adsorption:
.,...,1,,11
)( ,s njiCb
CaCb
Cbqq
j jj
ii
j jj
iiii C (6)
In this expression, ai is the initial slope, bi is the equilibrium constant and qs ,i = ai/bi the saturation capacity of component i. It holds that ki = Fai, (see equation 1), so the retention times of the Gaussian peaks in analytical separa-tions are given by the initial slope of corresponding adsorption isotherm. Figure 1 shows an example of a single-component (a) and a two-component (b) Langmuir adsorption isotherm. It should be understood that the adsorbed concentration of any component i depends on the concentration of all com-ponents present. Because of this, all n mass-balance equations (equation 3) are coupled and cannot be treated independently.

16
Figure 1. Example of (a) a single-component and (b) a binary Langmuir adsorption isotherm.
2.2.2 The bi-Langmuir adsorption isotherm Another common adsorption isotherm model is the bi-Langmuir model [47], which is an empirical extension of the Langmuir model:
.,...,1,,11
)(,I
,II
,I
,I njiCb
CaCb
Caq
j jj
ii
j jj
iii C (7)
The bi-Langmuir model applies to heterogeneous systems containing two independent types of adsorption sites (site I and II in equation 7). Examples are alkyl and silanol groups in C18 reversed-phase systems [48], and chiral selective and nonselective sites in chiral stationary phases [49, 50].
More complex models of type II and III exist that take lateral surface in-teractions, multi-layer adsorption, adsorption energy distribution heterogene-ity, and etc., into account [16, 17, 51-55]. The most advanced models are implicit, qi=f(C, q), and are constituted of many parameters, so they are very inconvenient and difficult to use.
2.3 Methods for adsorption isotherm measurement There are several methods that can be used for measurement of adsorption isotherms [56], all with their respective advantages and drawbacks with re-spect to accuracy, complexity, sample and time requirements. Some methods

17
are difficult or even impossible to use for measurement of competitive (multi-component) adsorption isotherms. Other methods cannot provide adsorption isotherm data points, but only parametric estimates.
Frontal analysis (paper I, II, IV), the inverse method (paper III-V), the perturbation peak method (paper I, VI) and the tracer pulse method (paperI) were used in this study for measurement of adsorption isotherms.
2.3.1 The perturbation peak and tracer peak methods Both the perturbation peak (PP) and tracer-pulse (TP) methods are so-called plateau methods, where the column is first equilibrated with an eluent con-taining the solute(s) studied and then a sample is injected to disturb the equi-librium. The properties of perturbation and tracer peaks and the methods for adsorption isotherm measurement linked to these properties will be treated in section 2.4.2.
2.3.2 Frontal analysis Single-component FA is most conveniently performed in the so called stair-case mode [16]. The column is initially equilibrated with an eluent without solute, C0 = 0. Eluents containing solute are then fed to the system, with sol-ute concentration increasing in discrete steps in a staircase manner. Each step-increase (from Cj to Cj+1) will result in the elution of a breakthrough front with a retention volume, VR, j+1, that can be used to calculate the corre-sponding amount solute adsorbed, Qj+1, according to:
.S
01,R11 V
VVCCQQ jjj
jj (8)
Normally 20 30 adsorption isotherm data points are measured in this way, over a wide concentration range. Adsorption isotherm model parameters are then fitted to the data points as described below. A ten-step FA staircase chromatogram measured in paper IV is shown in Figure 2.

18
10 20 30 40 50 600
100
200
300
400
500
600
700
Retention time [min]
UV
res
pnse
[mA
U]
Figure 2. Staircase frontal chromatogram of propranolol on a C18 column. The propranolol concentration in the feed was increased from 0 to 0.75 mM in ten steps. The retention time of each front was used to calculate the adsorption isotherm of propranolol. Eluent 28/72 (v/v) ACN/sodium phosphate buffer (pH = 2.53, I = 0.10).
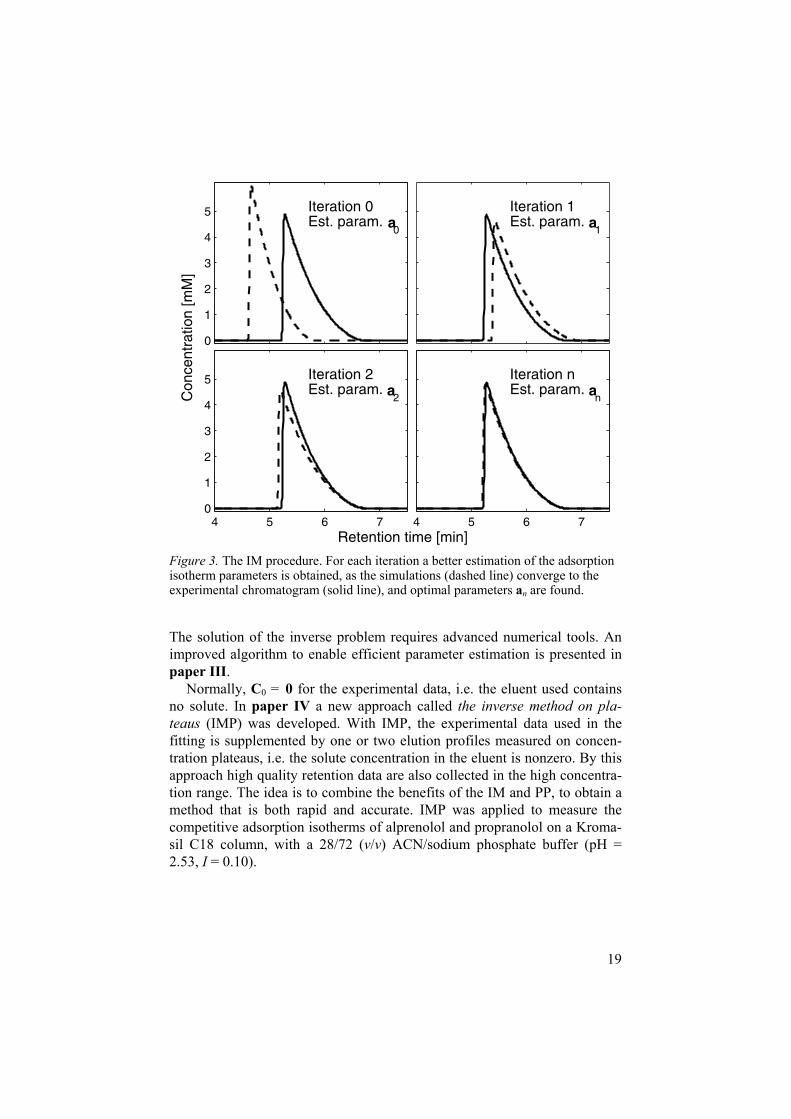
2.3.3 The inverse method With the inverse method, adsorption isotherm parameters are determined from overloaded elution profiles (peak shapes at sample overload are treated in section 2.4.1). The solute consumption and time requirements are modest compared to other methods. The adsorption isotherm cannot be obtained directly from this data (as opposed to the FA data). Instead the parameters, a,are estimated by solving the inverse partial differential equation problem: Elution profiles are simulated iteratively (by solving equation 3 numerically) and the parameters a are tuned by numerical optimization until the simulated and experimental profiles coincide in the least-square sense. This procedure is visualized in Figure 3, although somewhat simplified. Normally the IM is used to estimate multi-component adsorption isotherms and, normally, 2 4experimental profiles are used in the fitting.
19
0
1
2
3
4
5 Iteration 0Est. param.
0a
Con
cent
ratio
n [m
M]
Iteration 1Est. param.
1a
4 5 6 70
1
2
3
4
5 Iteration 2Est. param.
2a
Retention time [min]4 5 6 7
Iteration nEst. param.
na
Figure 3. The IM procedure. For each iteration a better estimation of the adsorption isotherm parameters is obtained, as the simulations (dashed line) converge to the experimental chromatogram (solid line), and optimal parameters an are found.
The solution of the inverse problem requires advanced numerical tools. An improved algorithm to enable efficient parameter estimation is presented in paper III.
Normally, C0 = 0 for the experimental data, i.e. the eluent used contains no solute. In paper IV a new approach called the inverse method on pla-teaus (IMP) was developed. With IMP, the experimental data used in the fitting is supplemented by one or two elution profiles measured on concen-tration plateaus, i.e. the solute concentration in the eluent is nonzero. By this approach high quality retention data are also collected in the high concentra-tion range. The idea is to combine the benefits of the IM and PP, to obtain a method that is both rapid and accurate. IMP was applied to measure the competitive adsorption isotherms of alprenolol and propranolol on a Kroma-sil C18 column, with a 28/72 (v/v) ACN/sodium phosphate buffer (pH = 2.53, I = 0.10).

20
2.3.4 Least-square fitting of model parameters In the methods mentioned above, adsorption isotherm model parameters, a,are fitted to different kinds of experimental data that in different ways relate to the adsorption isotherm. The objective function minimized differs from case to case, but in general it has the form:
d
1
2calcexp ,,n
kkkkkRSS app (9)
where RSS is the residual squared sum of the nd data points . The data points depend on general experimental parameters pk (such as eluent solute concentration) and adsorption isotherm parameters a. In the least-square fitting, the parameter vector a is sought that gives optimal agreement be-tween the experimental and calculated data points over the whole data range. A low RSS indicates a good fit, i.e. the obtained a mirrors the experi-mental observations well.
The objective functions in this study were minimized with respect to the adsorption isotherm parameters using the lsqnonlin routine in the MATLAB 7.0 software (MathWorks Inc, Natick, USA), which utilizes the Levenberg-Marquardt algorithm [57]. This algorithm finds only local optima, but by repeating the fitting with thousands of random initial guesses over the feasi-ble solution space, the global optimum was sought.
2.3.5 Model discrimination After fitting to several different adsorption isotherm models, a Fischer-test [37] is performed to decide which one is preferable from a statistical point of view. The models are compared in pairs by calculating the Fischer ratio:
.2
1
11,d
22,d
RSSRSS
pnpn
FR (10)
The FR is based on the RSS obtained and the number of data points, nd, used and the number of adsorption isotherm parameters, p, in the fitting with each model. The critical value (at a given significance level) for the FR can be found in a statistical F-table [58]. If the calculated ratio exceeds the critical value, then model 2 gives a significantly better fit than model 1.
When a model has been decided, the corresponding parameters are often tested by performing computer simulations. If the calculated elution profiles based on the fitted adsorption isotherm parameters overlap satisfactorily with experimental elution profiles, then the measured adsorption isotherm is re-garded as adequate.

21
2.4 Chromatographic properties and phenomena
2.4.1 Peak deformations In analytical LC, the sample concentrations are normally very low. Adsorp-tion isotherms are practically linear in this low-concentration range. This means that the adsorbed concentration is proportional to the concentration in the mobile phase. All molecules then migrate through the column, adsorb and desorb, independently of the other molecules, so each solute elutes as a Gaussian peak. The retention time of each peak depends on the initial slope of the corresponding adsorption isotherm. The peak shape deviates only little from the Gaussian ideal, but the chromatograms may become complex due to the multitude of solutes in the sample.
In preparative LC, where concentrations are generally much higher, the adsorption isotherm curvature and saturation capacity have an enormous impact on the peak shapes. Molecules in high concentration zones will spend relatively much time in the mobile phase due to the difficulty of finding free adsorption sites. Because of this overload, the sample zone becomes asym-metrical and elongated. For type I adsorption isotherms, the resulting peak is “fronting” (often called “Langmuirian”) and has a sharp front and a diffuse rear, see Figure 4. This effect usually sets in already at quite low concentra-tions for heterogeneous systems. Overloaded peaks corresponding to type IIIadsorption isotherms are “leading” (often called “anti-Langmuirian”) and have a diffuse front and sharp rear.
8 8.5 9 9.5 10 10.5 110
0.5
1
1.5
2
2.5
3
3.5
Con
cent
ratio
n [m
M]
Retention time [min]
Figure 4. Simulated chromatograms, corresponding to a type I adsorption isotherm, with five different sample concentrations. At low concentrations (linear conditions) the peaks are Gaussian. At higher concentrations (non-linear conditions) the peaks start fronting. The front sharpness increases and the retention time decreases as the injected concentration is increased, whereas the peak rear remains diffuse.

22
All real-life preparative LC systems are multi-component. Different solutes compete for the limited stationary phase surface so that strong band interfer-ence caused by mutual displacement is often observed [16]. Five simulations corresponding to different relative sample load of two-components is shown in Figure 5 to illustrate how complex the elution profiles may become.
12 16 200
0.5
1
1.5
2
2.5
3
3.5
4
Con
cent
ratio
n [m
M]
Retention time [min]
a
12 16 20
b
12 16 20
c
12 16 20
d
12 16 20
e
Figure 5. Illustration of typical competitive peak deformations in a binary chroma-togram. The simulations were done with the following relative concentrations of component 1 (solid line) and component 2 (dashed line) are (a) 4/1 (b) 4/2 (c) 4/4 (d) 2/4 and (e) 1/4.
2.4.2 Concentration plateaus perturbation and tracer peaks Most eluents used in LC are composed of solvents and buffer salts. These normally adsorb very little to the stationary phase. Adsorbing additives are sometimes used to shift the retention of all sample components. In situations where the eluent contains adsorbing solutes, there will always be a number of extra peaks in the chromatogram (provided that the detector is sensitive to at least one of the additives), independently of the sample injected. Such peaks are called perturbation or system peaks and originate from the pertur-bation of the adsorption equilibrium of the eluent solutes. If the eluent con-tains n adsorbing solutes, there will be n perturbation peaks [27] that possi-bly interfere with the sample peaks.
Since the retention times of the perturbation peaks are related to the ad-sorption isotherms of the system, perturbation experiments can be performed to measure adsorption isotherms. In the single component case, a single sol-ute is dissolved in the eluent and pumped through the column. When equilib-rium has been reached (a concentration plateau has been established), a per-

23
turbation injection is performed. The injected sample should be identical to the eluent, except that C C0. Assume that a small solute excess is injected, so that the system is subjected to a positive perturbation. The retention time of the resulting positive perturbation peak will be:
.10
0RCCdC
dqFtt (9)
It is assumed that the perturbation is very small, so that the deviation from the plateau concentration, C0, is negligible. The retention time is given by the tangential slope of the adsorption isotherm at coordinate (C0, q(C0)). The perturbation procedure is repeated at several plateau concentrations, and the adsorption isotherm can be calculated by fitting parameters to equation 9.
An interesting phenomenon is that the injected molecules are not found in the detected perturbation peak. The actual sample molecules have a higher (assuming a type I adsorption isotherm) retention time than the perturbation peak and elute at:
.10
0RCCC
qFtt (10)
This phenomenon, that the sample molecules and the perturbation peak have different velocities, was predicted already in 1963 [59] and was considered a paradox. To understand the phenomenon one must realize that injected sam-ple displaces plateau molecules, which in turn displace other plateau mole-cules, so that the perturbation propagates through the column like a wave, pushing new molecules in front. The observed perturbation peak is conse-quently composed of molecules that were in the system already before the injection. The sample molecules elute later as a so called tracer peak (or mass peak) together with a deficiency of plateau molecules. The tracer peak and the deficiency zone cancel, so normally only the perturbation peak is seen in the chromatogram. This fact that concentrations and molecules travel through the column at different velocities, is one of the most fascinating (and also most conceptually disturbing) phenomena encountered in chromatogra-phy. The phenomenon was studied and visualized very recently [60].

24
Figure 6. The picture shows the relationship between perturbation and tracer peaks and the adsorption isotherm. (a) Only the early eluting perturbation peak is normally observed, since the tracer peak (containing the injected molecules) and the plateau vacancy zone have combined elution and therefore cancel each other in the chroma-togram. (b) The retention times of the perturbation and tracer peaks are given by the slopes of the tangent and chord, respectively, of the adsorption isotherm at the con-centration studied (C0).
Also tracer peaks can be used for adsorption isotherm measurements, since the retention time (see equation 10) is related to the slope of the chord of the adsorption isotherm at coordinate (C0, q(C0)). The relation between perturba-tion and tracer peak retention times to the adsorption isotherm is illustrated in Figure 6.
The tracer peak is obviously impossible to detect unless the sample mole-cules are tagged somehow so that they are distinguishable from plateau molecules. Such a tag is difficult to accomplish without altering the adsorp-tive properties. The tracer sample can be isotopically labeled and detected by means of mass spectrometry or radiometric detection, or it can be a chiral isomer detectable by a polarimeter or other chiral detectors. The latter ap-proach was used recently [60] to study small perturbation and tracer peaks of methylmandelate on a C18 column with a MeOH/water eluent. In that study, the concentration plateau comprised of the methyl-(D)-mandelate (DM) and

25
the tracer sample was a small excess of methyl-(L)-mandelate (LM) added to DM-containing eluent.
The situation becomes much more complicated in the multi-component case, when n > 1 adsorbing solutes are added to the eluent. The retention time of the n perturbation peak will be [29] tR ,i = t0 i, where are the eigen-values of the matrix A:
,0CC
CqIA F (11)
where I is the unity matrix and q is the Jacobian, i.e. the matrix of partial derivatives ki cq / evaluated at plateau concentration C0. Perturbation peaks in multi-component systems cannot be identified, i.e. it is not possible to say which peak corresponds to which component. This is because the retention time of each peak is a result of the perturbation of all components, and each peak is constituted from plateau deviations of all n components. A complication has been that all perturbation peaks are not always detectable in multi-component systems: peaks tend to vanish at moderate to high pla-teau concentrations so the analysis cannot be performed over a sufficiently wide concentration range. Forssén et al recently provided a solution to this problem. By choosing appropriate perturbation sample compositions, all perturbation peaks become visible even at very high plateau concentrations [29-31]. The PP method was used in paper VI to measure binary adsorption isotherms of -blockers to Cel7a protein immobilized in a silica column.
In paper I the retention times of tracer peaks in multi-component systems were shown to be:
.10
0,RCC
C
i
ii C
qFtt (12)
The chiral tracer peak detection method [60] was extended to characterize a binary system with alprenolol and propranolol in a Kromasil C8 column, and a 28/72 (v/v) ACN / sodium phosphate buffer (pH = 2.54, I = 0.10). Two improvements were made to the methodology:
Instead of using enantiomer 1 in the eluent and enantiomer 2 as tracer sample, an inexpensive racemic mixture of both enantiomers was used in the eluent. The “flat-line chromatography” injection methodology developed in paper II was used: Only the chiral composition and not the total concentration in the sample differed from the plateau concentration. In this way the perturbation was minimized and the accuracy of the tracer data was improved.

26
The phenomenon and properties of perturbation and tracer peaks are consid-ered conceptually complicated. One of the aims of paper I was to visualize and explain these things in a comprehensive way.
2.4.3 Peak deformations on concentration plateaus Severe “non-Langmuirian” peak deformations can occur when strongly ad-sorbed additives are present in the eluent [61-66], even if all adsorption iso-therms are of type I. A rule of thumb has been developed [65, 66] that can be used to predict the peak shape of the injected sample under such conditions: If the initial slope of the solute adsorption isotherm is higher than the initial slope of the additive isotherm, then the solute peak will be Langmuirian (sharp front and diffuse rear). If the additive adsorption isotherm has the higher initial slope, three things can happen:
If the additive perturbation peak elutes before the solute peak, the solute peak will be anti-Langmuirian (diffuse front and sharp rear). If the additive perturbation peak elutes after the solute peak, the solute peak will be Langmuirian. If the additive perturbation peak and the solute peak elute close to each other, the solute peak will have both Langmuirian and anti-Langmuirian characteristics and may therefore be strangely de-formed.
In paper IV I showed that such peak behaviour can be encountered in mod-ern chiral LC systems. The separation of -blocker enantiomers on a Chiro-biotic T column (Advanced Technologies Inc., Whippany, USA) using a quaternary eluent (MeOH, ACN, acetic acid and triethylamine) was studied, and the effects of strongly adsorbed triethylamine was investigated. The adsorption isotherms of additive and -blocker enantiomers were estimated using the IM.
It has been believed that plateau-induced peak deformations can only oc-cur in multi-component systems. In paper II we investigated whether such deformations are possible also in single-component systems, where additive and injected molecules are identical. The chiral tracer peak detection method [60] was used to study the shapes of methylmandelate tracer peaks in a Kromasil C18 column at sample overload. The eluent used was a 35/65 (v/v)MeOH/water mixture spiked with DM and the samples were high-concentration LM dissolved in this eluent.

27
2.5 Characterization of chiral drug-protein interactions using the perturbation peak method (PP) and surface plasmon resonance (SPR) technology. One important application of adsorption isotherm determination is the char-acterization of interactions between drug molecules and proteins. The pro-tein under study is immobilized on a surface, the drug molecules are flowed over the surface and the binding is quantified. Chromatography can be used in such studies if the surface used is that of a LC stationary phase. Any of the methods mentioned in the previous section should be useable for such meas-urements.
In paper VI the PP method was used for the first time for characterization of chiral drug-protein interactions. The improved injection method devel-oped by Lindholm et al [29-31], enabling visualization of all perturbation peaks even at high concentrations, was used. Cel7a protein was immobilized in a narrow-bore (100 x 2 mm, 7 µm, 300 Å) Nukleosil diol silica HPLC column by sodium cyanoborohydride-mediated reductive amination [67], and the adsorption isotherms of alprenolol and propranolol enantiomers were measured by means of the PP method.
Optical biosensors based on surface plasmon resonance (SPR) are becom-ing popular tools for performing kinetic and affinity analyses of bio-molecules, for instance drug-protein interactions [68-72]. With SPR, adsorp-tion and desorption of sample molecules is monitored in real-time, as the detector is sensitive to changes in refractive index close to the sensor sur-face. A Biacore 2000 biosensor (Biacore AB, Uppsala, Sweden) was used for characterization of the same chiral drug-protein system as was studied with the PP method. This was the first SPR study with a focus on chiral as-pects of drug-protein systems. Firstly, Cel7a protein was immobilized on the CM5 sensor surface by PDEA-mediated thiol coupling [73]. Then, a wide range of concentrations of alprenolol and propranolol enantiomers were in-jected and the adsorption isotherms measured. In this study (paper VI) the PP method was compared to SPR biosensor analysis and the fundamental properties of the two methods and the results obtained were compared.

28
3 Results and Discussion (Summary of papers)
This section is intended to give a very brief overview of the results obtained. For more detailed results and discussion, see papers I-VI.
3.1 Paper I The tracer-pulse method was extended and validated for the determination of multi-component adsorption isotherm in LC. The C8 column was equili-brated with an eluent containing racemic alprenolol and propranolol (D and L) and the tracer sample contained (D)-alprenolol and (D)-propranolol. The tracer peaks were detected by measuring the chiral composition of the efflu-ent. This was achieved by injecting effluent fractions into a chiral selective LC system with a Chirobiotic T column. This off-line methodology of tracer peak detection is quite inconvenient in practice; 20 40 fractions have to be analyzed for each adsorption isotherm data point, and 20 30 data points are typically needed in the parameter fitting for good statistics. This somewhat tedious procedure could be used in this proof-of-concept study, but it is not suitable for routine work. It is then strongly suggested to instead use an on-line detector such as a polarimeter or a mass spectrometer. If such equipment and suitable tracers are available, this method is very advantageous; multi-component adsorption isotherm measurement becomes trivial.
The tracer samples were composed in such a way that there should be no equilibrium perturbation, i.e. the analysis was preformed under “flat-line” conditions. Small perturbation peaks were however always visible in the chromatograms measured by UV. In Figure 7 are three perturbation and tracer peak chromatograms, corresponding to different plateau concentra-tions, shown. This figure shows that the injected molecules (tracer mole-cules) indeed elute after the peaks seen on UV.

29
10 11 120
0.1
0.2
0.3
UV
res
pons
e [m
AU
]
8 9 10
5
10
15
Retention time [min]4.5 5 5.5 6
100
200
300
400
500Perturbationpeaks
Propr.tracerpeak
Alpr.tracerpeak
Figure 7. Perturbation and tracer peaks measured on three binary concentration plateaus: (a) 8.0 M, (b) 0.40 mM and (c) 8.0 mM propranolol and alprenolol. Only the perturbation peaks were directly visible; the tracer peaks were detected by a chiral analysis. The UV signals showing the perturbation peaks have been amplified and transposed for visual clarity.
The retention times of perturbation and tracer peaks at 30 concentration pla-teaus ranging from 2.4 M to 9.5 mM of both -blockers are shown in Fig-ure 8. At infinitely low plateau concentration the propranolol and alprenolol tracer peaks co-elute completely with the first and the second perturbation peak respectively. The four peaks separate as the plateau concentration is increased, but eventually converge towards t0 at very high plateaus.
0 1 2 3 4 5 6 7 8 9
5
6
7
8
9
10
11
12
C, mob. phase conc. [mM]
Ret
entio
n tim
e [m
in]
Figure 8. Retention times of perturbation peaks (+), alprenolol ( ) and propranolol (o) tracer peaks as a function of the plateau concentration. The lines correspond to the adsorption isotherm parameters measured by the tracer-pulse method.

30
Tracer-pulse retention times were measured at 40 binary concentration pla-teaus with 1/1, 1/3 and 3/1 concentration ratios and the data were fitted to the bi-Langmuir adsorption isotherm model. Single component frontal analysis was performed, with good parametric agreement. The competitive adsorp-tion isotherms measured by the tracer-pulse method and the single compo-nent ones measured by frontal analysis are plotted and compared in Figure9.
Figure 9. Comparison of bi-Langmuir adsorption isotherms determined by the TP (surfaces) and FA (bold lines) methods for (a) alprenolol and (b) propranolol. The symbols are the data points used in the fitting.
Computer simulations were finally performed based on the bi-Langmuir parameters obtained with the tracer-pulse method. Excellent agreement be-tween experimental and simulated elution profiles was observed (Figure10), showing that the adsorption isotherms correctly describe the system.

31
8 10 12
0
0.2
0.4
0.6
0.8
1 aC
once
ntra
tion
[mM
]
8 10 12
b
Retention time [min]8 10 12
c
Figure 10. Simulated (lines) and experimental (symbols) elution profiles of pro-pranolol (o) and alprenolol (*). The simulations are based on bi-Langmuir adsorp-tion isotherm parameters determined by the tracer-pulse method. 50 µL injections of (a) 9mM propranolol and 9 mM alprenolol, (b) 3 mM propranolol and 9 mM alpre-nolol, (c) 9 mM propranolol and 3 mM alprenolol mixtures.
3.2 Paper II A new type of peak deformations, previously unreported, were discovered when the shapes of tracer peaks at sample overload were studied in a single-component system using the off-line chiral tracer peak detection method. A C18 column was equilibrated with an eluent containing methyl-(D)-mandelate (DM), and tracer samples were methyl-(L)-mandelate (LM) dis-solved in the DM-containing eluent. The LM concentration was very high, yielding a fronting (Langmuirian) perturbation peak visible on UV. The chiral composition of the effluent was analyzed by injecting fractions into a chiral LC system with a CHIRAL-AGP column. A more systematic study of overloaded tracer peaks was performed by means of computer simulations.
Whereas the perturbation peak was always Langmuirian, the tracer peak could be strongly distorted. Similar peak distortions have been reported in multi-component systems [61-66], but in the present study they were shown to occur also in single-component systems. Figure 11 shows simulations of large perturbation and tracer peaks for different plateau concentrations and sample sizes.

32
Figure 11. Simulations of large perturbation (dashed-dotted lines) and tracer (solid lines) peaks at plateau concentrations (a) 5, (b) 15, (c) 25 and (d) 100 mM DM. The injected (50 L) samples were 50, 100, 250, 500 and 750 mM LM on each plateau.
The tracer profiles are smoother than the corresponding perturbation pro-files, since the tracer molecules separate from the self-sharpening perturba-tion zone and are more subjected to dispersion. Tracer peaks that predomi-nately co-elute with the perturbation peak are Langmuirian, whereas re-solved tracer peaks are anti-Langmuirian. Tracer peaks only partially sepa-rated from the perturbation peak can be strongly distorted. At injection the tracer zone is initially Langmuirian, but as it separates from the perturbation zone it is gradually inverted to an anti-Langmuirian shape, a transition proc-ess that terminates at the column outlet. The shape of the tracer elution pro-file therefore depends on the degree of separation, which in turn depends on the plateau concentration, the sample load and the column length.
Finally, we showed that for tracer samples injected without causing a per-turbation (i.e. the sample concentration is equal to the plateau concentration) the tracer peak will always be Gaussian, see Figure 12. Tracer samples in-

33
jected under “flat-line” conditions (i.e. no visible peaks) always result in well-defined tracer peak retention times, which is important when doing adsorption isotherm measurements with the tracer-pulse method.
19
20
21
0
2
4
Con
cent
ratio
n [m
M]
b
a
11.6 11.7 11.8 11.9 12 12.1 12.20
2
4
Retention time [min.]
c
Figure 12. Tracer injection without causing any perturbation: (a) the signal of a standard detector – a “flat-line” chromatogram, (b) simulated tracer peaks and (c) experimentally measured tracer peaks. The plateau concentration was 20 mM DM and the samples were 10 mM DM + 10 mM LM (dashed-dotted lines), 5 mM DM + 15 mM LM (dashed lines) and 0 mM DM + 20 mM LM (solid lines).
3.3 Paper III This paper describes an improved algorithm for solving the inverse partial differential equation (PDE) problem of non-linear chromatography, which is needed when using the IM for adsorption isotherm parameter estimation. Four basic parts of the solver were attributed:
Faster simulation. The partial differential equation solver routine is cen-tral in the algorithm, since most CPU time is spent there. In the original Rouchon method [43] C(x, t) is evaluated at approximately N2 (N is typi-cally 3000 20000) symmetrically spaced grid points over the whole (xt)-space, i.e. over [0 … L] × [0 … tmax]. However, the solution is restricted to a small subspace, so a majority of the evaluations are unnecessary. By identifying this subspace and performing the calculations there exclu-sively, the calculation time can be reduced dramatically. We used a grid refinement methodology: Equation 3 was first solved over the whole (xt)-space, but with a very sparse grid by temporarily assuming very low col-umn efficiency, N = 500. This resulted in a very quick but inaccurate so-

34
lution. From this solution, approximate boundaries of the subspace of in-terest could be identified. Using these boundaries, equation 3 was then quickly and accurately solved on a dense grid with the correct value of N.The calculation time was decreased dramatically by this modification. Others [74, 75] have reduced calculation times by identification of the non-zero subspace, but they used inner loop conditional statements which slow down the calculation. Accurate estimation of the Jacobian. In order to find successively better estimates of the adsorption isotherm parameters in each iteration, the Jacobian of the objective function with respect to the adsorption isotherm parameters must be calculated by the optimization routine. Here we esti-mated the Jacobian by numerical differentiation of complex variables, which is both very accurate and easily implemented. Without a very accu-rate estimation of the Jacobian the algorithm cannot converge properly. Simplified procedures for detector response conversion. The experimental elution profiles are measured by a detector and the response is a nonlinear function of the individual component concentrations. In the present study the simulated concentration profiles were translated into a detector re-sponse sum by the use of detector calibration curves. This procedure is of-ten much easier than the opposite, i.e. to translate the response sum of the experimental elution profiles into individual concentrations. Faster model screening. An appropriate adsorption isotherm model must be chosen to obtain acceptable profile agreement [35]. Consequently sev-eral models of increasing complexity must be tested. In the present study we suggested the exploitation of previous model fits. Parameter fitting re-sults corresponding to a simple model, such as the Langmuir model can be used as a good starting guess for more complex models and thus save initial iterations.
The inverse solver was tested on both experimental and synthetic data, and it proved to deliver accurate adsorption isotherm parameter estimates. Conver-gence time could be quite long (depending on stop criteria). In one applica-tion it was 16 hours, which is usually not a problem since computers are more easily convinced to work overnight than are analytical chemists. Tradi-tional methods for adsorption isotherm measurement, such as FA, are much more labour intensive.
3.4 Paper IV The accuracy of the IM is generally limited by the maximum eluted concen-tration of the experimental chromatograms used in the fitting [37]. In previ-ous studies, very large injection volumes, typically 15% of the column vol-

35
ume, have been used in order to obtain high-concentration elution profiles and, thereby, adsorption isotherms valid over a wide concentration range. In the present study I instead used concentration plateaus to reach the high-concentration region, see Figure 13. If the sample volume is small (2% of the column volume), the overloaded perturbation peaks will be resolved and reveal further properties of the adsorption isotherms. The peak shapes, reten-tion time shifts and the degree of peak vanishing [29] are unique attributes of the adsorption isotherms and should intuitively be useful “identification tags” of the model parameters. This approach is called the inverse method on plateaus (IMP).
10 15 200
2
4
6
8
10
Retention time [min]
Con
c. (
corr
ecte
d) [m
M]
a
10 15 20
b
Figure 13. Simulated example of binary elution profiles which can be used with (a) IMP and (b) the original IM. The sample concentration is the same in all simula-tions, but the injected volume is 11.8 times larger in (b). The thick line is the sum of components and the thin lines are the individual profiles.
Competitive adsorption isotherms of propranolol and alprenolol on a C18 column were estimated using the IM and IMP. FA was used as a reference. My results indicated that the IMP approach can yield highly accurate results. The L2 errors obtained for the IM and IMP were calculated according to:
,,0,0,1
2L 21
2FA,method,
CiCidC
dCqqi
ii
i
i (13)
where C1 and C2 are the maximum eluted concentrations of alprenolol and propranolol respectively, corresponding to the two methods. By studying the

36
L2-errors for different i, one can compare the method accuracies at different multitudes of 1, i.e. different multitudes of the maximum eluted concentra-tions. L2-errors for i =1, 2, and 3 are shown in Table 1.
Table 1. Calculated L2-errors for adsorption isotherms over different concentration ranges
i L2-error (mM)
IM IMP Alprenolol Propranolol Alprenolol Propranolol 1 35 41 19 41 2 32 36 9 31 3 23 28 9 27
The use of plateau data increases the accuracy of estimated adsorption iso-therms. A large amount of solute is needed to establish plateaus, so IMP is more expensive to use than IM. IMP is therefore recommended only in situa-tions where high accuracy is required, for instance in column characteriza-tions and drug-protein binding studies, whereas IM is clearly sufficient when the adsorption isotherm parameters are to be used for process optimization.
3.4 Paper V Modern chiral stationary phases for LC are often used with eluents compris-ing an organic main solvent and a polar additive. In the present study I showed that the common extreme enantiomer peak distortions may be caused by the additive component. I characterized the separation of the enan-tiomers of alprenolol, propranolol and atenolol on a teicoplanin stationary phase (Chirobiotic T) using MeOH/ACN eluents with TEA/HOAc additives. A very interesting peak behaviour was observed in this system. In Figure 14the elution profiles obtained when using a MeOH/ACN/HOAc/TEA 67.3/32.5/0.15/0.05 (v/v/v/v) are shown. Both alprenolol peaks are anti-Langmuirian, the two propranolol peaks are anti-Langmuirian and Lang-muirian respectively, and both atenolol peaks are Langmuirian. We call the state observed in the propranolol case “opposite tailing”. This state, with centred sharp sides, is very advantageous, since baseline resolution may be achieved at higher sample loads than are possible when the peaks tail in the same direction.

37
10 12 140
0.5
1
1.5C
once
ntra
tion
[mM
]a
12 13 14 15 160
0.5
1
1.5
Retention time [min.]
b
16 18 20 220
0.25
0.5
0.75 c
Figure 14. Separation of 50 L 50 mM (a) alprenolol, (b) propranolol and (c) at-enolol enantiomers on a Chirobiotic T column under identical experimental condi-tions. Eluent MeOH/ACN/HOAc/TEA 67.3/32.5/0.15/0.05 (v/v/v/v).
The non-Langmuirian behaviour was shown to be caused by strong adsorp-tion of the TEA additive. The peak deformations could be tuned by changes of the MeOH/ACN ratio. Figure 15 shows how the retention factors and peak symmetries vary with this ratio. The peak symmetries were calculated by the Agilent 1100 Chemstation evaluation software, using a pseudo-moment analysis. A peak is Langmuirian when the symmetry is below unity, and anti-Langmuirian when exceeding unity. For symmetry values near unity the peak is near-symmetrical although not necessarily Gaussian. Al-prenolol and propranolol shapes could be extensively tuned. Opposite tailing was possible in both cases. For atenolol, however, Langmuirian profiles were obtained regardless off the MeOH/ACN ratio in the eluent.

38
0 20 40 60 80 100
2.5
5
10
25
50a
Cap
acity
rat
io, k
p
0 25 50 75 100
1
2
3
4
5
6b
Sym
met
ry fa
ctor
25 50 75X% Acn in eluent
c
0 25 50 75 100
d
Figure 15. (a) Capacity ratios and (b-d) symmetry factors of alprenolol (+), pro-pranolol (o) and atenolol (x). Eluent: MeOH/ACN/HOAc/TEA 100-X/X/0.15/0.05. Sample (50 µL) concentrations were (a) 0.1 mM and (b-d) 5 mM. The solid lines are the S-enantiomers, dashed lines the R-enantiomers. Eluent compositions giving rise to opposite tailing are highlighted in grey.
Adsorption isotherms were determined using the inverse method No other method could be used due to the system complexity. Bi-Langmuir parame-ters for all solutes and the additive were simultaneously fitted to alprenolol, propranolol and atenolol profiles. A very good model agreement was found, as shown in Figure 16a-c. The fitted parameters could also be used to pre-dict elution profiles at very high overload (Figure 16c). Judging from the parameters obtained, the initial slope of the TEA adsorption isotherm was higher than for the alprenolol enantiomers, lower than for the atenolol enan-tiomers, and in between those of the propranolol enantiomers. The observed non-Langmuirian peak behaviour is therefore in perfect agreement with the rule of thumb (section 2.4.3) with this eluent composition. The deformation tuneability by MeOH/ACN ratio changes probably reflects that the -blockers are more strongly affected than TEA by such polarity changes in the mobile phase, so that the initial slopes of the -blocker adsorption iso-therms shift in relation to that of TEA.

39
10 11 12 13 14
Res
pons
e (n
orm
.)a
13 14 15 16
b
16 18 20 22
Retention time [min.]
c
11 12 13 14 15 16
d
Figure 16. Overlay of experimental (symbols) and simulations (lines) of 50 µL 25 and 50 mM (a) alprenolol, (b) propranolol and (c) atenolol, obtained with the IM. The adsorption isotherm parameters could be used to predict extreme band deforma-tions (d) of propranolol corresponding to a 50 µL 100 mM and a 500 µL 25 mM injection. Eluent MeOH/ACN/HOAc/TEA 67.3/32.5/0.15/0.05 (v/v/v/v).
3.6 Paper VI One of the plateau methods described above, the PP method, was applied to perform a detailed characterization of chiral drug-protein interactions. The method is very practical since analysis can performed on racemic mixtures. This is also very economical since pure enantiomers are generally more ex-pensive or hard to get. Measurements were also done with an SPR biosensor, a relatively new technique with many interesting applications in bioscience. The fundamental properties of the methods were compared and the conse-quences for operation and data analysis discussed.
With SPR the enantiomeric forms had to be injected and analyzed sepa-rately, since it is impossible to resolve the individual contributions of a mix-ture; analysis on racemic mixtures was shown to produce misleading results. On the other hand, much less solute and protein was required with SPR.

40
One conclusion was that the lowest attainable concentration to be used in the measurements was limited by the LOQ (limit of quantification) with SPR and by the LOD (limit of detection) with the PP method. This is because, with SPR, the steady-state signal of each analysis must be quantified, whereas it is sufficient to measure the retention time of peaks in the PP method without quantifying the peak areas. A general guideline was given that HPLC measurements are preferable at relatively weak drug-protein in-teractions, whereas SPR is best suited for stronger affinities. This is because with the PP method the solute consumption and analysis cycle time increase with affinity, whereas stronger signals and lower LOQs are obtained with SPR.
The binding of alprenolol and propranolol enantiomers to the Tricho-derma reesei Cel7a protein was studied at pH 4.5, 6.0 and 7.5. Measure-ments at the highest pH were performed with SPR only, since the retention was too strong with LC and the column stability uncertain. Adsorption iso-therm measurements with the two methods yielded a good qualitative para-metric agreement, but some quantitative deviations were also seen. The en-antioselective site was found to be strongly affected by pH, in accordance with previous studies [50, 76] of this drug-protein system.
Dimethylsulfoxide (DMSO) is very often added to several volumetric percent in bioassays if the analyte solubility is too low in water, but the ef-fect of DMSO is seldom considered. The -blockers used in this study are well soluble, and could therefore be analyzed both in the presence (5%) and in the absence of DMSO in the eluent. Both LC and SPR measurements showed clearly that the binding decreased considerably, especially for the enantioselective sites, when DMSO was used. Although DMSO is only slightly less polar than water, it obviously has higher eluent strength and should therefore, where possible, be avoided in bioassays.
41
4 Concluding remarks
Although LC has been around for more than 100 years a tremendous scien-tific effort is still being devoted to understanding and developing it further, always aiming at better and better separations. In this thesis, I have devel-oped some new methods for measurement of multi-component adsorption isotherms (paper I, III IV), which may prove useful in future system char-acterizations and optimizations. The PP method which, however, was not developed in the present study, was used in paper VI to investigate how modern LC methods can be utilized to gain detailed information about chiral drug-protein interactions. The PP method was compared to a fundamentally different analytical technique based on SPR, which is becoming the domi-nant methodology for such binding studies. It was concluded that the PP method is preferable at relatively weak drug-protein interactions, whereas SPR is best suited for stronger affinities. The LC methods were also used to study and visualize previously unknown or poorly understood chroma-tographic phenomena, such as the Helfferich paradox (i.e. that the visible peaks do not always contain the injected molecules) in the multi-component case (paper I), deformations of tracer peaks at sample overload (paper II),and the effect of strongly adsorbed additives on peak shapes in modern chiral LC systems (paper V).
My thesis provides new tools for rapid and accurate adsorption isotherm determination, complementing old methods used for multi-component LC characterization. It is also a contribution to the general understanding of LC, explaining complex phenomena that may not always be crucial for the regu-lar practitioner, but are nonetheless important parts of the whole.

42
5 Acknowledgements
I have a lot of people to acknowledge for their support during these past five years working on my thesis, and I would like to express my sincere gratitude to:
My supervisor associate professor Torgny Fornstedt inspiration and scien-tific counsel.
Head of Department Professor Karin Caldwell, also for inspiration and sci-entific counsel.
My co-authors Patrik Forssén, Jörgen Samuelsson and Natalia Ferraz for your contributions to my thesis.
All colleagues and friends at the department of physical and analytical chem-istry for long, frequent and enjoyable coffee breaks.
Friends, family and relatives for filling my life with other things than just chromatography.

43
6 Swedish summary
Utveckling och validering av metoder för karaktärisering av flerkomponentsystem vid preparativ vätskekromatografiKromatografi är en separationsmetod som används flitigt såväl inom kemisk analys som för renframställning av kemikalier och läkemedel. Metoden byg-ger på att olika molekyler fördelar sig på olika sätt mellan två faser, där den ena fasen rör sig i förhållande till den andra. Den stillastående (stationära) fasen består vanligtvis av finporösa, sfäriska, partiklar, nedpackade i ett cy-lindriskt rör (kolonn). Den rörliga (mobila) fasen är en vätska, en gas, eller ett mellanting av dessa, en s. k. överkritisk vätska. För den vanligaste kate-gorin, vätskekromatografi, används vanliga vätskor, allt ifrån vatten till or-ganiska lösningsmedel såsom metanol och hexan. Provet injiceras och pum-pas tillsammans med mobilfasen genom kolonnen och provets molekyler interagerar med stationärfasen. Komponenter med stor benägenhet att binda till stationärfasen bromsas i förhållande till molekyler som föredrar att förde-la sig till mobilfasen. Det tar därför olika lång tid att spola igenom olika typer av molekyler. På så vis kan man separera olika komponenter från oer-hört komplexa blandningar. En dator registrerar via en detektor hur de sepa-rerade molekylerna flödar ut ur kolonnen. Ett diagram som visar hur detek-torsignalen varierar med tiden, dvs. hur provkomponenterna eluerar som toppar, kallas kromatogram. Om topparna i kromatogrammet är väl skilda är separationen lyckad.
Vätskekromatografi används för både analytiska och preparativa ändamål. I det analytiska fallet är man ute efter kvantitativ information om provets innehåll (kemisk analys), medan man i det preparativa fallet vill renframstäl-la stora mängder av en viss substans. Denna doktorsavhandling fokuserar på olika frågeställningar inom preparativ vätskekromatografi.
För att få hög produktivitet vid preparativ kromatografi, måste man ladda kolonnen med mycket stora provmängder. Eftersom den stationära fasens yta är begränsad, får provkomponenterna konkurrera med varandra om bind-ningsplatser under separationsförloppet. Konkurrensen leder ofta till att kromatogrammets toppar blir deformerade och ofullständigt upplösta, vilket försvårar optimering av separationen. Figur 17 visar hur de kromatografiska

44
topparna kan se ut vid preparativ separation; figuren illustrerar problemati-ken med att samla upp rena fraktioner.
10 15 20 250
0.2
0.4
0.6
0.8
1
Retentionstid [min.]
Kon
cent
ratio
n [m
M]
Ren enantiomer 1Ren enantiomer 2
Blandzon
Figur 17. Typiskt kromatogram vid preparativ separation av två enantiomerer från en blandning. Den heldragna linjen visar elutionsprofilen för enantiomer 1, den streckade linjen visar elutionsprofilen för enantiomer 2. De färgade områdena visar var de fullständigt rena komponenterna återfinns.
Adsorptionsisotermer beskriver hur ämnen fördelas mellan mobil- och stationärfaser (vid konstant temperatur), och hur de olika ämnena konkurre-rar med varandra. Om adsorptionsisotermerna kan mätas, får man god kän-nedom om systemets beteende under olika förhållanden, såsom hur ämnena konkurrerar med varandra vid olika koncentrationskombinationer. Det blir då möjligt att utföra datorsimuleringar av separationsprocessen, vilket för-enklar processoptimering, uppskalning samt anpassning till moderna, konti-nuerliga, kromatografiska uppställningar som blir allt vanligare inom indu-strin. Dessutom ger adsorptionsisotermerna information om bindningen som sådan, t. ex. hur många och hur starka bindningsställen som finns. Det sist-nämda är av stort intresse för tillverkare av kromatografikolonner och för forskare som vill mäta interaktioner mellan t. ex. proteiner och läkemedel.
Det finns idag ett fåtal metoder som kan användas för att mäta adsorp-tionsisotermer. De brottas dock alla med olika begränsningar;.de är tidskrä-vande, komplicerade, kräver stora mängder substans, har begränsad nog-grannhet, eller är svåra / omöjliga att tillämpa på flerkomponentsystem. Den sista begränsningen är ytterst allvarlig eftersom den innebär att man måste analysera olika substanser var och en för sig, så att man måste ha tillgång till stora mängder redan renframställda komponenter.
I denna avhandling utvecklas och valideras metoder som är mycket lämp-liga för att karaktärisera flerkomponentsystem. Dessa kallas inversa meto-

45
den, inversa metoden på platå samt tracer-pulsmetoden, och är alla vidare-utveckling av redan existerande metoder.
Metoderna används för att karaktärisera avancerade kromatografiska sy-stem och för att studera komplicerade fenomen. I avhandlingen visas bland annat att vissa deformerade kromatogram som man råkar ut för vid separa-tion av spegelbildsmolekyler (enantiomerer) kan förklaras av störande ad-sorberande tillsatsämnen i mobilfasen. Jag visar att det i vissa fall är möjligt att styra deformationerna till en mycket fördelaktig situation, vilket utgör en helt ny optimeringsmetodik. Vidare studerar och visualiserar jag olika aspek-ter av Helfferich-paradoxen, vilken säger att de injicerade molekylerna inte alltid återfinns i kromatogrammets synliga toppar. Bland annat har jag för första gången undersökt hur de ”osynliga” topparna deformeras under olika experimentella betingelser. I de olika delarbetena utförs både omfattande experimentella försök och systematiska datorsimuleringar för att undersöka de olika fenomenen.
Avslutningsvis utförs en jämförande studie mellan en kromatografiskt ba-serad metod, störningstoppsmetoden, och en ytplasmonresonans-baserad biosensor (Biacore). Båda metoderna används för att utföra en detaljerad karaktärisering av interaktioner mellan proteiner och läkemedelsmolekyler med spegelbildsegenskaper. Metoderna gav ganska väl överensstämmande resultat. En av slutsatserna, baserad på en analys av metodernas fundamenta-la skillnader, var att kromatografibaserade metoder är mest lämpade då rela-tivt svaga bindningsenergier föreligger, medan biosensorn är att föredra då läkemedlets inbindning till proteinet är stark. En stor fördel med störnig-stoppsmetoden är att man kan analysera flerkomponents-blandningar, medan man måste analysera komponenterna var och en för sig med biosensorn.

46
7 Reference list
1. M.S. Tswett, T. Protok, Otd. Biol., 14 (1905) 20. 2. J.N. Wilson, J. Am. Chem. Soc., 62 (1940) 1583.3. D. DeVault, J. Am. Chem. Soc., 65 (1943) 532.4. E. Glueckauf, J. Chem. Soc.,(1947) 1302.5. A.J.P. Martin, R.L.M Synge, Biochem. J., 35 (1941) 1358.6. J.C. Giddings, Dynamics of chromatograph, part I: Principles and theory
(Chromatographic science series, Vol I), Marcel Dekker, New York, USA, 1965.7. G. Cancelliere, I. D’Acquarica, F. Gasparrini, M. Maggini, D. Misiti, C. Villani,
J. Sep. Sci., 29 (2006) 770.8. S.A.C. Wren, P. Tchelitcheff, J. Chromatogr. A, 1119 (2006) 140.9. D. Ishii, Introduction to Microscale High-Performance Liquid Chromatogra-
phy, VCH, New York, USA, 1988.10. Y. Saito, K. Jinno, T. Greibrokk, J. Sep. Sci., 27 (2004) 1379.11. N. Tanaka, H. Kobayashi, K. Nakanishi, H. Minakuchi, N. Ishizuka, Anal.
Chem., 71 (2001) A420. 12. R.S. Plumb, P. Rainville, B.W. Smith, K.A. Johnson, J. Castro-Perez, I.D. Wil-
son, J.K. Nicholson, Anal. Chem., 78 (2006) 7278.13. J.J. Kirkland, J.B. Adams, M.A. van Straten, H.A. Claessens, Anal. Chem., 70
(1998) 4344.14. L. Ma, H. Luo, J. Dai, P.W. Carr, J. Chromatogr. A, 1114 (2006) 21.15. F. Helfferich, G. Klein, Multicomponent chromatography (Chromatographic
science series, Vol 4), Marcel Dekker, New York, USA, 1970. 16. G. Guiochon, A. Felinger, D.G. Shirazi, A.K. Katti, Fundamentals of Prepara-
tive and Nonlinear Chromatography, 2nd ed., Elsevier Inc., San Diego, CA, USA, 2006.
17. K. Mihlbachler, K. Kaczmarski, A. Seidel-Morgenstern, G. Guiochon, J. Chro-matogr A, 955(2002) 35.
18. F. Gritti, G. Guiochon, J. Chromatogr. A, 1099 (2005) 1.19. C. Migliorini, M. Mazzotti, M. Morbidelli, J. Chromatogr. A, 827 (1998) 161.20. C. Heuer, E. Küsters, T. Plattner, A. Seidel-Morgenstern, J. Chromatogr. A, 827
(1998) 175.21. C.M. Grill, L. Miller, J. Chromatogr. A, 827 (1998) 359.22. I. Quiñones, C.M. Grill, L. Miller, G. Guiochon, J. Chromatogr. A, 867 (2000)
1.23. A. Tiselius, S. Claeson, Arkiv Kemi Mineral. Geol., 16a (1943) 18.24. D.H. James, C.S.G. Phillips, J. Chem. Soc., (1954) 1066.25. G. Götmar, Heterogeneous adsorption in chiral LC, Ph.D. thesis, Uppsala Uni-
versity, Sweden, 2002.26. O. Lisec, P. Hugo, A. Seidel-Morgenstern, J. Chromatogr. A, 908 (2001) 19.27. S.G. Shirazi, G. Guiochon, Anal. Chem., 62 (1990) 923.28. C. Blümel, P. Hugo, A. Seidel-Morgenstern, J. Chromatogr. A, 865 (1999) 51.29. P. Forssén, J. Lindholm, T. Fornstedt, J. Chromatogr. A, 991 (2003) 31.
47
30. J. Lindholm, P. Forssén, T. Fornstedt, Anal. Chem., 76 (2004) 4856.31. J. Lindholm, P. Forssén, T. Fornstedt, Anal. Chem., 76 (2004) 5472.32. E. Glueckauf, Trans. Faraday Soc., 51 (1955) 1540.33. L. Ravald, T. Fornstedt, J. Chromatogr. A, 908 (2001) 111.34. E.V. Dose, S. Jacobson, G. Guiochon, Anal. Chem., 63 (1991) 833.35. F. James, M. Sepulveda, F. Charton, I. Quiñones, G. Guiochon, Chem. Eng.
Sci., 54 (1999) 1677.36. L. Zhang, J. Selker, A. Qu, A. Velayudhan, J. Chromatogr. A, 934 (2001) 13.37. A. Felinger, A. Cavazzini, G. Guiochon, J. Chromatogr. A, 986 (2003) 207.38. A.W.J. De Jong, J.C. Kraak, H. Poppe, F. Nooitgedacht, J. Chromatogr., 193
(1980) 181.39. M. Petkovska, A. Seidel-Morgenstern, Chem. Eng. Comm., 192 (2005) 1300.40. L.R Snyder, “Principles of adsorption chromatography”, Marcel Dekker, New
York, 1968.41. R.P.W. Scott, P. Kucera, Anal. Chem., 45 (1973) 749.42. C. Horvath, W. Melander, I. Molnár, J. Chromatogr., 125 (1976) 129.43. P. Rouchon, M. Schonauer, P. Valentin, G. Guiochon, Separation. Sci., 22
(1987) 1793.44. K. Kaczmarski, M. Mazzotti, G. Storti, M. Morbidelli, Comput. Chem. Eng., 21
(1997) 641.45. IUPAC, Pure & Appl. Chem., 57 (1985) 603.46. I. Langmuir, J. Am. Chem. Soc., 38 (1916) 2221.47. D. Graham, J. Phys. Chem., 57 (1953) 665.48. I. Quiñones, A. Cavazzini, G. Guiochon, J. Chromatogr. A, 877 (2000) 1.49. S. Jacobson, S. Golshan-Shirazi, G. Guiochon, J. Am. Chem. Soc., 112 (1990),
6492.50. T. Fornstedt, G. Götmar, M. Anderson, G. Guiochon, J. Am. Chem. Soc., 121
(1999) 1164.51. I. Quiñones, G. Guiochon, J. Chromatogr. A, 796 (1998) 15.52. P. Szabelski, K. Kaczmarski, J. Chromatogr. A, 1113 (2006) 74.53. M. Moreau, P. Valentin, C. Vidal-Madjar, B. Lin, G. Guiochon, J. Colloid In-
terf, Sci., 141 (1991) 127.54. S. Brunauer, P. H. Emmet, J. Teller, J. Am. Chem. Soc., 60 (1938) 309.55. J. Stahlberg, M. Almgren, Anal. Chem., 61 (1989) 1109.56. A. Seidel-Morgenstern, J. Chromatogr. A, 1037 (2004) 255.57. D. Marquardt, SIAM J. Appl. Math., 11 (1963) 431.58. J. C. Miller, J. N. Miller, Statistics for analytical chemistry, 3rd Ed., Ellis Hor-
wood Ltd, 1993.59. F. Helfferich, D.L. Peterson, Science, 142 (1963) 661.60. J. Samuelsson, P. Forssén, M. Stefansson, T. Fornstedt, Anal. Chem., 76 (2004)
953.61. S. G. Shirazi, G. Guiochon, J. Chromatogr. A, 461 (1989) 1.62. S. G. Shirazi, G. Guiochon, J. Chromatogr. A, 461 (1989) 19.63. S. G. Shirazi, G. Guiochon, Anal. Chem., 61 (1989) 2373.64. S. G. Shirazi, G. Guiochon, Anal. Chem., 61 (1989) 2380.65. T. Fornstedt, G. Guiochon, Anal. Chem., 66 (1994) 2116.66. T. Fornstedt, G. Guiochon, Anal. Chem., 66 (1994) 2686.67. A. Nyström, A. Strandberg, A. Aspegren, S. Behr, A. Karlsson, Chromato-
graphia, 50 (1999) 209.68. R. L. Rich, Y. S. N. Day, T. A. Morton, D. G. Myszka, Anal. Biochem., 296
(2001) 197.69. Y. S. N. Day, D. G. Myszka, J. Pharm. Sci., 92 (2003) 333.

48
70. R. Karlsson, J. Mol. Recognit., 17 (2004) 151.71. D. G. Myszka, Anal. Biochem., 329 (2004) 316.72. M. Geittmann, T. Unge, U.H. Danielson, J. Med. Chem., 49 (2006) 2367.73. Biacore Application Note 9, Biacore AB, Uppsala, Sweden. 74. A. Felinger, G. Guiochon, J. Chromatogr. A, 658 (1994) 511.75. K. Kaczmarski, D. Antos, Comp. Chem. Eng., 20 (1996) 1271.76. T. Fornstedt, P. Sajonz, G. Guiochon, J. Am. Chem. Soc., 119 (1997) 1254.

Acta Universitatis UpsaliensisDigital Comprehensive Summaries of Uppsala Dissertationsfrom the Faculty of Science and Technology 256
Editor: The Dean of the Faculty of Science and Technology
A doctoral dissertation from the Faculty of Science andTechnology, Uppsala University, is usually a summary of anumber of papers. A few copies of the complete dissertationare kept at major Swedish research libraries, while thesummary alone is distributed internationally through theseries Digital Comprehensive Summaries of UppsalaDissertations from the Faculty of Science and Technology.(Prior to January, 2005, the series was published under thetitle “Comprehensive Summaries of Uppsala Dissertationsfrom the Faculty of Science and Technology”.)
Distribution: publications.uu.seurn:nbn:se:uu:diva-7422
ACTAUNIVERSITATISUPSALIENSISUPPSALA2006