“Analytical Method Development and Validation for Quantitative

24 Prace IMŻ 4 (2015)
Jarosław OPARA, Andrzej WROŻYNA
Instytut Metalurgii Żelaza
DEVELOPMENT AND VALIDATION
OF A QUANTITATIVE DILATOMETRIC ANALYSIS
MODEL OF AUSTENITE DECOMPOSITION
INTO FERRITE AND PEARLITE
The quantitative dilatometric analysis model for the austenite decomposition into ferrite and pearlite during con-
tinuous cooling treatment is presented. It is based on measurements of a relative length change of a sample during
the progress of phase transformations and calculations of the difference in atomic volume of present phases. The
proposed model incorporates crucial effects accompanying the austenite decomposition, i.e. the carbon enrichment of
the remaining austenite during ferrite formation, which causes an increase in the de�nite atomic volume of austenite,
while formation of pearlite has a clearly different impact with the volume fractions of cementite and ferrite regulated
by constant carbon composition inherited from austenite (enriched in carbon). The analysis results are compared with
quantitative microstructure analysis and an excellent convergence has been found. Depicted results state a convincing
con�rmation that the model is correctly developed by the authors. Additionally, kinetics of phase transformations as
function of normalized time were analyzed and a process of carbon enrichment of austenite was demonstrated.
Key words: hypoeutectoid steel, dilatometry, austenite decomposition, ferrite, pearlite, lattice parameter, kinetics
OPRACOWANIE I WALIDACJA MODELU ILOŚCIOWEJ ANALIZY DYLATOMETRYCZNEJ ROZPADU AUSTENITU W FERRYT I PERLIT
W niniejszej pracy zaprezentowano model ilościowej analizy dylatometrycznej dla rozpadu austenitu w ferryt i per-
lit podczas ciągłego chłodzenia. Rozwiązanie bazuje na pomiarach względnej zmiany długości próbki w trakcie po-
stępu przemian fazowych oraz obliczeniach różnic objętości atomowych występujących faz. Zaproponowany model
uwzględnia kluczowe zjawiska towarzyszące rozpadowi austenitu, tzn. wzbogacanie się austenitu w węgiel podczas
powstawania ferrytu, które powoduje wzrost określonej objętości atomowej austenitu, podczas gdy formowanie się
perlitu ma wyraźnie odmienny wpływ poprzez udziały objętościowe ferrytu i cementu, które wynikają z ustalonej
zawartości węgla dziedziczonej z austenitu (wzbogaconego w węgiel). Rezultaty ilościowej analizy dylatogramów ze-
stawiono z ilościową analizą mikrostruktur i uzyskano doskonałą zbieżność wyników. Przedstawione wyniki stanowią
wyraźne potwierdzenie, iż model jest poprawnie opracowany przez autorów. Ponadto, przeprowadzono analizę kinetyk
przemian fazowych w funkcji znormalizowanego czasu oraz przedstawiono proces wzbogacania austenitu w węgiel.
Słowa kluczowe: stal podeutektoidalna, dylatometria, rozpad austenitu, ferryt, perlit, parametr sieci, kinetyka
1. INTRODUCTION
The formation of ferrite and pearlite during austen-
ite decomposition is a process with a considerable tech-
nological signi"cance, for example in production of hot-forged steel forgings with desirable yield strength (in BY heat treatment). One of the well known methods to study phase transformations in steels is a dilatometric technique. In the literature one can "nd several works [1–8] associated with dilatometric analysis to quantify the volume fraction of transformation products. These works incorporate crucial effects accompanying the austenite decomposition, i.e. the carbon enrichment of the remaining austenite during ferrite formation, which causes an increase in the de"nite atomic volume of austenite, while formation of pearlite has a clearly different impact with the volume fractions of cementite and ferrite regulated by constant carbon composition inherited from austenite (enriched in carbon). Never-
theless, none of these approaches has been available,
i.e. to common use of open access source code or a com-
puter application. Hence, there was a motivation to develop its own model based on the previous works [4, 5, 7]. Therefore, one of the objectives of the work was reconstruction of the dilatometric analysis approach proposed by Kop et al. [4]. Accordingly, a computer program was developed with an implemented quanti-tative dilatometric analysis model, and with additional features to deal with dilatometric data.
Another purpose of this work was to evaluate and validate the proposed solution. The validation was per-
formed using the data from the work of Kop et al. [4], and experiments carried out for a low carbon steel. An application of the model on continuous cooling experi-ments is demonstrated. The analysis results are com-
pared with metallographic measurements using an im-
age analysis technique and an excellent convergence has been found. The results are depicted in chapters 4 and 6.

25Prace IMŻ 4 (2015) Development and validation of a quantitative dilatometric analysis model...
2. THEORY
Dilatometry is based on measurements of a rela-
tive volume change of a sample during progress of the phase transformations driven by the speci!ed thermal cycle. The relative volume change of the material re-
sults from both the thermal expansion/contraction ef-fect and the dimensional changes associated with the phase transformation phenomena at atomistic scale, i.e. a change in the crystal structures and/or an en-
richment/depletion of the solute in solid solutions. The total relative volume change can be described by semi-empirical models to quantify the progress of phase transformations, what is extensively demonstrated in the literature [1–8]. This approach allows to perform so called quantitative dilatometric analysis of a particular dilatation curve. For the proposed solution the follow-
ing assumptions need to be adopted: transformation strains are neglected and the expansion/contraction of a sample is isotropic. Under the above assumptions, for small dimensional changes, the following dependence of the relative total atomic volume change regarding the relative length change can be de!ned [2, 4, 5]
1 1VV
LL
LL3
0 0
3
0.
D D D= + -c m (1)
where: ΔV = V – V0 is the atomic volume change equal to difference between total average atomic volume V at a certain temperature and the initial average atomic volume V0 at the reference temperature; ΔL = L – L0
– the measured length change expressed by the dif-ference between the specimen length L at a certain temperature and the initial length L0 at room tempera-
ture.The right-hand side term in the equation (1) is the
value directly obtained from the dilatation measure-
ments, while the left-hand side term can be calculated based on the atomic volumes of the existing phases. The average atomic volume of the alloy is directly re-
lated to the volume fractions of structural constituents present in the material at a certain temperature T and can be formulated with the volume fraction rule
( ) ( )V T f V Ti ii
=/ (2)
where: V is the average atomic volume of the sample; fi – the volume fraction of a structural constituent i; Vi – the atomic volume of the structural constituent i.
Generally, in hypoeutectoid steels below A3 tempera-
ture we can consider three phases, i.e. austenite, fer-
rite and cementite. Therefore, the following equations to determine atomic volumes of the mentioned phases, which are related to the lattice parameters, are pre-
sented respectively
V a4
1 3=c c (3)
V a2
1 3=a a
(4)
V a b c121
=i i i i (5)
where: a is the lattice parameter of austenite, ferrite and cementite phase for the following subscripts γ, α, θ,respectively; bθ and cθ are the lattice parameters of the cementite phase in the other two spatial coordinates. The factors 4, 2 and 12 in the denominator resulting from the fact that 4, 2 and 12 iron atoms are contained in the unit cells of austenite, ferrite and cementite, re-
spectively.Additionally, during cooling of hypoeutectoid steels
below A1 temperature there appear phase mixtures of ferrite and cementite, i.e. structural constituent pearl-ite for which atomic volume can be calculated from the following formulae
( )V V V1p t t= - +a i
(6)
where ρ is the fraction cementite in the pearlite.The lattice parameters of the presented phases in
the equations (3÷5) can be determined using a general equation
( ) [ ( )]a a w x T T1C00b= + + -
z z z c z (7)
where: a0z is the lattice parameter in unalloyed phase
at the reference temperature T0 at which the lattice parameter was determined; wz – the coef!cient relat-ing the effect of the carbon concentration to the phase lattice parameter; x
C=c – the average carbon concentra-
tion in austenite; bz – the linear thermal expansion/
contraction coef!cient of the certain phase; z – the identi!er of the considered phases with the following symbols γ, α, θ for austenite, ferrite and cementite, re-
spectively. The lattice parameters used in the devel-oped model are listed in Tab. 1.
The linear thermal expansion/contraction coef!-
cients for austenite and ferrite are de!ned as a linear function of carbon concentration
e k xCb = -
z z z c (8)
where: ez is the constant parameter; kz – the coef!-
cient relating the effect of the carbon concentration to the thermal expansion/contraction coef!cient.
Unlike the previous approach, the linear thermal expansion/contraction coef!cient for cementite is de-
scribed by square function of temperature
e g T h T
2b = - +i i i i
(9)
where: gθ and hθ are the coef!cients relating the effect of the temperature to the thermal expansion/contrac-
tion coef!cient of cementite.Basing on the equations (1÷9) it is not possible to
calculate the phase fractions from the volume change of a sample due to the two intrinsic factors that prevent their direct determination, namely: the simultaneous
Table 1. Published data for lattice parameters of austenite, ferrite and cementite as function of composition and temperature
from reference [1, 9]
Tabela 1. Opublikowane dane parametrów sieci austenitu, ferrytu i cementytu w funkcji składu chemicznego oraz tempera-
tury ze źródeł [1, 9]
Phase a0
z b0
z c0
zwz ez kz gz hz T0
z [nm] [nm] [nm] [nm/at.%] [1/K] [1/K /at.%] [1/K] [1/K2] [K]
Austenite, γ 0.36306 0.0 0.0 7.8·10-5 2.49·10-5 5.0·10-7 0.0 0.0 1000.0
Ferrite, α 0.28863 0.0 0.0 0.0 1.75·10-5 0.0 0.0 0.0 800.0
Cementite, θ 0.45234 0.50883 0.67426 0.0 5.311·10-6 0.0 1.942·10-9 9.655·10-12 293.0

26 Prace IMŻ 4 (2015)Jarosław Opara, Andrzej Wrożyna
formation of the two phases, i.e. ferrite and pearlite,
and the carbon-concentration dependence of the atomic
volume of austenite [4]. The #rst factor stems from the
fact that the dilatation curve cannot distinguish be-
tween the formation of pro-eutectoid ferrite and pear-
lite. Therefore, certain arbitrary assumptions need to
be taken to de#ne separate temperature regions where
the formation of ferrite and pearlite takes place, as it
is expected from the phase diagram. Hence, the dilata-
tion curve can be analyzed in two steps. The problem
with unambiguous determination of the atomic volume
of austenite can be solved using the variation of the
lattice parameters with the temperature and compo-
sition determined by Onink et al. [1, 9] and mass con-
servation relation. Considering the two products of the
austenite decomposition, i.e. ferrite and pearlite, the
following equation for the mass conservation relation,
based on the volume fraction rule, can be expressed
x f x f x f xC C C
p p
C
0 = + +c c a a (10)
where: xC
0 – is the average carbon concentration in the material; x
C
a – is the carbon concentration in ferrite under the thermodynamic condition; x p
C – is the carbon concentration in pearlite.
Furthermore, during the progress of the austenite to ferrite phase transformation a carbon enrichment of the austenite occurs due to constrained solubility of carbon in ferrite, which depends on the momentary fer-
rite fraction. Accordingly, the average carbon content of the austenite, x
C=c, in a certain stage of the austenite
decomposition into ferrite (at this stage of transforma-
tion there is no pearlite, i.e. fp = 0), can be calculated from a reconstructed equation (10) as follows
xf
x f x
f
x f x
1C
C C C C
0 0=
-=
-
-
cc
a a
a
a a (11)
Summarizing, the volume fraction of the phases can be determined from the dilatation curve by utilizing the lattice parameters, the linear thermal expansion coef!cients and the phase compositions under the ther-
modynamic condition. However, on the account of the complexity of the problem an analytical solution for the equations (1) and (2) does not exist. Therefore, iterative procedures and numerical methods are developed with above assumptions and equations (1÷11) as a computer program. The proposed model and its implementation is described in next section.
3. MODEL DEVELOPMENT
The quantitative dilatometric analysis model for the austenite decomposition into ferrite and pearlite during a continuous cooling treatment is proposed. Accordingly, and based on the equation (2) the follo-
wing equation to determine the total atomic volume, V, of the alloy can be deduced
V = fγ Vγ + fαVα + fpVp (12)
where: f – is the volume fraction of austenite, ferrite and pearlite for the following subscripts γ, α, p, respec-
tively.The dilatometric analysis is performed separately
in two steps by the assumption that the austenite de-
composition is divided into two separate temperature regions, where the formation of ferrite and pearlite
appears, as is expected from the phase diagram. The-
refore, the crucial aspect of the analysis is to de!ne a characteristic temperature, i.e. pearlite start tempe-
rature, which separates the austenite transformation into two temperature regions. There are several ways to determine this temperature, which are extensively described in the work of Kop et al. [4] and the work of Choi [6].
The suggested model is based on the carbon enrich-
ment of the austenite and the difference in the atomic volume of phases during the phase transformation. Hence, at the !rst region of high temperatures when austenite decomposition starts, the volume fraction of ferrite can be calculated by the following relation
fV V
V V=
-
-
aa c
c (13)
As it was stated earlier, there is no analytical solu-
tion for the equations (1) and (2) and consequently the equation (13). This is mainly due to the carbon enrich-
ment of the austenite, which depends directly on the current volume fraction of ferrite at a given stage of the phase transformation. Therefore, the ferrite volu-
me fraction is determined by an iterative scheme, in which the Newton-Raphson method [10] is used. In the iterative scheme the average carbon concentration in the austenite is calculated using the equation (11), and the carbon concentration in ferrite is determined from the phase equilibrium line in Fe-Fe3C phase diagram which is calculated via Thermo-Calc [11]. Additionally, to solve the problem with iterative procedure the goal function needs to be de!ned. Accordingly, the recon-
structed equation (1) with the relative change in length proportional to the ratio of atomic volumes of phases present at current temperature is applied in the follo-
wing form
LL
VV
V
V V
3
13
10 0 0
0D D= =
- (14)
In the second temperature region only the transfor-
mation of austenite to pearlite is analyzed. Thus, in the further analysis the volume fraction of ferrite is assumed to be constant and also carbon enrichment at austenite do not occur. The pearlite composition with carbon is constant and equals to the austenite composi-tion with the average carbon concentration immediate-
ly after !nishing of the austenite to ferrite transforma-
tion. This composition determines the ratio of cementi-te and ferrite in the pearlite [4]. The volume fraction of pearlite can be derived directly from the equation (12) as follows
( )
fV V
V V f V Vp
p
=-
- + -
c
c a c a (15)
The contribution of experimental errors, i.e. some no-
n-idealities which cause deviations between calculated and measured length change, is compensated via the scaling factor [4], κ, and the applying equation (1) is de!ned by
V VL
L3 100
l D= +c m (16)
The scaling factor, κ, for an ideal case equals 1. Ac-
tually, always some non-idealities take place. The cir-
cumstances which in"uence the scaling factor and the way to determine its value are well described in the
27Prace IMŻ 4 (2015) Development and validation of a quantitative dilatometric analysis model...
work of Kop et al. [4]. According to this concept two re-
ference temperatures need to be de!ned, i.e. before and after the austenite phase transformation, at which the two scaling factors are calculated based on the equation (16). Subsequently, a linear function with temperature is de!ned based on values of scaling factors. Thereby, it is possible to determine a current scaling factor in dilatometric analysis with a changing temperature.
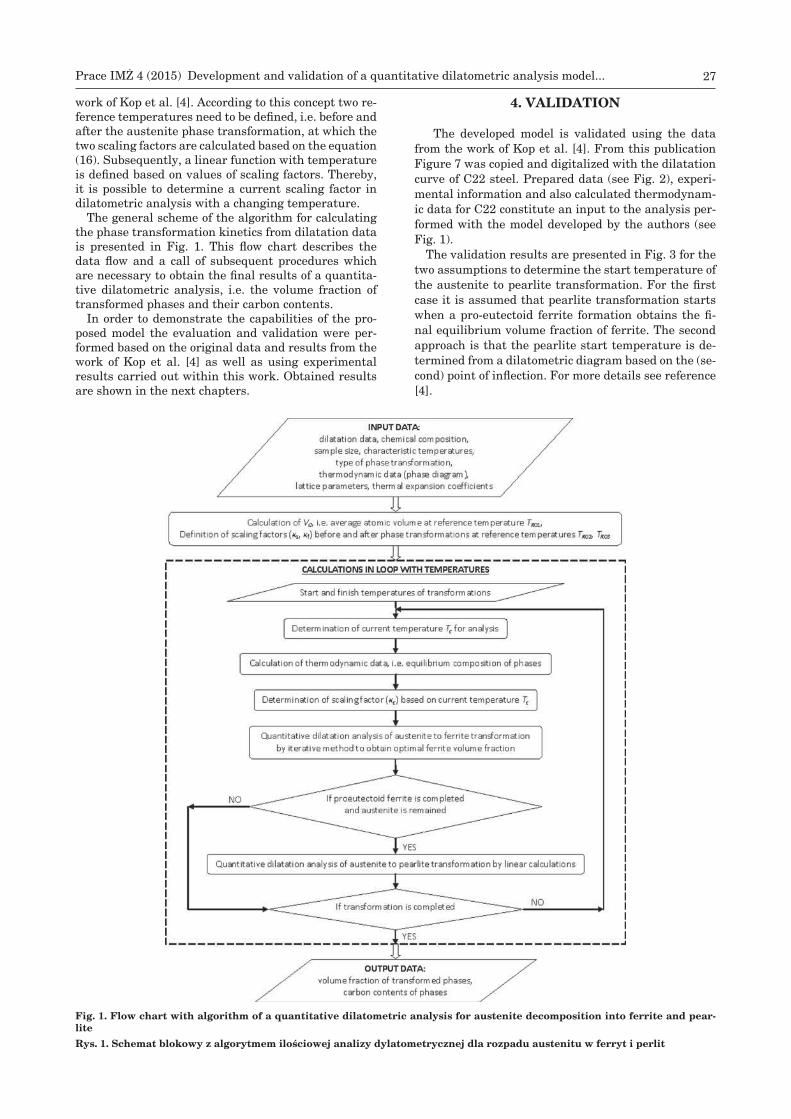
The general scheme of the algorithm for calculating the phase transformation kinetics from dilatation data is presented in Fig. 1. This "ow chart describes the data "ow and a call of subsequent procedures which are necessary to obtain the !nal results of a quantita-
tive dilatometric analysis, i.e. the volume fraction of transformed phases and their carbon contents.
In order to demonstrate the capabilities of the pro-
posed model the evaluation and validation were per-
formed based on the original data and results from the work of Kop et al. [4] as well as using experimental results carried out within this work. Obtained results are shown in the next chapters.
Fig. 1. Flow chart with algorithm of a quantitative dilatometric analysis for austenite decomposition into ferrite and pear-
lite
Rys. 1. Schemat blokowy z algorytmem ilościowej analizy dylatometrycznej dla rozpadu austenitu w ferryt i perlit
4. VALIDATION
The developed model is validated using the data from the work of Kop et al. [4]. From this publication Figure 7 was copied and digitalized with the dilatation curve of C22 steel. Prepared data (see Fig. 2), experi-mental information and also calculated thermodynam-
ic data for C22 constitute an input to the analysis per-
formed with the model developed by the authors (see Fig. 1).
The validation results are presented in Fig. 3 for the two assumptions to determine the start temperature of the austenite to pearlite transformation. For the !rst case it is assumed that pearlite transformation starts when a pro-eutectoid ferrite formation obtains the !-
nal equilibrium volume fraction of ferrite. The second approach is that the pearlite start temperature is de-
termined from a dilatometric diagram based on the (se-
cond) point of in"ection. For more details see reference [4].

28 Prace IMŻ 4 (2015)Jarosław Opara, Andrzej Wrożyna
In (Fig. 3) one can observe an excellent convergence
of the calculated ferrite volume fraction as the function
of temperature with digitalized data from the work [4].
However, slight discrepancies between the calculated
and digitalized results can be observed for pearlite vo-
lume fraction changes with temperature, especially in
Fig. 3b. This deviation can be explained either by an in-
accurate digitalization of picture with dilatometric cu-
rve, from the work [4], within the pearlite transforma-
tion range or by the differences in the implementation
of a procedure to calculate atomic volume of pearlite.
Nevertheless, the depicted results state a convincing
con#rmation that the quantitative dilatometric ana-
lysis model is correctly developed by the authors. An
application of the model is demonstrated in case of con-
tinuous cooling experiments of hypoeutectoid steel in
the next section.
Fig. 2. Dilatation curve during cooling (20°C/min) for C22
steel copied and digitalized from the work of Kop et al. [4]
Rys. 2. Krzywa dylatacyjna podczas chłodzenia (20°C/min)
stali C22, skopiowana i zdigitalizowana z pracy Kopa i in.
[4]
Fig. 3. Validation of the volume fraction change of ferrite and pearlite as a function of temperature based on the data from
the work of Kop et al. [4] for C22 steel. The two assumptions are considered to determine the start temperature of austenite
to pearlite transformation: (a) pearlite starts when pro-eutectoid ferrite formation obtains the !nal equilibrium volume
fraction of ferrite; (b) pearlite start temperature is determined from a dilatometric diagram based on the (second) point of
in"ection
Rys. 3. Walidacja zmian udziału objętościowego ferrytu i perlitu w funkcji temperatury na podstawie danych z pracy Kopa i in.
[4] dla stali C22. Przyjęto dwa założenia przy wyznaczaniu temperatury rozpoczęcia przemiany austenitu w perlit: (a) formowa-
nie perlitu rozpoczyna się gdy przyrost ferrytu przedeutektoidalnego osiąga końcowy równowagowy udział objętości ferrytu;
(b) temperatura rozpoczęcia formowania się perlitu jest określana z wykresu dylatometrycznego na podstawie (drugiego)
punktu przegięcia
a) b)
5. EXPERIMENTAL PROCEDURE
The chemical composition of steel used for dilatome-
tric measurement is shown in Tab. 2. The dilatometric
measurements were carried out on ϕ4×ϕ2×10.0mm
samples using a Bähr 805A/D quench dilatometer.
The samples were thermally stabilized due to heating
by induction to 650°C at rate of 10°C/s, annealing for
10 minutes and cooling to room temperature at a rate
of 0.5°C/s. Then the samples were heated to 920°C at
a rate of 10°C/s, held for 10 minutes and subsequen-
tly cooled with different rates of 0.1°C/s, 0.5°C/s, 1°C/s,
2°C/s and 4°C/s. The characteristic temperatures of
phase transformations were determined by the concept
of an in$ection point.
Table 2. Chemical composition of S355J2 steel (European
standard steel number 1.0577) in wt.%
Tabela 2. Skład chemiczny stali S355J2 (wg normy europej-
skiej numer stali 1.0577) w % wag.
C Si Mn P S Cu Al Ti N
0.17 0.40 1.55 0.017 0.026 0.07 0.032 0.0014 0.0070
The microstructure was observed by light optical mi-
croscopy after a standard method of preparation with
3% nital etchant. Quantitative analysis of phase frac-
tions were conducted on four images per each sample
using quantitative image analysis software MetIlo [12].
6. RESULTS AND DISCUSSION
The dilatometric curves for continuous cooling at va-
rious cooling rates are shown in Fig. 4. For the analy-
zed values of cooling rates the two subsequent trans-
formations are visible. The higher cooling rate value
the lower start and #nish temperatures and a change
in the dilatation effect of the above-mentioned trans-
formations is observed.

29Prace IMŻ 4 (2015) Development and validation of a quantitative dilatometric analysis model...
Microstructures after cooling at a series of cooling rates are shown in Fig. 5. In all the analyzed samples a mixture of ferrite and pearlite is observed. The higher cooling rate, the smaller grain size of ferrite. The re-
sults of the quantitative image analysis for fractions of structural constituents are shown in (Tab. 3) together with the results of fraction calculations based on dilato-
metric measurements. The results from the developed quantitative dilatometric analysis model coincide with the quantitative image analysis ones whereas the re-
sults from the lever rule method in case of ferrite are higher on average about 10 percentage points. The fraction of ferrite is probably overestimated in the le-
ver rule method since the carbon enrichment and the increasing atomic volume of the austenite during fer-
rite formation is not taken into account in the analysis of the samples dilatation.
Additionally, an application of the quantitative dila-
tometric analysis model gives a possibility to determi-ne kinetics of phase transformations. The increasing volume fraction of ferrite and pearlite as a function of temperature for the analyzed experiments is presented
in Fig. 6. One can observe that temperatures at which a certain fraction of ferrite and pearlite are reached de-
crease as the cooling rate increases. The determined values of start and !nish temperatures of transforma-
tions taken into consideration are presented in Tab. 4. A temperature span between start and !nish of pearli-tic transformation (Tab. 4) is the highest at 1°C/s and 2°C/s, where it is equal ΔT = 50°C and both for higher and lower cooling rates decreases to circa ΔT = 34°C. And in case of ferritic transformation the temperature span remains at around ΔT = 118°C.
Fig. 4. Dilatometric curves for S355J2 steel cooled at various cooling rates. For better readability the curves are shifted along
”relative change length” axis
Rys. 4. Krzywe dylatometryczne dla stali S355J2 chłodzonej z różnymi szybkościami chłodzenia. Dla zwiększenia czytelności
krzywe zostały przesunięte wzdłuż osi „względnej zmiany długości”
Table 3. Volume fractions of ferrite and pearlite in steel S355J2 cooled at various cooling rates determined in the quantitative
image analysis and on the basis of the length change of the samples by the lever rule method and the developed quantitative
dilatometric analysis model
Tabela 3. Ułamki objętości ferrytu i perlitu w stali S355J2 chłodzonej z różnymi szybkościami chłodzenia wyznaczone na
podstawie ilościowej analizy obrazu oraz reguły dźwigni bazującej na zmianach długości próbki oraz opracowanego modelu
ilościowej analizy dylatogramów
Cooling rateQuantitative image analysis Lever rule
Quantitative dilatometric
analysis model
Ferrite Pearlite Ferrite Pearlite Ferrite Pearlite
[°C/s] [%] [%] [%] [%] [%] [%]
0.1 71.4 28.6 80.2 19.8 70.9 29.1
0.5 73.7 26.3 82.9 17.1 72.6 27.4
1 76.8 23.2 84.1 15.9 73.9 26.1
2 77.2 22.8 88.0 12.0 75.2 24.8
4 73.9 26.1 89.3 10.7 76.7 23.3

30 Prace IMŻ 4 (2015)Jarosław Opara, Andrzej Wrożyna
a) b)
c) d)
e)
Fig. 5. Microstructure of steel S355J2 after cooling with
rate: a) 0.1°C/s, b) 0.5°C/s, c) 1°C/s, d) 2°C/s, e) 4°C/s
Rys. 5. Mikrostruktura stali S355J2 po chłodzeniu z szyb-
kością: a) 0.1°C/s, b) 0.5°C/s, c) 1°C/s, d) 2°C/s, e) 4°C/s
Table 4. Start and $nish temperatures of ferritic and pear-
litic transformations for S355J2 steel for various cooling rates
Tabela 4. Temperatury początku i końca przemian fazo-
wych ferrytu i perlitu dla stali S355J2 przy różnych szyb-
kościach chłodzenia
Cooling rate Fs Ff = Ps Pf ΔPs-f
[°C/s] [°C] [°C] [°C] [°C]
0.1 787 666 634 32
0.5 773 654 618 36
1 759 646 595 51
2 753 636 586 50
4 743 622 588 34
Kinetics of ferritic and pearlitic transformations are
shown in Fig. 7. Due to the changes of the cooling rate
between the experiments a span of time between start
and !nish of ferritic and pearlitic transformations beco-
mes larger when the cooling rate decreases (Fig. 7a, c). When normalized time of transformation is used (Fig. 7b, d) one can !nd that the kinetic of ferritic transfor-
mation is almost not affected by the cooling rate where-
as the kinetics of pearlitic transformation accelerates and changes with the increasing cooling rate.
Another feature of the quantitative dilatometric analysis model is an excellent possibility to track car-
bon enrichment of austenite during its decomposition.

31Prace IMŻ 4 (2015) Development and validation of a quantitative dilatometric analysis model...
Fig. 6. Volume fraction changes with temperature of ferrite (a) and pearlite (b) during austenite decomposition for different
cooling rates
Rys. 6. Zmiany udziału objętościowego ferrytu (a) i perlitu (b) w funkcji temperatury podczas rozpadu austenitu dla różnych
szybkości chłodzenia
a) b)
a) b)
c) d)
Fig. 7. Kinetics of austenite decomposition into ferrite (a, b) and pearlite (c, d) for different cooling rates
Rys. 7. Kinetyki rozpadu austenitu w ferryt (a, b) i perlit (c, d) dla różnych szybkości chłodzenia
The austenite enrichment in carbon in the analyzed experiments is shown in Fig. 8. One can observe that the increasing cooling rate causes that the austenite enrichment takes place in lower temperatures and si-multaneously the maximum carbon concentration in austenite (at the end of ferritic transformation) shifts
to higher values beyond the extrapolated Acm line. The phenomenon of such a shift raises a question about the criteria of a pearlitic transformation – a concept that a pearlitic transformation starts when the carbon con-
centration value equals the Acm value at a certain tem-
perature [6] seems to be not applicable in this case.

32 Prace IMŻ 4 (2015)Jarosław Opara, Andrzej Wrożyna
7. CONCLUSIONS
In the present study the quantitative dilatometric
analysis model of ferritic and pearlitic transformation
during continuous cooling in hypoeutectoid steel has
been presented. The model takes into account the diffe-
rences in the atomic volume of present phases and the
carbon enrichment of austenite during ferrite forma-
tion. The following conclusions can be made:
Fig. 8. Partial Fe-Fe3C phase diagram of S355J2 steel with
curves of average carbon concentration at austenite for
different cooling rates
Rys. 8. Częściowy układ równowagi fazowej stali S355J2
z przebiegami średniego stężenia węgla w austenicie dla
różnych szybkości chłodzenia
The results of the validation con#rm that the model •
is correctly developed;The comparison of the results from the quantitative •
dilatometric analysis model and quantitative image analysis of the microstructure show an excellent co-
nvergence. The fractions of ferrite calculated by the lever rule method are overestimated since this me-
thod does not take into account the increasing atomic volume of austenite during ferrite formation;The analysis of kinetics of ferritic and pearlitic trans-•
formation with normalized transformation time re-
veals that the kinetic of pearlitic transformation is in greater extent dependent on the cooling rate than the kinetic of ferritic transformation;The obtained results of kinetics can be used directly •
in validation of numerical models for phase transfor-
mations;The quantitative dilatometric analysis model shows •
that the increasing cooling rate causes a shift of the maximum carbon concentration in the austenite (at the end of ferritic transformation) beyond the extra-
polated Acm line. It raises a question about the crite-
ria of the pearlitic transformation start. This pheno-
menon is going to be a subject of a further research.
Acknowledgements
The authors are grateful to Dr Władysław Za-
lecki for providing CCT research results, an in-
troduction to dilatometry and stimulating discus-
sions. The !nancial support from the statutory
research project S0-0907 granted by the Ministry
of Science and Higher Education, Republic of Po-
land is acknowledged.
REFERENCES
Onink M., Tichelaar F.D., Brakman C.M., Mittemeijer E.J., 1. van der Zwaag S.: Quantitative Analysis of the Dilatation by Decomposition of Fe-C Austenites; Calculation of Volume Change upon Transformation, Zeitschrift für Metallkunde, 1996, 87, 24-32 Qiu C., van der Zwaag S.: Dilatation measurments of plain 2. carbon steels and their thermodynamic analysis, Steel Rese-
arch International, 1997, 68, 32-38 García de Andrés C., Caballero F. G., Capdevila C.: Dilato-3. metric characterization of pearlite dissolution in 0.1C-0.5Mn low carbon low manganese steel, Scripta Materialia, 1998, 38, 1835-1842 Kop T.A., Sietsma J., van der Zwaag S.: Dilatometric analysis 4. of phase transformations in hypo-eutectoid steels, Journal of Materials Science, 2001, 36, 519-526 Zhao L., Kop T.A., Rolin V., Sietsma J., Mertens A., Jacques 5. P.J., van der Zwaag S.: Quantitative dilatometric analysis of intercritical annealing in a low-silicon TRIP steel, Journal of Materials Science, 2002, 37, 1585-1591 Choi S.: Model for estimation of transformation kinetics from 6. the dilatation data during a cooling of hypoeutectoid steels, Materials Science and Engineering A, 2003, 363, 72-80
Lee S.-J., Lusk M.T., Lee Y.-K.: Conversional model of trans-7. formation strain to phase fraction in low alloy steels, Acta Ma-
terialia, 2007, 55, 875-882 San Martín D., Rivera Díaz del Castillo P.E.J., García de An-8. drés C.: In situ study of austenite formation by dilatometry in a low carbon microalloyed steel, Scripta Materialia, 2008, 58, 926-929 Onink M., Brakman C.M., Tichelaar F.D., Mittemeijer E.J., 9. van der Zwaag S.: The Lattice Parameters of Austenite and Ferrite in Fe-C Alloys as Functions of Carbon Concentration and Temperature, Scripta Metallurgica et Materialia, 1993, 29, 1011-1016Deu!hard P.: Newton Methods for Nonlinear Problems. Af"ne 10.
Invariance and Adaptive Algorithms, Springer Series in Com-
putational Mathematics, 35, Berlin, Springer, 2004
Andersson J.O., Helander T., Höglund L., Shi P.F., and Sund-11.
man B.: Thermo-Calc and DICTRA, Computational tools for
materials science, Calphad, 2002, 26, 273-312.
Szala J., MetIlo v12.1 – instruction manual, Katowice, 2009, 12.
unpublished