
Development and validation of a molecular diagnostic for ...
213
Development and validation of a molecular diagnostic for tuberculosis I Mutingwende 24662399 Thesis submitted for the degree Doctor Philosophiae in Pharmaceutics at the Potchefstroom Campus of the North-West University Promoter: Prof AF Grobler October 2016
Transcript of Development and validation of a molecular diagnostic for ...

Development and validation of a molecular diagnostic for tuberculosis
I Mutingwende
24662399
Thesis submitted for the degree Doctor Philosophiae in
Pharmaceutics at the Potchefstroom Campus of the North-West University
Promoter: Prof AF Grobler October 2016

i
DISCLAIMER
The financial assistance of the National Research Foundation (NRF) towards student bursary is
hereby acknowledged. Opinions expressed and conclusions arrived at, are those of the author and
are not necessarily to be attributed to the NRF.

ii
ACKNOWLEDGEMENTS
Firstly, I would like thank my creator and eternal Father for the gift of life, grace and opportunity
to complete my doctoral studies.
˜Romans 8:38˜
Words will not be enough to express my gratitude to the following special individuals without
whom this thesis would not have been possible.
My dear wife, Tariro, thank you for allowing me to be away from you and the kids while studying
1370kms from home. I am deeply grateful for the sacrifices that you made and for carrying the
burden of raising our children alone. To my daughter, Tadiwa and son, Isaac Jnr, you never
complained about having a visiting father during this period. Thank you for your resilience,
courage and love – you make me desire to be a better person daily.
Prof Anne Grobler, my promoter. Thank you for your patience, motivation, immense knowledge
and continuous support in all the time of research and writing of this thesis. Indeed, those hard
questions you posed in our discussions pushed me to think differently. I could not have imagined
having a better promoter and mentor for my PhD studies.
Prof Henk Viljoen, my co-promoter. Thank you for the insightful comments and encouragement;
that constant reminder that as an African student I am in no way different from American students
will always be in my heart and mind.
Mr Urban Vermeulen, my lab mate. This project would not have been possible without your
engineering expertise. I am grateful for those long nights and weekends you spent fixing the
various prototypes. Fellow PCDDP students, thank for those positive comments during our weekly
lab meetings. Dr Clinton Rambanapasi, we walked this road together! Thank you for the wonderful
advice during those trying and difficult moments.
Last but not least, I would like to thank my family: my parents and my brothers and sisters for
supporting me emotionally and spiritually throughout my studies and my life in general.
May God continue to bless you!
Isaac Mutingwende
North-West University
October 2016

iii
I dedicate this thesis to
my family, my wife, Tariro, and my beloved children, Tadiwa and Isaac Jnr
for your constant support and unconditional love
I love you all dearly.

iv
ABSTRACT
Background: Tuberculosis is a curable disease that is still responsible for more than 1.4 million
deaths annually. In the face of the HIV epidemic the modest gains that have been made in trying
to control and eradicate the disease are under serious threat. Lack of affordable, accessible, and
geographically available diagnostics is one of the main hindrances in controlling the disease in
resource limited settings where the disease burden is highest. Molecular methods due to their good
accuracy, short turnaround times (1 to 24 hours), relatively low cost and potential for automation
promise to fill current diagnostic gaps.
Objectives: The main objective of this study was to develop and validate a low cost user-friendly
molecular based test (known as NWU-TB) for tuberculosis diagnosis that provides a result on the
same day.
Methods: After developing the initial NWU-TB prototype, a preliminary independent evaluation
was conducted at the South African National Institute of Communicable Diseases (NICD) using
109 patient sputum samples. Concurrently, a blinded evaluation study was conducted at the North-
West University by the development team using 548 patient sputum samples collected at Orkney-
Westvaal hospital. Informed by results and recommendations from the two studies, improvements
on the initial prototype were made. A new evaluation study was then conceived and executed in
order to evaluate the performance of the new prototype using 176 new clinical sputum samples
collected at Orkney-Westvaal hospital. This study was combined with a small pilot study that
aimed to optimise and evaluate the potential use of propidium monoazide (PMA) to discriminate
between live and dead mycobacteria in clinical samples. MGIT culture was used as the reference
test (gold standard) in all 3 of the performance evaluation studies conducted. Except in the NICD
study, MGIT culture, sputum smear microscopy (SSM) and Xpert MTB/Rif were performed by
registered laboratory scientists stationed at Orkney-Westvaal hospital. Finally, the cost per test of
the developed diagnostic was estimated from a laboratory perspective using the “ingredients
approach” and a preliminary cost-effectiveness analysis based on a simple decision model was
also conducted.
Results: In the NICD study, NWU-TB performance was compared with SSM against MGIT
culture as the gold standard. NWU-TB showed a sensitivity of 67% and specificity of 88%, while
SSM showed a sensitivity of 40% and specificity of 100%. For the initial NWU-TB prototype
evaluation study conducted at the North-West University, comparisons were made to SSM and
Xpert MTB/Rif using MGIT culture as gold standard. NWU-TB showed an overall sensitivity and
specificity of 80.8% (95% CI: 75%–85.7%) and 75.6% (95% CI: 64.9%–84.4%) respectively, in
comparison to 85.3% (95% CI: 79.9%– 89.6%) and 73.2% (95% CI: 62.2%–82.4%) respectively
for Xpert MTB/Rif; and 62.1% (95% CI: 55.3%–68.4%) and 56.1% (95% CI: 44.7%–67%)

v
respectively for SSM. Sensitivity of NWU-TB was lower (p=0.026) than that of Xpert MTB/Rif
but better (p=0.001) than that of SSM. However, specificities for all the three assays where
significantly lower than expected. Clinical evaluation of the improved NWU-TB prototype showed
that both sensitivity and specificity increased. NWU-TB showed a better sensitivity of 94.6% [95%
CI: 89.1%; 97.8%) compared to Xpert MTB/Rif 84% (p=0.0025) and SSM 64.3% (p<0.001).
Xpert MTB/Rif showed a better specificity of 100% [95% CI: 88.1%-100%), which was
significantly higher than NWU-TB 86.2% (p<0.001) and SSM 62.1% (p<0.001). Overall, there
was a strong correlation between Xpert MTB/Rif and NWU-TB results (Mc Nemar’s chisquare
=11.64, p value = 0.0006).
Successful optimization of the PMA protocol was demonstrated using sputum samples. However,
when samples were stratified and pooled based on whether individuals were receiving treatment
or not, the results showed that there were no statistically significant differences between the two
groups. Finally, the total cost per test for NWU-TB was estimated at $5.36, with material cost per
test contributing the highest (75%) and equipment cost contributing the least (1.31%). Also, in the
preliminary cost-effectiveness analysis, incremental cost effectiveness ratios (ICERs) for
community based TB screening within South African mines using NWU-TB and Xpert MTB/Rif
were US$50.3 per case detected and US$181.52 per case detected respectively relative to the
current base case scenario of passive case finding.
Conclusion: A relatively low cost ($5.36 per test), same day (˂ 2 hours TAT) molecular test
prototype for tuberculosis was developed and evaluated. Additional product development and
longitudinal cohort studies are required in order to produce a final prototype that can be
commercialised. Sensitivity of the NWU-TB was comparatively better than both Xpert MTB/Rif
and SSM against MGIT culture as gold standard. However, the specificities of all the assays were
significantly lower than expected. Since all the samples used in these studies (except for the NICD
study) were collected at a single site, any disease dynamics unique to the site may have been
replicated throughout the studies. Use of PMA to discriminate between live and dead mycobacteria
was optimised and its use demonstrated some potential. This is supported by cases in which
culture-negative samples that had tested positive with the NWU-TB test without PMA treatment
would test negative after PMA treatment showing that DNA from dead mycobacteria was possibly
responsible for the false positive result in the first instance. The pilot study was ill equipped to
generate sufficient data that permits conclusive clinical decisions on the utility of PMA, but the
developed protocol can be adopted to a larger longitudinal study where such firm conclusions can
be drawn.
Key words: tuberculosis; NWU-TB; sputum; sensitivity; specificity; propidium monoazide

vi
UITTREKSEL
Agtergrond: Tuberkulose is ’n geneeslike siekte wat steeds verantwoordelik is vir meer as 1,4
miljoen sterftes per jaar. Die opkoms van die gepaardgaande MIV epidemie dreig om die beskeie
vordering wat gemaak is om die siekte te beheer en uit te roei, nietig te maak. Die gebrek aan
bekostigbare, beskikbare en geografies toeganklike diagnostiese toetse is een van die grootste
hindernisse in die beheer van tuberkulose in gebiede met beperkte infrastruktuur waar die
voorkoms van die siekte die hoogste is. Molekulêre metodes, met hul goeie akkuraatheid, kort
omkeertye (1 tot 24 uur), relatiewe lae koste en potensiaal vir toets outomatisering mag bydra om
huidige gapings in die diagnostiese mark te vul.
Doelwitte: Die hoofdoel van die studie was om 'n lae koste en gebruikersvriendelike molekulêre
toets wat tuberkulose binne een dag kan diagnoseer te ontwikkel en te bekragtig. Die toets staan
bekend as NWU-TB.
Metodes: Na die ontwikkeling van die aanvanklike NWU-TB prototipe, is ’n voorlopige
onafhanklike evaluering by die Suid-Afrikaanse Nasionale Instituut vir Oordraagbare Siektes
(NIOS) op sputum monsters van 109 pasiënte uitgevoer. Terselfdertyd is ’n evalueringstudie deur
die ontwikkelingspan by die Noordwes-Universiteit uitgevoer op 548 sputum monsters afkomstig
van pasiënte van die Orkney-Wesvaal hospitaal. Die studie ontwerp was sodanig dat die
monsteranalise blind was t.o.v. pasiënt data tot en met die interpretasie van die analises. Die
resultate en terugvoer van die twee studies, het gelei tot verbeteringe aan die aanvanklike prototipe,
dus ʼn tweede prototipe. Ten einde die verrigting van die nuwe prototipe te bepaal, is ’n soorgelyke
blinde evalueringstudie op 176 kliniese sputum monsters ,verkry vanaf die Orkney-Wesvaal
hospitaal, uitgevoer. Terselfdertyd is die potensiaal van die gebruik van propidium monoazide
(PMA) om tussen lewendige en dooie mikobakterieë in kliniese monsters te onderskei in ʼn klein
loodsstudie ondersoek. MGIT kultuur is gebruik as verwysingstoets (goudstandaard) in al drie
evalueringstudies. Behalwe vir die NIOS studie het geregistreerde laboratorium wetenskaplikes,
gestasioneer by Orkney-Wesvaal hospitaal, alle MGIT kultuur, sputum smeer mikroskopie (SSM)
en Xpert MTB/Rif uitgevoer. Ten slotte is die koste van die gebruik van die ontwikkelde
diagnostiese toets vanuit ’n laboratorium perspektief met behulp van ’n "bestanddeel benadering"
beraam en ’n koste-effektiwiteitsanalise uitgevoer op ’n eenvoudige besluitnemingsmodel.
Resultate: In die NIOS studie is die NWU-TB werksverrigting vergelyk met SSM teenoor MGIT
kultuur as die verwysings- of goudstandaard. Die NWU-TB het ’n sensitiwiteit van 67% en
spesifisiteit van 88% getoon, terwyl SSM ’n sensitiwiteit van 40% en spesifisiteit van 100% getoon
het. Vir die eerste NWU-TB prototipe evalueringstudie wat by die Noordwes-Universiteit
uitgevoer is, is die NWU-TB sisteem met SSM en Xpert MTB/Rif teenoor MGIT kultuur as die
goudstandaard vergelyk. Die NWU-TB het ’n algehele sensitiwiteit en spesifisiteit van 80.8%

vii
(95% VI: 75%-85.7%) en 75.6% (95% VI: 64.9%-84.4%) onderskeidelik getoon, in vergelyking
met 85.3% (95% VI: 79.9 %-89.6%) en 73.2% (95% VI: 62.2%-82.4%) onderskeidelik vir Xpert
MTB/Rif en 62.1% (95% VI: 55.3%-68.4%) en 56.1% (95% VI: 44.7%-67%) onderskeidelik vir
SSM. Sensitiwiteit van die NWU-TB was laer (p=0.026) as dié van Xpert MTB/Rif, maar beter
(p=0.001) as dié van SSM. Die spesifisiteit vir al drie die toetse was wel aansienlik laer as wat
verwag is. Kliniese evaluering van die verbeterde NWU-TB prototipe het ’n toename in beide
sensitiwiteit en spesifisiteit getoon. Die NWU-TB het ’n beter sensitiwiteit van 94.6% [95% VI:
89.1%- 97.8%) getoon in vergelyking met Xpert MTB/Rif 84% (p = 0.0025) en SSM 64.3% (p
<0.001). Xpert MTB/Rif het ’n beter spesifisiteit getoon van 100% [95% VI: 88.1% -100%), wat
aansienlik hoër was as NWU-TB 86.2% (p<0.001) en SSM 62.1% (p <0.001). Algeheel was daar
’n sterk korrelasie tussen Xpert MTB/Rif en NWU-TB resultate (McNemar se chi-kwadraattoets
= 11.64, p waarde = 0.0006).
Suksesvolle optimalisering van die PMA protokol is op sputum monsters gedemonstreer. Wanneer
die monsters gestratifiseer en saam gegroepeer is op die basis van individue wat behandeling
ontvang het al dan nie, het die resultate getoon dat daar geen statistiese beduidende verskil tussen
die twee groepe bestaan nie. Ten slotte, die totale koste per toets vir die NWU-TB is beraam op
US$5.36, met die materiaalkoste wat die hoogste bydra (75%) en toerustingkoste die minste
(1.31%) bydra lewer. In die voorlopige koste-effektiwiteitsanalise is die inkrementele koste-
effektiwiteitsverhoudings (IKEVs) vir gemeenskapsgebaseerde TB sifting in Suid-Afrikaanse
myne per geval bepaal as US$50.3 vir die NWU-TB en US$181.52 vir Xpert MTB/Rif relatief tot
die huidige geval basis van passiewe identifikasie.
Gevolgtrekking: ’n Relatiewe lae koste ($5.36 per toets), dieselfde dag (˂ 2 uur omkeertyd)
molekulêre prototipe toets is vir tuberkulose ontwikkel en geëvalueer. Addisionele produk
ontwikkeling en ’n longitudinale kohortstudie moet nog uitgevoer word ten einde ’n finale
prototipe te ontwikkel wat kommersialiseer kan word. Die sensitiwiteit van die NWU-TB was
relatief beter as die van beide Xpert MTB/Rif en SSM teenoor MGIT kultuur as die goudstandaard.
Die spesifisiteit vir al drie die toetse was aansienlik laer as wat verwag is. Aangesien al die
monsters gebruik in hierdie studies afkomstig van ’n enkele geografiese and sosiale versamelpunt
was (behalwe vir die NICD studie), is dit moontlik dat ‘n siekte dinamika wat uniek tot die area is
weerspieël word in die resultate.
Die gebruik van PMA om tussen lewendige en dooie mikobakterieë te onderskei, is gedemonstreer
en toon potensiaal. Hierdie potensiaal word ondersteun deur gevalle waar kultuur-negatiewe
monsters positief met die NWU-TB-toets sonder PMA behandeling getoets het en dan negatief na
afloop met PMA behandeling getoets het. Dit kan aandui dat DNA van dooie mikobakterieë
moontlik verantwoordelik was vir die aanvanklike vals positiewe uitslae. Die loodsstudie waarin

viii
die inisiëring en optimalisering van lewendig/dood onderskeiding gedoen is, was nie groot genoeg
om voldoende inligting te bekom om die nut daarvan in ’n kliniese besluit te kan bevestig nie. Die
ontwikkelde protokol kan met vrug in ’n groot longitudinale/moniterende studie toegepas word
sodat definitiewe en gevalideerde gevolgtrekkings gemaak kan word.
Sleutelwoorde: tuberkulose; NWU-TB; sputum; sensitiwiteit; spesifisiteit; propidium monoazide

ix
Table of Contents
Disclaimer ............................................................................................................................. i
Acknowledgements ..............................................................................................................ii
Abstract............................................................................................................................... iv
Uittreksel ............................................................................................................................. vi
Table of Contents................................................................................................................ ix
List of Annexures............................................................................................................... xii
List of Tables ....................................................................................................................xiii
List of Figures ................................................................................................................... xiv
List of Abbreviations ........................................................................................................ xvi
Chapter 1: Problem statement & study objectives
1.1 Background and Problem statement ................................................................................. 2
1.2 Study Rationale ............................................................................................................... 4
1.3 Aim of the Study ............................................................................................................. 5
1.4 Study Objectives .............................................................................................................. 5
1.5 Structure of the thesis ...................................................................................................... 7
1.6 Dissemination of findings ................................................................................................ 7
1.7 Declarations ..................................................................................................................... 8
1.8 References ....................................................................................................................... 9
Chapter 2: Literature Review
1.1 Mycobacterium tuberculosis .......................................................................................... 13
1.2 Tuberculosis pathogenesis ............................................................................................. 13
1.3 Tuberculosis Burden ...................................................................................................... 15
1.3.1 Paediatric tuberculosis ................................................................................................ 16
1.3.2 Drug-resistant TB burden ............................................................................................ 16
1.4 TB High Burden countries ............................................................................................. 17
1.5 TB treatment .................................................................................................................. 18
1.6 TB in South Africa ........................................................................................................ 19
1.7 Future targets for TB incidence rate ............................................................................... 20
1.8 TB laboratory diagnosis challenges ................................................................................ 21
1. 9 Measurement of the accuracy for diagnostic tests .......................................................... 22
1.10 Ideal TB diagnostic tests .............................................................................................. 23
1.11 Current tuberculosis and MDR diagnosis ..................................................................... 24

x
1.11.1 Smear microscopy..................................................................................................... 26
1.11.2 Culture methods ........................................................................................................ 27
1.11.3 Nucleic Acid amplification tests ................................................................................ 30
1.12 Future TB diagnostic systems ...................................................................................... 35
1.12.1 LoopAMP™ MTBC Detection Kit ........................................................................... 39
1.12.2 EasyNAT TB Diagnostic kit ..................................................................................... 41
1.12.3 Epistem Genedrive .................................................................................................... 42
1.12.4 Trueant MTB ............................................................................................................ 43
1.13 Evaluation of new diagnostic tests ............................................................................... 44
1.14 Cost-effectiveness of diagnostic tests ........................................................................... 45
1.14.1 Building decision analysis model .............................................................................. 45
1.15 Conclusion ................................................................................................................... 51
1.16 References ................................................................................................................... 53
Chapter 3: Commentary on independent clinical evaluation
Abstract ............................................................................................................................... 78
Text ..................................................................................................................................... 78
References ........................................................................................................................... 80
Chapter 4: Multiplex-PCR based system for tuberculosis diagnosis
Abstract.................................................................................................................................... 83
1. Introduction......................................................................................................................... .83
2. Materials and Methods......................................................................................................... 84
2.1 Study population and specimens........................................................................................ 84
2.2 Reference Standard tests.................................................................................................... 84
2.2.1 Sputum smear microscopy (SSM)................................................................................. .84
2.2.2 MGIT Culture................................................................................................................. .84
2.2.3 GeneXpert....................................................................................................................... 85
2.2.4 NWU-TB......................................................................................................................... 85
2.2.5 Biosafety evaluation of NWU-TB cell lysis step............................................................ 85
2.2.6 Statistical analysis.......................................................................................................... .86
2.2.7 Ethics.............................................................................................................................. 86
3. Results.................................................................................................................................. 86
3.1Patient population................................................................................................................ 86
3.2 Performance of NWU-TB in the individuals with no TB history...................................... 86

xi
3.3 Performance of NWU-TB in cohort analysis......................................................................86
3.4 Frequency of non-tuberculosis mycobacteria..................................................................... 86
3.5 Biosafety evaluation............................................................................................................ 86
4. Discussion............................................................................................................................. 86
5. Limitations of the study.........................................................................................................88
References................................................................................................................................. 88
Chapter 5: Detection of M. tuberculosis by an improved NWU-TB
Proof of submission to journal.................................................................................................. 91
Abstract……………................................................................................................................. 93
1. Introduction........................................................................................................................... 94
2. Methods...................................................................................................................... ........... 95
2.1 Study Design....................................................................................................................... 95
2.2 SSM, MGIT Culture and Xpert MTB/Rif........................................................................... 96
2.3 NWU-TB system................................................................................................................. 97
2.3.1 Sample preparation...........................................................................................................97
2.3.2 Design and synthesis of primer and fluorogenic probe.................................................... 97
2.3.3 Real-time PCR..................................................................................................................97
2.4 Live/dead discrimination..................................................................................................... 98
2.5 Ethics.............................................................................................................. ..................... 98
2.6 Statistical Analysis.............................................................................................................. 98
3. Results................................................................................................................................... 99
3.1 Study population............................................................................................. .................... 99
3.2 Correlation of NWU-TB CT values and smear grades........................................................99
3.3 Comparison of NWU-TB system and MGIT culture........................................................ 100
3.4 PMA treatment.................................................................................................................. 101
4. Discussion........................................................................................................................... 103
5. References....................................................................................................................... .... 107
Chapter 6: Cost-effectiveness of NWU-TB in South Africa
Abstract..................................................................................................................... .............. 115
Introduction............................................................................................................................. 115
Methods...................................................................................................................... ............. 117
NWU-TB costing.................................................................................................................... 117
Material costs per test..............................................................................................................117

xii
Number of tests per day.......................................................................................................... 117
Labour cost per test........................................................................................... ..................... .118
Equipment costs and daily equivalents................................................................................... 118
Overhead cost per test ............................................................................................................118
Cost–effectiveness...................................................................................................................118
Results ....................................................................................................................................121
NWU-TB costing.................................................................................................................... 121
Material costs.......................................................................................................................... 121
Labour costs............................................................................................................................ 121
Equipment cost per test........................................................................................................... 122
Total cost per test.................................................................................................................... 123
Cost-effectiveness................................................................................................................... 123
Discussion............................................................................................................................... 125
References................................................................................................................... ............ 128
Chapter 7: Summary & future prospects
1. Introduction......................................................................................................................... 145
2. Summary of study design, execution and results................................................................ 145
3. Discussion........................................................................................................................... 145
3.1 PMA use in live/dead discrimination................................................................................ 145
3.2 Specificity of SSM, Xpert MTB/Rif and NWU-TB......................................................... 145
4. Future research focus.......................................................................................................... 150
5. References........................................................................................................................... 151
List of Annexures
“Annexure A”..........................................................................................................................153
“Annexure B”……………………………………………………….……………………..... 155
“Annexure C”…………………………………….................................................................. 168
“Annexure D”………………………......................................................................................171
“Annexure E”………………………...................................................................................... 193

xiii
LIST OF TABLES
Chapter 2: Literature Review
Table 1: Post-2015 Global TB strategy and targets.................................................................. 21
Table 2: Distance to nearest Medical Facility for the poorest 5th of the World population..... 22
Table 3: Categorical classification of facilities where diagnostics may be implemented.........23
Table 4: Proposed minimum specifications for new TB POC diagnostic tests........................ 25
Table 5: Tuberculosis diagnostic products in later-stage development.................................... 36
Table 6: TB diagnostic technologies endorsed by the WHO, since 2007................................. 37
Table 7: STARD checklist for reporting of studies of diagnostic accuracy............................. 46
Chapter 4: Multiplex-PCR based system for tuberculosis diagnosis
Table 1: Sequences of primers used in multiplex PCR............................................................ 84
Table 2: Demographic and microbiological information.......................................................... 86
Table 3: Performance of SSM, GeneXpert, and NWU-TB system.......................................... 86
Table 4: Sensitivities of SSM, GeneXpert, and NWU-TB system........................................... 87
Table 5: Performance outcomes of SSM, GeneXpert, and NWU-TB stratified by HIV status,
against MGIT culture as gold standard in the cohort................................................................ 87
Table 6: Frequencies of non-tuberculosis mycobacteria found in the cohort........................... 87
Table 7: Reported diagnostic performance of different NAATs in smear-negative sputum TB
presumptive individuals in different countries......................................................................... . 88
Chapter 5: Detection of M. tuberculosis by an improved NWU-TB
Table 1: Study population characteristics................................................................................. 99
Table 2: Performance of SSM, Xpert MTB/RIF and NWU-TB system................................. 100
Table 3: Smear and culture results of 50 clinical sputum samples used in PMA testing........101
Table 4: Discrepant results from the four tests including PMA-treated results from NWU-
TB............................................................................................................................................ 102
Chapter 6: Cost-effectiveness of NWU-TB in South Africa
Table 1: Model parameter values and ranges, and sources..................................................... 120
Table 2: Material costs per NWU-TB test...............................................................................121
Table 3: Medical Laboratory Technologist labour cost per NWU-TB test in South Africa... 122
Table 4: Equipment cost per test for NWU-TB...................................................................... 122
Table 5: Total cost per test for NWU-TB based on component costs.................................... 123
Table 6: Incremental cost-effectiveness ratios of the different diagnostic strategies ............123

xiv
Chapter 7: Preliminary results on MDR-TB detection
Table 1: Comparison of Performance and features of NWU-TB to commonly used TB diagnostic
tests in South Africa................................................................................................................ 137
Table 2: Sequences of primers and sloppy molecular beacons used in the study................... 141
LIST OF FIGURES
Chapter 1: Problem statement & study objectives
Figure 1: Map showing location of Orkney-Westvaal hospital, also showing its location relative to
Potchefstroom and Johannesburg................................................................................................ 6
Chapter 2: Literature Review
Figure 1: Incidence rates of TB infection in Sub-Saharan Africa compared to other geographic
regions....................................................................................................................................... 15
Figure 2: New TB cases in the 22 High-Burden Countries in 2013......................................... 18
Figure 3: Recent and projected trends in global TB incidence (cases) between 2015 and
2050........................................................................................................................................... 20
Figure 4: Characteristic serpentine structure of young M. tuberculosis colonies grown in
Middlebrook 7H9 broth for MODS.......................................................................................... 29
Figure 5: Xpert MTB/RIF assay overview. Steps 1 through to 3 are manual, while the rest of the
steps are automated................................................................................................................... 33
Figure 6: Hybridization patterns obtained with line probe strips.............................................. 34
Figure 7: 2013 TB diagnostics funders’ contributions.............................................................. 38
Figure 8: Current and emerging automated, semi-modular or non-integrated TB NAATs; their
intended laboratory location and release or anticipated time.................................................... 39
Figure 9: Schematic description of the workflow for LoopAMP MTBC................................. 40
Figure 10: The XCP nucleic acid detection device (Ustar).......................................................42
Figure 11: Components of the Genedrive system developed by Epistem.................................43
Figure 12: Sputum is added to a red-capped sample bottle containing lyophilized reagents to
liquefy the sputum..................................................................................................................... 44
Figure 13: Schematic of the tuberculosis diagnostics development pathway........................... 45
Figure 14: An example of a basic decision tree for decision analysis...................................... 48

xv
Chapter 4: Multiplex-PCR based system for tuberculosis diagnosis
Figure 1: Lyser device and lysis microreactor used during cell lysis step in the NWU-TB
system........................................................................................................................................ 84
Figure 2: Multiplex PCR amplification of IS6110 (123 bp), MPT64 (240 bp) and protein antigen
b (419 bp).................................................................................................................................. 85
Figure 3: Patient flow, showing two arms for data analyses, namely the Cohort and
Subgroup................................................................................................................................... 85
Figure 4: Time to Positivity after MGIT culture of NWU-TB system lysed 10-fold serial dilutions
of M........................................................................................................................................... 87
Figure 5: Aerial view of LMR showing a fitted filter to trap bioaerosols during heat lysis..... 88
Chapter 5: Detection of M. tuberculosis by an improved NWU-TB
Figure 1: Correlation between NWU-TB CT values and bacteriology results....................... 100
Figure 2: Receiver operator characteristic curves for NWU-TB, SSM and GeneXpert compared to
MGIT culture as gold standard............................................................................................... 101
Figure 3: Comparison between the mean difference in threshold cycle (∆Ct) obtained from sputum
samples collected from patient either receiving anti-tuberculosis therapy (treatment group) or not
receiving treatment (treatment naive)..................................................................................... 103
Chapter 6: Cost-effectiveness of NWU-TB in South Africa
Figure 1: Simplified schematic of decision tree used in the study.......................................... 119
Figure 2: Cost-effectiveness analysis output graph................................................................ 124
Figure 3: One-way sensitivity-analysis of key parameters used in the model........................ 125
Chapter 7: Preliminary results on MDR-TB detection
Figure 1: Light exposure apparatus used in the PMA assay................................................... 125

xvi
LIST OF ABBREVIATIONS
All abbreviations are indicated and explained where they first appear in the text, where after only
the abbreviation is used.
ACF Active case finding
AFB Acid fast bacteria
AUC Area under curve
BHQ Black Hole Quencher
CEA Cost-effectiveness analysis
CFU Colony forming unit
CI Confidence Interval
CT Cycle threshold
DALY Disability-adjusted life year
DNA Deoxyribonucleic acid
DOR Diagnostic odds ratio
DST Drug susceptibility testing
EPTB Extrapulmonary tuberculosis
FAM Fluorescein amidite
FDA Food and Drug Administration
FIND Foundation for Innovative New Diagnostics)
gDNA genomic DNA
HBCs High-burden countries
HEG Hexathylene glycol
HIV Human immunodeficiency virus
ICER Incremental cost-effectiveness ratio
INH Isoniazid
LAMP Loop mediated isothermal amplification
LMR Lysis microreactor
LTBI Latent TB infection
MDR-TB Multidrug resistant TB
MGIT Mycobacterial growth indicator tube
MODS Microscopic-observation drug-susceptibility assay
MOTT Mycobacteria other than tuberculosis
M-PCR Multiplex- Polymerase chain reaction
MTB Mycobacterium tuberculosis

xvii
MTBC Mycobacterium tuberculosis complex
NAATS Nucleic acid amplification tests
NALC N-acetyl-L-cysteine-sodium hydroxide
NaOH Sodium hydroxide
NHLS National Health Laboratory Service
NICD National Institute of Communicable Diseases
NPV Negative predictive value
NTM Nontuberculous mycobacteria
NWU-TB North-West University-TB
PCR Polymerase chain reaction
PLHIV People living with HIV
PMA Propidium monoazide
POC Point-of-care
PPV Positive predictive value
RIF Rifampin
RMP Rifampin
RNA Ribonucleic acid
RRDR Rifampicin Resistance Determining Region
S2D2 Single step DNA diagnostics
SMB Sloppy molecular beacon
SSM Sputum smear microscopy
STARD Standards for the Reporting of Diagnostic accuracy studies
TAT Total assay time
TB Tuberculosis
VAT Value added tax
WHO World Health Organization
WTP Willingness to pay threshold
XDR-TB Extensively drug-resistant TB
ZN Ziehl-Neelsen

This is an introductory chapter to the thesis, and it defines current challenges/problems associated
with tuberculosis diagnosis and outlines the objectives of the study in order to address some of the
challenges that have been highlighted.

Chapter 1: Problem statement & study objectives
2
Image (advertorial) reprinted from Colorado State University news article (2012)
1.1 Background and Problem statement
Tuberculosis is an ancient scourge that has plagued humankind throughout its known history
(Daniel, 2006). In his famous 1882 Die Aetiologie der Tuberculose presentation to the Berlin
Physiological Society, Robert Koch outlined the structure of the tubercle bacillus, which is the
causative agent of Mycobacterium Tuberculosis (MTB). Since then, significant progress has been
made on many fronts including discovery of potent drugs, a co-ordinated international response to
control the spread of the disease and the development of diagnostic tests. However, in spite of
these positive developments, an estimated one third of the world’s population still has latent
tuberculosis (TB) infection (Dagnew et al., 2012). The rise of the colliding human
immunodeficiency virus (HIV) epidemic also threatens to erode the modest gains made in the
global fight against TB. In 2013 alone, there were an estimated 9.0 million new cases of TB (13%
co-infected with HIV) and 1.5 million TB deaths globally (World Health Organization, 2014). In
the same year, the proportion of new cases with multidrug resistant TB (MDR-TB) remained
largely unchanged at 3.5% in comparison to recent years (World Health Organization, 2014).
Although TB is curable and treatment is freely available in low-income countries; the
unavailability of rapid, affordable, highly sensitive and specific diagnostic tools is inhibiting
initiation of appropriate therapy in a timely manner. Inappropriate treatment as a result of the
diagnostic challenges, the associated treatment initiation delays and poor patient compliance are
some of the main drivers of the recent increase of multidrug resistant-TB (MDR-TB) cases
(Andrews et al., 2007; Lange et al., 2014; Li et al., 2014). Correct diagnosis of TB is needed to
improve treatment, reduce transmission, and control development of drug resistance. Despite
spirited efforts within the scientific community and other stakeholders to develop better diagnostic

Chapter 1: Problem statement & study objectives
3
tests, the century old sputum smear microscopy (SSM) technique remains the mainstay of TB
diagnosis, as it is the most widely used and often only available test in low-income countries
(Weyer et al., 2011). SSM is cheap (costs less than US$ 3 per test) (Shah et al., 2013) and has a
short turnaround time (2-3 days) which makes it attractive, but it is handicapped by its poor and
variable accuracy, the need for multiple specimens to make a diagnosis and the requirement of
skilled microscopists (Pai et al., 2004). Infection with HIV further reduces the sensitivity of SSM
and increases the proportion of extrapulmonary disease cases. In a study of HIV-positive TB
patients in Khayelitsha, South Africa, 49% of patients had negative smears and positive cultures
(Coetzee et al., 2004). Culture, another century old test, remains the gold standard for TB diagnosis
despite its high cost and lengthy turnaround times (2-6 weeks) (Somoskovi et al., 2000). The
requirement for expensive technology, reliable electricity supply, biosafety infrastructure, and
trained laboratory staff also limit its use in most high-burden settings (Niemz & Boyle, 2012). In
addition, culture has been reported to miss as many as 20% of true TB cases among HIV-TB
coinfected patients and is prone to contamination (Chien et al., 2000; Wilson et al., 2006; Schito
et al., 2012). This also presents serious challenges when evaluating new diagnostic tests, as the
globally accepted gold standard itself is not 100% accurate.
In the past two decades, much effort has been expended on bringing nucleic acid amplification
tests (NAATS) to the market. DNA isolation from sputum introduces complexities due to the
presence of contaminating fungi and bacteria, presence of PCR inhibitors, and identification of
suitable molecular targets are some of the difficulties faced in the development of NAATs for
point-of-care (POC) testing. In spite of these challenges, several commercial and in-house NAATs
have been developed over the years with differing degrees of success. A meta-analysis study
reported sensitivities and specificities of in-house NAATs to be 9.4%–100% and 5.6%–100%
respectively (Flores et al., 2005) compared to 36%–100% and 54%–100% (Ling et al., 2008) for
commercial assays. Despite the good accuracies for some of the commercial NAATs, their
widespread adoption in resource-limited settings has been inhibited by high cost, cold chain
requirements for reagents and level of technical skill required to operate them (McNerney et al.,
2015).
Recently, Xpert MTB/Rif (Cepheid, Sunnyvale, CA), launched an automated NAATs, which
simultaneously detects MTB and resistance to rifampicin, and has been endorsed by the World
Health Organization (WHO) (Weyer et al., 2013). A single cartridge integrates sample processing,
amplification, and detection of amplicons thus reducing the amount of manual manipulation and
Chapter 1: Problem statement & study objectives
4
level of technical expertise required (Boehme et al., 2010). Results are available within 2 hours
from receipt of patient specimen. South Africa was one of the first countries to roll out the Xpert
MTB/Rif assay and by the end of 2011 the country had procured over half (330,540 cartridges out
of 591,450 cartridges) of the cartridges produced by Cepheid (WHO, February 2012). Early
clinical evaluation studies had predicted that the good sensitivity and specificity of the test would
translate into dramatic increases in case detection and cure rates but emerging reports indicate that
the test has not made significant impact on morbidity and mortality (McNerney & Zumla, 2015).
Like all other available NAATs, Xpert MTB/Rif cannot be used in treatment monitoring due to its
inability to distinguish between live and dead mycobacteria. Further weaknesses of the assay
include high costs, stable electricity supply requirement and the need for annual calibration
(McNerney et al., 2012).
There is a debate on the definition of a POC test (Hicks et al., 2001; Schito et al., 2012). Traditional
definitions of POC testing are mainly product-oriented (e.g. dipstick) but we support a goal-
oriented view (i.e. rapid initiation of treatment). Thus POC testing is defined as “testing that will
result in a clear, actionable management decision within the same clinical encounter” (Dowdy et
al., 2014). Cognisant of the diversity of requirements that an ideal POC test must possess, which
are almost impossible to satisfy with a single test, developers have to make some trade-offs
especially between sensitivity and specificity. Two possible scenarios with very different technical
specification requirements exist: Developers may either concentrate on having a POC test suitable
for community-based screening to eliminate infection reservoirs or focus on a confirmatory test
based at the clinic. For example, high sensitivity is mandatory for a screening test and a lower
specificity may be acceptable but in the case of a confirmatory test specificity becomes more
important than sensitivity in order to avoid false positives which may lead to inappropriate
treatment (Dowdy et al., 2014).
1.2 Study Rationale
The TB diagnostics pipeline has expanded rapidly in recent years in response to the diagnostic
gaps identified in the problem statement, but the ideal POC test continues to elude us. Limitations
of current diagnostic tests are partly responsible for the estimated 3 million infectious cases that
are missed annually and this has contributed to the current size of the epidemic (World Health
Organization, 2014). A modelling study predicts that a rapid and widely accessible POC test
requiring no laboratory infrastructure could reduce both TB prevalence and mortality and save as
many as 400,000 lives annually (Keeler et al., 2006). The World Health Organization has thus

Chapter 1: Problem statement & study objectives
5
identified the development of new diagnostic tools as one of the three key pillars in the post-2015
global TB strategy and the policy has been recently adopted by the World Health Assembly (World
Health Organization, 2014).
In view of the aforementioned TB diagnostic problems and global efforts to address them, this
study was consummated in order to overcome or at least minimise the technical limitations and/or
to provide a commercially viable alternative to the available tests. This study, which is part of a
large study titled “Rapid Diagnosis of Tuberculosis in Resource poor settings”, was conceived and
carried out under the guidance of Prof Anne F Grobler and Prof Hendrik Viljoen. The project was
a collaborative study between the North-West University, Potchefstroom campus in South Africa
and the University of Nebraska-Lincoln, Omaha, in the USA.
1.3 Aim of the Study
The aim of the study was to develop a new POC test for tuberculosis diagnosis that (i) provides
results on the same day and is user-friendly (ii) can accurately diagnose infected individuals
leading to treatment initiation on the same clinical encounter, (iii) suitable for TB diagnosis in
adults within a high HIV prevalence setting (iv) ideal for the infrastructure level present at primary
healthcare facilities and/or community-based screening, (v) can possibly detect drug resistance,
and (vi) has a low cost.
1.4 Study Objectives
The first and major objective of this study was to develop a low cost, same day (1h turnaround
time) test suitable for community based TB disease screening. The developed test was initially
referred to as single step DNA diagnostics (S2D2) but the name was later changed to NWU-TB
system (used in most of the chapters in this thesis). The second objective was to evaluate the
performance of the test in clinical samples in comparison to other microbiological tests currently
used in South Africa (sputum smear microscopy (SSM), culture, Xpert MTB/Rif). As mentioned
earlier, HIV infection decreases the sensitivity of TB tests and the new test must have better
sensitivity in HIV infected patients in order to make a significant impact in South Africa. Yearly,
an estimated 30% of the global cases of HIV-associated TB occur in South Africa (Meintjes, 2014).
Within South Africa, HIV-TB coinfection cases are highest among miners and prisoners (Stuckler
et al., 2011; Telisinghe et al., 2014). In order to ensure that the sample size was sufficiently
powered, clinical evaluation was conducted at AngloGold Ashanti Orkney-Westvaal Hospital
which caters for the company’s mining personnel. Orkney is a gold mining town situated in the

Chapter 1: Problem statement & study objectives
6
Klerksdorp district of the North West province of South Africa and approximately 180 km from
Johannesburg.
Figure 1: Map showing location of Orkney-Westvaal hospital, also showing its location relative to
Potchefstroom and Johannesburg. Source: Google Earth, 2016. Accessed on 11 February 2016.
SSM and NAATs offer no information with regards to viability of mycobacteria thus both cannot
be used to monitor treatment outcomes. Conventional culture is thus relied upon for treatment
monitoring but due to its long turnaround time (2-6 weeks), routine bedside treatment decisions
cannot be made. The third objective of this study aimed to address this limitation of NAATs by
developing a strategy that enables NWU-TB to be used in treatment outcomes monitoring.
Diagnostic accuracy (sensitivity and specificity) of POC tests is an insufficient indicator of the
potential impact on morbidity and mortality of the test after deployment. Recent studies are
indicating that, despite the high accuracy of Xpert MTB/Rif in clinical evaluation studies, its
impact on new case detection and patient survival has been minimal (Theron et al., 2014;
McNerney et al., 2015; McNerney & Zumla, 2015). Instead of drawing conclusions about the
potential impact of NWU-TB after deployment based entirely on diagnostic accuracy data, the
fourth and final objective of the study was to estimate the cost per test for NWU-TB from a

Chapter 1: Problem statement & study objectives
7
healthcare provider’s perspective and further determine its cost-effectiveness in community based
screening of all miners in South Africa. By addressing the four objectives mentioned above, we
will be able to develop a prototype of the NWU-TB system suitable for TB diagnosis and treatment
monitoring.
1.5 Structure of the thesis
This thesis was submitted in full fulfilment of the requirements of a Doctor of Philosophy degree
in Pharmaceutics at North-West University, Potchefstroom Campus, South Africa. The study
forms part of the “Rapid Diagnosis of Tuberculosis in Resource poor settings” project and was
financially supported by the South African Technology Innovation Agency (TIA), South Africa
Medical Research Council - Strategic Health Innovation Partnerships (MRC-SHIP), the South
African TB Research & Innovation Initiative (SATRII), and the North-West University. This
thesis is submitted in a manuscript format in accordance with the General Academic Rules
(A.7.5.7.4) of the North-West University. Each chapter is written in accordance with specific
guidelines as stipulated by the journals intended for publication. Manuscript 1 has been accepted
and published in the Journal of Microbiological Methods; manuscript 2 has been submitted to the
Journal of Clinical Microbiology and is still under review; and manuscript 3 has also been
submitted to BMC Infectious Diseases and is still under review.
1.6 Dissemination of findings
Findings from this study were presented to a broad audience including North West Provincial
government leadership, clinicians, laboratory technologists, academics and managers from the
Department of Health. The manuscripts emanating from this project were written to distribute the
findings of the study and one of them has already been published and can be accessed online. The
articles will mainly cater for the academic community, laboratory technologists and clinicians. I
delivered presentations at local workshops/conferences especially in the North West Province in
order to disseminate information to local stakeholders and government officials. I also presented
part of the work at the point-of-care diagnostics world congress held on 18-19 September 2014 in
San Diego, California, USA.

Chapter 1: Problem statement & study objectives
8
1.7 Declarations
The contribution for each author in the manuscripts is as follows:
I. Mutingwende (Candidate)
Planning and design of the studies.
Experimental work.
Interpretation of results.
Writing of the manuscripts and thesis.
Corresponding author of manuscripts.
Prof. A.F. Grobler (Promoter)
Conceptualisation of the main study within which this project falls.
Supervision of the planning and design of the studies.
Assistance in the interpretation of results.
Supervision and critical review in the writing of the manuscripts and thesis.
Corresponding author of manuscripts.
Sourcing of funding for the study.
Prof. H. J. Viljoen (Co-promoter)
Conceptualisation of the main study within which this project falls.
Supervision of the planning and design of the studies.
Assistance in the interpretation of results.
Supervision and critical review in the writing of the manuscripts and thesis.
Prof. H.S. Steyn
Performed some of the statistical analysis
Critical review in the writing of some of the manuscripts
Mr. Urban Vermeulen
Design and manufacturing of some of the special equipment used in this study.
Assistance in the interpretation of results.
Critical review in the writing of some of the manuscripts.

Chapter 1: Problem statement & study objectives
9
1.8 References
Andrews, J.R., Sarita Shah, N., Gandhi, N., Moll, T. & Friedland, G. 2007. Multidrug-Resistant
and Extensively Drug-Resistant Tuberculosis: Implications for the HIV Epidemic and
Antiretroviral Therapy Rollout in South Africa. Journal of Infectious Diseases, 196(Supplement
3):S482-S490.
Boehme, C.C., Nabeta, P., Hillemann, D., Nicol, M.P., Shenai, S., Krapp, F., Allen, J., Tahirli, R.,
Blakemore, R., Rustomjee, R., Milovic, A., Jones, M., O'Brien, S.M., Persing, D.H., Ruesch-
Gerdes, S., Gotuzzo, E., Rodrigues, C., Alland, D. & Perkins, M.D. 2010. Rapid molecular
detection of tuberculosis and rifampin resistance. New England Journal of Medicine,
363(11):1005-1015.
Chien, H.P., Yu, M.C., Wu, M.H., Lin, T.P. & Luh, K.T. 2000. Comparison of the BACTEC
MGIT 960 with Löwenstein-Jensen medium for recovery of mycobacteria from clinical
specimens. The International Journal of Tuberculosis and Lung Disease, 4(9):866-870.
Coetzee, D., Hilderbrand, K., Goemaere, E., Matthys, F. & Boelaert, M. 2004. Integrating
tuberculosis and HIV care in the primary care setting in South Africa. Tropical Medicine &
International Health, 9(6):A11-15.
Dagnew, A.F., Hussein, J., Abebe, M., Zewdie, M., Mihret, A., Bedru, A., Chanyalew, M.,
Yamuah, L., Medhin, G., Bang, P., Doherty, T.M., Hailu, A. & Aseffa, A. 2012. Diagnosis of

Chapter 1: Problem statement & study objectives
10
latent tuberculosis infection in healthy young adults in a country with high tuberculosis burden
and BCG vaccination at birth. BMC Research Notes, 5:415.
Daniel, T.M. 2006. The history of tuberculosis. Respiratory Medicine, 100(11):1862-1870.
Dowdy, D.W., Houben, R., Cohen, T., Pai, M., Cobelens, F., Vassall, A., Menzies, N.A., Gomez,
G.B., Langley, I., Squire, S.B., White, R. & for the, T.B.M.A.C.m.p. 2014. Impact and cost-
effectiveness of current and future tuberculosis diagnostics: the contribution of modelling. The
International Journal of Tuberculosis and Lung Disease, 18(9):1012-1018.
Flores, L., Pai, M., Colford, J. & Riley, L. 2005. In-house nucleic acid amplification tests for the
detection of Mycobacterium tuberculosis in sputum specimens: meta-analysis and meta-
regression. BMC Microbiology, 5(1):55.
Hicks, J.M., Haeckel, R., Price, C.P., Lewandrowski, K. & Wu, A.H.B. 2001. Recommendations
and opinions for the use of point-of-care testing for hospitals and primary care: summary of a 1999
symposium. Clinica Chimica Acta, 303(1–2):1-17.
Keeler, E., Perkins, M.D., Small, P., Hanson, C., Reed, S., Cunningham, J., Aledort, J.E.,
Hillborne, L., Rafael, M.E., Girosi, F. & Dye, C. 2006. Reducing the global burden of
tuberculosis: the contribution of improved diagnostics. Nature, 444 Suppl 1:49-57.
Lange, C., Abubakar, I., Alffenaar, J.-W.C., Bothamley, G., Caminero, J.A., Carvalho, A.C.C.,
Chang, K.-C., Codecasa, L., Correia, A., Crudu, V., Davies, P., Dedicoat, M., Drobniewski, F.,
Duarte, R., Ehlers, C., Erkens, C., Goletti, D., Günther, G., Ibraim, E., Kampmann, B., Kuksa, L.,
de Lange, W., van Leth, F., van Lunzen, J., Matteelli, A., Menzies, D., Monedero, I., Richter, E.,
Rüsch-Gerdes, S., Sandgren, A., Scardigli, A., Skrahina, A., Tortoli, E., Volchenkov, G., Wagner,
D., van der Werf, M.J., Williams, B., Yew, W.-W., Zellweger, J.-P. & Cirillo, D.M. 2014.
Management of patients with multidrug-resistant/extensively drug-resistant tuberculosis in
Europe: a TBNET consensus statement. European Respiratory Journal, 44(1):23-63.
Li, Y., Ehiri, J., Oren, E., Hu, D., Luo, X., Liu, Y., Li, D. & Wang, Q. 2014. Are We Doing
Enough to Stem the Tide of Acquired MDR-TB in Countries with High TB Burden? Results of a
Mixed Method Study in Chongqing, China. PLoS ONE, 9(2):e88330.

Chapter 1: Problem statement & study objectives
11
Ling, D.I., Flores, L.L., Riley, L.W. & Pai, M. 2008. Commercial Nucleic-Acid Amplification
Tests for Diagnosis of Pulmonary Tuberculosis in Respiratory Specimens: Meta-Analysis and
Meta-Regression. PLoS ONE, 3(2):e1536.
McNerney, R., Cunningham, J., Hepple, P. & Zumla, A. 2015. New tuberculosis diagnostics and
rollout. The International Journal of Tuberculosis and Lung Disease, 32:81-86.
McNerney, R., Maeurer, M., Abubakar, I., Marais, B., Mchugh, T.D., Ford, N., Weyer, K., Lawn,
S., Grobusch, M.P., Memish, Z., Squire, S.B., Pantaleo, G., Chakaya, J., Casenghi, M., Migliori,
G.-B., Mwaba, P., Zijenah, L., Hoelscher, M., Cox, H., Swaminathan, S., Kim, P.S., Schito, M.,
Harari, A., Bates, M., Schwank, S., O’Grady, J., Pletschette, M., Ditui, L., Atun, R. & Zumla, A.
2012. Tuberculosis Diagnostics and Biomarkers: Needs, Challenges, Recent Advances, and
Opportunities. Journal of Infectious Diseases, 205(suppl 2):S147-S158.
McNerney, R. & Zumla, A. 2015. Impact of the Xpert MTB/RIF diagnostic test for tuberculosis
in countries with a high burden of disease. Current Opinion in Pulmonary Medicine, 21(3):304-
308.
Meintjes, G. 2014. Management challenges in tuberculosis and HIV. South African Medical
Journal, 104(12):885-885.
Niemz, A. & Boyle, D.S. 2012. Nucleic acid testing for tuberculosis at the point-of-care in high-
burden countries. Expert review of molecular diagnostics, 12(7):687-701.
Pai, M., McCulloch, M., Enanoria, W. & Colford, J.M. 2004. Systematic reviews of diagnostic
test evaluations: What's behind the scenes? Evidence-Based Medicine 9:101 - 103.
Schito, M., Peter, T.F., Cavanaugh, S., Piatek, A.S., Young, G.J., Alexander, H., Coggin, W.,
Domingo, G.J., Ellenberger, D., Ermantraut, E., Jani, I.V., Katamba, A., Palamountain, K.M.,
Essajee, S. & Dowdy, D.W. 2012. Opportunities and Challenges for Cost-Efficient
Implementation of New Point-of-Care Diagnostics for HIV and Tuberculosis. Journal of
Infectious Diseases, 205(suppl 2):S169-S180.

Chapter 1: Problem statement & study objectives
12
Shah, M., Chihota, V., Coetzee, G., Churchyard, G. & Dorman, S. 2013. Comparison of
laboratory costs of rapid molecular tests and conventional diagnostics for detection of tuberculosis
and drug-resistant tuberculosis in South Africa. BMC Infectious Diseases, 13(1):352.
Somoskovi, A., Kodmon, C., Lantos, A., Bartfai, Z., Tamasi, L., Fuzy, J. & Magyar, P. 2000.
Comparison of recoveries of mycobacterium tuberculosis using the automated BACTEC MGIT
960 system, the BACTEC 460 TB system, and Lowenstein-Jensen medium. Journal of Clinical
Microbiology, 38(6):2395-2397.
Stuckler, D., Basu, S., McKee, M. & Lurie, M. 2011. Mining and Risk of Tuberculosis in Sub-
Saharan Africa. American Journal of Public Health, 101(3):524-530.
Telisinghe, L., Fielding, K.L., Malden, J.L., Hanifa, Y., Churchyard, G.J., Grant, A.D. &
Charalambous, S. 2014. High Tuberculosis Prevalence in a South African Prison: The Need for
Routine Tuberculosis Screening. PLoS ONE, 9(1):e87262.
Theron, G., Zijenah, L., Chanda, D., Clowes, P., Rachow, A., Lesosky, M., Bara, W., Mungofa,
S., Pai, M., Hoelscher, M., Dowdy, D., Pym, A., Mwaba, P., Mason, P., Peter, J. & Dheda, K.
2014. Feasibility, accuracy, and clinical effect of point-of-care Xpert MTB/RIF testing for
tuberculosis in primary-care settings in Africa: a multicentre, randomised, controlled trial. The
Lancet, 383(9915):424-435.
Weyer, K., Carai, S. & Nunn, P. 2011. Viewpoint TB Diagnostics: What Does the World Really
Need? Journal of Infectious Diseases, 204(suppl 4):S1196-S1202.
Weyer, K., Mirzayev, F., Migliori, G.B., Van Gemert, W., D'Ambrosio, L., Zignol, M., Floyd, K.,
Centis, R., Cirillo, D.M., Tortoli, E., Gilpin, C., de Dieu Iragena, J., Falzon, D. & Raviglione, M.
2013. Rapid molecular TB diagnosis: evidence, policy making and global implementation of
Xpert MTB/RIF. European Respiratory Journal, 42(1):252-271.
WHO. February 2012. Update on Xpert MTB/RIF roll out Xpert MTB/RIF February 2012.
Wilson, D., Nachega, J., Morroni, C., Chaisson, R. & Maartens, G. 2006. Diagnosing smear-
negative tuberculosis using case definitions and treatment response in HIV-infected adults. The
International Journal of Tuberculosis and Lung Disease, 10(1):31-38.

Chapter 1: Problem statement & study objectives
13
World Health Organization. 2014. Global tuberculosis report 2014. World Health Organization:
Geneva. URL: http://www.who.int/tb/publications/global_report/gtbr14_main_text.pdf (Date of
acces:
17 January 2015).
World Health Organization. 2014. Global strategy and targets for tuberculosis prevention, care
and control after 2015. World Health Organization: Geneva. URL:
http://www.who.int/tb/post2015_strategy/en/ (Date of access: 11 November 2014).

12
This chapter reviews relevant literature on tuberculosis diagnosis. It specifically focuses on the
disease burden and the current diagnostic landscape, highlighting the strengths and weaknesses of
available tools, and identifying the gaps that new tools must address if global tuberculosis
eradication by 2050 is to be achieved.

Chapter 2: Literature review
13
1.1 Mycobacterium tuberculosis
The genus Mycobacterium consists of more than 160 species, which are divided into three groups;
M. tuberculosis complex (MTBC), M. leprae, and non-tuberculous mycobacteria (NTM) (also
termed atypical mycobacteria or 'mycobacteria other than M. tuberculosis complex') (Rastogi et
al., 2001; Jang et al., 2014). Tuberculosis (TB) is caused by one of the members of a group closely
related mycobacterial species belonging to the MTBC. There are about nine mycobacterial species
belonging to the complex. Although the complex members have different host ranges and
phenotypic characteristics, they exhibit extreme genetic similarity, with 0.01%–0.03%
synonymous nucleotide variation (Gutierrez et al., 2005). In humans, TB infections are mainly
caused by these mycobacterial species; M. tuberculosis, M. africanum, M. canettii, and M. bovis
(Grange, 2001; de Jong et al., 2010; Koeck et al., 2010; Mireia et al., 2013). M. bovis is the main
cause of tuberculosis in cattle, and other domesticated mammals (Cole et al., 1998). Other species
causing TB disease in various mammalian hosts include: M. microti, M. caprae, M. pinnipedii, M.
suricattae and M. mungi (Kremer et al., 1998; Alexander et al., 2010; Sabrina et al., 2011; Parsons
et al., 2013; Loeffler et al., 2014).
The M. tuberculosis genome is 4,411,529 base pairs (bp) long, with a G+C content of 65.6%
(Kremer et al., 1998). Molecular tools targeting various regions of this genome have been
developed for identification and characterization purposes. Early molecular methods to detect or
identify M. tuberculosis targeted the insertion sequences IS6110 and IS1081 (Thierry et al., 1990;
Collins & Stephens, 1991). With time, the panel of molecular targets increased to include: rrs,
gyrA, gyrB, hsp65, recA, rpoB, sodA genes and 16S-23S internal transcribed spacer (ITS) genes
(Radomski et al., 2013).
1.2 Tuberculosis pathogenesis
M. tuberculosis is spread by air when an infectious person coughs or sneezes expelling infectious
aerosol droplets 0.5 to 5.0 µm in diameter. An estimated 22% of those exposed to the infectious
aerosol droplets become infected with M. tuberculosis. Ninety percent (90%) of those infected
with M. tuberculosis remain asymptomatic, which is referred to as latent TB infection (LTBI)
(Ducati et al., 2006). In HIV uninfected individuals with LTBI, the lifetime risk of progressing to
TB disease (symptomatic TB) ranges between 10% and 20% (Corbett et al., 2003). However, in
MTB/HIV coinfected individuals, the annual risk of progressing to TB disease exceeds 10%
(Corbett et al., 2003).

Chapter 2: Literature review
14
In most cases TB disease progression follows the general four stage process described by Wallgren
(Wallgren, 1948; Smith, 2003). In stage one, which occurs 3 to 8 weeks following exposure to M.
tuberculosis, the inhaled infectious droplets lodge in the alveoli. These droplets are then
disseminated via the lymphatic circulation to lymph nodes in the lungs leading to the formation of
Ghon complex. The Ghon complex is subpleural lesion that also involves infection of the adjacent
lymphatics and hilar lymph nodes. At this time, conversion to tuberculin reactivity occurs. In stage
two, the mycobacteria are disseminated to other parts of the lungs and body organs via blood
circulation. This stage lasts for about 3 months, and death due to tuberculous meningitis or miliary
(disseminated) TB can occur during this stage. In the third stage, there is inflammation of the
pleural surfaces leading to severe chest pains. Typically, the stage lasts for 3 to 7 months, but can
be delayed for up to 2 years. Pleurisy occurs when TB antigens enter the pleural space thereby
eliciting an intense immune response. Initially, neutrophils and macrophages are involved,
followed by interferon (IFN)-γ-producing T-helper cell (Th) type 1 lymphocytes, which activates
macrophages to overcome inhibition of phagolysosome maturation (MacMicking et al., 2003;
Trajman et al., 2008). The activated macrophages process and present mycobacterial antigen to
CD4+ lymphocytes, thereby initiating a cell-mediated response, which in turn results in the
production of a number of cytokines such as TNF-α, IFN-γ, IL-6 and IL-12 (Lawn et al., 2002).
These cytokines attract and activate more macrophages leading to the formation of a granuloma
whose main function is to ‘wall off’ bacteria in the host, resulting in containment or cure in 90%
of individuals (Lawn et al., 2002; Zuñiga et al., 2012). In the last stage, the disease does not
progress and this may last for about 3 years. During this time, some individuals develop
extrapulmonary lesions in bones and joints and these usually present as chronic back pain.
Since the granuloma sit at the epicentre of TB immunopathogenesis and CD4+ lymphocytes are
crucially involved in its formation, depletion of CD4+ lymphocytes in HIV infected individuals
has an impact on the process. Studies suggest that CD4+ lymphocytes help maintain the
architecture and integrity of the granuloma and thus the reactivation of latent M. tuberculosis
infection, dissemination, and progression to active TB disease in co-infected individuals are
prevented (Sonnenberg et al., 2001; Diedrich & Flynn, 2011). As a result of the disruption in
granuloma formation, there is poor containment of mycobacteria which then spread to the lungs
and other parts of the body. This explains why the proportion of extrapulmonary tuberculosis
(EPTB) cases is higher among HIV-infected individuals than among HIV-uninfected individuals.
The consequent presence of fewer bacilli in sputum specimens from HIV/TB co-infected

Chapter 2: Literature review
15
individuals compared to HIV-uninfected individuals makes microbiological diagnosis of active
TB disease challenging (Shankar et al., 2014).
1.3 Tuberculosis Burden
Tuberculosis (TB) is the world’s second leading cause of death from a single infectious agent,
accounting for approximately 1.5 million deaths in 2013 (World Health Organization, 2014a).
Although, there has been a 41% decline in TB prevalence since 1990, the war is not over and new
challenges are emerging. The rise in multi-drug resistant tuberculosis (MDR-TB) cases, 3 million
un-diagnosed TB patients and diagnostic complications associated with HIV/TB co-infection seek
to erode those gains.
All regions of the world are affected by TB as shown in Figure , though about 80% of new cases
occur in 22 high-burden countries (HBCs) yearly (World Health Organization, 2010). In 2013, an
estimated 9 million people developed TB disease; approximately 56% of these were in South-East
Asia and Western Pacific Regions; another 25% were in the African Region, which also had the
highest incidence rates (280 cases per 100,000 population) and deaths relative to population. But
among these 9 million people who developed TB in 2013, over a third (about 3 million cases) were
not diagnosed, mainly due to shortcomings of the available TB diagnostic systems. These current
systems are either ill-adapted to resource-limited settings or specific patient needs, or simply
priced beyond the reach of the target population (UNITAID, 2015).
Figure 1: Incidence rates of TB infection in Sub-Saharan Africa compared to other geographic
regions. The darker colours indicate regions with the highest incidence whereas the lighter colours
indicate regions with the lowest incidence. Reprinted from (World Health Organization, 2014a),
with permission from the World Health Organization.

Chapter 2: Literature review
16
Although TB is an airborne disease, it is not an equal opportunity disease as the route of
transmission may suggest. For a number of reasons, some population groups are at a higher risk to
develop active TB disease compared to the general population. These high risk groups include:
HIV infected individuals, prisoners, miners, the elderly, children under 5 years, TB contacts,
diabetics, homeless individuals and the urban poor (Glynn et al., 2005; Parwati et al., 2010;
Prados-Torres et al., 2013; Vinkeles Melchers et al., 2013; Telisinghe et al., 2014). In 2013, an
estimated 1.1 million (13 %) of the 9 million people who developed TB were HIV-positive,
making HIV seropositivity the biggest predisposing factor. Appropriate and affordable diagnostic
tools for active case finding in these high risk groups should be prioritized, as every untreated
person with active pulmonary TB may infect as many as 10–15 people every year (Nathanson et
al., 2010). Health-care providers should recognize the increased risk of TB in these populations
and give special attention to surveillance and preventive services.
1.3.1 Pediatric tuberculosis
Childhood TB has been dubbed the hidden epidemic due to the difficulties in diagnosis in most
children. In 2013, there were an estimated 530,000 TB cases (6 % of global total cases) among
children under 15 years of age (World Health Organization, 2014a). Sputum smear microscopy
(SSM) and culture, the two common tests for TB diagnosis, yield false negative results in most
children and consequently the diagnosis is made based on clinical diagnosis (Zar et al., 2010;
Perez-Velez & Marais, 2012). However, signs and symptoms of childhood TB are non-classical
and unreliable since they also appear in other diseases, thus making clinical diagnosis unreliable
as well (Marais et al., 2005; Bergamini et al., 2009; Anderson et al., 2014). Furthermore, adoption
of unvalidated clinical scores in different settings leads to over-or–under diagnosis and thus often
results in inappropriate treatment (Hesseling et al., 2002; Hatherill et al., 2010; Pearce et al., 2012).
Radiological examinations in childhood TB are nonspecific (Swingler et al., 2005). Children also
have difficulty expectorating sputum, the common TB test specimen. In conclusion, diagnosing
childhood TB is different from that of adult TB, thus tests suitable for diagnosing childhood TB
are urgently required.
1.3.2 Drug-resistant TB burden
Multidrug-resistant (MDR) and extensively drug-resistant (XDR) TB are emerging global health
threats (Zumla et al., 2012). MDR-TB is defined as resistance to rifampicin and isoniazid, the two
common first-line anti-TB drugs, while XDR-TB is defined as MDR-TB with additional resistance
to a fluoroquinolone and one of the second-line injectable drugs (Migliori et al., 2007). MDR-TB

Chapter 2: Literature review
17
treatment is complicated, lengthy, expensive and associated with very high morbidity and
mortality. Recently, totally drug-resistant TB strains that are resistant to all currently available
drugs have also emerged (Velayati et al., 2009). Globally, in 2013, the WHO estimates that
450,000 people developed MDR-TB; of these, 170,000 people died. It is also estimated that less
than one in four cases of MDR-TB were detected in 2012, thus highlighting the inadequacies of
current diagnostics for MDR-TB detection. Progress towards targets for universal access to
diagnosis and treatment of MDR-TB is far off-track and in many countries this now constitutes a
public health crisis that is not being adequately recognized and addressed (World Health
Organization, 2014a).
1.4 TB High Burden countries
Though TB is a global problem, for the past two decades, 80% of tuberculosis cases remain
concentrated in 22 ‘high-burden’ countries (HBCs). India and China (Figure 2) had the highest
number of reported cases in 2013; however, relative to the population of individual nations, South
Africa (860 cases/ 100,000 population), jointly followed by Mozambique and Zimbabwe (552
cases/100,000 population) have the highest incidence rates in the world (World Health
Organization, 2014a). The main drivers of TB in these regions include poverty, malnutrition,
inadequate and unaffordable healthcare services, overcrowded and poorly ventilated houses, and
unavailability of suitable diagnostic tests (Krieger & Higgins, 2002; Broekmans et al., 2005).
Countries like China and Brazil are experiencing a sustained gradual decline in annually reported
cases, while in others the decline is painfully slow. The three assessment indicators used by the
WHO are TB incidence rates, TB prevalence and TB mortality. Seven of the 22 HBCs have met
the 2015 targets for reductions in TB cases and deaths, and a further four HBCs are on track to do
so by 2015. However, South Africa, the Democratic Republic of the Congo and Afghanistan are
the three countries that are completely off-track to meet the 2015 targets on all 3 indicators (World
Health Organization, 2014a).

Chapter 2: Literature review
18
Figure 2: New TB cases in the 22 High-Burden Countries in 2013. India had the highest number
of reported new TB cases in 2013. South Africa had the 6th highest number of reported new cases
in the same year. Reprinted with permission from the Kaiser Family Foundation,
http://kff.org/globaldata/
1.5 TB treatment
Tuberculosis is a treatable and curable disease. Early diagnosis is a key factor in ensuring treatment
success. In endemic settings, there is a high rate of empirical therapy in which case patients are
commenced on treatment based on clinical symptoms but with no microbiological test results
(Theron et al., 2014a). Such high levels of empirical therapy have been reported to lower the
potential population level impact on treatment outcomes and mortality in settings where new rapid
point of care TB tests have been adopted (Hanrahan et al., 2013).
Rifampicin (RMP) and isoniazid (INH) form the backbone of first-line anti-tuberculosis treatment.
New and recurrent cases of both pulmonary and extrapulmonary tuberculosis are usually treated
with a combination of rifampicin, isoniazid, pyrazinamide, and ethambutol for two months and, in
the second phase, a combination of isoniazid and rifampicin for a further four months
(2RHZE/4RH regimen). First line drugs sometimes fail to cure tuberculosis due to several reasons.
Patients with bacilli resistant to at least RMP and INH are classified as having multidrug-resistant
tuberculosis and a combination regimen of streptomycin, ethambutol, terizidone, pyrazinamide,
and one quinolone (levofloxacin or ofloxacin) is usually administered (Arbex et al., 2010).

Chapter 2: Literature review
19
Increasingly, extensively drug-resistant TB (XDR-TB), which is defined as MDR-TB with
resistance to a fluoroquinolone and an injectable agent (2nd line aminoglycoside or capreomycin),
cases are also being reported (Dheda et al., 2010; Gandhi et al., 2010). Management of XDR-TB
is very difficult with standard treatment of primary infection consisting of an initial 6–month
intensive phase of 7 drugs (ethionamide, pyrazinimide, capreomycin, moxifloxacin, clofazimine,
terizidone, para-aminosalycilic acid) followed by an 18-month continuation phase of 6 drugs
(ethionamide, pyrazinimide, moxifloxacin, clofazimine, terizidone, para-aminosalycilic acid)
(Pooran et al., 2013). Inspite of such a long and intense treatment regimen the treatment outcomes
are still poor (Pietersen et al., 2014). A strategy focusing on timely detection and treatment of drug
susceptible tuberculosis will curb the increase in the number drug resistant cases which are difficult
to treat.
1.6 TB in South Africa
South Africa had the highest per capita incidence of TB among the 22 HBCs, approaching 1%
(9,800 per million) in 2013, with 62% of cases being HIV-positive. It also had the highest TB/HIV
co-infection burden which is approximately 1.3 per 100 susceptible individuals per annum in 15–
49 year olds (Rehle et al., 2010). Thirty percent of the global incidence cases of TB-HIV co-
infection occurred in SA, which roughly equates to 530,000 people being infected with TB per
annum (World Health Organization, 2013; Creswell et al., 2014). The combined mortality rate
among HIV-positive and HIV-negative TB cases was 2,180 per million (0.2%) in 2013. Multidrug-
resistant (MDR) tuberculosis accounted for 1.8% (95% confidence interval [CI], 1.4 to 2.3) of all
new cases of tuberculosis and 6.7% (95% CI, 5.4 to 8.2) of retreatment cases (World Health
Organization, 2013). Approximately 10% of the reported MDR tuberculosis cases were XDR
tuberculosis cases making South Africa the country with the highest reported XDR tuberculosis
cases in the world.
South Africa was not on track to meet the 2015 targets for reductions in disease burden, and TB
incidence is projected to continue rising in the foreseeable future unless a new paradigm emerges.
Confronted by poor TB statistics, South Africa was the first HBC to roll-out the Xpert MTB/RIF
as the primary diagnostic test for all presumptive TB cases. Emerging data, however, shows
limited impact of the Xpert MTB/Rif rollout on morbidity and mortality in high burdened settings
(Theron et al., 2014b; McNerney & Zumla, 2015). Instead of focusing on improving TB diagnosis
alone, additional initiatives such as strengthening and improving quality of national TB treatment
programmes, special health education initiatives targeting high risk populations, and better access

Chapter 2: Literature review
20
to anti-retroviral therapy in HIV/TB co-infected individuals will aid in reducing the TB burden in
South Africa.
1.7 Future targets for TB incidence rate
The vision of the Stop TB Partnership and the World Health Organization (WHO) is to create a
TB-free world (World Health Organization, 2011). To achieve this target, the incidence rate must
fall at an average of 17% (Figure 3) annually between 2015 and 2050, much faster than the
maximum of 10% per year that was achieved in Western Europe in the 1950s when anti-TB drugs
became available (World Health Organization, 2014). If the present decline of 2% per year
continues beyond 2015 (Figure 3), the incidence rate will still be 1000 times greater than the
elimination threshold by 2050. The Post-2015 Global TB Strategy approved by the World Health
Assembly in May 2014 aimed to reduce TB deaths by 95% and cut new cases by 90% between
2015 and 2035. The strategy also set interim milestones for 2025 and 2035 (Table 1).
Pragmatically however, with the current anti-TB arsenal and systems for delivering them, these
targets are unattainable and have never been achieved on a global scale for any other epidemic. In
order to eliminate TB by 2050, two things are critical: concurrent discovery of optimal vaccines,
Figure 3: Recent and projected trends in global TB incidence (cases) between 2015 and 2050. To
eliminate TB by 2050, novel technologies that can help achieve 20% reductions per year are a
must. Currently, there is a 2% annual reduction in the number of new TB cases, which is
insufficient. Reprinted from (Raviglione & Director, 2013), with permission from the World
Health Organization.

Chapter 2: Literature review
21
drugs, diagnostics; and strengthening of health systems to ensure effective delivery of the new
products (Raviglione & Director, 2013).
Table 1: Post-2015 Global TB strategy and targets
Vision A world free of TB: zero deaths, disease and suffering due to TB
Goal End the global TB epidemic
Milestones for
2025
75% reduction in TB deaths (compared with 2015)
50% reduction in TB incidence rate (compared with 2015)
No affected families facing catastrophic costs due to TB
Targets for 2035 95% reduction in TB deaths (compared with 2015)
90% reduction in TB incidence rate (compared with 2015)
No affected families facing catastrophic costs due to TB
Reprinted from (Raviglione & Director, 2013), with permission from the World Health
Organization.
1.8 TB laboratory diagnosis challenges
In most developing countries, TB control relies on passive case finding among symptomatic
individuals on routine visits to healthcare facilities, followed by either clinical diagnosis or sputum
smear microscopy (SSM) laboratory diagnosis (Ogbudebe et al., 2015). At least two sputum
specimens are required on different days (Parsons et al., 2011), necessitating repeated visits to the
clinic for specimen delivery and collection of results, thereby increasing likelihood of patient
dropout due to prohibitive costs associated with the visits as patients travel long distances to the
nearest healthcare facilities (Table 2). Sadly, even after these delays the sensitivity of SSM has
been reported to vary considerably (range, 20 to 80%) making it unreliable in high prevalence
settings (Steingart et al., 2006b), and often depending on the diligence with which specimens are
collected. Also, quality assurance programs including quality control and external quality
assessments (EQAs) are often lacking at most microscopy centers in burdened countries.
In addition, childhood TB is notoriously difficult to diagnose and all conventional TB tests perform
poorly in this vulnerable population group (Zar, 2007; Lighter & Rigaud, 2009). HIV/TB co-
infected individuals form the second most difficult population group to diagnose with TB due to
the associated low bacillary load which makes SSM unreliable (Bruchfeld et al., 2000; Worodria
et al., 2003; Steingart et al., 2006b). Very few reference laboratories are relied upon in most of the
HBCs as they are among the poorest nations in the world. Furthermore these reference laboratories

Chapter 2: Literature review
22
have inadequate infrastructure and outdated equipment, poor biosafety measures, and are
incapable of reliably performing TB culture and drug susceptibility testing (DST) (Parsons et al.,
2011; Paglia et al., 2012).
In conclusion, current TB diagnostics are not adapted for the above-mentioned specific patient
groups or decentralized healthcare settings, and limited (or no) information on the quality of
diagnostics is available to guide procurement. Thus, there is a critical need for new, sensitive, easy
and rapid point-of-care diagnostics and also for sustained investments in laboratory infrastructure,
quality assurance programs, and well-trained staff.
Table 2: Distance to nearest Medical Facility for the poorest 5th of the World population
Country Distance (km) Uganda 4.7
Tanzania 4.7 Benin 7.5 Haiti 8.0
Zimbabwe 8.6 Bolivia 11.8
Madagascar 15.5 Chad 22.9 Niger 26.9
Selected from the 2004 World Health Report, p.22
1. 9 Measurement of the accuracy of diagnostic tests
Diagnostic accuracy measures quantify the ability of a new test to discriminate between and/or
predict disease and health when evaluated against a gold standard (Drobatz, 2009). These measures
may either serve a discriminatory function (i.e. sensitivity and specificity) or serve a predictive
function (i.e. predictive values, likelihood ratios, area under the receiver operating characteristic
curve, overall accuracy and diagnostic odds ratio) (Okeh & Okoro, 2012). It is also important to
note that these measures are not fixed indicators of a given test’s quality and performance.
Diagnostic measures are very sensitive to the characteristics of the population (e.g. disease
prevalence) in which the test has been evaluated, genetic variation of the pathogen or host and the
study design (Banoo et al., 2008). Poor methodological designs of diagnostic evaluation studies
can cause bias by over-estimating or under-estimating the performance of the indicator test and
also make comparisons between different studies difficult (Eusebi, 2013).
The discriminatory function is concerned with correctly classifying people into two groups; those
who are diseased and those who are not diseased (Eusebi, 2013). The main measures are sensitivity

Chapter 2: Literature review
23
and specificity and the results are of interest to particular to health policy experts. Sensitivity is
the probability, expressed as a percentage, that a truly infected individual will test positive, while,
specificity is the probability, expressed as a percentage, that a truly uninfected individual will test
negative (Banoo et al., 2008). Since these values are calculated in comparison to a “gold standard”
test which is assumed to be 100% sensitive and specific, any shortcomings in the accuracy of the
“gold standard” will lead to errors in calculating sensitivity and accuracy of the indicator test. The
choice of “gold standard” is therefore very important in evaluating a new test.
The predictive function is concerned with estimating the post-test probability of a disease in a
patient (Eusebi, 2013). These measures are of particular importance to clinicians as they provide
an indication of test performance i.e. the trustworthiness of the result. Predictive values are often
used for this task. A positive predictive value (PPV) tells the clinician what percent of patients
with a positive test result truly has the disease. Negative predictive value (NPV) indicates the
percentage of those patients with a negative test result do not have the disease (Drobatz, 2009).
1.10 Ideal TB diagnostic tests
Table 3, provides a list the infrastructure and human capital available at different healthcare levels
for low and middle income countries. However, at the primary level (level 3) which serves most
of the suspected TB patients, limited infrastructure and personnel to house and operate
sophisticated TB diagnostic tests exist.
Table 3: Categorical classification of facilities where diagnostics may be implemented LEVEL 1 LEVEL 2 LEVEL 3
Power/AC Available and reliable
Available May not be available/reliable
Clean water Available and reliable
Available May not be available/reliable
Buildings Well-equipped Laboratories with safety
facilities
Smaller laboratory facilities offering less sophisticated facilities
Limited or no laboratory testing and
safety facilities Staff Nurses, physicians,
trained laboratory staff Trained nurses,
few physicians, few or variably trained laboratory staff
Nurses, healthcare workers,
no/limited laboratory staff
Typical
locations
Urban centres, large hospitals, teaching
hospitals
District hospitals, urban health centres
Health clinics, usually local
Examples of current systems
in each level
Xpert MTB/RIF assay, Bactec MGIT
series
LAMP tests, Urinary LAM tests
e.g Alere ClearView
Sputum smear microscopy (direct or
concentrated)

Chapter 2: Literature review
24
These definitions can be applied to low and middle-income countries. Reprinted from (Batz et al.,
2011), with permission from the Treatment Action Group.
In 2009, a group of 34 representatives from various organizations including Treatment Action
Group, Me´decins Sans Frontie`res, Partners in Health, and other agencies, developed minimum
technical test specifications any new Point-of-Care (POC) TB test suitable for microscopy centers
(level 3) must meet (Table 4). The meeting could not, however, reach a consensus on 3 test
specifications; (i) sensitivity in smear-negative adults i.e. 60% versus 80% as the minimum; (ii)
diagnosis of extrapulmonary TB in adults as a minimal requirement; and (iii) rejection of use of
sputum as an appropriate sample. In the interim, the following points were agreed upon, (i)
exclusion of sputum sample as highly desirable but not a minimal requirement and (ii)
extrapulmonary diagnosis set as highly desirable but not a minimal requirement (Expert meeting
“Defining Test Specifications for a TB POC Test”
Paris, March 17-18 2009).
No existing POC TB test meets all of these specifications, although the Xpert MTB/RIF and Eiken-
LAMP meet most of them. POC tests usually have lower sensitivity and specificity than
laboratory-based equivalents. Commercial serodiagnostic tests, which have largely been marketed
as POC tests, have had a dismal performance record, prompting the WHO to issue policy guidance
against their use (World Health Organization, 2011). Basic scientific research to identify new
biomarkers specifically for POC tests needs to be urgently supported. Currently, nucleic acid
amplification testing (NAATs) is arguably the most appealing option for a POC TB diagnostic
test. However, due to the technical complexity of DNA extraction, amplification and detection,
NAAT technology is not easily translated into a POC device, as demonstrated by the lack of a
successful POC NAAT for any disease (Weyer et al., 2011).
1.11 Current tuberculosis and MDR diagnosis
In most of the high burdened countries, the public sector diagnostic infrastructure relies primarily
on sputum smear microscopy (SSM) that cannot detect drug resistance. Currently, most national
TB programmes do not offer universal DST, resulting in detection of less than one in four cases
of MDR TB. The conventional phenotypic methods for assessing drug resistance are slow.

Chapter 2: Literature review
25
Table 4: Proposed minimum specifications for the design of any new TB POC diagnostic test
Minimum specifications required Medical decision Treatment Initiation Sensitivity - Adults (regardless of HIV status)
Pulmonary TB: Smear pos., culture positive: 95% Smear neg., culture positive: * [60-80%] [Detection of extrapulmonary TB being a preferred but not a minimal requirement]
Sensitivity - children (incl. EPTB; regardless of HIV status)
80% compared to culture of any specimen and 60% of probable TB
Specificity Adults: 95% compared to culture Children: 95% compared to culture and 90% for culture neg., probable TB [problem of gold standard]
Time to results Max. 3 hours (patient must get result the same day) [Desirable would be <15min]
Throughput Min 20 test/day by 1 lab staff Sample collection Adult: urine, oral, breath, venous blood, sputum
[Desired: NON-sputum based sample type and use of finger prick instead of venous blood] Child: urine, oral, finger/heel prick
Sample preparation Safe – biosafety level 1 Max. 3 steps Approximate volumes of samples & reagents (no precise pipetting) Preparation not highly time sensitive
Number of samples One sample per test Read out Easy, unambigous to read with qualitative and simple ‘yes’, ‘no’,
‘invalid’ answer. Read out stays permanent for at least 1 hour
Waste disposal Simple burning or dispose in sharp pit; no glass Environmentally acceptable disposal
Controls Positive control included in the kit Quality control simpler and easier than with SSM
Reagents All reagents contained in a self-contained kit Kit contains sample collection device, H²O (if needed)
Storage/stability Shelf life 24 months incl. for reagents Stable at 30°C, higher temp for shorter time periods [to be defined] Stable in high humidity environments
Instrumentation If instrument needed, no maintenance required Instrument works in tropical conditions Acceptable replacement cost Must fit in backpack, shock resistant
Training time 1 day max. training time Can be performed by any health worker
Instrument Design Can work on battery Cost Below US$10 per test after scale up
Reprinted from (Batz et al., 2011), with permission from the Treatment Action Group.

Chapter 2: Literature review
26
In order to avoid delays in both therapy and prevention of MDR transmission, various genotypic
methods based on line probe assays, DNA sequencing or real-time PCR, have been proposed for
detection of the mutations associated with resistance to anti-tuberculosis drugs. This section briefly
discusses the techniques and clinical performance of current diagnostic tests for both
tuberculosis and drug resistant tuberculosis (DR-TB).
1.11.1 Smear microscopy
Ziehl-Neelsen (ZN) smear microscopy remains the primary diagnostic test for pulmonary MTB in
high-burden countries (HBCs) and also for TB treatment monitoring. In a recent study of the 22
HBCs, a total of 77.6 million sputum smears were performed annually at a value of US$ 137
million in 42 827 microscopy centers (Kik et al., 2014). It is affordable, the average cost of SSM
is US$ 1.77 (IQR US$ 1.28–2.69) per smear and rapid (result in a day) (Kik et al., 2014). However,
it suffers from low and variable sensitivity, especially in paucibacillary HIV infected individuals,
and more significantly, high operator dependence thereby increasing variability (Steingart et al.,
2006b; Steingart et al., 2007). The effectiveness of microscopy is further diminished by the
conditions in which laboratory staff operate i.e. poor microscopes, inferior reagents, intermittent
electricity supply, insufficient time to examine slides properly, and a poor work ethic (Kivihya-
Ndugga et al., 2003; Steingart et al., 2007; Kik et al., 2014).
The original method is now over 130 years old and involves staining the mycobacterial cell wall
with colorimetric or fluorescent dyes for subsequent visualization via microscopy. A positive
smear test indicates the presence of acid fast bacteria (AFB), but does not discriminate between
members of the MTB complex and other non-tuberculous mycobacteria (NTM). Two or three
sputum specimens collected on different days are required in SSM algorithms. The specimens are
either processed directly, but concentration of MTB via centrifugation or bleach sedimentation
may improve sensitivity (Steingart et al., 2006b). Centrifugation, however, adds an extra biosafety
requirement for sealed rotor buckets to minimize risk from aerosols. This requirement is not easily
implementable in resource limited settings.
In most high burden settings, SSM uses a conventional light binocular microscope and the ZN
staining method where AFBs are stained red with carbol fuschin. A 40x and 100x magnification
objective with oil immersion on the microscope is used. Visible AFB units are scored to determine
the bacterial load based on the number of AFB viewed per field and classified according to the
WHO/International Union Against Tuberculosis and Lung Disease guidelines with scoring as

Chapter 2: Literature review
27
follows; “0” for absence of AFB, scanty 1-9, 1+, 2+, or 3+ (Kantor de Narvaiz et al., 1998). Fully
trained microscopists can read a maximum of 25–30 slides a day.
Fluorescence microscopy (FM) has led to an improvement over conventional ZN as AFB
observation is easier and faster. Staining of AFB with fluorescent dyes is more rapid than the ZN
method and most importantly each field can be read at a lower magnification thus it is easier for
microscopists to identify the AFB. Consequently, a trained microscopist can read double the
number of slides per day compared to conventional SSM. A number of studies report an average
of 10% better sensitivity of light emitting diode (LED)-FMs used for SSM compared to light
microscopy but with similar specificity (Trusov et al., 2009; Albert et al., 2013; Xia et al., 2013).
The major drawback of SSM is its poor and highly variable sensitivity (20–80%), especially in
paucibacillary specimens (common with poor-quality sputum samples or HIV co-morbidity)
(Steingart et al., 2006b). SSM cannot be used for drug resistance detection and its specificity may
be reduced by the presence of NTMS due to the test’s inability to distinguish MTB from NTMs.
Nevertheless, a major systematic review analysing data from 30 articles reported an average
specificity of 97% for SSM, indicating that the assay is generally specific (Steingart et al., 2006a).
The reading of slides is time-consuming, tedious, operator dependent and a repetitive task that
requires diligence to be effective. Due to this low sensitivity, it is estimated that 17% of TB
transmission is from patients who are SSM-negative (Behr et al., 1999), highlighting the
shortcomings of SSM and the consequences thereof. With effective external quality assurance
(EQA) plans some of the performance defaults can be addressed but the resources to maintain and
coordinate such systems can also be extensive and even prohibitive.
1.11.2 Culture methods
Mycobacterial culture is the current gold standard for MTB diagnosis in most HBCs despite MTB
being a slow growing microorganism with an extended generation time (20 to 22 hours) compared
to other bacteria (40 to 60 minutes). Decontamination of patient sputum samples is an essential
step in the isolation of mycobacteria as contaminating bacteria and fungi may further slow the
growth of M. tuberculosis (Chatterjee et al., 2013). A number of decontamination procedures exist
and to yield the best results a procedure must be mild but sufficiently control the level of
contaminants. The common decontamination methods include: the sodium hydroxide (NaOH)
based Petroff, the N-acetyl-L-cysteine-sodium hydroxide (NALC-NaOH) and the Kudoh (Falodun
et al., 2012). NaOH reduces the viability of M. tuberculosis and has been reported to kill up to

Chapter 2: Literature review
28
60% of the bacilli in clinical samples (Asmar & Drancourt, 2015). This reduces the sensitivity of
culture methods especially in high HIV prevalence settings due to paucibacillary disease.
After successful decontamination, the samples are cultivated in an appropriate media. A variety of
such media have been developed in an attempt to speed up the growth rate of M. tuberculosis.
Solid media or liquid media or two-phase media (having a liquid phase and a solid phase) may be
used in culturing Mycobacterium tuberculosis complex (MTBC). Lowenstein-Jensen medium,
containing variable concentrations of malachite green is the most widely used solid media but
growth of TB bacilli on such traditional solid medium requires 4-8 weeks. Liquid culture systems
reduce the delays in obtaining results to days rather than weeks. A number of automated
commercial liquid-culture based systems are available on the market. These include the BACTEC
MGIT 960 system (Becton Dickinson), the BacT/Alert 3D System (bioMe´rieux), and the
microscopic-observation drug-susceptibility assay (MODS; Hardy Diagnostics). The following
sections discuss these systems in more detail.
1.11.2.1 Bactec MGIT 960
The BACTEC Mycobacteria Growth Indicator Tube System (MGIT 960) (Becton Dickinson
Microbiology Systems, Sparks, Md.) is a nonradiometric, fully automated, continuous monitoring
system, introduced as an alternative to the radiometric BACTEC 460 for growth and detection of
mycobacteria. Currently, MGIT 960 is considered the gold standard in liquid culture systems and
the top performer with regard to sensitivity (Palomino, 2005). MGIT 960 has a high sensitivity
(80% - 98.1%) and high specificity (89.6%-100%), with a cost per test of between US$16-US$32
(Molicotti et al., 2014). The main advantage of the MGIT 960 system over the more sensitive solid
culture systems is its shorter time to positivity of 10-14 days. The MGIT 960 system is also used
extensively for in vitro antibiotic sensitivity testing, and data from several studies have shown that
it is an accurate (sensitivity and specificity >98%), quick and effective system to determine
sensitivity to anti-tuberculosis drugs of a tubercular isolated strain (Ardito et al., 2001; Kontos et
al., 2004).
1.11.2.2 BacT/Alert 3D
The BacT/ALERT 3D system (bioMérieux, Durham, NC, USA), is a fully automated system based
on the detection of CO2 released into the liquid media by actively proliferating mycobacteria. CO2
lowers the pH in the media, which in turn produces a color change in a sensor in the vial, detected
by a reflectometric unit in the instrument. Several studies have reported comparable performance

Chapter 2: Literature review
29
of the BacT/Alert 3D with that of MGIT 960 for both diagnosis and DST of MTB (Brunello &
Fontana, 2000; Bemer et al., 2004; Guney et al., 2007). The BacT/Alert 3D with its computerized
data management system is an acceptable method for diagnosis of MTB but has some
disadvantages, for example, being prone to contamination, longer turnaround time [13.2 days
(range 7-40 days)], high instrument cost (US$ 63,264.30), and high cost per test ($7.91 to $37.35
depending on sample volume) (Rohner et al., 1997). Based on currently available information, it
is apparent that further studies are required to fully evaluate the performance of the BacT/ALERT
3D system.
1.11.2.3 Microscopic-observation drug-susceptibility assay (MODS)
The MODS test simultaneously detects viable mycobacteria and performs drug susceptibility
testing of both isoniazid and rifampicin, providing results in 7 to 9 days, compared to 21 to 26
days for standard culture (Moore et al., 2006b; Shiferaw et al., 2007). Each decontaminated
sputum sample is divided into 12 aliquots and Middlebrook 7H9 culture medium (containing
different antimicrobial agents and supplements) is placed into each of the wells. Four of the wells
are drug-free and the other eight have low and high concentrations of anti-TB medications. After
incubation at room temperature, plates are read under a microscope. Positive cultures are identified
in drug-free control wells by cord formation, characteristic of M. tuberculosis growth in liquid
medium (Figure ). Concurrent growth in drug-containing wells indicates resistance.
Figure 4: Characteristic serpentine structure of young M. tuberculosis colonies grown in
Middlebrook 7H9 broth for MODS, as seen under an inverted-light microscope (original
magnification, ×20). Reprinted from (Shiferaw et al., 2007), with permission from the American
Society for Microbiology.
MODS does not require expensive equipment apart from an inverted microscope (approximately
$2,500 USD) and costs only $2 per test (Caviedes & Moore, 2007). So far, several studies
comprising more than 3000 adults, including HIV-infected persons, and 5600 sputum specimens

Chapter 2: Literature review
30
have evaluated MODS (Moore et al., 2006b; Arias et al., 2007; Shiferaw et al., 2007). These multi-
center studies have demonstrated that MODS possess similar performance characteristics as the
other more expensive liquid culture systems, but slightly faster than traditional culture methods.
Overall sensitivity of MODS in sputum is reported to range from 86 to 100% (Moore et al., 2006b;
Arias et al., 2007; Shiferaw et al., 2007; Minion et al., 2010) for TB diagnosis and 92 to 97% for
MDR TB (Mello et al., 2007; Shiferaw et al., 2007; Coronel et al., 2014; Huang et al., 2014).
Specificity was reported to range between 94 and 99 % (Moore et al., 2006a; Huang et al., 2014).
Despite its promising performance in clinical evaluations, some limitations of MODS still exist.
First, the qualitative nature of the MODS assay limits a resistance proportion evaluation of
cultures. Secondly, the possibility of cross-contamination as in other culture methods still exists
though it has been reported to be infrequent and very low (Moore et al., 2006a; Coronel et al.,
2014).
1.11.3 Nucleic Acid amplification tests
Nucleic acid amplification tests (NAATs) are increasingly becoming available and popular in the
mycobacteriology laboratory. NAATs are based on detection of unique regions of the MTB
genome, and specific mutations that confer antibiotic resistance. These tests offer a number of
advantages over conventional diagnostics: Turnaround times are shorter (results available within
a few hours after receipt of specimens), results are highly accurate, and systems are more
affordable and accessible (Couturier et al., 2014; McNerney et al., 2015). Despite these great
benefits, some limitations of NAATs include inability to distinguish between live and dead bacilli,
inhibition of amplification, and variable sensitivity (5.6%-100%) in both commercial and in-house
NAAT systems, especially in the problematic smear negative-culture positive group (Flores et al.,
2005; Ling et al., 2008; Greco et al., 2009). The common amplification targets include insertion
element IS 6110, cyp141, 16S rDNA, rpoB gene encoding the ᵝ-subunit of the RNA polymerase,
the gene coding for the 32 kD protein, the recA gene, the hsp65 gene, mpt64, dnaJ gene, sodA
gene and 16S-23S rRNA ITS (Verma et al., 1994; Yamada-Noda et al., 2007; Boehme et al., 2010;
Nimesh et al., 2013; Costa et al., 2014; Ou et al., 2014; Farzam et al., 2015). Commercial NAAT
systems on the market include the Amplified MTD® (Gen-Probe Incorporated, San Diego, CA)
Amplicor MTB (Roche Diagnostic Systems, Somerville, NJ), Xpert MTB/Rif (Cepheid,
Sunnyvale, CA), and Genotype MTBDRplus (Hain Life sciences GmbH, Nehren, Germany).
1.11.3.1 Amplified MTD® test
In 1995, the United States Food and Drug Administration (FDA) approved the Amplified
Mycobacterium Tuberculosis Direct Test (MTD) (GenProbe San Diego, CA, USA), for smear-

Chapter 2: Literature review
31
positive specimens and an enhanced MTD in 1999 for both smear-positive and smear-negative
specimens. AMTD is an isothermal (42°C) transcription-mediated amplification nucleic acid
probe test. The AMTD test provides detection of M. tuberculosis complex rRNA within 2.5 to 3.5
hours after starting the test procedure. Thus, while the AMTD test cannot be used to ascertain drug
susceptibility, it can be used to perform rapid and reliable diagnosis of M. tuberculosis. A high
sensitivity (96.9%) and specificity (100%) when the test is used for AFB smear positive specimens
has been reported by the manufacturer (Hologic Gen-Probe inc). In a meta-analysis of AMTD
studies, sensitivity of 97% and specificity of 96% among smear-positive respiratory specimens
was found, and a sensitivity of 76% and specificity of 97% among smear-negative specimens
(Greco et al., 2006). AMTD costs on average $50 per test (MAG Mutual Healthcare Solutions,
2008), and is not cost-effective (Dowdy et al., 2003). Thus, while the assay has offered some
benefits, it has not successfully provided a practical solution for all levels of clinical and public
health laboratories.
1.11.3.2 Roche Amplicor Mtb PCR
The FDA-approved Amplicor MTB Test (Roche Molecular Systems, Basel, Switzerland)
amplifies a 584-bp DNA fragment within a larger region encoding for 16S rRNA using
biotinylated primers. An internal control, which acts as a safeguard against false negative results
arising from inhibition of the polymerase, is included in the assay. It also has a built-in system
(uracil-N-glycosylase) that secures against contamination by amplicons from previous runs, which
is the most common cause of false positive results. The enzyme, added to the samples before
amplification, destroys any amplicon resulting from previous amplifications without damaging the
uracil-free target DNA. Turnaround time for the system is 6-7 hours. The reported specificity is
close to 100 % while sensitivity ranges from 90 % to 100 % in smear-positive samples and from
50 % to 95.9 % in smear negative specimens (Soini & Musser, 2001). In 2009, the manufacture of
the AMPLICOR MTB assay was discontinued, possibly due to the launch of the COBAS®
TaqMan® MTB Test by the same company (Safianowska et al., 2012).
1.11.3.3 Xpert MTB/Rif
The Xpert MTB/Rif assay (Cepheid, Sunnyvale, CA) received FDA approval in July 2013 (Food
and Drug Administration, 2013). It is a self-contained, integrated real-time PCR platform that
offers minimal hands-on time, with low potential for PCR contamination. The assay,
simultaneously, detects an 81-bp “core” region of the rpoB gene for MTB identification and
utilizes five molecular beacons to probe mutations associated with rifampicin resistance in this

Chapter 2: Literature review
32
rifampicin resistance determining region (RRDR). A short description of the Xpert MTB/Rif
workflow is provided in Figure . It has revolutionized TB diagnostics due to its rapid and sensitive
detection of M. tuberculosis and rifampicin (RMP) resistance (Boehme et al., 2010; Helb et al.,
2010; Moure et al., 2011).
When implemented as a replaced strategy for SSM, Xpert MTB/Rif has been reported to have a
pooled sensitivity of 89% (95% Credible Interval (CrI) [85% - 92%]) and pooled specificity of
99% (95% CrI [98% - 99%]) (Steingart et al., 2014). The same report also indicated that pooled
sensitivity for Xpert MTB/Rif in paucibacillary HIV/TB coinfected individuals was 79% (95%
CrI [70% to 86%]) as compared to 86% in HIV negative individuals. In another recent study
conducted in South Africa, evaluating the performance of Xpert MTB/Rif for diagnosing
extrapulmonary TB using a variety of biological samples, an overall sensitivity of 59% (95% CI,
[53% - 65%]) and specificity of 92% (95% CI [90% - 94%]) was reported (Scott et al., 2014). This
good performance of Xpert MTB/Rif is encouraging and has demonstrated that rapid and accurate
diagnosis of TB is achievable.
However, in spite of such a high potential impact of Xpert MTB/Rif, wide-scale implementation
has only occurred in South Africa while the other 21 HBCs still rely on SSM (Qin et al., 2015). In
these countries, selected use of Xpert MTB/Rif in patients either at risk of MDR-TB or HIV co-
infection is recommended. The low rate of implementation and usage is mainly due to the high
installation, operational and maintenance costs (World Health Organization, 2014b). A recent
multicentre study has also reported that Xpert MTB/Rif deployment in high burden settings has
not significantly reduced tuberculosis related morbidity, partly due to high levels of empirical
therapy (Theron et al., 2014b). The instrument also depends on a stable supply of electricity and
requires annual maintenance which makes it not a true POC test (Denkinger et al., 2013).

Chapter 2: Literature review
33
Figure 5: Xpert MTB/RIF assay overview. Steps 1 through to 3 are manual, while the rest of the
steps are automated. The instrument automatically calls MTB results and in positive individuals
it also reports the rifampicin resistance status permitting appropriate treatment within 2 hours.
Advertorial source:
http://www.finddiagnostics.org/programs/tb/find_activities/automated_naat.html (accessed
25/09/2015).
1.11.3.4 Molecular Line Probe Assays
Rapid line probe assays (LPAs) have recently been implemented to screen patients at high risk for
drug-resistant tuberculosis. These tests include the INNO-LiPARif.TB assay (Innogenetics), the
GenoType MTBDRplus assay (Hain Lifescience) and the new AID line probe assay (AID
Diagnostika, Germany). Both are quick tests to detect the TB bacterium and to check if it is
resistant (RMP and INH) to drugs within a day. Systematic reviews on the performance of LPAs
in comparison to conventional DST methods have shown that LPAs are highly sensitive (97%)
and specific (99%) for the detection of rifampicin resistance alone or in combination with INH
(sensitivity, 90%; specificity, 99%) (Barnard et al., 2008; World Health Organization, 2008). The
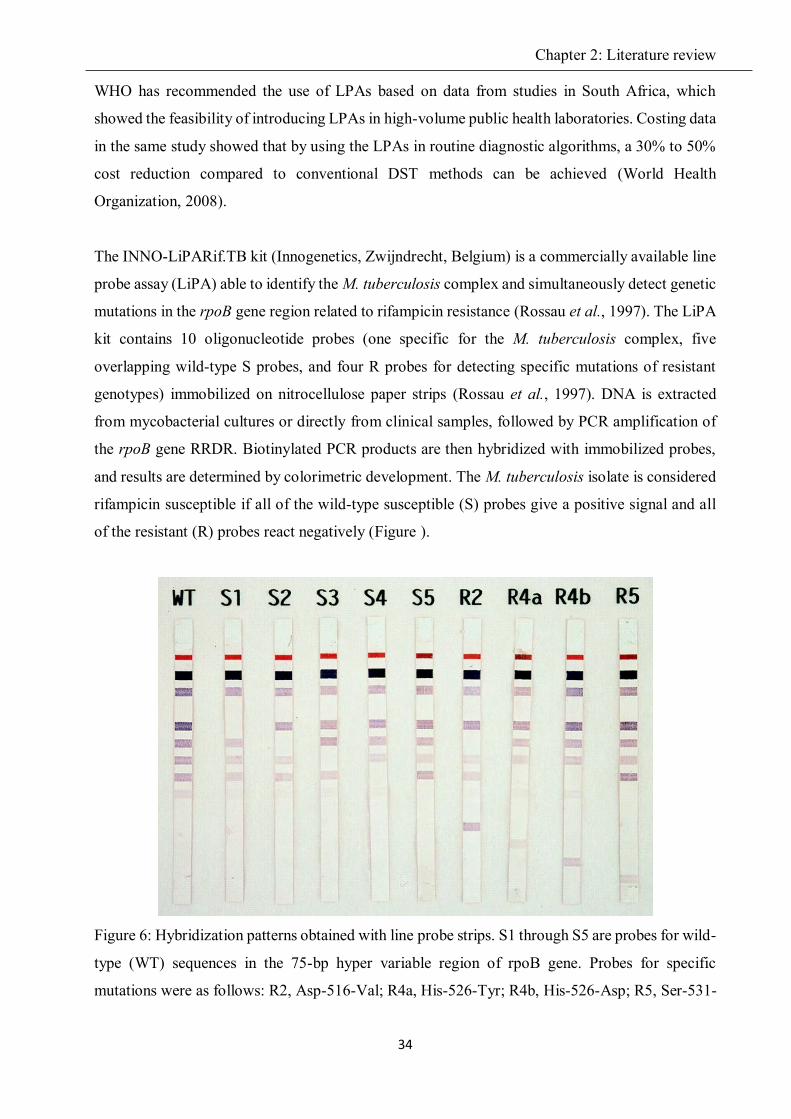
Chapter 2: Literature review
34
WHO has recommended the use of LPAs based on data from studies in South Africa, which
showed the feasibility of introducing LPAs in high-volume public health laboratories. Costing data
in the same study showed that by using the LPAs in routine diagnostic algorithms, a 30% to 50%
cost reduction compared to conventional DST methods can be achieved (World Health
Organization, 2008).
The INNO-LiPARif.TB kit (Innogenetics, Zwijndrecht, Belgium) is a commercially available line
probe assay (LiPA) able to identify the M. tuberculosis complex and simultaneously detect genetic
mutations in the rpoB gene region related to rifampicin resistance (Rossau et al., 1997). The LiPA
kit contains 10 oligonucleotide probes (one specific for the M. tuberculosis complex, five
overlapping wild-type S probes, and four R probes for detecting specific mutations of resistant
genotypes) immobilized on nitrocellulose paper strips (Rossau et al., 1997). DNA is extracted
from mycobacterial cultures or directly from clinical samples, followed by PCR amplification of
the rpoB gene RRDR. Biotinylated PCR products are then hybridized with immobilized probes,
and results are determined by colorimetric development. The M. tuberculosis isolate is considered
rifampicin susceptible if all of the wild-type susceptible (S) probes give a positive signal and all
of the resistant (R) probes react negatively (Figure ).
Figure 6: Hybridization patterns obtained with line probe strips. S1 through S5 are probes for wild-
type (WT) sequences in the 75-bp hyper variable region of rpoB gene. Probes for specific
mutations were as follows: R2, Asp-516-Val; R4a, His-526-Tyr; R4b, His-526-Asp; R5, Ser-531-

Chapter 2: Literature review
35
Leu. Reprinted from (Hirano et al., 1999), with permission from the American Society for
Microbiology.
The GenoType MTBDRplus is a DNA strip assay (Hain Lifescience, Germany) developed for the
rapid detection of gene mutations associated with rifampicin and isoniazid resistance (rpoB and
katG) in clinical isolates (Hillemann et al., 2007). Evaluations of the assay conducted by several
research groups report high accuracy for rifampicin resistance but lower accuracy for isoniazid
(Makinen et al., 2006; Miotto et al., 2006; Hillemann et al., 2007; Bwanga et al., 2009; Yadav et
al., 2013). The Genotype MTBDRplus instrument costs 23,790€ and the assay costs approximately
3.50€ per test. The turnaround time is 48 hours (Yadav et al., 2013).
The AID line probe assay detects the most prevalent chromosomal mutations associated with
resistance to first-line (isoniazid and rifampin) and second-line (streptomycin, amikacin,
capreomycin, fluoroquinolones, and ethambutol) TB drugs (Ritter et al., 2014). This LPA has a
total turnaround time of one day. Its design consists of three test modules termed INH/RIF,
FQ/EMB, and AG, with the third module detecting mutations related to resistance to the
aminoglycosides (AG) (kanamycin, amikacin and streptomycin), and capreomycin (Ritter et al.,
2014). Each LPA strip has four control probes (conjugate control, amplification control,
mycobacterium genus control and M. tuberculosis complex control) in order to verify the test
procedures. For results to be considered valid all four control bands should test positive; otherwise,
the results are considered invalid. Two studies have reported on the performance of AID in clinical
samples; both showed that AID is in agreement (> 91.5% for all other drugs, and 72.9% for
ethambutol) with reference tests such as sequencing and DST (Ritter et al., 2014; Molina-Moya et
al., 2015). However, Ritter and co-workers mostly used clinical isolates instead of actual patient
samples (Ritter et al., 2014). Thus definitive conclusions on the clinical usefulness of AID should
be drawn with care, since a ratio of mutant DNA to wild-type DNA below 10% in clinical samples
is known to reduce the sensitivity of any molecular assay (Molina-Moya et al., 2015). More studies
that evaluate AID in clinical samples are needed in order to determine the clinical usefulness of
this assay.
1.12 Future TB diagnostic systems
Though smear microscopy and culture still form the backbone of the typical TB mycobacteriology
laboratory in the HBCs, emerging technologies are rapidly changing the landscape and providing
hope in the fight against TB. There are more than 81 manufacturers and developers working on

Chapter 2: Literature review
36
191 TB diagnostic products (tests or associated hardware); 144 of these are already commercially
available and 47 are in late- or mid-stage development (Daniels, 2014). A few examples of new
TB diagnostics at various stages of development that are under the WHO pre-qualification are
listed in Table 5.
Table 5: Tuberculosis diagnostic products in later-stage development or on track for evaluation by
the World Health Organization
Test Type Sponsor Status
MeltPro TB/INH Closed-tube real-time PCR for INH drug resistance
Zeesan Biotech
3-site evaluation using 1,096 clinical isolates; Chinese FDA-approved
Alere Q fully automated nucleic acid testing platform
Alere Early stage development; test for TB case detection and drug resistance
Q-TB test Cartridge-based asymmetric PCR amplification (Q-POCTM platform)
QuantuMDx
Early stage development; permits MTBC and MDR assays simultaneously on the handled device
MeltPro TB/STR Closed-tube real-time PCR for streptomycin drug resistance
Zeesan Biotech
3-site evaluation using 1,096 clinical isolates
PURE-LAMP Manual NAAT by loop-mediated isothermal amplification for MTB detection
Eiken A multisite showed average sensitivity of 97.2% (95% CI, 94.3% to 98.2%) in culture-positive samples (Gray et al., 2016)
RealTime MTB/TB MDx m2000
Automated real-time for MTB Abbott Lower limit of detection than Roche Cobas assay;
GeneChip Real-time PCR for RMP and INH resistance
CapitalBio Chinese Center for Disease Control and Prevention in collaboration with; On the market
REBA MTB-XDR Line-probe assay for fluoroquinolone and second-line injectable drugs
YD Diagnostics
Initial evaluation study in 2015, Marketed
BD MAX MTB assay
Real-time PCR for MTB in automated BD MAX
Becton Dickson
100% sensitivity and specificity for smear-positive samples
CAD 4TB Digital chest X-ray for TB screening
Delft Imaging systems
Used in ZAMSTAR study
Giant African pouched rats (Cricetomys gambianus)
Trained sniffer rates to detect MTB in sputum
Apopo Foundation
Rats detected 80% of MTB species while ignoring Mycobacterium avium/ intracellulare

Chapter 2: Literature review
37
Test Type Sponsor Status
Lateral flow urine lipoarabinomannan assay (LF-LAM)
Urine dipstick for TB LAM protein
Alere Approved by WHO in 2015 for diagnosis and screening of active tuberculosis in people living with HIV (World Health Organization, 2015b)
RPA Isothermal based Recombinase Polymerase Amplification (RPA) using three core enzymes
TwistDx Sensitivity of 91.4% (95%CI: 85, 97.9) and specificity of 100% (Boyle et al., 2014)
VerePLEX Lab-On-Chip
Microarray technology Rifampicin and isoniazid resistance
Veredus Laboratories
Released for research use (McNerney et al., 2015)
Source: Adapted from (Harrington & Benjamin, 2015) with some minor modifications.
In addition, since 2007, several tools with improved sensitivity and speed of diagnosis have been
endorsed by the WHO Strategic and Technical Advisory Group for Tuberculosis (STAG-TB)
(Table 6). However, in 2014, no TB technologies underwent review. Other technologies not shown
in Table 6 were also reviewed and some received negative policy recommendations (e.g.
commercial serological antibody-based TB tests; interferon-gamma release assays [IGRAs] for
detection of active TB) (World Health Organization, 2011), while others were not endorsed due to
lack of adequate evidence (e.g. LAMP); LPAs for second-line drugs (World Health Organization,
2013). The only WHO-endorsed NAATs are the first-generation LPAs and the more recent Xpert®
MTB/Rif assay. A significant deterrent to widespread application of NAATs is the need for
appropriate field evaluation of newer tests. Currently, there have been limited independent,
multicentre evaluations in high-burden settings of the next-generation NAATs, with only two
evaluations of LoopAMP™ MTBC Detection Kit and EasyNAT™, and one of each for
Genedrive®, Truelab™ and FluoroCycler® technologies (Harrington & Benjamin, 2015).
Table 6: TB diagnostic technologies endorsed by the WHO, since 2007
Year Technology reviewed by WHO 2007 Commercial liquid culture and DST tools, and rapid speciation strip tests 2008 Molecular LPAs for first-line anti-TB drug resistance detection 2010 LED microscopy 2010 Selected non-commercial DST methods (MODS, CRI and NRA) 2010 Xpert MTB/Rif 2013 Policy update on Xpert MTB/Rif, with extension to childhood and EPTB
Reprinted from (UNITAID, 2015), with permission from the World Health Organization.

Chapter 2: Literature review
38
Another major deterrent in the development of diagnostic products is the shallow funding
landscape in which researchers are asked to confront such a sizeable epidemic with shrinking
resources. The 2011–2015 Global Plan calls for annual investments of $340 million in research to
develop new TB diagnostics. In 2013, various funders contributed a total of $67.8 million to
diagnostics research (Figure ), leaving a gap of $272.2 million (Frick, 2014). The major funders
of diagnostics research were the Gates Foundation and the US-National Institute of Allergy and
Infectious Diseases (NIAID) with investments of $16.0 and $15.8 million respectively. Only two
companies rank among the top five diagnostics funders in 2013: Company Y contributing $5.0
million, and Qiagen with $4.1 million. Alere is another private-sector company with 2013
investments of $2 million and ranking 10th. However, the figures are not very accurate as the
South African government through its various departments and agencies provides significant
funding to TB research.
Figure 7: 2013 TB diagnostics funders’ contributions. The South African Medical Research
Council, which is the only African funding organization on the list, contributed $15,238. All
figures are in United States dollars. Reprinted from (Frick, 2014), with permission the Treatment
Action Group.
Despite all these challenges a number of NAATs at various stages of development (Figure 8) are
in the pipeline. The assays under development include LoopAMP™ MTBC Detection Kit (Eiken
Chemical Company; Japan), EasyNAT™ TB kit (Ustar, China), Genedrive® MTB assay

Chapter 2: Literature review
39
(Epistem; United Kingdom), and Trueant MTB (Molbio; India). The principles, current status and
prospects of some NAATs that can be deployed at microscopy centers will be discussed in the
following sections. However, the absence of a dipstick type POC TB test continues to be a gaping
hole in the pipeline. This is mainly due to insufficient progress in biomarker research and lack of
strong industry interest in TB (Wilson & Palriwala, 2011).
Figure 8: Current and emerging automated, semi-modular or non-integrated TB NAATs; their
intended laboratory location and release or anticipated time. Reprinted from (UNITAID, 2014),
with permission from the World Health Organization.
1.12.1 LoopAMP™ MTBC Detection Kit
In 2000, Notomi and coworkers first described a molecular method that had the ability to
accurately amplify a few copies of DNA 109-1010 times in 15-60 minutes under isothermal
conditions (about 65oC) with great accuracy (Notomi et al., 2000). A detailed description of the
assay can be found elsewhere (Tomita et al., 2008), but briefly it involves (i) auto-cycling strand
displacement DNA synthesis which is performed by a DNA polymerase with high-strand
displacement activity and (ii) a set of four specially designed primers that identify a total of six
distinct sequences in the target DNA (Figure 9). Eiken Chemical Co. Ltd, Tokyo, Japan has a

Chapter 2: Literature review
40
commercially available modified LAMP assay, which has a simplified DNA extraction process.
In their methodology, raw sputum is treated with two extraction solutions and, following heating
for 10 min at 100°C, the sputum is briefly centrifuged at 2,000g. The target of the Eiken LAMP
assay is an M. tuberculosis specific region of the gyrB gene, encoding DNA gyrase subunit B. The
amplified product can be seen by direct visual inspection of turbidity or fluorescence in the tube
(Neonakis et al., 2011).
Figure 9: Schematic description of the workflow for LoopAMP MTBC. Currently it is a manual
procedure and results are determined by fluorescent signal detection. Reprinted from (UNITAID,
2012), with permission from the World Health Organization.
The first clinical evaluation of the LAMP assay for the detection of pulmonary tuberculosis
showed a sensitivity of 97.7% in smear-positive sputum samples and 48.8% in smear-negative
samples, and a specificity of 99% (Boehme et al., 2007). A recent study has confirmed that the
Eiken-LAMP assay has comparable diagnostic performance to that of the original LAMP (Mitarai
et al., 2011). However, the specificity of the TB-LAMP assay remains a major concern especially
when the TB prevalence falls below 10%. Also the poor performance (48% sensitivity) in smear-
negative patients (Boehme et al., 2010), reduces its utility in some population groups with high
rates of smear-negative tuberculosis, such as HIV-positive individuals and children. Feasibility
studies in microscopy centres have demonstrated that minimal technical training was required
suggesting that the platform is applicable for use in peripheral laboratory settings (Boehme et al.,
2007). Further advantages include rapidity, high sensitivity, ease of application and cost-
effectiveness.

Chapter 2: Literature review
41
If Eiken-LAMP is to be adopted as a replacement to smear microscopy especially in high HIV
prevalence settings where the sensitivity of sputum smear microscopy is reduced, more head-to-
head comparison studies with TB-LAMP and LED microscopy are needed in different geographic
regions. Currently, insufficient field evaluation data exists for Eiken-LAMP to receive a
recommendation either in favor of, or against by the WHO Expert Review Group (UNITAID,
2015).
1.12.2 EasyNAT TB Diagnostic kit
EasyNAT TB Diagnostic kit (Ustar, China) is another novel assay for diagnosis of active
pulmonary TB based on isothermal amplification-Lateral Flow. It was approved by the China Food
and Drug Administration (CFDA) on 26th February 2014 but limited peer-reviewed information
is available on this system. Briefly, 1 mL of liquefied sputum is heated to lyse the mycobacteria.
The lysed sample is then transferred into a DNA purification device, for standard solid-phase
extraction using a DNA affinity membrane and a series of wash steps, followed by elution. For
MTB detection, the DNA extract is mixed with cross-priming amplification (CPA) reagents, and
incubated at 63°C for 1h. Six to eight primers target the gyrB gene of M. tuberculosis bacilli. The
detection of amplified products is performed on a lateral flow strip housed in a sealed XCP nucleic
acid detection device (Figure ) to minimize cross-contamination of amplicons (Fang et al., 2009;
Niemz & Boyle, 2012).
In a landmark clinical evaluation study, the sensitivity of EasyNAT was 87.5% (28/32) in smear-
negative sputum samples and 96.9% (63/65) in smear-positive specimens (Fang et al., 2009).
Though the sample size was too small, it showed good sensitivity in the problematic smear-
negative, culture-positive group, which would make it an ideal replacement of smear microscopy.
Screening of 13 non-tuberculous mycobacterial species showed that the assay is 100% specific for
TB. The total assay time is approximately 90 minutes at an estimated cost of US $4 to 5 per test
(Mhimbira et al., 2015). The current sample processing step for the EasyNAT system is fairly
complicated, and to become a true POC a simplified sputum specimen processing method that
shortens total assay time (TAT), minimizes biological risk, and decreases the risk of sample
contamination must be developed. Another drawback of the system is its inability to detect TB
drug resistance, which is an important requirement in HBCs.

Chapter 2: Literature review
42
Figure 10: The XCP nucleic acid detection device (Ustar). (A) The schematic cross-section,
showing the amplicon cartridge (B) indicates a positive cross-priming amplification test result in
addition to control line. Reprinted from (Niemz & Boyle, 2012), with permission from Taylor &
Francis publishing group.
1.12.3 Epistem Genedrive
Epistem (Manchester, UK) has developed the Genedrive system, a lightweight (560 g) and
portable instrument that enables rapid PCR amplification with real-time detection of MTB from
sputum or urine samples in <45 min. Initially, cell lysis and DNA extraction is performed using a
novel composite paper-based approach from raw or liquefied sputum. Three 20 μl aliquots of the
extract are transferred into the test cartridge (Figure 2) containing lyophilized reagents for PCR
amplification. The test cartridge is then inserted into the Genedrive instrument (Figure 2) for PCR
amplification targeting REP13E12 and rpoB genes. The instrument automatically reports results
at the end of amplification cycles. The instrument performs rapid PCR amplification with probe-
based real-time fluorescence detection and high resolution melt curve analysis to verify target
amplicon production, and enable genotyping of the rpoB RRDR. This US $4000 instrument can
be operated on a 12V DC battery and the anticipated cartridge price will be between US$ 10 and
US$ 17.

Chapter 2: Literature review
43
Figure 2: Components of the Genedrive system developed by Epistem. Test cartridge (left) and
Genedrive instrument (right). Images (advertorial) reprinted from Epistem (UK).
https://www.genedrive.com/. Date of access: 6 January 2016
In a recent study conducted in Spain using spiked sputum samples, sensitivity of 90.8% in
comparison to culture for MTBC detection and 72.3% for rpoB detection was reported (Castan et
al., 2014). In the SSM scanty or negative samples characteristic of paubacillary patients, the
performance of Genedrive was comparable to GeneXpert. However, these results should be treated
with extreme caution as clinical sputum samples were not used in this study. The small sample
volume, portability, battery power operation, low cost and performance of the Genedrive make it
an ideal POC test for MTBC detection and rifampicin resistance in low resource settings. Multisite
studies on clinical samples should be urgently conducted to evaluate this promising system.
1.12.4 Trueant MTB
Trueant MTB (Molbio/Bigtec Diagnostics, India) is a semi-automated, battery-powered, and
portable chip based real time PCR device for MTB diagnosis. It involves four simple processes
that can be completed within an hour. These processes are (i) sample collection, (ii) sample
preparation, (iii) automatic analysis, and (iv) result reporting, respectively (Figure 3). The total
assay time is approximately one hour, enabling rapid detection of M. tuberculosis DNA.

Chapter 2: Literature review
44
Figure 3: Sputum is added to a red-capped sample bottle containing lyophilized reagents to liquefy
the sputum. After DNA extraction 6 μl is aliquoted into a disposable reaction cartridge, which is
then entered into the Truelab™ Uno analyser for processing and analysis. Images (advertorial)
reprinted from Bigtech Private Ltd (India).
The Truenat MTB test was reported to have sensitivity and specificity of 91.1% (CI: 86.1–94.7)
and 100% (CI: 90.0–100) respectively (Nikam et al., 2013). Limited diagnostic performance data
is available and larger studies in different geographic regions are urgently required to evaluate the
Truenat MTB test.
1.13 Evaluation of new diagnostic tests
After developing, optimizing and obtaining initial proof-of-concept data on the prototype, the next
phase involves evaluating its accuracy, reliability and performance outcomes. Figure 4 outlines
the TB diagnostics development pathway, formulated by the Stop Tuberculosis Partnership’s New
Diagnostics Working group (Stop TB Partnership’s New Diagnostics Working Group, 2009;
Wallis et al., 2010). In diagnostic accuracy studies, outcomes from the new test are compared with
outcomes from the reference standard—both measured in the same cohort of TB suspects. Flaws
in study design can lead to biased and optimistic estimates of diagnostic accuracy during
evaluation. As several potential threats to the internal and external validity of a study on diagnostic
accuracy exist, Standards for the Reporting of Diagnostic accuracy studies (STARD) (Table 7)
were designed to (i) improve the accuracy and completeness of diagnostic studies, (ii) permit users
to evaluate the potential bias in a study, and assess whether results can be extrapolated to a broader
population (Bossuyt et al., 2003).

Chapter 2: Literature review
45
Figure 4: Schematic of the tuberculosis diagnostics development pathway. It must be noted that
the process is not completely unidirectional, but there is movement back and forth between the
various developmental stages. The schematic was formulated by the Stop tuberculosis
Partnership’s New Diagnostics Working group. Reprinted from (Wallis et al., 2010), with
permission from Elsevier.
Although accuracy of diagnostic tests is an important attribute, it should never be considered in
isolation from other benchmarks. The 2004 Health Development Report cited the lack of access
and unaffordability as two major reasons why new diagnostics fail (Travis et al., 2004). Some
accurate TB diagnostics are available on the market but they are neither affordable nor accessible
to most patients in the developing world where disease burden is the greatest. Therefore, research
and development of tuberculosis diagnostic tools should not only focus on diagnostic accuracy but
they must be also easy to operate, accessible and cost-efficient to be adopted in endemic areas.
1.14 Cost-effectiveness of diagnostic tests
Cost-effectiveness analysis (CEA) is one of a number of economic techniques for assessing gains
in health relative to the costs of alternative health interventions (Robinson, 1993). These
competing alternatives can be independent or mutually exclusive, but in both cases policy makers
still need to rationalize the scarce resources available (Earnshaw & Lewis, 2008). In literature the
terms cost-benefit, cost-effectiveness and cost-utility are often used interchangeably but strictly
speaking these terms are distinct terms, though related.

Chapter 2: Literature review
46
Table 7: STARD checklist for reporting of studies of diagnostic accuracy
Section and Topic Item #
TITLE/ABSTRACT/ KEYWORDS
1 Identify the article as a study of diagnostic accuracy (recommend MeSH heading 'sensitivity and specificity').
INTRODUCTION 2 State the research questions or study aims, such as estimating diagnostic accuracy or comparing accuracy between tests or across participant groups.
METHODS Participants 3 The study population: The inclusion and exclusion criteria,
setting and locations where data were collected. 4 Participant recruitment: Was recruitment based on presenting
symptoms, results from previous tests, or the fact that the participants had received the index tests or the reference standard?
5 Participant sampling: Was the study population a consecutive series of participants defined by the selection criteria in item 3 and 4? If not, specify how participants were further selected.
6 Data collection: Was data collection planned before the index test and reference standard were performed (prospective study) or after (retrospective study)?
Test methods 7 The reference standard and its rationale. 8 Technical specifications of material and methods involved
including how and when measurements were taken, and/or cite references for index tests and reference standard.
9 Definition of and rationale for the units, cut-offs and/or categories of the results of the index tests and the reference standard.
10 The number, training and expertise of the persons executing and reading the index tests and the reference standard.
11 Whether or not the readers of the index tests and reference standard were blind (masked) to the results of the other test and describe any other clinical information available.
Statistical methods 12 Methods for calculating or comparing measures of diagnostic accuracy, and the statistical methods used to quantify uncertainty (e.g. 95% confidence intervals).
13 Methods for calculating test reproducibility, if done. RESULTS
Participants 14 When study was performed, including beginning and end dates of recruitment.
15 Clinical and demographic characteristics of the study population (at least information on age, gender, spectrum of presenting symptoms).
16 The number of participants satisfying the criteria for inclusion who did or did not undergo the index tests and/or the reference standard; describe why participants failed to undergo either test (a flow diagram is strongly recommended).
Test results 17 Time-interval between the index tests and the reference standard, and any treatment administered in between.

Chapter 2: Literature review
47
Section and Topic Item #
18 Distribution of severity of disease (define criteria) in those with the target condition; other diagnoses in participants without the target condition.
19 A cross tabulation of the results of the index tests (including indeterminate and missing results) by the results of the reference standard; for continuous results, the distribution of the test results by the results of the reference standard.
20 Any adverse events from performing the index tests or the reference standard.
Estimates 21 Estimates of diagnostic accuracy and measures of statistical uncertainty (e.g. 95% confidence intervals).
22 How indeterminate results, missing data and outliers of the index tests were handled.
23 Estimates of variability of diagnostic accuracy between subgroups of participants, readers or centers, if done.
24 Estimates of test reproducibility, if done. DISCUSSION 25 Discuss the clinical applicability of the study findings.
Reprinted from (Bossuyt et al., 2003), with permission from the American Association for Clinical
Chemistry.
A cost-benefit analysis involves assigning a monetary value to both the cost of the intervention
and the benefit (health in this case) derived from such an intervention (Levin & McEwan, 2001).
This requirement of placing a direct monetary value on human health (life) is ethically problematic,
thus rendering cost-benefit analyses less important in health economics. The main difference
between cost-effectiveness analyses (CEA) and cost-utility analysis (CUA) lies in how the benefits
are measured and valued. If benefits are measured as life-years gained (LYGs), this will be called
CEA and its main output is known as an incremental cost-effectiveness ratio (ICER) (Jakubiak-
Lasocka & Jakubczyk, 2014). If instead of LYGs, Quality-Adjusted Life Years (QALYs), the
analysis will be known as a cost-utility analysis (CUA) and its main output parameter referred to
as an incremental cost-utility ratio (ICUR) (Jakubiak-Lasocka & Jakubczyk, 2014). ICURs are
controversial because when calculating QALYs the “years of life” are weighted by a utility score
that measures patients’ preferences for a particular state of health, which is highly subjective as
individuals or societies have different perceptions on life. Thus in spite of the weaknesses of ICERs
to be discussed more fully later, ICERs are considered a more objective measure of effectiveness
and is the focus of cost analysis in this thesis. ICER basically refers to the cost differential between
two alternative interventions, divided by their effectiveness differential. The following parameters
are involved in the computation:
ICER = ΔC/ΔE = Cost new test – cost current test /Effect new test – effect current test.

Chapter 2: Literature review
48
1.14.1. Building decision analysis models
The determination of an ICER is a complicated process that requires careful development and
validation of appropriate models and collection of appropriate data to input into the model. The
stages involved in a creating a decision analysis model and the key considerations thereof will be
discussed in the following sections.
1.14.1.1 Define the problem
The first and most important step in decision analysis is to define the problem, to identify the
possible alternatives available and their consequences. A decision tree (Figure 5), a visual
representation of all the possible options and the consequence of each option, assists the modeler
in clearly defining the problem. In a decision tree, a decision node (represented by a square) is a
point where several alternatives are possible, while chance node (represented by a circle) is a point
in a decision tree where chance determines which event will occur. The sum of probabilities for
all branches emanating from a chance node must equal 1.0.
Figure 5: An example of a basic decision tree that can assist in defining the problem in decision
analysis.
1.14.1.2 Define the perspective
The perspective determines the components to be included in the costing of the interventions and
the manner in which they are valued (Neumann, 2009). A range of perspectives can be used,
including the societal, patient, and provider perspectives (Ryder et al., 2009). In the societal
perspective all medical and non-medical costs associated of an intervention are relevant, even

Chapter 2: Literature review
49
though the analyst may not be able to measure or ascribe a value to some of them. For the provider
(government/health insurer) perspective, certain categories of costs may not be relevant, such as
patient time and travel costs, and indirect costs. The societal perspective requires the broadest
approach to characterizing costs and health outcomes of treatment, and is the recommended
perspective in public policy applications (Russell et al., 1996). However, due to the difficulties in
computing the costs of the societal perspective, health economists often use the provider
perspective. It is important to recognize that what may be cost-effective from a societal perspective
may not be cost-effective from the perspective of a patient.
1.14.1.3 Define the base case(s) of analysis
This stage involves evaluating both the intended and unintended consequences of the different
alternatives in the decision tree. The probabilities of each of those consequences are also
considered. The sources of such data include published peer-reviewed articles, meta-analyses,
ongoing study data, in country expert opinion, and other trusted sources such as UNAIDS and
WHO life tables.
1.14.1.4 Specify the time horizon, and define thresholds for analysis
In decision tree models, events and outcomes are modelled over a specified time horizon or period
of time during which the benefits of the intervention are expected to materialise. This is critical as
short-term vs. long-term costs/effects may be very different and thus can alter the C/E ratio of a
given intervention depending on the time horizon used in the analysis. Ideally the time horizons
used range from 1 year to 10 years (Ramsey et al., 2005).
In order for an analyst to make objective recommendations from ICER results emanating from
different studies/settings there is need for a reference point to enable proper comparison. For
example, how does one decide whether US$ 450 per QALY gained in Brazil or US$ 27 per QALY
gained in the Tanzania represents good use of money for the national health-care system? Three
approaches have been put forward to address this challenge: (i) thresholds based on per capita
national incomes; (ii) benchmark interventions and (iii) league tables. Of the three approaches the
use of thresholds has gained popularity. There are a number of widely referenced thresholds that
are used to define the boundaries of a cost-effective intervention. Arbitrary thresholds such as
$50,000/QALY in the United States or £20,000/QALY in the United Kingdom are used sometimes
but these are highly controversial because they are not generalizable across settings and are not
empirically-derived (Diamond & Kaul, 2009).
Chapter 2: Literature review
50
Recently, the use of thresholds that are based on per capita gross domestic product (GDP) has
gained prominence in cost-effectiveness analyses studies and is promoted by the World Health
Organization in that organization’s publication: Choosing Interventions that are Cost–Effective
(WHO-CHOICE) project (World Health Organization, 2015a). Generally an intervention is
considered to be highly cost-effective when the cost per DALY averted is below the WHO-
CHOICE country-specific willingness-to-pay (WTP) threshold. This threshold value is dependent
on economic status and cultural factors, thus is variable between nations or even regions (Francis
et al., 2013).
Another important consideration in cost-effectiveness analysis is the selection of an appropriate
discount rate. Discounting means the conversion of future costs to their present value. The concept
is informed by the fact that individuals and society have general preferences to consume something
now over consumption in the future. For comparison across studies, it is important that analyses
are performed using a common discount rate. In this regard the WHO-CHOICE uses a discount
rate of 3%. However as with many other issues in cost-effectiveness analyses, this practice is
widely debated (Van Hout, 1998; Gravelle & Smith, 2001; Reinschmidt, 2002).
1.14.1.5 Populate the model with probabilities, costs, and effectiveness data
Once all of the components of the model have been gathered from the various sources, this data
can now be populated in the model and then perform the decision analysis using mathematical
equations. However, nowadays a variety of software packages (e.g. Tree Age Pro and Decision
Tools Suite) are available which can calculate the ICER and sensitivity analyses based on the
formulas.
1.14.1.6 Conduct sensitivity analyses
Since estimates of costs and effects are used in decision analysis, these are often bound to vary
with location, season and a multiple other factors. Sensitivity analyses tests show how robust the
model is to these uncertainties by varying model inputs and evaluating their effect on the results
from the model. Sensitivity analysis also serves as an alternative to confidence intervals which do
not have value in decision analysis. One-way, two-way and three-way sensitivity analyses are
often reported based on how many variables are allowed to fluctuate at a time; one, two or three
respectively (Werner et al., 2013).

Chapter 2: Literature review
51
1.14.2 Weaknesses of cost-effectiveness analysis models
Cost-effectiveness analysis has a number of limitations that are well recognized but that does not
diminish its value in health economics. Rather, it simply requires that the “consumers” of this
information (i.e, guideline committees, policy makers, and health insurers) be properly informed
about its strengths and limitations (Weintraub & Cohen, 2009). First and foremost, the quality of
the data fed into the model determines the quality of the outputs. If the literature search and
background data gathering is biased then no matter how excellent the research questions and
decision model are, the outcomes will be biased. In recent years standardized methods for
conducting these analyses have been developed in order to minimize bias. However, at times it is
unrealistic to perfectly adhere to these standards and compromises that are scientifically justifiable
are often made (Russell et al., 1996).
Cost-effectiveness analyses will certainly always require a number of assumptions to be made, as
it is not possible to quantitatively measure all the parameters necessary for such a model. Even in
cases where measurements are available, they may not adequately represent values appropriate for
the analysis at hand. Therefore the rationale behind these assumptions also influences the quality
of the outputs. Also, quality of life estimation (e.g QALYS) that involves making considerable
assumptions may present with several methodological errors. Practically it is impossible to reduce
such a qualitative phenomenon (quality of life) that incorporates diverse personal, cultural and
psychological beliefs into a single numerical value (Francis et al., 2013). Although disability
weights/utilities are well studied and widely used in quality of life assessment (Salomon et al.,
2013), they are still an imperfect method of quantifying such a qualitative outcome.
Notwithstanding, these limitations, cost-effectiveness analysis remains a useful tool for guiding
clinicians, researchers, and policy makers in making delicate decisions related to the allocation of
scarce resources. It is however of equal importance to understand that it only represents a limited
dimension of decision-making.
1.15 Conclusion
This chapter has reviewed literature on tuberculosis epidemiology, current diagnostic tests and
their limitations and finally looked at some tuberculosis diagnostic tests in the pipeline. The
magnitude of the tuberculosis burden in the world, especially among 22 high burden countries is
huge and is compounded by the HIV epidemic. The accuracy of diagnostic tests is lower in
HIV/TB coinfected individuals. Sputum smear microscopy, which is the test mostly relied upon
in the majority of high burden settings, has sensitivity as low as 20% in HIV/TB coinfected

Chapter 2: Literature review
52
individuals due to the low bacillary load. It will be a catastrophe to allow such a scenario to persist.
New TB diagnostics with high sensitivity and specificity in paucibacillary HIV infected
individuals are urgently needed.
Since TB infections predominantly occur in low resource settings due to poor living conditions,
new tests should be affordable, cost-effective and rapidly provide results to allow initiation of
appropriate therapy during the same clinical encounter. Patient dropout due to the need to make
multiple visits to the clinic to provide specimens and collect results when using tests that have long
turnaround times or require multiple samples has been cited as one of the drivers in the spread of
both MTB and MDR-TB. Nucleic acid amplification based tests have a short turnaround time
providing results within a few hours after receiving samples. This allows patients to be commenced
on appropriate therapy on the same day thus reducing the dropout rate. Sensitive detection of
pathogens is dependent on the availability of quality DNA or RNA templates. Thus efficient
sample processing methods that provide quality templates are critical. Traditional methods for
DNA/RNA extraction are labour intensive, lengthy, and require highly specialized skill, and this
hindered the adoption of molecular methods at the primary/district levels. Recent TB tests such as
the Xpert MTB/Rif and the Genedrive rely on the use of cartridges. Sample extraction,
amplification and detection are all carried out within the self-contained, single use cartridge. This
eliminates the need for intensive manual labour and highly specialized skill but this comes at a
huge cost (Choi et al., 2013). Cost-effective sample processing methods that offer similar
advantages to cartridges will improve access to nucleic acid based TB tests.
As highlighted earlier in this chapter, a number of TB tests exist but there is little data from large
multi-site evaluation studies to guide policy makers in choosing the most appropriate technologies.
After developing any new tests, innovators must create the necessary collaborations to evaluate
the tests in appropriate settings. These studies should follow STARD guidelines for conducting
evaluation studies in order to avoid bias and allow comparison of data from different studies. After
tests with better performance (sensitive and specific) have been identified, cost-effectiveness
analyses should be prioritized before implementation. This approach will minimize post-market
failure of new tests due to market related factors such as willingness to pay, availability of funding
for national TB programs, infrastructure, and size of the market.
It remains a challenge to evaluate the comparative qualitative and quantitative value of these tests
and the use of a number of value parameters have been described and will be applied to the NWU
TB diagnostic system in Chapter 6 of the thesis.
Chapter 2: Literature review
53
1.16 References
Albert, H., Nakiyingi, L., Sempa, J., Mbabazi, O., Mukkada, S., Nyesiga, B., Perkins, M.D. &
Manabe, Y.C. 2013. Operational Implementation of LED Fluorescence Microscopy in Screening
Tuberculosis Suspects in an Urban HIV Clinic in Uganda. PLoS ONE, 8(9):e72556.
Alexander, K.A., Laver, P.N., Michel, A.L., Williams, M., van Helden, P.D., Warren, R.M. & Gey
van Pittius, N.C. 2010. Novel Mycobacterium tuberculosis Complex Pathogen, M. mungi.
Emerging Infectious Diseases, 16(8):1296-1299.
Anderson, S.T., Kaforou, M., Brent, A.J., Wright, V.J., Banwell, C.M., Chagaluka, G., Crampin,
A.C., Dockrell, H.M., French, N., Hamilton, M.S., Hibberd, M.L., Kern, F., Langford, P.R., Ling,
L., Mlotha, R., Ottenhoff, T.H., Pienaar, S., Pillay, V., Scott, J.A., Twahir, H., Wilkinson, R.J.,
Coin, L.J., Heyderman, R.S., Levin, M. & Eley, B. 2014. Diagnosis of childhood tuberculosis
and host RNA expression in Africa. New England Journal of Medicine, 370(18):1712-1723.
Arbex, M.A., Varella, M.d.C.L., Siqueira, H.R.d. & Mello, F.A.F.d. 2010. Drogas
antituberculose: interações medicamentosas, efeitos adversos e utilização em situações especiais -
parte 1: fármacos de primeira linha. Jornal Brasileiro de Pneumologia, 36:626-640.
Ardito, F., Posteraro, B., Sanguinetti, M., Zanetti, S. & Fadda, G. 2001. Evaluation of BACTEC
Mycobacteria Growth Indicator Tube (MGIT 960) Automated System for Drug Susceptibility
Testing of Mycobacterium tuberculosis. Journal of Clinical Microbiology, 39(12):4440-4444.
Arias, M., Mello, F.C.Q., Pavón, A., Marsico, A.G., Alvarado-Gálvez, C., Rosales, S., Carvalho
Pessôa, C.L., Pérez, M., Andrade, M.K., Kritski, A.L., Fonseca, L.S., Chaisson, R.E., Kimerling,
M.E. & Dorman, S.E. 2007. Clinical evaluation of the microscopic-observation drug-
susceptibility assay for detection of tuberculosis. Clinical Infectious Diseases, 44(5):674-680.
Asmar, S. & Drancourt, M. 2015. Chlorhexidine decontamination of sputum for culturing
Mycobacterium tuberculosis. BMC Microbiology, 15(1):1-6.
Banoo, S., Bell, D., Bossuyt, P., Herring, A., Mabey, D., Poole, F., Smith, P.G., Sriram, N.,
Wongsrichanalai, C., Linke, R., O'Brien, R., Perkins, M., Cunningham, J., Matsoso, P., Nathanson,
C.M., Olliaro, P., Peeling, R.W. & Ramsay, A. 2008. Evaluation of diagnostic tests for infectious
diseases: general principles. Nature Reviews Microbiology S16-S28. doi:10.1038/nrmicro1523.

Chapter 2: Literature review
54
Barnard, M., Albert, H., Coetzee, G., O'Brien, R. & Bosman, M.E. 2008. Rapid molecular
screening for multidrug-resistant tuberculosis in a high-volume public health laboratory in South
Africa. American Journal of Respiratory and Critical Care Medicine 177(7):787-792.
Batz, H.-G., Cooke, G.S. & Reid, S.D. 2011. Towards lab-free tuberculosis diagnosis. Treatment
Action Group, the TB/HIV Working Group of the Stop TB Partnership, Imperial College, MSF.
Geneva.
Behr, M.A., Warren, S.A., Salamon, H., Hopewell, P.C., de Leon, A.P., Daley, C.L. & Small, P.M.
1999. Transmission of Mycobacterium tuberculosis from patients smear-negative for acid-fast
bacilli. The Lancet, 353(9151):444-449.
Bemer, P., Bodmer, T., Munzinger, J., Perrin, M., Vincent, V. & Drugeon, H. 2004. Multicenter
Evaluation of the MB/BACT System for Susceptibility Testing of Mycobacterium tuberculosis.
Journal of Clinical Microbiology, 42(3):1030-1034.
Bergamini, B.M., Losi, M., Vaienti, F., D'Amico, R., Meccugni, B., Meacci, M., De Giovanni, D.,
Rumpianesi, F., Fabbri, L.M., Balli, F. & Richeldi, L. 2009. Performance of Commercial Blood
Tests for the Diagnosis of Latent Tuberculosis Infection in Children and Adolescents. Pediatrics,
123(3):e419-e424.
Boehme, C.C., Nabeta, P., Henostroza, G., Raqib, R., Rahim, Z., Gerhardt, M., Sanga, E.,
Hoelscher, M., Notomi, T., Hase, T. & Perkins, M.D. 2007. Operational feasibility of using loop-
mediated isothermal amplification for diagnosis of pulmonary tuberculosis in microscopy centers
of developing countries. Journal of Clinical Microbiology, 45(6):1936-1940.
Boehme, C.C., Nabeta, P., Hillemann, D., Nicol, M.P., Shenai, S., Krapp, F., Allen, J., Tahirli, R.,
Blakemore, R., Rustomjee, R., Milovic, A., Jones, M., O'Brien, S.M., Persing, D.H., Ruesch-
Gerdes, S., Gotuzzo, E., Rodrigues, C., Alland, D. & Perkins, M.D. 2010. Rapid molecular
detection of tuberculosis and rifampin resistance. New England Journal of Medicine,
363(11):1005-1015.

Chapter 2: Literature review
55
Bossuyt, P.M., Reitsma, J.B., Bruns, D.E., Gatsonis, C.A., Glasziou, P.P., Irwig, L.M., Moher, D.,
Rennie, D., de Vet, H.C.W. & Lijmer, J.G. 2003. The STARD Statement for Reporting Studies
of Diagnostic Accuracy: Explanation and Elaboration. Clinical Chemistry, 49(1):7-18.
Boyle, D.S., McNerney, R., Teng Low, H., Leader, B.T., Pérez-Osorio, A.C., Meyer, J.C.,
O'Sullivan, D.M., Brooks, D.G., Piepenburg, O. & Forrest, M.S. 2014. Rapid Detection of
Mycobacterium tuberculosis by Recombinase Polymerase Amplification. PLoS ONE,
9(8):e103091.
Broekmans, J., Caines, K. & Paluzzi, J.E. 2005. Investing in strategies to reverse the global
incidence of TB. London: Earthscan.
Bruchfeld, J., Aderaye, G., Palme, I.B., Bjorvatn, B., Kallenius, G. & Lindquist, L. 2000. Sputum
concentration improves diagnosis of tuberculosis in a setting with a high prevalence of HIV.
Transactions of the Royal Society of Tropical Medicine and Hygiene, 94(6):677-680.
Brunello, F. & Fontana, R. 2000. Reliability of the MB/BacT System for Testing Susceptibility
of Mycobacterium tuberculosis Complex Isolates to Antituberculous Drugs. Journal of Clinical
Microbiology, 38(2):872-873.
Bwanga, F., Hoffner, S., Haile, M. & Joloba, M. 2009. Direct susceptibility testing for multi drug
resistant tuberculosis: A meta-analysis. BMC Infectious Diseases, 9(1):67.
Castan, P., dePablo, A., Fernández-Romero, N., Rubio, J., Cobb, B.D., Mingorance, J. & Toro, C.
2014. Point-of-Care System for Detection of Mycobacterium tuberculosis and Rifampin
Resistance in Sputum Samples. Journal of Clinical Microbiology, 52(2):502-507.
Caviedes, L. & Moore, D.A.J. 2007. Introducing mods: A low-cost, low-tech tool for high-
performance detection of tuberculosis and multidrug resistant tuberculosis. Indian Journal of
Medical Microbiology, 25(2):87-88.
Chatterjee, M., Bhattacharya, S., Karak, K. & Dastidar, S.G. 2013. Effects of different methods
of decontamination for successful cultivation of Mycobacterium tuberculosis. The Indian Journal
of Medical Research, 138(4):541-548.

Chapter 2: Literature review
56
Choi, H.W., Miele, K., Dowdy, D. & Shah, M. 2013. Cost-effectiveness of Xpert® MTB/RIF for
diagnosing pulmonary tuberculosis in the United States. The International Journal of
Tuberculosis and Lung Disease 17(10):1328-1335.
Cole, S.T., Brosch, R., Parkhill, J., Garnier, T., Churcher, C., Harris, D., Gordon, S.V., Eiglmeier,
K., Gas, S., Barry, C.E., 3rd, Tekaia, F., Badcock, K., Basham, D., Brown, D., Chillingworth, T.,
Connor, R., Davies, R., Devlin, K., Feltwell, T., Gentles, S., Hamlin, N., Holroyd, S., Hornsby,
T., Jagels, K., Krogh, A., McLean, J., Moule, S., Murphy, L., Oliver, K., Osborne, J., Quail, M.A.,
Rajandream, M.A., Rogers, J., Rutter, S., Seeger, K., Skelton, J., Squares, R., Squares, S., Sulston,
J.E., Taylor, K., Whitehead, S. & Barrell, B.G. 1998. Deciphering the biology of Mycobacterium
tuberculosis from the complete genome sequence. Nature, 393(6685):537-544.
Collins, D.M. & Stephens, D.M. 1991. Identification of an insertion sequence, IS1081, in
Mycobacterium bovis. FEMS Microbiology Letters 67(1):11-15.
Corbett, E.L., Watt, C.J., Walker, N. & et al. 2003. The growing burden of tuberculosis: Global
trends and interactions with the hiv epidemic. Archives of Internal Medicine, 163(9):1009-1021.
Coronel, J., Roper, M.H., Herrera, C., Bonilla, C., Jave, O., Gianella, C., Sabogal, I., Huancaré,
V., Leo, E., Tyas, A., Mendoza-Ticona, A., Caviedes, L. & Moore, D.A.J. 2014. Validation of
microscopic observation drug susceptibility testing for rapid, direct rifampicin and isoniazid drug
susceptibility testing in patients receiving tuberculosis treatment. Clinical Microbiology and
Infection, 20(6):536-541.
Costa, P., Amaro, A., Ferreira, A.S., Machado, D., Albuquerque, T., Couto, I., Botelho, A.,
Viveiros, M. & Inácio, J. 2014. Rapid identification of veterinary-relevant Mycobacterium
tuberculosis complex species using 16S rDNA, IS6110 and Regions of Difference-targeted dual-
labelled hydrolysis probes. Journal of Microbiological Methods, 107(0):13-22.
Couturier, B.A., Weight, T., Elmer, H. & Schlaberg, R. 2014. Antepartum Screening for Group
B Streptococcus by Three FDA-Cleared Molecular Tests and Effect of Shortened Enrichment
Culture on Molecular Detection Rates. Journal of Clinical Microbiology, 52(9):3429-3432.

Chapter 2: Literature review
57
Creswell, J., Sahu, S., Sachdeva, K.S., Ditiu, L., Barreira, D., Mariandyshev, A., Mingting, C. &
Pillay, Y. 2014. Tuberculosis in BRICS: challenges and opportunities for leadership within the
post-2015 agenda. Bulletin of the World Health Organization, 92(6):459-460.
Daniels, C. 2014. The tuberculosis diagnostics pipeline 2014. New York. URL:
http://www.pipelinereport.org/2014/tb-diagnostics. Date of access: 11 February 2015.
de Jong, B.C., Antonio, M. & Gagneux, S. 2010. Mycobacterium africanum—Review of an
Important Cause of Human Tuberculosis in West Africa. PLoS Neglected Tropical Diseases,
4(9):e744.
Denkinger, C.M., Nicolau, I., Ramsay, A., Chedore, P. & Pai, M. 2013. Are peripheral
microscopy centres ready for next generation molecular tuberculosis diagnostics? European
Respiratory Journal, 42(2):544-547.
Dheda, K., Warren, R.M., Zumla, A. & Grobusch, M.P. 2010. Extensively drug-resistant
tuberculosis: epidemiology and management challenges. Infectious Disease Clinics of North
America, 24(3):705-725.
Diamond, G.A. & Kaul, S. 2009. Cost, effectiveness, and cost-effectiveness. Circulation:
Cardiovascular Quality and Outcomes, 2(1):49-54.
Diedrich, C.R. & Flynn, J.L. 2011. HIV-1/Mycobacterium tuberculosis Coinfection Immunology:
How Does HIV-1 Exacerbate Tuberculosis? Infection and Immunity, 79(4):1407-1417.
Dowdy, D., Maters, A., Parrish, N., Beyrer, C. & Dorman, S. 2003. Cost-effectiveness of the
Gen-Probe amplified Mycobacterium tuberculosis direct test as used routinely on smear-positive
respiratory specimens. Journal of Clinical Microbiology, 41:948–953.
Drobatz, K.J. 2009. Measures of accuracy and performance of diagnostic tests. Journal of
Veterinary Cardiology, 11, Supplement 1:S33-S40.
Ducati, R.G., Ruffino-Netto, A., Basso, L.A. & Santos, D.S. 2006. The resumption of
consumption : a review on tuberculosis. Memórias do Instituto Oswaldo Cruz, 101:697-714.

Chapter 2: Literature review
58
Earnshaw, J. & Lewis, G. 2008. NICE guide to the methods of technology appraisal.
Pharmacoeconomics, 26(9):725-727.
Eusebi, P. 2013. Diagnostic Accuracy Measures. Cerebrovascular Diseases, 36(4):267-272.
Falodun, O.I., Adesokan, H.K. & Cadmus, S.I.B. 2012. Recovery rates of Mycobacterium
tuberculosis using five decontamination methods. African journal of medicine and medical
sciences, 41 Suppl:181-185.
Fang, R., Li, X., Hu, L., You, Q., Li, J., Wu, J., Xu, P., Zhong, H., Luo, Y., Mei, J. & Gao, Q.
2009. Cross-Priming Amplification for Rapid Detection of Mycobacterium tuberculosis in
Sputum Specimens. Journal of Clinical Microbiology, 47(3):845-847.
Farzam, B., Imani Fooladi, A.A., Izadi, M., Hossaini, H.M. & Feizabadi, M.M. 2015. Comparison
of cyp141 and IS6110 for detection of Mycobacterium tuberculosis from clinical specimens by
PCR. Journal of Infection and Public Health, 8(1):32-36.
Flores, L., Pai, M., Colford, J. & Riley, L. 2005. In-house nucleic acid amplification tests for the
detection of Mycobacterium tuberculosis in sputum specimens: meta-analysis and meta-
regression. BMC Microbiology, 5(1):55.
Food and Drug Administration. 2013. FDA permits marketing of first US test labeled for
simultaneous detection of tuberculosis bacteria and resistance to the antibiotic rifampin. Clinical
Infectious Diseases, 57.
Francis, S.A., Daly, C., Heydari, B., Abbasi, S., Shah, R.V. & Kwong, R.Y. 2013. Cost-
effectiveness analysis for imaging techniques with a focus on cardiovascular magnetic resonance.
Journal of Cardiovascular Magnetic Resonance, 15(1):1-11.
Frick, M. 2014. Tuberculosis Research and development: 2014 Report on Tuberculosis Research
Funding Trends, 2005–2013. URL:
http://www.treatmentactiongroup.org/sites/g/files/g450272/f/201505/TAG_2014_TB_Fundin
g_Report_2nd_Ed.pdf. Date of access: 28 February 2015.

Chapter 2: Literature review
59
Gandhi, N.R., Nunn, P., Dheda, K., Schaaf, H.S., Zignol, M., van Soolingen, D., Jensen, P. &
Bayona, J. 2010. Multidrug-resistant and extensively drug-resistant tuberculosis: a threat to global
control of tuberculosis. The Lancet, 375(9728):1830-1843.
Glynn, J.R., Crampin, A.C., Yates, M.D., Traore, H., Mwaungulu, F.D., Ngwira, B.M., Ndlovu,
R., Drobniewski, F. & Fine, P.E.M. 2005. The Importance of Recent Infection with
Mycobacterium tuberculosis in an Area with High HIV Prevalence: A Long-Term Molecular
Epidemiological Study in Northern Malawi. Journal of Infectious Diseases, 192(3):480-487.
Grange, J.M. 2001. Mycobacterium bovis infection in human beings. Tuberculosis 81(1-2):71-
77.
Gravelle, H. & Smith, D. 2001. Discounting for health effects in cost–benefit and cost‐
effectiveness analysis. Health economics, 10(7):587-599.
Gray, C.M., Katamba, A., Narang, P., Giraldo, J., Zamudio, C., Joloba, M., Narang, R.,
Paramasivan, C.N., Hillemann, D., Nabeta, P., Amisano, D., Alland, D., Cobelens, F. & Boehme,
C.C. 2016. Feasibility and Operational Performance of Tuberculosis Detection by Loop-Mediated
Isothermal Amplification Platform in Decentralized Settings: Results from a Multicenter Study.
Journal of Clinical Microbiology, 54(8):1984-1991.
Greco, S., Girardi, E., Navarra, A. & Saltini, C. 2006. The current evidence on diagnostic
accuracy of commercial based nucleic acid amplification tests for the diagnosis of pulmonary
tuberculosis. Thorax, 61:783–790.
Greco, S., Rulli, M., Girardi, E., Piersimoni, C. & Saltini, C. 2009. Diagnostic Accuracy of In-
House PCR for Pulmonary Tuberculosis in Smear-Positive Patients: Meta-Analysis and
Metaregression. Journal of Clinical Microbiology, 47(3):569-576.
Guney, C., Suel, A., Karagoz, T. & Yorulmaz, Y. 2007. P1642 Evaluation of the BACT/ALERT
3D system for testing susceptibility of Mycobacterium tuberculosis tofirst-line antituberculosis
agents: comparison with BacTec MGIT 960 and Lowenstein-Jensen proportion method.
International Journal of Antimicrobial Agents, 29, Supplement 2(0):S463.

Chapter 2: Literature review
60
Gutierrez, M.C., Brisse, S., Brosch, R., Fabre, M., Omaïs, B., Marmiesse, M., Supply, P. &
Vincent, V. 2005. Ancient Origin and Gene Mosaicism of the Progenitor of Mycobacterium
tuberculosis. PLoS Pathogens, 1(1):e5.
Hanrahan, C.F., Selibas, K., Deery, C.B., Dansey, H., Clouse, K., Bassett, J., Scott, L., Stevens,
W., Sanne, I. & Van Rie, A. 2013. Time to Treatment and Patient Outcomes among TB Suspects
Screened by a Single Point-of-Care Xpert MTB/RIF at a Primary Care Clinic in Johannesburg,
South Africa. PLoS ONE, 8(6):e65421.
Harrington, M. & Benjamin, W. 2015. The Tuberculosis Diagnostics Pipeline. 2015 PIPELINE
REPORT:153. URL:
http://www.pipelinereport.org/sites/g/files/g575521/f/201507/TB%20Diagnostics.pdf. Date of
access: 16 December 2015.
Hatherill, M., Hanslo, M., Hawkridge, T., Little, F., Workman, L., Mahomed, H., Tameris, M.,
Moyo, S., Geldenhuys, H., Hanekom, W., Geiter, L. & Hussey, G. 2010. Structured approaches
for the screening and diagnosis of childhood tuberculosis in a high prevalence region of South
Africa. Bulletin of the World Health Organization, 88(4):312-320.
Helb, D., Jones, M., Story, E., Boehme, C., Wallace, E., Ho, K., Kop, J., Owens, M.R., Rodgers,
R., Banada, P., Safi, H., Blakemore, R., Lan, N.T.N., Jones-López, E.C., Levi, M., Burday, M.,
Ayakaka, I., Mugerwa, R.D., McMillan, B., Winn-Deen, E., Christel, L., Dailey, P., Perkins, M.D.,
Persing, D.H. & Alland, D. 2010. Rapid Detection of Mycobacterium tuberculosis and Rifampin
Resistance by Use of On-Demand, Near-Patient Technology. Journal of Clinical Microbiology,
48(1):229-237.
Hesseling, A.C., Schaaf, H.S., Gie, R.P., Starke, J.R. & Beyers, N. 2002. A critical review of
diagnostic approaches used in the diagnosis of childhood tuberculosis. The International Journal
of Tuberculosis and Lung Disease, 6(12):1038-1045.
Hillemann, D., Rüsch-Gerdes, S. & Richter, E. 2007. Evaluation of the GenoType MTBDRplus
Assay for Rifampin and Isoniazid Susceptibility Testing of Mycobacterium tuberculosis Strains
and Clinical Specimens. Journal of Clinical Microbiology, 45(8):2635-2640.

Chapter 2: Literature review
61
Hirano, K., Abe, C. & Takahashi, M. 1999. Mutations in the rpoB Gene of Rifampin-Resistant
Mycobacterium tuberculosis Strains Isolated Mostly in Asian Countries and Their Rapid Detection
by Line Probe Assay. Journal of Clinical Microbiology, 37(8):2663-2666.
Hologic Gen-Probe inc. Amplified MTD Test Performance Data. http://www.gen-
probe.com/products-services/amplified-mtd Date of access: 13 March 2015
Huang, Z., Li, G., Chen, J., Li, W., Xu, X., Luo, Q., Xiong, G., Sun, J. & Li, J. 2014. Evaluation
of MODS assay for rapid detection of Mycobacterium tuberculosis resistance to second-line drugs
in a tertiary care tuberculosis hospital in China. Tuberculosis, 94(5):506-510.
Jakubiak-Lasocka, J. & Jakubczyk, M. 2014. Cost-effectiveness versus Cost-Utility Analyses:
What Are the Motives Behind Using Each and How Do Their Results Differ?—A Polish Example.
Value in Health Regional Issues, 4:66-74.
Jang, M.-A., Koh, W.-J., Huh, H.J., Kim, S.-Y., Jeon, K., Ki, C.-S. & Lee, N.Y. 2014. Distribution
of Nontuberculous Mycobacteria by Multigene Sequence-Based Typing and Clinical Significance
of Isolated Strains. Journal of Clinical Microbiology, 52(4):1207-1212.
Kantor de Narvaiz, I., Kim Jae, S., Frieden, T., Laszlo, A., Luelmo, F., Norval, P.-Y., Rieder, H.,
Valenzuela, P. & Weyer, K. 1998. Laboratory services in tuberculosis control, part II:
Microscopy. Geneva, Switzerland. URL:
http://apps.who.int/iris/bitstream/10665/65942/1/WHO_TB_98.258_(part1).pdf. Date of access:
11 June 2014.
Kik, S.V., Denkinger, C.M., Chedore, P. & Pai, M. 2014. Replacing smear microscopy for the
diagnosis of tuberculosis: what is the market potential? European Respiratory Journal,
43(6):1793-1796.
Kivihya-Ndugga, L.E.A., van Cleeff, M.R.A., Githui, W.A., Nganga, L.W., Kibuga, D.K.,
Odhiambo, J.A. & Klatser, P.R. 2003. A comprehensive comparison of Ziehl-Neelsen and
fluorescence microscopy for the diagnosis of tuberculosis in a resource-poor urban setting. The
International Journal of Tuberculosis and Lung Disease, 7(12):1163-1171.
Chapter 2: Literature review
62
Koeck, J.L., Fabre, M., Simon, F., Daffé, M., Garnotel, é., Matan, A.B., Gérôme, P., Bernatas, J.J.,
Buisson, Y. & Pourcel, C. 2010. Clinical characteristics of the smooth tubercle bacilli
'Mycobacterium canettii' infection suggest the existence of an environmental reservoir. Clinical
Microbiology and Infection, 17(7):1013-1019.
Kontos, F., Maniati, M., Costopoulos, C., Gitti, Z., Nicolaou, S., Petinaki, E., Anagnostou, S.,
Tselentis, I. & Maniatis, A.N. 2004. Evaluation of the fully automated Bactec MGIT 960 system
for the susceptibility testing of Mycobacterium tuberculosis to first-line drugs: a multicenter study.
Journal of Microbiological Methods, 56(2):291-294.
Kremer, K., van Soolingen, D., van Embden, J., Hughes, S., Inwald, J. & Hewinson, G. 1998.
Mycobacterium microti: More Widespread than Previously Thought. Journal of Clinical
Microbiology, 36(9):2793-2794.
Krieger, J. & Higgins, D. 2002. Housing and Health: Time Again for Public Health Action.
American Journal of Public Health 92(5):758–768.
Lawn, S.D., Butera, S.T. & Shinnick, T.M. 2002. Tuberculosis unleashed: the impact of human
immunodeficiency virus infection on the host granulomatous response to Mycobacterium
tuberculosis. Microbes and Infection, 4(6):635-646.
Levin, H.M. & McEwan, P.J. 2001. Cost-effectiveness analysis: Methods and applications. Vol.
4: Sage Publications.
Lighter, J. & Rigaud, M. 2009. Diagnosing childhood tuberculosis: traditional and innovative
modalities. Current Problems in Pediatric and Adolescent Health Care, 39(3):61-88.
Ling, D.I., Flores, L.L., Riley, L.W. & Pai, M. 2008. Commercial Nucleic-Acid Amplification
Tests for Diagnosis of Pulmonary Tuberculosis in Respiratory Specimens: Meta-Analysis and
Meta-Regression. PLoS ONE, 3(2):e1536.
Loeffler, S.H., de Lisle, G.W., Neill, M.A., Collins, D.M., Price-Carter, M., Paterson, B. & Crews,
K.B. 2014. The seal tuberculosis agent, Mycobacterium pinnipedii, infects domestic cattle in
New Zealand: epidemiologic factors and DNA strain typing. Journal of Wildlife Diseases,
50(2):180-187.

Chapter 2: Literature review
63
MacMicking, J.D., Taylor, G.A. & McKinney, J.D. 2003. Immune control of tuberculosis by
IFN-gamma-inducible LRG-47. Science, 302(5645):654-659.
MAG Mutual Healthcare Solutions. 2008. 2009 physicians’ fee & coding guide. Duluth (GA),
USA.
Makinen, J., Marttila, H.J., Marjamaki, M., Viljanen, M.K. & Soini, H. 2006. Comparison of two
commercially available DNA line probe assays for detection of multidrug-resistant
Mycobacterium tuberculosis. Journal of Clinical Microbiology, 44(2):350-352.
Marais, B., Gie, R., Obihara, C., Hesseling, A., Schaaf, H. & Beyers, N. 2005. Well defined
symptoms are of value in the diagnosis of childhood pulmonary tuberculosis. Archives of Disease
in Childhood, 90(11):1162-1165.
McNerney, R., Cunningham, J., Hepple, P. & Zumla, A. 2015. New tuberculosis diagnostics and
rollout. International Journal of Infectious Diseases, 32:81-86.
McNerney, R. & Zumla, A. 2015. Impact of the Xpert MTB/RIF diagnostic test for tuberculosis
in countries with a high burden of disease. Current Opinion in Pulmonary Medicine, 21(3):304-
308.
Mello, F.C., Arias, M.S., Rosales, S., Marsico, A.G., Pavon, A., Alvarado-Galvez, C., Pessoa,
C.L., Perez, M., Andrade, M.K., Kritski, A.L., Fonseca, L.S., Chaisson, R.E., Kimerling, M.E. &
Dorman, S.E. 2007. Clinical evaluation of the microscopic observation drug susceptibility assay
for detection of Mycobacterium tuberculosis resistance to isoniazid or rifampin. Journal of
Clinical Microbiology, 45(10):3387-3389.
Mhimbira, F.A., Bholla, M., Sasamalo, M., Mukurasi, W., Hella, J.J., Jugheli, L. & Reither, K.
2015. Detection of Mycobacterium tuberculosis by EasyNAT Diagnostic Kit in Sputum Samples
from Tanzania. Journal of Clinical Microbiology, 53(4):1342-1344.
Migliori, G.B., Besozzi, G., Girardi, E., Kliiman, K., Lange, C., Toungoussova, O.S., Ferrara, G.,
Cirillo, D.M., Gori, A., Matteelli, A., Spanevello, A., Codecasa, L.R. & Raviglione, M.C. 2007.

Chapter 2: Literature review
64
Clinical and operational value of the extensively drug-resistant tuberculosis definition. European
Respiratory Journal, 30(4):623-626.
Minion, J., Leung, E., Menzies, D. & Pai, M. 2010. Microscopic-observation drug susceptibility
and thin layer agar assays for the detection of drug resistant tuberculosis: a systematic review and
meta-analysis. The Lancet Infectious Diseases, 10(10):688-698.
Miotto, P., Piana, F., Penati, V., Canducci, F., Migliori, G.B. & Cirillo, D.M. 2006. Use of
genotype MTBDR assay for molecular detection of rifampin and isoniazid resistance in
Mycobacterium tuberculosis clinical strains isolated in Italy. Journal of Clinical Microbiology,
44(7):2485-2491.
Mireia, C., Astrid, L., Sonja, M., Kerstin, M.-R., Sébastien, C.-S., Andreas, N., Pjotr Wojtek, D.,
Aleksandar, R., Stefan, N., Julian, P., Emmanuel, C.-H., Julia, F., Iñaki, C., Christophe, B.,
Sebastien, G. & Fabian, H.L. 2013. Novel Mycobacterium tuberculosis Complex Isolate from a
Wild Chimpanzee. Emerging Infectious Diseases 19(6):969.
Mitarai, S., Okumura, M., Toyota, E., Yoshiyama, T., Aono, A., Sejimo, A., Azuma, Y., Sugahara,
K., Nagasawa, T., Nagayama, N., Yamane, A., Yano, R., Kokuto, H., Morimoto, K., Ueyama, M.,
Kubota, M., Yi, R., Ogata, H., Kudoh, S. & Mori, T. 2011. Evaluation of a simple loop-mediated
isothermal amplification test kit for the diagnosis of tuberculosis. The International Journal of
Tuberculosis and Lung Disease, 15(9):1211-1217, i.
Molicotti, P., Bua, A. & Zanetti, S. 2014. Cost-effectiveness in the diagnosis of tuberculosis:
choices in developing countries. The Journal of Infection in Developing Countries, 8(01):24-38.
Molina-Moya, B., Lacoma, A., Prat, C., Diaz, J., Dudnyk, A., Haba, L., Maldonado, J., Samper,
S., Ruiz-Manzano, J., Ausina, V. & Dominguez, J. 2015. AID TB resistance line probe assay for
rapid detection of resistant Mycobacterium tuberculosis in clinical samples. Journal of Infection,
70(4):400-408.
Moore, D.A.J., Caviedes, L., Gilman, R.H., Coronel, J., Arenas, F., LaChira, D., Salazar, C.,
Carlos Saravia, J., Oberhelman, R.A., Hollm-Delgado, M.-G., Escombe, A.R., Evans, C.A.W. &
Friedland, J.S. 2006a. Infrequent MODS TB culture cross-contamination in a high-burden
resource-poor setting. Diagnostic Microbiology and Infectious Disease, 56(1):35-43.

Chapter 2: Literature review
65
Moore, D.A.J., Evans, C.A.W., Gilman, R.H., Caviedes, L., Coronel, J., Vivar, A., Sanchez, E.,
Piñedo, Y., Saravia, J.C., Salazar, C., Oberhelman, R., Hollm-Delgado, M.-G., LaChira, D.,
Escombe, A.R. & Friedland, J.S. 2006b. Microscopic-Observation Drug-Susceptibility Assay for
the Diagnosis of TB. New England Journal of Medicine, 355(15):1539-1550.
Moure, R., Muñoz, L., Torres, M., Santin, M., Martín, R. & Alcaide, F. 2011. Rapid Detection
of Mycobacterium tuberculosis Complex and Rifampin Resistance in Smear-Negative Clinical
Samples by Use of an Integrated Real-Time PCR Method. Journal of Clinical Microbiology,
49(3):1137-1139.
Nathanson, E., Nunn, P., Uplekar, M., Floyd, K., Jaramillo, E., Lonnroth, K., Weil, D. &
Raviglione, M. 2010. MDR tuberculosis--critical steps for prevention and control. New England
Journal of Medicine, 363(11):1050-1058.
Neonakis, I.K., Spandidos, D.A. & Petinaki, E. 2011. Use of loop-mediated isothermal
amplification of DNA for the rapid detection of Mycobacterium tuberculosis in clinical specimens.
European Journal of Clinical Microbiology & Infectious Diseases, 30(8):937-942.
Neumann, P.J. 2009. Costing and perspective in published cost-effectiveness analysis. Medical
care, 47(7_Supplement_1):S28-S32.
Niemz, A. & Boyle, D.S. 2012. Nucleic acid testing for tuberculosis at the point-of-care in high-
burden countries. Expert Review of Molecular Diagnostics, 12(7):687-701.
Nikam, C., Jagannath, M., Narayanan, M.M., Ramanabhiraman, V., Kazi, M., Shetty, A. &
Rodrigues, C. 2013. Rapid Diagnosis of Mycobacterium tuberculosis with Truenat MTB: A Near-
Care Approach. PLoS ONE, 8(1):e51121.
Nimesh, M., Joon, D., Pathak, A.K. & Saluja, D. 2013. Comparative study of diagnostic accuracy
of established PCR assays and in-house developed sdaA PCR method for detection of
Mycobacterium tuberculosis in symptomatic patients with pulmonary tuberculosis. Journal of
Infection, 67(5):399-407.
Notomi, T., Okayama, H., Masubuchi, H., Yonekawa, T., Watanabe, K., Amino, N. & Hase, T.
2000. Loop-mediated isothermal amplification of DNA. Nucleic Acids Research, 28(12):e63.

Chapter 2: Literature review
66
Ogbudebe, C.L., Chukwu, J.N., Nwafor, C.C., Meka, A.O., Ekeke, N., Madichie, N.O., Anyim,
M.C., Osakwe, C., Onyeonoro, U., Ukwaja, K.N. & Oshi, D.C. 2015. Reaching the underserved:
Active tuberculosis case finding in urban slums in southeastern Nigeria. International Journal of
Mycobacteriology, 4(1):18-24.
Okeh, U. & Okoro, C. 2012. Evaluating Measures of Indicators of Diagnostic Test Performance:
Fundamental Meanings and Formulars. Journal of Biometrics & Biostatistics, 3(132).
Ou, X., Song, Y., Zhao, B., Li, Q., Xia, H., Zhou, Y., Pang, Y., Wang, S., Zhang, Z., Cheng, S.,
Liu, C. & Zhao, Y. 2014. A multicenter study of Cross-Priming Amplification for tuberculosis
diagnosis at peripheral level in China. Tuberculosis, 94(4):428-433.
Paglia, M.G., Bevilacqua, N., Haji, H.S., Vairo, F., Girardi, E., Nicastri, E., Muhsin, J., Racalbuto,
V., Jiddawi, M.S. & Ippolito, G. 2012. Improvement of Tuberculosis Laboratory Capacity on
Pemba Island, Zanzibar: A Health Cooperation Project. PLoS ONE, 7(8):e44109.
Palomino, J.C. 2005. Nonconventional and new methods in the diagnosis of tuberculosis:
feasibility and applicability in the field. European Respiratory Journal, 26(2):339-350.
Parsons, L.M., Somoskövi, Á., Gutierrez, C., Lee, E., Paramasivan, C.N., Abimiku, A.l., Spector,
S., Roscigno, G. & Nkengasong, J. 2011. Laboratory Diagnosis of Tuberculosis in Resource-
Poor Countries: Challenges and Opportunities. Clinical Microbiology Reviews, 24(2):314-350.
Parsons, S.D.C., Drewe, J.A., Gey van Pittius, N.C., Warren, R.M. & van Helden, P.D. 2013.
Novel Cause of Tuberculosis in Meerkats, South Africa. Emerging Infectious Diseases,
19(12):2004-2007.
Parwati, I., van Crevel, R. & van Soolingen, D. 2010. Possible underlying mechanisms for
successful emergence of the Mycobacterium tuberculosis Beijing genotype strains. The Lancet
Infectious Diseases, 10(2):103-111.
Pearce, E.C., Woodward, J.F., Nyandiko, W.M., Vreeman, R.C. & Ayaya, S.O. 2012. A
systematic review of clinical diagnostic systems used in the diagnosis of tuberculosis in children.
AIDS Research and Treatment, 2012:401896.

Chapter 2: Literature review
67
Perez-Velez, C.M. & Marais, B.J. 2012. Tuberculosis in Children. New England Journal of
Medicine, 367(4):348-361.
Pietersen, E., Ignatius, E., Streicher, E.M., Mastrapa, B., Padanilam, X., Pooran, A., Badri, M.,
Lesosky, M., van Helden, P., Sirgel, F.A., Warren, R. & Dheda, K. 2014. Long-term outcomes
of patients with extensively drug-resistant tuberculosis in South Africa: a cohort study. The
Lancet, 383(9924):1230-1239.
Pooran, A., Pieterson, E., Davids, M., Theron, G. & Dheda, K. 2013. What is the Cost of
Diagnosis and Management of Drug Resistant Tuberculosis in South Africa? PLoS ONE,
8(1):e54587.
Prados-Torres, A., Calderón-Larrañaga, A., Hancco-Saavedra, J., Poblador-Plou, B. & van den
Akker, M. 2013. Multimorbidity patterns: a systematic review. Journal of Clinical Epidemiology,
67(3):254-266.
Qin, Z.Z., Pai, M., Van Gemert, W., Sahu, S., Ghiasi, M. & Creswell, J. 2015. How is Xpert
MTB/RIF being implemented in 22 high tuberculosis burden countries? European Respiratory
Journal, 45(2):549-554.
Radomski, N., Roguet, A., Lucas, F.S., Veyrier, F.J., Cambau, E., Accrombessi, H., Moilleron, R.,
Behr, M.A. & Moulin, L. 2013. atpE gene as a new useful specific molecular target to quantify
Mycobacterium in environmental samples. BMC Microbiology, 13(1):1-13.
Ramsey, S., Willke, R., Briggs, A., Brown, R., Buxton, M., Chawla, A., Cook, J., Glick, H., Liljas,
B. & Petitti, D. 2005. Good research practices for cost‐effectiveness analysis alongside clinical
trials: the ISPOR RCT‐CEA task force report. Value in health, 8(5):521-533.
Rastogi, N., Legrand, E. & Sola, C. 2001. The mycobacteria: an introduction to nomenclature
and pathogenesis. Scientific and Technical Review, 20(1):21-54.
Raviglione, M. & Director, G.T.B. 2013. Global strategy and targets for tuberculosis prevention,
care and control after 2015: Geneva, World Health Organization. URL:
http://www.who.int/tb/post_2015_tb_presentation.pdf?ua=1. Date of access: 11 August 2015.

Chapter 2: Literature review
68
Rehle, T.M., Hallett, T.B., Shisana, O., Pillay-van Wyk, V., Zuma, K., Carrara, H. & Jooste, S.
2010. A Decline in New HIV Infections in South Africa: Estimating HIV Incidence from Three
National HIV Surveys in 2002, 2005 and 2008. PLoS ONE, 5(6):e11094.
Reinschmidt, K.F. 2002. Aggregate social discount rate derived from individual discount rates.
Management Science, 48(2):307-312.
Ritter, C., Lucke, K., Sirgel, F.A., Warren, R.W., van Helden, P.D., Böttger, E.C. & Bloemberg,
G.V. 2014. Evaluation of the AID TB Resistance Line Probe Assay for Rapid Detection of
Genetic Alterations Associated with Drug Resistance in Mycobacterium tuberculosis Strains.
Journal of Clinical Microbiology, 52(3):940-946.
Robinson, R. 1993. Cost-effectiveness analysis. The British Medical Journal, 307(6907):793-
795.
Rohner, P., Ninet, B., Metral, C., Emler, S. & Auckenthaler, R. 1997. Evaluation of the MB/BacT
system and comparison to the BACTEC 460 system and solid media for isolation of mycobacteria
from clinical specimens. Journal of Clinical Microbiology, 35(12):3127-3131.
Rossau, R., Traore, H., De Beenhouwer, H., Mijs, W., Jannes, G., De Rijk, P. & Portaels, F. 1997.
Evaluation of the INNO-LiPA Rif. TB assay, a reverse hybridization assay for the simultaneous
detection of Mycobacterium tuberculosis complex and its resistance to rifampin. Antimicrobial
Agents and Chemotherapy, 41(10):2093-2098.
Russell, L.B., Gold, M.R., Siegel, J.E., Daniels, N. & Weinstein, M.C. 1996. The role of cost-
effectiveness analysis in health and medicine. Journal of the American Medical Association,
276(14):1172-1177.
Ryder, H.F., McDonough, C., Tosteson, A.N.A. & Lurie, J.D. 2009. Decision Analysis and Cost-
effectiveness Analysis. Seminars in Spine Surgery, 21(4):216-222.
Sabrina, R., Javier, B., Beatriz, R., Lucía de, J., Julio, Á., Elena, C., Nuria, M., Francisco, L.,
Javed, M.T., José, L.S.-L., Ernesto, L., Ana, M., Lucas, D., Alicia, A. & Monitoring of Animal,
T. 2011. Mycobacterium caprae Infection in Livestock and Wildlife, Spain. Emerging Infectious
Diseases, 17(3):532.

Chapter 2: Literature review
69
Safianowska, A., Walkiewicz, R., Nejman-Gryz, P. & Grubek-Jaworska, H. 2012. The use of
selected commercial molecular assays for the microbiological diagnosis of tuberculosis.
Pneumonologia i Alergologia Polska, 80:6-12.
Salomon, J.A., Vos, T., Hogan, D.R., Gagnon, M., Naghavi, M., Mokdad, A., Begum, N., Shah,
R., Karyana, M. & Kosen, S. 2013. Common values in assessing health outcomes from disease
and injury: disability weights measurement study for the Global Burden of Disease Study 2010.
The Lancet, 380(9859):2129-2143.
Scott, L.E., Beylis, N., Nicol, M., Nkuna, G., Molapo, S., Berrie, L., Duse, A. & Stevens, W.S.
2014. Diagnostic Accuracy of Xpert MTB/RIF for Extrapulmonary Tuberculosis Specimens:
Establishing a Laboratory Testing Algorithm for South Africa. Journal of Clinical Microbiology,
52(6):1818-1823.
Shankar, E.M., Vignesh, R., Ellegård, R., Barathan, M., Chong, Y.K., Bador, M.K., Rukumani,
D.V., Sabet, N.S., Kamarulzaman, A., Velu, V. & Larsson, M. 2014. HIV–Mycobacterium
tuberculosis co-infection: a ‘danger-couple model’ of disease pathogenesis. Pathogens and
Disease, 70(2):110-118.
Shiferaw, G., Woldeamanuel, Y., Gebeyehu, M., Girmachew, F., Demessie, D. & Lemma, E.
2007. Evaluation of microscopic observation drug susceptibility assay for detection of multidrug-
resistant Mycobacterium tuberculosis. Journal of Clinical Microbiology, 45(4):1093-1097.
Smith, I. 2003. Mycobacterium tuberculosis Pathogenesis and Molecular Determinants of
Virulence. Clinical Microbiology Reviews, 16(3):463-496.
Soini, H. & Musser, J.M. 2001. Molecular diagnosis of mycobacteria. Clinical Chemistry,
47(5):809-814.
Sonnenberg, P., Murray, J., Glynn, J.R., Shearer, S., Kambashi, B. & Godfrey-Faussett, P. 2001.
HIV-1 and recurrence, relapse, and reinfection of tuberculosis after cure: a cohort study in South
African mineworkers. The Lancet, 358(9294):1687-1693.

Chapter 2: Literature review
70
Steingart, K.R., Henry, M., Ng, V., Hopewell, P.C., Ramsay, A., Cunningham, J., Urbanczik, R.,
Perkins, M., Aziz, M.A. & Pai, M. 2006a. Fluorescence versus conventional sputum smear
microscopy for tuberculosis: a systematic review. The Lancet Infectious Diseases, 6(9):570-581.
Steingart, K.R., Ng, V., Henry, M., Hopewell, P.C., Ramsay, A., Cunningham, J., Urbanczik, R.,
Perkins, M.D., Aziz, M.A. & Pai, M. 2006b. Sputum processing methods to improve the
sensitivity of smear microscopy for tuberculosis: a systematic review. The Lancet Infectious
Diseases, 6(10):664-674.
Steingart, K.R., Ramsay, A. & Pai, M. 2007. Optimizing sputum smear microscopy for the
diagnosis of pulmonary tuberculosis. Expert review of anti-infective therapy 5(3):327-331.
Steingart, K.R., Schiller, I., Horne, D.J., Pai, M., Boehme, C.C. & Dendukuri, N. 2014. Xpert®
MTB/RIF assay for pulmonary tuberculosis and rifampicin resistance in adults. Cochrane
Database Syst Rev, 1.
Stop TB Partnership’s New Diagnostics Working Group. 2009. Pathways to better diagnostics
for tuberculosis: a blueprint for the development of TB diagnostics. Geneva: World Health
Organization. URL:
http://www.stoptb.org/wg/new_diagnostics/assets/documents/blueprinttb_annex_web.pdf.
Date of access: 14 February 2014.
Swingler, G.H., du Toit, G., Andronikou, S., van der Merwe, L. & Zar, H.J. 2005. Diagnostic
accuracy of chest radiography in detecting mediastinal lymphadenopathy in suspected pulmonary
tuberculosis. Archives of Disease in Childhood, 90(11):1153-1156.
Telisinghe, L., Fielding, K.L., Malden, J.L., Hanifa, Y., Churchyard, G.J., Grant, A.D. &
Charalambous, S. 2014. High tuberculosis prevalence in a South African prison: the need for
routine tuberculosis screening. PLoS One, 9(1):e87262.
Theron, G., Peter, J., Dowdy, D., Langley, I., Squire, S.B. & Dheda, K. 2014a. Do high rates of
empirical treatment undermine the potential effect of new diagnostic tests for tuberculosis in high-
burden settings? The Lancet Infectious Diseases, 14(6):527-532.

Chapter 2: Literature review
71
Theron, G., Zijenah, L., Chanda, D., Clowes, P., Rachow, A., Lesosky, M., Bara, W., Mungofa,
S., Pai, M., Hoelscher, M., Dowdy, D., Pym, A., Mwaba, P., Mason, P., Peter, J. & Dheda, K.
2014b. Feasibility, accuracy, and clinical effect of point-of-care Xpert MTB/RIF testing for
tuberculosis in primary-care settings in Africa: a multicentre, randomised, controlled trial. The
Lancet, 383(9915):424-435.
Thierry, D., Brisson-Noel, A., Vincent-Levy-Frebault, V., Nguyen, S., Guesdon, J.L. & Gicquel,
B. 1990. Characterization of a Mycobacterium tuberculosis insertion sequence, IS6110, and its
application in diagnosis. Journal of Clinical Microbiology, 28(12):2668-2673.
Tomita, N., Mori, Y., Kanda, H. & Notomi, T. 2008. Loop-mediated isothermal amplification
(LAMP) of gene sequences and simple visual detection of products. Nature protocols 3:877-882.
Trajman, A., Pai, M., Dheda, K., van Zyl Smit, R., Zwerling, A.A., Joshi, R., Kalantri, S., Daley,
P. & Menzies, D. 2008. Novel tests for diagnosing tuberculous pleural effusion: what works and
what does not? European Respiratory Journal, 31(5):1098-1106.
Travis, P., Bennett, S., Haines, A., Pang, T., Bhutta, Z., Hyder, A.A., Pielemeier, N.R., Mills, A.
& Evans, T. 2004. Overcoming health-systems constraints to achieve the Millennium
Development Goals. The Lancet, 364(9437):900-906.
Trusov, A., Bumgarner, R., Valijev, R., Chestnova, R., Talevski, S., Vragoterova, C. & Neeley,
E.S. 2009. Comparison of Lumin LED fluorescent attachment, fluorescent microscopy and Ziehl-
Neelsen for AFB diagnosis. The International Journal of Tuberculosis and Lung Disease,
13(7):836-841.
UNITAID. 2012. Tuberculosis: diagnostic technology landscape: Semi-annual update.
www.unitaid.eu/images/marketdynamics/. Date of access: 14 July 2014.
UNITAID. 2015. Tuberculosis diagnostics technology and market landscape,. Geneva: World
Health Organization. https://c-path.org/wp-
content/uploads/2015/11/Tuberculosis_diagnostics_technology_and_market_landscape_4th_edit
ion_Oct_2015.pdf. Date of access: 16 July 2014.

Chapter 2: Literature review
72
Van Hout, B.A. 1998. Discounting costs and effects: a reconsideration. Health economics,
7(7):581-594.
Velayati, A.A., Masjedi, M.R., Farnia, P., Tabarsi, P., Ghanavi, J., Ziazarifi, A.H. & Hoffner, S.E.
2009. Emergence of new forms of totally drug-resistant tuberculosis bacilli: super extensively
drug-resistant tuberculosis or totally drug-resistant strains in iran. Chest, 136(2):420-425.
Verma, A., Rattan, A. & Tyagi, J. 1994. Development of a 23S rRNA-based PCR assay for the
detection of mycobacteria. Indian Journal of Biochemistry and Biophysics 31:288 - 294.
Vinkeles Melchers, N.V., van Elsland, S.L., Lange, J.M., Borgdorff, M.W. & van den Hombergh,
J. 2013. State of affairs of tuberculosis in prison facilities: a systematic review of screening
practices and recommendations for best TB control. PLoS One, 8(1):e53644.
Wallgren, A. 1948. The time-table of tuberculosis. Tubercle, 29(11):245-251.
Wallis, R.S., Pai, M., Menzies, D., Doherty, T.M., Walzl, G., Perkins, M.D. & Zumla, A. 2010.
Biomarkers and diagnostics for tuberculosis: progress, needs, and translation into practice. The
Lancet, 375(9729):1920-1937.
Weintraub, W.S. & Cohen, D.J. 2009. The limits of cost-effectiveness analysis. Circulation:
Cardiovascular Quality and Outcomes, 2(1):55-58.
Werner, E.F., Wheeler, S. & Burd, I. 2013. Creating Decision Trees to Assess Cost-Effectiveness
in Clinical Research. Journal of Biometrics & Biostatistics, 2012.
Weyer, K., Carai, S. & Nunn, P. 2011. Viewpoint TB Diagnostics: What Does the World Really
Need? Journal of Infectious Diseases, 204(suppl 4):S1196-S1202.
Wilson, P. & Palriwala, A. 2011. Prizes for global health technologies. URL:
http://healthresearchpolicy.org/assessme ? nts/prizes-global-health-technologies. Date of
access: 15 November 2015
World Health Organization. 2014a. Global tuberculosis report 2014. Geneva Switzerland. URL:
http://apps.who.int/iris/bitstream/10665/137094/1/9789241564809_eng.pdf. Date of
access: 16 August 2015

Chapter 2: Literature review
73
World Health Organization. 2014b. Xpert MTB/RIF Implementation Manual: Technical and
Operational ‘How-To’; Practical Considerations. Geneva: World Health Organization.
URL: http://apps.who.int/iris/bitstream/10665/112469/1/9789241506700_eng.pdf. Date of
access: 7 October 2015
World Health Organization. 2008. Molecular line probe assays for rapid screening of patients at
risk of multidrug-resistant tuberculosis (MDR-TB). Policy statement June. URL:
http://www.who.int/tb/features_archive/policy_statement.pdf. Date of access: 14 May 2014
World Health Organization. 2010. Global tuberculosis control: WHO report 2010: World Health
Organization: Geneva. URL:
http://reliefweb.int/sites/reliefweb.int/files/resources/F530290AD0279399C12577D8003E9D
65-Full_Report.pdf. Date of access: 17 April 2014
World Health Organization. 2011. Global tuberculosis control. WHO Library Cataloguing-in-
Publication Data. URL:
http://apps.who.int/iris/bitstream/10665/44728/1/9789241564380_eng.pdf. Date of access: 25
September 2014.
World Health Organization. 2013. Global tuberculosis report. WHO Report; 2013: WHO Press:
Geneva, Switzerland. URL:
http://apps.who.int/iris/bitstream/10665/91355/1/9789241564656_eng.pdf. Date of access: 27
September 2014
World Health Organization. 2014. Global strategy and targets for tuberculosis prevention, care
and control after 2015. Geneva: World Health Organization.
http://www.who.int/tb/post2015_strategy/en/. Date of access: 16 May 2015.
World Health Organization. 2015a. Chosing interventions that are cost effective [Internet].
Geneva: World Health Organization. URL:
http://www.who.int/tb/post2015_tbstrategy.pdf. Date of access: 17 April 2015
World Health Organization. 2015b. The use of lateral flow urine lipoarabinomannan assay (LF-
LAM) for the diagnosis and screening of active tuberculosis in people living with HIV. Geneva:

Chapter 2: Literature review
74
World Health Organization. URL:
http://apps.who.int/iris/bitstream/10665/193633/1/9789241509633_eng.pdf. Date of access: 10
August 2016.
Worodria, W., Okot-Nwang, M., Yoo S, D. & Aisu, T. 2003. Causes of lower respiratory infection
in HIV-infected Ugandan adults who are sputum AFB smear-negative. The International Journal
of Tuberculosis and Lung Disease, 7(2):117-123.
Xia, H., Song, Y.Y., Zhao, B., Kam, K.M., O'Brien, R.J., Zhang, Z.Y., Sohn, H., Wang, W. &
Zhao, Y.L. 2013. Multicentre evaluation of Ziehl-Neelsen and light-emitting diode fluorescence
microscopy in China. The International Journal of Tuberculosis and Lung Disease, 17(1):107-
112.
Yadav, R.N., Singh, B.K., Sharma, S.K., Sharma, R., Soneja, M., Sreenivas, V., Myneedu, V.P.,
Hanif, M., Kumar, A., Sachdeva, K.S., Paramasivan, C.N., Vollepore, B., Thakur, R., Raizada, N.,
Arora, S.K. & Sinha, S. 2013. Comparative Evaluation of GenoType MTBDRplus Line Probe
Assay with Solid Culture Method in Early Diagnosis of Multidrug Resistant Tuberculosis (MDR-
TB) at a Tertiary Care Centre in India. PLoS ONE, 8(9):e72036.
Yamada-Noda, M., Ohkusu, K., Hata, H., Shah, M.M., Nhung, P.H., Sun, X.S., Hayashi, M. &
Ezaki, T. 2007. Mycobacterium species identification – A new approach via dnaJ gene
sequencing. Systematic and Applied Microbiology, 30(6):453-462.
Zar, H. 2007. Diagnosis of pulmonary tuberculosis in children – what’s new? . South African
Medical Journal, 97:983-985.
Zar, H.J., Connell, T.G. & Nicol, M. 2010. Diagnosis of pulmonary tuberculosis in children: new
advances. Expert Review of Anti-infective Therapy 8(3):277-288.
Zumla, A., Abubakar, I., Raviglione, M., Hoelscher, M., Ditiu, L., McHugh, T.D., Squire, S.B.,
Cox, H., Ford, N., McNerney, R., Marais, B., Grobusch, M., Lawn, S.D., Migliori, G.B., Mwaba,
P., O'Grady, J., Pletschette, M., Ramsay, A., Chakaya, J., Schito, M., Swaminathan, S., Memish,
Z., Maeurer, M. & Atun, R. 2012. Drug-resistant tuberculosis--current dilemmas, unanswered

Chapter 2: Literature review
75
questions, challenges, and priority needs. The Journal of Infectious Diseases, 205 Suppl 2:S228-
240.
Zuñiga, J., Torres-García, D., Santos-Mendoza, T., Rodriguez-Reyna, T.S., Granados, J. & Yunis,
E.J. 2012. Cellular and Humoral Mechanisms Involved in the Control of Tuberculosis. Clinical
and Developmental Immunology, 2012:18.

76
This chapter covers results from an independent preliminary evaluation of the NWU-TB system
that was conducted by the Centre for Tuberculosis at the National Institute for Communicable
Diseases (NICD), which is a division of the National Health Laboratory Service (NHLS) of South
Africa. The aim of this pilot study was for the system to be assessed by independent experts and
use their recommendations to make improvements on system design and performance. The chapter
is written in the form of a commentary. A report of the study that was produced by the NICD can
be found in “Annexure A”.

Chapter 3: Commentary on independent clinical evaluation of NWU-TB test
77
Commentary: A preliminary independent evaluation of the NWU-TB system
Isaac Mutingwendea#, Urban Vermeulena, Hendrik Viljoena, b, Anne Groblera#
a DST/NWU Preclinical Drug Development Platform, Faculty of Health Sciences, North-West
University, Potchefstroom, South Africa, b Department of Chemical & Biomolecular Engineering, University of Nebraska–Lincoln, USA
#Address correspondence to Isaac Mutingwende, [email protected];
Anne Grobler, [email protected]

Chapter 3: Commentary on independent clinical evaluation of NWU-TB test
78
Abstract
An independent evaluation of the NWU-TB system was carried out at the National Institute for
Communicable Diseases in South Africa in order to assess the sensitivity and specificity of the
assay in clinical sputum samples. One hundred and nine (109) sputum samples were used in this
pilot study, and the sensitivity and specificity of NWU-TB was 67% and 88% respectively, relative
to MGIT culture as gold standard. There were some weaknesses in the study design that made it
difficult to validate the results; these include small sample size and the use of lysed frozen samples
for PCR. This is a deviation from the standard workflow of the system where PCR is carried out
immediately after lysis using the fresh lysates. However, some recommendations from the study
were incorporated during further development of the system.
Text
During the early stages of development of the NWU-TB system, the funders of the project
requested an independent preliminary evaluation of the performance of the initial prototype. The
results of the evaluation were used to guide downstream developmental efforts. This evaluation
was conducted by the Centre for Tuberculosis at the National Institute for Communicable Diseases
(NICD), a division of the National Health Laboratory Service (NHLS) of South Africa. The NICD
is a national public health institution with a number of centres focusing on surveillance, reference
and research on specific diseases such as meningitis, HIV/AIDS, tuberculosis and malaria. The
study was conducted between February and March 2014 at the Centre for Tuberculosis which is
located in Pretoria, South Africa.
NWU-TB is a system that allows rapid diagnosis of Mycobacterium tuberculosis (MTB), giving a
result in less than 2 hours. The method relies on rapid (within 10 minutes) cell lysis through
mechanical, thermal and chemical means in one reaction (Grobler et al., 2012); followed by
amplification of specific target sequences unique to MTB using PCR (within 20 minutes). The
PCR products are then visualized using agarose gel electrophoresis (within 15 minutes)
(Mutingwende et al., 2015).
The proposed study design for the independent evaluation included one hundred and fifty (150)
smear-positive and one hundred (100) smear-negative sputum samples that were to be tested using
sputum smear microscopy (SSM), MGIT culture, Xpert MTB/Rif and NWU-TB. Since the NICD
is a national reference laboratory, they receive samples from all the provinces of South Africa and
thus it can be assumed that the samples are representative of all the MTB strains occurring in the

Chapter 3: Commentary on independent clinical evaluation of NWU-TB test
79
country. However, only 109 samples were later used in the evaluation due to limited availability
of samples during that time. Furthermore, the sample volumes were too small to allow testing with
all the 4 tests (MGIT culture, Xpert MTB/Rif, SSM, and NWU-TB), and as a result the comparison
with the Xpert MTB/Rif assay, which was the real purpose of the study, was not done in the
evaluation. MGIT culture was used as the “gold standard” in the evaluation. The 109 sputum
samples were therefore all tested using MGIT culture, SSM and NWU-TB.
To eliminate bias, the results of MGIT culture and SSM were kept blind to the scientist performing
the index test and results were to be separately passed to a consulting biostatistician for analysis.
To determine reproducibility and margin of operator error, two NICD scientists were to perform
the index test separately on the same sputum samples. However, due to the changes in the study
design (i.e. sample size and exclusion of Xpert MTB/Rif) a biostatistician was not involved in the
data analysis; the analysis was done by scientists at the NICD. Furthermore, only one scientist
carried out the tests using the NWU-TB, thus reproducibility of the assay could not be determined.
In light of these weaknesses in the study design, the validity of some of the study outcomes could
not be properly ascertained. For example, although SSM is reported to have a high specificity
(Desikan, 2013), a 100% specificity was not expected considering the high prevalence of non-
tuberculosis mycobacteria (NTMs) in South Africa due to HIV co-infection (Corbett et al., 1999;
Sookan & Coovadia, 2014).
In spite of the mentioned shortcomings on the study design, the results could not be ignored
without further investigation. The NICD made two valid recommendations: the need to carry out
independent assessments of the sample processing step, and migration to a real time PCR platform.
It was noted that the 109 patient samples used in the study were lysed using the NWU-TB
processing procedure and frozen at -20 oC for 48 hours due to problems with the primer set used
in the PCR MasterMix (as highlighted in Annexure A). A fresh batch of primers was ordered and
reconstituted for the study and quality control tests on the new batch were performed; this was
assumed to be the source of the amplification problems. Therefore a previously used batch of the
primer set was eventually used in the study. The use of previously lysed and frozen samples for
PCR amplification was a deviation from the standard NWU-TB protocol where samples are lysed
and amplified by PCR immediately. Later studies (data not shown) revealed that use of lysed and
frozen samples reduces the sensitivity of NWU-TB, as some samples that tested positive when
immediately amplified would test negative when amplified after storage. This is possibly due to
the presence of polysaccharides that partition with the aqueous soluble DNA (Belisle &

Chapter 3: Commentary on independent clinical evaluation of NWU-TB test
80
Sonnenberg, 1998) and therefore interfere with PCR reactions (Olson & Morrow, 2012). Since the
NWU-TB sample processing procedure uses lysed samples that are not processed to remove
contaminants, storage of samples after lysis can promote the interaction of mycobacterial
polysaccharides and DNA, leading to lower sensitivity when lysed and frozen samples are used in
the PCR reaction.
Despite these problems inherent in the study design of the independent evaluation, the study
highlighted some key weaknesses of the NWU-TB system that needed to be addressed. These
include the lack of an internal amplification control and the need to run agarose gels after
amplification. It is inconceivable for healthcare personnel at primary healthcare centres to run
agarose gels on daily basis. The system was therefore subsequently modified to take into account
these important recommendations.
References
Belisle, J.T. & Sonnenberg, M.G. 1998. Isolation of genomic DNA from mycobacteria.
Mycobacteria Protocols:31-44.
Corbett, E.L., Blumberg, L., Churchyard, G.J., Moloi, N., Mallory, K., Clayton, T.I.M., Williams,
B.G., Chaisson, R.E., Hayes, R.J. & De Cock, K.M. 1999. Nontuberculous Mycobacteria.
American Journal of Respiratory and Critical Care Medicine, 160(1):15-21.
Desikan, P. 2013. Sputum smear microscopy in tuberculosis: Is it still relevant? The Indian
Journal of Medical Research, 137(3):442-444.
Grobler, A., Levanets, O., Whitney, S., Booth, C. & Viljoen, H. 2012. Rapid cell lysis and DNA
capture in a lysis microreactor. Chemical Engineering Science, 81(0):311-318.
Mutingwende, I., Vermeulen, U., Steyn, F., Viljoen, H. & Grobler, A. 2015. Development and
evaluation of a rapid multiplex-PCR based system for Mycobacterium tuberculosis diagnosis using
sputum samples. Journal of Microbiological Methods, 116(0):37-43.
Olson, N.D. & Morrow, J.B. 2012. DNA extract characterization process for microbial detection
methods development and validation. BMC Research Notes, 5:668-668.

Chapter 3: Commentary on independent clinical evaluation of NWU-TB test
81
Sookan, L. & Coovadia, Y.M. 2014. A laboratory-based study to identify and speciate non-
tuberculous mycobacteria isolated from specimens submitted to a central tuberculosis laboratory
from throughout KwaZulu-Natal Province, South Africa. South African Medical Journal,
104(11):766-768.

82
This chapter consists of a full length article that has been accepted and published in the Journal of
Microbiological Methods. The author guidelines followed in submitting to the Journal can be
found in “Annexure B” and the manuscript is presented in this thesis as it appears online
(http://www.sciencedirect.com/science/article/pii/S0167701215001852). The chapter addresses
the first and second objectives of the study as outlined in Chapter 1.

Chapter 4: Multiplex-PCR based system for tuberculosis diagnosis
83

Chapter 4: Multiplex-PCR based system for tuberculosis diagnosis
84

Chapter 4: Multiplex-PCR based system for tuberculosis diagnosis
85

Chapter 4: Multiplex-PCR based system for tuberculosis diagnosis
86

Chapter 4: Multiplex-PCR based system for tuberculosis diagnosis
87

Chapter 4: Multiplex-PCR based system for tuberculosis diagnosis
88

Chapter 4: Multiplex-PCR based system for tuberculosis diagnosis
89

90
This chapter consists of a full length article that has been submitted to the Journal of Clinical
Microbiology. The author guidelines for submitting to the Journal can be found in “Annexure D”,
and these guidelines were followed in writing the manuscript. Two exceptions are made in
following the guidelines: first, for easy reading figures, schemes and tables are inserted at their
logical places as they would appear in the printed version and second, 1.5 line spacing was used
to ensure consistency with the rest of the thesis. This chapter is connected to objective 1 covered
in chapter 3 as it is an improvement of the NWU-TB system and also deals with the third objective
of the study. The third objective aimed to develop a feasible strategy that can enable the NWU-
TB system (and consequently other NAATs) to be used for tuberculosis treatment outcomes
monitoring. The improved system discussed in this chapter uses a real-time PCR platform and a
strategy to distinguish between live and dead mycobacteria. The ability to distinguish between live
and dead mycobacteria will allow the use of a PCR based assay to monitor a patient’s response to
therapy, which is not currently possible in clinical practice with any of the commercial PCR based
MTB assays. Though a full prospective longitudinal study could not be conducted in order to
evaluate the utility of the strategy for treatment outcomes monitoring, results presented in this
chapter demonstrate that with further optimization the NWU-TB assay can potentially be used for
treatment monitoring.

Chapter 5: Detection of M. tuberculosis by an improved NWU-TB diagnostic test
91
Proof of submission: Journal of Clinical Microbiology
to me, [email protected]
Dear Mr. Mutingwende,
On February 19, 2016, we received the manuscript "Detection of Mycobacterium tuberculosis by
an improved NWU-TB system potentially capable to differentiate between live and dead
mycobacteria" by Isaac Mutingwende, Urban Vermeulen, Faans Steyn, Hendrik Viljoen, and Anne
Grobler. The submission form indicates that this paper should be processed as a (n) Full-Length
Text intended for publication in the section Mycobacteriology and Aerobic Actinomycetes.
The manuscript has been assigned the control number JCM00377-16. Take note of this number,
and refer to it in any correspondence with the Journals Department or with the editor.
You can check the status of this manuscript by clicking on the link below and selecting Check
Status:
http://jcm.msubmit.net/cgibin/main.plex?el=A3GN2tAy5A2CkiG2F3A9ftd5G0cYXH2ilEIDnX
4rfksWgZ
Thank you for submitting your work to Journal of Clinical Microbiology.
Regards,
JCM staff

Chapter 5: Detection of M. tuberculosis by an improved NWU-TB diagnostic test
92
Detection of Mycobacterium tuberculosis by an improved NWU-TB system potentially
capable to discriminate between live and dead mycobacteria
Isaac Mutingwendea#, Urban Vermeulena, Faans Steynb, Hendrik Viljoena, c, Anne Groblera#
a DST/NWU Preclinical Drug Development Platform, Faculty of Health Sciences, North-West
University, Potchefstroom, South Africa, b Statistical Consultation Service, North-West University, Potchefstroom, South Africa, C Department of Chemical & Biomolecular Engineering, University of Nebraska–Lincoln, USA
#Address correspondence to Isaac Mutingwende, [email protected] ;
Anne Grobler, [email protected]
Running title: Detection of M. tuberculosis by an improved NWU-TB
Key words: Tuberculosis; diagnosis; NWU-TB system; propidium monoazide; live/dead
discrimination; sputum

Chapter 5: Detection of M. tuberculosis by an improved NWU-TB diagnostic test
93
Abstract (249 words)
Delays in tuberculosis diagnosis and initiation of appropriate treatment limit the success of global
efforts to eradicate the disease. Inability of current molecular assays to discriminate between live
and dead mycobacteria limit their deployment in endemic settings. In this study, the performance
of the NWU-TB system under development was evaluated, in comparison to smear microscopy,
Xpert MTB/Rif and MGIT culture. The effectiveness of propidium monoazide (PMA) to
distinguish between live and dead mycobacteria was also evaluated. 176 randomly selected stored
sputum samples were used to evaluate the NWU-TB system. Next, a random subset of 50 samples
selected from the 176 samples was used for live/dead discrimination evaluation using PMA. The
∆CT (CT PMA-treated – CT PMA-untreated) was calculated and samples were stratified by TB treatment
status for analysis. Using MGIT culture as the gold standard, the sensitivities % (95% CI) of smear,
Xpert MTB/Rif, and NWU-TB were 64.3 (55.4-72.6), 84 (76.2-90.1), and 94.6 (89.1-97.8)
respectively, while the specificities % (95% CI) were 62.1 (42.3-79.3), 100 (88.1-100) and 86.2
(68.3-96.1) respectively. There was no statistically significant difference (p= 0.277) between the
∆CTs of treatment naive and on treatment groups. NWU-TB and Xpert MTB/Rif have similar
overall diagnostic accuracies for detection of pulmonary TB. The potential of PMA to discriminate
between live and dead mycobacteria has been demonstrated in clinical samples. This finding is
important for TB endemic settings where it is critical for molecular tests to identify true reinfection
cases in addition to being applicable to treatment outcomes monitoring.

Chapter 5: Detection of M. tuberculosis by an improved NWU-TB diagnostic test
94
1.0 Introduction
Despite being an ancient disease, Mycobacterium tuberculosis (MTB) is still one of the major
infectious diseases in the 21st century. In 2013 alone, an estimated 9.0 million people developed
TB and 1.5 million succumbed to the disease; 360,000 of whom were HIV-positive (WHO, 2014).
Pulmonary TB is the most common form of the disease. South Africa has the highest TB incidence
in the world, estimated to be 652/100,000 population in 2013. Prompt diagnosis and treatment are
crucial to reduce the prevalence and incidence of the disease. Treatment initiation delay has been
shown to vary from 30 to 90 days from onset of symptoms mainly due to diagnostic delay (1, 2).
Modelling studies indicate that a sensitive, same-day and accessible TB diagnostic could reduce
mortality by 20-35% as result of early treatment initiation (3). Rapid, accurate, affordable, and
accessible TB diagnostics that allow same day diagnosis and treatment initiation are urgently
needed if the TB fight is to be won in resource constrained settings.
Sputum smear microscopy (SSM) is the first and often the only TB diagnostic test used in resource
limited settings and requires at least 2 specimens to be submitted on different days; it has a low
and variable sensitivity, is tedious, and requires skilled microscopists (4). Mycobacteria Culture,
the current global gold standard is highly sensitive and specific, but suffer from such problems as
long turnaround time, need for expensive equipment, and it is prone to cross contamination
especially in high prevalence settings (5-7). Both tests are thus associated with treatment initiation
delays. Nucleic acid amplifications tests (NAATs) provide a viable option for a point-of-care TB
(POC-TB) diagnostic. A number of in-house and commercial NAATs have been developed to
identify MTB in clinical specimens rapidly and directly (8-15). Meta-analysis studies have
reported sensitivity and specificity of in-house PCR assays to be 9.4%–100% and 5.6%–100
respectively (15) and of commercial assays to be 36–100% and 54–100% (9) respectively.
In general, improvement in accuracy is necessary if NAATs are to become more clinically relevant
and beneficial to patients in low resource settings and areas with a high HIV prevalence. HIV
infection reduces the bacillary load in sputum and consequently reduces sensitivity of molecular
tests in HIV-infected individuals compared to HIV-uninfected individuals (16, 17). Therefore,
new or improved NAATs should close this sensitivity gap compared to culture in individuals with
paucibacillary disease. The inability of NAATs to discriminate between live and dead
mycobacteria also contributes to their poor specificity when compared to culture. For example, a
large proportion of patients presumed to have been successfully treated remain Xpert MTB/Rif -
positive for up to 5 years (18). Detection of reinfection cases in endemic settings is another

Chapter 5: Detection of M. tuberculosis by an improved NWU-TB diagnostic test
95
challenge associated with all current molecular assays. In a study assessing the performance of
Xpert MTB/Rif for monitoring treatment response, the proportion of positive Xpert MTB/Rif
results was twice that of positive liquid cultures (84% vs. 42%) after 8 weeks of treatment and at
the end of the 26 week monitoring period, 27% of samples were Xpert MTB/Rif positive compared
to only 4% with MGIT culture (19). Therefore, new molecular assays should ideally also be
suitable for diagnosing previously treated patients and treatment outcomes monitoring. Improving
current molecular assays such as Xpert MTB/Rif is a viable option but the development of new
systems also remains an attractive alternative. Current efforts with the Xpert MTB/RIF Ultra
(Ultra) assay, which uses a new sample processing cartridge that doubles the amount of purified
DNA delivered to the PCR reaction, are commendable as the new assay will have better a
sensitivity than the original Xpert MTB/Rif assay (20, 21), but it still cannot distinguish between
live and dead mycobacteria.
Pretreatment of clinical samples with a DNA-intercalating agent, propidium monoazide (PMA)
prior to DNA isolation and amplification has been investigated as a possibility (22). The PMA dye
can penetrate dead cells and covalently form a PCR-unamplifiable DNA complex upon light
activation (22). However, PMA cannot penetrate live cells, and thus the DNA from live cells is
PCR-amplifiable. After PMA processing, downstream processes remain unaltered, enabling
coupling with any molecular assay. Current evidence on the effectiveness of the PMA approach
in clinical specimens is limited (23, 24), therefore more evaluations are needed.
The aim of this study was to (i) evaluate the performance of an improved rapid molecular assay
known as the NWU-TB (25) for detection of M. tuberculosis complex in clinical sputum samples
and (ii) to evaluate whether PMA can be used in conjunction with the NWU-TB system for the
selective amplification and detection of DNA from viable mycobacteria in patient sputum samples.
2.0 Methods
2.1 Study Design
From January 2013 to December 2014, a total 548 sputum samples were collected from
tuberculosis presumptive miners visiting the Orkney West-Vaal hospital. The hospital is owned
and privately operated by AngloGold Ashanti to cater for the healthcare needs of its miners. Upon
submission of a fresh same day sputum sample, an aliquot was used to perform SSM, MGIT
culture and Xpert MTB/Rif. The remainder of these fresh un-decontaminated samples was frozen
at -20oC and stored at the hospital for an average of 2 weeks. The frozen samples were transferred

Chapter 5: Detection of M. tuberculosis by an improved NWU-TB diagnostic test
96
under appropriate conditions to the North-West University from Orkney-Westvaal hospital (a 52
km distance) and stored at -20 oC until used in evaluating the NWU-TB system. Samples were
stored at North-West University for time periods ranging from 2 weeks to 1 year before testing.
Qualified laboratory scientists stationed at Orkney-Westvaal hospital performed the three
reference tests (SSM, Xpert MTB/Rif, MGIT culture) as part of their routine work. MTB results
for these 3 reference tests were kept blind to the North-West University (NWU) research team up
until the data analysis stage. In this study, 176 stored random nonduplicated clinical sputum
samples were used to evaluate the NWU-TB system at the North-West University and then results
from the 3 reference tests for the tested samples were requested from the hospital for statistical
analysis.
2.2 SSM, MGIT Culture and Xpert MTB/Rif
SSM and MGIT culture were performed by experienced and independent laboratory scientists
working at Orkney-Westvaal hospital following appropriate standard protocols and
manufacturers’ instructions (26, 27). Briefly, equal volumes of sputum and N-acetyl-L-cysteine –
sodium hydroxide solution were mixed. After 20 minutes, the mixture was neutralized with
phosphate buffered saline and centrifuged. The sediment obtained was resuspended in 1 ml sterile
phosphate buffer and used for smear preparation and inoculation in culture. Sputum smear grading
of Ziehl-Neelsen stained smears was performed in accordance with the WHO criteria (26). For
MGIT culture, MGIT tubes (Becton Dickinson, Franklin Lakes, NJ, USA) inoculated with 0.5ml
of decontaminated sample were incubated at 37°C. Samples were considered negative when no
growth was automatically detected by the MGIT instrument after 42 days. Mycobacterial species
in positive cultures were identified using AccuProbe molecular probes (GenProbe, San Diego, CA,
USA).
Xpert MTB/Rif was performed as per manufacturer’s instructions (Cepheid, Sunnyvale, CA,
USA). Briefly, 1 ml of sputum sample was mixed with 2 ml of Xpert sample reagent, vortexed for
at least 10 seconds, and incubated at room temperature for 10 minutes, followed by another round
of vortexing for 10 seconds and room temperature incubation for 5 minutes. A total of 2 ml of the
mixture was transferred into the Xpert cartridge and loaded into the Xpert MTB/Rif instrument.
The automatic detection and reporting procedure was then run and results automatically reported.

Chapter 5: Detection of M. tuberculosis by an improved NWU-TB diagnostic test
97
2.3 NWU-TB system
2.3.1 Sample preparation
Previously frozen sputum samples were thawed overnight at 4oC. A 250µl sputum aliquot was
mixed with an equal volume of a lysis buffer followed by lysis on a lyser device for 7 minutes as
previously described (25, 28). Initial experiments using 5µl of lysate without a DNA concentration
step, using a real time instrument (as achieved with the endpoint PCR based system) (25) did not
achieve optimal amplification even after intensive qPCR optimization with the aid of the Taguchi
method (29). To address the challenge, MTB DNA was extracted and purified using a ZR Viral
DNA/RNA Kit (Zymo Research, Irvine, CA), with modifications to concentrate DNA. To 500µL
of the lysate, 400µL of genomic lysis buffer and 165µL isopropanol were added, and the mixture
was then vortexed for 4-6s before incubation for 10 minutes at room temperature. The mixture was
transferred into a Zymo-spin column and centrifuged at 10 000g for 80s. The collection tube was
discarded, followed sequentially by addition of
(i) 200µL DNA pre-wash buffer and centrifugation for 60s at 10 000g;
(ii) 500µL of g-DNA wash buffer followed by 60s centrifugation at 10 000g;
(iii) 60µL of elution buffer pre-equilibrated at 65oC was followed by centrifugation for 45s at 10
000g.
The eluted DNA was stored at -20oC until used in subsequent qPCR experiments. Five (5)
microliters of each DNA sample was used as a template for amplification in real-time PCR. The
Zymo kit was selected due to its quick (15 minutes) DNA recovery step after the lysis step, thus
enabling the sample processing step to be carried out in less than 30 minutes.
2.3.2 Design and synthesis of primer and fluorogenic probe.
The IS6110 insertion sequence (Accession number: AJ242908), which is unique to the MTBC
members [23, 24] was the target for PCR amplification. The primer and scorpion probe were
designed using Beacon Designer software (Version 8.13, Premier Biosoft International). The
sequence of the primer is: CGGCGGCTGGGCTCCC and of the scorpion probe:
[FAM]-GGTCACCGGTTGATGTGGTCGTAGTAGGTCGCGGTGACC-[BHQ1]-[HEG]-
CGAGCTGGGTGTGCCGATC. The primer and scorpion probe were both synthesized by Sigma
Aldrich (reference number: 8203265032).
2.3.3 Real-time PCR
The amplification reaction mixture contained 5 μl of template in a final volume of 20μl: 10µl
KAPA Probe Fast qPCR Hotstart Mastermix 2x (Kapa Biosystems/Roche, Cape Town, South

Chapter 5: Detection of M. tuberculosis by an improved NWU-TB diagnostic test
98
Africa), 0.1μl (100nM final concentration) primer, 0.25μl (250nM final concentration) scorpion
probe, and 4.65μl molecular grade water. PCR was carried out using a Bio-Rad CFX 96 (Biorad
CFX Manager 3.1 software) with the following cycling protocol: initial denaturation at 95oC for 2
minutes, followed by 40 cycles of 95oC for 10s, 63oC for 15s, 72oC for 10s. All runs included a
no-template control and a positive control. All samples were tested in triplicate. A result was
considered negative when no amplification occurred or when the CT value was ˃37 cycles. The
results were considered positive when CT values were ˂37 cycles for all three samples.
2.4 Live/dead discrimination
The next objective was to test the effectiveness of propidium monoazide (PMA) in
distinguishing between live and dead mycobacteria in clinical sputum samples from TB treatment
naive patients and patients at various stages of standard TB therapy. Of the 176 samples used to
evaluate the performance of NWU-TB as described in the sections above, 50 sputum samples were
randomly selected and used in the live/dead discrimination evaluation. Each of the 50 samples was
split into 2 aliquots. The first aliquot was handled as per the standard NWU-TB protocol described
above. The second aliquot was first treated with PMA according to the optimal conditions
described elsewhere (23, 30, 31). Briefly, PMA (Biotium, Inc., Hayward, CA, USA) was dissolved
in 20% of dimethylsulfoxide (DMSO) (Sigma) and aliquoted before storage in the dark at -20oC.
PMA was added to 500µL of sample (buffer + sputum) to a final concentration of 100 µM and
incubated in the dark for 10 minutes with occasional flipping to allow diffusion of the intercalating
dyes into dead cells. Light exposure was performed for 5 minutes using a 650 watt halogen light
source (GE, South Africa) placed at a distance of 20 centimeters from the samples. The samples
were kept on ice in horizontal orientation to avoid excessive heating. The samples were then
subjected to the same procedure described above for the NWU-TB system, from lysis to qPCR.
2.5 Ethics
This study was approved by the North-West University Research Ethics Committee under ethics
number: NWU-00005-11-A5.
2.6 Statistical Analysis
Statistical analyses were performed using STATA 11 (StataCorp, College Station, TX, USA). A
p-value of less than 0.05 was considered statistically significant. Sensitivity and specificity,
positive predictive value (PPV), negative predictive value (NPV), and area under the curve (AUC)
for smear microscopy, Xpert MTB/RIF, and NWU-TB were calculated using MGIT culture as

Chapter 5: Detection of M. tuberculosis by an improved NWU-TB diagnostic test
99
reference. The ∆CT, i.e. is the difference between the CT values of PMA-treated aliquot and the CT
value of the PMA-untreated aliquot was calculated for each sample. A CT value ˃ 37 was adjusted
to 37 for ∆CT calculations.
3.0 Results
3.1 Study population
Of the 176 samples tested, 158 patient sputum samples were included in the analysis to evaluate
the NWU-TB system in comparison to SSM and Xpert MTB/Rif against MGIT culture as the gold
standard. The other 18 samples had missing data from one of the 3 references tests and thus were
not included in the analysis. The population predominantly consisted of 96.13% male patients that
originated from a mining community. The mean age of patients was 44.49 years as shown in Table
1. Next, a subgroup of 50 randomly selected samples from the 176 samples was used to evaluate
the effectiveness of the use of PMA for live/dead mycobacteria discrimination. The population
characteristics of this subgroup are provided in Table 1 alongside those of the overall group.
3.2 Correlation of NWU-TB CT values and smear grades
To determine the correlation between quantification of bacterial load by SSM and NWU-TB
categorization, the CT values were stratified according to smear grade using the World Health
Organization grading system (26). The smear grading was performed by experienced laboratory
staff at Orkney-Westvaal hospital. The correlation results between the smear grades and CT values
from the NWU-TB system are presented in Figure 1. A strong negative correlation between CT
values and smear grades was found (Spearman rank correlation −0.71, p<0.001).
Table 1: Study population characteristics
NWU-TB evaluation group PMA evaluation group Age [% (95% CI)] 44.49 (43.01-45.97)
Sex: Male n (%) Female n (% )
149 (96.13%)
6 (3.87%)
47 (95.91%) 2 (4.08%)
HIV status where known: Positive n (%) Negative n (%)
82 (78.85%) 22 (21.15%)
28 (80.0%) 7 (20.0%)
Current TB treatment: Yes n (%) No n (%)
99 (63.87%) 56 (36.13%)
19 (38.78%) 30 (61.22%)

Chapter 5: Detection of M. tuberculosis by an improved NWU-TB diagnostic test
100
Figure 1: Correlation between NWU-TB CT values and bacteriology results. Boxes represent the
25th, 50th (median) and 75th quartiles with whiskers extending to the greatest and smallest values.
SSM grading was done according to prescriptions of the World Health Organization (26).
3.3 Comparison of NWU-TB system and MGIT culture
NWU-TB had a higher sensitivity at 94.6% [95% CI: 89.1%; 97.8%) compared to Xpert MTB/Rif
84% (p=0.0025) and SSM 64.3% (p<0.001) as given in Table 2. However, Xpert MTB/Rif had a
specificity of 100% [95% CI: 88.1%-100%), which was significantly higher than NWU-TB at
86.2% (p<0.001) and SSM at 62.1% (p<0.001). Overall, there was a strong correlation between
Xpert MTB/Rif and NWU-TB (Mc Nemar’s chisquare =11.64, p value = 0.0006).
Table 2: Performance of SSM, Xpert MTB/Rif and NWU-TB against MGIT culture as gold
standard
SSM Xpert MTB/Rif NWU-TB
Sensitivity% (95% CI) 64.3 (55.4-72.6) 84 (76.2-90.1) 94.6 (89.1-97.8)
Specificty% (95% CI) 62.1 (42.3-79.3) 100 (88.1-100) 86.2 (68.3-96.1)
PPV% (95%CI) 88.3 (80-94) 100 (96.4-100) 96.8 (92.1-99.1)
NPV% (95% CI) 28.1 (17.6-40.8) 60.4 (45.3-74.2) 78.1 (60-90.7)
*AUC 0.6255 0.9202 0.9016
*AUC – Area under the curve
Spearman's rho = - 0.7109
p < 0.001
20
25
30
35
40
Ct
negative scanty 1+ 2+ 3+

Chapter 5: Detection of M. tuberculosis by an improved NWU-TB diagnostic test
101
Overall Diagnostic accuracy of NWU-TB in comparison to Xpert MTB/Rif and SSM using
ROC curves
Receiver operator characteristic (ROC) analysis indicated that the area under the curve for SSM,
GeneXpert and NWU-TB was 0.6255, 0.9202 and 0.9016 respectively. An assay with an area
under the curve (AUC) greater than 0.9 is considered to have excellent performance, based on the
ROC analysis both GeneXpert and NWU-TB showed excellent performance.
Figure 2: Receiver operator characteristic curves for NWU-TB, SSM and GeneXpert compared to
MGIT culture as gold standard.
3.4 PMA treatment
The number of samples divided into 5 different smear grades (Negative, Scanty, 1+, 2+, and 3+)
and the corresponding cultures results are given in Table 3. Of the 50 samples used in the sub-
study most of the samples was classified as smear negative.
Table 3: Smear and culture results of 50 clinical sputum samples used in PMA testing
*Smear grades categorized according to the World Health Organization guidelines for AFB smear
positivity (26). Abbreviations: AFB, acid-fast bacilli; PMA, propidium monoazide.
0.0
01
.00
Se
nsitiv
ity
0.00 1.001-Specificity
SSM: AUC-0.6255 GeneXpert: AUC-0.9202
NWU-qTB: AUC-0.9016 Reference
AFB grade*
Culture Positive Negative
Missing
Total
Negative 13 4 1 18 Scanty 9 3 12 1+ 7 1 8 2+ 5 0 5 3+ 7 0 7 Total 50

Chapter 5: Detection of M. tuberculosis by an improved NWU-TB diagnostic test
102
All culture negative samples except one were undetectable by both and Xpert MTB/Rif and NWU-
TB. The discrepant sample (Sample 12 in Table 4) tested positive with both Xpert MTB/Rif and
NWU-TB without PMA treatment; however, when the sample was treated with PMA, followed
by NWU-TB it tested negative giving a very large ∆CT. In contrast, 8 culture positive samples
tested positive on the NWU-TB system without PMA treatment, however after PMA treatment
they tested negative. The CT values without PMA treatment in these samples were above 30 cycles.
In 3 patients who had NTM infection (M. chelonei and M. Kansasii), all the tests (Xpert MTB/Rif,
NWU-TB and MGIT culture) reported negative results except SSM.
Table 4: Discrepant results from the four tests including PMA-treated results from NWU-TB
*Sample SSM Culture Xpert MTB/Rif
NWU-TB PMA-untreated
CT NWU-TB PMA-untreated
∆CT
1 Negative Positive MTB-low Positive 34.93 2.07 2 Negative Positive Negative Positive 35.55 1.45 3 Negative Positive MTB-Very
low Positive 36.73 0.27
4 Negative Positive Negative Negative 37 0 5 Negative Positive Not done Positive 34.99 2.01 6
Negative Positive Not done Positive 35.78 1.22
7 Negative Positive Negative Positive 36.13 0.87 8 Scanty 8 Positive Negative Positive 35.85 1.15 9 Scanty 5 Negative MTB-Very
low Positive 27.71 9.29
10 Scanty 7 Positive MTB-Very Low
Positive 30.57 6.43
11 1+ M. chelonei Negative Negative 37 0 12 Scanty 4 M. kansasii Negative Negative 37 0 13 Scanty 4 M. kansasii Negative Negative 37 0
Note: All CT values for samples shown in this table were ˃37 after PMA-treatment, which means
they all tested negative for live mycobacteria. ∆CT = CT PMA-treated – CT PMA-Untreated. The shaded
cells indicated those samples where the results of Culture, Xpert MBT/Rif and NWU-TB differed.
* Re-coded numbering; Not the actual patient identification codes used in the study
PMA treatment did not yield statistically significant differences when data was stratified according
to TB treatment status as shown in Figure 3. The nonparametric median equality test of the ∆CT
values of the treatment naive and treatment groups was 0.277. There were however observable
differences with CT values of PMA-treated samples higher than those of PMA-untreated samples
in most of the cases. Since the sample size was too small to stratify the patient samples according

Chapter 5: Detection of M. tuberculosis by an improved NWU-TB diagnostic test
103
to TB treatment stage, sufficiently powered statistical analyses could not be performed to highlight
the differences observed.
Figure 3: Comparison between the mean difference in threshold cycle (∆Ct) (propidium
monoazide (PMA) treated minus PMA untreated) obtained from sputum samples collected from
patients either receiving anti-tuberculosis therapy (treatment group) or not receiving treatment
(treatment naive).
4.0 Discussion
Early detection of MTB and initiation of appropriate anti-tuberculosis therapy are critical steps in
ensuring both better disease prognosis in patients and epidemic control efforts. Currently, SSM
and culture are the most relied upon tests for the initial diagnosis and treatment response
monitoring in most high burdened countries. Though relatively sensitive for both initial diagnosis
and treatment monitoring, culture is largely handicapped by its long turnaround time. SSM can
produce results within a day but it cannot determine the viability of mycobacteria. Recently,
considerable focus has been placed on PCR-based assays due to their short turnaround times and
good accuracy (9, 32-35). However, like SSM no current commercial PCR-based assay can
distinguish between live and dead mycobacteria thereby making the assays unreliable, especially
in high endemic areas where reinfections cases are common. In this study, the performance of a
new qPCR based NWU-TB system in clinical sputum samples was evaluated, and then the
effectiveness of using PMA to distinguish between live and dead mycobacteria in sputum from
patients on either standard anti-tuberculosis therapy or treatment naive was also explored.
Nonparametric median equality test: P = 0.277
-2
0
2
4
6
8
10
De
lta C
t
treatment naive treatmentTreatment status

Chapter 5: Detection of M. tuberculosis by an improved NWU-TB diagnostic test
104
NWU-TB showed better sensitivity than both SSM and Xpert MTB/Rif. The sensitivity values for
Xpert MTB/Rif and SSM are comparable to those reported in literature (4, 36), thus results from
this study can be trusted but still some caution must be exercised when drawing conclusions. By
extrapolation, this means that the sensitivity of NWU-TB is comparable to other commercial
molecular systems and warrant is its further development.
On the other hand, the specificity of NWU-TB was significantly lower than that of Xpert MTB/Rif
but comparable to that of other molecular assays reported elsewhere (37, 38). The lower specificity
of NWU-TB may have been due to MTB-NTM coinfection though this was not investigated nor
confirmed in this study. The high prevalence of NTMs in the cohort used as previously reported
(25) strongly supports the MTB/NTM coinfection argument. Although speciation was done, the
presence of a mixture of MTB and NTM in a patient sample may interfere with the performance
of a molecular test depending on the relative concentrations of the MTB and NTM in that sample
thereby reducing specificity (39).
Study results may be influenced by the reference standard used to compare test results. Although
culture is the universally accepted gold standard, it is not 100% sensitive and can give false-
negative results (40), thus presenting obstacles for evaluating new diagnostics especially in cohorts
with a high HIV prevalence rate. However, in this study the effect of an imperfect reference
standard on the reported accuracies of the tests is assumed to be minimal due to the experience of
the technicians performing the tests at the hospital. The area under the curve (AUC) for both Xpert
MTB/Rif and NWU-TB was above 0.9 indicating that they are both excellent tests according to a
widely accepted guideline (41), while the AUC for SSM was 0.6255, confirming it’s widely
reported lower accuracy.
The NWU-TB results reported in this paper demonstrate that current efforts to improve the
system’s sputum sample processing method as well as its usability in peripheral-level clinics on a
real-time PCR platform have not reduced the accuracy of the system as the results are comparable
to those previously reported (25). Strong correlation (rho = -0.7109) between NWU-TB CT values
and the smear grades was demonstrated. This demonstrates the reproducibility and reliability of
the NWU-TB sample processing step. Currently, the sample processing method is fully manual
and efforts are underway to semi-automate the process and exclude the wash steps. Semi-
automation will minimize variations due to skill levels and laboratory capacities after deployment.
Although a Biorad CFX96 was used in this study, the final modular NWU-TB system will

Chapter 5: Detection of M. tuberculosis by an improved NWU-TB diagnostic test
105
incorporate a small fast thermal cycler currently being development by a collaborator. The new
cycler will permit real-time amplification in less than 25 minutes. This study demonstrates that the
NWU-TB sample processing method can be coupled to any real-time PCR platform, thus reducing
installation costs in laboratories that already have existing real-time PCR instruments.
Currently, sputum culture conversion at 2 months is the only widely accepted marker of treatment
efficacy and thus acceptable for monitoring therapy in patients on anti-tuberculosis treatment (42).
Since MGIT culture can take 2 to 6 weeks for the results to be available, it is not suitable for rapid
decision-making about the effectiveness of TB-therapy. The PMA method coupled to nucleic acid
amplification tests has been used for rapid differentiation of live and dead cells in food and
environmental microbiology (43, 44). Recently, attempts have been made to apply the PMA
approach, linked to PCR, to differentiate between live and dead MTB. To our knowledge, very
few studies have evaluated the effectiveness of PMA in clinical sputum samples. Some of the
factors that influence the efficacy of PMA include: length of PMA incubation with the sample,
concentration of PMA used and the duration of exposure to the halogen lamp. However, de
Assuncao et al., showed that at the optimal PMA concentration, different incubation (5 to 10
minutes) and halogen lamp exposure times (1 to 2 minutes) resulted in small differences in the
efficacy of PMA (30). Therefore, shorter time intervals were adopted in this study. Previous
studies with MTB used PMA concentrations ranging from 50 to 500µM (23, 30, 45). Since high
PMA concentrations have been reported to penetrate viable cells and inhibit PCR (46), a moderate
concentration of 100µM as employed in another study was selected (30). Some sample processing
methods (sputasol and Cepheid sample reagent) has been reported to be incompatible with PMA
(24), but there was no evidence that the lysis buffer used in this study was incompatible with PMA.
Noteworthy, one culture negative sample (sample 9 in Table 4) tested positive on both Xpert
MTB/Rif and NWU-TB without PMA treatment. However, after PMA pretreatment in the NWU-
TB system, a negative result was reported with a large ∆CT. This is a classic case of a false positive
obtained by NAAT systems, highlighting the weaknesses of current molecular assays in failing to
distinguish between live and dead mycobacteria. Overall comparison of the ∆CT values when
patient data was stratified according to TB treatment status (treatment vs treatment naive),
however, yielded no statistically significant differences although observable differences can be
noted from the box plots in Figure 3. Specific cases are also reported in Table 4 where indeed
PMA discriminated between live and dead mycobacteria. There were 8 culture-positive samples
that tested positive without PMA treatment using the NWU-TB test but tested negative after PMA

Chapter 5: Detection of M. tuberculosis by an improved NWU-TB diagnostic test
106
treatment. This anomaly has also been reported in another study (47). Since in our case, stored
samples as opposed to fresh samples were used, freezing and thawing could have affected the
integrity of bacterial cell membranes, thus PMA could have penetrated the damaged membranes
of MTB (47) leading to the false negative results after PMA pretreatment.
The study had some limitations. Thawed stored sputum samples were used for NWU-TB testing,
which may not give the same results as fresh specimens. Limited availability of patient medical
data such as duration of therapy and the small sample size limited the level of analyses that could
be conducted. A large prospective longitudinal assessment will yield more information. For this
pilot PMA evaluation, the sample size was not sufficiently powered to detect differences between
the treatment naive patients and those on TB treatment. In conclusion, the NWU-TB sample
processing method is simple, fast and permits quantitative grading correlating with TB disease
burden. Use of PMA also shows potential for live/dead MTB discrimination, which is important
for treatment monitoring and detection in endemic settings where reinfection is common.
Funding
This study was supported by the MRC- Strategic Health Innovation Partnerships, and the North-
West University. Isaac Mutingwende is a recipient of the National Research Foundation (NRF) of
South Africa Innovation Doctoral bursary.
Conflict of Interest
The authors declare that they have no conflicts of interest. All rights in patents were assigned to
North-West University.
Acknowledgements
The authors are grateful to the TB Laboratory staff at AngloGold Ashanti Orkney-Westvaal
Hospital for performing smear microscopy, Xpert MTB/Rif and MGIT culture for this study.

Chapter 5: Detection of M. tuberculosis by an improved NWU-TB diagnostic test
107
5.0 References
1. Karim F, Islam MA, Chowdhury A, Johansson E, Diwan VK. 2007. Gender differences
in delays in diagnosis and treatment of tuberculosis. Health Policy and Planning 22:329-
334.
2. Sreeramareddy CT, Qin ZZ, Satyanarayana S, Subbaraman R, Pai M. 2014. Delays
in diagnosis and treatment of pulmonary tuberculosis in India: a systematic review. The
International Journal of Tuberculosis and Lung Disease 18:255-266.
3. Keeler E, Perkins MD, Small P, Hanson C, Reed S, Cunningham J, Aledort JE,
Hillborne L, Rafael ME, Girosi F, Dye C. 2006. Reducing the global burden of
tuberculosis: the contribution of improved diagnostics. Nature 444 Suppl 1:49-57.
4. Steingart KR, Ng V, Henry M, Hopewell PC, Ramsay A, Cunningham J, Urbanczik
R, Perkins MD, Aziz MA, Pai M. 2006. Sputum processing methods to improve the
sensitivity of smear microscopy for tuberculosis: a systematic review. The Lancet
Infectious Diseases 6:664-674.
5. Diraa O, Fdany K, Boudouma M, Elmdaghri N, Benbachir M. 2003. Assessment of
the Mycobacteria Growth Indicator Tube for the bacteriological diagnosis of tuberculosis.
The International Journal of Tuberculosis and Lung Disease 7:1010-1012.
6. Nijenbandring de Boer R, Baptista de Oliveira e Souza Filho J, Cobelens F, de Paula
Ramalho D, Campino Miranda PF, de Logo K, Oliveira H, Mesquita E, Oliveira MM,
Kritski A. 2014. Delayed culture conversion due to cigarette smoking in active pulmonary
tuberculosis patients. Tuberculosis 94:87-91.
7. Lee M-R, Chung K-P, Chen W-T, Huang Y-T, Lee L-N, Yu C-J, Teng L-J, Hsueh P-
R, Yang P-C, Luh K-T. 2012. Epidemiologic surveillance to detect false-positive
Mycobacterium tuberculosis cultures. Diagnostic Microbiology and Infectious Disease
73:343-349.
8. Miyazaki Y, Koga H, Kohno S, Kaku M. 1993. Nested polymerase chain reaction for
detection of Mycobacterium tuberculosis in clinical samples. Journal of Clinical
Microbiology 31:2228 - 2232.

Chapter 5: Detection of M. tuberculosis by an improved NWU-TB diagnostic test
108
9. Ling DI, Flores LL, Riley LW, Pai M. 2008. Commercial Nucleic-Acid Amplification
Tests for Diagnosis of Pulmonary Tuberculosis in Respiratory Specimens: Meta-Analysis
and Meta-Regression. PLoS ONE 3:e1536.
10. Kox L, Rhienthong D, Miranda A, Udomsantisuk N, Ellis K, van Leeuwen J, van
Heusden S, Kuijper S, Kolk A. 1994. A more reliable PCR for detection of
Mycobacterium tuberculosis in clinical samples. Journal of Clinical Microbiology 32:672
- 678.
11. Kearns A, Freeman R, Steward M, Magee J. 1998. A rapid polymerase chain reaction
technique for detecting M. tuberculosis in a variety of clinical specimens. Journal of
Clinical Pathology 51:922 - 924.
12. Ikonomopoulos J, Gorgoulis V, Zacharatos P, Manolis E, Kanavaros P, Rassidakis
A, Kittas C. 1999. Multiplex polymerase chain reaction for the detection of mycobacterial
DNA in cases of tuberculosis and sarcoidosis. Modern Pathology 12:854 - 862.
13. Ikonomopoulos J, Gorgoulis V, Zacharatos P, Kotsinas A, Tsoli E, Karameris A,
Panagou P, Kittas C. 1998. Multiplex PCR assay for the detection of mycobacterial DNA
sequences directly from sputum. In Vivo 12:547 - 552.
14. Gunisha P, Madhavan H, Jayanthi U, Therese K. 2001. Polymerase chain reaction using
IS6110 primer to detect Mycobacterium tuberculosis in clinical samples. Indian Journal of
Pathology and Microbiology 44:97 - 102.
15. Flores L, Pai M, Colford J, Riley L. 2005. In-house nucleic acid amplification tests for
the detection of Mycobacterium tuberculosis in sputum specimens: meta-analysis and
meta-regression. BMC Microbiology 5:55.
16. Scott LE, McCarthy K, Gous N, Nduna M, Van Rie A, Sanne I, Venter WF, Duse A,
Stevens W. 2011. Comparison of Xpert MTB/RIF with Other Nucleic Acid Technologies
for Diagnosing Pulmonary Tuberculosis in a High HIV Prevalence Setting: A Prospective
Study. PLoS Medicine 8:e1001061.

Chapter 5: Detection of M. tuberculosis by an improved NWU-TB diagnostic test
109
17. Adelman MW, Kurbatova E, Wang YF, Leonard MK, White N, McFarland DA,
Blumberg HM. 2014. Cost Analysis of a Nucleic Acid Amplification Test in the Diagnosis
of Pulmonary Tuberculosis at an Urban Hospital with a High Prevalence of TB/HIV. PLoS
ONE 9:e100649.
18. Boyles TH, Hughes J, Cox V, Burton R, Meintjes G, Mendelson M. 2014. False-
positive Xpert(R) MTB/RIF assays in previously treated patients: need for caution in
interpreting results. The International Journal of Tuberculosis and Lung Disease 18:876-
878.
19. Friedrich SO, Rachow A, Saathoff E, Singh K, Mangu CD, Dawson R, Phillips PPJ,
Venter A, Bateson A, Boehme CC, Heinrich N, Hunt RD, Boeree MJ, Zumla A,
McHugh TD, Gillespie SH, Diacon AH, Hoelscher M. 2013. Assessment of the
sensitivity and specificity of Xpert MTB/RIF assay as an early sputum biomarker of
response to tuberculosis treatment. The Lancet Respiratory Medicine 1:462-470.
20. Harrington M, Benjamin W. 2015. The Tuberculosis Diagnostics Pipeline. 2015
PIPELINE REPORT:153. URL:
http://www.pipelinereport.org/sites/g/files/g575521/f/201507/TB%20Diagnostics.pdf. Date of
access: 16 November 2015
21. Suzana S, Ninan MM, Gowri M, Venkatesh K, Rupali P, Michael JS. 2015. Xpert
MTB/Rif for the diagnosis of extrapulmonary tuberculosis‐an experience from a tertiary
care centre in South India. Tropical Medicine & International Health
doi:10.1111/tmi.12655.
22. Rogers GB, Stressmann FA, Koller G, Daniels T, Carroll MP, Bruce KD. 2008.
Assessing the diagnostic importance of nonviable bacterial cells in respiratory infections.
Diagnostic Microbiology and Infectious Disease 62:133-141.
23. Kim YJ, Lee SM, Park BK, Kim SS, Yi J, Kim HH, Lee EY, Chang CL. 2014.
Evaluation of propidium monoazide real-time PCR for early detection of viable
Mycobacterium tuberculosis in clinical respiratory specimens. Annals of Laboratory
Medicine 34:203-209.

Chapter 5: Detection of M. tuberculosis by an improved NWU-TB diagnostic test
110
24. Nikolayevskyy V, Miotto P, Pimkina E, Balabanova Y, Kontsevaya I, Ignatyeva O,
Ambrosi A, Skenders G, Ambrozaitis A, Kovalyov A, Sadykhova A, Simak T, Kritsky
A, Mironova S, Tikhonova O, Dubrovskaya Y, Rodionova Y, Cirillo D, Drobniewski
F. Utility of propidium monoazide viability assay as a biomarker for a tuberculosis disease.
Tuberculosis 95:179-185.
25. Mutingwende I, Vermeulen U, Steyn F, Viljoen H, Grobler A. 2015. Development and
evaluation of a rapid multiplex-PCR based system for Mycobacterium tuberculosis
diagnosis using sputum samples. Journal of Microbiological Methods 116:37-43.
26. Kantor de Narvaiz I, Kim Jae S, Frieden T, Laszlo A, Luelmo F, Norval P-Y, Rieder
H, Valenzuela P, Weyer K. 1998. Laboratory services in tuberculosis control, part II:
Microscopy. World Health Organization, Geneva, Switzerland.
http://whqlibdoc.who.int/hq/1998/WHO_TB_98.258_(part2).pdf.
27. Becton Dickinson and Company. 2013. BBL™MGIT™Mycobacteria Growth Indicator
Tube 7 mLWith BACTEC™MGIT™960 Supplement Kit.
https://www.bd.com/ds/technicalCenter/inserts/L000180JAA(201106).pdf. Accessed 16
June 2014.
28. Grobler A, Levanets O, Whitney S, Booth C, Viljoen H. 2012. Rapid cell lysis and DNA
capture in a lysis microreactor. Chemical Engineering Science 81:311-318.
29. Thanakiatkrai P, Welch L. 2011. Using the Taguchi method for rapid quantitative PCR
optimization with SYBR Green I. International Journal of Legal Medicine 126:161-165.
30. de Assuncao TM, Batista EL, Jr., Deves C, Villela AD, Pagnussatti VE, de Oliveira
Dias AC, Kritski A, Rodrigues-Junior V, Basso LA, Santos DS. 2014. Real time PCR
quantification of viable Mycobacterium tuberculosis from sputum samples treated with
propidium monoazide. Tuberculosis 94:421-427.
31. Alvarez G, Gonzalez M, Isabal S, Blanc V, Leon R. 2013. Method to quantify live and
dead cells in multi-species oral biofilm by real-time PCR with propidium monoazide. AMB
Express 3:1.

Chapter 5: Detection of M. tuberculosis by an improved NWU-TB diagnostic test
111
32. Müllerova M. 1996. Gen-probe amplified MTD test in comparison with microscopy and
culture. Journal of Microbiological Methods 27:104.
33. Nicol MP, Workman L, Isaacs W, Munro J, Black F, Eley B, Boehme CC, Zemanay
W, Zar HJ. 2011. Accuracy of the Xpert MTB/RIF test for the diagnosis of pulmonary
tuberculosis in children admitted to hospital in Cape Town, South Africa: a descriptive
study. The Lancet Infectious Diseases 11:819-824.
34. Park SH, Kim CK, Jeong HR, Son H, Kim SH, Park MS. 2014. Evaluation and
comparison of molecular and conventional diagnostic tests for detecting tuberculosis in
Korea, 2013. Osong Public Health and Research Perspectives 5:S3-7.
35. Chen JH, She KK, Kwong TC, Wong OY, Siu GK, Leung CC, Chang KC, Tam CM,
Ho PL, Cheng VC, Yuen KY, Yam WC. 2015. Performance of the new automated
Abbott RealTime MTB assay for rapid detection of Mycobacterium tuberculosis complex
in respiratory specimens. European Journal of Clinical Microbiology & Infectious Diseases
doi:10.1007/s10096-015-2419-5.
36. Steingart KR, Sohn H, Schiller I, Kloda LA, Boehme CC, Pai M, Dendukuri N. 2013.
Xpert(R) MTB/RIF assay for pulmonary tuberculosis and rifampicin resistance in adults.
Cochrane Database Syst Rev 1:CD009593.
37. Nimesh M, Joon D, Pathak AK, Saluja D. 2013. Comparative study of diagnostic
accuracy of established PCR assays and in-house developed sdaA PCR method for
detection of Mycobacterium tuberculosis in symptomatic patients with pulmonary
tuberculosis. Journal of Infection 67:399-407.
38. Haldar S, Bose M, Chakrabarti P, Daginawala HF, Harinath BC, Kashyap RS,
Kulkarni S, Majumdar A, Prasad HK, Rodrigues C, Srivastava R, Taori GM, Varma-
Basil M, Tyagi JS. Improved laboratory diagnosis of tuberculosis – The Indian experience.
Tuberculosis 91:414-426.
39. Cross LJ, Anscombe C, McHugh TD, Abubakar I, Shorten RJ, Thorne N, Arnold C.
2015. A Rapid and Sensitive Diagnostic Screening Assay for Detection of Mycobacteria
Including Mycobacterium tuberculosis Directly from Sputum without Extraction.
International Journal of Bacteriology 2015.

Chapter 5: Detection of M. tuberculosis by an improved NWU-TB diagnostic test
112
40. Walter SD, Irwig L, Glasziou PP. Meta-Analysis of Diagnostic Tests With Imperfect
Reference Standards. Journal of Clinical Epidemiology 52:943-951.
41. Swets JA. 1988. Measuring the accuracy of diagnostic systems. Science 240:1285-1293.
42. Mitchison DA. 1993. Assessment of new sterilizing drugs for treating pulmonary
tuberculosis by culture at 2 months. The American Review of Respiratory Disease
147:1062-1063.
43. Nocker A, Sossa-Fernandez P, Burr MD, Camper AK. 2007. Use of Propidium
Monoazide for Live/Dead Distinction in Microbial Ecology. Applied and Environmental
Microbiology 73:5111-5117.
44. Vesper S, McKinstry C, Hartmann C, Neace M, Yoder S, Vesper A. 2008. Quantifying
fungal viability in air and water samples using quantitative PCR after treatment with
propidium monoazide (PMA). Journal of Microbiological Methods 72:180-184.
45. Miotto P, Bigoni S, Migliori GB, Matteelli A, Cirillo DM. 2012. Early tuberculosis
treatment monitoring by Xpert® MTB/RIF. European Respiratory Journal 39:1269-1271.
46. Pholwat S, Heysell S, Stroup S, Foongladda S, Houpt E. 2011. Rapid First- and Second-
Line Drug Susceptibility Assay for Mycobacterium tuberculosis Isolates by Use of
Quantitative PCR. Journal of Clinical Microbiology 49:69-75.
47. Kim YJ, Lee SM, Park BK, Kim SS, Yi J, Kim HH, Lee EY, Chang CL. 2014.
Evaluation of Propidium Monoazide Real-Time PCR for Early Detection of Viable
Mycobacterium tuberculosis in Clinical Respiratory Specimens. Annals of Laboratory
Medicine 34:203-209.

113
This chapter consists of a full length article to be submitted to BMC Infectious Diseases journal.
The “instructions to authors” for the journal were followed in preparing the manuscript, except
that for easy reading figures, schemes and tables are inserted at their logical places as they would
appear in a printed version of the article and 1.5 line spacing was used to ensure consistency with
the rest of the thesis. The complete author guidelines for the journal can be found in “Annexure
E”. This chapter addresses the fourth objective in this study by estimating the cost per test of
NWU-TB and its potential cost-effectiveness if adopted as a TB screening test for all miners in
South Africa.

Chapter 6: Cost-effectiveness of NWU-TB South Africa
114
Estimating the cost per test and potential cost-effectiveness of the NWU-TB system for
active tuberculosis screening in mining communities in South Africa
Isaac Mutingwendea*, Urban Vermeulena, Hendrik Viljoena,b, Anne Groblera*
aDST/NWU Preclinical Drug Development Platform, Faculty of Health Sciences, North-West
University, Potchefstroom, South Africa, b Department of Chemical & Biomolecular Engineering, University of Nebraska–Lincoln, USA
* Corresponding authors:
Email addresses: [email protected] (AG), [email protected] (IM)
Key words: Tuberculosis; screening; NWU-TB system; cost-effectiveness; DALY; ICER
Running title: Cost-effectiveness of NWU-TB in South Africa
Chapter 6: Cost-effectiveness of NWU-TB South Africa
115
Abstract
Background: mining communities act as reservoirs and drivers of new TB infections within South
Africa and its neighboring countries; with a prevalence of tuberculosis estimated at 3,000/100,000
population in South African miners. As new diagnostic tests that are cheaper, portable, and more
accurate continue to reach the market, active case finding (ACF) as opposed to passive case finding
can help reduce disease burden in such hotspots. The objective of this study was to estimate the
cost per test for NWU-TB and then evaluate the cost-effectiveness of using either NWU-TB or
Xpert MTB/Rif or sputum smear microscopy (SSM) to screen all miners in South Africa for
tuberculosis, relative to the current base scenario of passive case finding (PCF).
Methods: The “ingredients approach” was used to estimate the cost per test for NWU-TB from a
laboratory perspective. A decision-analysis model was used to estimate the cost-effectiveness of
screening all South African miners for TB, using NWU-TB, SSM and Xpert MTB/Rif relative to
the current base scenario of PCF. We adopted the healthcare provider’s perspective. The primary
outcome was the incremental cost-effectiveness (ICER) in US$ cost per case detected. It should
be emphasized that the modelling work described here is of a very preliminary nature as it sought
to address a basic question of whether at the current costs and performance level, NWU-TB will
be cost-effective for TB screening in a high prevalence setting.
Results: The total cost per test for NWU-TB was estimated at $5.36, with material cost per test
contributing the highest (75%) and equipment cost contributing the least (1.31%). The incremental
cost effectiveness ratios (ICERs) for community based TB screening within South African mines
using NWU-TB and Xpert MTB/Rif were US$50.3 per case detected and $181.52 per case
detected respectively.
Conclusions: NWU-TB is cheaper than Xpert MTB/Rif but is almost double the cost of SSM.
Active screening of all miners in South Africa for tuberculosis using NWU-TB was the most cost-
effective strategy.
Introduction
The emergence of accurate, rapid and reliable TB diagnostic tests on the market provides hope to
all stakeholders in low- and middle income countries involved in the fight against TB. Studies’
documenting the diagnostic accuracy (sensitivity and specificity) of these tests are widely available
and it is an active research area [1-4]. However, accuracy alone does not directly translate into
Chapter 6: Cost-effectiveness of NWU-TB South Africa
116
better patient or population outcomes such as deaths averted, years of life gained and reduced
transmissions [5]. Therefore, the ability to estimate the potential impact and cost-effectiveness of
a promising diagnostic test before its deployment must be a high priority to avoid wasteful
investments [6]. For example, the recently launched revolutionary Xpert MTB/Rif has well
documented good accuracy [7-9], but evidence from recent studies indicates that in spite of this
high accuracy, insignificant reductions in morbidity and mortality have been achieved [10, 11].
Due to the urgent need to deploy new TB diagnostics but within an environment of limited
population-level data on impact of new diagnostic interventions, models provide a less costly
alternative to translate available empirical data into estimates of impact and cost-effectiveness,
thus enabling informed decision making [12].
Miners are an important reservoir of tuberculosis infection in South Africa and prevalence of TB
in miners is more than three times that of a normal population [13]. Mines in South Africa employ
many migrant workers from neighboring countries, which drives the spread of the epidemic in the
region and the problem was well summarized by the South African Health Minister, (“If TB and
HIV are a snake in Southern Africa, the head of the snake is here in South Africa. People come
from all over the Southern African Development Community to work in our mines and they export
TB and HIV, along with their earnings. If we want to kill a snake, we need to hit it on its head”)
(Aaron Motsoaledi, June 2010). Active case finding (ACF) to identify and treat persons with active
tuberculosis in hotspots like the mines is an attractive strategy that can interrupt future
transmissions. However, for such programs to attract immediate funding there is need to highlight
the direct economic benefits [14]. In this manuscript, the cost-effectiveness of adopting NWU-TB
for community based screening of active tuberculosis in South African mines was determined.
To determine the cost-effectiveness, the cost per test from a laboratory perspective for NWU-TB
was determined. The accuracy of NWU-TB was previously described [15, 16] for tuberculosis
diagnosis in a hospital of a South African gold mine. Since the test is under final development
information from this study will also assist in setting the appropriate target product profile (TPP)
that informs final product (prototype) optimization to achieve optimal population-level impact that
is at the same time cost-effective.

Chapter 6: Cost-effectiveness of NWU-TB South Africa
117
Methods
NWU-TB costing
To determine the total cost of NWU-TB from a health provider’s perspective, we gathered cost
information for the different activities and materials used. These included material costs per test,
overhead and labour costs, equipment costs, and average number of tests performed per day.
Statutory South African VAT (14%) was included in all the costs, and all costs are in U.S dollars
[costs converted from South African rand to U.S$ at 13.6940 R/$US applicable on 23/09/2015
(https://www.resbank.co.za/Research/Rates/Pages/CurrentMarketRates.aspx)]. The South African
rand has been declining since the time this analysis was conducted and this might have a significant
impact on the outcomes and conclusions drawn from this study. In January 2016, the rand reached
it all time low of 16.84 to the dollar which directly leads to high prices for all imported products.
This shows how vulnerable developing countries are to first world technologies where the costs
are pegged to major international currencies and the tests are not domestic-based.
Material costs per test
The unit cost per specimen tested from a provider’s perspective for NWU-TB was estimated using
the “ingredients” approach. This involved documenting all the materials used from the moment a
patient sputum sample is received in the laboratory until patient results are dispatched.
Number of tests per day
To determine the labour cost per test and the equipment cost per test, it is necessary to determine
the maximum number of NWU-TB tests that can be performed per day and assume that the system
will operate at maximum capacity for the entire duration of its useful lifespan. The maximum
number of tests that can be performed per day was determined as outlined below. The NWU-TB
test can be divided into main 2 stages: sample processing stage and the amplification and detection
of M. tuberculosis stage on a real-time platform. The real time instrument can run 48 specimens
simultaneously, with each run lasting a maximum of 1 hour. The rate limiting step in the current
NWU-TB workflow is the lysis step during the patient sample processing procedure [15]. In the
current lyser device a maximum of 8 specimens can be processed per each run, with each run
lasting a maximum of 20 minutes including the specimen processing and lysis. Assuming, a
laboratory operates for 8 hours daily, a maximum of 128 specimens can be processed daily using
a single lyser device.

Chapter 6: Cost-effectiveness of NWU-TB South Africa
118
Labour cost per test
NWU-TB can be performed by a qualified medical laboratory technologist with ease. In South
Africa a medical laboratory technologist must possess a national diploma in biomedical technology
and be registered with Health Professions Council of South Africa. In determining the labour costs,
the assumption was that all the tests will be performed only by these technologists and therefore
the salary of a technologist employed by the National Health Laboratory Services (NHLS) was
used in calculating labour cost per test. Other labour costs such as sample collection, counseling
and physician consultation, were not included in calculating the labour cost per test as these would
apply to any TB test.
Equipment costs and daily equivalents
The cost of building a lyser device was taken as the purchase price, and this does not include
normal costs associated with future commercial product. However, these incremental costs are
likely to be offset by cost savings associated with economies of scale. The negotiated purchase
price of the Streck real time thermal cycler is US$ 8,000. The cost of building the lyser device
came to US$ 772.29, thus the total equipment of the NWU-TB system is US$ 8,772.29. In order
to estimate the daily equivalent costs, the following assumptions were made; (i) one year warranty
provided by manufacturer, (ii) equipment comes with a $1,000.00 insurance package, with the
assumption that the client will purchase insurance annually after expiry of warranty, (iii) the
equipment has a 5 year useful lifespan, and (iv) a discount rate of 5% is included.
Overhead cost per test
Overhead costs for NWU-TB were estimated to be equivalent to those calculated for sputum smear
microscopy (SSM) reported elsewhere [17]. The assumption is premised on the fact that NWU-
TB is designed to be stationed at a microscopy centre thus requiring the same level of
infrastructure. The overhead cost was determined as $0.74 with an uncertainty range of between
$0.18 and $0.93.
Cost–effectiveness
The modelling work described here is of a very preliminary nature as it only seeks to inform further
product development. A decision-analytic model was constructed to estimate the cost-
effectiveness of community based screening of tuberculosis in South African mines using any of
the three tests (SSM, Xpert MTB/Rif or NWU-TB) in comparison to the base scenario of passive
case finding (PCF). The model structure is shown in Figure 1 and the main outcome measure is
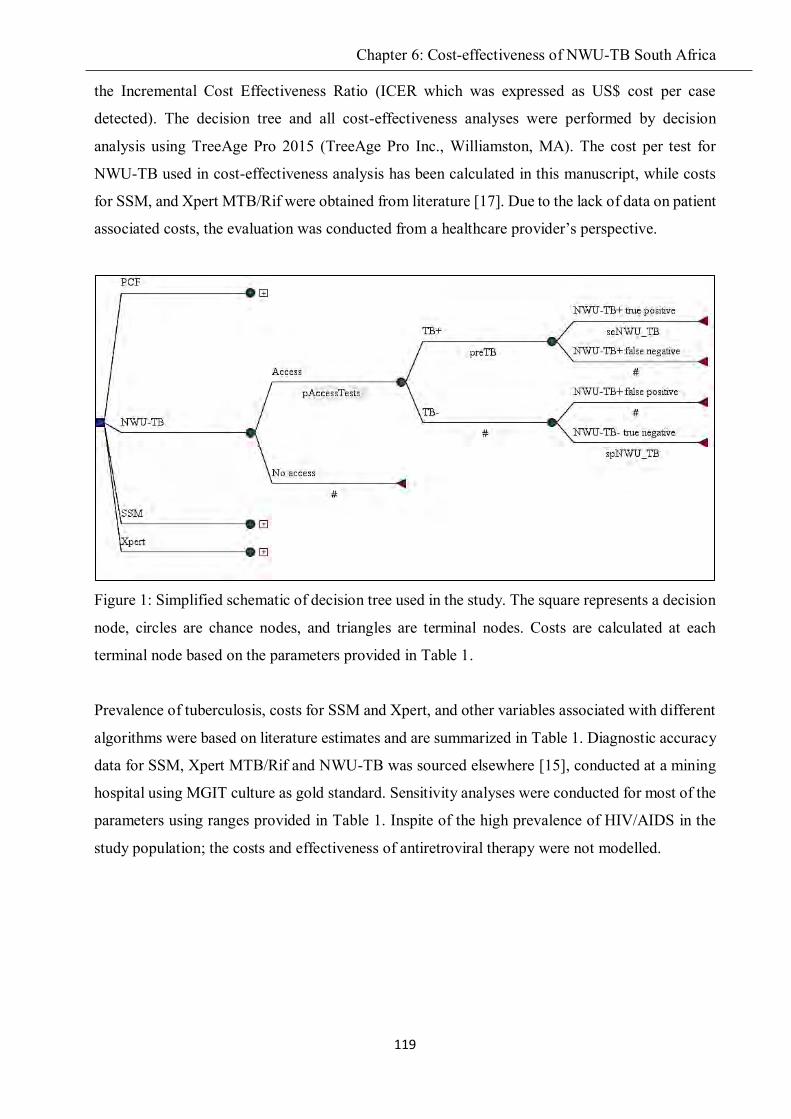
Chapter 6: Cost-effectiveness of NWU-TB South Africa
119
the Incremental Cost Effectiveness Ratio (ICER which was expressed as US$ cost per case
detected). The decision tree and all cost-effectiveness analyses were performed by decision
analysis using TreeAge Pro 2015 (TreeAge Pro Inc., Williamston, MA). The cost per test for
NWU-TB used in cost-effectiveness analysis has been calculated in this manuscript, while costs
for SSM, and Xpert MTB/Rif were obtained from literature [17]. Due to the lack of data on patient
associated costs, the evaluation was conducted from a healthcare provider’s perspective.
Figure 1: Simplified schematic of decision tree used in the study. The square represents a decision
node, circles are chance nodes, and triangles are terminal nodes. Costs are calculated at each
terminal node based on the parameters provided in Table 1.
Prevalence of tuberculosis, costs for SSM and Xpert, and other variables associated with different
algorithms were based on literature estimates and are summarized in Table 1. Diagnostic accuracy
data for SSM, Xpert MTB/Rif and NWU-TB was sourced elsewhere [15], conducted at a mining
hospital using MGIT culture as gold standard. Sensitivity analyses were conducted for most of the
parameters using ranges provided in Table 1. Inspite of the high prevalence of HIV/AIDS in the
study population; the costs and effectiveness of antiretroviral therapy were not modelled.

Chapter 6: Cost-effectiveness of NWU-TB South Africa
120
Table 1: Parameter values and ranges inputted in the model, and reference sources for the
estimates used in the cost-effectiveness analysis
Parameter Parameter value
Range (Min-Max)
Reference
Epidemiological parameters
Prevalence of TB among miners 0.03 0.01-0.07 [13]
Characteristics of TB diagnosis
Sensitivity SSM 0.621 0.553-0.684 [15]
Specificity SSM 0.561 0.447-0.67 [15]
Sensitivity NWU-TB 0.808 0.75-0.856 [15]
Specificity NWU-TB 0.756 0.649-0.844 [15]
Sensitivity Xpert 0.853 0.799-0.896 [15]
Specificity Xpert 0.732 0.622-0.824 [15]
Probability of being screened with a diagnostic test
1 0.95-1.0 Personal opinion
Probability of accessing care in PCF 0.57 0.25-1.00 [18]
pTruepos_combined_PCF 0.776 0.61-1.0 [18]
pTrueneg_combined_PCF 1.00 0.883-1.0 [18]
Laboratory costs
SSM $2.25 1.40-3.24 [17]
NWU-TB* $5.36 4.56 - 10.64 This manuscript
Xpert $14.93 13.36-28.88 [17]
PCF $0.20 0.1 – 1 [19]
*Note: The cost per test for NWU-TB is calculated in this paper
Xpert, Xpert MTB/Rif; DALY, disability-adjusted life year; SSM, sputum smear microscopy,
pTruepos_combined_PCF refers to the combined sensitivity of SSM and culture when confirming
suspected TB cases, similarly pTrueneg_combined_PCF refers to the combined specificity of SSM
and culture.

Chapter 6: Cost-effectiveness of NWU-TB South Africa
121
The following assumptions were made in the model in addition to those already mentioned
elsewhere in this manuscript; a discount of 3%, the standard costs of TB treatment were not
modelled, and benefits were assumed to only accrue over a one year static time period.
Results
NWU-TB costing
Material costs
The material cost per sample for NWU-TB is $ 4.02 when the cost of propidium monoazide is not
included as shown in Table . The cost of propidium monoazide per sample is $5.28 which is 31.34
% above the cost of all other materials used in the NWU-TB system.
Table 2: Material costs per NWU-TB test
Item US$ % of total
Lysis buffer 0.11 2.74
Lysis microreactor (LMR) 0.80 19.90
ZR Viral DNA/RNA Kit 0.57 14.17
Scorpion primer 0.09 2.24
Scorpion probe 0.74 18.41
KAPA Probe qPCR Mastermix 2x 0.39 9.70
96-well plates 0.06 1.49
Micro seal adhesives for PCR plates 0.02 0.50
DNA extraction control- Internal control 0.92 22.89
PCR grade water pH 8.0 0.10 2.49
General consumables (Gloves, tips, detergents) 0.22 5.47
Total material costs per test 4.02 100.00
Labour costs
Determining the staff time per test is naturally the first step in determining labour cost per test and
Table shows how the calculations were performed. The NWU-TB assay can be performed by any
qualified Medical/Clinical Laboratory Technologist whose annual pay scale range is R 130,121.00
to R 291,807.00 according to the National Health Laboratory Services (NHLS)

Chapter 6: Cost-effectiveness of NWU-TB South Africa
122
(http://www.payscale.com/research/ZA/Employer=NHLS/Salary/by_Job). In this study a median
salary of R 210,964.00 (equivalent to US$ 15,405.58) was used. The actual work days per year are
shown in Table .
Table 3: Medical Laboratory Technologist labour cost per NWU-TB test in South Africa
Item Value
Total potential income per year $15,405.58
Potential working days per year 260 days
Annual leave 22 days
National holidays 12 days
Actual working days 226 days
Technologist salary per day $68.17
Working hours per day 8 hours
Number of tests per hour 16 tests
Labour cost per test $0.53
Equipment cost per test
Using standard procedures, the present value of equipment over its entire 5 year life span, was
calculated to be $12,318.24. Table shows how the equipment cost per test of US$ 0.07 was
calculated.
Table 4: Equipment cost per test for NWU-TB
Value (units)
Present value of equipment with insurance $12, 318.24
monthly equivalent equipment cost (over 5 years) $205,304
Days equipment used per month 22 days
Daily equivalent equipment cost $9.33
Number of tests per day 128 tests
Equipment cost per test $0.07

Chapter 6: Cost-effectiveness of NWU-TB South Africa
123
Total cost per test
Using data from Table to Table , and the assumption made for the overhead cost per test, the total
cost per test from the health provider’s perspective was calculated as shown in Table . The
estimated total cost per test was US$ 5.36.
Table 5: Total cost per test for NWU-TB based on component costs
Value (US$) % of total
Material cost per test 4.02 75%
Labour cost per test 0.53 9.89%
Equipment cost per test 0.07 1.31%
Overhead cost per test 0.74 13.80%
Total cost per test 5.36 100%
Cost-effectiveness
The incremental cost-effectiveness ratio (ICER) of NWU-TB was US$ 50.3 per case detected,
while both Xpert MTB/Rif and SSM were dominated as shown in Table . South Africa is a middle
income country with a willingness-to-pay threshold of US 5,786.00 [20], thus ICER was
compared to this threshold value. A test that is dominated by other alternatives is rejected from the
onset as the dominated strategy has a greater cost with no greater benefits under all model
conditions. Xpert MTB/Rif and SSM were dominated under the model conditions.
Table 6: Incremental cost-effectiveness ratios of the different diagnostic strategies
Strategy Cost Incr Cost Eff Incr Eff C/E Incr C/E
PCF 0.114 0 0.491 0 0.23 0
SSM 2.25 2.136 0.478 -0.013 4.71 “dominated”
NWU-TB 5.36 5.246 0.594 0.104 9.02 50.63
Xpert 14.93 14.816 0.572 0.082 26.08 $ 181.52
All tests referencing common baseline. Incr Cost – incremental cost; Incr Eff – incremental
effectiveness; Incr C/E – incremental cost-effectiveness;

Chapter 6: Cost-effectiveness of NWU-TB South Africa
124
Figure 2: Cost-effectiveness analysis output graph
One-way sensitivity-analyses on all parameters were performed, and Figure 2 shows 8 parameters
that had the highest effect on the model. The model was most sensitive to the specificities of NWU-
TB and Xpert MTB/Rif, showing that increases in the specificities of the assays are associated
with increased cost effectiveness. A decrease in the prevalence of tuberculosis in the target
population will result in reduced ICERs.

Chapter 6: Cost-effectiveness of NWU-TB South Africa
125
Figure 3: One-way sensitivity-analysis of key parameters used in the model. The vertical line
represents the incremental cost-effectiveness ratio (ICER) of the baseline parameter values. Only
the top 8 parameters are shown and the others are not shown. Black bars represent the low value
of the sensitivity range and the coloured bars represent the high value. EV- expected value of ICER
under baseline parameters; SSM- sputum smear microscopy; Xpert- Xpert MTB/Rif
Discussion
In South Africa, active tuberculosis cases are detected through passive case finding using mainly
SSM to test presumptive patients presenting themselves at health care centres. MGIT culture,
which is the current gold standard for tuberculosis diagnosis is slow and requires specialized
facilities thereby making it unsuitable for community based screening of the disease [21]. In 1974,
the World Health Organization abandoned its policy on ACF using mobile mass radiography, due
to strong evidence against its effectiveness and inappropriateness [14]. However, screening of high
risk groups was never condemned as long as it does not deter development of optimal tests. As
better tools for TB diagnosis with lower risks than mobile mass radiography emerge on the market,
there is need to predict their potential impact on future transmission, cost-effectiveness, and direct
benefits for cases detected. We previously described a low cost and rapid TB diagnostic test with

Chapter 6: Cost-effectiveness of NWU-TB South Africa
126
the potential to be adapted for mobile ACF programs in high burden settings like mines in South
Africa [15, 16].
In this study, the total cost per test for NWU-TB, which is a nucleic acid amplification test (NAAT)
for rapid detection of Mycobacterium Tuberculosis (MTB) was first estimated. The cost of NWU-
TB was found to be 64% lower than that of subsidized Xpert MTB/Rif [22, 17].
Consumables/materials accounted for 75% of the total cost per test, which is comparable to that
reported for other molecular tests (Xpert MTB/Rif and MTBDRplus), whose consumable costs are
described to be between 60% and 80% [17]. Reduction in consumable cost contribution for NWU-
TB can be gained from economies of scale if the test is rolled out on a wider scale. Labour costs
contributed 9.89%, which can increase if the number tests performed per day decreases. On the
other hand, if less skilled cheaper labour can be trained to use the test or in low-income countries
where salary costs are lower, the labour cost per test can also decrease further provided the number
of tests per day remains unchanged. Equipment costs per test accounted for only 1.31%,
highlighting the fact that simple technology can make a difference.
It was demonstrated that NWU-TB is the most cost-effective diagnostic test for community based
TB screening among miners in South Africa. NWU-TB had an ICER of $ 54.58 per case detected
relative to PCF, while SSM and Xpert MTB/Rif were dominated under the model conditions. The
results are comparable to those from an ACF program conducted in Cambodia which targeted TB
contacts; the overall cost per case detected was US$ 108 [23]. The prevalence of TB among
household contacts is reported to be 3.1% (95% CI 2.1–4.5%) [24], and is similar to the TB
prevalence [3%, sensitivity analysis range: 1% - 7%] used in the study, this study and the
Cambodia study [23] highlight the cost-effectiveness of ACF in high TB prevalence settings.
Different results may be obtained when ACF is conducted in low prevalence settings. One-way
sensitivity analyses revealed that TB prevalence was of the top three factors whose uncertainty
drives the largest impact. Therefore, current R&D effort to semi-automate and commercialize the
NWU-TB test should focus on further improvements on the specificity of the test.
Although Xpert MTB/Rif was dominated it had an ICER of US$ 181.52 per case detected, and
can be considered cost-effective compared to results from large ACF multisite study which
reported ICERs ranging from US$ 60 to US$ 1626 per case detected [25]. Therefore, policy makers
must take into account its good performance characteristics and design features such as its low
biohazard risk which makes it a suitable alternative for community-based screening. Caution must

Chapter 6: Cost-effectiveness of NWU-TB South Africa
127
still be exercised in recommending the most suitable alternative as policy makers do not make
decisions in a vacuum. There are many programmes competing for limited funding and a
seemingly “cost-effective strategy” may wipeout the entire health budget of the country if
implemented. For example, it is reported that “In India, providing Xpert MTB/Rif to 15% of all
TB suspects would consume the entire annual budget of the Revised National TB Control Program
of US$ 65million as of 2010”. There are about 500,000 mine workers in South Africa [26].
Assuming that a program was launched where all of them were screened at the stated costs for the
TB tests given in Table , then screening all miners in South Africa for tuberculosis using either
NWU-TB or Xpert MTB/Rif would cost US$ 2,680,000 and US$ 7,465,000 respectively in
laboratory associated costs only.
Like any other modelling analyses, the study had some limitations. First, the model has a one year
statistic time frame and future reductions in TB transmission that accrue from community-based
screening in mining communities were not accounted for. It has been estimated that an individual
with active TB can infect up to 12 persons per year [27, 28], leading to 0.9 future active TB cases
[29]. Therefore, the model may have significantly underestimated the long-term cost-effectiveness
of TB active case finding for all the tests relative to the no screening base scenario. Secondly, to a
large degree, the cost-effectiveness analysis relied on literature data for parameter estimates. For
example, effectiveness parameters were taken from a study conducted in a neighboring country
[19], with a different socio-economic status to South Africa. In addition, costs per test for SSM
and MGIT culture were obtained from literature and the methods used to calculate these costs are
slightly different from the one adopted for determining NWU-TB cost per test as outlined in this
study. Another assumption was that a negative test during screening will not influence clinical
decision making.
In conclusion, a detailed costing calculation for estimating the cost per each NWU-TB test from a
laboratory perspective is provided. The potential cost-effectiveness of community-based screening
of all miners in South Africa for tuberculosis using either SSM or Xpert MTB/Rif or NWU-TB
relative to the current base scenario of PCF was modelled. NWU-TB was found to be the most
cost-effective strategy relative to PCF as base case scenario, while both Xpert MTB/Rif and SSM
were dominated under the model conditions.

Chapter 6: Cost-effectiveness of NWU-TB South Africa
128
Funding
This study was supported by the MRC- Strategic Health Innovation Partnerships, and the North-
West University. Isaac Mutingwende is a recipient of the NRF Innovation bursary.
Conflict of Interest
The authors declare that they have no conflicts of interest. All rights in patents were assigned to
the North-West University.
References
1. Weekes K, Pearse M, Sievers A, Ross B, d'Apice A. The diagnostic use of the polymerase chain
reaction for the detection of Mycobacterium tuberculosis. Pathology. 1994;26:482 - 6.
2. Weyer K, Mirzayev F, Migliori GB, Van Gemert W, D'Ambrosio L, Zignol M et al. Rapid
molecular TB diagnosis: evidence, policy making and global implementation of Xpert MTB/RIF.
European Respiratory Journal. 2013;42(1):252-71. doi:10.1183/09031936.00157212.
3. World Health Organization. Molecular line probe assays for rapid screening of patients at risk
of multidrug-resistant tuberculosis (MDR-TB). Policy statement June. 2008.
4. Yoon K, Cho S, Lee T, Cheon S, Chang J, Kim S et al. Detection of Mycobacterium tuberculosis
in clinical samples from patients with tuberculosis or other pulmonary diseases by polymerase
chain reaction. Yonsei Medical Journal. 1992;33:209 - 16.
5. Mann G, Squire SB, Bissell K, Eliseev P, Du Toit E, Hesseling A et al. Beyond accuracy:
creating a comprehensive evidence base for TB diagnostic tools. International Journal of
Tuberculosis and Lung Disease. 2010;14(12):1518-24.
6. Dowdy DW, Cattamanchi A, Steingart KR, Pai M. Is Scale-Up Worth It? Challenges in
Economic Analysis of Diagnostic Tests for Tuberculosis. PLoS Medicine. 2011;8(7):e1001063.
doi:10.1371/journal.pmed.1001063.
7. Walusimbi S, Bwanga F, De Costa A, Haile M, Joloba M, Hoffner S. Meta-analysis to compare
the accuracy of GeneXpert, MODS and the WHO 2007 algorithm for diagnosis of smear-negative
pulmonary tuberculosis. BMC Infectious Diseases. 2013;13(1):507.
Chapter 6: Cost-effectiveness of NWU-TB South Africa
129
8. Steingart KR, Sohn H, Schiller I, Kloda LA, Boehme CC, Pai M et al. Xpert(R) MTB/RIF assay
for pulmonary tuberculosis and rifampicin resistance in adults. The Cochrane database of
systematic reviews. 2013;1:CD009593. doi:10.1002/14651858.CD009593.pub2.
9. Park KS, Kim JY, Lee JW, Hwang YY, Jeon K, Koh WJ et al. Comparison of the Xpert
MTB/RIF and Cobas TaqMan MTB assays for detection of Mycobacterium tuberculosis in
respiratory specimens. Journal of Clinical Microbiology. 2013;51(10):3225-7.
doi:10.1128/jcm.01335-13.
10. McNerney R, Zumla A. Impact of the Xpert MTB/RIF diagnostic test for tuberculosis in
countries with a high burden of disease. Current Opinion in Pulmonary Medicine. 2015;21(3):304-
8. doi:10.1097/mcp.0000000000000161.
11. Theron G, Zijenah L, Chanda D, Clowes P, Rachow A, Lesosky M et al. Feasibility, accuracy,
and clinical effect of point-of-care Xpert MTB/RIF testing for tuberculosis in primary-care settings
in Africa: a multicentre, randomised, controlled trial. The Lancet. 2014;383(9915):424-35.
doi:http://dx.doi.org/10.1016/S0140-6736(13)62073-5.
12. Estill J, Egger M, Blaser N, Vizcaya LS, Garone D, Wood R et al. Cost-effectiveness of point-
of-care viral load monitoring of ART in resource-limited settings: Mathematical modelling study.
AIDS 2013;27(9):10.1097/QAD.0b013e328360a4e5. doi:10.1097/QAD.0b013e328360a4e5.
13. van Halsema CL, Fielding KL, Chihota VN, Lewis JJ, Churchyard GJ, Grant AD. Trends in
drug-resistant tuberculosis in a gold-mining workforce in South Africa, 2002-2008. International
Journal of Tuberculosis and Lung Disease. 2012;16(7):967-73. doi:10.5588/ijtld.11.0122.
14. Lönnroth K, Corbett E, Golub J, Godfrey-Faussett P, Uplekar M, Weil D et al. Systematic
screening for active tuberculosis: rationale, definitions and key considerations [State of the art
series. Active case finding/screening. Number 1 in the series]. The International Journal of
Tuberculosis and Lung Disease. 2013;17(3):289-98. doi:10.5588/ijtld.12.0797.
15. Mutingwende I, Vermeulen U, Steyn F, Viljoen H, Grobler A. Development and evaluation of
a rapid multiplex-PCR based system for Mycobacterium tuberculosis diagnosis using sputum

Chapter 6: Cost-effectiveness of NWU-TB South Africa
130
samples. Journal of Microbiological Methods. 2015;116(0):37-43.
doi:http://dx.doi.org/10.1016/j.mimet.2015.06.007.
16. Grobler A, Levanets O, Whitney S, Booth C, Viljoen H. Rapid cell lysis and DNA capture in
a lysis microreactor. Chemical Engineering Science. 2012;81(0):311-8.
doi:http://dx.doi.org/10.1016/j.ces.2012.07.009.
17. Shah M, Chihota V, Coetzee G, Churchyard G, Dorman S. Comparison of laboratory costs of
rapid molecular tests and conventional diagnostics for detection of tuberculosis and drug-resistant
tuberculosis in South Africa. BMC Infectious Diseases. 2013;13(1):352.
18. Sekandi JN, Dobbin K, Oloya J, Okwera A, Whalen CC, Corso PS. Cost-Effectiveness
Analysis of Community Active Case Finding and Household Contact Investigation for
Tuberculosis Case Detection in Urban Africa. PloS one. 2015;10(2):e0117009.
doi:10.1371/journal.pone.0117009.
19. Zwerling AA, Sahu M, Ngwira LG, Khundi M, Harawa T, Corbett EL et al. Screening for
Tuberculosis Among Adults Newly Diagnosed With HIV in Sub-Saharan Africa: A Cost-
Effectiveness Analysis. Journal of Acquired Immune Deficiency Syndromes. 2015;70(1):83-90.
doi:10.1097/qai.0000000000000712.
20. Vassall A, van Kampen S, Sohn H, Michael JS, John K, den Boon S et al. Rapid diagnosis of
tuberculosis with the Xpert MTB/RIF assay in high burden countries: a cost-effectiveness analysis.
PLoS Medicine. 2011;8(11):e1001120.
21. Said HM, Ismail N, Osman A, Velsman C, Hoosen AA. Evaluation of TBc Identification
Immunochromatographic Assay for Rapid Identification of Mycobacterium tuberculosis Complex
in Samples from Broth Cultures. Journal of Clinical Microbiology. 2011;49(5):1939-42.
doi:10.1128/JCM.01906-10.
22. Nikam C, Rodrigues C. Xpert MTB/RIF: The newly endorsed TB diagnostic. Pediatric
Infectious Disease. 2014;6(2):75-8. doi:http://dx.doi.org/10.1016/j.pid.2014.07.003.
23. Eang MT, Satha P, Yadav RP, Morishita F, Nishikiori N, van-Maaren P et al. Early detection
of tuberculosis through community-based active case finding in Cambodia. BMC Public Health.
2012;12(1):1-10. doi:10.1186/1471-2458-12-469.

Chapter 6: Cost-effectiveness of NWU-TB South Africa
131
24. Fox GJ, Barry SE, Britton WJ, Marks GB. Contact investigation for tuberculosis: a systematic
review and meta-analysis. European Respiratory Journal. 2013;41(1):140-56.
doi:10.1183/09031936.00070812.
25. Hinderaker SG, Rusen ID, Chiang CY, Yan L, Heldal E, Enarson DA. The FIDELIS initiative:
innovative strategies for increased case finding. The International Journal of Tuberculosis and
Lung Disease. 2011;15(1):71-6.
26. Gwatidzo T, Benhura M. Mining sector wages in South Africa. Labour Market Intelligence
Partnership. 2013:2-8.
27. Keeler E, Perkins MD, Small P, Hanson C, Reed S, Cunningham J et al. Reducing the global
burden of tuberculosis: the contribution of improved diagnostics. Nature. 2006;444 Suppl 1:49-
57. doi:10.1038/nature05446.
28. Corbett EL, Charalambous S, Fielding K, Clayton T, Hayes RJ, De Cock KM et al. Stable
Incidence Rates of Tuberculosis (TB) among Human Immunodeficiency Virus (HIV)–Negative
South African Gold Miners during a Decade of Epidemic HIV-Associated TB. Journal of
Infectious Diseases. 2003;188(8):1156-63. doi:10.1086/378519.
29. Salpeter EE, Salpeter SR. Mathematical Model for the Epidemiology of Tuberculosis, with
Estimates of the Reproductive Number and Infection-Delay Function. American Journal of
Epidemiology. 1998;147(4):398-406.

132
This chapter summarizes all the preceding chapters and discusses recommendations for future
research. The chapter starts with a recap of the objectives, followed by the main findings in each
of the chapters, and finally highlights potential areas for future research.
Thus, objectives 1, 2 and 3 were satisfactorily addressed.

Chapter 7: Summary & future prospects
133
1.0 Introduction Annually, 3 million infectious cases of tuberculosis remain undiagnosed (World Health
Organization, 2014). Evidence shows that a single TB diseased patient can infect as many as 15
more individuals per year if they remain untreated (Valadas & Antunes, 2005). TB is a curable
disease but appropriate therapy cannot be initiated before a proper diagnosis is made. Sputum
smear microscopy (SSM), the current mainstay test in low-income settings has poor accuracy, is
labour intense, requires electricity and skilled microscopists and is thus inadequate to identify all
infectious cases. If new diagnostic tests that result in dramatic increases in case detection in low-
income settings where the disease burden is greatest do not see the light of the day, there is no way
TB can be eradicated by 2050. Disturbingly, despite Sub-Saharan Africa being the highest bearer
of the TB disease burden, its involvement in research and development of new TB diagnostic tests
is minimal. Financial returns on investment to develop affordable point-of-care tests for low-
income settings are narrow and therefore unattractive to international biotech firms (McNerney et
al., 2015). As an African student and together with my supervisors, we decided to be part of the
solution and conceived this study.
The objectives of this study were as follows:
1. Develop a rapid and affordable nucleic acid amplification based test for the diagnosis of
tuberculosis using sputum samples dedicated to be used for community-based screening in low-
income settings.
2. To evaluate the performance of the developed test in clinical sputum samples collected between
January 2013 and December 2015.
3. To be able to distinguish between live and dead mycobacteria, thereby preventing false positive
results in a NAAT system and enabling the test to be used in treatment outcomes monitoring.
4. To determine the cost and potential cost-effectiveness if the system is adopted as replacement
for SSM in South Africa.
2.0 Summary of study design, execution and results
Applying the principle of rapid cell lysis (Grobler et al., 2012) that achieves mycobacterial cell
lysis through chemical, mechanical and thermal means simultaneously, a 15 minute sputum sample
processing method was developed. After the lysis step, 5µL of the lysate was directly used in a
Multiplex PCR reaction using a Philisa fast thermal cycler (Streck Inc., Omaha, NE) which allows
amplification for 40 cycles in 25 minutes. Biosafety risk of the lysis step was also assessed to avoid
exposure of healthcare workers to bioaerosols during sample manipulation. The Total Assay Time
(TAT) of the NWU-TB test is about 1 hour 30 minutes. Diagnostic accuracy in clinical sputum

Chapter 7: Summary & future prospects
134
samples using MGIT culture as gold standard showed that NWU-TB had better sensitivity [%
(95% CI)] than both Xpert MTB/Rif and SSM in TB treatment naive individuals. In the initial
evaluation described in chapter 4, the sensitivity of NWU-TB was [87.6% (79.8%–93.2%)] while
sensitivities of SSM and Xpert MTB/Rif were [62.9% (52.9%–72.1%)], and [83.8% (75.3%–
90.3%)], respectively. Specificity [% (95% CI)] for NWU-TB [88.9% (70.8%–97.6%)] was also
better than for SSM [74.1% (53.7%–88.9%)] but lower than Xpert MTB/Rif [70.4% (49.8%–
86.2%)]. In the problematic smear negative-culture positive group, mainly comprised of HIV
infected patients, NWU-TB had better sensitivity of [76.1% (60.7%–88.9%)] than Xpert MTB/Rif
[61.5% (44.6%–76.6%)]. Biosafety studies showed that there was complete mycobacterial
inactivation during lysis and bioaerosols released were trapped by the filter fitted on the lysis
microreactors. These results and features demonstrate that the new test (NWU-TB) can be suitable
for community based TB screening in South Africa due to the short TAT, low cost, and good
sensitivity especially in the smear negative-culture positive group.
However, the test still had some limitations that could prevent its widespread adoption. The first
limitation of the test was the need to run agarose gels, and in the field or laboratory healthcare
workers would not be interested in performing such a task. Secondly, the test could not distinguish
between live and dead mycobacteria. DNA from dead mycobacteria has been reported to persist
in sputum for up to 5 years (Boyles et al., 2014). In endemic settings, exposed individuals and
patients with a TB history are likely to have a false positive result. In order to address these two
issues, a real-time PCR platform and a strategy using propidium monoazide (PMA) to distinguish
between live and dead mycobacteria were adopted. PMA is a photoreactive DNA-binding dye that
penetrates cell walls of dead cells and binds to DNA but cannot penetrate intact cell walls of living
cells (Nocker et al., 2006). Exposure to visible light from a 650W halogen lamb induces the
photoreaction of PMA and dsDNA, forming a complex that is not amplifiable by PCR (Nocker et
al., 2007). The sensitivity of NWU-TB [94.6% (89.1%;-97.8%)] was still higher than for both
Xpert MTB/Rif [84% (76.2%-90.1%)] and SSM [64.3% (55.4%-72.6%)]. Specificity for NWU-
TB [86.2% (68.3%-96.1%)] was higher than for SSM [62.1% (42.3%-79.3%), but still remained
lower than Xpert MTB/Rif [100% (88.1%-100%)]. Next, 50 paired PMA treated or PMA untreated
sputum samples were randomly selected to evaluate the effectiveness of PMA to discriminate
between live and dead mycobacteria. The ∆CT (PMA treated – PMA untreated) was calculated
and samples stratified by TB treatment status for analysis. Though observable, ∆CT difference
between patients receiving TB therapy and treatment naive were not statistically significant.

Chapter 7: Summary & future prospects
135
Proof-of-concept for the inclusion of PMA in the NWU-TB test was demonstrated in the study. In
future, a large prospective study must be conducted.
The diagnostic accuracy (sensitivity and specificity) of any test is an important factor that is
considered when selecting the most suitable test to adopt. Therefore, diagnostic accuracy studies
reporting on the clinical evaluation of new tests must follow STARD guidelines for the results to
be considered trustworthy and enable accurate comparison of results from different studies.
STARD guidelines were followed in designing the three clinical evaluations of NWU-TB reported
in this thesis. The first evaluation was performed at an independent site, the NICD, and blinded
samples were used in the study. The other two studies were performed at North-West University
by the team developing NWU-TB, however, the reference test (MGIT culture) together with Xpert
MTB/Rif were performed by independent and experienced laboratory technicians stationed at
Orkney-West Vaal hospital. The results from the comparative and reference tests were kept blind
to the North-West University team until the data analysis stage. The current universally accepted
“gold standard” for tuberculosis is MGIT culture and this was used in all the evaluations. As
STARD guidelines were followed in designing the studies, the lower accuracy of Xpert MTB/Rif
reported in chapter 4 when compared to results from other studies could not be dismissed on the
basis that it is different from other studies. The diagnostic results reported in chapter 4 and chapter
5 indicate the actual performance of SSM, MGIT culture and Xpert MTB/Rif in the field and it
can be observed that the field results may be different from results of evaluations done in controlled
studies. This possibly explain why some tests with good performance indicators as reported in
literature do not make huge impacts on morbidity and mortality once deployed in the field. It is
recommended that future clinical evaluation studies of diagnostic tests be conducted in settings
that closely mirror the sites at which they will be deployed and that they are performed by
individuals with the same skills level of the healthcare workers anticipated to operate the
instruments.
In addition to diagnostic accuracy, it is necessary to estimate the cost-effectiveness of adopting
the new strategy as tests with good accuracy may not be affordable in the target market. This is
particularly critical for a disease like tuberculosis that mainly affects the poor as they stay in
overcrowded and poorly ventilated houses, therefore a good test which is unaffordable will not
make a big impact. The cost of NWU-TB and its cost-effectiveness for community-based
screening of tuberculosis in all South African miners was evaluated. Costs for NWU-TB were
estimated using the “ingredients approach” and were estimated to be $5.36 without PMA treatment

Chapter 7: Summary & future prospects
136
and $10.64 with PMA treatment. NWU-TB was also found to be cost-effective for tuberculosis
screening in all South African miners with an ICER of $50.3 per case detected. Xpert MTB/Rif
and SSM were both dominated under the model conditions. Although Xpert MTB/Rif was
dominated its ICER was $181.52 per case detected which is comparable to the ICERs of other
ACF studies reported elsewhere (Hinderaker, 2011; Eang et al., 2012)
Table 4 of Chapter 2 provided a list of the proposed minimum specifications for the design of any
new TB POC diagnostic test that was drafted by a TB diagnostics working group
(http://www.msfaccess.org/TB_POC_Parismeeting/). A comparison of NWU-TB to other tests
following those points is provided in Table 1 below to indicate how NWU-TB fares when
compared to other tests. NWU-TB cost per test is lower than that of Xpert MTB/Rif and MGIT
culture, but is more expensive compared to SSM. It also shows better sensitivity that Xpert
MTB/Rif in the problematic smear-negative and culture-positive group, which is associated with
paucibacillary disease. However, NWU-TB still has some weaknesses: it is still manual test
making it susceptible to operator variability and it stills lacks an internal amplification control
which may result in false negatives due to presence of PCR inhibitors.

Chapter 7: Summary & future prospects
137
Table 1: Comparison of Performance and features of NWU-TB to commonly used TB diagnostic tests in South Africa
SSM MGIT culture Xpert MTB/Rif NWU-TB system
Cost $2.25 $23.46 $14.93 $5.36
Equipment cost $3,409.00 $38,950.00 $17,000.00 $ 8,772.29
Sensitivity : smear--Culture
+ N/A N/A 61.5% 76.1%
Number of samples 3 1 1 1 Time to Result 2-3 days 10-21 days < 2 hours < 2 hours
Number of samples per run 1 (20/day) 960 1 (64/day) 8 (128/day)
Sample processing BSL 1 BSL 3 BSL 1 BSL 1
Level of training High High Low High
Results read out Complex simple Simple simple
Battery powered Yes No No Yes
Where sited (laboratory) primary level reference level district level Primary level/mobile
Live/dead discrimination No Yes No Yes
Major limitations MTB vs. MOTT Slow expensive manual

Chapter 7: Summary & future prospects
138
3.0 Discussion
This section aims to provide a proper perspective on some of the outcomes reported on in this
thesis and firstly to put the specific results on the use of PMA to distinguish between live and dead
bacteria into context and secondly to discuss the low specificities of SSM and Xpert MTB/Rif
reported here since these are discordant with results from several other publications.
3.1 PMA use in live/dead discrimination
Molecular methods promise to change the tuberculosis diagnostic landscape due to their quick
turnaround times, and high accuracy. A number of such tests are already on the market. In spite of
the advantages of the molecular tests, these methods have not managed to completely replace
culture methods with its long turnaround times of 2-6 weeks. One of the main reasons for this is
that molecular methods are not able to distinguish between live and dead mycobacterium, which
makes them unsuitable for treatment outcomes monitoring and also prone to false positives in
previously treated individuals. The use of propidium monoazide has been explored in a few studies
(Miotto et al., 2012; de Assuncao et al., 2014; Kim et al., 2014) in an attempt to address this
inherent shortcoming of all molecular methods. The PMA approach is attractive in that if properly
optimised it can be coupled to any molecular method. Since few studies have evaluated this
approach particularly using clinical sputum samples, a pilot study was conceived and executed as
described in one the manuscripts (chapter 5) in this thesis. The aim of the pilot was to optimize the
PMA assay using the light exposure instrument (Figure 1) that was assembled specifically for this
study. Only 50 frozen sputum samples were used in the evaluation in which each sample was split
into two aliquots. To enable a direct comparison, one aliquot was treated with PMA and the other
was not. The samples were further processed in exactly the same manner following the NWU-TB
standard protocol.
The results of this pilot study show that PMA treatment alters CT values of the samples (denoted
by ∆CT), with larger ∆CT values occurring in samples from patients who were receiving anti-
tuberculosis therapy. This indicates that PMA was able to penetrate dead cells and cross-link with
DNA to form a complex that is non-amplifiable by PCR using the conditions described in the
manuscript. The protocol developed in the study will be used in a large prospective cohort study
where fresh samples will be used.

Chapter 7: Summary & future prospects
139
Figure 1: Light exposure apparatus used in the PMA assay
It is hypothesized that freezing and thawing of samples damage the integrity of the bacterial cell
wall of viable cells, which may allow PMA to penetrate the cells (Kim et al., 2014). In addition,
propidium monoazide is currently relatively expensive and this deters its wide scale use if the cost
is not significantly reduced by for instance decreasing the sample volume. The cost was of this
study was one of the reasons for analyzing only 50 samples in our study.
3.2 Specificity of SSM, Xpert MTB/Rif and NWU-TB
There may be concerns with reference to the low specificity results for Xpert MTB/Rif and SSM
that were presented in this thesis. These results appear to be discordant with results from several
other publications that show that both Xpert MTB/Rif and SSM have high specificities (Steingart
et al., 2006; Steingart et al., 2014). The following facts may go some way in explaining the results:
First, samples used in all studies reported in this thesis were collected from the same site (Orkney-
Westvaal hospital) therefore any factors unique to this site would be replicated throughout all the
studies. It should be noted that the laboratory where the reference tests (MGIT culture, SSM, and
Xpert MTB/Rif) were performed is certified by the South African National Accreditation System
(SANAS). As described in our study design the reference tests were carried out by registered
medical scientists at the site as part of their daily routine work, with no interference form the NWU.
In addition, the studies were blinded, with unblinding at the data analysis stage only. These results
reinforce the known fact that all the current TB diagnostic tests have weaknesses when deployed
in the field, especially in high prevalence settings. The reference used in all the analysis is MGIT
culture, referred to as the “gold standard” in the literature; it is currently the universally acceptable
microbiological reference standard.

Chapter 7: Summary & future prospects
140
4.0 Future research focus
In the present study; a rapid and affordable point-of-care TB diagnostic test suitable to be used as
a community-based TB screening tool has been developed and evaluated. However, some R&D
activities are still outstanding in order for the system to become commercially available.
The areas for further research include the following:
1. Designing and optimizing an internal amplification control. An internal amplification control
needs to be introduced to each sample at the beginning of sample preparation to monitor the
success of the process rather than the diagnosis of the sample, without losing sensitivity. As
internal control a DNA sequence that is unrelated to the M. tuberculosis target sequences must be
used. This unrelated DNA sequence is simultaneously amplified by PCR. A negative internal
control result with a negative patient result is regarded as inconclusive and the test is repeated.
This helps reduce the number of false negative that may be caused by the presence of PCR
inhibitors in the sample.
2. Conduct a full prospective clinical evaluation on the effectiveness of PMA to discriminate
between live and dead mycobacteria. A proof-of-concept study described in chapter 5
demonstrated that PMA is potentially effective strategy when coupled to NAATs for
differentiating between live and dead mycobacteria in clinical samples. The strategy can enable
NAATs to be used in treatment outcomes monitoring, which currently relies on the slow culture
method. In the future study, during the first 2 months weekly sputum samples must be obtained
from patients commenced on therapy and then monthly thereafter. This will ensure that there is a
sufficient number of time points for statistical analysis which was not possible in the proof-of-
concept study.
3. Screening of miners in South Africa to determine whether NWU-TB is actually a cost-effective
strategy for community based TB screening. The final prototype of the NWU-TB system
incorporating the improvements suggested above needs to be evaluated in the South African mines
in order to validate the cost-effectiveness results reported in chapter 6. Other clinical evaluations
studies can also be conducted during this phase in order to build a sufficient dossier for
presentation to the WHO prequalification programme.
4. Incorporating drug resistance detection capabilities in the NWU-TB assay algorithm.
Approximately 95% of rifampin resistance is associated with mutations in an 81-bp region

Chapter 7: Summary & future prospects
141
(corresponding to codons 511 to 533) of the rpoB gene known as the rifampicin resistance
determining region (RRDR) (Htike Min et al., 2014). Efforts to use sloppy molecular beacons
(SMBs) targeting the entire 81bp RRDR are already underway using three SMBs (Chakravorty et
al., 2012) and their sequences are provided in Table 5. SMBs enable rapid and high-throughput
identification of drug resistance based on accurate “probe-target hybrid” melting temperature (Tm)
values (Roh et al., 2015). The primers and SMBs were synthesized by Biomers.net (GmbH,
Germany).
Table 5: Sequences of primers and sloppy molecular beacons for RMP drug resistance detection
Name Sequence Fragment length
RpoB-F RpoB-R
5′-agacgttgatcaacatccg-3′ 5′-acctccagcccggcacgctcacgt-3′ 172bp
rpo1 5′-FAM-cgaccgCccatgaattggctcagctggctggtgAcggtcg-BHQ1-3′
rpo2 5′-HEX-ggcgcgaaccAcgacagcgggttgttctggtccatgaacgcgcc-BHQ1-3′
rpo3 5′ −Cy5-cgcgcgcaTcAccAacagtcggTgcttgtgggtcaacccgcgcg-BHQ2-3′
The envisaged algorithm involves first detecting the presence of M.tuberculosis in a patient sample
and in positive samples the presence of any mutations in the RRDR that are associated with RMP
resistance is then probed. The rationale behind this approach is to minimize costs associated with
drug resistance detection as the SMB probes are expensive. Two of the SMB probes (rpo1 and
rpo2) have been successfully optimised and optimization of the third probe (rpo3) is still ongoing.
The melt peak of rpo1 that corresponds to a wild type genotype is 80.0oC and that of rpo2 is 83.2 oC. Further validation using a large panel of wild type clinical isolates will be needed to determine
the range within which all possible wild type genotypes will fall. Future work must also focus on
optimization of the rpo3 probe. Thereafter the concordance between the SMB approach will be
evaluated against Sanger sequencing as the” gold standard” in patient sputum samples.

Chapter 7: Summary & future prospects
142
5.0 References
Boyles, T.H., Hughes, J., Cox, V., Burton, R., Meintjes, G. & Mendelson, M. 2014. False-positive
Xpert(R) MTB/RIF assays in previously treated patients: need for caution in interpreting results.
The International Journal of Tuberculosis and Lung Disease, 18(7):876-878.
Chakravorty, S., Kothari, H., Aladegbami, B., Cho, E.J., Lee, J.S., Roh, S.S., Kim, H., Kwak, H.,
Lee, E.G., Hwang, S.H., Banada, P.P., Safi, H., Via, L.E., Cho, S.-N., Barry, C.E. & Alland, D.
2012. Rapid, High-Throughput Detection of Rifampin Resistance and Heteroresistance in
Mycobacterium tuberculosis by Use of Sloppy Molecular Beacon Melting Temperature Coding.
Journal of Clinical Microbiology, 50(7):2194-2202.
de Assuncao, T.M., Batista, E.L., Jr., Deves, C., Villela, A.D., Pagnussatti, V.E., de Oliveira Dias,
A.C., Kritski, A., Rodrigues-Junior, V., Basso, L.A. & Santos, D.S. 2014. Real time PCR
quantification of viable Mycobacterium tuberculosis from sputum samples treated with propidium
monoazide. Tuberculosis 94(4):421-427.
Eang, M.T., Satha, P., Yadav, R.P., Morishita, F., Nishikiori, N., van-Maaren, P. & Weezenbeek,
C.L.-v. 2012. Early detection of tuberculosis through community-based active case finding in
Cambodia. BMC Public Health, 12(1):1-10.
Grobler, A., Levanets, O., Whitney, S., Booth, C. & Viljoen, H. 2012. Rapid cell lysis and DNA
capture in a lysis microreactor. Chemical Engineering Science, 81(0):311-318.
Hinderaker, S.G. 2011. The FIDELIS initiative: innovative strategies for increased case finding.
The International Journal of Tuberculosis and Lung Disease, 15.
Htike Min, P.K., Pitaksajjakul, P., Tipkrua, N., Wongwit, W., Jintaridh, P. & Ramasoota, P. 2014.
Novel mutation detection IN rpoB OF rifampicin-resistant Mycobacterium tuberculosis using
pyrosequencing. Southeast Asian J Trop Med Public Health, 45(4):843-852.
Kim, Y.J., Lee, S.M., Park, B.K., Kim, S.S., Yi, J., Kim, H.H., Lee, E.Y. & Chang, C.L. 2014.
Evaluation of Propidium Monoazide Real-Time PCR for Early Detection of Viable
Mycobacterium tuberculosis in Clinical Respiratory Specimens. Annals of Laboratory Medicine,
34(3):203-209.

Chapter 7: Summary & future prospects
143
McNerney, R., Cunningham, J., Hepple, P. & Zumla, A. 2015. New tuberculosis diagnostics and
rollout. The International Journal of Tuberculosis and Lung Disease, 32:81-86.
Miotto, P., Bigoni, S., Migliori, G.B., Matteelli, A. & Cirillo, D.M. 2012. Early tuberculosis
treatment monitoring by Xpert® MTB/RIF. European Respiratory Journal, 39(5):1269-1271.
Nocker, A., Cheung, C.Y. & Camper, A.K. 2006. Comparison of propidium monoazide with
ethidium monoazide for differentiation of live vs. dead bacteria by selective removal of DNA from
dead cells. Journal of Microbiological Methods, 67(2):310-320.
Nocker, A., Sossa-Fernandez, P., Burr, M.D. & Camper, A.K. 2007. Use of Propidium
Monoazide for Live/Dead Distinction in Microbial Ecology. Applied and Environmental
Microbiology, 73(16):5111-5117.
Roh, S.S., Smith, L.E., Lee, J.S., Via, L.E., Barry, C.E., III, Alland, D. & Chakravorty, S. 2015.
Comparative Evaluation of Sloppy Molecular Beacon and Dual-Labeled Probe Melting
Temperature Assays to Identify Mutations in Mycobacterium tuberculosis Resulting in Rifampin,
Fluoroquinolone and Aminoglycoside Resistance. PLoS ONE, 10(5):e0126257.
Steingart, K.R., Henry, M., Ng, V., Hopewell, P.C., Ramsay, A., Cunningham, J., Urbanczik, R.,
Perkins, M., Aziz, M.A. & Pai, M. 2006. Fluorescence versus conventional sputum smear
microscopy for tuberculosis: a systematic review. The Lancet Infectious Diseases, 6(9):570-581.
Steingart, K.R., Schiller, I., Horne, D.J., Pai, M., Boehme, C.C. & Dendukuri, N. 2014. Xpert®
Mtb/Rif assay for pulmonary tuberculosis and rifampicin resistance in adults. The Cochrane
Database of Systematic Reviews(1):1-166.
Valadas, E. & Antunes, F. 2005. Tuberculosis, a re-emergent disease. European Journal of
Radiology, 55(2):154-157.
World Health Organization. 2014. Global tuberculosis report 2014. Geneva Switzerland. URL:
http://apps.who.int/iris/bitstream/10665/137094/1/9789241564809_eng.pdf. Date of
access: 16 August 2015

Appendix A: Independent evaluation report
144
Annexure A: Independent evaluation report

Appendix A: Independent evaluation report
145

Appendix B: Journal of Microbiological Methods information pack
146
Annexure B: Journal of Microbiological Methods information pack

Appendix B: Journal of Microbiological Methods information pack
147

Appendix B: Journal of Microbiological Methods information pack
148

Appendix B: Journal of Microbiological Methods information pack
149

Appendix B: Journal of Microbiological Methods information pack
150

Appendix B: Journal of Microbiological Methods information pack
151

Appendix B: Journal of Microbiological Methods information pack
152

Appendix B: Journal of Microbiological Methods information pack
153

Appendix B: Journal of Microbiological Methods information pack
154

Appendix B: Journal of Microbiological Methods information pack
155

Appendix B: Journal of Microbiological Methods information pack
156

Appendix B: Journal of Microbiological Methods information pack
157

Appendix B: Journal of Microbiological Methods information pack
158

Appendix C: Supplementary information, paper 1
159
Annexure C: Supplementary information, paper 1
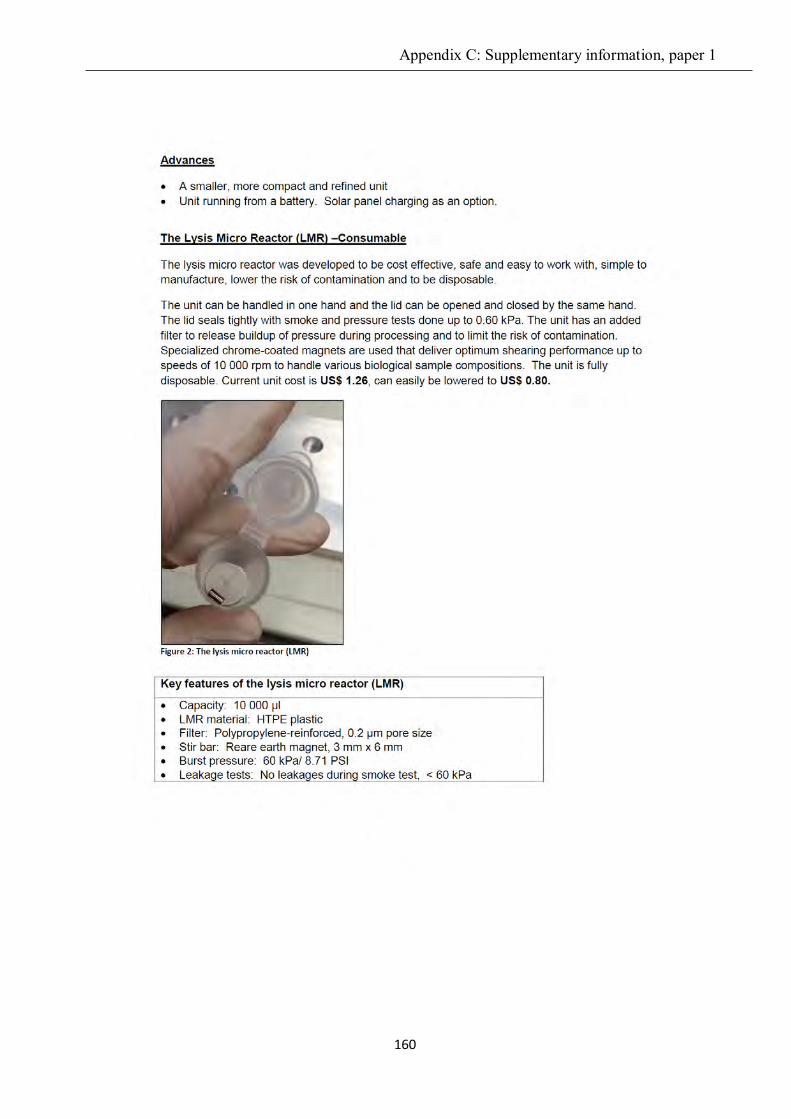
Appendix C: Supplementary information, paper 1
160

Appendix C: Supplementary information, paper 1
161
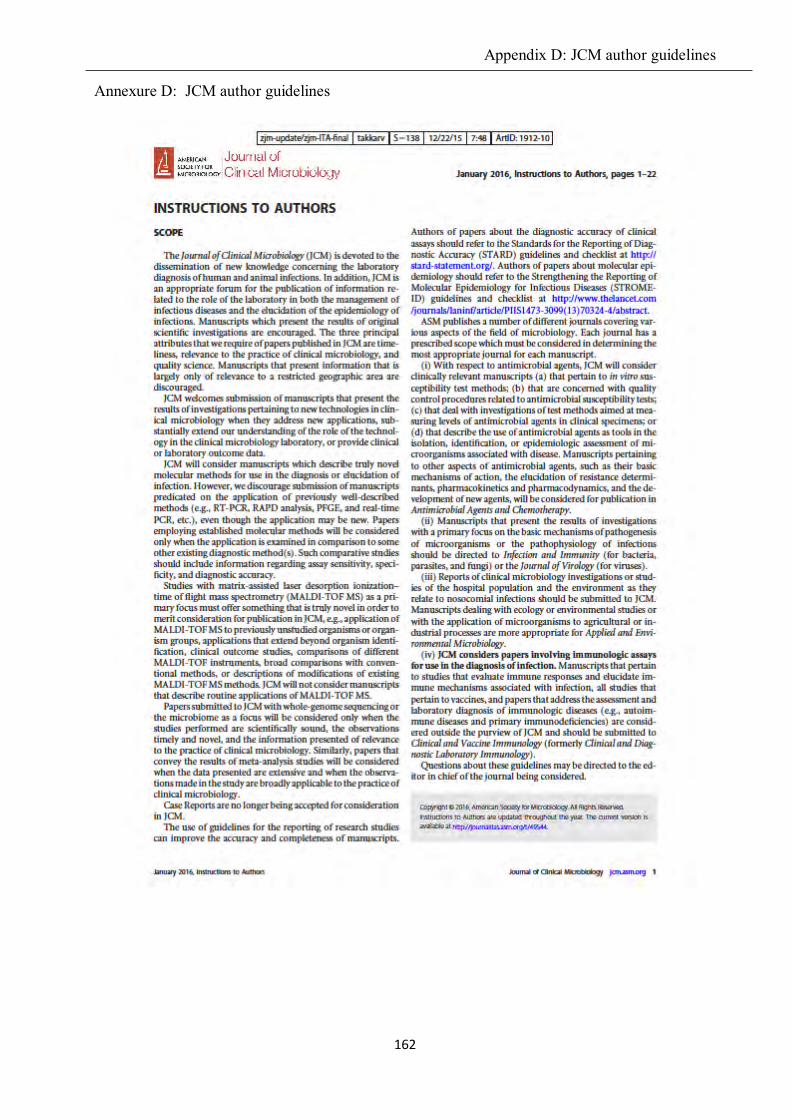
Appendix D: JCM author guidelines
162
Annexure D: JCM author guidelines

Appendix D: JCM author guidelines
163

Appendix D: JCM author guidelines
164

Appendix D: JCM author guidelines
165

Appendix D: JCM author guidelines
166
Appendix D: JCM author guidelines
167

Appendix D: JCM author guidelines
168

Appendix D: JCM author guidelines
169

Appendix D: JCM author guidelines
170

Appendix D: JCM author guidelines
171

Appendix D: JCM author guidelines
172

Appendix D: JCM author guidelines
173

Appendix D: JCM author guidelines
174

Appendix D: JCM author guidelines
175

Appendix D: JCM author guidelines
176

Appendix D: JCM author guidelines
177

Appendix D: JCM author guidelines
178

Appendix D: JCM author guidelines
179

Appendix D: JCM author guidelines
180

Appendix D: JCM author guidelines
181

Appendix D: JCM author guidelines
182

Appendix D: JCM author guidelines
183

Annexure E: BMC author guidelines
184
Annexure E: BMC author guidelines

Annexure E: BMC author guidelines
185

Annexure E: BMC author guidelines
186
Annexure E: BMC author guidelines
187

Annexure E: BMC author guidelines
188

Annexure E: BMC author guidelines
189

Annexure E: BMC author guidelines
190

Annexure E: BMC author guidelines
191

Annexure E: BMC author guidelines
192

Annexure E: BMC author guidelines
193


