Development and Testing of a Gainsharing Formula - UW … · The Graduate School University of...
87
Development and Testing of a Gainsharing Formula in a Mid-Size Manufacturing Company in Northwest Wisconsin by Scott Czekalski A Research Paper Submitted in Partial Fulfillment of the Requirements for the Master of Science Degree in Management Technology The Graduate School University of Wisconsin-Stout May, 2006
Transcript of Development and Testing of a Gainsharing Formula - UW … · The Graduate School University of...
Development and Testing of a Gainsharing Formula
in a Mid-Size Manufacturing Company
in Northwest Wisconsin
by
Scott Czekalski
A Research Paper Submitted in Partial Fulfillment of the
Requirements for the Master of Science Degree
in
Management Technology
The Graduate School
University of Wisconsin-Stout
May, 2006
The Graduate School University of Wisconsin-Stout
Menomonie, WI
ABSTRACT
Author: Czekalski, Scott L.
Title: Development and Testing of a Gainsharing Formula in a
Mid-Size Manufacturing Company in Northwest Wisconsin
Graduate Degree/ Major: MS Management Technology
Research Adviser: Jerry Coomer, Ph.D.
MonthNear: May, 2006
Number of Pages: 79
Style Manual Used: American Psychological Association, 5th edition
If organizations are to not only survive, but thrive in the changing world of global
competition they must find a way to utilize their greatest resource- their people. The old
command and control management model and information on a need to know basis is no
longer effective in today's changing environment. Organizations must become more
efficient and have everyone working towards a common goal and treating the business as
if it were their own. By implementing gainsharing, a team-based reward system,
organizations will be able to push knowledge and power to the lowest levels possible
allowing employees to manage the business and managers to lead.
The purpose of this study was to research what is required for a successful
gainsharing plan, define an implementation procedure, and develop and test a gainsharing
formula specifically for XYZ Corporation, Inc. Through a process of elimination one
measure from XYZ Corporation was chosen to be used in a gainsharing formula. As a
result, two formulas were created and various scenarios tested using historical data from
2005. Upon completion of the study, conclusions were drawn regarding the validity of
the formulas and the feasibility of implementing gainsharing at XYZ Corporation at this
time. Also included are recommendations pertaining to future steps XYZ Corporation
may take under consideration before implementing gainsharing. This study will benefit
anyone who is interested in improving productivity, employee morale, job satisfaction,
and employee involvement. An executive summary has been included in Appendix S of
the study.

The Graduate School
University of Wisconsin Stout
Menomonie, WI
Acknowledgments
I would like to thank the followingpeople who have been a
tremendous help throughout my graduate studies:
My wife, Kelly, for loving, supporting, andputting up with me as Iput our
life "on-hold" for the previous three years in order to achieve my degree,
My son, Zachary, who brings me inspiration andjoy, and
My parents, brothers, sister, nieces and nephews, and grandparents for your
support and encouragement.
Dr. Jerry Coomer, my research advisor, for your guidance and insight on leadership and
what people are able to accomplish in organizations
(ifonly we could get them to see);
Kari Dahl, for demonstrating how fast and how well people can come
together and become a team and a family;
and to the rest of the professors that I have had throughout my journey-
It's been a pleasure,
Thank you.
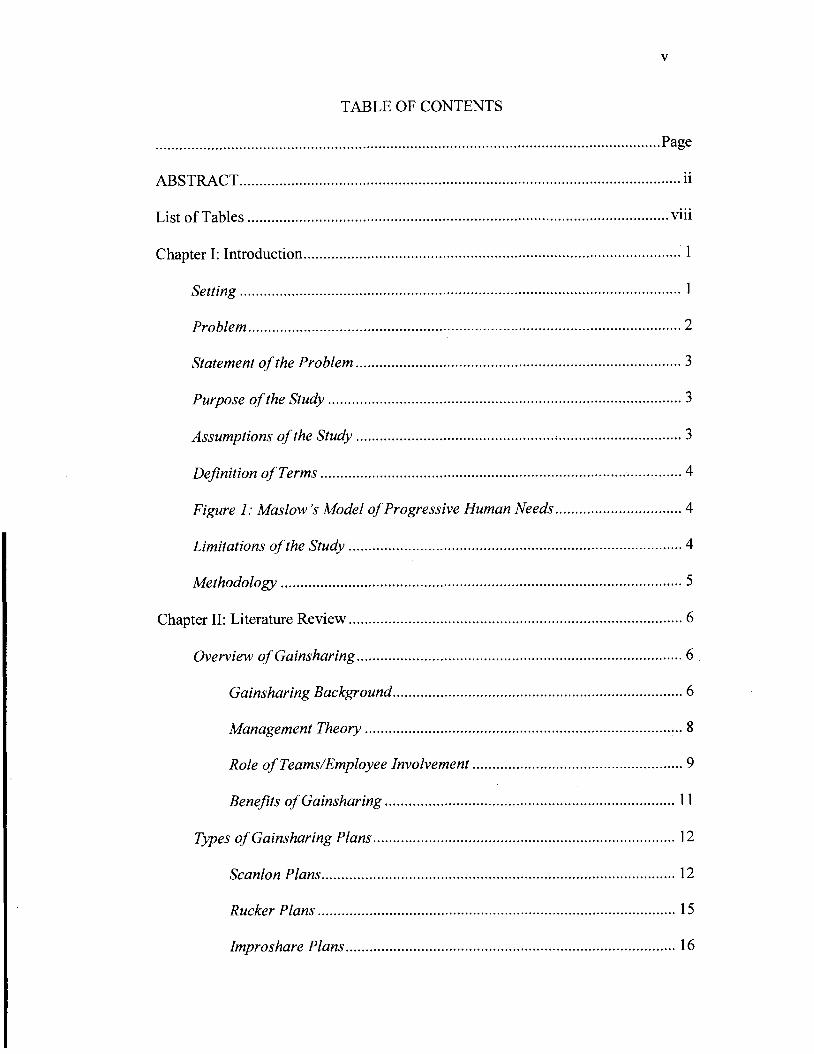
TABLE OF CONTENTS
............................................................................................................................... Page
. . ............................................................................................................... ABSTRACT 11
... .................... ................................................................................. List of Tables .. vlll
Chapter I: Introduction ............................................................................................... 1
............................................................................................................... Setting 1
Problem ............................................................................................................ 2
.................................................................................. Statement of the Problem 3
Purpose of the Study ......................................................................................... 3
.................................................. ............................... Assumptions of the Study 3
........................................................................................... Definition of Terms 4
................................ Figure 1: Maslow 's Model of Progressive Human Needs 4
Limitations of the Study .................................................................................... 4
................................................................................................... Methodology 5
.................................................................................... Chapter 11: Literature Review 6
Overview of Gainsharing .................................................................................. 6
......................................................................... Gainsharing Background 6
................................................................................ Management Theory 8
..................................................... Role of Teams/Employee Involvement 9
Benefits of Gainsharing ......................................................................... 11
Types of Gainsharing Plans ............................................................................ 12
Scanlon Plans ......................................................................................... 12
Rucker Plans .......................................................................................... 15
Improshare Plans ................................................................................... 16
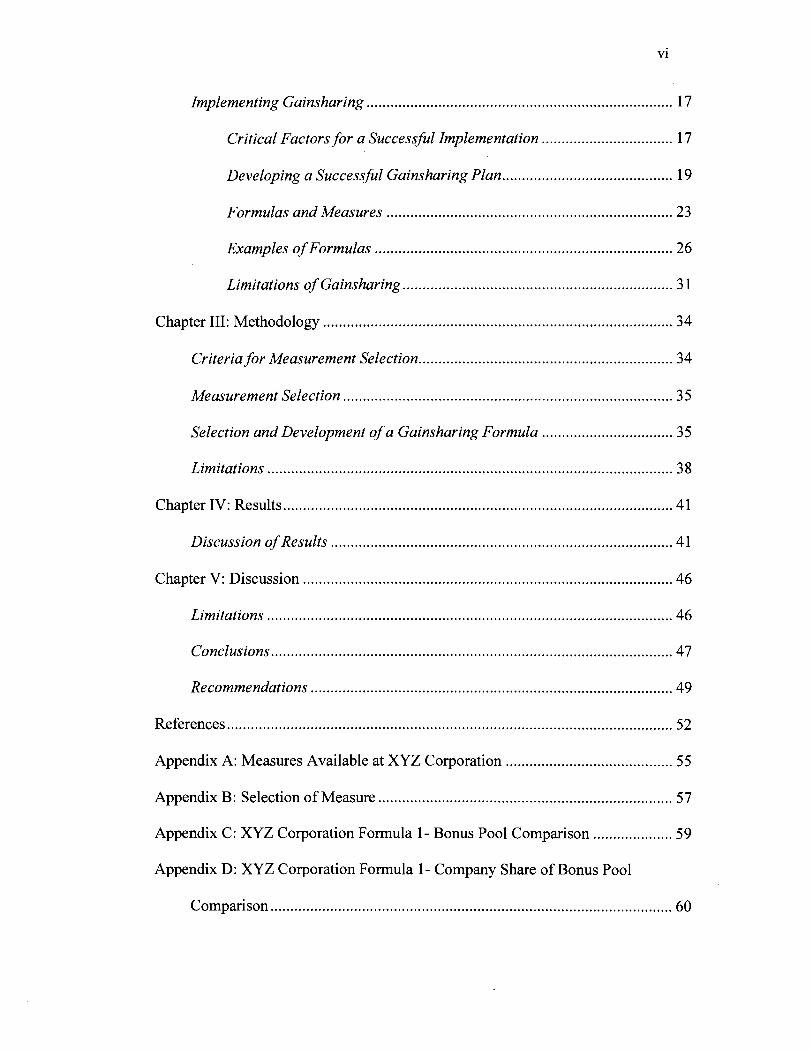
............................................................................. Implementing Gainsharing 17
................................. Critical Factors for a Successful Implementation 17
........................................... Developing a Successful Gainsharing Plan 19
........................................................................ Formulas and Measures 23
Examples of Formulas ........................................................................... 26
Limitations of Gainsharing ................................................................... 31
Chapter 111: Methodology ........................................................................................ 34
................................................................ Criteria for Measurement Selection 34
................................................................................... Measurement Selection 35
.... ............................ Selection and Development of a Gainsharing Formula .. 35
Limitations ...................................................................................................... 38
Chapter IV: Results .................................................................................................. 41
Discussion of Results ...................................................................................... 41
Chapter V: Discussion ............................................................................................. 46
Limitations ...................................................................................................... 46
Conclusions ..................................................................................................... 47
Recommendations ........................................................................................... 49
References ................................................................................................................ 52
Appendix A: Measures Available at XYZ Corporation ........................................ 55
Appendix B: Selection of Measure .......................................................................... 57
Appendix C: XYZ Corporation Formula 1- Bonus Pool Comparison .................... 59
Appendix D: XYZ Corporation Formula 1 - Company Share of Bonus Pool
Comparison ..................................................................................................... 60
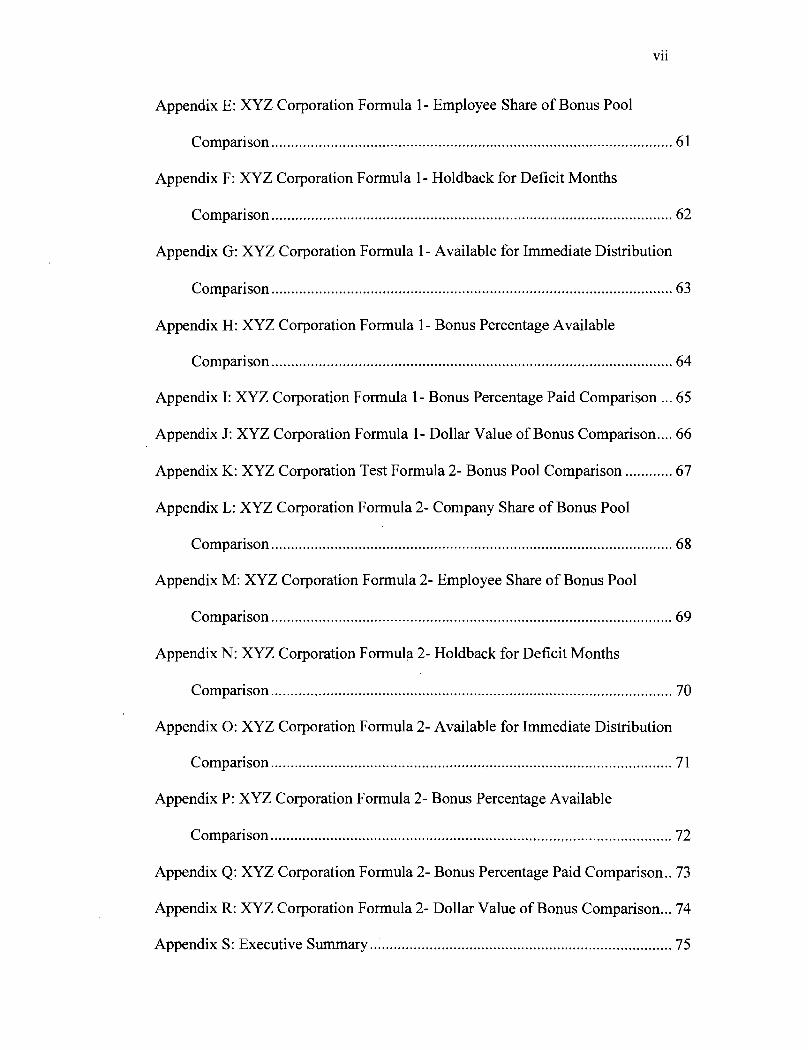
Appendix E: XYZ Corporation Formula 1 - Employee Share of Bonus Pool
Comparison. .. .. .. . . . . . . . .. . . .. . . . . .. . .. .. . . .. . . .. . . . . . . . . . . . . . . . . . . . . . . . . . . . . . . . . . . . . . . . . . . . . . . . . . 6 1
Appendix F: XYZ Corporation Formula 1 - Holdback for Deficit Months
Comparison ..................................................................................................... 62
Appendix G: XYZ Corporation Formula 1 - Available for Immediate Distribution
Comparison ................................................................................................ 63
Appendix H: XYZ Corporation Formula 1 - Bonus Percentage Available
Comparison .................................................................................................. 64
Appendix I: XYZ Corporation Formula 1- Bonus Percentage Paid Comparison ... 65
Appendix J: XYZ Corporation Formula 1- Dollar Value of Bonus Comparison .... 66
Appendix K: XYZ Corporation Test Formula 2- Bonus Pool Comparison . . . . . . . . . . .. 67
Appendix L: XYZ Corporation Formula 2- Company Share of Bonus Pool
Comparison ................................................................................................... 68
Appendix M: XYZ Corporation Formula 2- Employee Share of Bonus Pool
Comparison ................................................................................................. 69
Appendix N: XYZ Corporation Formula 2- Holdback for Deficit Months
Comparison ..................................................................................................... 70
Appendix 0: XYZ Corporation Formula 2- Available for Immediate Distribution
Comparison . .. . . . . .. . . . . . . .. . . .. .. .. . .. .. .. .. .. .. .. . . . . . . . . . . . . . . . . . . . . . . . . . . . . . . . . . . . . . . . . . . . 7 1
Appendix P: XYZ Corporation Formula 2- Bonus Percentage Available
Comparison .................................................................................................. 72
Appendix Q: XYZ Corporation Formula 2- Bonus Percentage Paid Comparison.. 73
Appendix R: XYZ Corporation Formula 2- Dollar Value of Bonus Comparison ... 74
Appendix S: Executive Summary ............................................................................ 75
viii
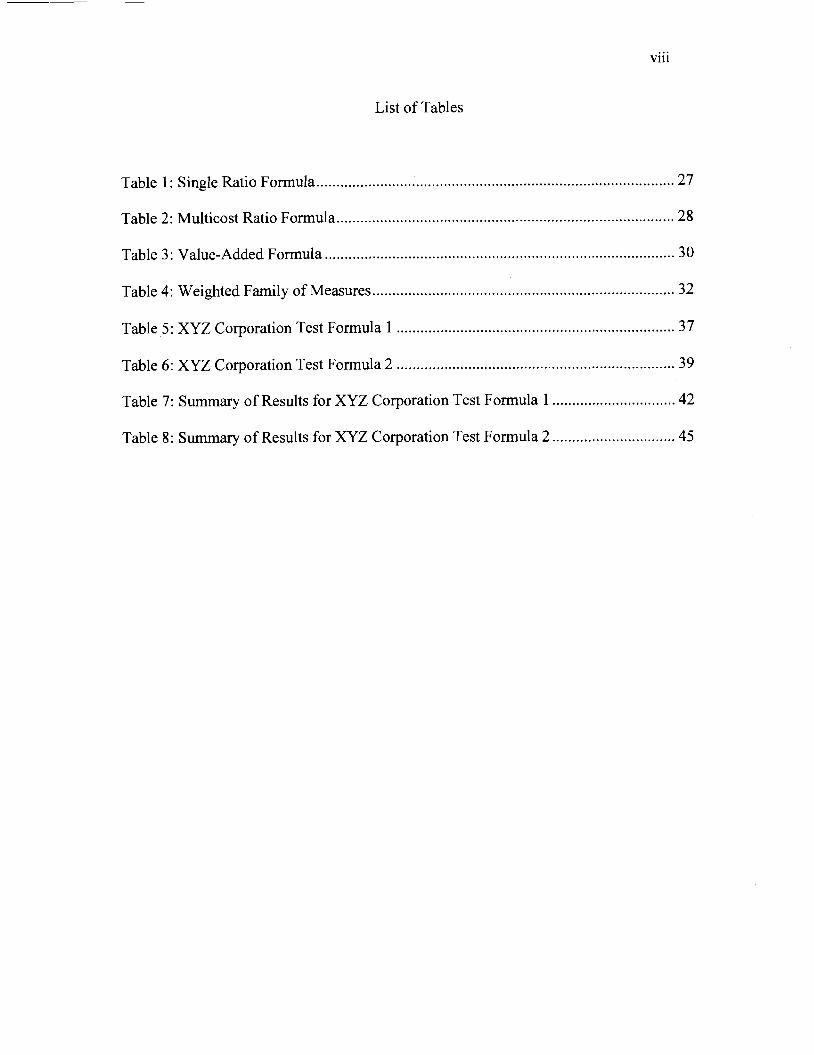
List of Tables
.......................................................................................... Table 1: Single Ratio Formula 27
..................................................................................... Table 2: Multicost Ratio Formula 28
........................................................................................ Table 3 : Value-Added Formula 30
............................................................................ Table 4: Weighted Family of Measures 32
...................................................................... Table 5: XYZ Corporation Test Formula 1 37
Table 6: XYZ Corporation Test Formula 2 ...................................................................... 39
............................... Table 7: Summary of Results for XYZ Corporation Test Formula 1 42
............................... Table 8: Summary of Results for XYZ Corporation Test Formula 2 45
Chapter I: Introduction
Setting
XYZ Corporation, Inc. is a mid-size manufacturer of classroom computer
furniture and point-of-purchase displays located in Northwest Wisconsin. There are two
buildings encompassing three separate plants. Plant 1 is a metal fabrication shop
consisting of sheet metal, tube punching and drilling, welding, and powder coating
capabilities. Plant 2 includes a rough mill, finishing, product assembly, packaging, and a
finished goods warehouse. Plant 3 is a panel fabrication shop with panel lay-up, panel
saw, Computer Numeric Controlled (CNC) router equipment, edge banding technologies,
and small assembly functions. Recently a new building was purchased with the intent of
moving Plant 1 and product assembly of Plant 2 into the new facility. Once the move is
complete the buildings will total approximately 300,000 square feet.
XYZ Corporation's business flow is heavily seasonal in the months of June, July,
and August with 40 - 45% of deliveries occurring in these three months. Make to stock
items and modified products account for approximately 85% of sales. These are spread
over 2000 end items with 75% of sales coming from the top 100 products. However,
monthly sales of each of the top 100 vary considerably from month to month. Over the
past four years sales have continued to grow to a total of $21 million this past year.
Conversely, the net profit has continued to decline over the same four years. In addition,
to meet the demands for the summer an extraordinary amount of overtime was put in by
the workforce. Even with this overtime, XYZ Corporation failed to meet the delivery date
on numerous occasions. To support the sales volume XYZ Corporation employs a total of
180 full-time employees, which includes 80 direct labor employees and 20 crew-leaders
on the production floor.
Problem
XYZ Corporation is a functionally structured organization and experiences many
of the difficulties associated with that structure. Each plant, and each department within
that plant, is more concerned with getting the job out of their area and passing it along to
the next plantldepartment with little concern of the affect on the overall job. Currently,
XYZ Corporation has no formal incentive system and limited measures are visible to the
employees. Suggestion programs are in place, but they are loosely structured, tracked,
and maintained. The two main vehicles for an employee to get their suggestion heard are
the Engineering Change Request (ECR) and an Employee Suggestion form. Both forms
must be passed through various departments for approval with limited involvement from
the employee who filled out the form. The forms may take days, weeks, or even months
to make their way through the various departments before any action, if any, is taken on
the suggestion. This has created a culture in which the employees show low morale, a
lack of motivation, and no risk taking. Many employees do not know the direction or
objectives of the organization and therefore, do not know where and how improvements
should be made.
The nature of business has changed; it has become one of ongoing and heightened
levels of competition, which demands flexibility, delivery speed, and innovation (Brown
& Bessant, 2003). If XYZ Corporation is to remain competitive in these changing times
they must be able to unleash the power of their workforce in hopes of not only surviving,
but thriving. It is what people throughout the organization do on a daily basis that
determines how successful the organization can be (Wilson, 1995). In order to utilize the
talents of its workforce, management must believe that the success of the organization
lies with their people. Ultimately, management must work towards creating conditions
that utilize the workforce by valuing, empowering, and allowing them to share in the
success of the organization. Gainsharing is one philosophy that sets out to achieve these
goals.
Statement of the Problem
Given the above setting and problem, the purpose of this study is to determine
what is required for a successful gainsharing plan, define an implementation procedure,
and develop and test a gainsharing formula specifically for XYZ Corporation, Inc.
Purpose of the Study
The objectives of this study are to:
1. Review gainsharing plans and formulas through literature review
2. Define the characteristics of a successful gainsharing program
3. Provide an implementation procedure for a gainsharing program
4. Develop a gainsharing formula for XYZ Corporation, Inc.
5. Test a gainsharing plan for XYZ Corporation, Inc.
Assumptions of the Study
The assumptions of the study are:
1. That gainsharing and the management philosophy associated with it are
vital to an organizations success.
2. The results of this study can be used by companies of different sizes,
industries, and regions.
3. That XYZ Corporation, Inc. will provide the necessary information
required to complete the study.
Definition of Terms
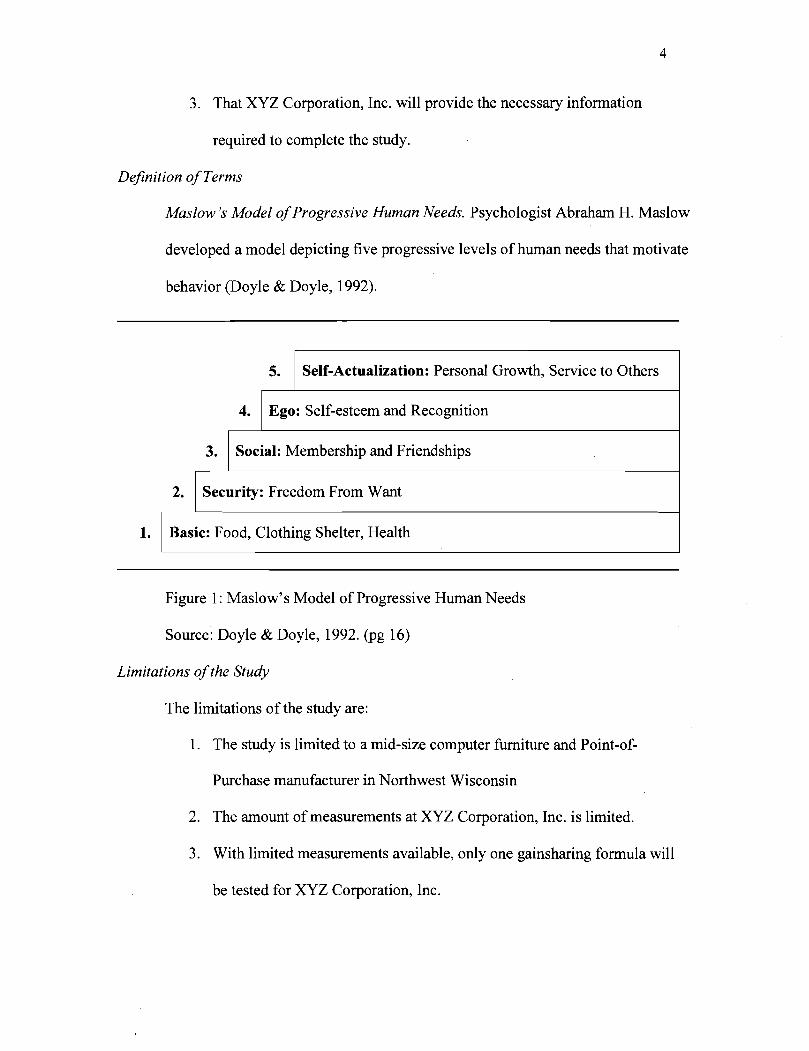
Maslow S Model of Progressive Human Needs. Psychologist Abraham H. Maslow
developed a model depicting five progressive levels of human needs that motivate
behavior (Doyle & Doyle, 1992).
5. 1 Self-Actualization: Personal Growth, Service to Others
Figure 1 : Maslow's Model of Progressive Human Needs
Source: Doyle & Doyle, 1992. (pg 16)
Limitations of the Study
The limitations of the study are:
1. The study is limited to a mid-size computer furniture and Point-of-
Purchase manufacturer in Northwest Wisconsin
2. The amount of measurements at XYZ Corporation, Inc. is limited.
3. With limited measurements available, only one gainsharing formula will
be tested for XYZ Corporation, Inc.
4. Ego: Self-esteem and Recognition
3. Social: Membership and Friendships
2. Security: Freedom From Want
1. Basic: Food, Clothing Shelter, Health
Methodology
The methodology used in this study will include research of literature on
gainsharing plans, their successes and failures, management theory, formulas used, and
limitations. Once this information has been obtained, a list of measures from XYZ
Corporation will be acquired, criteria will be created, and the measures will be pared
down to one for use in a gainsharing formula. After a measure has been selected, a
formula will be chosen, developed, and tested. A baseline will be created utilizing
historical information from the previous twelve months of the organization. Once the
baseline has been set, scenarios will be tested to determine the bonus percentage if a
gainsharing plan was in place. Finally, conclusions will be drawn about the validity of the
formula, future recommendations for fiuther study, and future steps for XYZ
Corporation.
Chapter 11: Literature Review
The purpose of this study is to determine what is required for a successful
gainsharing plan, define an implementation procedure, and develop and test a gainsharing
formula specifically for XYZ Corporation, Inc. Through a review of literature this study
will provide a definition of gainsharing, the characteristics of a successful gainsharing
program, various gainsharing plans, example formulas, and an implementation procedure.
Overview of Gainsharing
Gainsharing Background. Gainsharing is a philosophy of incorporating employee
participation, recognition, problem identification, and accountability while improving
personal and organizational performance (Band, Scanlan & Tustin, 1994). It is a group
incentive bonus plan that requires employee involvement in determining how to improve
the performance of the group or organization by better utilizing resources (Thor, 1993).
Any gains in productivity andlor cost reductions during a given time period are shared
between the organization and the workers (Band, Scanlan & Tustin, 1994). The term
"gainsharing" was actually coined by Frederick Taylor, the father of scientific
management, who was an advocate of this sharing. Currently, an estimated 26 percent of
organizations within the United States use some form of gainsharing with 73 percent
being implemented since 1980 (Roy & Dugal, 2005). Management practices, employee
involvement, and shared rewards make up the three key components in all gainsharing
programs (Doyle & Doyle, 1992).
Profit-sharing plans are the earliest form of a gainsharing program and are solely
based on financial incentives (Doyle & Doyle, 1992). Prior to Social Security, profit
sharing plans had success meeting Maslow's level 2 (see Figure 1) by providing the
security that employees required. Once this need was met by Social Security profit-
sharing had lost its motivational power for two reasons. First, employees will not be
motivated today for a payment that may be months away (OYDell, 1981). Second, there is
no connection between effort and reward making it difficult for an employee to see how
their performance can affect the overall profit of an organization. Conversely, profit
sharing plans do provide motivation to top managers who have more control over the
variables which affect profit. Since gainsharing provides motivation to the employees that
have an effect over productivity and profit sharing provides motivation to top managers
the plans are able to coexist.
Overall, gainsharing has been instrumental in the evolution of management
systems transforming them from individual incentive systems focused on improving
output and reducing costs to a system of participative management and shared group
incentives (Doyle & Doyle, 1992). While compensation is part of a gainsharing program,
the dramatic change will be to a participative and cooperative culture and a focus on
processes as much as products (Band, Scanlan & Tustin, 1994). Any reward system is an
important tool that can be used to achieve the responses that are rewarded (O'Dell, 198 1).
Feedback, not the financial aspect, then becomes the primary advantage of the
gainsharing plan (Doyle & Doyle, 1992). The size of the bonus indicates how successful
the employees were at making improvements, and frequent bonuses will allow for faster
responses to improvement ideas. The frequency at which the reward pays varies; most
plans will pay monthly, some organizations pay their bonuses on a quarterly basis, while
other plans pay on a weekly basis. However, most gainsharing formulas account for a
portion of the bonus to be set-aside for months with losses. Any funds that are remaining
at the end of the year are then distributed to the employees.
Management Theory. With increasing global competition, it is becoming
progressively more important that American organizations continue to look for ways to
improve their productivity (Belcher, Jr, 1993). The traditional way of managing
American organizations with an autocratic style and communication on a "need-to-know"
basis are no longer effective in the global economy. If an organization is to implement
gainsharing, they must look at their management practices to ensure they are supportive
of the gainsharing philosophy (O'Dell, 198 1). If employees can not have an influence on
their area because an autocratic style of management exists the motivational factors of
gainsharing will be rendered useless (Belcher, Jr, 1993).
By 196 1, Rensis Likert identified four management styles ranging from
authoritarian to participative (Doyle & Doyle, 1992). The Authoritarian style is military
based style of top-down chain of command. With this style, top management makes the
decisions and the workers are expected to carry out the orders; employee ideas and
problem solving need not apply. The Paternalistic style is very similar to the top-down
Authoritarian style. With this style, there may be some signs of employee involvement,
such as suggestion boxes, but they are not very effective. Employees may find this style
the most difficult to be creative in. A third style, Consultative, begins to involve
employees as managers ask for ideas and opinions, but make the final decision. This style
of management can be effective for a time, but as a greater number of workers are
striving to reach Maslow's Levels 4 and 5, a Participative management style is required.
A Participative style is characterized by managers actively seeking employee ideas, more
authority delegated to work teams, teamwork, and high performance. In an organization
that practices Participative management, employees are better trained and informed on
such things as the mission and strategic objectives of the organization and how their work
is part of a team and contributes to the organization as a whole. The management
philosophy is centered on a feeling of respect and trust in the employees' capabilities and
their motivation to contribute towards the good of the organization (Margulies & Kleiner,
1995). Both Douglas McGregor and Rensis Likert regarded the Participative management
style as the one best way to manage employees (Collins, 1998). If a gainsharing plan is to
be successful management attitudes and behaviors must embrace the participative style
(Band, Scanlan & Tustin, 1994).
Role of Teams/Employee Involvement. Employee involvement is an integral part
of most gainsharing programs and can take the form of suggestion programs, suggestion
committees, quality circles, and work teams (Doyle & Doyle, 1992). It is participative by
nature with the overall goal of utilizing the knowledge of the worker and aligning their
behavior and actions with organizational goals (Cotton, 1993). Three approaches
typically found to gain employee involvement are parallel suggestion programs, job
involvement, and high involvement (Lawler 111, 1993). All three approaches have varying
degrees of moving information, rewards, knowledge, and power to the lowest level
possible.
Parallel suggestion involvement programs' form problem-solving groups and do
the least to move information, rewards, knowledge, and power to the lowest level (Lawler
111, 1993). Within these groups the employees may be asked what improvements are
needed, but are powerless to implement their suggestions. Quality circles are an example
of parallel suggestion involvement programs and represent a minor change in
organizational structure. If the reward structure is not changed to support the parallel
suggestion involvement program it may be seen as a program, lose its momentum, and
disappear.
Job involvement focuses on ways that will motivate employees to achieve better
job performance (Lawler 111, 1993). An organization can create job involvement in one of
two ways, either through individual job enrichment programs or through creating work
groups or teams. Individual job enrichment programs give the employees feedback,
increases their influence over how their work is completed, and requires them to use an
assortment of skills. Work groups or teams have the same characteristics, but involve a
number of people who are all working towards the same goal, hold themselves mutually
responsible, and are responsible for their results (Zobal, 1998). In this instance, the group
is able to make decisions that individuals cannot (Lawler 111, 1993). In order for teams to
be successful, a great deal of attention, training, and support must be given to team
leaders (Trent, 2003). With employees receiving more information, power, and skills, a
significant change in the fundamental operations of an organization is required (Lawler
111, 1993).
High involvement is the third approach and entails total employee involvement in
which employees acquire a sense of involvement with the organization and how it
performs overall (Lawler 111, 1993). In the high involvement approach, much of the
aspects of the previous two approaches are evident, but employees are also involved in
decisions relating to strategy and other major organizational decisions. This type of
approach would require a total redesign of the control-oriented organization and proves to
be extremely difficult. Because of this drastic change, this approach is generally seen in
new start-up organizations. Gainsharing can be the first step in employee involvement as
the organization transforms their level of employee participation from suggestion boxes
to work teams (Cotton, 1993).
BeneJits of Gainsharing. The benefits realized by implementing a gainsharing
program typically fall into the categories of cognitive benefits and affective benefits
(Kim, 2005). The cognitive benefits seen from of a gainsharing program relate to
productivity improvements. Some organizations report tenfold improvement in their
defect rates while reducing their repair costs by half (Band, Scanlan & Tustin, 1994). A
typical quality and productivity improvement for a company under $100 million has
averaged 17.3 percent per year (Boyett & Boyett, 2004). Other cognitive benefits realized
by the organization include better production processes, new tools and machinery, and
significant cost savings (Collins, 1998).
Improving employee morale, increasing job satisfaction, a reduction in
disciplinary actions, turnover, and absenteeism are some of the affective benefits realized
by an organization and are generally skewed towards benefits related to organizational
effectiveness (Kim, 2005). Other affective benefits that organizations generally realize
are aligning behaviors with organizational goals and the attraction and retention of
employees (Roy & Dugal, 2005). Since the organization may actually benefit from losing
poor performing employees the structure of the reward system should be designed to
maintain and reward the highly motivated employees. A well-designed gainsharing
program should also promote the development of communication and decision making
skills and make it easier to identify employees with managerial and leadership potential
(Band, Scanlan & Tustin, 1994). By rewarding improvements, gainsharing plans will still
allow organizations to recognize employees with managerial and leadership potential
without having to increase their formal status through promotion. By structuring the
reward system and measures correctly, an organization can reinforce the message of a
participative and cooperative culture while creating alignment to their strategic goals and
unleashing the intelligence, creativity, energy, and commitment of their workforce.
Types of Gainsharing Plans
Scanlon Plans. The best-known gainsharing plan was developed by Joseph
Scanlon in 1938 at Empire Steel and Tin Plate Company (Doyle & Doyle, 1992). From
its inception up until 1960 small, family owned operations implemented the greatest
share of Scanlon plans (O'Dell, 198 1). During the 1960's organizations moved towards
participative management as its own goal and interest in Scanlon plans declined. As
international competition grew during the 1970's, and organizations looked to reduce
labor costs, interest in gainsharing programs in large companies began to gain momentum
(O'Dell, 1993). Though Scanlon plans remained relatively unchanged for the first 20
years, organizations will now typically use different participation systems and additional
productivity measures to allow for the best fit for their organization (Doyle & Doyle,
1992).
Even though there are various types of Scanlon plans, all are based on a
participative management philosophy, worker involvement, and a group reward system
(O'Dell, 1981). According to O'Dell(1981), the basic principles of the Scanlon plan are
closely linked to the management philosophy of Douglas McGregor's Theory Y, which
are:
a The expenditure of physical and mental effort in work is as natural as play or
rest.
a External control and the threat of punishment are not the only means for
bringing about effort toward organizational objectives. People will exercise
self-direction and self-control in the service of objectives to which they are
committed.
a Commitment to objectives is a function of the rewards, tangible and
intangible, associated with their achievement.
a The average human being learns under proper conditions, not only to accept
responsibility but also to seek it.
a The capacity to exercise a relatively high degree of imagination, ingenuity,
and creativity in the solution of organizational problems is widely, not
narrowly, distributed in a population. (pgs. 26-27)
The degree to which a gainsharing program is successful is related to the amount of effort
an organization puts into formalizing the participative management philosophy (Doyle &
Doyle, 1992). Once formalized, management will have moved away from the
authoritarian style of control, understand that their employees have good ideas for
improving performance, and fully believe in Theory Y principles. Management will also
encourage their employees to learn, grow, and develop as human beings (Cotton, 1993).
Thus, a Scanlon plan is not only a program, but becomes a way of life within the
organization.
Worker involvement is generally formalized through the formation of two
committees; a productivity committee and a plant or screening committee (Doyle &
Doyle, 1992). The department supervisor and three to seven non-management employees
who are elected by their fellow employees will make up the productivity committee
(Collins, 1998). This committee is charged with collecting and evaluating suggestions
from other non-management employees regarding improvements in quality, productivity,
and quality of work life. A secondary function of the production committee is to analyze
any production related problems and communicate any changes that may affect the
department (07Dell, 198 1). In order to implement the idea the productivity committee
must accept the proposal, have it fall within their allowable budget, and it must not
directly affect another department (Collins, 1998). In a majority of organizations the
productivity committee meets monthly, however, it may be important to meet on a more
frequent basis when the plan is first introduced (OYDell, 198 1). Ideas that are rejected or
fall outside the limits of the productivity committee are passed along to the plant
committee (Collins, 1998).
The plant committee is typically made up of one elected individual from each of
the productivity committees and an equal number of high-level managers as appointed by
management (Collins, 1998). The plant committee has two functions; review all
suggestions that are forwarded from the productivity committee and communications
(Doyle & Doyle, 1992). The review of all rejected ideas creates an automatic appeals
process by allowing management to see additional potential in a suggestion that the
productivity committee may not have seen. If both committees reject a suggestion the
reasons must be explained to the employee. In addition to reviewing the suggestions the
plant committee, through the representatives of the productivity committee, also
communicates back to the organization issues concerning monthly productivity results,

gainsharing results for the month, and any other relevant information about the business.
The reasons a bonus was or was not earned must be communicated back so employees
will continue the attitudes and behaviors that resulted in the increased productivity.
In order for a Scanlon plan to function, management must be able to measure
productivity, the improvements that are made in productivity, and then calculate a bonus
based on those measurements (O'Dell, 1981). The formula is commonly set up to
compare the expected costs for the month versus the actual costs for the month (Collins,
1998). In general, the expected costs are determined by performing a historical analysis
of the previous three to five years of the organizations performance. A typical Scanlon
plan will measure labor costs as a percentage of the sales value of production (Doyle &
Doyle, 1992). However, other organizations have made modifications to the
measurements in the typical Scanlon plan. Some organizations will also include the cost
of tools and materials. Any gains that are seen are split between the employees and the
organization at some agreed upon percentage (Collins, 1998). A percentage of the
employees share is set-aside in a reserve fund to cover months where actual costs
exceeded expected costs. Any money left over in the reserve fund at the end of the year is
paid out to the employees. Bonuses of 10% to 15% are not uncommon and it is
recommended that all employees, including managers, take part in the same bonus plan
(Cotton, 1993).
Rucker Plans. Approximately the same time Joseph Scanlon was developing his
gainsharing program Allan Rucker was working on a gainsharing program that was based
on the value added by manufacturing (Doyle & Doyle, 1992). Rucker plans use a
measure of productivity called production value, which is the difference between the
sales value of goods produced and the costs incurred to manufacture the goods (O'Dell,
1981). This measure is expressed as a ratio and has been determined to remain a constant
percentage despite the variations in costs and selling prices (Doyle & Doyle, 1992). In
order to obtain this ratio accounting records for the previous three to five years should be
studied (O'Dell, 1981). Once this measure is found it becomes the Rucker standard that is
used to determine the bonus pool (Doyle & Doyle, 1992). A bonus is paid when
employees reduce costs or increase output and their actual costs fall below the Rucker
standard. Like the Scanlon plan, the bonus is paid monthly as a percentage of the
employee's regular pay and a reserve is set aside to cover months with a loss; whatever
remains at the end of the year is paid to the employees. Originally Rucker plans did not
include participative management and employee involvement, though these practices
were later added and borrowed from Scanlon plans (Cotton, 1993). Overall, compared to
a Scanlon plan, the Rucker formula is more difficult for the employees to understand and
it must be recalculated every five years to update the standard (Doyle & Doyle, 1992).
Even though most new gainsharing plans implemented include the ratio of labor costs to
value added they are rarely Rucker plans.
Improshare Plans. A third gainsharing program, Improshare (Improved
Productivity Sharing), was developed by Mitchell Fein in the mid-1970's and is deeply
rooted in industrial engineering practices of standard hours required to produce a product
(Doyle & Doyle, 1992). Improshare was created with the purpose of correcting the faults
intrinsic in individual incentive systems (O'Dell, 1981). It moves the focus from number
of pieces produced by an individual worker at his station to the overall productivity of the
work team. Improshare plans base their calculations on standard direct and indirect hours
required to produce a unit of product (Doyle & Doyle, 1992). This type of plan can be
aimed at a specific department or at the plant level (Cotton, 1993). As employees make
improvements to their throughput of product, the time required to produce a product will
drop (Doyle & Doyle, 1992). The difference between the standard and the time it took to
produce a product is the bonus, which is split 50-50 between the organization and the
employees. The bonus is based on a running four-to-six week average and is paid weekly
as a proportion of their hours worked; therefore, no reserve fund is required. The
company can buy back the Improshare standard if there are significant improvements
made and sustained in productivity. Generally, this is done by paying a substantial bonus.
If new equipment is purchased, the organization can only reduce the standard by 80% of
the gains made by the equipment purchase. The remaining 20% is split between the
organization and the employees. Contrary to Scanlon plans there is no employee
involvement program, even though a suggestion system is generally borne out of
necessity (OYDell, 198 1).
Implementing Gainsharing
Critical Factors for a Successfil Implementation. There are three critical success
factors that lead to a successful gainsharing program (Brown, 1995). First, the
gainsharing plan must be part of the overall goals and objectives of the organization and
not implemented because "everybody else is doing it." The gainsharing plan should be
custom tailored to support the overall objectives of the organization and to ensure that the
measurement system is designed to create alignment in achieving the desired culture
(Zobal, 1998). In order to create a customized plan the organization must understand their
culture, business strategy, and desired behaviors. Once these are understood the
organization can begin designing a reward system that fits their objectives. It is crucial
that the reward system be set up so the employees are able to influence the measurements
that lead to the reward (Zobal, 1999).
Even if an organization has a plan that is linked with their overall goals and
objectives, this alone will not ensure success (Brown, 1995). The second critical factor
for success is the employee involvement system. This includes having the employees
involved in defining the plan and also having a formal involvement system once the plan
has been implemented. The success of the plan is based more on the way the plan is
developed, implemented, and operated than the actual design of the plan. Having the
employees take part in designing the plan will help create buy-in and ownership of the
system. The only way to accomplish this is to have top management initiate and support
the involvement process and define the guidelines for empowerment (Margulies &
Kleiner, 1995). The employees must be allowed to feel a sense of ownership and be able
to make decisions that affect their area.
The third and final critical success factor of a successful gainsharing plan is
defining the team and relating the reward to the appropriate level of team (Brown, 1995).
In order to form teams successfully they must receive proper training, share a vision and
common values, a sense of faith in the employees must be present by management, and
the culture needs to be supportive of risk taking and the failures that may coincide with it
(Margulies & Kleiner, 1995). When first introducing teams the team may be responsible
for developing a limited set of performance standards and the measurements required to
determine how well they are meeting their standards (Thorne & Smith, 2000). The team
may also set up a process for handling group decisions and elect their team leaders.
Proper training of the team members is an integral part throughout the entire team
building process. Once the team has been in place and operating for a period of time, they
may have their responsibility increased in collecting data for key performance areas. In
order for this to be accomplished the team may require some advanced training in
numeric, literacy, and computing skills. The team may also analyze and revise their
performance measures, improve their planning skills to include maintenance and
production flow issues, increase their knowledge of plant profit, and become empowered
to recruit new members into the team.
Once the team demonstrates an understanding of collecting data for their key
performance areas their responsibilities may be increased to include more elaborate use
of information. Now their responsibilities may include analysis to eliminate quality
problems, set weekly production goals, and obtain the information required to understand
the resources they control. The team may also take on additional responsibilities related
to human resources. At this time the team may be allowed to interview new team
members, take initial disciplinary actions, and assist in setting up standardized training
for team members. As teams progress, they can be given the responsibility to work with
suppliers to eliminate any non-value-added activities in the supply process. The human
resource aspect may also be increased to now include performance appraisals of team
members and improve safety standards. The fully developed self-directed work team may
be responsible for looking after long-term budgets, controlling their spending to meet the
budget, seeking any external training, and making decisions related to compensation.
Developing a Successful Gainsharing Plan. There are five phases an organization
must go through in order to successfully implement a gainsharing plan (O'Dell, 1981).
The five phases are: Exploration, Diagnosis, Planning and Design, Action, and
Evaluation. During the exploration phase an organization must acknowledge a need to
change. The need to change could range from the survival of the organization being
threatened to top management's belief in the Theory Y form of management. At this time
management should be collecting information in order to understand gainsharing and
how it can apply to their organization. Once top-level interest has been gained resources
should be made available to do a diagnosis or feasibility study of implementing a
gainsharing plan (Boyett & Boyett, 2004).
The diagnosis phase will include the formation of a task force to evaluate the
organizations culture, business objectives, management philosophy, and perform a
costshenefits analysis (O'Dell, 198 1). The president, plant manager, controller, human
resources manager, and at least three other representatives from other areas of the
company form the best make up of the task force. If the task force decides that the project
should move forward a feasibility study needs to be performed. The feasibility study will
focus on strategic direction, the potential for gains, top management attitudes,
organizational dependencies, and organizational climate (Boyett & Boyett, 2004). By
interviewing top management, gainsharing can be evaluated to ensure that it is put in
place to achieve the strategic goals of the business. When researching the potential for
gains the focus is on identifying critical performance measures that should be emphasized
in the gainsharing formula. After the critical performance measures are identified data
needs to be gathered about current performance levels, targets, and the potential for any
gains. As the feasibility study continues, top management and other key employees'
attitudes need to be assessed to ensure they embrace gainsharing and the participative
management philosophy. It is imperative that management has a philosophy consistent
with a participative style or, at least, has a strong commitment to gainsharing with
managers and supervisors that are willing to try it (O'Dell, 1981). If the plan is to succeed
the employees need to be surveyed, be willing to function in a participative environment,
and have a level of trust exist with management. In studying the organizational
dependencies, the feasibility study will review current operating procedures and process
flows (Boyett & Boyett, 2004). This will look at the degree of teamwork and cooperation
that exists between functions and how much they are related to performance. It will also
assess the manufacturing process to best determine what formula may be used (O'Dell,
198 1). The final step in the feasibility study is reviewing the organizational climate
(Boyett & Boyett, 2004). The climate assessment will provide a gap analysis between the
beliefs required for a successful gainsharing plan versus the current practices and may be
expanded to include organizational size (O'Dell, 1981). Large organizations may have to
divide their gainsharing schemes by division, while small organizations may be able to
implement a plan company wide. In addition, people in small organizations can more
easily make a connection between their behaviors and the performance of the
organization. Once the feasibility study is complete the task force can make a
recommendation to move forward with the plan or postpone it until any corrective actions
are completed (Boyett & Boyett, 2004).
Once the task force makes a recommendation to move forward the team then
moves into the planning and design phase (O'Dell, 1981). During this phase the task
force may grow to include functional managers and possibly some employee
representatives. The objectives of this phase are to figure out many of the details and
create a gainsharing design document (Boyett & Boyett, 2004). The purpose of the
document is to address the issues of implementation, operation, and maintenance of the
system. One of the first steps the task force will focus on will be creating a timeline
identifying all of the necessary activities that are required to meet the date set for
implementation. It becomes extremely important that the task force concentrate on
implementing gainsharing during a period when productivity is most likely to increase.
This is done to gain some early wins and build momentum in the system. Some additional
details the task force must address in the document will be outlining the objectives of the
plan and creating an outline of the function and structure of the teams. The details of the
formula, including the eligibility requirements, payout period, and provisions for the
reserve fund all need to be defined during this stage. A set timeline, usually one year, is
included into the document to allow for a formal review of the plan and to make a
decision to continue, modify, or abandon the plan. The final detail to include in the
document is a provision for adjustments due to unforeseen events such as new equipment
purchases, a change in the product line, or new technologies that have been added. This
provision should state how any gains made from these events will be divided between the
employees and the organization and what the effect will be on the productivity standard.
Once the document is complete the task force must resubmit the document to top
management for their final approval.
After the plan has been developed and top management has given their approval,
the task force must move into the action phase (O'Dell, 1981). It is in the action phase
that the task force must secure employee approval. This can be accomplished utilizing
informational programs and meetings explaining the benefits for all involved in the
process (Boyett & Boyett, 2004). It is crucial that the employees understand the
productivity-sharing emphasis of the plan and that management will not manipulate the
formula for the company's benefit. Including test calculations and a summary of the key
features are beneficial. It is recommended that all employees be allowed to vote for the
approval of the implementation plan. Once the employees vote and approve the plan, the
task force must act quickly to establish the productivity and plant committees.
Since it takes time to establish new processes and attitudes it is a wise decision to
evaluate the effectiveness of the program at periodic checkpoints (O'Dell, 1981). The
difficulty of this phase is trying to fully ascertain if people are doing or behaving any
differently, if the different behaviors have helped, or if the changes are even from the
implementation of the program (Gross, 1995). The best way to begin to evaluate the
program is by having discussions with the employees to determine if they understand the
plan. A second indicator of the plans success is the number of suggestions and suggestion
implementations coming from the employees. After a period of six months the task force
can check to see if any bonuses have been paid to the employees (O'Dell, 1981). After
one year, the task force will then be able to analyze the programs performance in
accordance to the gainsharing design document that was created during the planning and
design phase (Boyett & Boyett, 2004).
Formulas and Measures. The gainsharing formula must be created with the notion
of getting what you measure (Thor, 1999). Organizations will typically know the final
results they want to achieve (i.e. increased profits, higher growth, etc.), but these
measurements are too far away from the employees to affect. Therefore, the gainsharing
formula should consist of measurements that will act as drivers towards the final results.
Performance measures generally make up the gainsharing formula because they are easier
for the team to affect and fall within their "line of sight" (Gross, 1995). Some common
performance measures consist of labor productivity, customer measures, and process
quality (Thor, 1999). Labor productivity, as a relationship of labor input and physical
output, was the original measurement in gainsharing formulas and is commonly used
today. Some other forms of labor productivity may include material productivity, floor-
space productivity, and inventory turnover.
Customer measures can be either gathered internally or collected with the
assistance of the customer's themselves. Some of the internally derived customer
measures may include on-time delivery, warranty costs, rejects and returns, and mis-
shipments and incompletes. Externally derived customer measures may include
satisfaction survey scores, quality ratings and awards, and market share. However, these
measures are difficult to gather and even harder for the employees to have a direct impact
on.
Process quality measures deal with waste in the manufacturing environment.
Unplanned scrap, rework, unplanned machine downtime, and process interruptioddelay
time are all examples of process quality measures. Working conditions are another
performance measurement that could be used in the gainsharing formula. These
measurements are difficult to quantify the importance a unit of improvement has and may
require some flexibility to include them in the formula. Examples of working conditions
measures include safety results, 5 s audit results, and team participation rates. Because it
is too far away from the employees, profitability is a measure that is rarely used in
determining the gainsharing formula. However, net profit or return on investment could
be used to control the distribution of the pool to ensure that a bonus is not paid out in
months when the company lost money but gains in the performance measures were
realized. Once the measures are in place, an effective gainsharing formula must also meet
the following criteria (Boyett & Boyett, 2004):
The formula must be fair to the company by being a true measure of
performance over time and working towards achieving the strategic objectives
of the organization. The formula must benefit the company when gains are
made and protect the company during a down period.
The formula must be fair to the employees and they should be able to make a
difference by modifying their behavior.
The employees must be able to understand how the formula works and how
their behaviors will affect the outcome of the gains.
The calculations must be easily made and based on information that is
available on a timely basis.
The formula must be flexible to accommodate changes in company goals,
objectives, and priorities.
The formula should help direct the attention of the employees to problem
areas.
To complete the development of the formula a baseline must be established from
which to calculate gains. A historical baseline is typically calculated using the average
performance from the previous six months to as much as five years. If poor historical data
is available, the organization may look at utilizing a rolling average for the gainsharing
baseline. This is accomplished by dropping the oldest month and adding a new month to
calculate a new baseline. A second method for calculating a baseline is to utilize a target
baseline. When utilizing a target baseline, a bonus is not paid until a certain target level is
achieved. Once the baseline is set consideration should be given to keeping the baseline
fixed and basing all future gains from the same base, or to utilize a rolling average by
allowing the base to change over time.
Examples of Formulas. The single ratio formula (see Table 1) is a simple Scanlon
formula that calculates a ratio of labor costs to the sales value of production during a base
period (Boyett & Boyett, 2004). This becomes the base ratio which is then used to
determine an allowed payroll cost for the current period. In the example, even though the
actual payroll costs were higher than the base period labor costs a bonus was still earned.
This is accomplished because the allowed payroll costs for the month are 20% of the
value of production. The bonus is then calculated by comparing the actual labor costs to
the allowed labor cost for the month. The amount of the employee share is 75% of the
bonus pool from which 25% is held back for deficit months to protect the company from
short-term spikes in productivity. Each employee would then receive a bonus check
worth 10.45% of their total wages, including overtime. This formula works best when the
base ratio remains constant over long periods of time and sales prices and labor costs do
not change at different rates.
A split ratio formula can be used to overcome some of the limitations of the single
ratio formula by determining the allowed costs for each product (O'Dell, 1981). The split
ratio formula can react to changes across product lines, but organizations have a difficult
time allocating indirect costs across the product lines (Boyett & Boyett, 2004). A multi-
cost ratio formula (see Table 2) is a third type of Scanlon formula that utilizes a broader
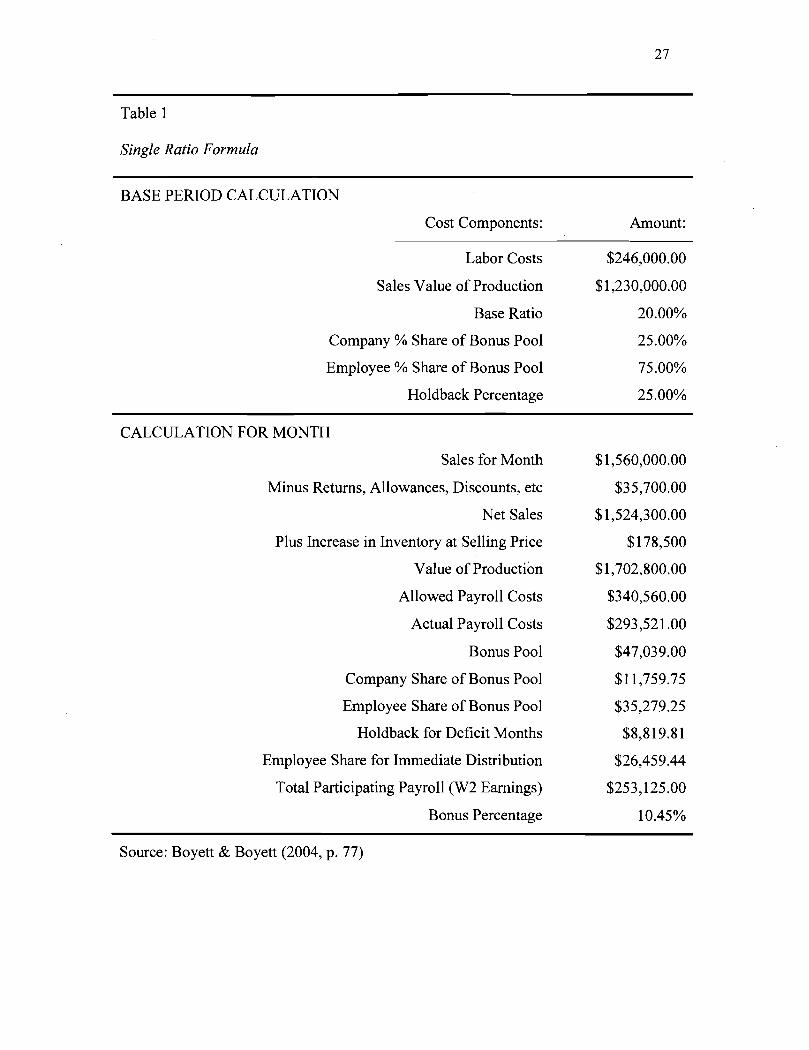
Table 1
Single Ratio Formula
BASE PERIOD CALCULATION
Cost Components: Amount:
Labor Costs $246,000.00
Sales Value of Production $1,230,000.00
Base Ratio 20.00%
Company % Share of Bonus Pool 25.00%
Employee % Share of Bonus Pool 75.00%
Holdback Percentage 25.00%
CALCULATION FOR MONTH
Sales for Month
Minus Returns, Allowances, Discounts, etc
Net Sales
Plus Increase in Inventory at Selling Price
Value of Production
Allowed Payroll Costs
Actual Payroll Costs
Bonus Pool
Company Share of Bonus Pool
Employee Share of Bonus Pool
Holdback for Deficit Months
Employee Share for Immediate Distribution
Total Participating Payroll (W2 Earnings)
Bonus Percentage
Source: Boyett & Boyett (2004, p. 77)
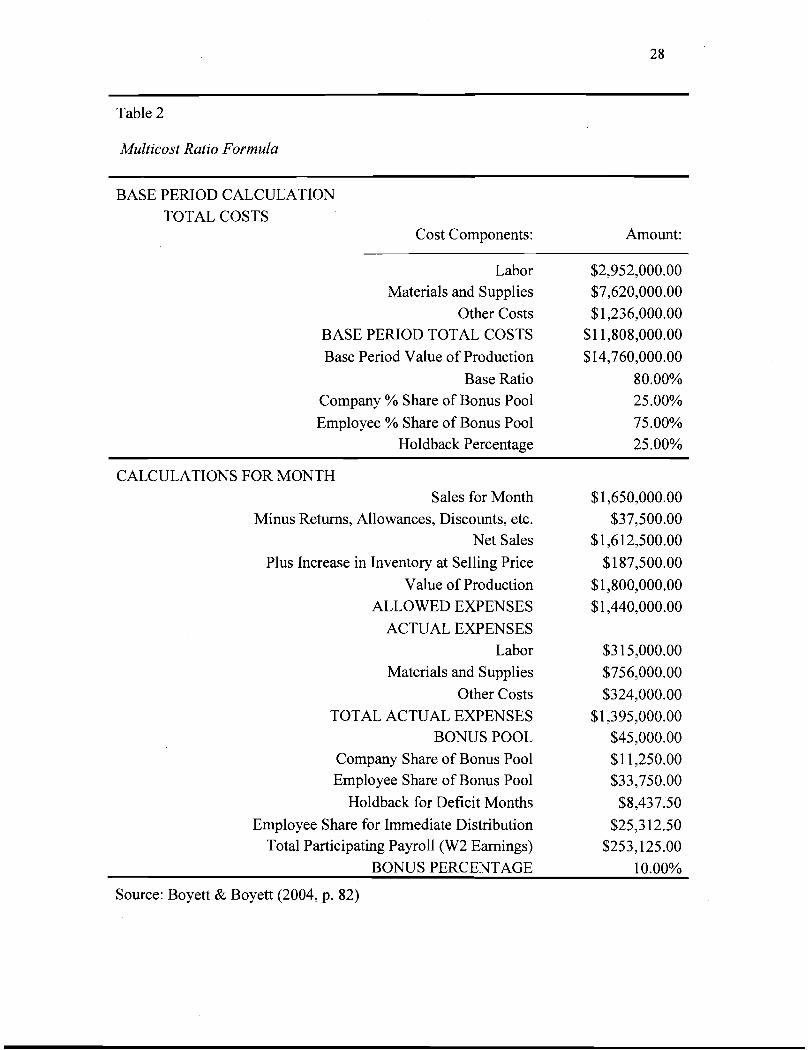
Table 2
Multicast Ratio Formula
BASE PERIOD CALCULATION TOTAL COSTS
Cost Components: Amount: - -
Labor Materials and Supplies
Other Costs BASE PERIOD TOTAL COSTS Base Period Value of Production
Base Ratio Company % Share of Bonus Pool Employee % Share of Bonus Pool
Holdback Percentage
CALCULATIONS FOR MONTH Sales for Month $1,650,000.00
Minus Returns, Allowances, Discounts, etc. $37,500.00 Net Sales $1,612,500.00
Plus Increase in Inventory at Selling Price $1 87,500.00 Value of Production $1,800,000.00
ALLOWED EXPENSES $1,440,000.00 ACTUAL EXPENSES
Labor $3 15,000.00 Materials and Supplies $756,000.00
Other Costs $324,000.00 TOTAL ACTUAL EXPENSES $1,395,000.00
BONUS POOL $45,000.00 Company Share of Bonus Pool $1 1,250.00 Employee Share of Bonus Pool $33,750.00
Holdback for Deficit Months $8,437.50
Employee Share for Immediate Distribution $25,3 12.50 Total Participating Payroll (W2 Earnings) $253,125.00
BONUS PERCENTAGE 10.00%
Source: Boyett & Boyett (2004, p. 82)
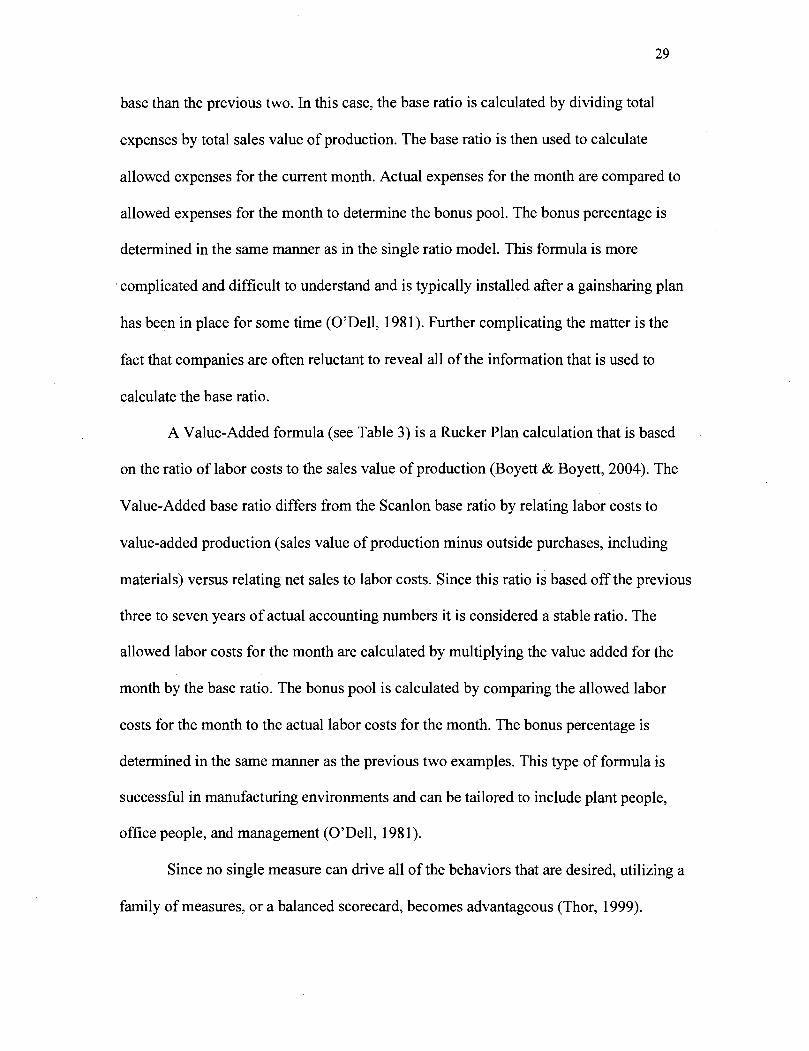
base than the previous two. In this case, the base ratio is calculated by dividing total
expenses by total sales value of production. The base ratio is then used to calculate
allowed expenses for the current month. Actual expenses for the month are compared to
allowed expenses for the month to determine the bonus pool. The bonus percentage is
determined in the same manner as in the single ratio model. This formula is more
complicated and difficult to understand and is typically installed after a gainsharing plan
has been in place for some time (O'Dell, 198 1). Further complicating the matter is the
fact that companies are often reluctant to reveal all of the information that is used to
calculate the base ratio.
A Value-Added formula (see Table 3) is a Rucker Plan calculation that is based
on the ratio of labor costs to the sales value of production (Boyett & Boyett, 2004). The
Value-Added base ratio differs from the Scanlon base ratio by relating labor costs to
value-added production (sales value of production minus outside purchases, including
materials) versus relating net sales to labor costs. Since this ratio is based off the previous
three to seven years of actual accounting numbers it is considered a stable ratio. The
allowed labor costs for the month are calculated by multiplying the value added for the
month by the base ratio. The bonus pool is calculated by comparing the allowed labor
costs for the month to the actual labor costs for the month. The bonus percentage is
determined in the same manner as the previous two examples. This type of formula is
successful in manufacturing environments and can be tailored to include plant people,
office people, and management (O'Dell, 198 1).
Since no single measure can drive all of the behaviors that are desired, utilizing a
family of measures, or a balanced scorecard, becomes advantageous (Thor, 1999).
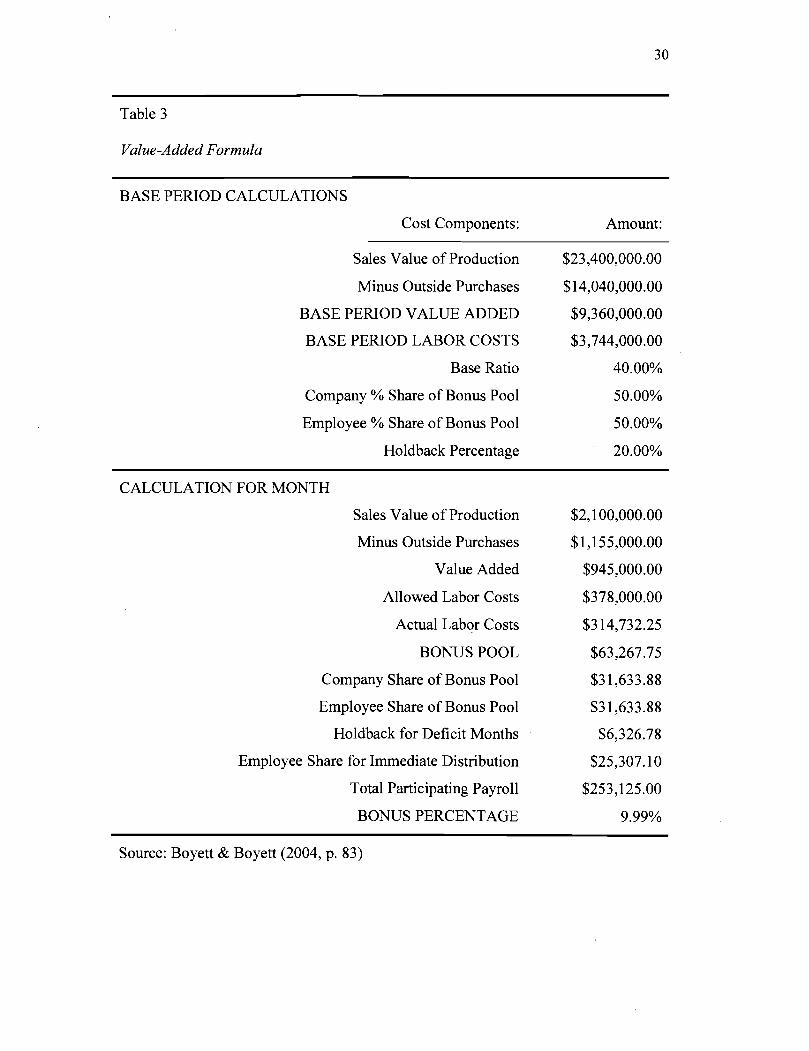
Table 3
Value-Added Formula
BASE PERIOD CALCULATIONS
Cost Components: Amount:
Sales Value of Production
Minus Outside Purchases
BASE PERIOD VALUE ADDED
BASE PERIOD LABOR COSTS
Base Ratio
Company % Share of Bonus Pool
Employee % Share of Bonus Pool
Holdback Percentage
CALCULATION FOR MONTH
Sales Value of Production
Minus Outside Purchases
Value Added
Allowed Labor Costs
Actual Labor Costs
BONUS POOL
Company Share of Bonus Pool
Employee Share of Bonus Pool
Holdback for Deficit Months
Employee Share for Immediate Distribution
Total Participating Payroll
BONUS PERCENTAGE
Source: Boyett & Boyett (2004, p. 83)
Normally, an organization will utilize four to six partially offsetting measures to create a
wider coverage of drivers without creating a loss of focus for the employees (see Table 4)
(Thor, 1993). These measures should include several key factors of production but also
consider quality, customer delivery, and other measures that are not considered in the
realm of productivity or efficiency. The formula can be balanced and the measures given
their proper importance by assigning a relative weight. This helps to prevent employees
from speeding up at the end of the month to meet production numbers only to suffer
quality and safety issues. The measures should be of local origin, understood by
everyone, visible, and be able to be calculated by the employees. The organization must
determine the dollar value per point and the base level that needs to be achieved prior to
receiving a bonus. In Table 4, the current performance level is scored on a scale of zero
to ten. Once the score has been determined, it is multiplied by the weight to give a value
to the measure. The values of the measures are totaled and compared to the base value
and the difference is multiplied by the dollar value per point to determine the bonus pool.
Limitations of Gainsharing. While there are many benefits to gainsharing there
are also some limitations that must be taken into consideration. It is difficult for
gainsharing programs to succeed if they are lacking top management support, have
inadequate middle management involvement, and provide insufficient training involving
first-level supervisors (Collins, 1998). Many managers are unwilling, or unable, to take
the risks that are associated with moving towards a participative management style and
allowing employees to make mistakes (Doyle & Doyle, 1992). A level of trust must exist
between management and the workers to allow a culture conducive to gainsharing to
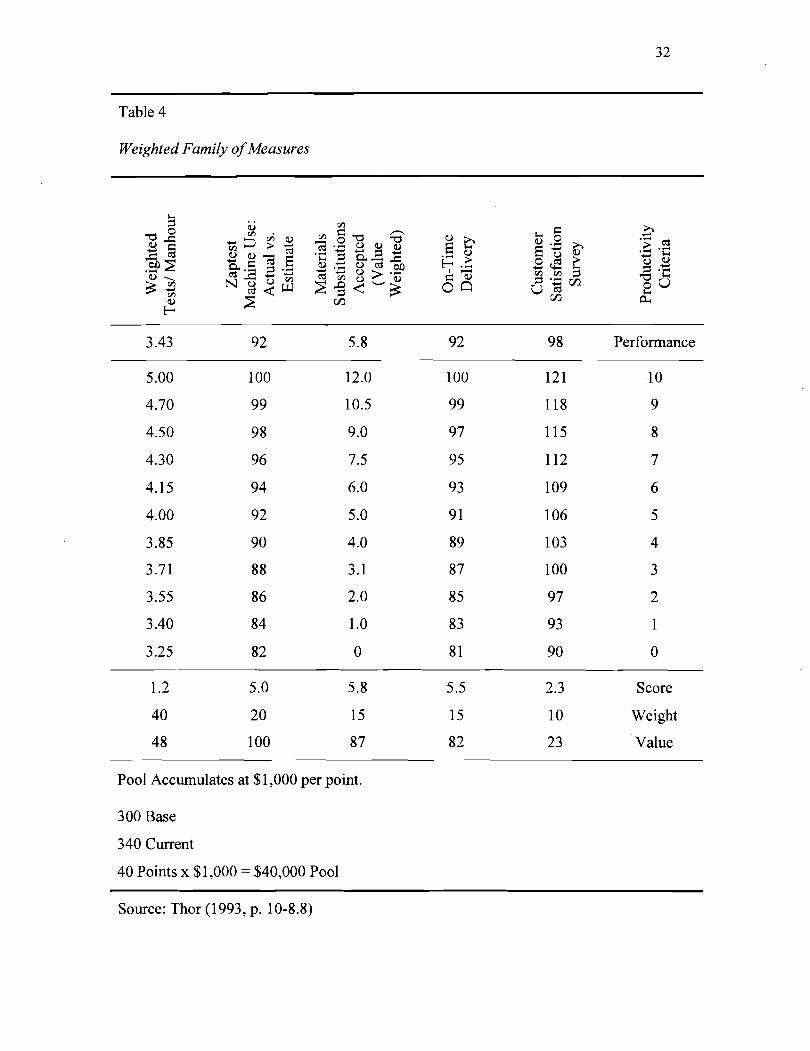
Table 4
Weighted Family of Measures
3.43 92 5.8 92 9 8 Performance
1.2 5.0 5.8 5.5 2.3 Score
40 20 15 15 10 Weight
48 100 87 82 2 3 Value
Pool Accumulates at $1,000 per point.
300 Base
340 Current
40 Points x $1,000 = $40,000 Pool
Source: Thor (1993, p. 10-8.8)
exist (O'Dell, 198 1 ). Without this trust, management will be unwilling to share the proper
operating and financial data required to allow employees to make the proper changes to
their performance. It takes strong, competent leadership to provide an undeniable vision
of excellence that challenges the employees (Doyle & Doyle, 1992).
Careful consideration must be given to timing the startup of the gainsharing plan
(O'Dell, 1981). It is much better to start the plan during a time of increased business than
during a down cycle. The bonuses paid during the upswing can carry employee
motivation through the downturn. With the increased production coming through the
shop floor, it becomes critical that the company is able to sell the additional product. If
the market is unable to support the additional product, the organization must find other
job duties for any employees that have been freed up or allow the number of employees
to self-adjust through attrition.
The last major limitation to gainsharing is a poorly developed formula that is
unrewarding, too rewarding, or perceived as unfair by the employees (OYDell, 1981). The
formula must not sacrifice other areas of the business in order for the employees to
receive a gain (Thor, 1993). If a plan focuses mainly on labor-cost containment it may
fail to focus the employees on broader business issues (Doyle & Doyle, 1992). There is
some concern that once employees have been paid a bonus for a task they have
completed they will be unwilling to complete the task again if a bonus is unavailable
(O'Dell, 198 1). Therefore, it is imperative that employees understand the importance of
the involvement system and that the bonus is not a reward for doing their job, but only a
means of keeping score.
Chapter 111: Methodology
The purpose of this study is to determine what is required for a successful
gainsharing plan, define an implementation procedure, and develop and test a gainsharing
formula specifically for XYZ Corporation, Inc. Through literature review a definition of
gainsharing, the characteristics of a successful gainsharing program, various gainsharing
plans, example formulas, and an implementation procedure have been provided. From
this, a gainsharing formula will be developed and tested utilizing available measures from
XYZ Corporation, Inc.
In order to develop a formula, criteria must be established for selecting a measure.
Once the criteria have been defined, a matrix will be created to determine the best
measure to use in a gainsharing formula. Using this information, a gainsharing formula
will be selected and developed for XYZ Corporation, Inc., historical data will be
collected, and various scenarios will be tested to determine the effectiveness of the
formula.
Criteria for Measurement Selection
When selecting a measure for a gainsharing formula the ability to measure
productivity and the improvements in productivity are essential. Therefore, it is beneficial
if the measurement has the ability to be measured financially versus a measurement that
cannot. A non-financial measurement (example: on-time delivery) may still be used in a
gainsharing formula by either attaching a dollar value to a unit of improvement or by
utilizing a target baseline in the formula. To maximize the effectiveness of the
measurement it must be visible to the employees and they must have the ability to control
and affect the measure by modifying their behaviors. In order to benefit the organization
the measurement must also act as a driver towards the strategic objectives. Finally, the
measurement should be easy to attain on a regular basis, easily understood by the
employees, and available at XYZ Corporation, Inc.
Measurement Selection
In order to select a measure for use in a gainsharing formula a list of measures
that are currently available at XYZ Corporation, Inc. has been created (reference
Appendix A). Using the above criteria for measurement selection and the available
measures at XYZ Corporation, a matrix was created to determine the level of correlation
between the available measures and the criteria (reference Appendix B). After the first
criterion was applied (employees can affedcontrol) all measures that had a low
correlation were eliminated from future evaluation. The remaining measures were rated
based on how they acted as a driver towards the strategic objectives of XYZ Corporation.
After applying this criterion, all measures that had a moderate or low correlation were
eliminated from future consideration. The same process was applied for the final three
criteria, resulting in two possible measures (7r and 7s) that could be used in a gainsharing
formula. Since 7r (actual production labor to standard production labor per product) has a
higher correlation to the employees affectingkontrolling, this measure has been selected
for use in developing and testing a gainsharing formula. Because measure 7r is a
comparison of two separate measures, data will be collected on the two components that
make up the measure to allow for better use in a gainsharing formula.
Selection and Development of a Gainsharing Formula
Based on the available measures and the selected measurement a Simple Scanlon
single ratio based formula will be utilized (see Table 1). Since data will be collected on
the two components of 7r, two separate formulas will be developed and tested. XYZ
Corporation Test Formula 1 will not include a base ratio, but will instead utilize the
allowed payroll expense calculated from the labor standards for the products that were
produced for the given month at XYZ Corporation. Given that the standards are based on
historical information, the actual payroll expenses for the month were calculated using
the payroll information for 80 direct labor employees and 25% of the payroll costs for the
crew-leaders. The crew-leader portion of the actual payroll expense is based on a
historical average of 25% of their time spent working on production jobs.
In XYZ Corporation Test Formula 1 (see Table 5), net sales are determined by
deducting the returns, allowances, discounts, and sales of products not produced by XYZ
Corporation from the sales for the month. The increase in inventory at selling price is
added to net sales resulting in the value of production for the month. The allowed payroll
costs will be compared to the actual payroll expenses for the month with the difference
resulting in the available bonus pool. The bonus pool will be split between the company
and the employees 50-50, with 25% of the employees' share going into a holdback for
deficit months. In the case of a negative bonus pool the company will absorb the loss and
transfer 100% of the loss to the holdback for deficit months' account. Any positive
variance remaining at the end of the year will be distributed to the employees. The
holdback for the month will be deducted from the employees' share of the bonus pool to
net the employee share for immediate distribution. The employee share for immediate
distribution divided by the total participating payroll will result in a bonus percentage that
will be available to all employees who are included in the program. A binary profit gate
will be used to determine the bonus percentage that is paid to the employees. If it was a
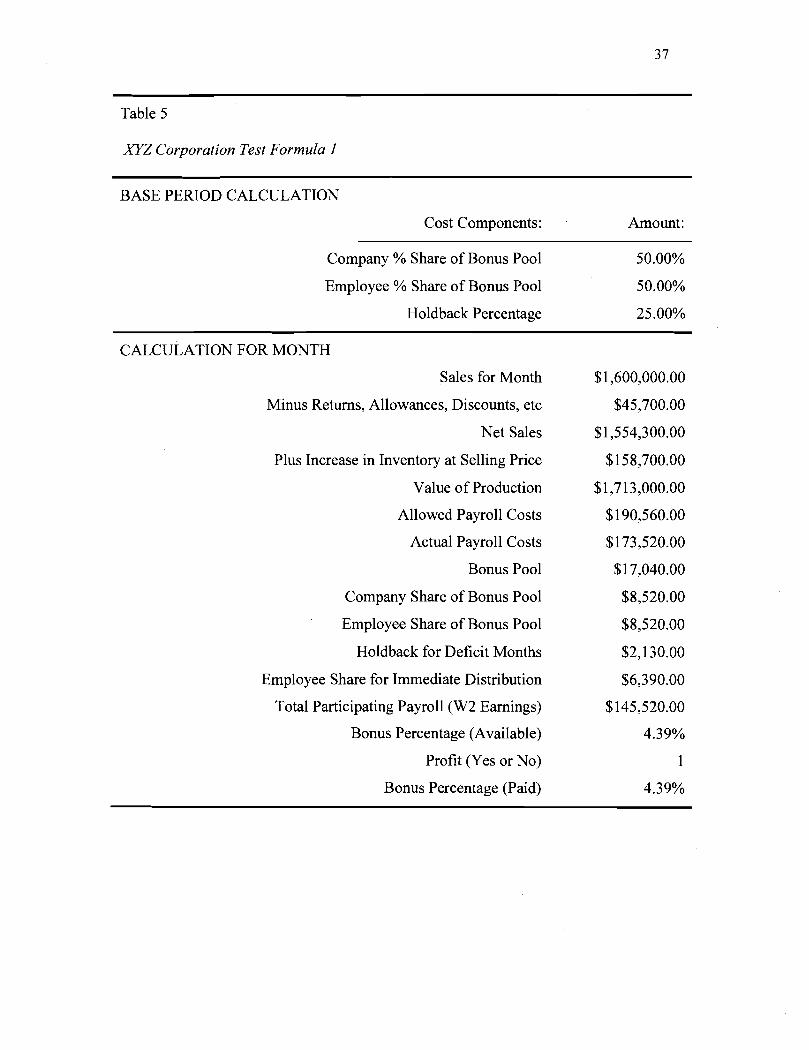
Table 5
XYZ Corporation Test Formula 1
BASE PERIOD CALCULATION
Cost Components: Amount:
Company % Share of Bonus Pool 50.00%
Employee % Share of Bonus Pool 50.00%
Holdback Percentage 25.00%
CALCULATION FOR MONTH
Sales for Month
Minus Returns, Allowances, Discounts, etc
Net Sales
Plus Increase in Inventory at Selling Price
Value of Production
Allowed Payroll Costs
Actual Payroll Costs
Bonus Pool
Company Share of Bonus Pool
Employee Share of Bonus Pool
Holdback for Deficit Months
Employee Share for Immediate Distribution
Total Participating Payroll (W2 Earnings)
Bonus Percentage (Available)
Profit (Yes or No)
Bonus Percentage (Paid)
profitable month 100% of the available bonus will be paid, if not, there will be no bonus
for the month. The bonus percentage paid to the employee will be the percentage of their
total wages, including overtime, for the period.
The second formula, XYZ Corporation Test Formula 2 (see Table 6), uses a base
ratio that was calculated by dividing actual payroll costs for the year by the total sales
volume of production for the year. In this instance, the actual payroll costs includes 80
direct labor employees, 20 crew-leaders, and an additional 10 employees in the
Maintenance, Shipping and Receiving, Tooling, and Micro-Production shop departments.
With this information the base ratio for XYZ Corporation was calculated at 16.35% for
2005. Multiplying this base ratio by the value of production for the month will result in
the allowed payroll costs. The remainder of the formula is calculated in the same manner
as XYZ Corporation Test Formula 1. Both formulas will be tested using information
gathered from XYZ Corporation for the year 2005 with scenarios generated for
improvements to the actual payroll costs of 5%, lo%, 15%, and 20%. Each formula will
also be used to calculate the improvement percentage to zero out the year-end company
share of bonus pool, the year-end holdback for deficit months' account, and the
percentage needed for participating employees to receive a total of $500.00 in bonuses.
The bonus calculation includes any positive year-end variance in the holdback for deficit
months' account.
Limitations
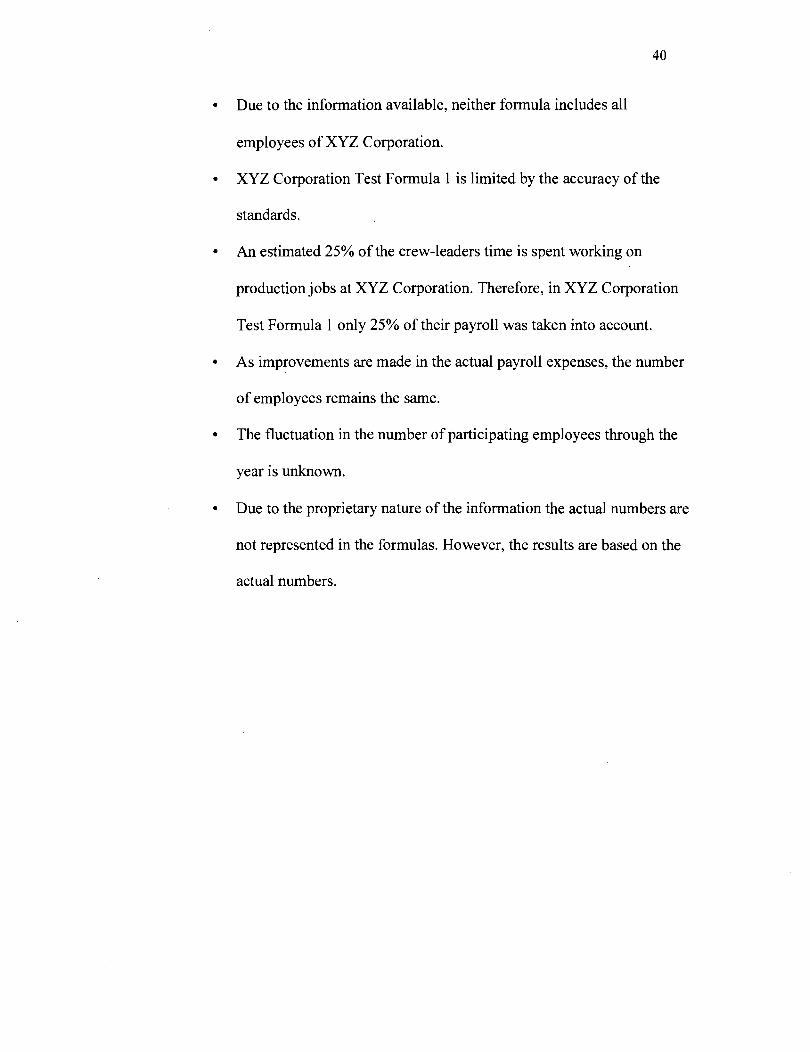
The following limitations were observed in the methodology:
The formulas are limited to information gathered from XYZ
Corporation for the year 2005.
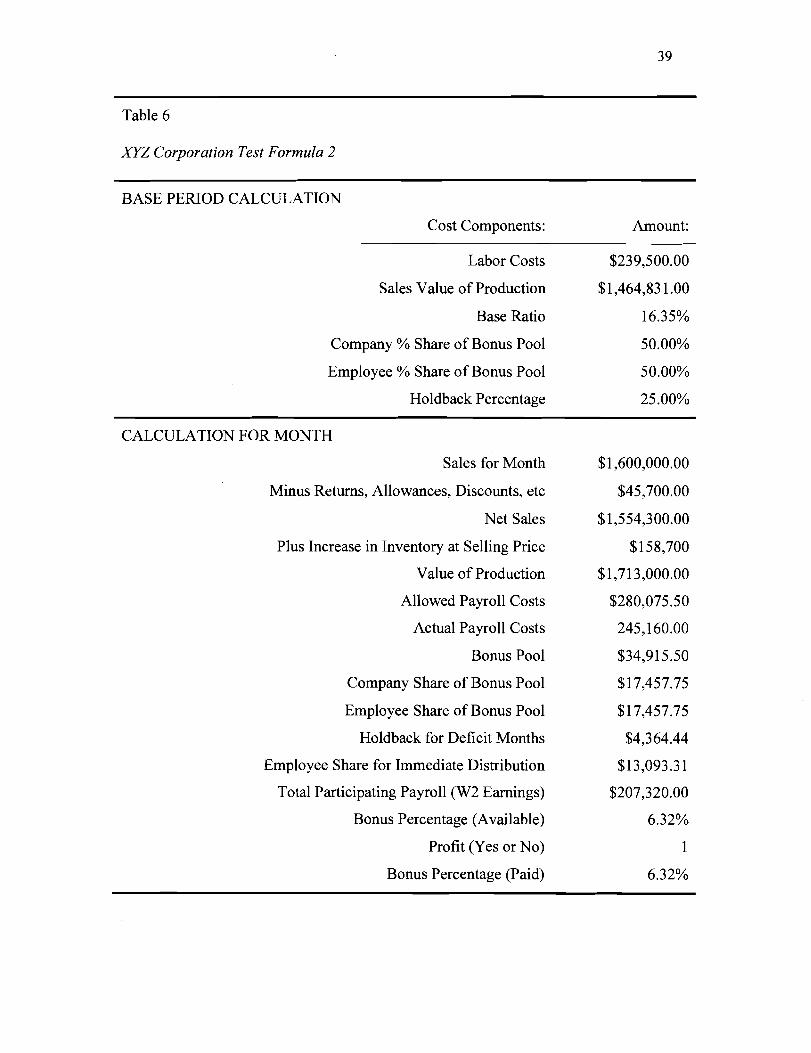
Table 6
XYZ Corporation Test Formula 2
BASE PERIOD CALCULATION
Cost Components: Amount:
Labor Costs $239,500.00
Sales Value of Production $1,464,83 1 .OO
Base Ratio 16.35%
Company % Share of Bonus Pool 50.00%
Employee % Share of Bonus Pool 50.00%
Holdback Percentage 25.00%
CALCULATION FOR MONTH
Sales for Month
Minus Returns, Allowances, Discounts, etc
Net Sales
Plus Increase in Inventory at Selling Price
Value of Production
Allowed Payroll Costs
Actual Payroll Costs
Bonus Pool
Company Share of Bonus Pool
Employee Share of Bonus Pool
Holdback for Deficit Months
Employee Share for Immediate Distribution
Total Participating Payroll (W2 Earnings)
Bonus Percentage (Available)
Profit (Yes or No)
Bonus Percentage (Paid)
Due to the information available, neither formula includes all
employees of XYZ Corporation.
XYZ Corporation Test Formula 1 is limited by the accuracy of the
standards.
An estimated 25% of the crew-leaders time is spent working on
production jobs at XYZ Corporation. Therefore, in XYZ Corporation
Test Formula 1 only 25% of their payroll was taken into account.
As improvements are made in the actual payroll expenses, the number
of employees remains the same.
The fluctuation in the number of participating employees through the
year is unknown.
Due to the proprietary nature of the information the actual numbers are
not represented in the formulas. However, the results are based on the
actual numbers.
Chapter IV: Results
Through literature review, the purpose of this study was to determine what is
required for a successful gainsharing plan, define an implementation procedure, and
develop and test a gainsharing formula specifically for XYZ Corporation. Using
information gathered from XYZ Corporation a measurement was selected to use in a
gainsharing formula. From this, two Simple Scanlon single ratio based formulas were
created and tested. XYZ Corporation Test Formula 1 used XYZYs company standards for
allowed payroll expenses, while XYZ Corporation Test Formula 2 used a base ratio
calculated from information gathered for 2005. Both formulas were then tested using
improvements in actual payroll expenses of 5%, lo%, 15%, and 20%. Next, the formulas
were tested to determine the improvement percentage to zero out the year-end company
share of bonus pool account, the year-end holdback for deficit months account, and the
percentage of improvement required for each employee to receive a total of $500.00 in
bonuses. The bonus calculation included any positive amount in the year-end holdback
for deficit months' account. Due to the proprietary nature of the information, only the
results of the formulas are shown. Tables 7 and 8 show a summary of the year end results
for each formula, while Appendices C through R shows a monthly breakdown of each
component listed in the tables.
Discussion of Results
After applying the base information for 2005 to XYZ Corporation Test Formula
1, the bonus pool and the company share of bonus pool would have been ($600,3 10) and
the employees would have received no bonus (see Table 7). This is a result of the
difference between the total allowed payroll costs for 2005, based on standards, and the
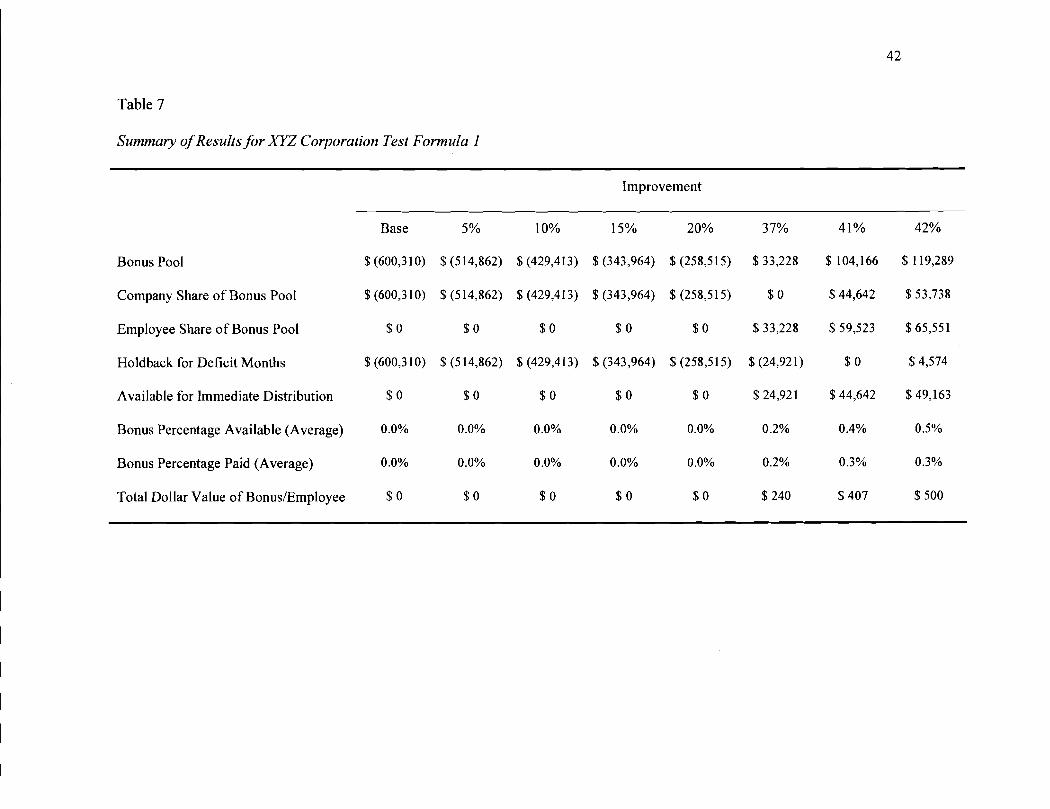
Table 7
Summary of Results for XYZ Corporation Test Formula I
Improvement
Bonus Pool
Company Share of Bonus Pool
Employee Share of Bonus Pool
Holdback for Deficit Months
Available for Immediate Distribution
Bonus Percentage Available (Average)
Bonus Percentage Paid (Average)
Total Dollar Value of BonusIEmployee
Base
$ (600,3 10)
$ (600,3 10)
$ 0
$ (600,3 10)
$ 0
0.0%
0.0%
$ 0
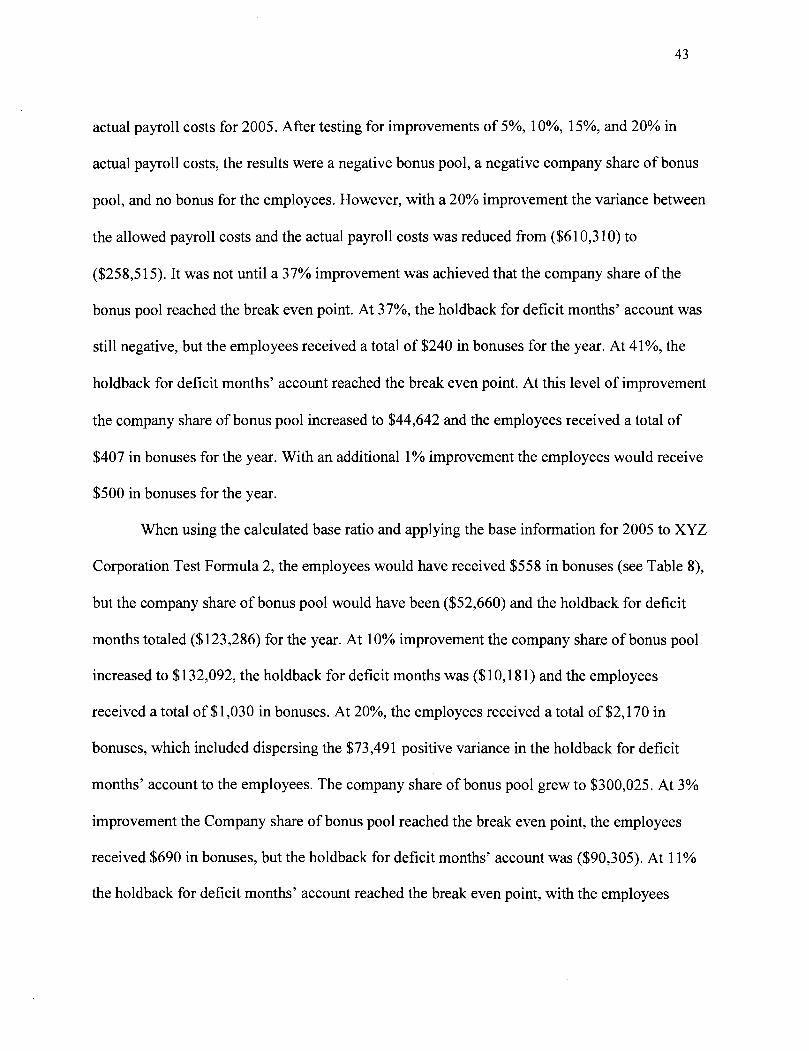
actual payroll costs for 2005. After testing for improvements of 5%, lo%, 15%, and 20% in
actual payroll costs, the results were a negative bonus pool, a negative company share of bonus
pool, and no bonus for the employees. However, with a 20% improvement the variance between
the allowed payroll costs and the actual payroll costs was reduced from ($61 0,3 10) to
($258,5 15). It was not until a 37% improvement was achieved that the company share of the
bonus pool reached the break even point. At 37%, the holdback for deficit months' account was
still negative, but the employees received a total of $240 in bonuses for the year. At 41%, the
holdback for deficit months' account reached the break even point. At this level of improvement
the company share of bonus pool increased to $44,642 and the employees received a total of
$407 in bonuses for the year. With an additional 1 % improvement the employees would receive
$500 in bonuses for the year.
When using the calculated base ratio and applying the base information for 2005 to XYZ
Corporation Test Formula 2, the employees would have received $558 in bonuses (see Table 8),
but the company share of bonus pool would have been ($52,660) and the holdback for deficit
months totaled ($123,286) for the year. At 10% improvement the company share of bonus pool
increased to $132,092, the holdback for deficit months was ($10,18 1) and the employees
received a total of $1,030 in bonuses. At 20%, the employees received a total of $2,170 in
bonuses, which included dispersing the $73,491 positive variance in the holdback for deficit
months' account to the employees. The company share of bonus pool grew to $300,025. At 3%
improvement the Company share of bonus pool reached the break even point, the employees
received $690 in bonuses, but the holdback for deficit months' account was ($90,305). At 11%
the holdback for deficit months' account reached the break even point, with the employees

receiving $1,078 in bonuses, and the company share of bonus pool reaching $150,288. With a
1% reduction from the base information the employees would still receive $500 in bonuses for
the year. Under all tested scenarios of improvement XYZ Corporation realized no additional
profitable months.
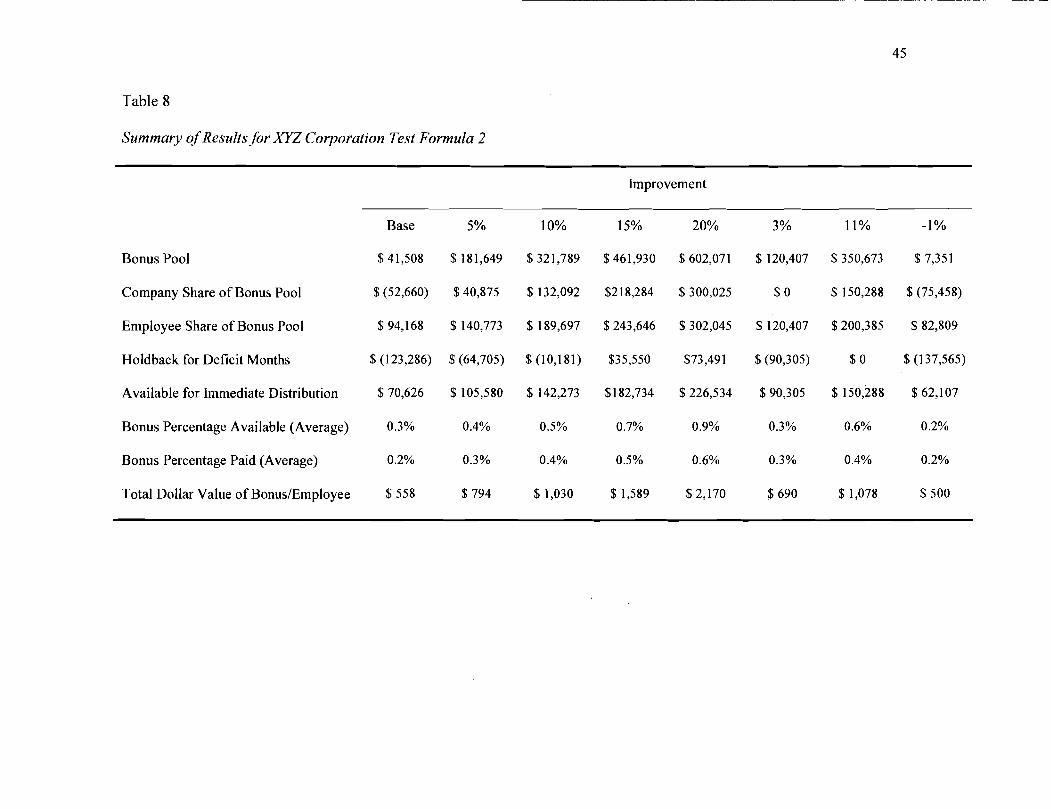
Table 8
Summary of Results for XYZ Corporation Test Formula 2
Improvement
Bonus Pool
Company Share of Bonus Pool
Employee Share of Bonus Pool
Holdback for Deficit Months
Available for Immediate Distribution
Bonus Percentage Available (Average)
Bonus Percentage Paid (Average)
Total Dollar Value of BonusIEmployee
Base
$ 41,508
$ (52,660)
$ 94,168
$ (1 23,286)
$ 70,626
0.3%
0.2%
$ 558
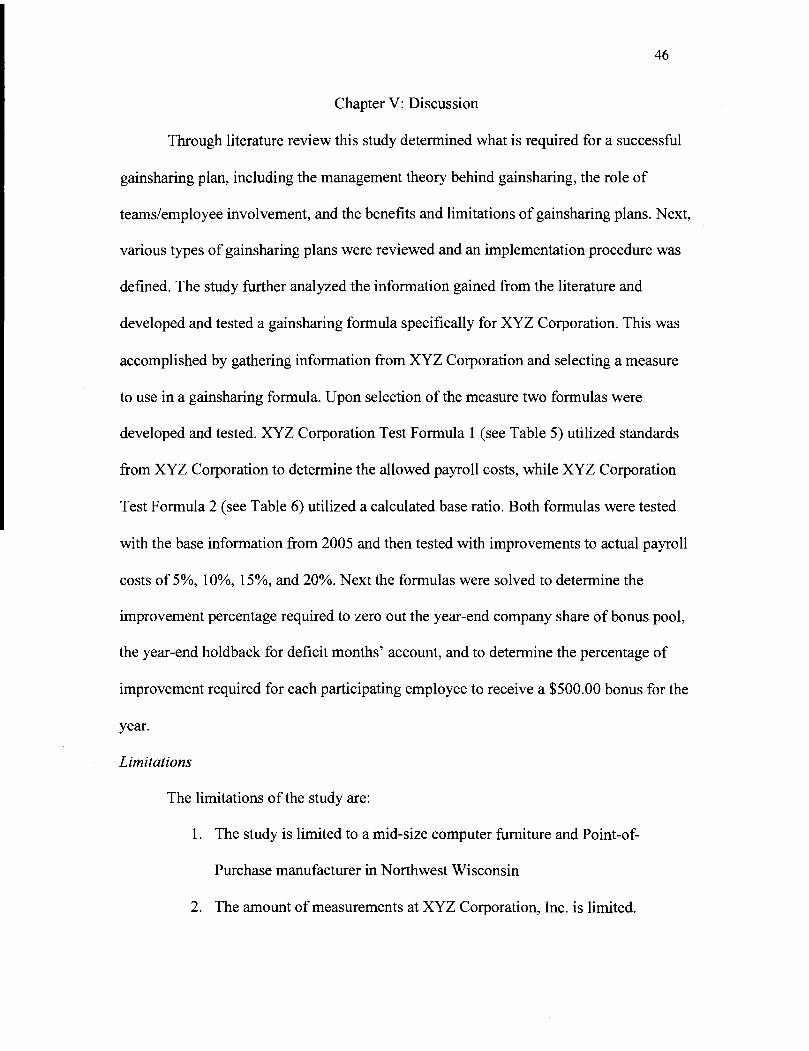
Chapter V: Discussion
Through literature review this study determined what is required for a successful
gainsharing plan, including the management theory behind gainsharing, the role of
teamslemployee involvement, and the benefits and limitations of gainsharing plans. Next,
various types of gainsharing plans were reviewed and an implementation procedure was
defined. The study further analyzed the information gained from the literature and
developed and tested a gainsharing formula specifically for XYZ Corporation. This was
accomplished by gathering information from XYZ Corporation and selecting a measure
to use in a gainsharing formula. Upon selection of the measure two formulas were
developed and tested. XYZ Corporation Test Formula 1 (see Table 5) utilized standards
from XYZ Corporation to determine the allowed payroll costs, while XYZ Corporation
Test Formula 2 (see Table 6) utilized a calculated base ratio. Both formulas were tested
with the base information from 2005 and then tested with improvements to actual payroll
costs of 5%, lo%, 15%, and 20%. Next the formulas were solved to determine the
improvement percentage required to zero out the year-end company share of bonus pool,
the year-end holdback for deficit months' account, and to determine the percentage of
improvement required for each participating employee to receive a $500.00 bonus for the
year.
Limitations
The limitations of the study are:
1. The study is limited to a mid-size computer furniture and Point-of-
Purchase manufacturer in Northwest Wisconsin
2. The amount of measurements at XYZ Corporation, Inc. is limited.
3. With limited measurements available, only one gainsharing formula will
be tested for XYZ Corporation, Inc.
The limitations observed in the methodology are:
1. The formulas are limited to information gathered from XYZ Corporation
for the year 2005.
2. Due to the information available, neither formula includes all employees
of XYZ Corporation.
3. XYZ Corporation Test Formula 1 is limited by the accuracy of the
standards.
4. An estimated 25% of the crew-leaders time is spent working on
production jobs at XYZ Corporation. Therefore, in XYZ Corporation Test
Formula 1 only 25% of their payroll was taken into account.
5. As improvements are made in the actual payroll expenses, the number of
employees remains the same.
6. The fluctuation in the number of participating employees through the year
is unknown.
7. Due to the proprietary nature of the information the actual numbers are not
represented in the formulas. However, the results are based on the actual
numbers.
Conclusions
The results of the tested formulas were held up to the six points of an effective
gainsharing formula as defined by Boyett & Boyett (2004). These are:
1. The formula must be fair to the company.
2. The formula must be able to be affected by the employees modifying their
behavior.
3. The formula must be easy to understand.
4. The calculations must be easily made and based on information that is
available in a timely fashion.
5. The formula must be flexible to accommodate changes in company goals,
objectives, and priorities.
6. The formula should direct the attention of the employees to problem areas.
Upon reviewing the data collected, the two gainsharing formulas are deemed to be
unacceptable for implementation at XYZ Corporation at this time. XYZ Corporation Test
Formula 1 is not fair to the company or the employees. Even though this formula was
based off of company standards, the company lost a significant amount of money in the
company share of bonus pool and the holdback for deficit months' account. This can be
partially attributed to a company philosophy of not laying off employees during slow
periods. However, this would not explain why the variance between the allowed payroll
costs and actual payroll costs is so great during the peak busy season. There are two
possibilities explaining this variance during the peak months. Either the employees have
lost their sense of urgency and have become less efficient throughout the year because of
the presence of excess employees during the off-peak months or the standards are
extremely inaccurate. Since the standards are based off past history, the latter seems less
likely to be the cause. XYZ Corporation Test Formula 1 also required a 37%
improvement in order for the employees to receive a $240 bonus, making the formula
very difficult for the employees to affect by modifying their behaviors. This would not
allow the company to gain any short-term wins making it difficult for the program to gain
momentum and becoming part of the culture.
While XYZ Corporation Test Formula 2 is better for the employees by virtue of
them receiving a bonus from the 2005 base information, the formula is not fair to the
company. The company share of the bonus pool and the holdback for deficit months'
account are negative even though the employees receive a bonus. In addition, given the
findings of XYZ Corporation Test Formula 1, if the standards are that inaccurate then it is
reasonable to assume that the base ratio is inaccurate also. Both formulas achieve points
three through five of a successful gainsharing formula, but they only direct the
employees' attention to the allowable payroll costs and would not direct their attention to
any other problem areas. In order for a gainsharing plan to be successhl at XYZ
Corporation either the demand needs to be steadied or the labor pool must be more
closely matched with the fluctuating demand.
Recommendations
Based off this study, the following are recommendations and future steps for
XYZ Corporation to take under consideration:
1. XYZ Corporation Test Formula 2 could be expanded to use the
information from the previous three years to develop a base ratio. Once
the base ratio was developed a rolling average could be used and
recalculated annually. This would be recommended if it were determined
the standards are inaccurate.
2. XYZ Corporation could assess how supportive their management practices
are of the gainsharing philosophy of employee involvement, visible
measures, and allowing employees to have an influence on their area.
3. XYZ Corporation could begin to practice employee involvement by
forming formal committees, teams, and councils.
4. Implement Lean Manufacturing techniques for a few years to gain some
consistency in the manufacturing processes, achieve some initial benefits
by plucking the "low hanging fruit", and define the appropriate measures
that would work towards the strategic objectives of the organization. This
would also assist in aligning the management practices and philosophy
with gainsharing.
5. Define better measurements that would work towards the strategic
objectives of the organization and make them visible to the employees.
Some measures to consider would include:
Throughput time
On-time delivery
Overall Equipment Efficiency (OEE)
Scrap
ReworkICost of QualityIReturns
6. Ultimately, possibly with the measures above, use a balanced scorecard
method with tiered profit gates. This would prevent the employees from
focusing on one measure while the others slipped. A tiered profit gate
would pay a portion of the bonus to the employees provided they met
certain profit levels. As the profit level increased, the employees would
receive a higher portion of their bonus. This would guarantee the formula
was beneficial to the company while the employees made improvements.
7. Expand the formula to cover all employees except upper management. A
profit sharing system may be beneficial for use with upper management.
This is not an exhaustive list of recommendations or future steps for XYZ Corporation to
take under consideration. However, it may provide the beginning steps that XYZ
Corporation can take towards implementing the gainsharing philosophy and programs
and ultimately realizing the many benefits that are associated with gainsharing.
References
Band, D.C., Scanlan, G., & Tustin C.M. (1 994). Beyond the bottom line: Gainsharing and
organizational development [Electronic version]. Personal Review, 23, 1 7-32.
Retrieved July 3,2005 from Emerald Library.
Belcher, J.G., Jr. (1993). Reward systems: Time for change. In W. F. Christopher & C.
Thor (Eds.), Handbook for productivity measurement and improvement (pp 10-5.1
- 10-5.13). Portland, Oregon: Productivity Press.
Boyett, J.B., & Boyett, J.T. (2004). The gainsharing design manual. Lincoln, Nebraska:
ASJA Press.
Brown, D.I. (1995). Team-based reward plans [Electronic version]. Team Performance
Management: An International Journal, l,23-3 1. Retrieved July 3,2005 from
Emerald Library.
Brown, S., & Bessant, J., (2003). The manufacturing strategy- capabilities links in mass
customization and agile manufacturing - an exploratory study [Electronic
version]. International Journal of Operation & Production Management, 23,707-
730. Retrieved March 6,2004 from Emerald Library.
Collins, D.B. (1998). Gainsharing andpower. Ithaca, New York: Cornell University
Press.
Cotton J.L. (1993). Employee involvement: Methods for improvingperformance and
work attitudes. Newbury Park, California: SAGE Publications, Inc.
Doyle, R.J. & Doyle, P.I. (1992). Gain management. New York, New York: AMACOM.
Gross, S.E. (1995). Compensation for teams. New York, New York: The Hay Group.
Kim, D.O. (2005). The benefits and costs of employee suggestions under gainsharing
[Electronic version]. Industrial and Labor Relations Review, 58,63 1-652.
Retrieved November 5, 2005 from Ebscho Host database.
Lawler, E.E., 111. (1993). Managing employee involvement. In W. F. Christopher & C.
Thor (Eds.), Handbook for productivity measurement and improvement (pp 10-1.3
- 10- 1.13). Portland, Oregon: Productivity Press.
Margulies, J.S. & Kleiner, B.H. (1995). New designs of work groups: Applications of
empowerment [Electronic version]. Empowerment in Organizations, 3, 12- 18.
Retrieved July 3,2005 from Emerald Library.
O'Dell, C.S. (1 98 1). Gainsharing involvement, incentives, andproductivity. New York,
New York: AMACOM.
O'Dell, C.S. (1993). Sharing the productivity payoff: A gainsharing primer. In W. F.
Christopher & C. Thor (Eds.), Handbook for productivity measurement and
improvement (pp 10-7.1 - 10-7.12). Portland, Oregon: Productivity Press.
Roy, M.H. & Dugal, S.S. (2005). Using employee gainsharing plans to improve
organizational effectiveness [Electronic version]. Benchmarking: An International
Journal, 12,250-259. Retrieved November 5,2005 from Emerald Library.
Thor, C. G. (1993). Knowledge worker gainsharing. In W. F. Christopher & C. Thor
(Eds.), Handbook for productivity measurement and improvement (pp 10-8.1 -
10-8.8). Portland, Oregon: Productivity Press.
Thor, C. G. (1 993). Strategy-linked measurement and gainsharing. In W. F. Christopher
& C. Thor (Eds.), Handbook for productivity measurement and improvement (pp
10-6.1 - 10-6.14). Portland, Oregon: Productivity Press.
Thor, C.G. (1 999). Best management practices: Gainsharing. Menlo Park, California:
Crisp Publications.
Thorne, K. & Smith, M. (2000). Accounting control and performance measurement in a
teamworking environment [Electronic version]. Managerial Auditing Journal, 15,
348-357. Retrieved July 3,2005 from Emerald Library.
Trent, R.J. (2003). Planning to use work teams effectively [Electronic version]. Team
Performance Management: An International Journal, 9, 50-58. Retrieved July 3,
2005 from Emerald Library.
Wilson, T.B. (1 995). Innovative reward systems for the changing workplace. New York,
New York: McGraw-Hill, Inc.
Zobal, C. (1998). The "ideal" team compensation system- an overview: Part I [Electronic
version]. Team Performance Management: An International Journal, 4,235-249.
Retrieved July 3,2005 from Emerald Library.
Zobal, C. (1 999). The "ideal" team compensation system- an overview, Part I1
[Electronic version]. Team Performance Management: An International Journal,
5,23-45. Retrieved July 3,2005 from Emerald Library.
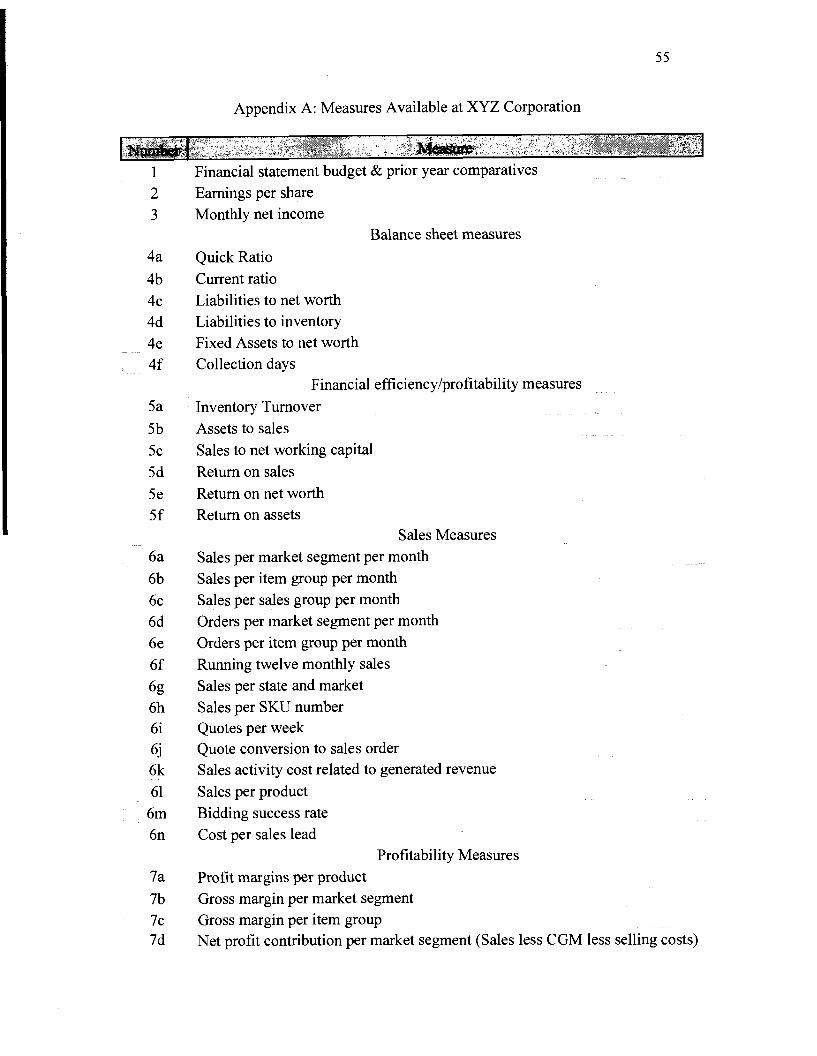
Appendix A: Measures Available at XYZ Corporation
Financial statement budget & prior year comparatives Earnings per share Monthly net income
Balance sheet measures
Quick Ratio Current ratio Liabilities to net worth Liabilities to inventory Fixed Assets to net worth Collection days
Financial efficiencylprofitability measures
Inventory Turnover Assets to sales Sales to net working capital Return on sales Return on net worth Return on assets
Sales Measures Sales per market segment per month Sales per item group per month Sales per sales group per month Orders per market segment per month Orders per item group per month Running twelve monthly sales Sales per state and market Sales per SKU number Quotes per week Quote conversion to sales order Sales activity cost related to generated revenue Sales per product Bidding success rate Cost per sales lead
Profitability Measures Profit margins per product Gross margin per market segment Gross margin per item group Net profit contribution per market segment (Sales less CGM less selling costs)
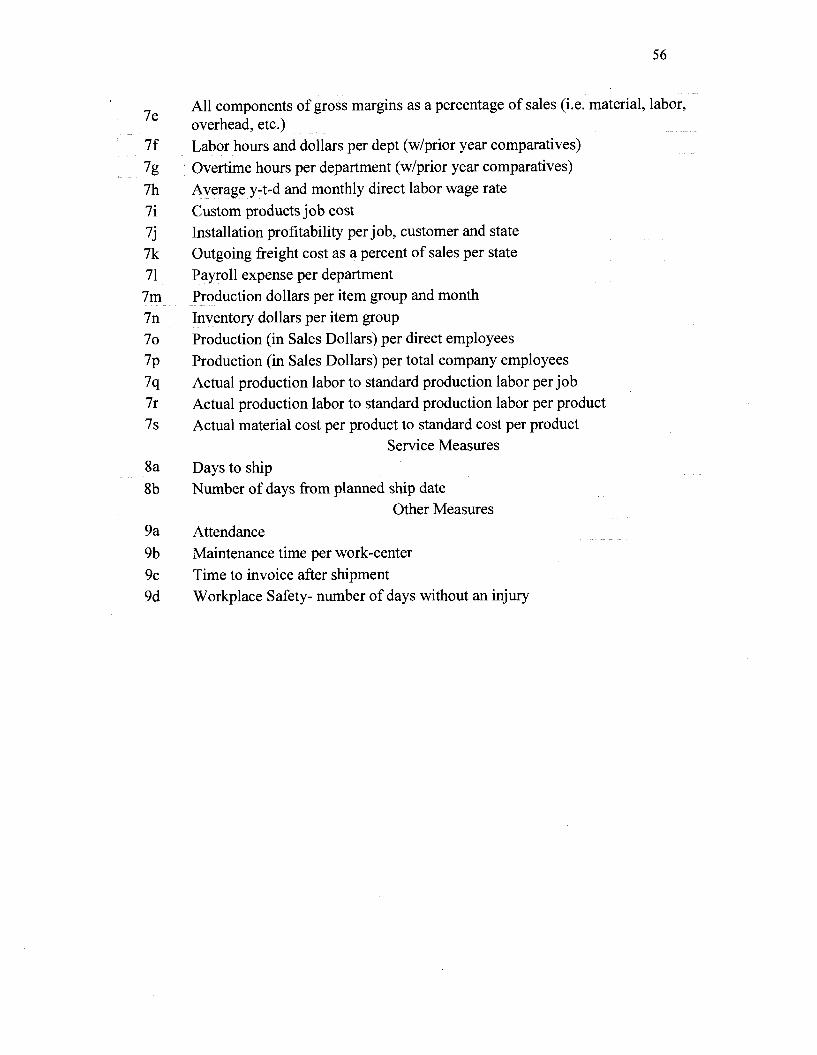
All components of gross margins as a percentage of sales (i.e. material, labor, 7e overhead, etc.) 7f Labor hours and dollars per dept (wlprior year comparatives)
7g Overtime hours per department (wlprior year comparatives) 7h Average y-t-d and monthly direct labor wage rate 7i Custom products job cost
7j Installation profitability per job, customer and state 7k Outgoing freight cost as a percent of sales per state 71 Payroll expense per department 7m Production dollars per item group and month 7n Inventory dollars per item group 70 Production (in Sales Dollars) per direct employees
7p Production (in Sales Dollars) per total company employees
7q Actual production labor to standard production labor per job 7r Actual production labor to standard production labor per product 7s Actual material cost per product to standard cost per product
Service Measures 8a Days to ship 8b Number of days from planned ship date
Other Measures 9a Attendance 9b Maintenance time per work-center 9c Time to invoice after shipment 9d Workplace Safety- number of days without an injury
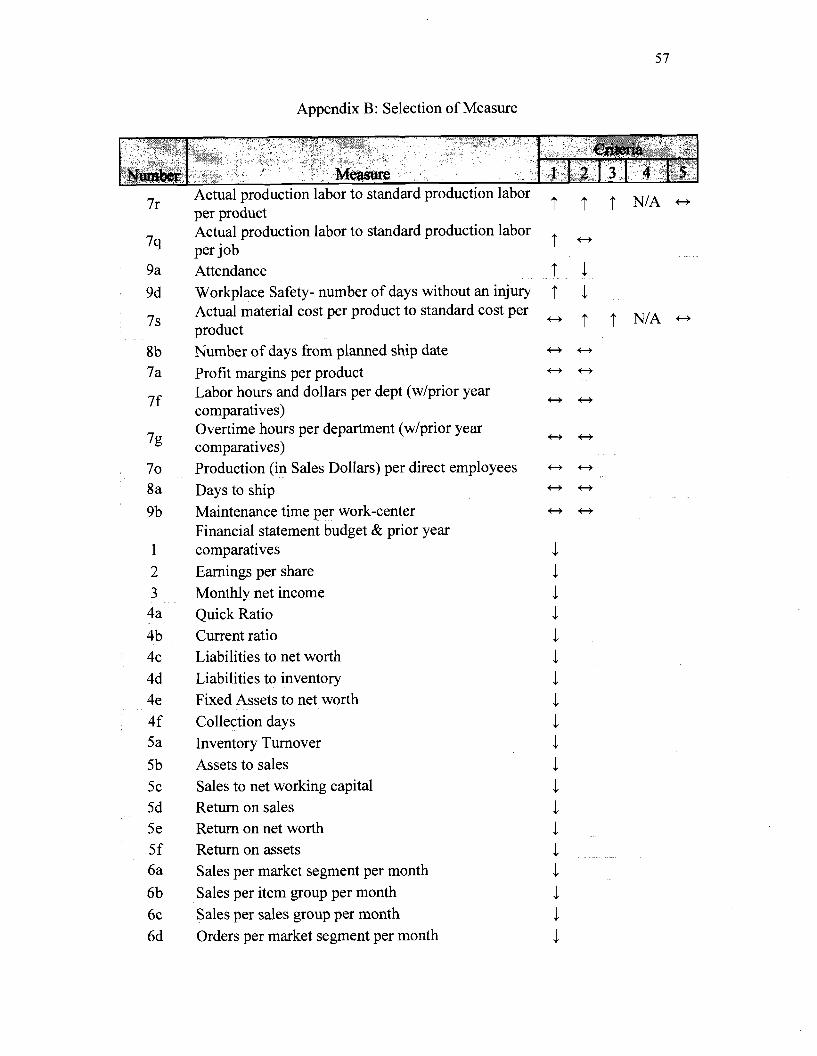
Appendix B: Selection of Measure
7r Actual production labor to standard production labor t t NIA - " per product
Actual production labor to standard production labor 7q perjob t - 9a Attendance t . 1 9d Workplace Safety- number of days without an injury J,
Actual material cost per product to standard cost per 7s product
* t t NIA
8b Number of days from planned ship date t) t)
7a Profit margins per product
7f Labor hours and dollars per dept (wlprior year comparatives) Overtime hours per department (wlprior year
7g comparatives) 70 Production (in Sales Dollars) per direct employees 8a Days to ship 9b Maintenance time per work-center
Financial statement budget & prior year 1 comparatives 2 Earnings per share 3 Monthly net income 4a Quick Ratio 4b Current ratio 4c Liabilities to net worth
Liabilities to inventory Fixed Assets to net worth Collection days Inventory Turnover Assets to sales Sales to net working capital Return on sales Return on net worth Return on assets Sales per market segment per month Sales per item group per month Sales per sales group per month Orders per market segment per month
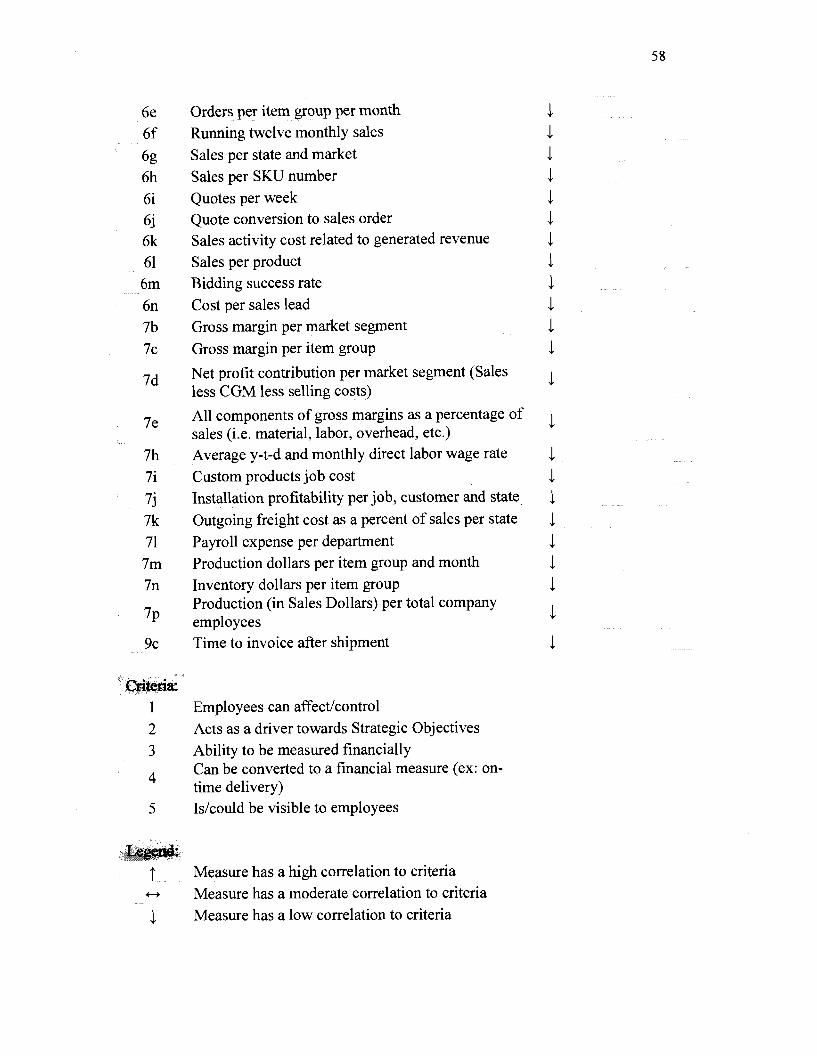
Orders per item group per month Running twelve monthly sales Sales per state and market Sales per SKU number Quotes per week Quote conversion to sales order Sales activity cost related to generated revenue Sales per product Bidding success rate Cost per sales lead Gross margin per market segment Gross margin per item group
Net profit contribution per market segment (Sales less CGM less selling costs)
All components of gross margins as a percentage of sales (i.e. material, labor, overhead, etc.) Average y-t-d and monthly direct labor wage rate Custom products job cost Installation profitability per job, customer and state Outgoing freight cost as a percent of sales per state Payroll expense per department Production dollars per item group and month Inventory dollars per item group Production (in Sales Dollars) per total company employees Time to invoice after shipment
1 Employees can affectlcontrol 2 Acts as a driver towards Strategic Objectives 3 Ability to be measured financially
4 Can be converted to a financial measure (ex: on- time delivery)
5 Is/could be visible to employees
Measure has a high correlation to criteria t, Measure has a moderate correlation to criteria
Measure has a low correlation to criteria
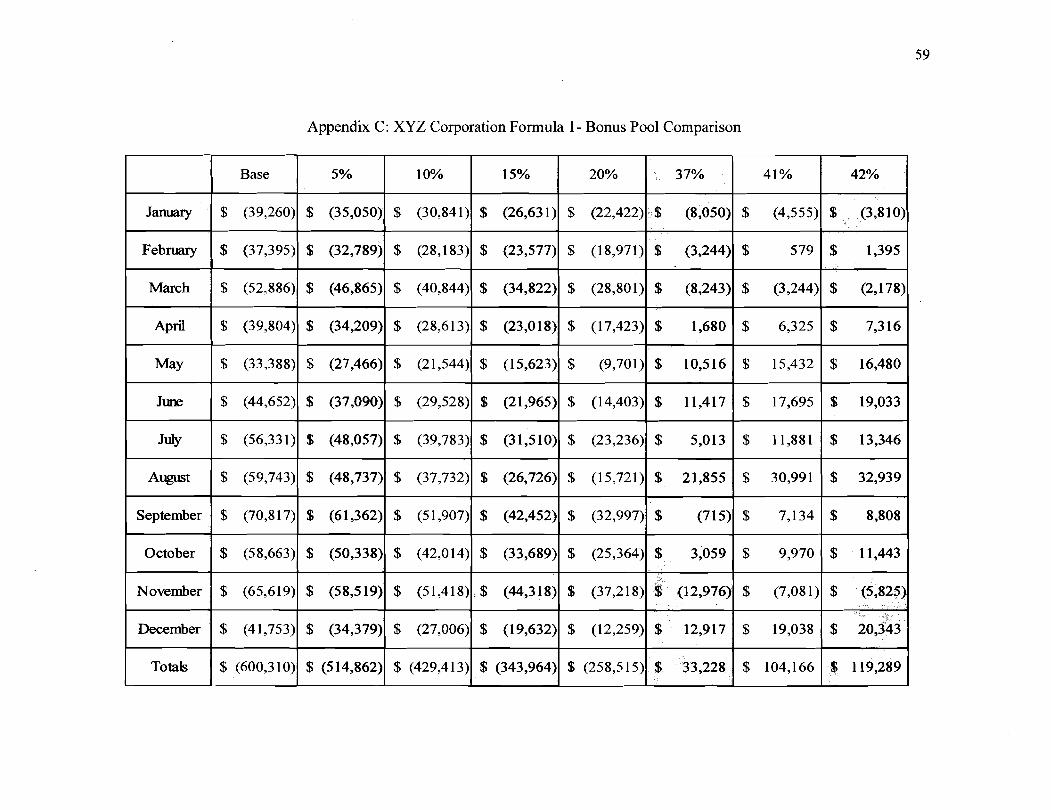
Appendix C: XYZ Corporation Formula 1 - Bonus Pool Comparison
January
February
March
April
May
June
JUb
August
September
October
November
December
Totals
Base
$ (39,260)
$ (37,395)
$ (52,886)
$ (39,804)
$ (33,388)
$ (44,652)
$ (56,331)
$ (59,743)
$ (70,817)
$ (58,663)
$ (65,619)
$ (41,753)
$ (600,310)
15%
$ (26,631)
$ (23,577)
$ (34,822)
$ (23,018)
$ (15,623)
$ (21,965)
$ (31,510)
$ (26,726)
$ (42,452)
$ (33,689)
$ (44,318)
$ (19,632)
$ (343,964)
5%
$ (35,050)
$ (32,789)
$ (46,865)
$ (34,209)
$ (27,466)
$ (37,090)
$ (48,057)
$ (48,737)
$ (61,362)
$ (50,338)
$ (58,519)
$ (34,379)
$ (514,862)
10%
$ (30,841)
$ (28,183)
$ (40,844)
$ (28,613)
$ (21,544)
$ (29,528)
$ (39,783)
$ (37,732)
$ (51,907)
$ (42,014)
$ (51,418)
$ (27,006)
$ (429,413)
42%
$ (3,810)
$ 1,395
$ (2,178)
$ 7,316
$ 16,480
$ 19,033
$ 13,346
$ 32,939
$ 8,808
$ 11,443
$ (5,825)
$ 20,343
$ 119,289
20%
$ (22,422)
$ (18,971)
$ (28,801)
$ (17,423)
$ (9,701)
$ (14,403)
$ (23,236)
$ (15,721)
$ (32,997)
$ (25,364)
$ (37,218)
$ (12,259)
$ (258,515)
37%
$ (8,050)
$ (3,244)
$ (8,243)
$ 1,680
$ 10,516
$ 11,417
$ 5,013
$ 21,855
$ (715)
$ 3,059
$ (12,976)
$ 12,917
$ 33,228
41%
$ (4,555)
$ 579
$ (3,244)
$ 6,325
$ 15,432
$ 17,695
$ 11,881
$ 30,991
$ 7,134
$ 9,970
$ (7,081)
$ 19,038
$ 104,166
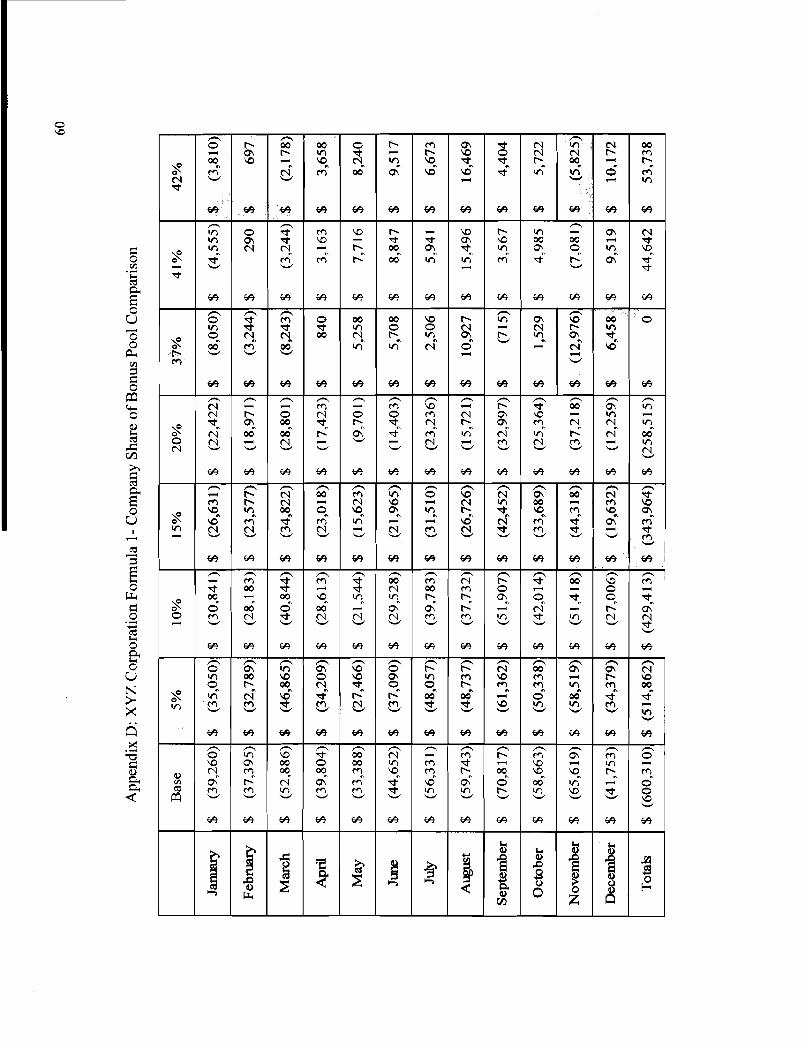
m
w w w w w w w w w w w w w
m m , Q - , d m % 2 Z Z $ o?
6 9 @ @ 6 9 6 9 6 9 6 4 @ @ 6 9 @ 6 4 @
o e m o w w m b m m m w o 'f"
w w w w w w w w w w # w @
N - - m - - m Q d b d s G G - N b O N O O m N m Q - m -
@ @ @ @ @ @ @ @ @ @ @ @ @
'",
w @ w w w w w w w w w # #
6
s - d
m
IA
%
m n N q -
n n n
w w w
=1,
N a z a z
3 b N W
n
Zm 3
h
d w
y s x ,
6-
\on
* w * - * N w m S 2 2 0 - m , - w , \ o v r v r Y r o \
g o d o w - m m b - - 3 a s a a a 3 3 c
m b F A $ " m g B M . g ? % 3
6- -
2
b!
#
3
c.i w
h
Z N w Z b a a m
*!
h h h h h
'fin
n
b
*.s""'-mz.-r"" , a c a a z ~ . ~
z*
--
$ 3 ,
n 0
"- m
n n n n n n n
O! S r D > 6 m m - - m
3 S $ C ; 3 , . ,
:n
G 3 G g n ,","
n n n
n v,
2-
v , o d m ~ b - - ~
" " X z - N
\D.
n
h
En w
h
- 5 - w
mm
" m
= $ ? z t n t n m
m 6 6 6 m O o N - N b m
h h h h h h h h h h
m b N - z g 2 N m W QI,
3 a a c a z a c a s 3 s z z
- m * m * S G G h h h
" 2 3 f
2-i%w.m,\om
ln 0\
*.,
c\1
PJ m
* a 2
--
d Y
\o d d
w
a
$ W
w
Em ~ 3 c S c a c s s z 9 9 0 ~
N O . m b Q ; O m 3 z c z 3 s c c b c s s g
o m m S 6 6 C C 3 S G G 3 m w m o m m m m m m - b m ze @ w w w w w w e 3 w w @ w w
Q m w o w v , m * + Q z 2 2
@ @ @ 6 9 @ @ @ @ @ @ 6 4 @ @
6
s q ~ $ z n h h h n n
?
m b m
wn
?.
zn
3 0 2 6 6
Q. v,
('?!
'? +
*'
w
". 0
w
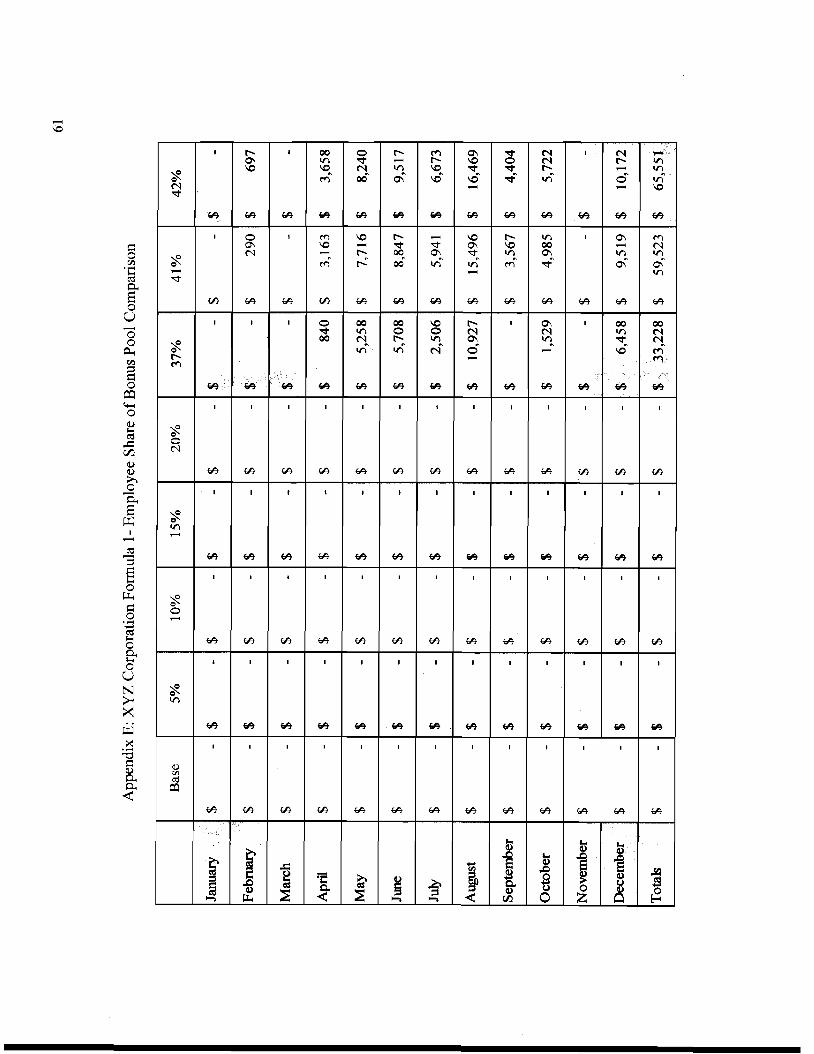
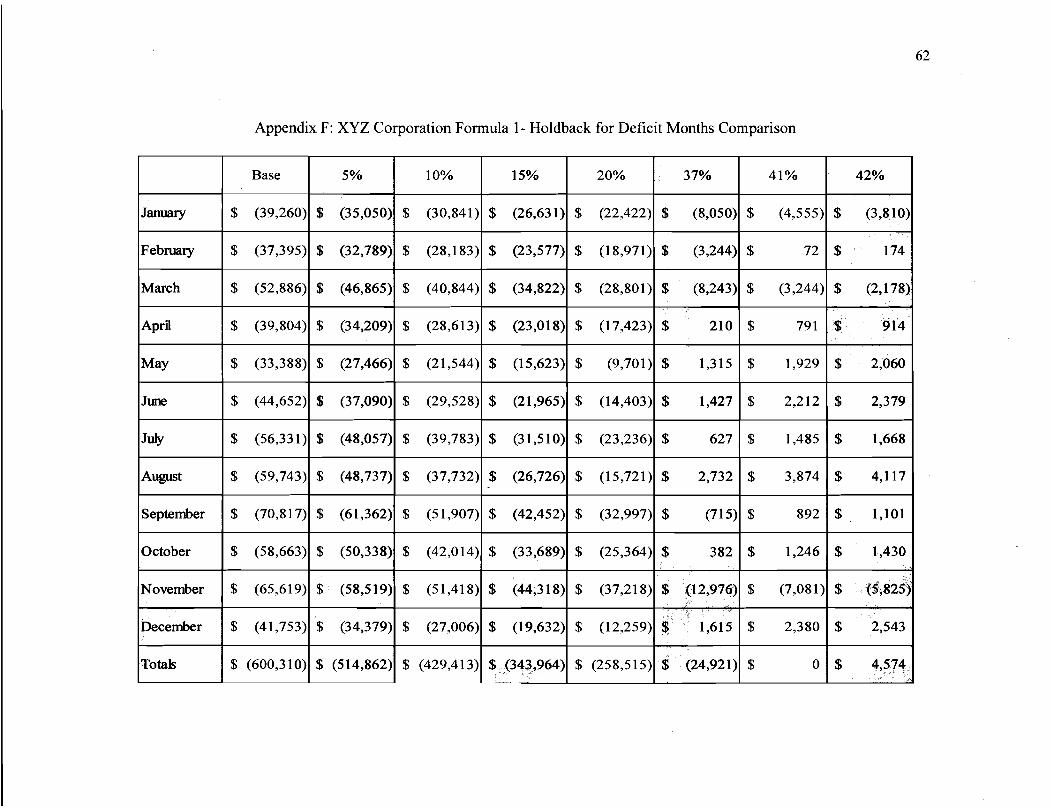
Appendix F: XYZ Corporation Formula 1 - Holdback for Deficit Months Comparison
January
February
March
April
May
June
J U b
August
September
October
November
December
Totak
Base
$ (39,260)
$ (37,395)
$ (52,886)
$ (39,804)
$ (33,388)
$ (44,652)
$ (56,331)
$ (59,743)
$ (70,817)
$ (58,663)
$ (65,619)
$ (41,753)
$ (600,310)
5%
$ (35,050)
$ (32,789)
$ (46,865)
$ (34,209)
$ (27,466)
$ (37,090)
$ (48,057)
$ (48,737)
$ (61,362)
$ (50,338)
$ (58,519)
$ (34,379)
$ (514,862)
10%
$ (30,841)
$ (28,183)
$ (40,844)
$ (28,613)
$ (21,544)
$ (29,528)
$ (39,783)
$ (37,732)
$ (51,907)
$ (42,014)
$ (51,418)
$ (27,006)
$ (429,413)
15%
$ (26,631)
$ (23,577)
$ (34,822)
$ (23,018)
$ (15,623)
$ (21,965)
$ (31,510)
$ (26,726)
$ (42,452)
$ (33,689)
$ (44,318)
$ (19,632)
$ (343,964)
20%
$ (22,422)
$ (18,971)
$ (28,801)
$ (17,423)
$ (9,701)
$ (14,403)
$ (23,236)
$ (15,721)
$ (32,997)
$ (25,364)
$ (37,218)
$ (12,259)
$ (258,515)
4 1 %
$ (4,555)
$ 72
$ (3,244)
$ 791
$ 1,929
$ 2,212
$ 1,485
$ 3,874
$ 892
$ 1,246
$ (7,081)
$ 2,380
$ 0
37%
$ (8,050)
$ (3,244)
$ (8,243)
$ 210
$ 1,315
$ 1,427
$ 627
$ 2,732
$ (715)
$ 382
$ (12,976)
$ 1,615
$ (24,921)
42%
$ (3,810)
$ 1 74
$ (2,178)
$ 914
$ 2,060
$ 2,379
$ 1,668
$ 4,117
$ 1,101
$ 1,430
$ (&825)
$ 2,543
$ 4,574 -
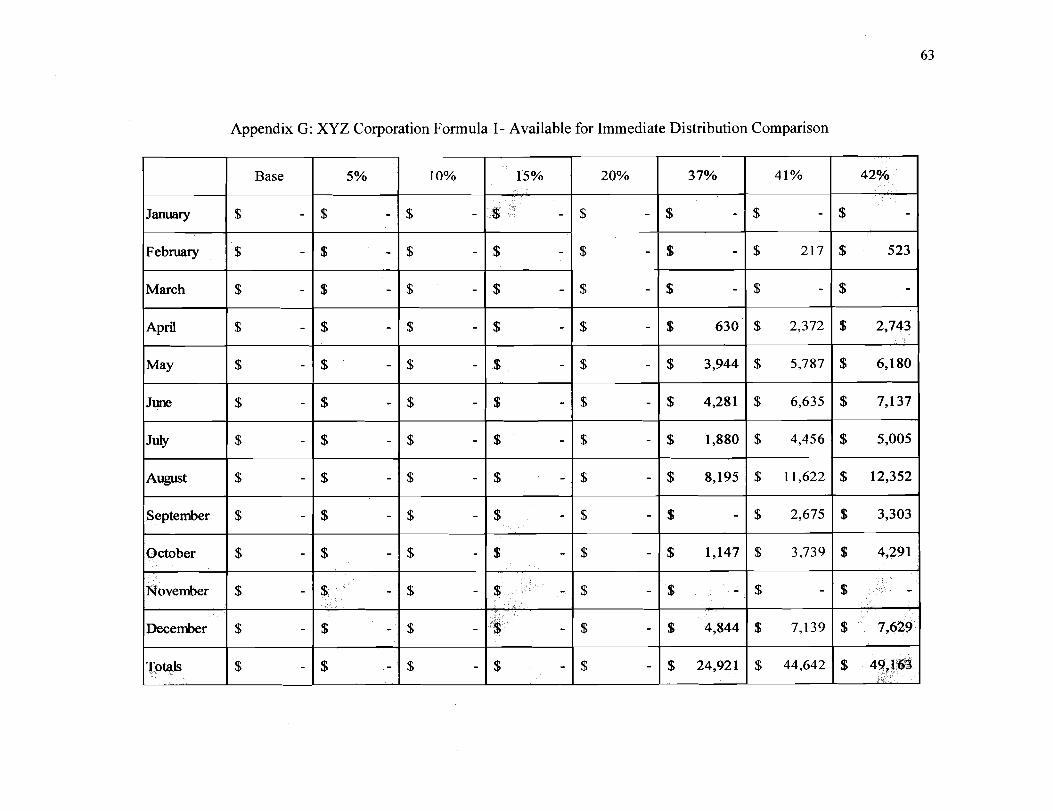
Appendix G: XYZ Corporation Formula 1- Available for Immediate Distribution Comparison
42%
$ -
$ 523
$ -
20%
$ -
$ -
$ -
January
February
March
10%
$ -
$ -
$ -
37%
$ -
$ -
$ -
15%
$ - -
$ -
$ -
Base
$ -
$ -
$ -
41%
$ -
$ 217
$ -
5%
$ -
$ -
$ -
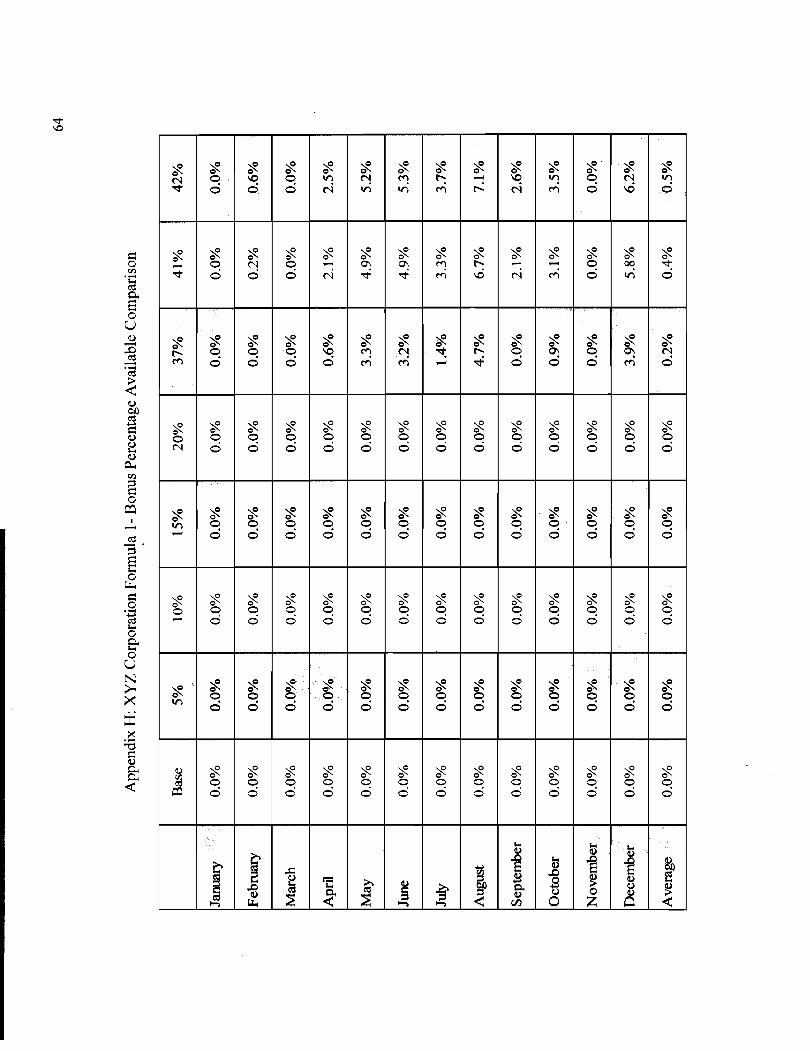
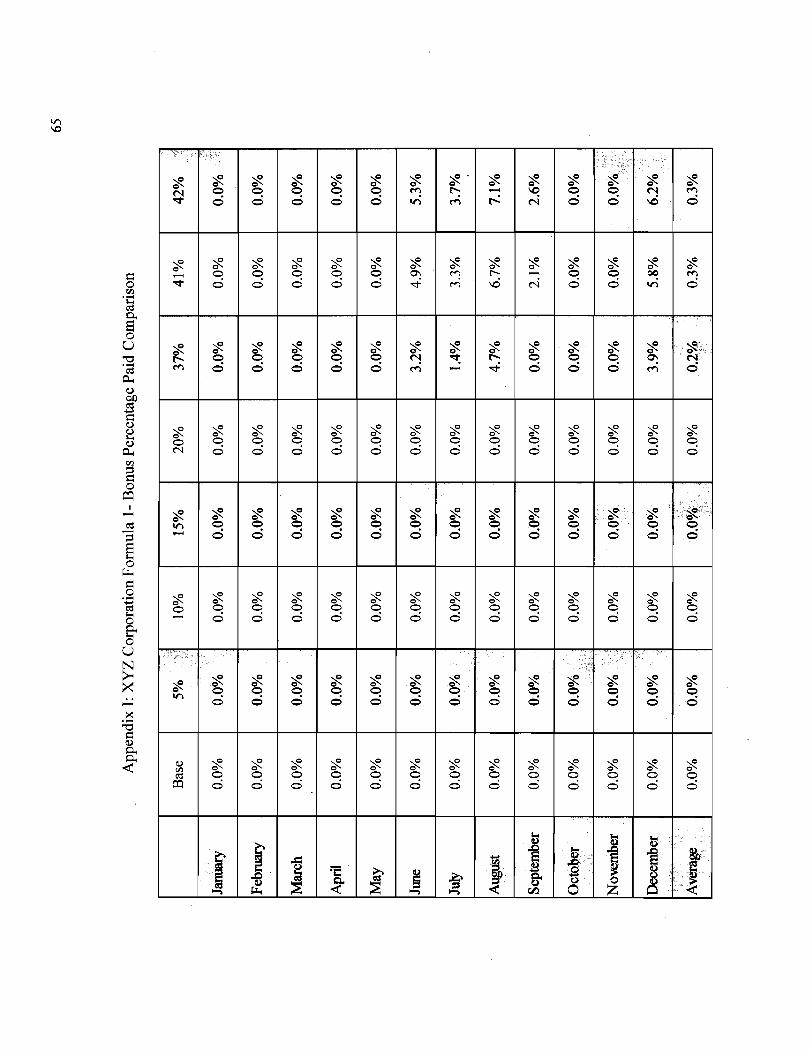
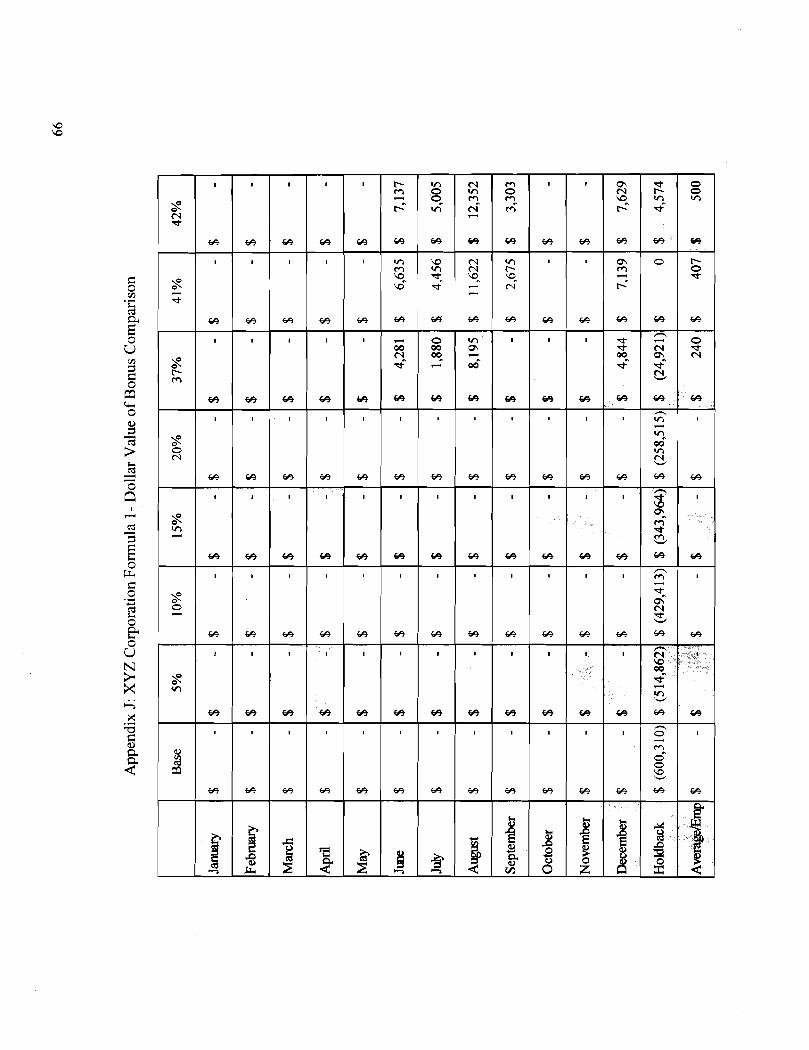
0 d
a b (U
I
I
I
I
Vc
m
d
s C
d
s F m
3 m
(U
I
I
I
I
I
I
I e V c N m
V c \ D ( U ' n
I
I
I
I
I
I
I
I
I
r,
I
I
I
M O V c O
c 4 s X w 3 w 6 e 6 e w w w 6 e w w w w w 6 e
V c m F
I
I
1
I
I
- w 6 9 6 9 w w 3 w 3 w ' w 3 w w 3 6 9 @ 3 w w 3
2
6 e 6 9 6 9 6 9 € u ~ € e - G 9 6 e G 9 6 e * 6 e
I
: - , z
I
9 8 % I&
I
I
00
I
h o w 00 .o, 3 - &
I
I
:-
m 3
F "
d b 00,
I
1 a - 0 ( U F O :-
I a O F
h h
(U
2 e.
n
2 2
I
% g $ g
I I
r,
I
w 3 w 3 w 3 w w w 3 w 3 w 3 w 3 w 3 w 3 w 3 w 3 w 3
6 e € e € e 6 e € e w 6 e 6 e € e € e 6 e € e w € e
I I
b
- I ,
I
J2 B P ! , 6 P B , ,
I
4 a
I n
52 ?, 0 0 z
1 2 ' 1 4
I
B
9
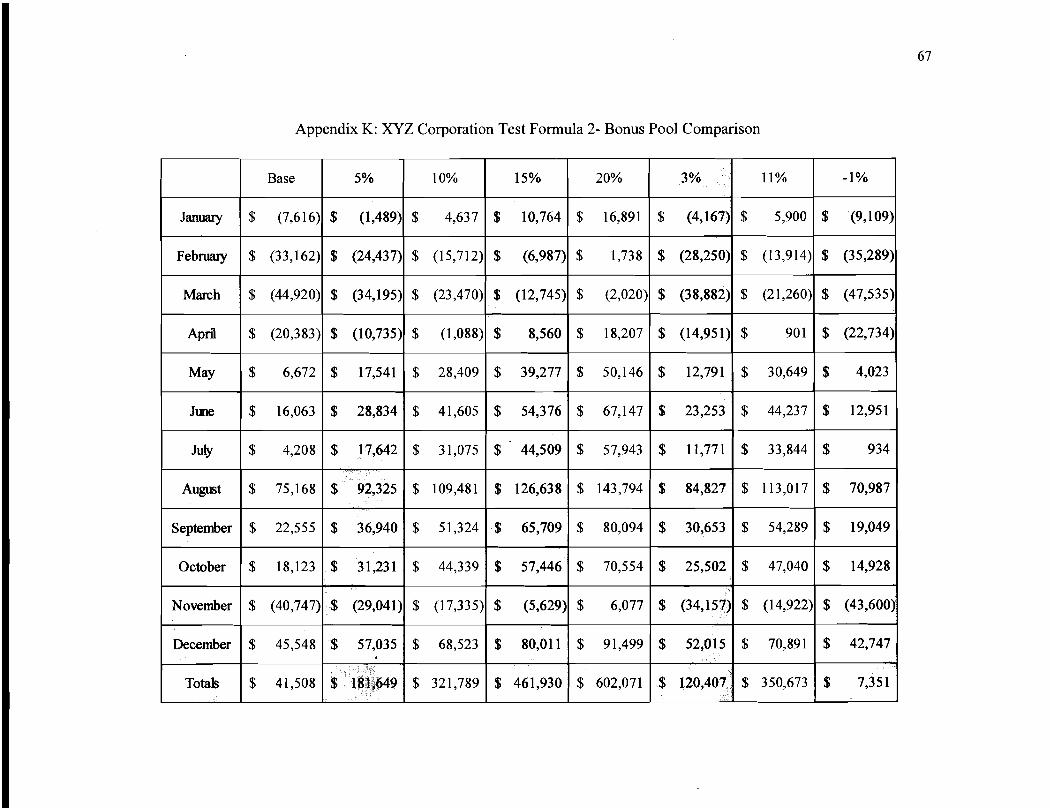
Appendix K: XYZ Corporation Test Formula 2- Bonus Pool Comparison
January
February
March
April
May
June
July
August
September
October
3%
$ (4,167)
$ (28,250)
$ (38,882)
$ (14,951)
$ 12,791
$ 23,253
$ 11,771
$ 84,827
$ 30,653
$ 25,502
11%
$ 5,900
$ (13,914)
$ (21,260)
$ 901
$ 30,649
$ 44,237
$ 33,844
$ 113,017
$ 54,289
$ 47,040
20%
$ 16,891
$ 1,738
$ (2,020)
$ 18,207
$ 50,146
$ 67,147
$ 57,943
$ 143,794
$ 80,094
$ 70,554
Base
$ (7,616)
$ (33,162)
$ (44,920)
$ (20,383)
$ 6,672
$ 16,063
$ 4,208
$ 75,168
$ 22,555
$ 18,123
-1%
$ (9,109)
$ (35,289)
$ (47,535)
$ (22,734) - $ 4,023
$ 12,951
$ 934
$ 70,987
$ 19,049
$ 14,928
5%
$ (1,489)
$ (24,437)
$ (34,195)
$ (10,735)
$ 17,541
$ 28,834
$ 17,642
$ 92,325
$ 36,940
$ 31,231
10%
$ 4,637
$ (15,712)
$ (23,470)
$ (1,088)
$ 28,409
$ 41,605
$ 31,075
$ 109,481
$ 51,324
$ 44,339
15%
$ 10,764
$ (6,987)
$ (12,745)
$ 8,560
$ 39,277 -
$ 54,376
$ 44,509
$ 126,638
$ 65,709
$ 57,446
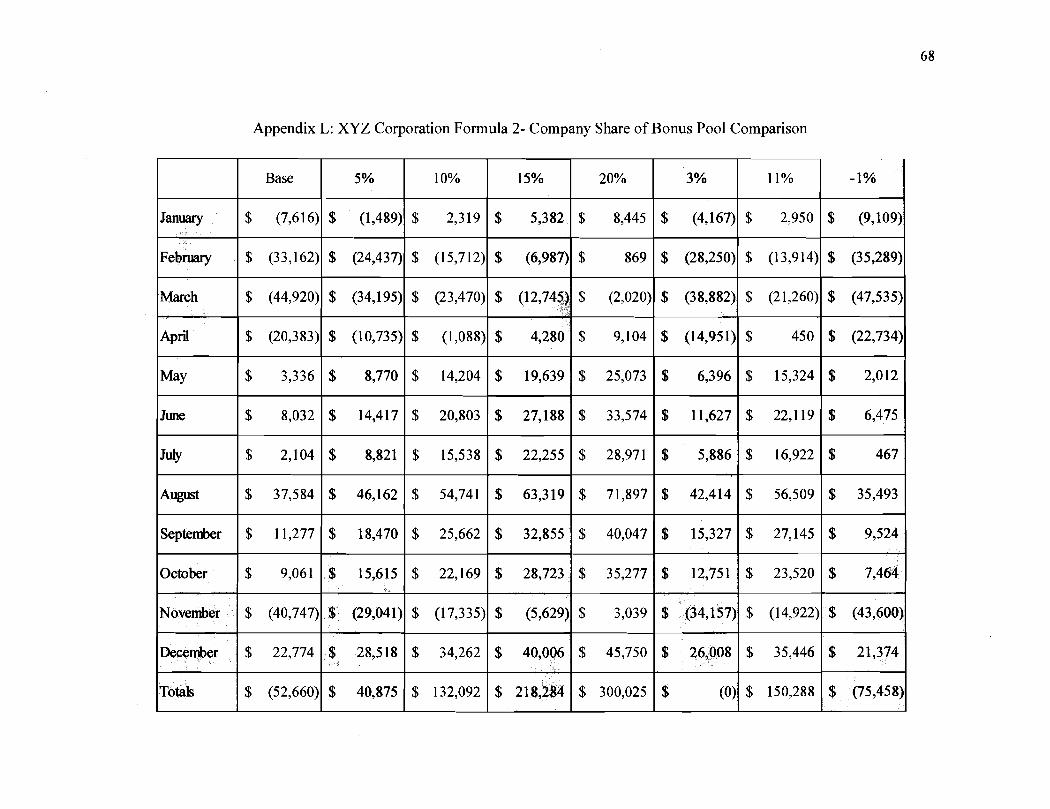
Appendix L: XYZ Corporation Formula 2- Company Share of Bonus Pool Comparison
January
February
March
A P ~
May
June
July
A w ~
September
October
Base
$ (7,616)
$ (33,162)
$ (44,920)
$ (20,383)
$ 3,336
$ 8,032
$ 2,104
$ 37,584
$ 11,277
$ 9,061
11%
$ 2,950
$ (13,914)
$ (21,260)
$ 450
$ 15,324
$ 22,119
$ 16,922
$ 56,509
$ 27,145
$ 23,520
- 1%
$ (9,109)
$ (35,289)
$ (47,535)
$ (22,734)
$ 2,012
$ 6,475
$ 467
$ 35,493
$ 9,524
$ 7,464
5%
$ (1,489)
$ (24,437)
$ (34,195)
$ (10,735)
$ 8,770
$ 14,417
$ 8,821
$ 46,162
$ 18,470
$ 15,615
10%
$ 2,319
$ (15,712)
$ (23,470)
$ (1,088)
$ 14,204
$ 20,803
$ 15,538
$ 54,741
$ 25,662
$ 22,169
15%
$ 5,382
$ (6,987)
$ (12,745)
$ 4,280
$ 19,639
$ 27,188
$ 22,255
$ 63,319
$ 32,855
$ 28,723
20%
$ 8,445
$ 869
$ (2,020)
$ 9,104
$ 25,073
$ 33,574
$ 28,971
$ 71,897
$ 40,047
$ 35,277
3%
$ (4,167)
$ (28,250)
$ (38,882)
$ (14,951)
$ 6,396
$ 11,627
$ 5,886
$ 42,414
$ 15,327
$ 12,751
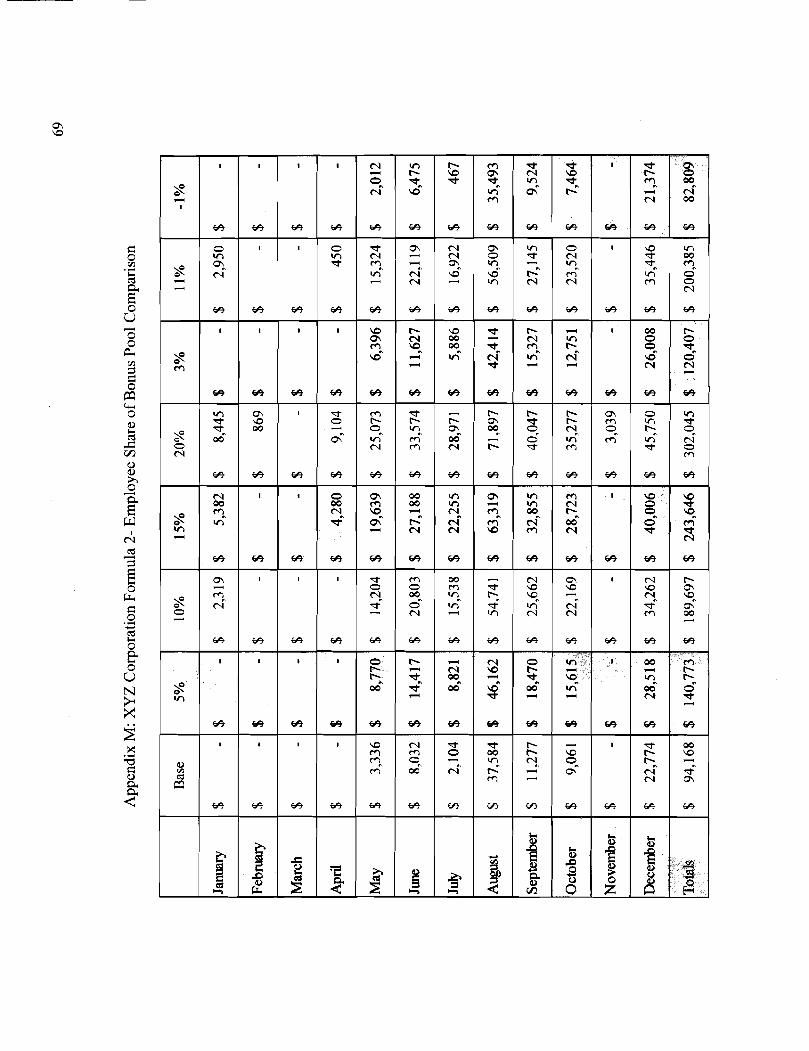
2-
V, 00
2 o Pi
CI 0
3 2
0 m
\O d
m d *
b Q\ z- oo
m b
g- z
00
+ d- Q\
2 : s !
m
\o
g K i z z K i m z- d
b m d + b b b ~ \ 0 ~ 1 z C I b C I Q \ d b m m b
00, ~ i m ~ b w m
2- * * \ O m *
2
m P - N Z e - ,
=* d
m o c 6 t - + Z m
I
m b
I
&
:-
I
I
I
I
I
I
I
I
I
I
I
s 3 I
s - +
I $
s o Pi
m 3
s z
s m
8 m
!
2 m m
2 3
:*
, m
0
*-
0 0 - W
+
2-
m, m 3
*! \O
a,, m
2-
;-
m m,
I
0 m
2
I
In d W
;-
2 $ 3
2 :-
I
I
3
Pi
t = m '",
3 " 2
L!
Ifl Pi-
1
3 3
I
I
I
Q\
00
I
I
I
I
2-
P i 3 " c . ? z N
3 3
3
3
-!
z-
CI
s- 3
;3̂
I
I
+ 8 X m m 3
I
I
I
d
€ e € e € e € e € e € e € e € e f A € e f / ) € e € e
O d Q \ P i Q \ l n O N
€ e € e € e € e € e € e € e € e € e € e € e € e € e
z* F / ) F / ) F / ) 6 4 6 4 6 4 6 4 6 4 ~ c i ) € e F / )
€ e € e € e € e € e F A € e € e € e € e € e € e
s g % s z s z Z!
6 4 6 4 6 4
* m 0 0 + P i Q \ o o m w w
'", m N I n P i N
f A € e F A € e F A € e ~ F A F A
3
Z!
e 9 F / ) F / ) 6 4 ~ w 3 f # 9
W P i d d b +
2
f A F A F A ~ € e F A ~ € e F A F A F A
' P % *! - N o 0
W d 9 m m
00 0
% *
d
w 0 0, o d
Pi w
;- m
00 - '??
00 *
d b W
2 N
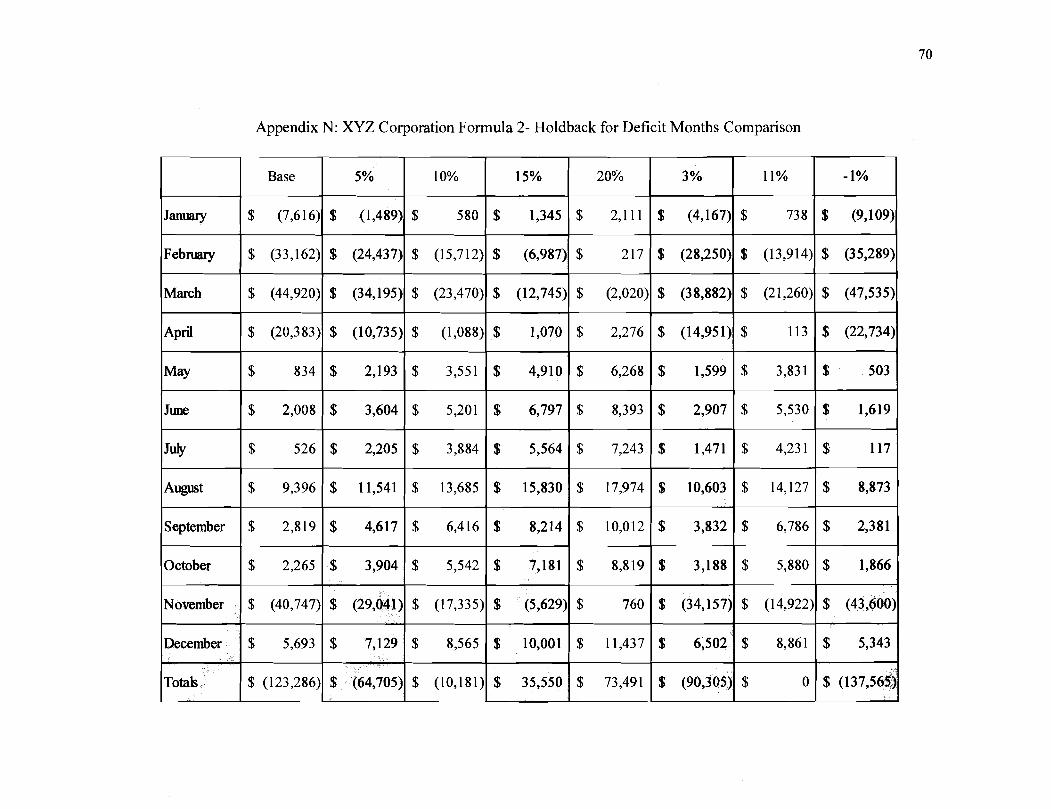
Appendix N: XYZ Corporation Formula 2- Holdback for Deficit Months Comparison
January
February
March
April
May
June
11%
738
$ (13,914)
$ (21,260)
$ 113
$ 3,831
$ 5,530
- 1%
$ (9,109)
$ (35,289)
$ (47,535)
$ (22,734)
$ 503
1,619
Base
$ (7,616)
$ (33,162)
$ (44,920)
$ (20,383)
$ 834
$ 2,008
5%
$ (1,489)
$ (24,437)
$ (34,195)
$ (10,735)
$ 2,193
$ 3,604
10%
$ 580
$ (15,712)
$ (23,470)
$ (1,088)
$ 3,551
$ 5,201
20%
$ 2,111
$ 217
$ (2,020)
$ 2,276
$ 6,268
$ 8,393
15%
$ 1,345
$ (6,987)
$ (12,745)
$ 1,070
$ 4,910
$ 6,797
3%
$ (4,167)$
$ (28,250)
$ (38,882)
$ (14,951)
$ 1,599
$ 2,907
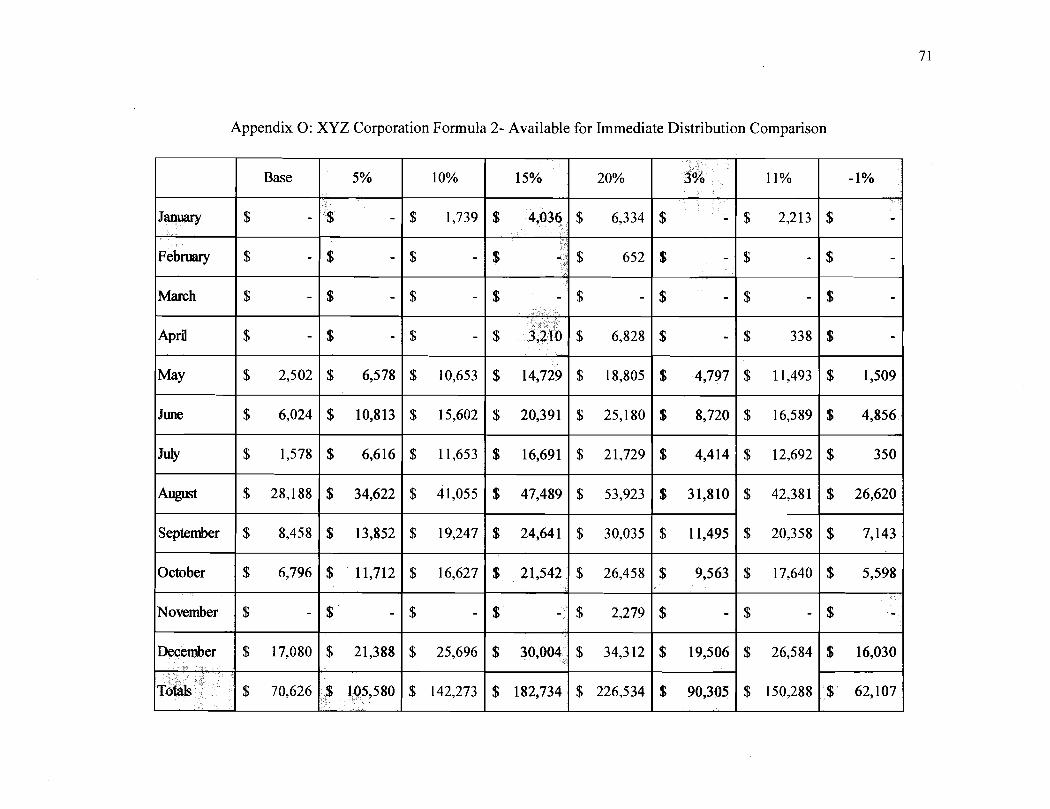
Appendix 0: XYZ Corporation Formula 2- Available for Immediate Distribution Comparison
July
A w ~
September
$ 1,578
$ 28,188
$ 8,458
$ 6,616
$ 34,622
$ 13,852
$ 11,653
$ 41,055
$ 19,247
$ 16,691
$ 47,489
$ 24,641
$ 21,729
$ 53,923
$ 30,035
$ 4,414
$ 31,810
$ 11,495
$ 12,692
$ 42,381
$ 20,358
i
$ 350
$ 26,620
$ 7,143
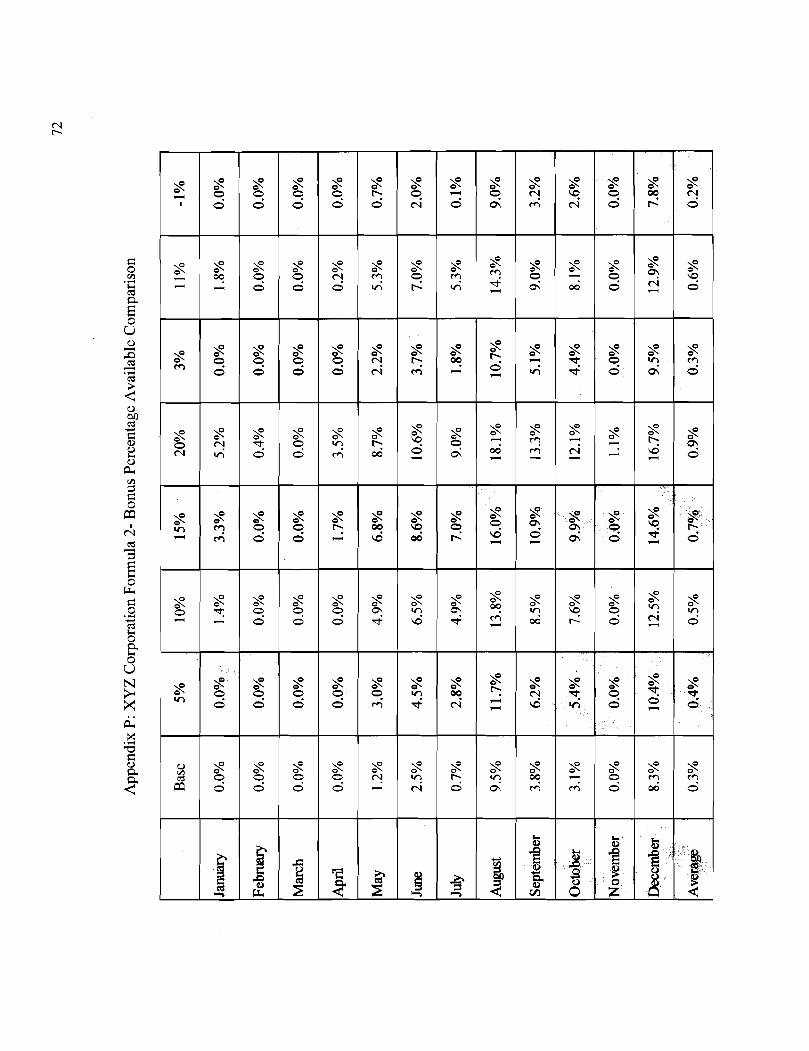
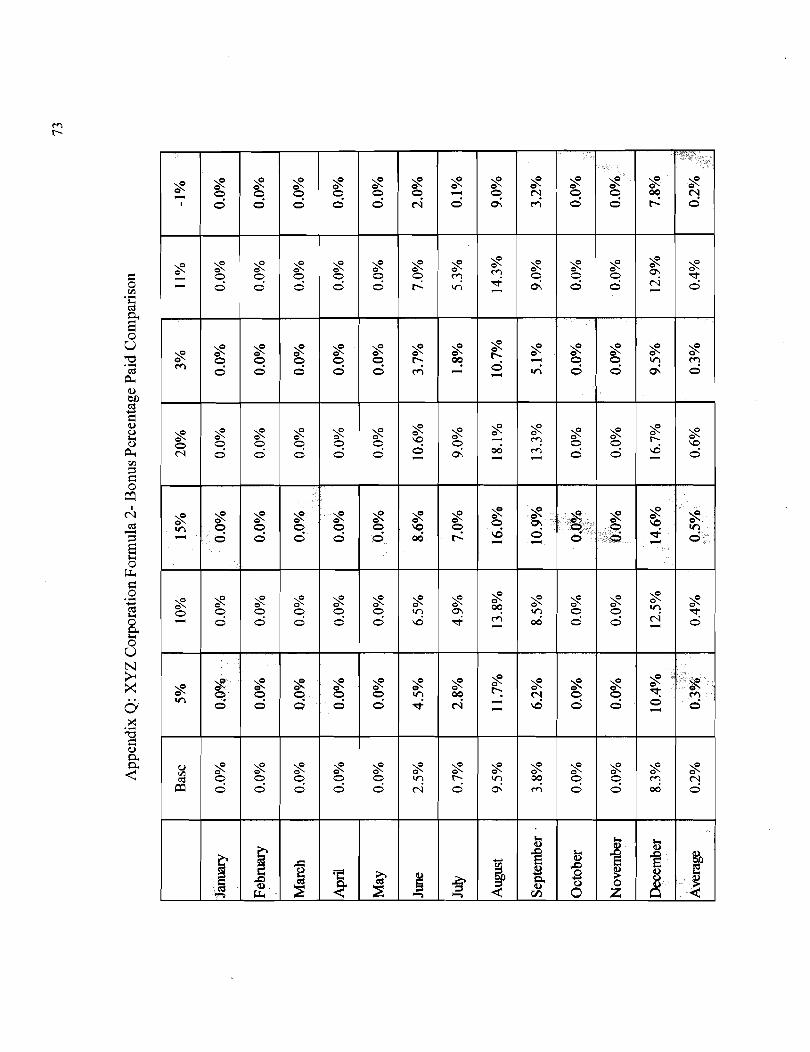
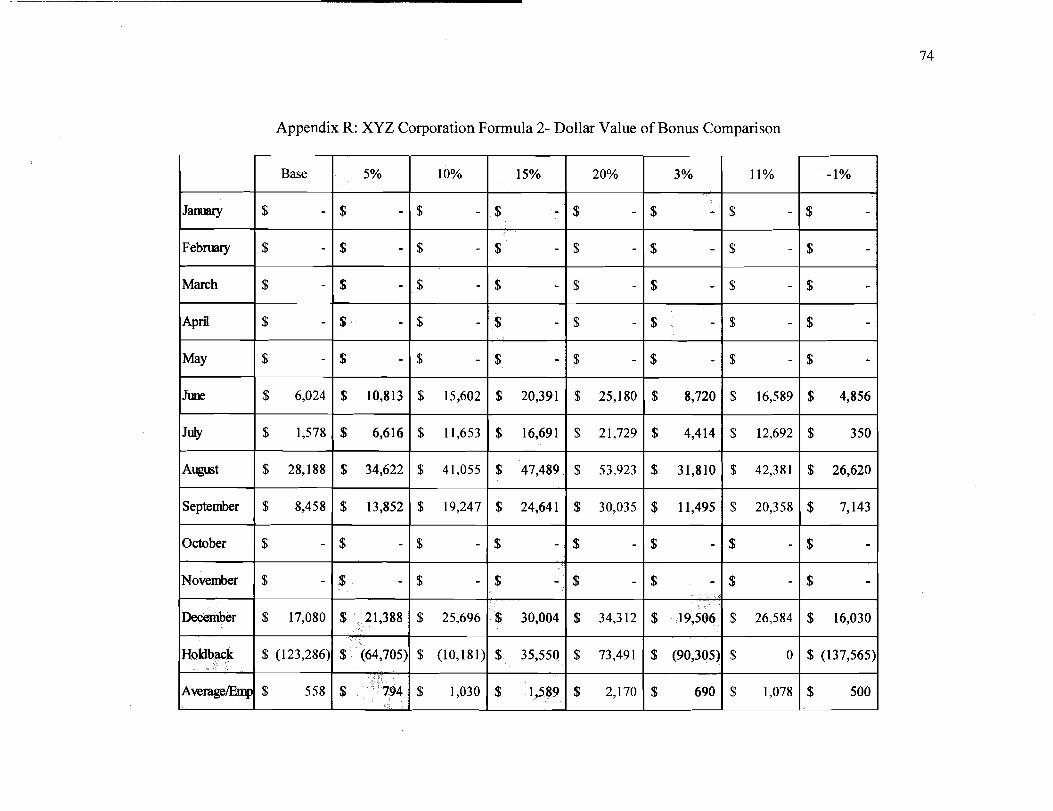
Appendix R: XYZ Corporation Formula 2- Dollar Value of Bonus Comparison
J-
February
March
A P ~
May
June
July
Base
$ -
$ -
$ -
$ -
$ -
$ 6,024
$ 1,578
5%
$ -
$ -
$ -
$ -
$ -
$ 10,813
$ 6,616
10%
$ -
$ -
$ -
$ -
$ -
$ 15,602
$ 11,653
15%
$ -
$ -
$ -
$ -
$ -
$ 20,391
$ 16,691
20%
$ -
$ -
$ -
$ -
$ -
$ 25,180
$ 21,729
3%
$ - $ -
$ -
$ -
$ -
$ 8,720
$ 4,414
11%
$ -
$ -
$ -
$ -
$ -
$ 16,589
$ 12,692
- 1%
$
$ -
$ -
$ -
$ -
$ 4,856
$ 350
Appendix S: Executive Summary
The purpose of the study was to research various gainsharing plans and formulas
through literature review, define the characteristics of a successful gainsharing program,
provide an implementation procedure, and develop and test a gainsharing formula
specifically for XYZ Corporation. Gainsharing plans are team-based reward programs
that benefit the employees and the organization by sharing in any gains that are achieved
by the employees. A Theory Y management style generally works best when
implementing a gainsharing program as this philosophy is based on actively seeking
employee ideas, developing work teams, teamwork, and employee involvement.
Employees must come to understand how their work is part of a team and how they are
able to contribute to the organization. According to Boyett & Boyett (2004), a company
can see an average of 17.3% gains in quality and productivity improvements per year
after implementing gainsharing. Along with the quality and productivity improvements,
other benefits include improved morale and job satisfaction along with a reduction in
turnover and absenteeism.
Upon researching various types of gainsharing formulas and selecting an available
measure at XYZ Corporation that the employees could affedcontrol, acted as a driver
towards strategic objectives, and was able to be measured financially, two formulas were
developed and tested. Both formulas focused on allowed payroll costs versus actual
payroll costs for a monthly time period. The first formula (see Table 5) used standards
available at XYZ Corporation, while the second formula (see Table 6) utilized historical
data from 2005 to calculate a ratio of actual payroll costs to sales value of production.
This ratio was then used to calculate an allowed payroll cost based on the value of
production for the month. Each formula was tested using base information from 2005 and
improvements in actual payroll costs of 5%, lo%, 15%, and 20%. Next the formulas were
tested to determine the percentage of improvement required for the company to break
even on their bonus pool account, the break even point for the holdback for deficit
months' account, and the percentage of improvement required for each participating
employee to receive a $500 bonus for the year.
When testing the first formula utilizing company standards to determine the
allowed payroll costs, the employees did not receive a bonus even when showing a 20%
reduction in actual payroll costs (see Table 7). From the 2005 base information, actual
payroll costs were $600,000 more than the allowed payroll costs. With a 20% reduction
in actual payroll costs this was reduced to a $258,000 variance. At a 37% improvement
the employees received $240 in bonuses for the year and the company share of the bonus
pool reached the break even point. It was not until the employees reached a 42%
improvement that they achieved a $500 bonus for the year.
Under the second formula in which a calculated ratio was used, the employees
received $560 in bonuses for the year when using the base information (see Table 8). The
company, however, still showed a negative variance of $175,000 for the year in the
company share of bonus pool and holdback for deficit months' accounts. At 15%
improvement the employees received nearly $1600 dollars for the year and the company
showed a positive variance of approximately $253,000 in the company share of bonus
pool and holdback for deficit months' accounts. The company share of bonus pool
account achieved the break-even point at 3% improvement, while the employees still
received a $500 bonus with a 1% reduction in efficiency.
Gainsharing formulas are meant to be a win-win for both the company and the
employees, while being easy to understand and calculate, and assisting in directing the
employees' attention to any problem areas. Given the above results, the conclusion can
be drawn that it would not be appropriate to implement a gainsharing program at this
time at XYZ Corporation. Under the first formula, the employees were unable to attain
benefits from their efforts until they achieved a 20% improvement. Even at this level of
improvement the company would still see a negative variance between actual payroll
costs and allowed payroll costs. Two theories can be drawn from this information:
1) the standards that are being used to calculate the allowed payroll costs are
inaccurate or
2) the employees have inherently slowed down throughout the year due to a
company philosophy of not laying people off during the slow periods.
Given the above two theories for the lack of accuracy in formula 1, formula 2 is also
deemed an unacceptable option. Furthermore, both formulas fail the last criterion of a
successful gainsharing formula by limiting the employees' focus solely on allowable
payroll costs and not allowing them to focus their attention on other problem areas. In
order for a gainsharing plan to be successful at XYZ Corporation either the demand needs
to be steadied or the labor pool must be leveled to meet the fluctuating demand. Upon
reviewing the results the following recommendations may be taken under consideration:
XYZ Corporation Test Formula 2 (see Table 6 ) could be expanded to use the
information from the previous three years to develop a more accurate base
ratio. Once the base ratio has been developed, a rolling average could be used
and recalculated annually.
XYZ Corporation could assess how supportive their management practices are
of the gainsharing philosophy of employee involvement, visible measures, and
allowing employees to have an influence on their area.
XYZ Corporation could begin to practice employee involvement by forming
formal committees, teams, and councils.
Implement Lean Manufacturing techniques for a few years to gain some
consistency in the manufacturing processes, achieve some initial benefits by
plucking the "low hanging fruit", and define the appropriate measures that
would work towards the strategic objectives of the organization. This would
also assist in aligning the management practices and philosophy with
gainsharing.
Define better measurements that would work towards the strategic objectives
of the organization and make them visible to the employees. Some measures
to consider would include:
Throughput time
On-time delivery
Overall Equipment Efficiency (OEE)
Scrap
ReworMCost of QualityIReturns
Ultimately, possibly with the measures above, use a balanced scorecard
method with tiered profit gates. This would prevent the employees from
focusing on one measure while the others slipped. A tiered profit gate would
pay a portion of the bonus to the employees provided they met certain profit
levels. As the profit level increased, the employees would receive a higher
portion of their bonus. This would guarantee the formula was beneficial to the
company while the employees made improvements.
Expand the formula to cover all employees except upper management. A
profit sharing system may be beneficial for use with upper management.
This is not an exhaustive list of recommendations or future steps for XYZ Corporation to
take under consideration. However, it may provide the beginning steps that XYZ
Corporation can take towards implementing the gainsharing philosophy and programs
and ultimately realizing the many benefits that are associated with gainsharing.