DEVELOPMENT AND EVALUATION OF FRACTURE MECHANICS TEST ... · DEVELOPMENT AND EVALUATION OF FRACTURE...
29
DEVELOPMENT AND EVALUATION OF FRACTURE MECHANICS TEST METHODS FOR SANDWICH COMPOSITES Daniel O. Adams, Joseph Nelson, Zack Bluth, and Chris Hansen Department of Mechanical Engineering University of Utah Salt Lake City, UT 84112 ABSTRACT The objective of this research investigation is to develop standardized test methods for characterizing both the Mode I and Mode II energy release rate associated with facesheet/core delamination growth in sandwich composites. For Mode I testing, the Single Cantilever Beam (SCB) test has been selected. Earlier research focused on assessing the acceptable ranges of several geometric parameters and material properties of the SCB sandwich specimen. Recent research has focused on specimen width effects as well as the use of facesheet doublers to reduce facesheet rotation when testing sandwich composites with very thin facesheets. For the width effect study, testing and analysis was performed using three widths of both Nomex honeycomb and aluminum honeycomb core sandwich specimens. Of particular interest was the minimum number of honeycomb cells required across the specimen width. To investigate the use of facesheet doublers, tests and analyses were performed using carbon/epoxy facesheets bonded to Nomex honeycomb cores. Of interest was the possible use of conventional tabbing material (G10 woven glass/epoxy circuit board material) as a facesheet doubler. For Mode II testing, an End Notched Shear (ENS) test has been developed. Recent research has focused on establishing proper beam support spans as well as initial crack lengths to allow utilization of a compliance calibration-based G IIC calculation and to produce stable crack growth. Expected benefits to aviation include standardized and industry-accepted fracture mechanics test methods for sandwich composites. The results from these tests may be used as inputs to damage analyses for predicting facesheet/core delamination growth in sandwich structures. Additionally, an FAA Technical Center report will be produced, providing additional guidance for aviation industry users.
Transcript of DEVELOPMENT AND EVALUATION OF FRACTURE MECHANICS TEST ... · DEVELOPMENT AND EVALUATION OF FRACTURE...
DEVELOPMENT AND EVALUATION OF FRACTURE MECHANICS
TEST METHODS FOR SANDWICH COMPOSITES
Daniel O. Adams, Joseph Nelson, Zack Bluth, and Chris Hansen Department of Mechanical Engineering
University of Utah Salt Lake City, UT 84112
ABSTRACT The objective of this research investigation is to develop standardized test methods for characterizing both the Mode I and Mode II energy release rate associated with facesheet/core delamination growth in sandwich composites. For Mode I testing, the Single Cantilever Beam (SCB) test has been selected. Earlier research focused on assessing the acceptable ranges of several geometric parameters and material properties of the SCB sandwich specimen. Recent research has focused on specimen width effects as well as the use of facesheet doublers to reduce facesheet rotation when testing sandwich composites with very thin facesheets. For the width effect study, testing and analysis was performed using three widths of both Nomex honeycomb and aluminum honeycomb core sandwich specimens. Of particular interest was the minimum number of honeycomb cells required across the specimen width. To investigate the use of facesheet doublers, tests and analyses were performed using carbon/epoxy facesheets bonded to Nomex honeycomb cores. Of interest was the possible use of conventional tabbing material (G10 woven glass/epoxy circuit board material) as a facesheet doubler. For Mode II testing, an End Notched Shear (ENS) test has been developed. Recent research has focused on establishing proper beam support spans as well as initial crack lengths to allow utilization of a compliance calibration-based GIIC calculation and to produce stable crack growth. Expected benefits to aviation include standardized and industry-accepted fracture mechanics test methods for sandwich composites. The results from these tests may be used as inputs to damage analyses for predicting facesheet/core delamination growth in sandwich structures. Additionally, an FAA Technical Center report will be produced, providing additional guidance for aviation industry users.

INTRODUCTION
While test methods for fracture mechanics of monolithic composite
laminates are at a high level of maturity, the development of fracture mechanics
test methods for sandwich composites has received considerably less attention.
As a result, there has been no consensus on a suitable test configuration or
specimen geometry for either Mode I or Mode II fracture toughness testing for
sandwich composites. The objective of this research investigation is to develop
test methods for the determination of both the Mode I and Mode II fracture
toughness of sandwich composite materials that are suitable for ASTM
standardization.
Following a comprehensive literature review and initial evaluations of
candidate test configurations, the selection of a recommended test configuration
has been made for both Mode I and Mode II testing. Follow-on testing and
analysis was subsequently performed to establish a range of usage for the
proposed sandwich fracture test methods. Additionally, research focused on
establishing suitable test fixturing as well as recommended data reduction
methodologies for both Mode I and Mode II test methods.
In the latest phase of this research investigation, efforts have focused on
remaining issues identified through earlier parametric studies and testing of a
variety of sandwich configurations. The goal of this phase of investigation is to
arrive at a final test fixture design, specimen configuration, data analysis
methodology, and a final range of acceptable sandwich materials and geometries
for both Mode I and Mode II fracture toughness testing. Recent investigations
and accomplishments associated with the development of both a Mode I and
Mode II fracture mechanics test methods are highlighted in the following
sections.

MODE I: SINGLE CANTILEVER BEAM (SCB) TEST METHOD
Based on a detailed experimental and numerical investigation of five
candidate test configurations1, the Single Cantilever Beam (SCB) test
configuration was selected for Mode I testing. In this configuration, the bottom
facesheet is affixed to a lower support plate to prevent bending deformation in
the core and bottom facesheet. As illustrated in Figure 1, an upward load is
applied through a single piano hinge bonded to the upper facesheet on the
delaminated end of the specimen. Thus, only the upper facesheet is considered
a cantilever beam, and thus the name “Single” Cantilever Beam. Variations of the
SCB test configuration have been researched by Cantwell and Davies2 as well as
Li and Carlsson3-5 and Viana and Carlsson6-7.
Figure 1. Single Cantilever Beam (SCB) test configuration.
Piano Hinge
Delamination
Crack Tip
Applied Load
Plate Support
An important consideration in the development of this test method was the
design of the test fixture. The fixture is required be sufficiently rigid and robust to
support the specimen throughout the test. Yet, the fixture is also needed to be
simple and versatile enough to handle a wide range of sandwich configurations
and allow the test to be performed efficiently in a laboratory environment. Lastly,
the fixture needed to allow for the measuring and gathering of data accurately
without interfering with the natural failure of the specimen.
The base support fixture designed to secure the specimen to the base
plate via an edgewise loading clamp is shown in Figures 2-3. The horizontal
edge clamps, which are bolted to the base plate via slotted holes, can be
adjusted inward and outward to provide sufficient clamping force to hold the
specimen securely to the base plate. To increase the clamping capability, the
clamping surface of the edge clamps was beveled slightly inward. This method of
support was found not only to secure the specimen, but it also acted to center the
specimen on the fixture which aided in ensuring proper loading. Using this edge
constraining technique, it was found that test specimens could effectively be held
during testing and quickly be changed out.
The initial prototype test fixture featured a sliding base plate to which the
sandwich specimen is secured. As loading increases and the delamination along
the upper facesheet propagates, the sandwich specimen is allowed to translate,
ensuring that the applied load remains normal to the sandwich specimen.
However, further analyses by Ratcliffe8,9 as well as the authors has determined
that the translating base can be replaced through the use of an extended loading
rod. Although testing using the translating base as well as the loading rod yielded
similar test results, the loading rod fixturing eliminated the inertial issues
associated with the translating base without affecting the Mode I dominance at
the crack front. Additionally, the use of the loading rod was less complicated.
Thus, the use of a lengthened loading rod has been selected as the preferred
load application method. However, the translating base method is still considered
acceptable.

Figure 2. Prototype Single Cantilever Beam (SCB) test fixture.
Figure 3. Test fixture and specimen showing edgewise clamping mechanism.

Recent research towards the development of a SCB test method has
focused on two remaining issues identified through earlier parametric studies and
testing of a variety of sandwich configurations specimens: specimen width effects
and subsequent recommendations for specimen width; and the use of facesheet
doublers to reduce facesheet rotation when testing sandwich composites with
thin facesheets. Recent investigations and accomplishments associated with
each of these topics are highlighted in the following sections.
Specimen Width Effects While a single recommended specimen width is preferred for the SCB
test, geometric and material properties of the core and facesheet have been
found to affect widthwise variations in the energy release rate. One consideration
affecting the recommended specimen width is the curved crack front resulting
from anticlastic curvature during facesheet bending. Anticlastic curvature is a
Poisson’s ratio induced deformation which causes a transverse, or saddle-
shaped, curvature to develop when a bending moment is applied to the
facesheet. These anticlastic effects are most pronounced in facesheet laminates
with high in-plane Poisson’s ratio (ν12) properties. Sandwich composites
constructed using facesheets with high ν12 properties will therefore see increased
degrees of debond curvature over facesheets with low ν12 properties, as shown
in Figure 4. The anticlastic bending of the facesheet results in a thumbnail
shaped debond with areas of increased curvature near the edges of the
specimen.
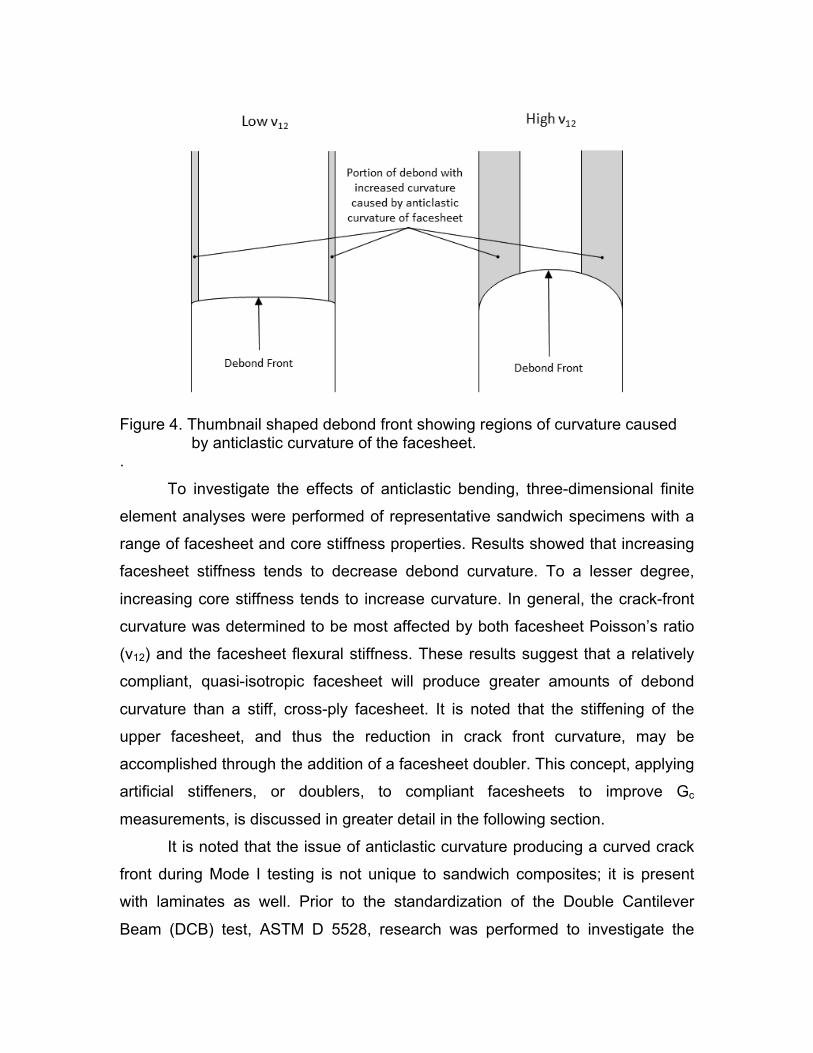
Figure 4. Thumbnail shaped debond front showing regions of curvature caused
by anticlastic curvature of the facesheet. .
To investigate the effects of anticlastic bending, three-dimensional finite
element analyses were performed of representative sandwich specimens with a
range of facesheet and core stiffness properties. Results showed that increasing
facesheet stiffness tends to decrease debond curvature. To a lesser degree,
increasing core stiffness tends to increase curvature. In general, the crack-front
curvature was determined to be most affected by both facesheet Poisson’s ratio
(ν12) and the facesheet flexural stiffness. These results suggest that a relatively
compliant, quasi-isotropic facesheet will produce greater amounts of debond
curvature than a stiff, cross-ply facesheet. It is noted that the stiffening of the
upper facesheet, and thus the reduction in crack front curvature, may be
accomplished through the addition of a facesheet doubler. This concept, applying
artificial stiffeners, or doublers, to compliant facesheets to improve Gc
measurements, is discussed in greater detail in the following section.
It is noted that the issue of anticlastic curvature producing a curved crack
front during Mode I testing is not unique to sandwich composites; it is present
with laminates as well. Prior to the standardization of the Double Cantilever
Beam (DCB) test, ASTM D 5528, research was performed to investigate the

effects of anticlastic curvature in a DCB specimen made from a monolithic
composite10. Results of this study suggested that accurate Gc results could be
achieved, despite the debond curvature which existed during testing, as long as
self similar debond growth was occurring, in which the shape and degree of
curvature of the debond front remains unchanged as the debond propagates.
Thus by allowing the debond to reach a state of fully developed, self similar
debond growth, accurate Gc measurements could be obtained, despite the
presence of the curvature in the crack front. It is believed that these same
requirements of self similar debond growth will ensure that accurate Gc
measurements can be obtained in the sandwich SCB test despite the presence
of the curvature in the crack front.
To further investigate specimen width effects, three widths of foam core
sandwich specimens and two facesheet configurations were tested. The
specimen widths were 25 mm (1.0 in.), 51 mm (2.0 in) and 76 mm (3.0 in). The
two facesheet configurations were [(0/90)/(±45)]3T (quasi-isotropic) and [(0/90)2]S
(cross ply) facesheets fabricated from carbon/epoxy. The results of this testing
are shown in Figures 5 and 6. Results from the quasi-isotropic facesheets
(Figure 5) show that Gc measurements for the narrowest 25 mm (1.0 in.) wide
specimens did not stabilize with increasing crack length. Rather, Gc
measurements continued to increase as the debond propagated. The 51 mm (2.0
in.) and 76 mm (3.0 in.) specimens produced more consistent Gc measurements
throughout the test. Results from the specimens with cross-ply facesheets
(Figure 6) displayed relatively consistent Gc measurements for all three specimen
widths.

Figure 5. Gc vs. debond length for foam specimen with quasi-isotropic
facesheets.
Figure 6. Gc vs. debond length for foam specimen with cross-ply facesheets.
It was possible to view the shape of the debond front for the quasi-
isotropic and cross-ply foam core specimens using a dye penetrant. During
testing, the liquid penetrant was introduced into the debond and allowed to wick
to the debond front. The specimens were then removed from the test fixture and

the penetrant was allowed to dry. The facesheets were then peeled from the
core, and the dye clearly indicated the shape of the debond and the amount of
curvature present for each of the sandwich configurations. The results from the
dye penetrant experiments are shown in Table 1 and indicate that debond
curvature is more prevalent with quasi-isotropic facesheets than for cross-ply
facesheets. These findings are in agreement with the FEA results discussed
previously, which showed greater debond curvature along the edges of quasi-
isotropic specimen than the cross-ply specimen.
Table 1. Debond Front Curvature for Quasi-Isotropic and Cross-Ply Foam Core Sandwich Specimen of Varying Widths
Width (mm) Quasi-isotropic Cross-ply
25
51
76

Based on the results obtained from finite element analysis, from
mechanical testing, and from the literature, it is recommended that a minimum
specimen width of 51 mm (2.0 in.) be specified for SCB testing.
While a single recommended specimen width is preferred, further
considerations must be given to honeycomb core materials, particularly those
with relatively large cell sizes. Since the bond surface of a honeycomb core is not
continuous, the debonding area across the crack front can vary with position
along the line of cells. For example, if the bond contact area between the core
and facesheet at that given instant is low, as shown in Figure 7a, then Gc
measurements can be artificially reduced. Along those same lines, when the
debond is growing across a region of the honeycomb with higher bonding area,
as shown in Figure 7b, Gc measurements could be artificially increased. This
width effect is expected to be especially pronounced when relatively large cell
sizes produce too few honeycomb cells across the width of a test specimen.
Thus in addition to specifying a proper specimen width, a minimum number of
honeycomb cells must be present across the width of the specimen. Previous
studies have suggested that 6 cells across the width of a honeycomb sandwich
specimen are sufficient to achieve consistent Gc measurements9,11.
A series of tests were performed to investigate the minimum number of
cells required across the width of a SCB test specimen to accurately measure Gc
of a honeycomb sandwich construction. Testing was performed using both
aluminum and Nomex core materials with a relatively large 9.5 mm (0.375 in.)
honeycomb cell size. Specimens were cut to widths of 25 mm (1.0 in.), 51 mm
(2.0 in.) and 76 mm (3.0 in.). This correlated to specimens with approximately 3,
6, and 8 full honeycomb cells across the width of each specimen. Results of the
SCB testing of the aluminum honeycomb core and Nomex honeycomb core are
shown in Figures 8 and 9, respectively.
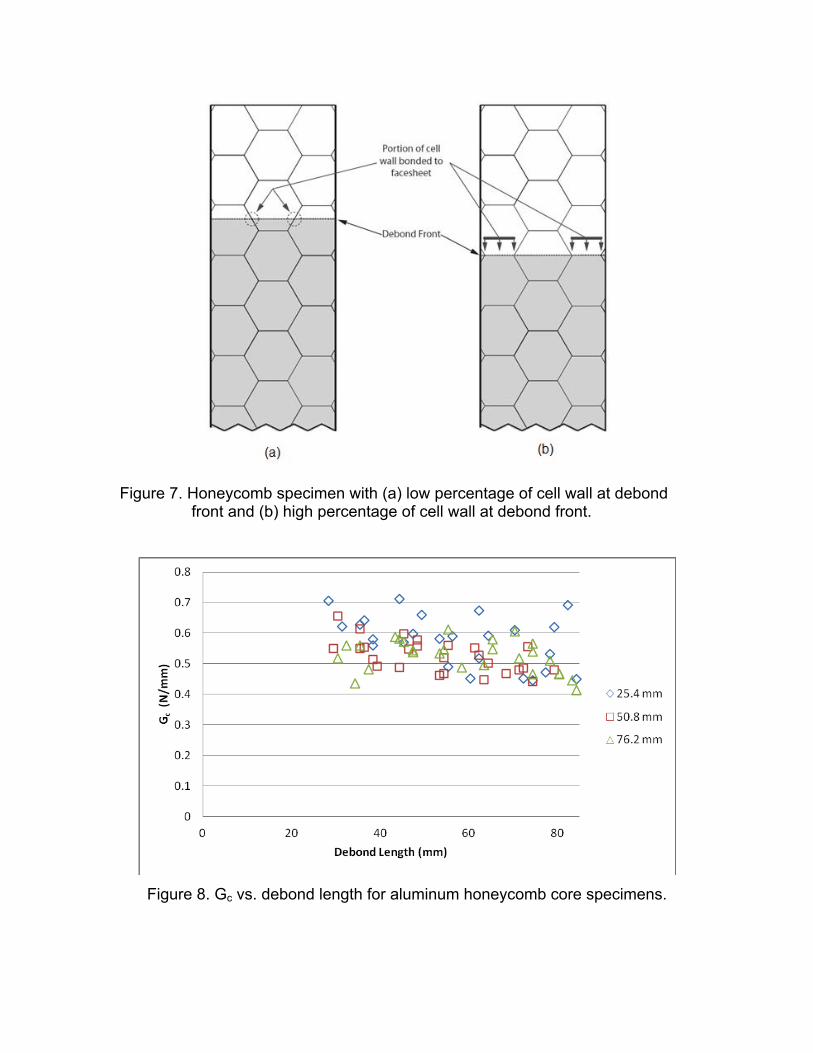
Figure 7. Honeycomb specimen with (a) low percentage of cell wall at debond front and (b) high percentage of cell wall at debond front.
Figure 8. Gc vs. debond length for aluminum honeycomb core specimens.
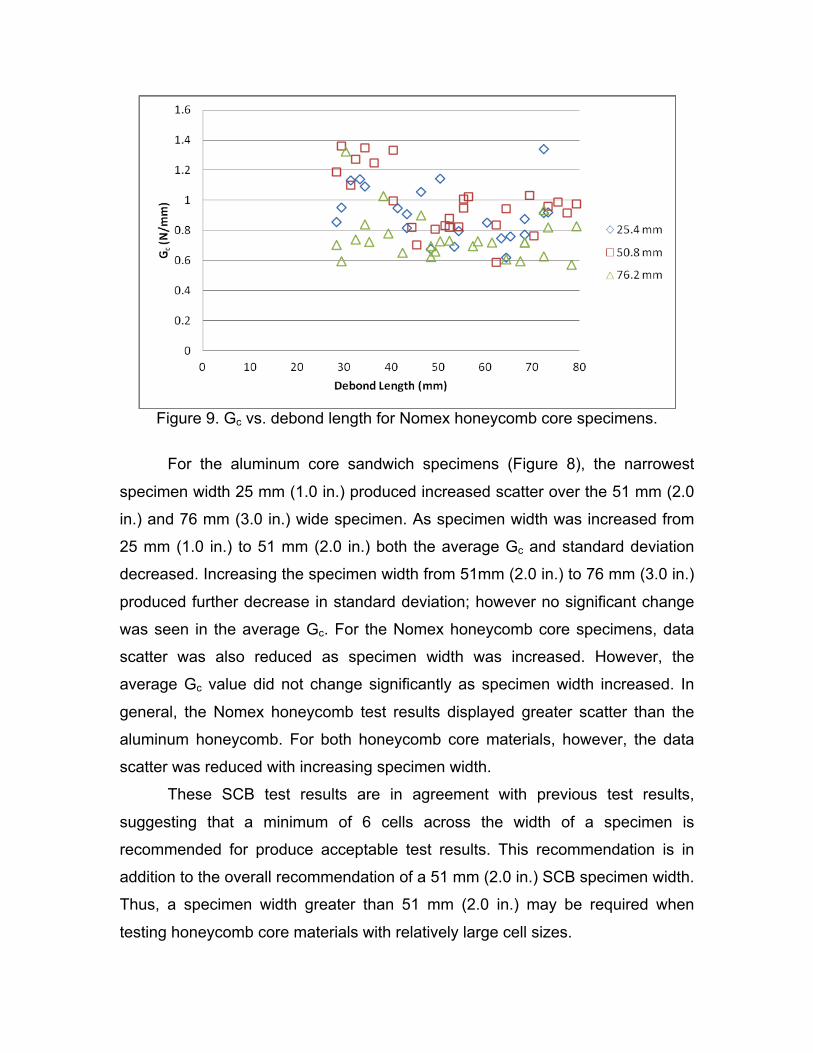
Figure 9. Gc vs. debond length for Nomex honeycomb core specimens.
For the aluminum core sandwich specimens (Figure 8), the narrowest
specimen width 25 mm (1.0 in.) produced increased scatter over the 51 mm (2.0
in.) and 76 mm (3.0 in.) wide specimen. As specimen width was increased from
25 mm (1.0 in.) to 51 mm (2.0 in.) both the average Gc and standard deviation
decreased. Increasing the specimen width from 51mm (2.0 in.) to 76 mm (3.0 in.)
produced further decrease in standard deviation; however no significant change
was seen in the average Gc. For the Nomex honeycomb core specimens, data
scatter was also reduced as specimen width was increased. However, the
average Gc value did not change significantly as specimen width increased. In
general, the Nomex honeycomb test results displayed greater scatter than the
aluminum honeycomb. For both honeycomb core materials, however, the data
scatter was reduced with increasing specimen width.
These SCB test results are in agreement with previous test results,
suggesting that a minimum of 6 cells across the width of a specimen is
recommended for produce acceptable test results. This recommendation is in
addition to the overall recommendation of a 51 mm (2.0 in.) SCB specimen width.
Thus, a specimen width greater than 51 mm (2.0 in.) may be required when
testing honeycomb core materials with relatively large cell sizes.
Facesheet Thickness Effects
Recent research has also focused on the effects of facesheet thickness,
particularly for the case of relatively thin facesheets. In the SCB test, the upper
facesheet must have adequate flexural stiffness such that displacements do not
produce excessive facesheet rotations during testing. These limitations are
imposed by the compliance calibration method of data reduction, since the Gc
calculation is based upon beam theory. For the use of the compliance calibration
method, Ratcliffe8,9 has suggested that deflection be limited to 20% of the crack
length.
Since many sandwich configurations used in aviation feature relatively thin
facesheets, excessive facesheet deformation is of concern. For SCB testing, the
effective facesheet thickness can be increased through the addition of a bonded
doubler, using either the same facesheet material or conventional glass
fabric/epoxy tabbing material. Thus the use of a doubler on the delaminated
facesheet may allow thin, compliant facesheet sandwich constructions to be
tested without violating the small displacement assumptions of beam theory.
Thus, a combined experimental and numerical investigation was performed to
investigate the effect of facesheet thickness and the addition of doublers on the
stress state, mode mixity, and Gc measurements.
SCB testing was performed using specimens cut from a single sandwich
panel of dimensions 229 mm (9.0 in.) x 813 mm (32 in.). The facesheets were 3
ply [0/90/0]T carbon/epoxy and the core was a 48 kg/m3 (3 lb/ft3) density Nomex
honeycomb. Following manufacturing, this sandwich panel was cut into three
smaller sub-panels of equal size. A 0.58 mm (0.02 in.) thick G10 glass/epoxy
doubler was bonded to the surface of one of these sub-panels. Similarly, a
thicker 1.6 mm (0.063 in.) thick G10 doubler was bonded to the second sub-
panel. The third sub-panel was tested without a doubler. Each subpanel was
then cut into five specimens that were 51 mm (2.0 in.) wide. Loading hinges were
bonded to the facesheets 25 mm (1.0 in.) from the debond front and SCB testing
was performed on the three sets of specimens.
During testing it was found that each of the groups of tests exhibited crack
growth in the vicinity of the targeted facesheet/core interface without the crack
diverting or kinking deeply into the core. However, the fracture locations of the
three sets of specimens were found to be different. The no-doubler (thin
facesheet) specimens experienced crack growth between the adhesive layer and
the facesheet, as shown in Figure 10a. The “thick” 1.6 mm (0.063 in.) doubler
specimens experienced crack growth in the Nomex honeycomb core at the base
of each of the fillets created by the adhesive used to bond the facesheet to the
core, as shown in Figure 10c. The “thin” 0.58 mm (0.02 in.) doubler specimens
experienced crack growth in a combination of these two locations, with fracture
occurring in the core, along the base of the adhesive fillets, and at the
facesheet/adhesive interface, as shown in Figure 10b.
These differences in failure location were also reflected in the resulting Gc
measurements as shown in Figure 11. The resulting Gc values increased with
increasing doubler thickness. Values from the thick doubler specimens were
approximately 4 times those from the no-doubler specimens. This increase in Gc
was believed to be produced primarily from the debond propagating through the
Nomex honeycomb core rather than at the interface. Given that all of the tested
specimens originated from the same parent sandwich panel, the bond integrity of
the facesheet to the core was not considered a significant variable.

a. No doubler.
b. 0.58 mm (0.02 in.) “thin” doubler.
c. 1.6 mm (0.063 in.) “thick” doubler.
Figure 10. Effects of facesheet doublers on failure location in SCB specimens.

Figure 11. Effects of facesheet doublers on Gc measurement in SCB specimens.
Additional finite element analyses were performed to investigate the
effects of adding doublers to thin-facesheet sandwich configurations. Analyses
were performed using a variety of doubler thicknesses, through-the-thickness
crack locations, and core materials. Of particular interest was the state of stress
and mode mixity of crack growth associated with each facesheet condition.
Results of the finite element analyses showed that shear stresses exist in
the vicinity of the crack tip, regardless of the core and facesheet material
properties as well as the through-the-thickness placement of the crack. However,
these shear stresses are much smaller in magnitude than the upward-directed
normal stresses in the same region: roughly two orders of magnitude smaller for
the cases considered. Despite the relatively small magnitude of the shear
stresses, the analyses indicate that the orientation of the shear stresses (positive
or negative) in the vicinity of the crack tip may change, depending on the
facesheet and core material properties as well as the through-the-thickness crack
placement in the core material. This sign change of the shear stress is significant
because of the associated change in the orientation of the plane on which the

maximum principal stress exists, as shown in Figure 12. If crack growth is
postulated to occur on this plane of maximum principal stress, then this change
in shear stress orientation will result in a change in the preferred direction of
predicted crack growth: either along the upper facesheet/core interface (Figure
12a) or downward into the core (Figure 12b).
a. Negative shear stress resulting in upward crack growth along interface.
b. Positive shear stress resulting in downward crack growth direction into core.
Figure 12. Change in orientation of predicted crack growth plane resulting from change in sign of shear stress.

A qualitative study into the orientation of the shear stresses in the vicinity
of the crack supported the findings from mechanical testing involving the use of
doublers. For the no doubler case (Figure 10a), the orientation of the shear
stresses within the core favors crack propagation at the facesheet/core interface
as shown in Figure 12a. When the specimen with the thin doubler (Figure 10b)
was modeled with a crack adjacent to the facesheet/core interface, the
orientation of the shear stresses in the vicinity of the crack tip was opposite that
predicted for the no-doubler specimen. As a result, the principal stress direction
favors crack kinking down into the core as shown in Figure 12b. However,
analysis of the thin doubler specimen with the crack located 0.5 mm below the
interface resulted in the shear stress reversing back to the original orientation
shown in Figure 12a. Thus a crack located a short distance below the interface
would be predicted to propagate upward towards the interface. These results for
the thin doubler specimen suggest that the crack would be confined to a region
less than 0.5 mm below the facesheet/core interface, similar to the experimental
results shown in Figure 10b.
For the case of the specimen with the thick doubler, the orientation of the
shear stresses in the vicinity of the crack tip favored crack kinking downward into
the core for the first two crack locations investigated: adjacent to the interface
and 0.5 mm below the interface (Figure 13a and 13b, respectively). By further
lowering the position of the crack to 1.0 mm below the upper facesheet/core
interface, however, a reversal in the sign of the shear stress was produced as
shown in Figure 13c. Thus, a core crack positioned 1.0 mm below the interface is
predicted to grow at an upward angle towards the upper facesheet. These results
for the thick doubler specimen suggest that the crack would propagate a greater
distance (between 0.5 mm and 1.0 mm) below the facesheet/core interface than
for the thin doubler specimen, in agreement with the experimental results shown
in Figure 10c.
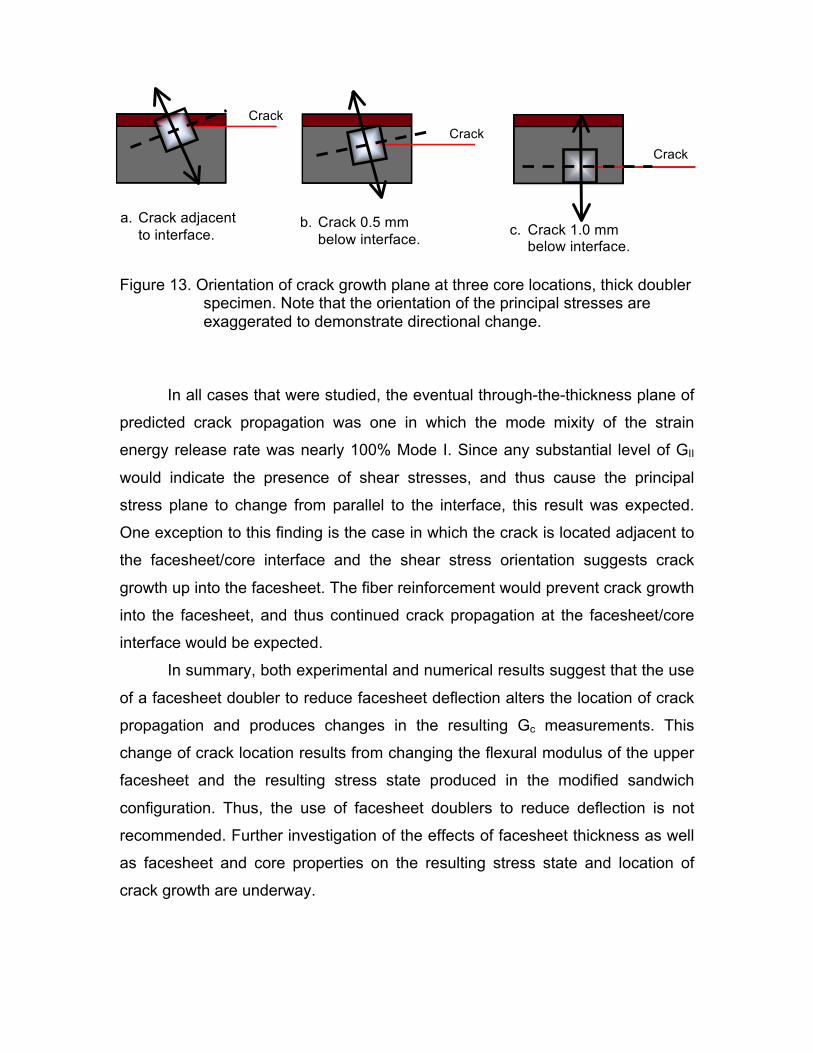
Figure 13. Orientation of crack growth plane at three core locations, thick doubler
specimen. Note that the orientation of the principal stresses are exaggerated to demonstrate directional change.
In all cases that were studied, the eventual through-the-thickness plane of
predicted crack propagation was one in which the mode mixity of the strain
energy release rate was nearly 100% Mode I. Since any substantial level of GII
would indicate the presence of shear stresses, and thus cause the principal
stress plane to change from parallel to the interface, this result was expected.
One exception to this finding is the case in which the crack is located adjacent to
the facesheet/core interface and the shear stress orientation suggests crack
growth up into the facesheet. The fiber reinforcement would prevent crack growth
into the facesheet, and thus continued crack propagation at the facesheet/core
interface would be expected.
In summary, both experimental and numerical results suggest that the use
of a facesheet doubler to reduce facesheet deflection alters the location of crack
propagation and produces changes in the resulting Gc measurements. This
change of crack location results from changing the flexural modulus of the upper
facesheet and the resulting stress state produced in the modified sandwich
configuration. Thus, the use of facesheet doublers to reduce deflection is not
recommended. Further investigation of the effects of facesheet thickness as well
as facesheet and core properties on the resulting stress state and location of
crack growth are underway.
a. Crack adjacent to interface.
Crack Crack
Crack
b. Crack 0.5 mm below interface.
c. Crack 1.0 mm below interface.

MODE II: END NOTCHED SANDWICH (ENS) TEST METHOD
Following extensive experimental and numerical investigation1, the End
Notched Sandwich (ENS) test configuration was selected for Mode II fracture
mechanics testing of sandwich composites. This sandwich test configuration was
motivated by the three-point end notch flexure test (3ENF) test for monolithic
composites, as well as modifications for sandwich composites by Carlsson12 and
Shipsha et al.13
As shown in Figure 14, the ENS test is a three-point bend test with a
tensioned wire that fits underneath the top facesheet. The wire is slid into the
preexisting crack on the specimen end, and located immediately above the outer
loading point. The height of the tensioned wire is positioned such that when the
sandwich specimen is loaded in the same manner as a standard three-point
bend specimen, the wire maintains separation between the facesheet and core
and prevents the introduction of frictional forces between the crack faces. Figure
15 shows the prototype ENS test fixture developed at the University of Utah. The
fixture consists of an existing three-point bend test fixture with an attachment to
hold the tensioned wire in place. The attachment consists of a steel frame that
supports a 24-gauge (0.5 mm diameter) steel wire. The spool and tightening
mechanism allow for easy adjustments to the wire tension as well as quick
replacement of broken wires. The height of the wire is adjusted at the connection
between the steel frame attachment and the three-point bend fixture.
End Notched Sandwich testing has been performed on sandwich
composite configurations utilizing three types of core and five different
facesheets. The three core materials investigated were polyurethane foam,
Nomex honeycomb, and aluminum honeycomb. The five facesheets were three,
six, and twelve ply carbon/epoxy cross-ply laminates as well as two and six ply
carbon/epoxy woven facesheets. Initial test results showed semi-stable crack
growth along the facesheet/core interface for honeycomb core sandwich
configurations, as desired. However, polyurethane foam cores exhibited unstable
crack growth along the interface as well as crack kinking.

Figure 14. End Notched Sandwich (ENS) Test Configuration.
Figure 15. Prototype End Notched Sandwich (ENS) Test Fixture.
Steel Frame
Screw
Tightening Device Wire Spool
Artificial Pre-crack
Half Span Length
Applied Load
Span Length
Wire Load

Pre-Crack Length and Crack Growth Stability Recent research has focused on understanding the factors affecting crack
growth stability. As mentioned previously, the ENS test produced desirable semi-
stable crack growth behavior in sandwich specimens with Nomex honeycomb
cores, but unstable crack growth in polyurethane core sandwich specimens.
Results from follow-on numerical modeling, shown in Figure 16, suggest that
crack growth stability is dependent on the length of the pre-crack in the
specimen. At short crack lengths, the critical specimen deflection (at which crack
growth occurs) decreases with increasing crack length until a critical crack length
is reached (referred to as the minimum pre-crack length), at which point the
critical beam deflection begins to increase with crack length. These findings
suggest that if the pre-crack length is too short, the crack will propagate in an
unstable manner initially, through at least a portion of the specimen length. For
pre-crack lengths greater than the minimum, however, crack growth is expected
to be stable.
Figure 16. Required Specimen Deflection for Crack Growth in ENS Specimen.

Recent testing has confirmed the existence of the minimum pre-crack
length for a 6 ply Nomex honeycomb core sandwich configuration. Testing was
performed to investigate crack-growth stability of this sandwich configuration for
normalized pre-crack lengths of 5%, 15%, and 25%, also known as pre-crack-
ratios (PCR). As shown in Figure 16, a transition from unstable to stable crack
growth is predicted for a PCR of approximately 20% of the span. The results of
these tests, shown in Figure 17, show the transition from unstable to stable crack
growth in the predicted region. It is important to note that previous testing has
only achieved semi-stable mode II crack growth for Nomex honeycomb cores,
but stable crack growth is now attainable with proper pre-crack sizing.
Figure 17. Effect of pre-crack length on crack growth stability.
As mentioned above, all previous ENS testing on polyurethane foam core
sandwich configurations have resulted in unstable crack growth or crack kinking.
Results of finite element analysis suggest that crack kinking into the core may be
caused by a change in the sign of the shear stress, similar to findings for the
Mode I SCB test. In general, interface cracks in sandwich configurations with
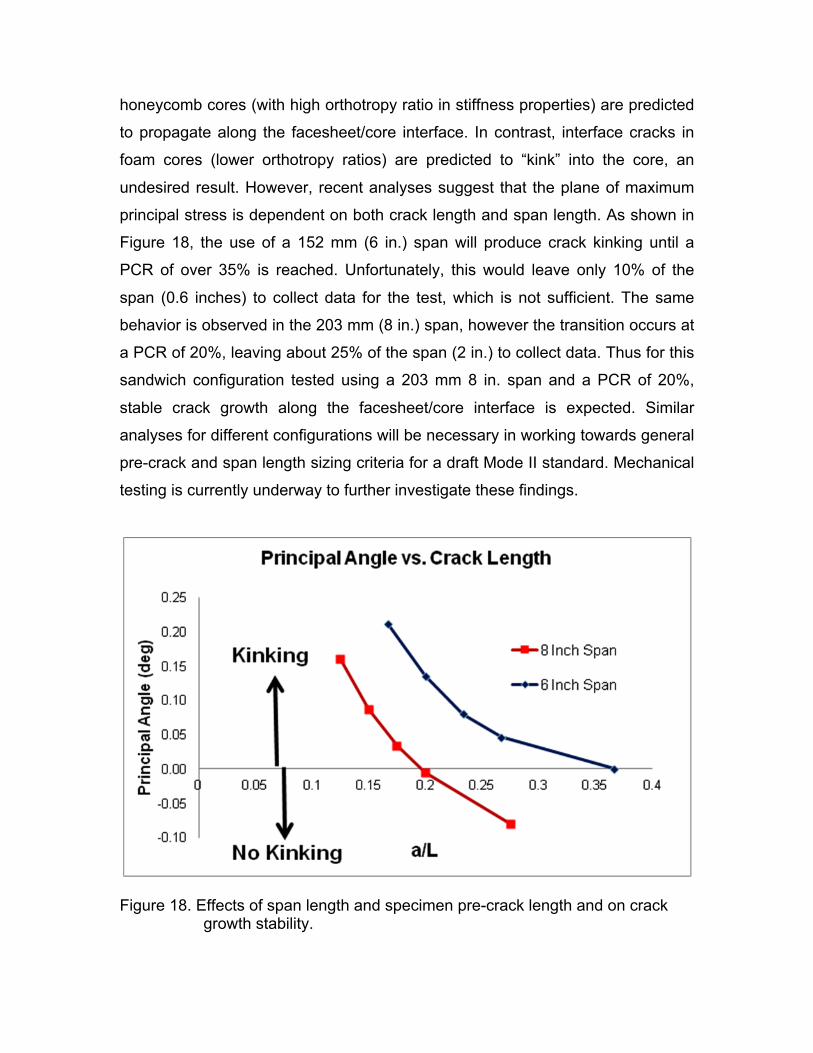
honeycomb cores (with high orthotropy ratio in stiffness properties) are predicted
to propagate along the facesheet/core interface. In contrast, interface cracks in
foam cores (lower orthotropy ratios) are predicted to “kink” into the core, an
undesired result. However, recent analyses suggest that the plane of maximum
principal stress is dependent on both crack length and span length. As shown in
Figure 18, the use of a 152 mm (6 in.) span will produce crack kinking until a
PCR of over 35% is reached. Unfortunately, this would leave only 10% of the
span (0.6 inches) to collect data for the test, which is not sufficient. The same
behavior is observed in the 203 mm (8 in.) span, however the transition occurs at
a PCR of 20%, leaving about 25% of the span (2 in.) to collect data. Thus for this
sandwich configuration tested using a 203 mm 8 in. span and a PCR of 20%,
stable crack growth along the facesheet/core interface is expected. Similar
analyses for different configurations will be necessary in working towards general
pre-crack and span length sizing criteria for a draft Mode II standard. Mechanical
testing is currently underway to further investigate these findings.
Figure 18. Effects of span length and specimen pre-crack length and on crack growth stability.

Geometric Sizing and Crack Growth Stability Recent testing has shown a relationship between specimen dimensioning
(i.e. specimen width W, specimen thickness t, and span length, L) and crack
growth stability. For example, a sandwich configuration with a 102 mm (4 in.)
span can experience stable crack growth while the same sandwich configuration
with a 203 mm 8 in. span will be unstable. From testing performed to date, it was
determined that a range of specimen aspect ratios (i.e. L/W, L/t, etc) may exist
that result in stable crack growth. Testing was performed to evaluate crack
growth stability for four different sets of L/W values: (4 in./1 in.), (6 in./1 in.), (8
in./1 in.) and (8 in./2 in.) Test results indicated that a span length equal to 4 times
the width is required to achieve stable crack growth as shown in Figure 19.
Further research is needed to more fully explore these specimen aspect ratios,
as well as other material and geometrical parameters including core thickness
and the relative flexural stiffnesses of the debonded facesheet and the remaining
sandwich structure.
Figure 19. Effect of initial crack length on crack growth stability.

Specimen Width Effects Further numerical analyses have been performed to investigate both
specimen width effects as well as facesheet flexural stiffness effects on the
calculated energy release rate. Figure 20 shows the predicted variation in both
the total energy release rate, Gc, as well as the Mode II component, GII, across
the specimen width for a Nomex honeycomb core sandwich specimen. The
magnitude of GII is shown to decrease near the specimen edges for both the 25
mm (1.0 in.) and 51 mm (2.0 in.) specimens. However, the significantly larger
value for Gc near the specimen edges implies that the crack growth in these outer
regions is Mode I dominant. This effect appears to be reduced for the wider 51
mm (2.0 in.) specimen. Further investigation into mode mixity, especially with
respect to specimen width, is ongoing.
Figure 20. Variation in Gc and GII across the width of an ENS specimen.

SUMMARY In this stage of the research investigation, efforts have focused on
establishing remaining limits and investigating remaining issues associated with
the proposed Mode I and Mode II fracture toughness test methods. For Mode I
testing, the Single Cantilever Beam (SCB) test has been selected. Recent
research results have been used to establish a minimum SCB specimen width of
51 mm (2.0 in.) and a minimum of 6 honeycomb cells across the specimen width.
Additionally, experimental and numerical results have shown that the use of a
facesheet doubler to reduce facesheet deflection may alter the location of crack
propagation as well as resulting Gc measurements. Thus, the use of facesheet
doublers in SCB specimens with thin facesheets is not recommended.
For Mode II testing, an End Notched Shear (ENS) test has been
developed. Recent research has focused on producing stable crack growth in a
wide variety of sandwich configurations. Results suggest that crack growth
stability is dependent on both the initial crack length in the specimen as well as
the span length used during testing. Ongoing research is investigating other
material and geometrical parameters and ratios that may be used to assess
crack growth stability.
Expected benefits to aviation include standardized and industry-accepted
fracture mechanics test methods for sandwich composites. The results from
these tests may be used as inputs to damage analyses for predicting
facesheet/core delamination growth in sandwich structures. Additionally, an FAA
Technical Center report will be produced, providing additional guidance for
aviation industry users. REFERENCES
1. Adams, D.O., Kessler, J.A., Kuramoto, B., Bluth, J., Weaver, C., and Gill, A., “Development and Evaluation of Fracture Mechanics Test Methods For Sandwich Composites,”, Proceedings of the 2010 FAA JAMS Technical Review Meeting, Wichita, KS, July 21-22, 2010.

2. Cantwell, W.J and Davies, P. “A Test Technique for Assessing Core-Skin Adhesion in Composite Sandwich Structures”, Journal of Materials Science Letters, Vol. 13, pp. 203-205, 1994.
3. Li, X. and Carlsson, L.A., “The Tilted Sandwich Debond (TSD) Specimen
for Face/Core Interface Fracture Characterization,” Journal of Sandwich Structures and Materials, Vol., 1, pp.60-75, 1999.
4. Li, X. and Carlsson, L.A., “Fracture Mechanics Analysis of Tilted Sandwich Debond (TSD) Specimen” Journal of Composite Materials, Vol.35, pp. 2145 – 2168, 2001.
5. Li, X. and Carlsson, L.A., “Elastic Foundation Analysis of Tilted Sandwich Debond (TSD) Specimen”, Journal of Sandwich Structures and Materials, Vol. 2, No 1., pp. 3-32, 2000.
6. Viana, G. M., and Carlsson, L.A., “Mode Mixity and Crack Tip Yield Zones in TSD Sandwich Specimens with PVC Foam Core”, Journal of Sandwich Structures and Materials, Vol.4, pp. 141-155, 2002.
7. Viana, G. M., and Carlsson, L.A., “Influences of Foam Density and Core Thickness on Debond Toughness of Sandwich Specimens with PVC Foam Core”, Journal of Sandwich Structures and Materials, Vol. 5, April 2003.
8. Ratcliffe, J.G., “Sizing Single Cantilever Beam Specimens for Characterizing Facesheet/Core Peel Debonding in Sandwich Structure, NASA Technical Publication TP-2010-216169, 2010.
9. Ratcliffe, J.G. and Reeder, J.R. “Sizing a Single Cantilever Beam
Specimen for Characterizing Facesheet–Core Debonding in Sandwich Structure”, Journal of Composite Materials, Vol. 45, No. 25, 2011.
10. Davidson, B. D and Schapery, R. A Effect of Finite Width on Deflection and Energy Release Rate of an Orthotropic Double Cantilever Specimen”, Journal of Composite Materials, Vol. 22, 1988.
11. ASTM C297, “Standard Test Method for Flatwise Tensile Strength of Sandwich Constructions,” American Society for Testing and Materials, West Conshohocken, PA, 2010.
12. Carlsson, L.A., “On the Design of the Crack Sandwich Beam (CSB) Specimen” Journal of Reinforced Plastics and Composites, Vol. 10, pp. 434-446, 1991.
13. Shipsha, A., Burman, M., and Zenkert, D., “Interfacial Fatigue Crack
Growth in Foam Core Sandwich Structures” Fatigue and Fracture of Engineering Materials and Structures, Vol. 22, pp. 123-131, 1999.