Development and Application of Radiotracer … and Application of Radiotracer Dilution Technique for...
9
Development and Application of Radiotracer Dilution Technique for Flow Rate Measurements H.J. Pant, Jayashree Biswal, Sunil Goswami, J.S. Samantray, V.K. Sharma and K.S.S. Sarma Isotope and Radiation Application Division Shyam Shukla Kirloskar Brothers Limited, Yamuna, Survey No. 98 (3-7), Baner, Pune - 411 045 Radiotracer dilution technique for flow rate measurements in pipelines, canals, mountainous rivers, and streams was developed and applied for measurement of water flow rates in a branch canal of M/s Sardar Sarovar Narmada Nigam Limited (SSNNL), Surendranagar, Gujarat and in large diameter pipelines in a power plant at Vishakhapatnam, owned by M/s Hinduja National Power Corporation Limited (HNPCL), Vishakhapatnam, Andhra Pradesh. In case of the M/s SSNNL, Gujarat, the measurements were carried out to quantify the flow rates and validate the efficacy of the Concrete Volute (CV) Pumps used for pumping the water along the canal. Whereas in case of the M/s HNPCL, Andhra Pradesh, the flow rate measurements were carried out to check the calibration of the installed flow meters as well as to validate the efficacy of the Vertical Turbine (VT) pumps used for pumping water through the pipelines. Iodine-131 as potassium iodide was used as radiotracer in both the cases. The flow rates of water were ranging 3 from 20.30±0.29 - 20.62±0.26 m /s measured at four different pumping stations along the canal when single CV pump was operated. The measured flow rates were found to be in agreement with the theoretically estimated pumping capacity of a CV pump, 3 i.e. 20 m /s. The values of the flow rates measured in large diameter pipelines at M/s HNPCL, Visakhapatnam, ranged from 3 3 14.10±0.43 - 15.43±0.46 m /s with single VT pump in operation and ranged from 24.55±0.78 - 27.51±0.82 m /s when two identical VT pumps were operated simultaneously. The measured values of the flow rates were used to validate the efficacy of the pumps, calibrate the flow meters and optimize the pumping operations leading to significant revenue savings to the industries. Introduction The accurate knowledge of flow rates of process material (liquid, gas and solid) in industrial and environmental systems is an essential requirement. The flow rates are usually needed for one or more of the following reasons i.e. calibration of installed flow meters, in situations where flow meters are not installed, material balance, measurement of efficacy of pumps or turbines, distribution of flow in a network of pipes, etc. Generally, the industrial systems where the flow rates are needed to be measured are classified into two categories, namely open channels and closed conduits. Open channels are systems where the stream has a free surface open to the atmosphere such as canals, rivers, streams, sewer lines, effluent channels etc. Flow in closed conduits, such as pipelines is caused by a pressure difference. Various conventional methods such as gravimetric method, hydraulic structure method, velocity-area method or current meter method and slope-hydraulic radius method are used for flow rate measurements in canals, rivers and tunnels [1-8]. None of the above methods can be applied for flow rate measurement in all the situations. The selection of a suitable method for a particular application depends on the type and nature of the system, physical properties of the flowing water, flow patterns of the water, limitations imposed by the design and operating condition of the plant, cost and installation of the equipment. Similarly, various types of flow meters, such as ultrasonic, electromagnetic, acoustic, venturi, pitot tube, etc., are used for flow rate measurements in pipelines [9] in industry. Most of these flow meters have limitations in large diameter pipelines. Tracer dilution method is one of the most widely used and well-suited for flow rate measurements in canals and large diameter pipelines. The tracer dilution technique can be applied for flow measurements in irregular shaped, large diameter and fully or partially filled pipelines [1-18]. The dilution technique can also be used for flow rate measurement even when the flow path is branched. The tracer used could be either a chemical or a radioactive isotope. Chemical tracers such as fluorescent dye, normal salts are commonly used for measurement of flow rates in canals and pipelines. The measurement of high flow rates using chemical tracer requires large amount of tracers to be injected as they cannot be detected below a few milligram per litre. Injecting a large amount of tracer will affect the flow as well as contaminate the system. The fluorescent dyes such as Rodamine B, though detectable under high dilutions, are generally lost from the water medium through adsorption on the bed, walls and soil in suspension [13]. Some of these drawbacks of chemical tracers could be overcome by using radiotracers. The radiotracers are particularly useful for higher discharge rate 3 (upto 1200 m /s) measurements with better accuracy owing to -9 their higher detection sensitivity (10 mg/cc) [11, 12, 14-16]. Because of this property of radiotracers, a few micrograms of radiotracer is sufficient. There is essentially no interference with the system being studied. The present article describes an application of radiotracer dilution technique flow measurements in a canal and large diameter pipelines to evaluate and validate the pumping efficacy of the pumps used for pumping the water and calibrate the installed flow meters. | BARC Newsletter 2017 1 | May-June Article
Transcript of Development and Application of Radiotracer … and Application of Radiotracer Dilution Technique for...
Development and Application of Radiotracer Dilution Technique for Flow Rate Measurements
H.J. Pant, Jayashree Biswal, Sunil Goswami, J.S. Samantray, V.K. Sharma and K.S.S. Sarma
Isotope and Radiation Application Division
Shyam Shukla
Kirloskar Brothers Limited, Yamuna, Survey No. 98 (3-7), Baner, Pune - 411 045
Radiotracer dilution technique for flow rate measurements in pipelines, canals, mountainous rivers, and streams was developed and applied for measurement of water flow rates in a branch canal of M/s Sardar Sarovar Narmada Nigam Limited (SSNNL), Surendranagar, Gujarat and in large diameter pipelines in a power plant at Vishakhapatnam, owned by M/s Hinduja National Power Corporation Limited (HNPCL), Vishakhapatnam, Andhra Pradesh. In case of the M/s SSNNL, Gujarat, the measurements were carried out to quantify the flow rates and validate the efficacy of the Concrete Volute (CV) Pumps used for pumping the water along the canal. Whereas in case of the M/s HNPCL, Andhra Pradesh, the flow rate measurements were carried out to check the calibration of the installed flow meters as well as to validate the efficacy of the Vertical Turbine (VT) pumps used for pumping water through the pipelines. Iodine-131 as potassium iodide was used as radiotracer in both the cases. The flow rates of water were ranging
3from 20.30±0.29 - 20.62±0.26 m /s measured at four different pumping stations along the canal when single CV pump was operated. The measured flow rates were found to be in agreement with the theoretically estimated pumping capacity of a CV pump,
3i.e. 20 m /s. The values of the flow rates measured in large diameter pipelines at M/s HNPCL, Visakhapatnam, ranged from 3 314.10±0.43 - 15.43±0.46 m /s with single VT pump in operation and ranged from 24.55±0.78 - 27.51±0.82 m /s when two identical
VT pumps were operated simultaneously. The measured values of the flow rates were used to validate the efficacy of the pumps, calibrate the flow meters and optimize the pumping operations leading to significant revenue savings to the industries.
Introduction
The accurate knowledge of flow rates of process material (liquid, gas and solid) in industrial and environmental systems is an essential requirement. The flow rates are usually needed for one or more of the following reasons i.e. calibration of installed flow meters, in situations where flow meters are not installed, material balance, measurement of efficacy of pumps or turbines, distribution of flow in a network of pipes, etc. Generally, the industrial systems where the flow rates are needed to be measured are classified into two categories, namely open channels and closed conduits. Open channels are systems where the stream has a free surface open to the atmosphere such as canals, rivers, streams, sewer lines, effluent channels etc. Flow in closed conduits, such as pipelines is caused by a pressure difference. Various conventional methods such as gravimetric method, hydraulic structure method, velocity-area method or current meter method and slope-hydraulic radius method are used for flow rate measurements in canals, rivers and tunnels [1-8]. None of the above methods can be applied for flow rate measurement in all the situations. The selection of a suitable method for a particular application depends on the type and nature of the system, physical properties of the flowing water, flow patterns of the water, limitations imposed by the design and operating condition of the plant, cost and installation of the equipment. Similarly, various types of flow meters, such as ultrasonic, electromagnetic, acoustic, venturi, pitot tube, etc., are used for flow rate measurements in pipelines [9] in industry. Most of these flow meters have limitations in large diameter pipelines.
Tracer dilution method is one of the most widely used and well-suited for flow rate measurements in canals and large diameter pipelines. The tracer dilution technique can be applied for flow measurements in irregular shaped, large diameter and fully or partially filled pipelines [1-18]. The dilution technique can also be used for flow rate measurement even when the flow path is branched. The tracer used could be either a chemical or a radioactive isotope. Chemical tracers such as fluorescent dye, normal salts are commonly used for measurement of flow rates in canals and pipelines. The measurement of high flow rates using chemical tracer requires large amount of tracers to be injected as they cannot be detected below a few milligram per litre. Injecting a large amount of tracer will affect the flow as well as contaminate the system. The fluorescent dyes such as Rodamine B, though detectable under high dilutions, are generally lost from the water medium through adsorption on the bed, walls and soil in suspension [13]. Some of these drawbacks of chemical tracers could be overcome by using radiotracers. The radiotracers are particularly useful for higher discharge rate
3(upto 1200 m /s) measurements with better accuracy owing to -9their higher detection sensitivity (10 mg/cc) [11, 12, 14-16].
Because of this property of radiotracers, a few micrograms of radiotracer is sufficient. There is essentially no interference with the system being studied. The present article describes an application of radiotracer dilution technique flow measurements in a canal and large diameter pipelines to evaluate and validate the pumping efficacy of the pumps used for pumping the water and calibrate the installed flow meters.
|BARC Newsletter 2017 1| May-June
Article
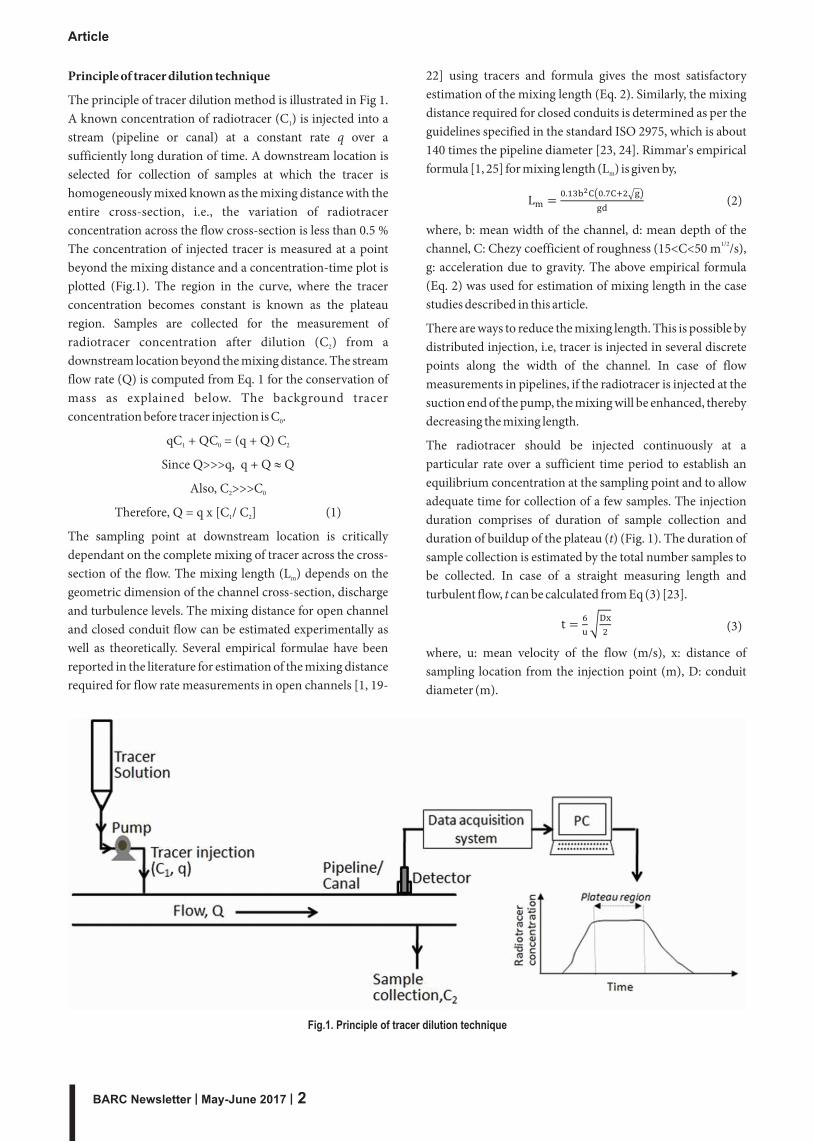
Principle of tracer dilution technique
The principle of tracer dilution method is illustrated in Fig 1. A known concentration of radiotracer (C ) is injected into a 1
stream (pipeline or canal) at a constant rate q over a sufficiently long duration of time. A downstream location is selected for collection of samples at which the tracer is homogeneously mixed known as the mixing distance with the entire cross-section, i.e., the variation of radiotracer concentration across the flow cross-section is less than 0.5 % The concentration of injected tracer is measured at a point beyond the mixing distance and a concentration-time plot is plotted (Fig.1). The region in the curve, where the tracer concentration becomes constant is known as the plateau region. Samples are collected for the measurement of radiotracer concentration after dilution (C ) from a 2
downstream location beyond the mixing distance. The stream flow rate (Q) is computed from Eq. 1 for the conservation of mass as explained below. The background tracer concentration before tracer injection is C .0
qC + QC = (q + Q) C1 0 2
Since Q>>>q, q + Q » Q
Also, C >>>C2 0
Therefore, Q = q x [C / C ] (1)1 2
The sampling point at downstream location is critically dependant on the complete mixing of tracer across the cross-section of the flow. The mixing length (L ) depends on the m
geometric dimension of the channel cross-section, discharge and turbulence levels. The mixing distance for open channel and closed conduit flow can be estimated experimentally as well as theoretically. Several empirical formulae have been reported in the literature for estimation of the mixing distance required for flow rate measurements in open channels [1, 19-
Fig.1. Principle of tracer dilution technique
22] using tracers and formula gives the most satisfactory estimation of the mixing length (Eq. 2). Similarly, the mixing distance required for closed conduits is determined as per the guidelines specified in the standard ISO 2975, which is about 140 times the pipeline diameter [23, 24]. Rimmar's empirical formula [1, 25] for mixing length (L ) is given by,m
(2)
where, b: mean width of the channel, d: mean depth of the 1/2channel, C: Chezy coefficient of roughness (15<C<50 m /s),
g: acceleration due to gravity. The above empirical formula (Eq. 2) was used for estimation of mixing length in the case studies described in this article.
There are ways to reduce the mixing length. This is possible by distributed injection, i.e, tracer is injected in several discrete points along the width of the channel. In case of flow measurements in pipelines, if the radiotracer is injected at the suction end of the pump, the mixing will be enhanced, thereby decreasing the mixing length.
The radiotracer should be injected continuously at a particular rate over a sufficient time period to establish an equilibrium concentration at the sampling point and to allow adequate time for collection of a few samples. The injection duration comprises of duration of sample collection and duration of buildup of the plateau (t) (Fig. 1). The duration of sample collection is estimated by the total number samples to be collected. In case of a straight measuring length and turbulent flow, t can be calculated from Eq (3) [23].
(3)
where, u: mean velocity of the flow (m/s), x: distance of sampling location from the injection point (m), D: conduit diameter (m).
|BARC Newsletter 2| May-June 2017
Article
Radiotracer methodology
An ideal tracer is a substance that is intentionally introduced into a system, be it biological, industrial or environmental, to study the dynamics of the process material flowing through the system. The tracer quantity should be small and its introduction into the system should not disturb the flow. Further, it should be distinguishable from the process material for its detection. In case of a radiotracer, radioactivity is the property that distinguishes it from the bulk process material and enables its detection. Also, the tracer should not get adsorbed on walls of the system. In case of tracing a phase without any chemical reaction; the radiotracer should have physical properties similar to that of the process material being traced. But if a phase being traced involves a chemical reaction, the radiotracer should have physical and chemical properties identical to that of the phase being traced.
The procedure for flow rate measurement using radiotracer dilution method involves selection of a suitable radiotracer, estimation of amount of activity required for the measurements, preparation and its transport to the experimental site, continuous injection of a known amount of radiotracer at a constant rate, online monitoring of its concentration, sample collection at a downstream location, measurement of concentration in the injected and collected samples; and estimation of the flow rate. Some of the major steps involved are discussed below.
Selection of radiotracer
The selection of a radiotracer for a particular study requires careful consideration of various characteristics of the radiotracer such as physico-chemical behaviour, half-life, type and energy of radiation, possibility of production, specific activity and radiotoxicity. In majority of the industrial applications, the phase tracing does not involve a chemical reaction and thus only the physical properties of the radiotracer need to be considered. This enables the selected radiotracer to mix homogeneously within the phase being traced. For 'in situ' detection, a gamma-emitting radiotracer is selected and the energy of the emitted gamma radiation should be sufficiently high to penetrate through the wall of the system and get detected. Lower energy gamma emitting tracers are, on the other hand, easier to transport in view of their modest shielding requirement. The half-life of the selected radiotracer should be sufficiently long to prepare the radiotracer, transport it to the experimental site and complete the measurements; and at the same time it should be short enough to minimize any environmental hazards. The selected radioisotope used for preparation of the radiotracer should have sufficiently high neutron absorption cross-section to enable its production in desired quantities. Also, the selected radiotracer should have low radiotoxicity. The specific activity of a radiotracer is an important factor to be considered from the radiological safety point of view. One would usually
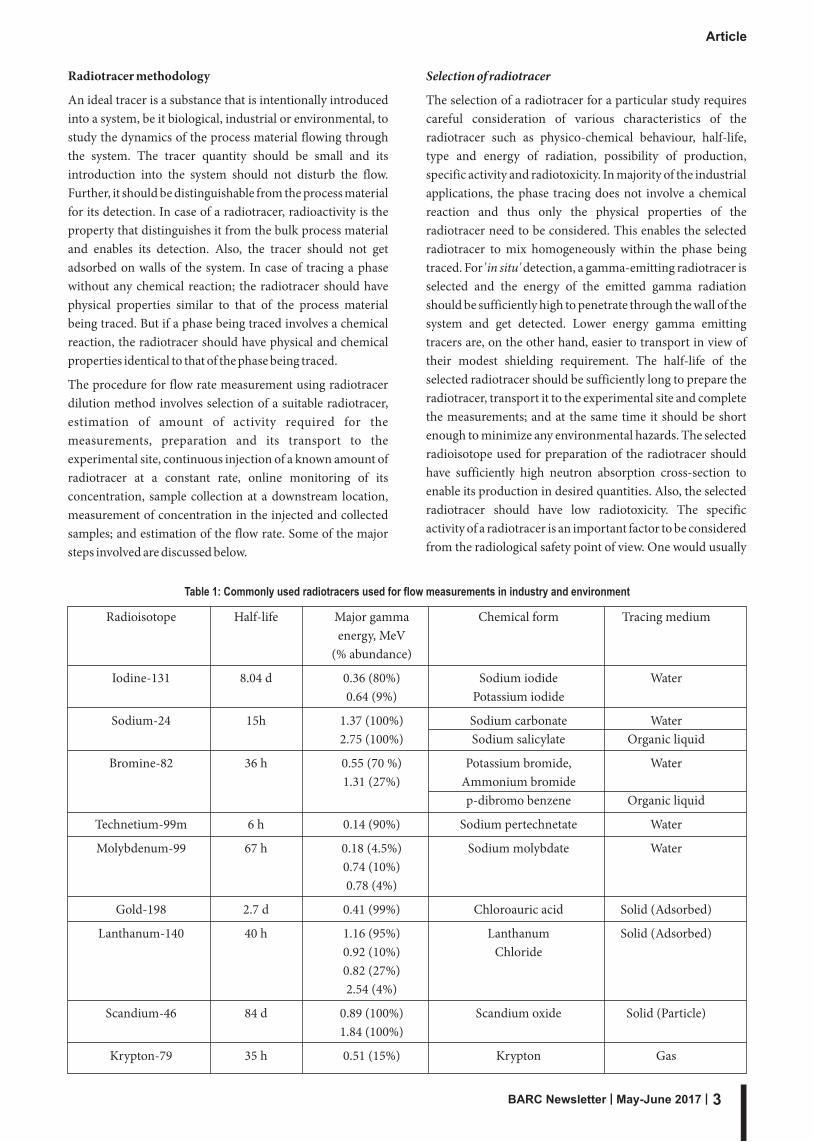
Table 1: Commonly used radiotracers used for flow measurements in industry and environment
Radioisotope Half-life Major gamma Chemical form Tracing mediumenergy, MeV
(% abundance)
Iodine-131 8.04 d 0.36 (80%) Sodium iodide Water0.64 (9%) Potassium iodide
Sodium-24 15h 1.37 (100%) Sodium carbonate Water2.75 (100%) Sodium salicylate Organic liquid
Bromine-82 36 h 0.55 (70 %) Potassium bromide, Water1.31 (27%) Ammonium bromide
p-dibromo benzene Organic liquid
Technetium-99m 6 h 0.14 (90%) Sodium pertechnetate Water
Molybdenum-99 67 h 0.18 (4.5%) Sodium molybdate Water0.74 (10%)0.78 (4%)
Gold-198 2.7 d 0.41 (99%) Chloroauric acid Solid (Adsorbed)
Lanthanum-140 40 h 1.16 (95%) Lanthanum Solid (Adsorbed)0.92 (10%) Chloride0.82 (27%)2.54 (4%)
Scandium-46 84 d 0.89 (100%) Scandium oxide Solid (Particle)1.84 (100%)
Krypton-79 35 h 0.51 (15%) Krypton Gas
|BARC Newsletter 2017 3| May-June
Article

transport small volume of the radiotracer to the experimental site as they are easy to shield and manoeuvre. But the injection of high specific activity poses a risk of loss of the tracer on the wall of the system. The probability of such risk is greatly reduced by adding a carrier i.e. non-radioactive counterpart to the injected tracer. The commonly used radiotracers used for flow rate measurements of different phases in industrial and environmental systems are given in Table 1. Based on the above considerations, Iodine-131 as NaI was selected and used as radiotracer in the case studies described in this article.
Amount of radiotracer
The amount of radiotracer required to measure flow rate is estimated by considering the detector sensitivity for a specific radioisotope at a chosen detection geometry, accuracy desired, expected dilution between the injection and the measuring location and natural background radiation. The detector sensitivity (counts per unit time per unit volume per unit radioactivity) is estimated in the laboratory prior to the field measurements. To minimize possible loss of radiotracer due to adsorption on different surfaces, a non radioactive carrier (similar chemical properties as the radioactive tracer) is always added to the tracer solution before injection.
Based on the above considerations, about 55 GBq activity of Iodine-131 was estimated to be used for flow rate measurements in the canal. Similarly, the amount of radiotracer required for the flow rate measurements in the pipelines was estimated to be about 11 GBq when only one pump was operated and 22 GBq when two pumps were operated.
Preparation of radiotracer
The radiotracer is prepared by neutron irradiation of a suitable target material in a nuclear reactor followed by
chemical processing (if required). The target material is chosen in such a way that, it should undergo nuclear reaction with thermal neutrons to produce the desired radiotracer with appreciable yield. The yield of the product radioisotope depends upon amount of starting material, natural abundance of the target isotope and cross-section of
131the nuclear reaction. Iodine-131 ( I) in the form of sodium iodide has been used as radiotracer in the two case studies
131reported here. Hence the preparation of I radiotracer is explained below. An accurately weighed tellurium dioxide (TeO ) powder was irradiated in DHRUVA reactor at a 2
13 2 1thermal neutron flux of 5 x 10 n cm s for 21 days. After the irradiation, the can was cooled for 2 days and was transported to the radiochemical processing laboratory in a
131 130 131lead shielded flask. I is produced by Te(n,γ) Te nuclear 131reaction (s = 200 mb) followed by beta decay. The I th
radioisotope was separated from the target by dry 131distillation. I is dissolved in aqueous solution and exist in
the form of sodium iodide.
Case studies
The radiotracer dilution method was used for flow rate measurements of water in a branch canal of a canal system and large diameter pipelines in a power plant. The two case studies are described below in details.
Flow rate measurements in a canal
The Sardar Sarovar Project (SSP) shown in Fig. 2, Gujarat, India, an inter-state and multipurpose river valley project irrigates Gujarat, Rajasthan and Maharashtra, provides drinking water to a large number of villages in Gujarat and generate hydropower. The project consists of a main terminal dam on the river Narmada along with 30 major dams, 135 medium dams and 3000 minor dams, a canal system and two
Fig. 2: Site map and location of the canal
|BARC Newsletter 4| May-June 2017
Article

Fig. 3: Photograph of the canal showing the injection and sampling location
Fig. 4: Injection of radiotracer into suction end of the CV pump
hydropower stations. The canal system consists of 532 km 3Narmada Main Canal, with a capacity of 1133 m /s at the head
regulator 38 branch canals taking off from the main canal, covering a total length of 75,000 km, supply to about 2 million hectares of land. The Saurashtra Branch Canal (SBC) is the largest branch canal of Narmada Canal system, which takes off from the Narmada Canal near the village Karannagar. The SBC is 104 km long and tails into Bhogavo II reservoir (Dholi Dhaja Dam) near Surendranagar (Fig. 2).
For supplying water to Saurashtra and Kachchh regions where natural terrain prevents gravity flow, huge pumping stations have been provided at different locations. On the SBC, the total lift of 71 m is provided by a series of five pumping stations with pumping head ranging from 10.8 m to 17 m. In these pumping stations, a total of 26 Concrete Volute (CV) Pumps each having
3capacity of 20 m /s and 22 Vertical Turbine (VT) Pumps each of 35 m /s capacity are installed. After design, engineering,
construction and commissioning of all five pumping stations one of the mandatory requirements was to measure discharge rate for validation of efficiency of the installed CV pumps, energy auditing, and effective management and distribution of water.
The radiotracer dilution method was used for measurement of flow rates in four different sections of SBC. Five pumping stations (PS1, PS2, PS3, PS4 and PS5) were constructed along the 104 km long section of the SBC canal and used for pumping water. Fig. 3 shows a typical pumping station used for pumping the water through the canal and the crosssection of the canal. Each pumping station comprises of 5-6 identical CV pumps. The flow rates were measured at four pumping stations PS2, PS3, PS4, and PS5 with single pump in operation at each station.
For each test, the radiotracer solution was prepared by diluting 131the radiotracer containing 55 GBq activitiy of I in a volume of
15 litre of water in a graduated cylindrical vessel. About 0.06% inactive potassium iodide and 0.3% of sodium thiosulphate was also added and homogeneously mixed within the solution to minimize the losses due to adsorption and evaporation, respectively. 20 ml of this solution was withdrawn, further diluted to a volume 20 L in three successive steps with a dilution
7factor of 10 and stored for the measurement of C . The prepared 1
radiotracer solution was injected at the suction end of the pump at a known constant rate (q) (Table 2) as shown in Fig 4. The injection rate was also manually estimated by monitoring the reduction in volume of tracer solution with time as shown in Fig 5.
Fig. 5. Measurement of injection rate of radiotracer
The samples for measurement of radiotracer concentration (C ) were collected from a downstream location (Fig 3b) at 2
which the radiotracer was expected to mix homogeneously
|BARC Newsletter 2017 5| May-June
Article
(a) (b)Pumping station/Injection location Sampling location
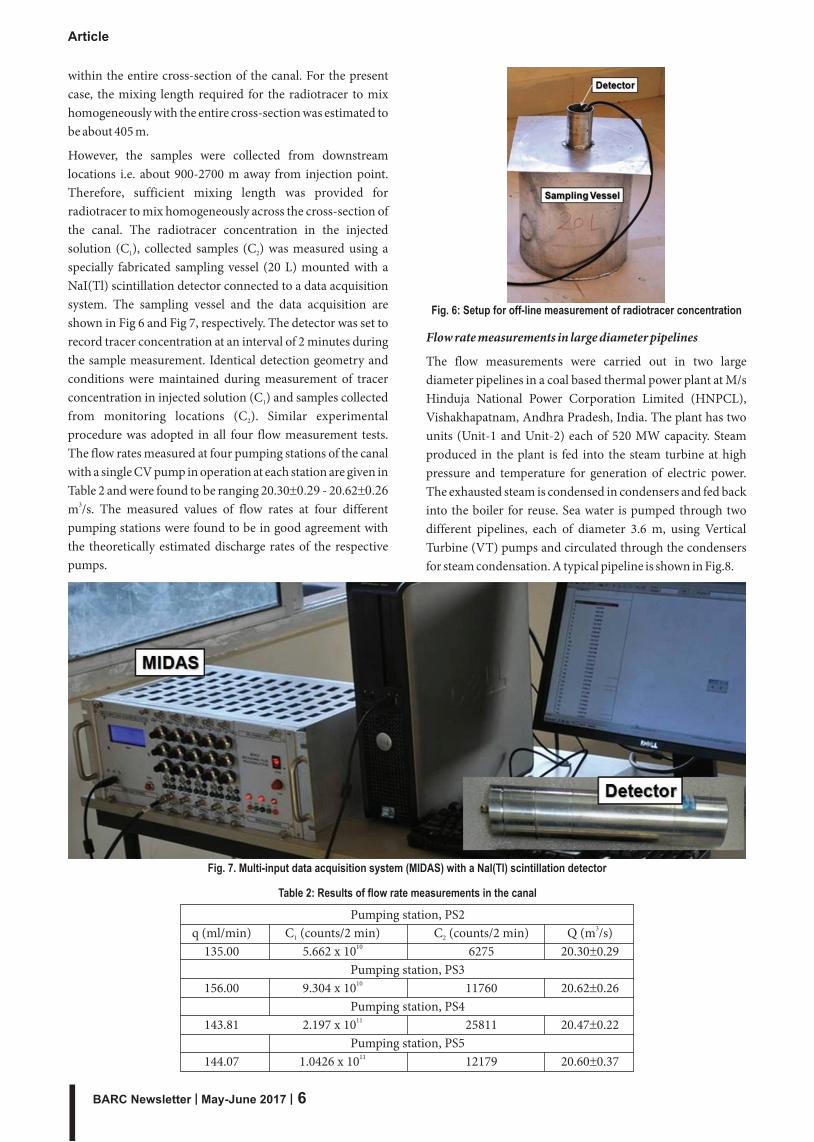
Fig. 6: Setup for off-line measurement of radiotracer concentration
within the entire cross-section of the canal. For the present case, the mixing length required for the radiotracer to mix homogeneously with the entire cross-section was estimated to be about 405 m.
However, the samples were collected from downstream locations i.e. about 900-2700 m away from injection point. Therefore, sufficient mixing length was provided for radiotracer to mix homogeneously across the cross-section of the canal. The radiotracer concentration in the injected solution (C ), collected samples (C ) was measured using a 1 2
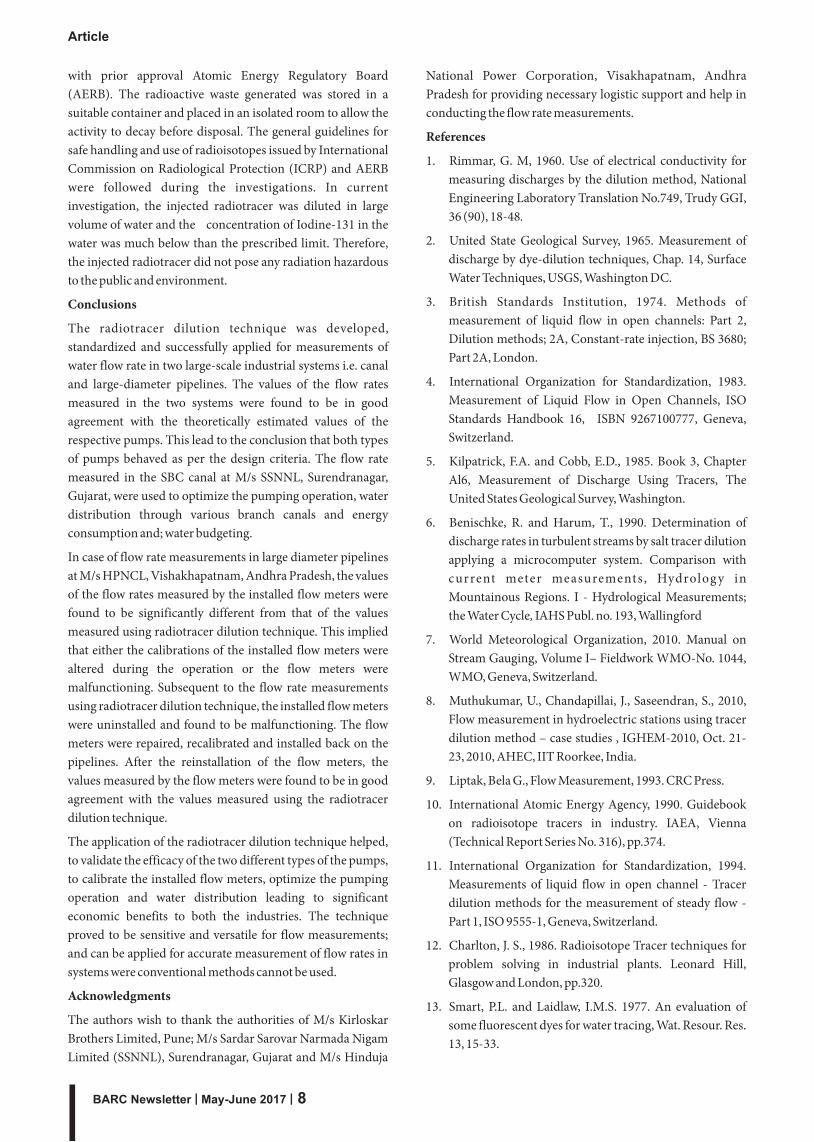
specially fabricated sampling vessel (20 L) mounted with a NaI(Tl) scintillation detector connected to a data acquisition system. The sampling vessel and the data acquisition are shown in Fig 6 and Fig 7, respectively. The detector was set to record tracer concentration at an interval of 2 minutes during the sample measurement. Identical detection geometry and conditions were maintained during measurement of tracer concentration in injected solution (C ) and samples collected 1
from monitoring locations (C ). Similar experimental 2
procedure was adopted in all four flow measurement tests. The flow rates measured at four pumping stations of the canal with a single CV pump in operation at each station are given in Table 2 and were found to be ranging 20.30±0.29 - 20.62±0.26
3m /s. The measured values of flow rates at four different pumping stations were found to be in good agreement with the theoretically estimated discharge rates of the respective pumps.
Fig. 7. Multi-input data acquisition system (MIDAS) with a NaI(Tl) scintillation detector
Pumping station, PS23q (ml/min) C (counts/2 min) C (counts/2 min) Q (m /s)1 2
10135.00 5.662 x 10 6275 20.30±0.29Pumping station, PS3
10156.00 9.304 x 10 11760 20.62±0.26Pumping station, PS4
11143.81 2.197 x 10 25811 20.47±0.22Pumping station, PS5
11144.07 1.0426 x 10 12179 20.60±0.37
Table 2: Results of flow rate measurements in the canal
Flow rate measurements in large diameter pipelines
The flow measurements were carried out in two large diameter pipelines in a coal based thermal power plant at M/s Hinduja National Power Corporation Limited (HNPCL), Vishakhapatnam, Andhra Pradesh, India. The plant has two units (Unit-1 and Unit-2) each of 520 MW capacity. Steam produced in the plant is fed into the steam turbine at high pressure and temperature for generation of electric power. The exhausted steam is condensed in condensers and fed back into the boiler for reuse. Sea water is pumped through two different pipelines, each of diameter 3.6 m, using Vertical Turbine (VT) pumps and circulated through the condensers for steam condensation. A typical pipeline is shown in Fig.8.
|BARC Newsletter 6| May-June 2017
Article

Unit-1, P1A3q (ml/min) C (counts/2 min) C (counts/2 min) Q (m /s)1 2
10188.2 5.867 x 10 11875 15.43±0.46Unit-1, P1A+P1B
10187.2 3.755 x 10 4240 27.51±0.82Unit-2, P2A10220.8 3.096 x 10 8044 14.10±0.43
Unit-2, P2A+P2B10185.1 6.626 x 10 8291 24.55±0.78
Table 3: Results of flow rate measurements in large diameter pipelines
A schematic diagram of the experimental system is shown in Fig 9. There are two independent pumping stations for each unit and each pumping station has two identical VT pumps for pumping the sea water for cooling. The pumps, P1A and P1B are used for pumping water in Unit-1, whereas the pumps P2A and P2B are used for pumping the water in Unit-2. Four tests were performed with operations of P1A; P1A and P1B simultaneously; P2A; and P2A and P2B simultaneously for flow rate measurements. The radiotracer stock solution preparation and the tracer injection were carried out in a similar manner as mentioned in previous case study described in the current article. In this case about 11-22 GBq
131activity of I was used in each measurement. The radiotracer injection system used for injecting the radiotracer into the pipeline is shown in Fig 10.
An aliquot of 20 ml was collected from the stock solution, further diluted to a volume 20 L in three successive steps with
6a dilution factor of 10 and stored for measurement of C . The 1
samples for the measurements of tracer concentration C were 2
collected from a downstream location at a distance of 1500 m from the injection point. This distance was sufficient enough for the radiotracer to mix uniformly across the cross-section of the pipe. The concentrations of radiotracer in injected solution and in sample collected at downstream were
Fig. 8: Large diameter pipelines used for transporting the cooling water
Fig.9: Schematic diagram of the cooling water circulation system and experimental setup for flow rate measurements
measured as mentioned in Section 4.1. The results obtained from the flow rate measurements in large diameter pipelines in the thermal power plant are given in Table 3.
Fig.10: Injection system used of injecting the radiotracer into the pipeline
The values of the flow rates of cooling water in the pipelines of Unit-1 and Unit-2 of the power plant were measured to be
315.43±0.46 and 14.10±0.43 m /s, respectively when only one VT pump was operated in each unit. Whereas, the values of the measured flow rates were found to be 27.51±0.82 and
324.55±0.78 m /s, respectively when both the pumps were operated simultaneously in each unit. To the best of author's knowledge the flow rate measurement in such large diameter pipelines using radiotracer dilution technique has been carried out for the first time.
Radiological safety
The radiotracer tests were carried out by trained and authorized personnel of Isotope and Radiation Application Division (IRAD), Bhabha Atomic Research Centre, Mumbai
|BARC Newsletter 2017 7| May-June
Article
with prior approval Atomic Energy Regulatory Board (AERB). The radioactive waste generated was stored in a suitable container and placed in an isolated room to allow the activity to decay before disposal. The general guidelines for safe handling and use of radioisotopes issued by International Commission on Radiological Protection (ICRP) and AERB were followed during the investigations. In current investigation, the injected radiotracer was diluted in large volume of water and the concentration of Iodine-131 in the water was much below than the prescribed limit. Therefore, the injected radiotracer did not pose any radiation hazardous to the public and environment.
Conclusions
The radiotracer dilution technique was developed, standardized and successfully applied for measurements of water flow rate in two large-scale industrial systems i.e. canal and large-diameter pipelines. The values of the flow rates measured in the two systems were found to be in good agreement with the theoretically estimated values of the respective pumps. This lead to the conclusion that both types of pumps behaved as per the design criteria. The flow rate measured in the SBC canal at M/s SSNNL, Surendranagar, Gujarat, were used to optimize the pumping operation, water distribution through various branch canals and energy consumption and; water budgeting.
In case of flow rate measurements in large diameter pipelines at M/s HPNCL, Vishakhapatnam, Andhra Pradesh, the values of the flow rates measured by the installed flow meters were found to be significantly different from that of the values measured using radiotracer dilution technique. This implied that either the calibrations of the installed flow meters were altered during the operation or the flow meters were malfunctioning. Subsequent to the flow rate measurements using radiotracer dilution technique, the installed flow meters were uninstalled and found to be malfunctioning. The flow meters were repaired, recalibrated and installed back on the pipelines. After the reinstallation of the flow meters, the values measured by the flow meters were found to be in good agreement with the values measured using the radiotracer dilution technique.
The application of the radiotracer dilution technique helped, to validate the efficacy of the two different types of the pumps, to calibrate the installed flow meters, optimize the pumping operation and water distribution leading to significant economic benefits to both the industries. The technique proved to be sensitive and versatile for flow measurements; and can be applied for accurate measurement of flow rates in systems were conventional methods cannot be used.
Acknowledgments
The authors wish to thank the authorities of M/s Kirloskar Brothers Limited, Pune; M/s Sardar Sarovar Narmada Nigam Limited (SSNNL), Surendranagar, Gujarat and M/s Hinduja
National Power Corporation, Visakhapatnam, Andhra Pradesh for providing necessary logistic support and help in conducting the flow rate measurements.
References
1. Rimmar, G. M, 1960. Use of electrical conductivity for measuring discharges by the dilution method, National Engineering Laboratory Translation No.749, Trudy GGI, 36 (90), 18-48.
2. United State Geological Survey, 1965. Measurement of discharge by dye-dilution techniques, Chap. 14, Surface Water Techniques, USGS, Washington DC.
3. British Standards Institution, 1974. Methods of measurement of liquid flow in open channels: Part 2, Dilution methods; 2A, Constant-rate injection, BS 3680; Part 2A, London.
4. International Organization for Standardization, 1983. Measurement of Liquid Flow in Open Channels, ISO Standards Handbook 16, ISBN 9267100777, Geneva, Switzerland.
5. Kilpatrick, F.A. and Cobb, E.D., 1985. Book 3, Chapter Al6, Measurement of Discharge Using Tracers, The United States Geological Survey, Washington.
6. Benischke, R. and Harum, T., 1990. Determination of discharge rates in turbulent streams by salt tracer dilution applying a microcomputer system. Comparison with current meter measurements, Hydrolog y in Mountainous Regions. I - Hydrological Measurements; the Water Cycle, IAHS Publ. no. 193, Wallingford
7. World Meteorological Organization, 2010. Manual on Stream Gauging, Volume I– Fieldwork WMO-No. 1044, WMO, Geneva, Switzerland.
8. Muthukumar, U., Chandapillai, J., Saseendran, S., 2010, Flow measurement in hydroelectric stations using tracer dilution method – case studies , IGHEM-2010, Oct. 21-23, 2010, AHEC, IIT Roorkee, India.
9. Liptak, Bela G., Flow Measurement, 1993. CRC Press.
10. International Atomic Energy Agency, 1990. Guidebook on radioisotope tracers in industry. IAEA, Vienna (Technical Report Series No. 316), pp.374.
11. International Organization for Standardization, 1994. Measurements of liquid flow in open channel - Tracer dilution methods for the measurement of steady flow - Part 1, ISO 9555-1, Geneva, Switzerland.
12. Charlton, J. S., 1986. Radioisotope Tracer techniques for problem solving in industrial plants. Leonard Hill, Glasgow and London, pp.320.
13. Smart, P.L. and Laidlaw, I.M.S. 1977. An evaluation of some fluorescent dyes for water tracing, Wat. Resour. Res. 13, 15-33.
|BARC Newsletter 8| May-June 2017
Article
14. Smith, D.B., 1964. River flow Measurement using Radioactive Tracers. Dilution Techniques for Flow Measurement, Bulletin, No. 31. Paper 8, Dept. of Civil Engineering, Univ. of Newcastle, Newcastle, New South Wales, Australia.
15. British Standards Institution (1967) Methods of measurement of liquid flow in open channels. Part 2. Dilution methods. 2C. Radioisotope techniques. BS 3680 Part 2C, London.
16. International Atomic Energy Agency, 1968. Guidebook on nuclear techniques in hydrology. Tech.Rep.Ser.No.91, IAEA, Vienna.
17. International Organization for Standardization, 1973. Liquid Flow Measurement in Open Chnnnels-Dilution Methods for Measurement of Steady Flow-Constant Rate Injection Method”, ISO Standard 555/1.
18. International Organization for Standardization, 1974. Liquid flow measurement in open channels-dilution methods for measurement of steady flow-integration (sudden injection) method. ISO Standard 555/11.
19. Elder, J.W. 1959. The dispersion of a marked fluid in turbulent shear flow. Journal of Fluid Mechanics 5(4): 544–560.
20. Hull, D.E., Dispersion and persistence of tracer in river flow measurements, 1962. Int. J. App. Rad. and Isotopes, 13.
21. Barsby, A., 1968, Determination of mixing length in dilution gauging, International Association of scientific hydrology publication no. 78, 395 - 407.
22. Ward, P. R. B., 1973. Prediction of mixing lengths for river flow gauging, J. Hydraul. Div. Am. Soc. Civ. Eng., 99(7), 1069– 1081.
23. International Standards Organization, ISO 2975-3:1976, Measurement of water flows in closed conduits-tracer methods-Part III, Constant rate injection method using radioactive tracers, Geneva, 1976.
24. Proceedings of the symposium on Radioisotope Tracers in Industry and Geophysics, Prague, 21 - 25 November, 1966. Printed by International Atomic Energy Agency, pp 564.
25. Subramanya, K., Engineering Hydrology, 1994, pp 115.
|BARC Newsletter 2017 9| May-June
Article


![[XLS] · Web viewApproaches used in the Mackenzie laboratory include theoretical modeling of transporter function, structure/function relationships, electrophysiology, radiotracer](https://static.fdocuments.in/doc/165x107/5b0875c87f8b9a992a8c4f95/xls-viewapproaches-used-in-the-mackenzie-laboratory-include-theoretical-modeling.jpg)