Development and Application of a Nutrient Attenuation ... Annual Conference...• John Galbraith,...
36
October 23, 2017 Victor D’Amato, PE Development and Application of a Nutrient Attenuation Assessment Methodology for Chesapeake Bay Watershed Onsite Wastewater Treatment Systems
Transcript of Development and Application of a Nutrient Attenuation ... Annual Conference...• John Galbraith,...

October 23, 2017
Victor D’Amato, PE
Development and Application of a Nutrient Attenuation Assessment Methodology for Chesapeake Bay Watershed Onsite Wastewater Treatment Systems

Outline
• Development: Chesapeake Bay Expert Panel on Nutrient Attenuation in OWTS
– Background
– Approach/conceptual framework
– Results
– Caveats and recommendations
• Application: Maryland OWTS Gap Closer Analysis
– Project objectives and approach
– Results of analysis
– Implications and next steps

ChesBay OWTS Attenuation Panel History
• On-Site Wastewater Treatment Systems Nitrogen Reduction Technologies Panel
– Initial Best Management Practices (BMP) report approved in February 2014
– Currently considering two additional BMPs
• Attenuation Panel formed in June 2014
– Approximately 20 conference calls/meeting
– Approx. 13 engineers, 10 soil scientists, 4 modelers, 3 geologists, 2 hydrologists, others
– Final report approved in October
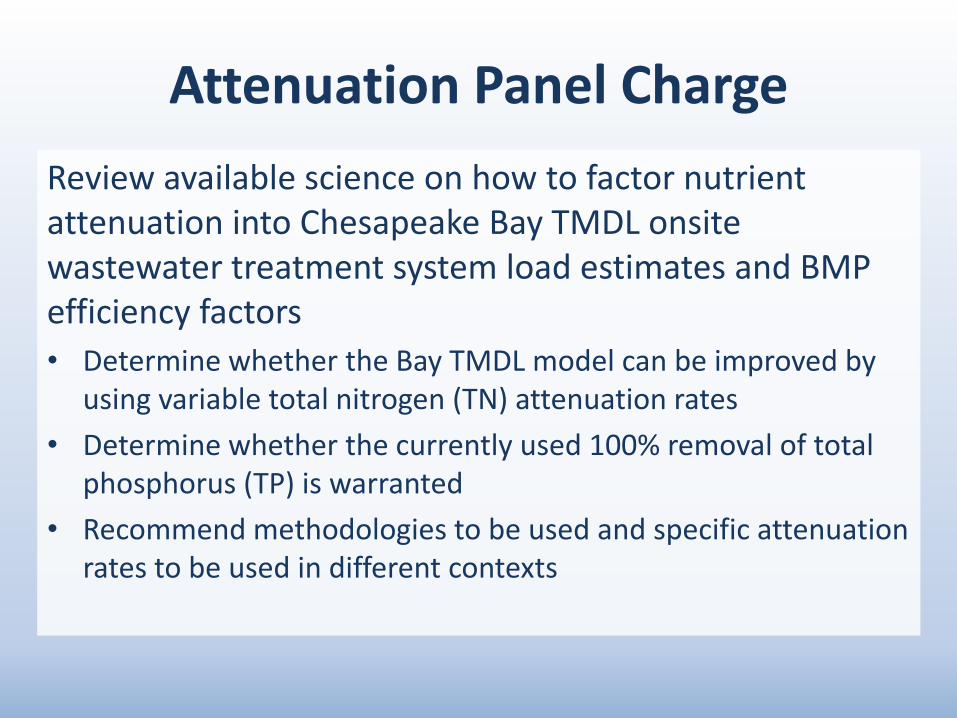
Review available science on how to factor nutrient attenuation into Chesapeake Bay TMDL onsite wastewater treatment system load estimates and BMP efficiency factors
• Determine whether the Bay TMDL model can be improved by using variable total nitrogen (TN) attenuation rates
• Determine whether the currently used 100% removal of total phosphorus (TP) is warranted
• Recommend methodologies to be used and specific attenuation rates to be used in different contexts
Attenuation Panel Charge

Bay States
• Tom Boekeloo, New York State DEC
• Jay Conta, Virginia Tech/Virginia DOH
• Marcia Degen, Virginia Dept. of Health
• Joshua Flatley, Maryland Dept. of Environment
• Jack Hayes, Delaware DNREC
• Nick Hong - PA DEP
• Dave Montali, West Virginia DEP
Attenuation Panelists
Other Panelists
• Steven Berkowitz, North Carolina DHHS
• Judy Denver, USGS
• John Galbraith, Virginia Tech
• Barry Glotfelty, Frederick County (MD) HD
• Robert Goo, US EPA - OWOW
• George Heufelder, Barnstable County (MA) DHE
• Michael O'Driscoll, East Carolina/Duke University
• David Radcliffe, University of Georgia
• Eberhard Roeder, Florida Department of Health
• Robert Siegrist, Colorado School of Mines
Chesapeake Bay Program Office
• Lewis Linker
• David Wood
• Ning Zhou
United States Geological Survey (USGS)
• Scott Ator
• John Brakebill
• Andrew Sekellick
Advisors/Contributors
• Rob Adler, US EPA - Region 1 (retired)
• Jim Anderson, University of Minnesota
• Jason Baumgartner, Delaware DNREC
• John Diehl, Pennsylvania DEP (retired)
• Paul Finnell, US Department of Agriculture
• Mengistu Geza, Colorado School of Mines
• Kristina Heinemann, US EPA - Region 2
• Charles Humphrey, East Carolina University
• Joyce Hudson, US EPA - OWM (retired)
• Ruth Izraeli, US EPA - Region 2
Other Contributors and Former PanelistsAdvisors/Contributors (continued)
• Jim Kreissl, Tetra Tech
• David Lindbo, US Department of Agriculture
• Andrew J. Maupin, Idaho DEQ
• Kevin McLeary, Pennsylvania DEP
• Randy Miles, University of Missouri
• Ross Mandel, ICPRB
• Jeff Moeller, Water Environment Research Foundation
• Rich Piluk, Anne Arundel County (MD) Health Department
• Sushama Pradhan, North Carolina DHHS
• Jay Prager, Maryland Department of Environment (retired)
• Carol Ptacek, University of Waterloo
• Eric Regensburger, Montana DEQ
• David Sample, Virginia Tech
• Durrelle Scott, Virginia Tech
• Ivan Valiela, Cornell University
• Janice Vollero, Pennsylvania DEP
• Kang Xia, Virginia Tech

Methods
• Develop conceptual framework for evaluating and reporting nutrient removal in OWTS
• Literature review
• Modeling, which was used to corroborate findings from the literature
– STUMOD (Soil Treatment Unit Model) by Colorado School of Mines
– SPARROW (Spatially Referenced Regression on Watershed Attributes) by USGS

Chesapeake Bay Program OWTS Assumptions
Panel Task: can we improve upon 20% and 60% TN reduction assumptions throughout watershed?

Attenuation Panel Conceptual Framework
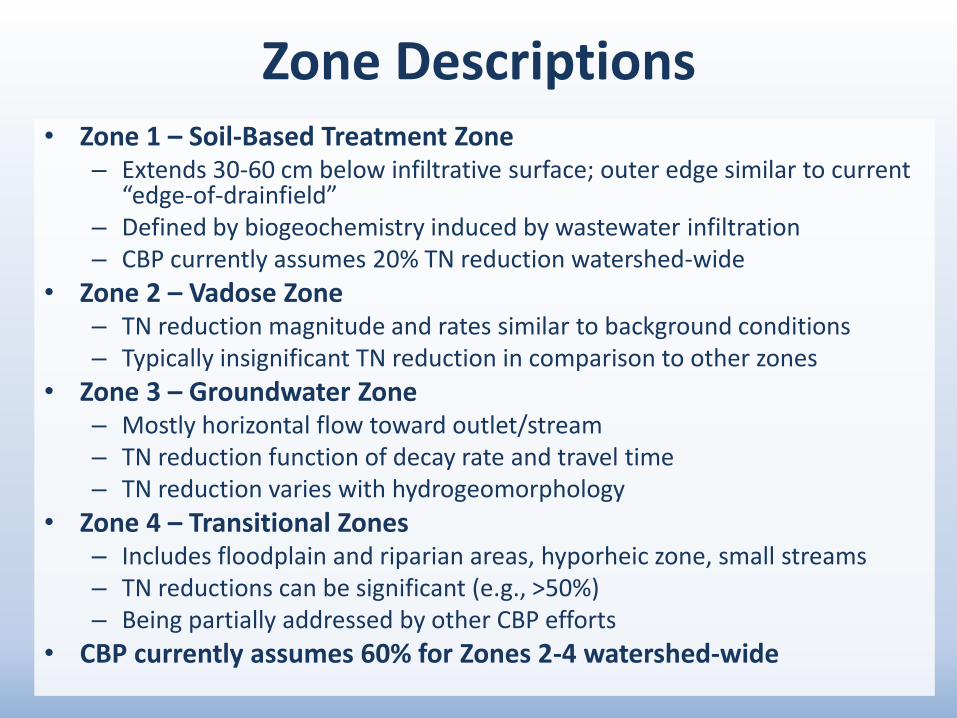
Zone Descriptions• Zone 1 – Soil-Based Treatment Zone
– Extends 30-60 cm below infiltrative surface; outer edge similar to current “edge-of-drainfield”
– Defined by biogeochemistry induced by wastewater infiltration – CBP currently assumes 20% TN reduction watershed-wide
• Zone 2 – Vadose Zone– TN reduction magnitude and rates similar to background conditions– Typically insignificant TN reduction in comparison to other zones
• Zone 3 – Groundwater Zone– Mostly horizontal flow toward outlet/stream– TN reduction function of decay rate and travel time– TN reduction varies with hydrogeomorphology
• Zone 4 – Transitional Zones– Includes floodplain and riparian areas, hyporheic zone, small streams– TN reductions can be significant (e.g., >50%)– Being partially addressed by other CBP efforts
• CBP currently assumes 60% for Zones 2-4 watershed-wide
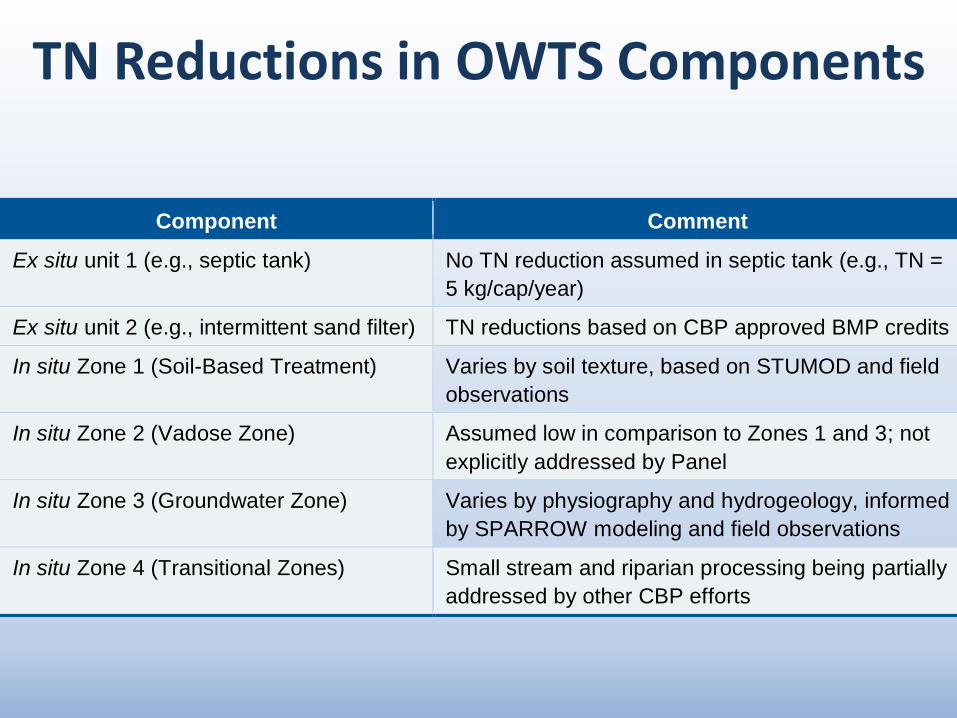
TN Reductions in OWTS Components
Component Comment
Ex situ unit 1 (e.g., septic tank) No TN reduction assumed in septic tank (e.g., TN =
5 kg/cap/year)
Ex situ unit 2 (e.g., intermittent sand filter) TN reductions based on CBP approved BMP credits
In situ Zone 1 (Soil-Based Treatment) Varies by soil texture, based on STUMOD and field
observations
In situ Zone 2 (Vadose Zone) Assumed low in comparison to Zones 1 and 3; not
explicitly addressed by Panel
In situ Zone 3 (Groundwater Zone) Varies by physiography and hydrogeology, informed
by SPARROW modeling and field observations
In situ Zone 4 (Transitional Zones) Small stream and riparian processing being partially
addressed by other CBP efforts

Zone 1 Results and Recommendation
Soil textural class Loading rate (cm/day)
TN reduction for a specified depth to groundwater and actual hydraulic loading rate applied
30 cm/100% 30 cm/50% 60 cm/100% 60 cm/50%
Sand 4 7%
16%
16% 31%
Loamy sand 4
Sandy loam 3
Loam 3
Silt loam 1.8 11%
30%
34% 59%
Clay loam 1.8
Sandy clay loam 1.8
Silty clay loam 1.8
Silt 1.8
Sandy clay 1 29%
54%
54% 80%
Silty clay 1
Clay 1

Zone 1 Implications
• Change to spatially variable Zone 1 TN reduction rates results in a total OWTS sector load decrease of approximately 4 percent~ 3 percent increase for sandy soils~ 16 percent decrease for loamy soils ~ 45 percent decrease for clayey soils

Zone 3 Results and RecommendationHydrogeomorphic Region1 Relative TN
Transmission Classification
Recommended Zone 3 Attenuation Factor
(Transmission Factor)
Fine Coastal Plain - Coastal Lowlands Low 75% (25%)
Fine Coastal Plain - Alluvial and Estuarine Valleys Low 75% (25%)
Fine Coastal Plain - Inner Coastal Plain - Upland Sands and Gravels Medium 60% (40%)
Fine Coastal Plain - Middle Coastal Plain – mixed sediment texture Medium 60% (40%)
Fine Coastal Plain - Middle Coastal Plain – fine sediment texture Low 75% (25%)
Coarse Coastal Plain - Middle Coastal Plain – Sands with Overlying
Gravels (also dissected)
High 45% (55%)
Coarse Coastal Plain - Inner Coastal Plain - Dissected Outcrop Belt High 45% (55%)
Crystalline Piedmont High 45% (55%)
Crystalline Blue Ridge High 45% (55%)
Carbonate Piedmont Very High 35% (65%)
Carbonate Valley and Ridge Very High 35% (65%)
Carbonate Appalachian Plateau Very High 35% (65%)
Siliciclastic Mesozoic Lowland High 45% (55%)
Siliciclastic Valley and Ridge Medium 60% (40%)
Siliciclastic Appalachian Plateau Low 75% (25%)
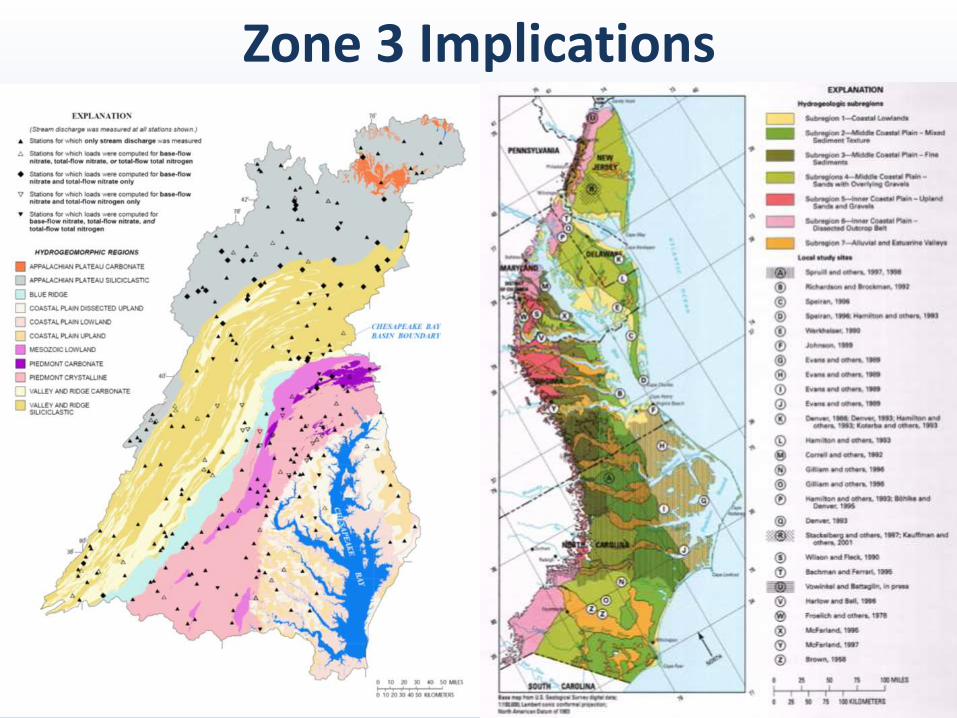
Zone 3 Implications

Overall Panel Recommendations
Soil Textural
Classification
USDA Soil Textures Low TN
Transmission
Area
Medium TN
Transmission
Area
High TN
Transmission
Area
Very High TN
Transmission
Area
Sandy Sand, Loamy Sand,
Sandy Loam, Loam
1.1 kg/cap/yr
(-31%)
1.7 kg/cap/yr
(6%)
2.3 kg/cap/yr
(44%)
2.7 kg/cap/yr
(69%)
Loamy Silt loam, Clay Loam,
Sandy Clay Loam, Silty
Clay Loam, Silt
0.8 kg/cap/yr
(-50%)
1.3 kg/cap/yr
(-19%)
1.8 kg/cap/yr
(13%)
2.1 kg/cap/yr
(31%)
Clayey Sandy Clay, Silty Clay,
Clay
0.6 kg/cap/yr
(-63%)
0.9 kg/cap/yr
(-44%)
1.3 kg/cap/yr
(-19%)
1.5 kg/cap/yr
(-6%)
Represents delivery to Zone 4 (additional removal possible)
Change from current CBP load (1.6 kg/cap/yr) in parentheses
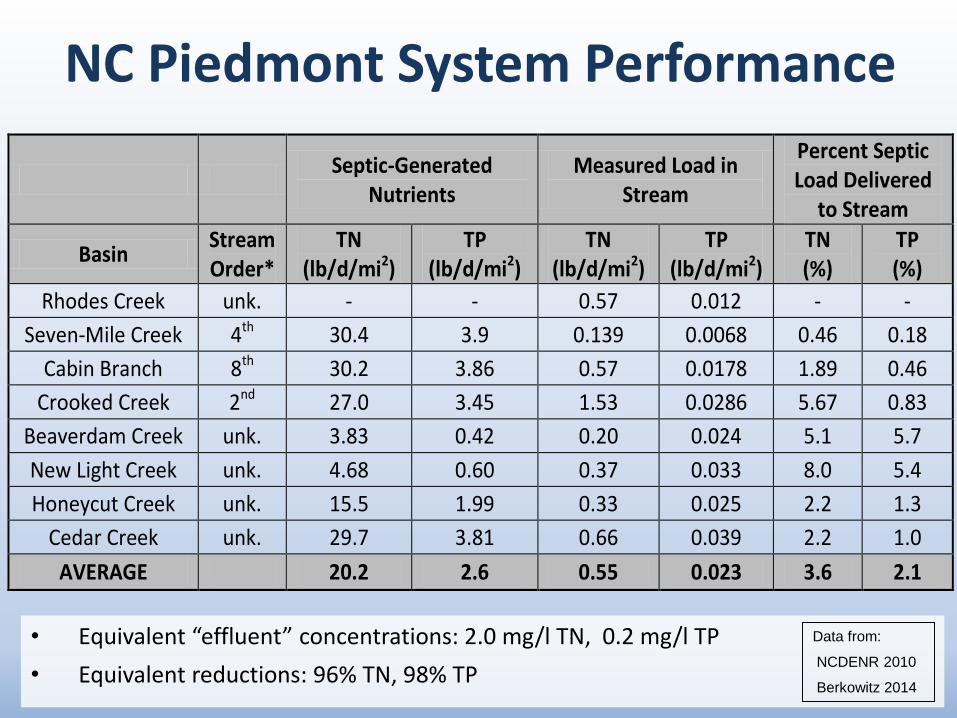
NC Piedmont System Performance
• Equivalent “effluent” concentrations: 2.0 mg/l TN, 0.2 mg/l TP
• Equivalent reductions: 96% TN, 98% TP
Septic-Generated
Nutrients Measured Load in
Stream
Percent Septic Load Delivered
to Stream
Basin Stream Order*
TN (lb/d/mi2)
TP (lb/d/mi2)
TN (lb/d/mi2)
TP (lb/d/mi2)
TN (%)
TP (%)
Rhodes Creek unk. - - 0.57 0.012 - -
Seven-Mile Creek 4th 30.4 3.9 0.139 0.0068 0.46 0.18
Cabin Branch 8th 30.2 3.86 0.57 0.0178 1.89 0.46
Crooked Creek 2nd 27.0 3.45 1.53 0.0286 5.67 0.83
Beaverdam Creek unk. 3.83 0.42 0.20 0.024 5.1 5.7
New Light Creek unk. 4.68 0.60 0.37 0.033 8.0 5.4
Honeycut Creek unk. 15.5 1.99 0.33 0.025 2.2 1.3
Cedar Creek unk. 29.7 3.81 0.66 0.039 2.2 1.0
AVERAGE 20.2 2.6 0.55 0.023 3.6 2.1
Data from:
NCDENR 2010
Berkowitz 2014
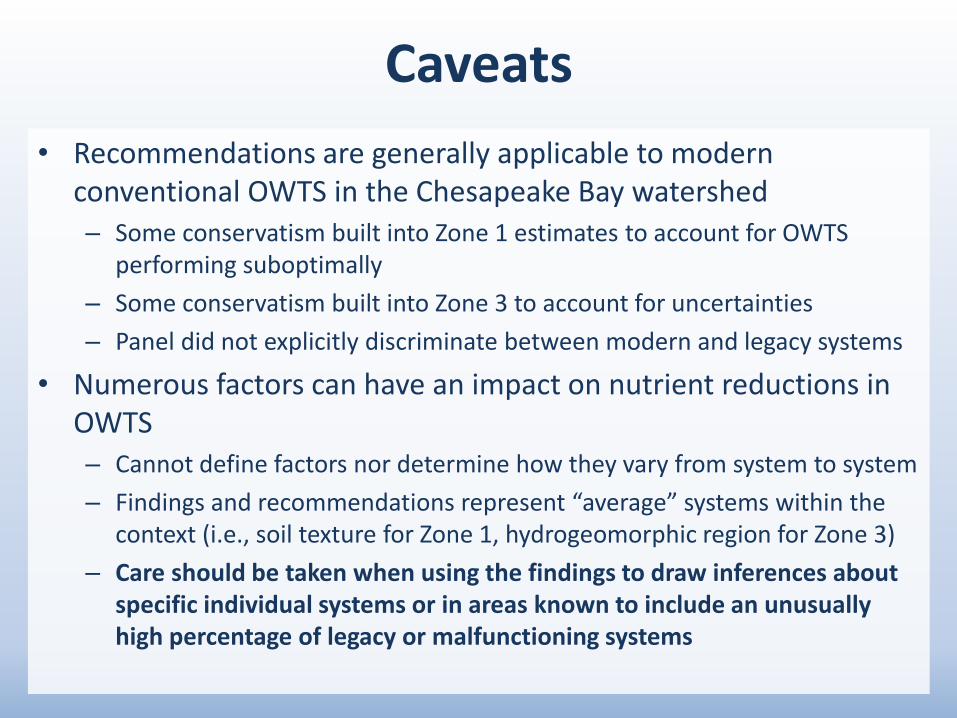
Caveats
• Recommendations are generally applicable to modern conventional OWTS in the Chesapeake Bay watershed– Some conservatism built into Zone 1 estimates to account for OWTS
performing suboptimally
– Some conservatism built into Zone 3 to account for uncertainties
– Panel did not explicitly discriminate between modern and legacy systems
• Numerous factors can have an impact on nutrient reductions in OWTS– Cannot define factors nor determine how they vary from system to system
– Findings and recommendations represent “average” systems within the context (i.e., soil texture for Zone 1, hydrogeomorphic region for Zone 3)
– Care should be taken when using the findings to draw inferences about specific individual systems or in areas known to include an unusually high percentage of legacy or malfunctioning systems
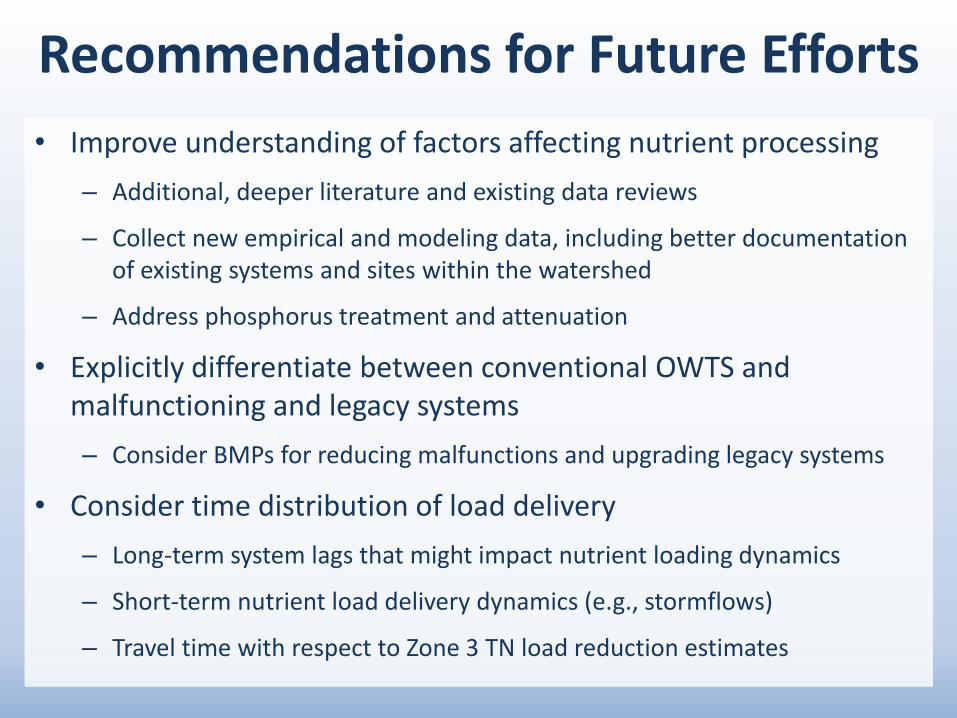
Recommendations for Future Efforts
• Improve understanding of factors affecting nutrient processing
– Additional, deeper literature and existing data reviews
– Collect new empirical and modeling data, including better documentation of existing systems and sites within the watershed
– Address phosphorus treatment and attenuation
• Explicitly differentiate between conventional OWTS and malfunctioning and legacy systems
– Consider BMPs for reducing malfunctions and upgrading legacy systems
• Consider time distribution of load delivery
– Long-term system lags that might impact nutrient loading dynamics
– Short-term nutrient load delivery dynamics (e.g., stormflows)
– Travel time with respect to Zone 3 TN load reduction estimates

Maryland Gap Closer Analysis for Chesapeake Bay TMDL Implementation
• US EPA funded support for states to implement Chesapeake Bay nutrient TMDL
• Objective– Help determine how to best reduce Chesapeake Bay Watershed
nitrogen loading from OWTS in Maryland
• Approach– First assess the relative nitrogen loading associated with individual
systems to establish priority: Nutrient Loading Analysis
– Then assess the most appropriate approach for reducing nutrient loading associated with individual systems: Nutrient Reduction Analysis
– GIS analysis of ~420,000 existing individual onsite systems

Nutrient Loading Analysis
Indicators
● system age
● soil suitability (depth to restrictive layer, saturated hydraulic conductivity, and drainage class)
● proximity to streams
● proximity to lakes and ponds
● proximity to Bay tidal waters
● watershed vulnerability
● housing density
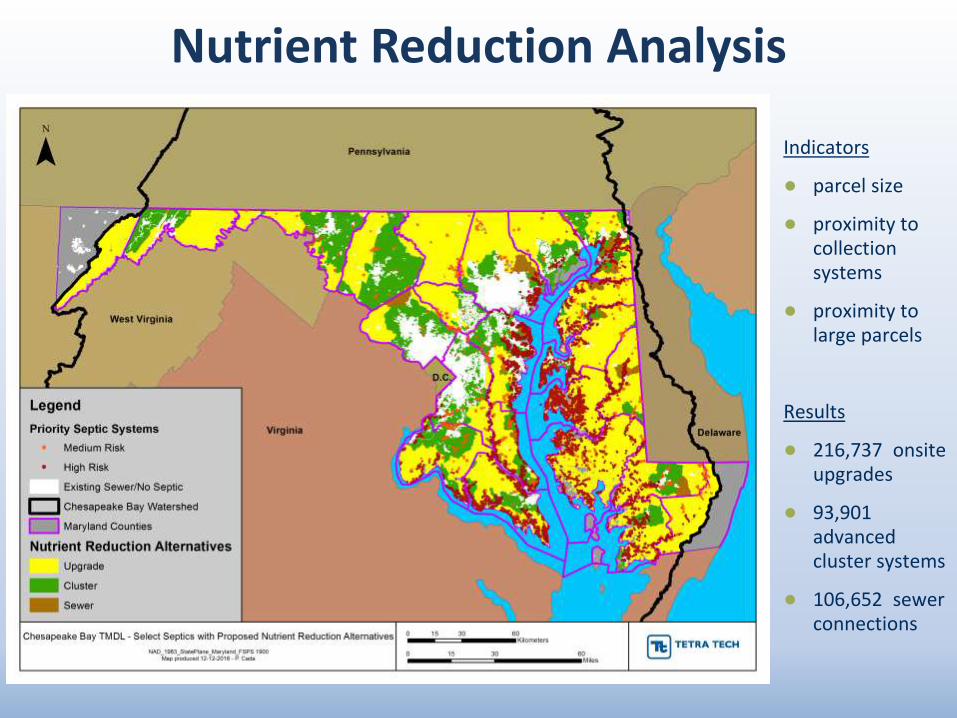
Nutrient Reduction Analysis
Indicators
● parcel size
● proximity to collection systems
● proximity to large parcels
Results
● 216,737 onsite upgrades
● 93,901 advanced cluster systems
● 106,652 sewer connections
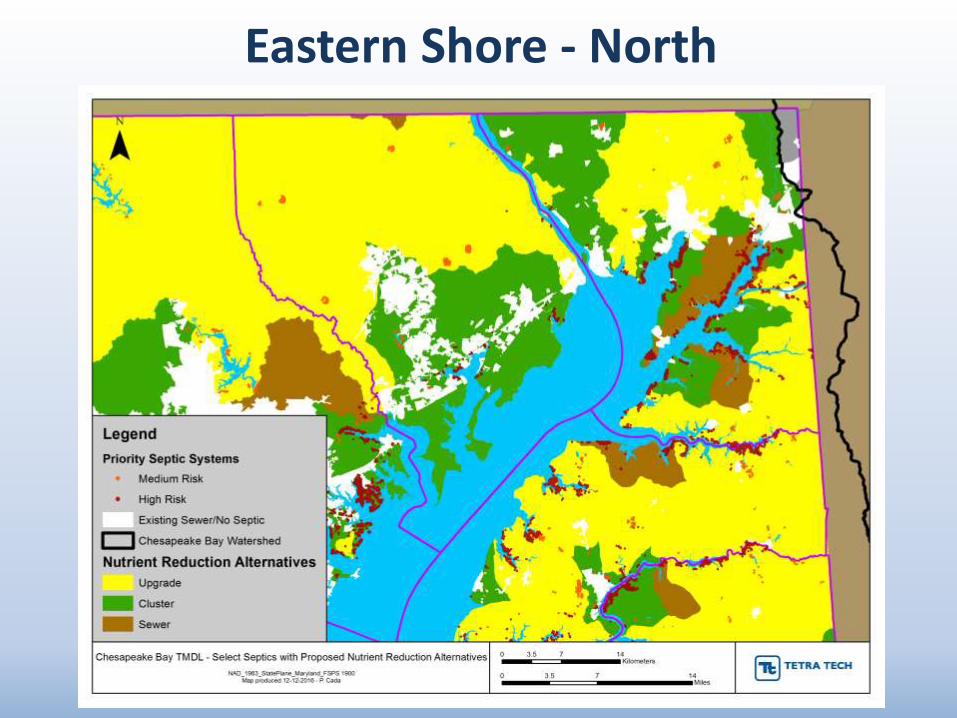
Eastern Shore - North

Eastern Shore - Central

Eastern Shore - South
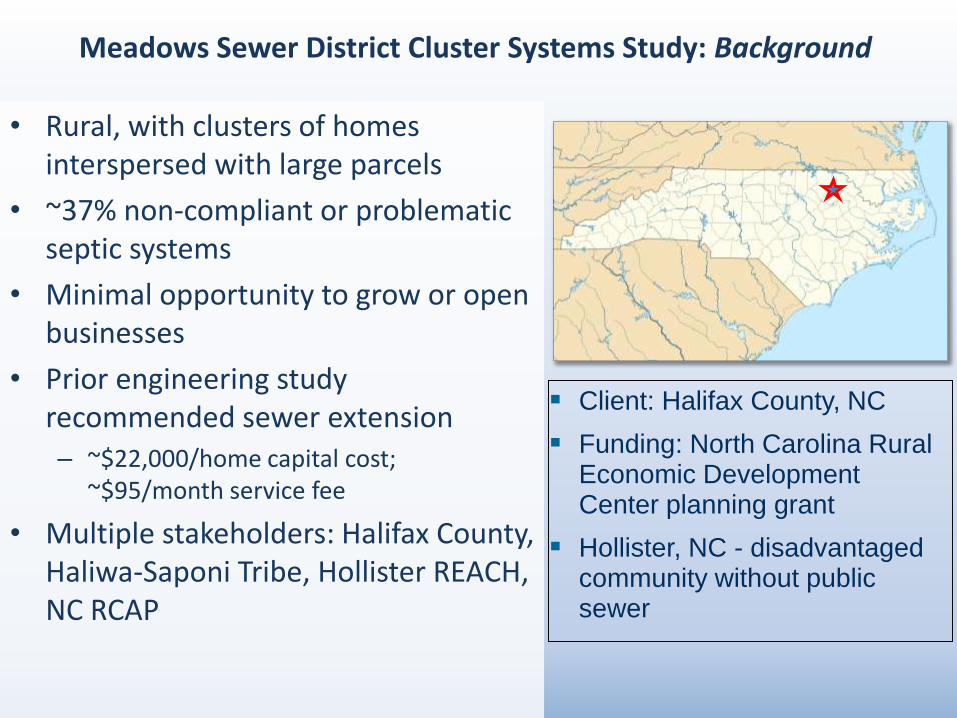
Meadows Sewer District Cluster Systems Study: Background
• Rural, with clusters of homes interspersed with large parcels
• ~37% non-compliant or problematic septic systems
• Minimal opportunity to grow or open businesses
• Prior engineering study recommended sewer extension– ~$22,000/home capital cost;
~$95/month service fee
• Multiple stakeholders: Halifax County, Haliwa-Saponi Tribe, Hollister REACH, NC RCAP
Client: Halifax County, NC
Funding: North Carolina Rural Economic Development Center planning grant
Hollister, NC - disadvantaged community without public sewer
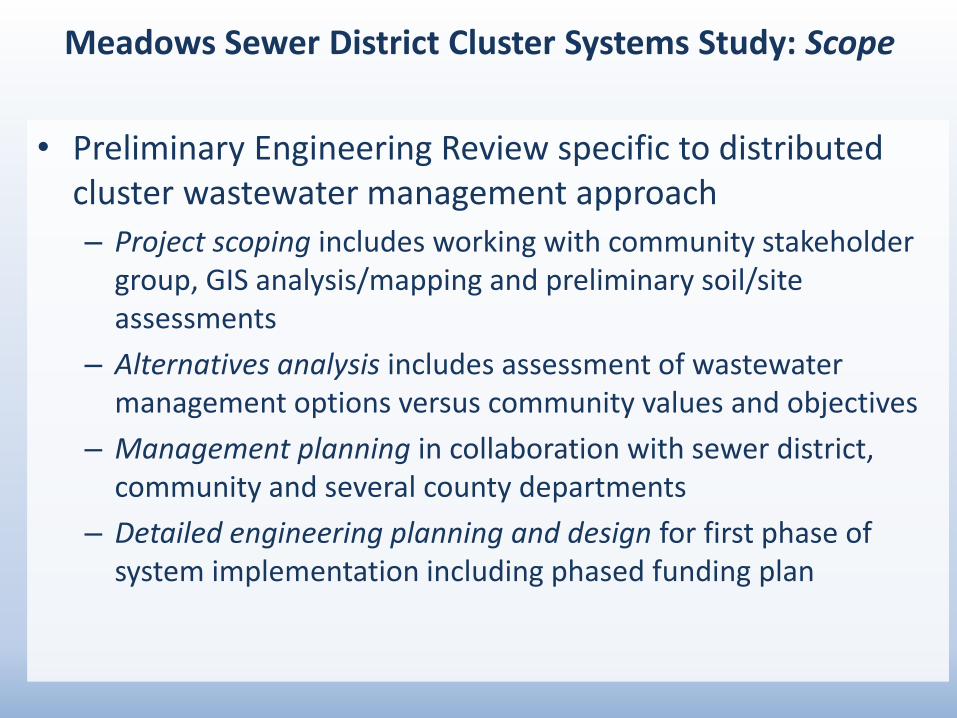
Meadows Sewer District Cluster Systems Study: Scope
• Preliminary Engineering Review specific to distributed cluster wastewater management approach
– Project scoping includes working with community stakeholder group, GIS analysis/mapping and preliminary soil/site assessments
– Alternatives analysis includes assessment of wastewater management options versus community values and objectives
– Management planning in collaboration with sewer district, community and several county departments
– Detailed engineering planning and design for first phase of system implementation including phased funding plan
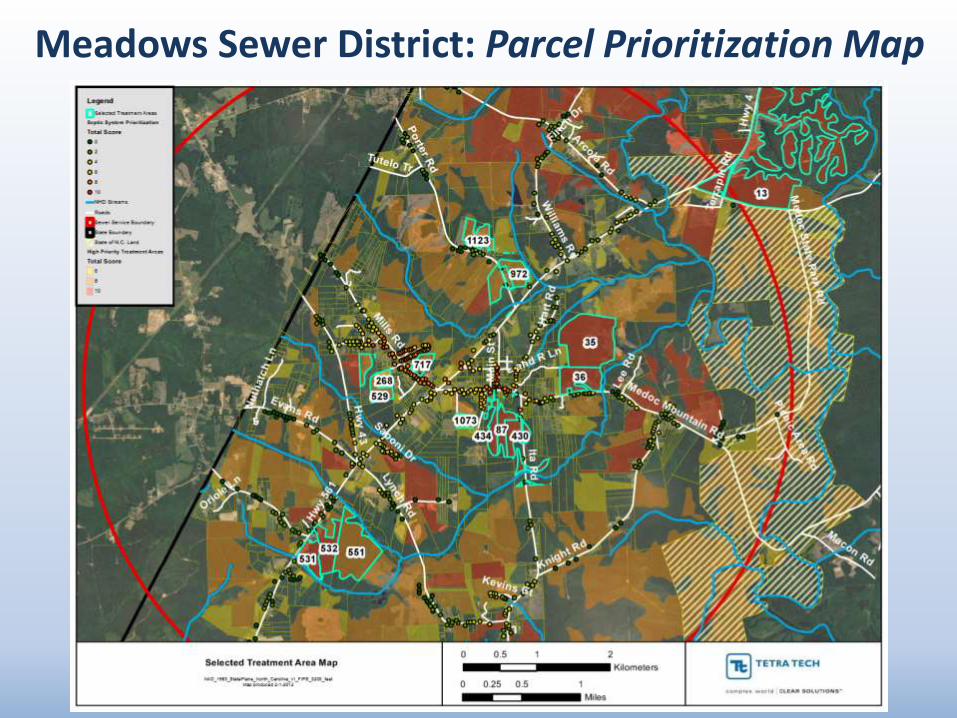
Meadows Sewer District: Parcel Prioritization Map
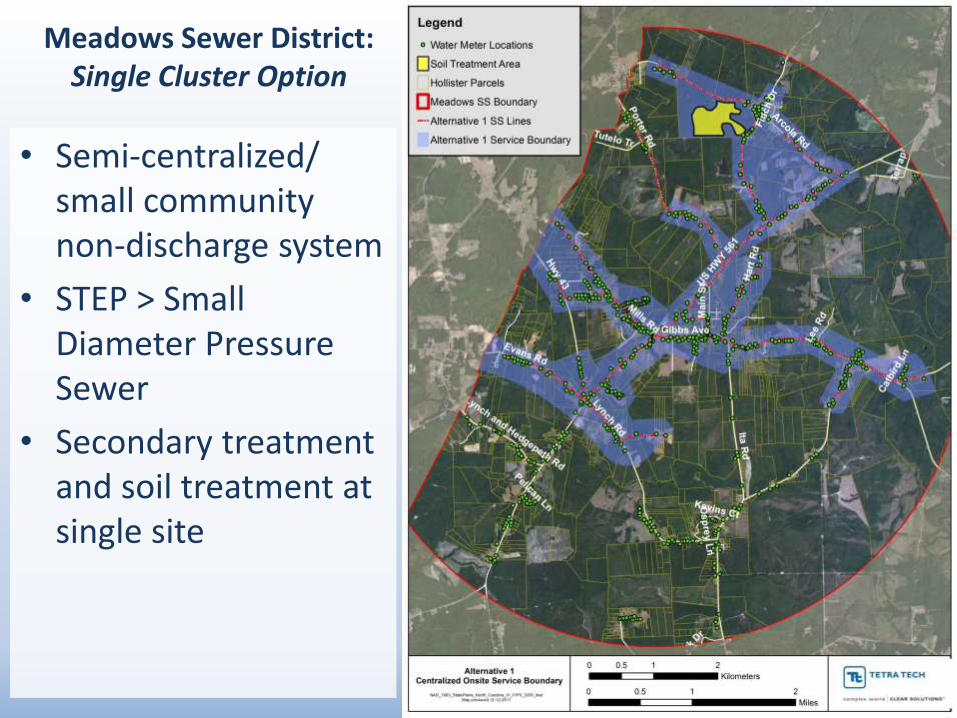
Meadows Sewer District: Single Cluster Option
• Semi-centralized/ small community non-discharge system
• STEP > Small Diameter Pressure Sewer
• Secondary treatment and soil treatment at single site
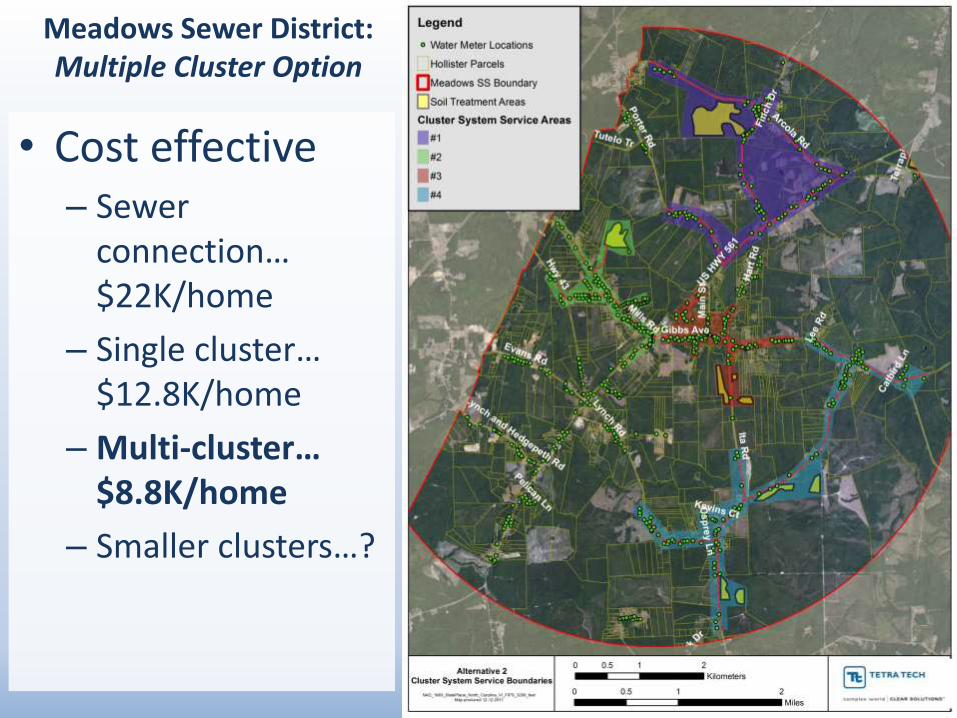
Meadows Sewer District: Multiple Cluster Option
• Cost effective– Sewer
connection… $22K/home
– Single cluster… $12.8K/home
– Multi-cluster… $8.8K/home
– Smaller clusters…?
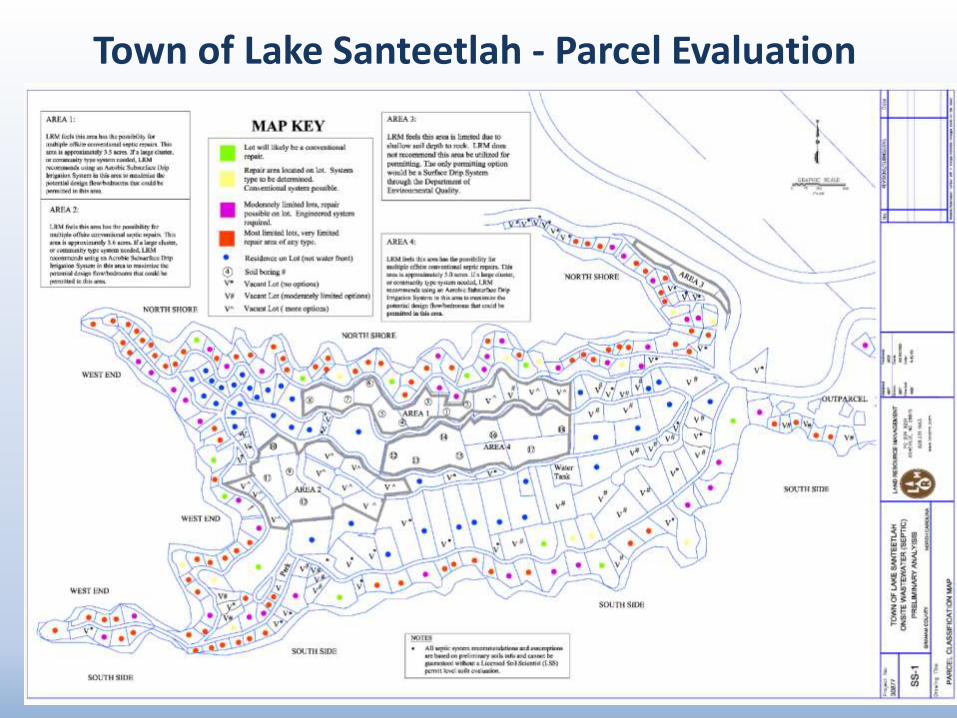
Town of Lake Santeetlah - Parcel Evaluation
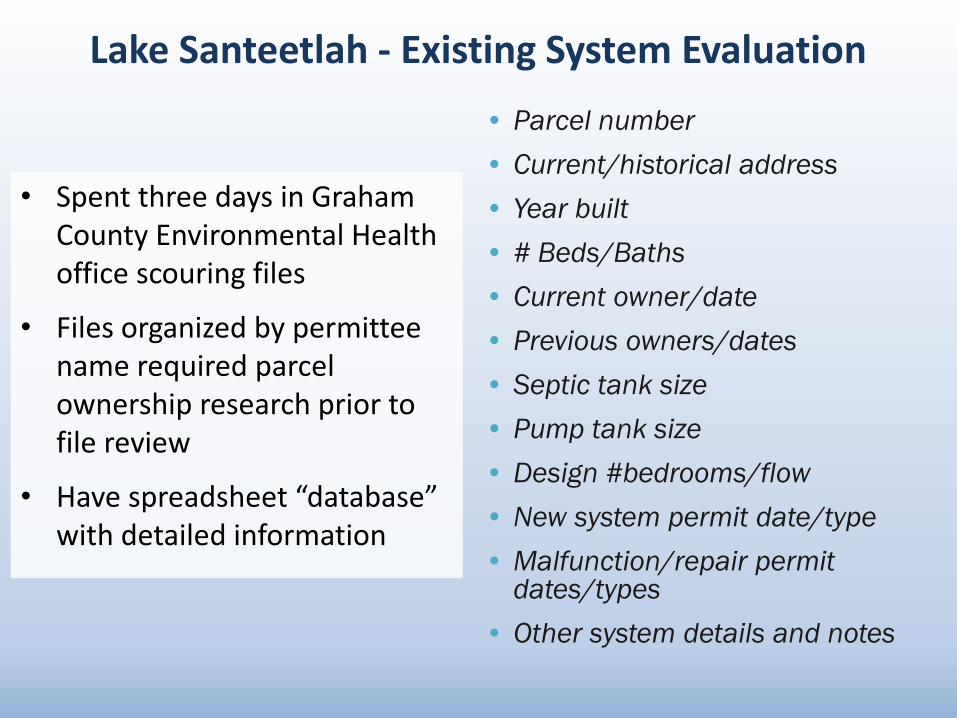
Lake Santeetlah - Existing System Evaluation
• Spent three days in Graham County Environmental Health office scouring files
• Files organized by permittee name required parcel ownership research prior to file review
• Have spreadsheet “database” with detailed information
• Parcel number
• Current/historical address
• Year built
• # Beds/Baths
• Current owner/date
• Previous owners/dates
• Septic tank size
• Pump tank size
• Design #bedrooms/flow
• New system permit date/type
• Malfunction/repair permit dates/types
• Other system details and notes

Lake Santeetlah - Potential Cluster System Plan

Conclusions and Recommendations
• Inventory-Prioritize-Management framework for addressing OWTS in Chesapeake Bay Watershed– Refine GIS analyses to identify priority areas
– Use Attenuation Panel results with distance related delivery rates
– Mine existing records and collaborate with local staff to fill data gaps
– Consider other important attributes (e.g., management capacity)
– Develop specific implementation plans for nutrient reduction noting that soil treatment can be very effective
• Build program capacity for implementation– Develop costing and decision-making tools
– Help adapt administration of SRF, other funding programs
– Pilots, demonstrations, studies
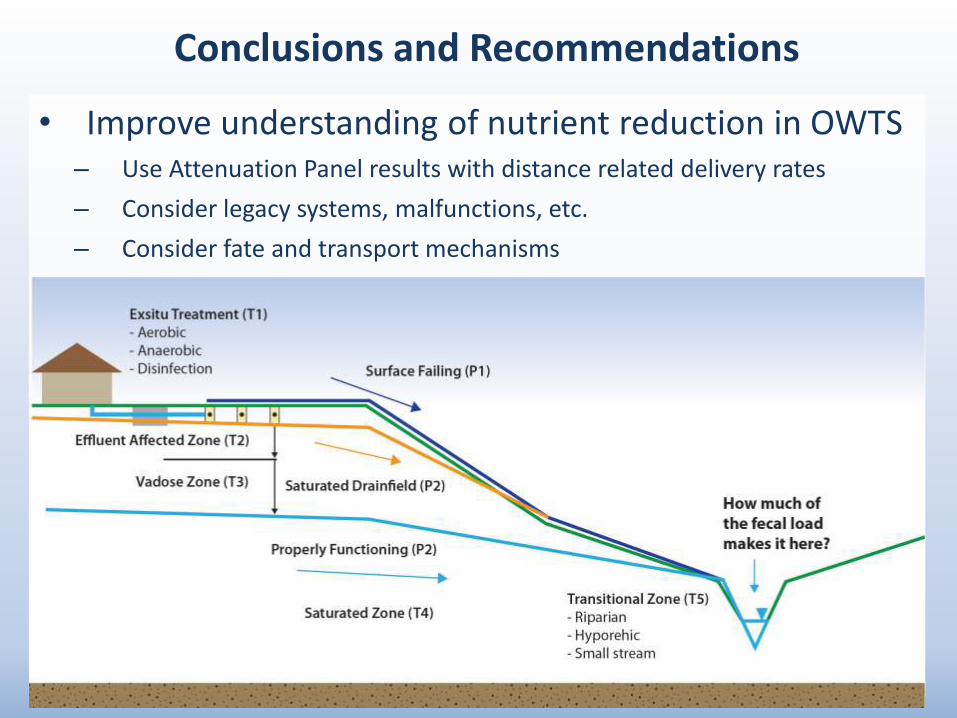
Conclusions and Recommendations
• Improve understanding of nutrient reduction in OWTS– Use Attenuation Panel results with distance related delivery rates
– Consider legacy systems, malfunctions, etc.
– Consider fate and transport mechanisms

Contact Information
Victor A. D'Amato, PETetra Tech Engineering, P.C.P.O. Box 144091 Park Drive, Suite 200Research Triangle Park, NC 27709 Direct: [email protected]