DEVELOPMENT ACTIVITY REPORT 2nd QUARTER 2020
59
Proposed New Building Lots Number of Applications 185 4 15 Major Subdivision 3 Residential Units Minor Subdivision * 14 Industrial 1,480,125 7 Public 67,623 4 Mixed Use 14,598 123 3 Office 3 11,150 DEVELOPMENT ACTIVITY REPORT 2nd QUARTER 2020 Division of Planning, Monmouth County, New Jersey April 1, 2020 to June 30, 2020 Commercial 78,815 7 Summary of Development Statistics for Projects Submitted in Q2 2020 (fig. 1) Purpose: The Development Activity Report provides a summary of county-wide development activity in Monmouth County, New Jersey for the 2nd Quarter of 2020. This report details development activity on a quarterly basis to identify current trends and to compare these to previous quarters. Highlights: ● AA 33 Industrial: 1,220,000 square foot warehouse in Millstone. Status - Conditional Approval - 5/2020 ● 500 Halls Mill Road - Warehouse: 206,642 square foot warehouse in Freehold Township. Status - Request Information - 5/2020 ● Brookstone at Casola Farms - Howell: 70,950 square foot Flex/Commercial buildings in Howell. Status - Request Information - 6/2020 ● Marlboro Development Group: 12,000 square foot, 105 unit Residential/Commercial mixed-use development in Marlboro. Status - Conditional Approval - 6/2020 ● 183 Three Brooks Holdings Warehouse Expansion: 53,387 square foot warehouse in Freehold Township. Status - Request Information - 6/2020 Use: Building Area (square feet) Dwelling Units * 96 *The dwelling units for major and minor subdivisions have been removed to further distinguish residential units proposed from siteplan applications and proposed building lots from subdivisions. (Revised 1/22/21)
Transcript of DEVELOPMENT ACTIVITY REPORT 2nd QUARTER 2020

Proposed
New
Building
Lots
Number of
Applications
1854
15
Major Subdivision 3
Residential Units
Minor Subdivision * 14
Industrial1,480,125
7
Public 67,623
4
Mixed Use14,598 123
3
Office 311,150
DEVELOPMENT ACTIVITY REPORT 2nd QUARTER 2020
Division of Planning, Monmouth County, New Jersey April 1, 2020 to June 30, 2020
Commercial78,815
7
Summary of Development Statistics for Projects Submitted in Q2 2020 (fig. 1)
Purpose: The Development Activity Report provides a summary of county-wide development activity in
Monmouth County, New Jersey for the 2nd Quarter of 2020. This report details development activity on a
quarterly basis to identify current trends and to compare these to previous quarters.
Highlights:
● AA 33 Industrial: 1,220,000 square foot warehouse in Millstone.
Status - Conditional Approval - 5/2020
● 500 Halls Mill Road - Warehouse: 206,642 square foot warehouse in Freehold Township.
Status - Request Information - 5/2020
● Brookstone at Casola Farms - Howell: 70,950 square foot Flex/Commercial buildings in Howell.
Status - Request Information - 6/2020
● Marlboro Development Group: 12,000 square foot, 105 unit Residential/Commercial mixed-use
development in Marlboro.
Status - Conditional Approval - 6/2020
● 183 Three Brooks Holdings Warehouse Expansion: 53,387 square foot warehouse in Freehold Township.
Status - Request Information - 6/2020
Use:
Building Area
(square feet) Dwelling Units
* 96
*The dwelling units for major and minor subdivisions have been removed to further distinguish residential units
proposed from siteplan applications and proposed building lots from subdivisions. (Revised 1/22/21)
(fig. 2)

(fig. 3)
(fig. 4)
Millstone, 1220096
Freehold Township, 260065
Howell, 75950
Marlboro, 33510
Colts Neck, 22557
Other Towns, 10427
Non-Residential Development by Municipality (Square Feet) Submitted Q2 2020
Holmdel, 60
Tinton Falls, 58
West Long Branch, 53
Asbury Park, 14
Residential Development by Municipality (Units) Submitted Q2 2020

WSP10050 Bakes BreweryWall
TownshipSite Plan Commercial CANR 0 . .
HZSP10055Palmer Beauty
Salon
Hazlet
TownshipSite Plan Commercial CA 200 . .
MNSP10057Taco Bell -
Manalapan
Manalapan
TownshipSite Plan Commercial CANR 2578 . .
ETSP10059
Fort
Monmouth
Bowling Center
Eatontown
BoroughSite Plan Commercial RI 5051 . .
HWSP10065
Brookstone at
Casola Farms -
Howell
Howell
TownshipSite Plan Commercial RI 70950 . .
WSP10067Guaranteed
Services
Wall
TownshipSite Plan Commercial CANR 0 . .
FRTSP10074
Proposed
Convenience
Store with
Dunkin'
Freehold
TownshipSite Plan Commercial CANR 36 . .
MSSP10058
AT & T - Crown
Tower
Millstone
Millstone
TownshipSite Plan Industrial CANR 96 . .
APSP10051AT&T - Asbury
Park Beach
Asbury Park
CitySite Plan Industrial CANR 0 . .
HWSP9085AVESI 24, LLC -
Howell Solar
Howell
TownshipSite Plan Industrial RI 0 . .
MSSP10054AA 33
Industrial
Millstone
TownshipSite Plan Industrial CA 1220000 . .
FRTSP10061
500 Halls Mill
Road -
Warehouse
Freehold
TownshipSite Plan Industrial RI 206642 . .
MRSP10062AT&T W-575 /
Wickatunk
Marlboro
TownshipSite Plan Industrial CA 0 . .
FRTSP10068
183 Three
Brooks
Holdings
Warehouse
Expansion
Freehold
TownshipSite Plan Industrial RI 53387 . .
TFSP9206ACommVault -
Fire House
Tinton Falls
BoroughSite Plan Office CANR 0 . .
LotsStatusFile # Project Name Municipality Type CategorySquare
Feet
Development Statistics for Projects Submitted in Q2 2020 (fig. 5)
Units
MRSP10070
Touchstone
Veterinary
Center
Marlboro
TownshipSite Plan Office CANR 6150 . .
HWSP8374AFive Points
Business Park
Howell
TownshipSite Plan Office CANR 5000 . .
MQSP10056Fun Girl
Properties
Manasquan
BoroughSite Plan Mixed Use CANR 1018 . 3
MRSP10064
Marlboro
Development
Group
Marlboro
TownshipSite Plan Mixed Use CA 12000 . 105
AHSP10071 65 First Avenue
Atlantic
Highlands
Borough
Site Plan Mixed Use CA 1580 . 15
MRSP10053The Church in
Marlboro
Marlboro
TownshipSite Plan Public INC 15360 . .
CNSP10060
Colts Neck
Community
Church
Colts Neck
TownshipSite Plan Public CA 22557 . .
HZSP10066Faith Reformed
Church
Hazlet
TownshipSite Plan Public RI 0 . .
MDSP10072
Middletown
Municipal
Building
Middletown
TownshipSite Plan Public FA 29706 . .
TFSP10052
All American
Assisted Living
at Tinton Falls
Tinton Falls
BoroughSite Plan Residential FA . . 58
WLBSP10063310 Norwood
Avenue
West Long
Branch
Borough
Site Plan Residential RI . . 53
HLSP10069
Barclay Square
at Holmdel,
LLC
Holmdel
TownshipSite Plan Residential INC . . 60
APSP10073
202-204
Seventh
Avenue
Asbury Park
CitySite Plan Residential CANR . . 14
LB588
57 West End
Avenue Minor
Subdivision
Long Branch
CityMinor Subdivision Exempt . 1 .
H307Careri Minor
Subdivision
Highlands
BoroughMinor Subdivision Exempt . 1 .
MD1474
Lesko
Management
Minor
Subdivision
Middletown
TownshipMinor Subdivision Exempt . 1 .

HW1420Maxim Road
Subdivision
Howell
TownshipMinor Subdivision Exempt . 0 .
FR320Kiely Minor
Subdivision
Freehold
BoroughMinor Subdivision Exempt . 3 .
LB589
140 Park Ave
Minor
Subdivision
Long Branch
CityMinor Subdivision Exempt . 2 .
FRT651
Applegate
Minor
Subdivision
Freehold
TownshipMinor Subdivision Exempt . 0 .
KP296
Straub Motors
Minor
Subdivision
Keyport
BoroughMinor Subdivision Exempt . 1 .
CN463Kling Minor
Subdivision
Colts Neck
TownshipMinor Subdivision Exempt . 0 .
MD1475
Municipal
Building Minor
Subdivision
Middletown
TownshipMinor Subdivision Exempt . 0 .
W1415
1716 Leslie
Street Minor
Subdivision
Wall
TownshipMinor Subdivision Exempt . 1 .
HW1421
Prince of Peace
Minor
Subdivision
Howell
TownshipMinor Subdivision Exempt . 2 .
AP388
910 Cookman
Avenue Minor
Subdivision
Asbury Park
CityMinor Subdivision Exempt . 1 .
HL426
Warrior Minor
SubdivisionHolmdel
Township
Minor
ROWSubdivision RI . 1 .
RM457
Rumson
Borough
Trent/
Timpone
Minor
Subdivision
Minor
ROWSubdivision CFA . 0 .
MRMJ784
Marlboro
Development
Group
Subdivision - 1
Marlboro
TownshipMajor Subdivision PA . 4 .
MRMJ784A
Marlboro
Development
Group
Subdivision - 2
Marlboro
TownshipMajor Subdivision CPA . 88 .

APMJ785
503 8th
Avenue
Subdivision
Asbury Park
CityMajor Subdivision PA . 4 .
FA
CFA
CA
CPA
PA
RI
CANR
INC
ROW
Conditional Final Approval
Right-of-Way
County Approval Not Required
Request Information
Preliminary Approval
Conditional Preliminary Approval
Conditional Approval
Final Approval
Incomplete Application
*The dwelling units for major and minor subdivisions have been removed to further distinguish residential units
proposed from siteplan applications and proposed building lots from subdivisions. (Revised 1/22/21)

(fig. 6)
(fig. 7)
105168
372375
120780 114186
78815
Q2 Reports 2016-2020
Square Feet of Proposed Commercial Development
2016 Q2 2017 Q2 2018 Q2 2019 Q2 2020 Q2
(fig. 8)
Year
& Quarter
New
Applications
received in the
quarter
Applications
acted on in
the quarter
2016 Q1 19 22 5
2016 Q2 18 12 3
2016 Q3 14 13 4
2016 Q4 23 20 6
2017 Q1 22 27 7
2017 Q2 13 13 4
2017 Q3 17 11 5
2017 Q4 8 7 5
2018 Q1 24 13 3
2018 Q2 19 20 11
2018 Q3 17 13 7
2018 Q4 14 12 10
2019 Q1 12 9 3
2019 Q2 12 12 5
2019 Q3 20 16 2
2019 Q4 11 23 6
2020 Q1 15 22 122020 Q2 7 14 7
(fig. 9)
Commercial Development Applications 2016-2020
Applications granted
final approval in the
quarter
105168 (2016)
372375 (2017)
120780 (2018) 114186 (2019)78815 (2020)
741874 (2016)
878739 (2017)
418696 (2018)
522225 (2019)
149331 (2020)
Square Feet of Proposed Commercial Development
2016-2020 Q2 2016-2020 Year Total

(fig. 10)
0
10
20
30
40
50
60
20
16
Q1
20
16
Q2
20
16
Q3
20
16
Q4
20
17
Q1
20
17
Q2
20
17
Q3
20
17
Q4
20
18
Q1
20
18
Q2
20
18
Q3
20
18
Q4
20
19
Q1
20
19
Q2
20
19
Q3
20
19
Q4
20
20
Q1
20
20
Q2
Applications granted final approvalin the quarter
Applications acted on in the quarter
New Applications received in thequarter

(fig. 11)
(fig. 12)
145216
16920122778
273317
1480125
Q2 Reports 2016-2020
Square Feet of Proposed Industrial Development
2016 Q2 2017 Q2 2018 Q2 2019 Q2 2020 Q2

(fig. 13)
(fig. 14)
Year
& Quarter
New
Applications
received in the
quarter
Applications
acted on in
the quarter
2016 Q1 6 5 4
2016 Q2 4 5 4
2016 Q3 10 8 1
2016 Q4 9 7 2
2017 Q1 8 7 2
2017 Q2 3 4 2
2017 Q3 6 3 3
2017 Q4 11 7 4
2018 Q1 4 12 7
2018 Q2 7 8 4
2018 Q3 4 4 6
2018 Q4 5 3 1
2019 Q1 8 7 9
2019 Q2 5 3 2
2019 Q3 7 4 4
2019 Q4 7 7 1
2020 Q1 9 14 32020 Q2 7 13 3
Industrial Development Applications 2016-2020
All Applications
granted final
approval in the
quarter
145216 (2016)16920 (2017) 122778 (2018)
273317 (2019)
1480125 (2020)
572346 (2016)
1447068 (2017)
564065 (2018)
2929619 (2019)
2560855 (2020)
Square Feet of Proposed Industrial Development
2016-2020 Q2 2016-2020 Year Total

(fig. 15)
0
5
10
15
20
25
302
01
6 Q
1
20
16
Q2
20
16
Q3
20
16
Q4
20
17
Q1
20
17
Q2
20
17
Q3
20
17
Q4
20
18
Q1
20
18
Q2
20
18
Q3
20
18
Q4
20
19
Q1
20
19
Q2
20
19
Q3
20
19
Q4
20
20
Q1
20
20
Q2
All Applications granted finalapproval in the quarter
Applications acted on in thequarter
New Applications received in thequarter

(fig. 16)
(fig. 17)
5402
30773 31647
4187
11150
Q2 Reports 2016-2020
Square Feet of Proposed Office Development
2016 Q2 2017 Q2 2018 Q2 2019 Q2 2020 Q2

(fig. 18)
(fig. 19)
Year
& Quarter
New
Applications
received in the
quarter
Applications
acted on in
the quarter
2016 Q1 7 5 4
2016 Q2 3 4 2
2016 Q3 1 3 3
2016 Q4 2 2 1
2017 Q1 3 5 3
2017 Q2 3 5 1
2017 Q3 8 5 2
2017 Q4 10 4 3
2018 Q1 4 5 3
2018 Q2 3 2 0
2018 Q3 9 6 6
2018 Q4 2 3 1
2019 Q1 2 4 2
2019 Q2 3 1 1
2019 Q3 3 2 3
2019 Q4 3 2 2
2020 Q1 4 6 02020 Q2 3 1 1
Office Development Applications 2016-2020
All Applications
given final approval
in the quarter
5402 (2016)
30773 (2017) 31647 (2018)
4187 (2019)11150 (2020)
34722 (2016)
95086 (2017)
118896 (2018)
38260 (2019)
51595 (2020)
Square Feet of Proposed Office Development
2016-2020 Q2 2016-2020 Year Total

(fig. 20)
0
5
10
15
20
25
20
16
Q1
20
16
Q2
20
16
Q3
20
16
Q4
20
17
Q1
20
17
Q2
20
17
Q3
20
17
Q4
20
18
Q1
20
18
Q2
20
18
Q3
20
18
Q4
20
19
Q1
20
19
Q2
20
19
Q3
20
19
Q4
20
20
Q1
20
20
Q2
All Applications given final approvalin the quarter
Applications acted on in the quarter
New Applications received in thequarter

(fig. 21)
(fig. 22)
5807
201255
17194 12451 14598
Q2 Reports 2016-2020
Square Feet of Proposed Mixed Use Development
2016 Q2 2017 Q2 2018 Q2 2019 Q2 2020 Q2

(fig. 23)
(fig. 24)
Year
& Quarter
New
Applications
received in the
quarter
Applications
acted on in
the quarter
2016 Q1 2 5 1
2016 Q2 3 2 2
2016 Q3 4 3 1
2016 Q4 6 3 0
2017 Q1 2 3 0
2017 Q2 4 4 0
2017 Q3 2 4 3
2017 Q4 4 4 1
2018 Q1 3 5 0
2018 Q2 3 5 2
2018 Q3 4 8 0
2018 Q4 1 3 1
2019 Q1 3 3 1
2019 Q2 4 3 3
2019 Q3 5 3 2
2019 Q4 2 3 1
2020 Q1 4 5 12020 Q2 3 4 0
All Applications
given final approval
in the quarter
Mixed Use Development Applications 2016-2020
5807 (2016)
201255 (2017)
17194 (2018) 12451 (2019) 14598 (2020)
85036 (2016)
362734 (2017)
248020 (2018)
98860 (2019)
137342 (2020)
Square Feet of Proposed Mixed Use Development
2016-2020 Q2 2016-2020 Year Total

(fig. 25)
0
2
4
6
8
10
12
14
20
16
Q1
20
16
Q2
20
16
Q3
20
16
Q4
20
17
Q1
20
17
Q2
20
17
Q3
20
17
Q4
20
18
Q1
20
18
Q2
20
18
Q3
20
18
Q4
20
19
Q1
20
19
Q2
20
19
Q3
20
19
Q4
20
20
Q1
20
20
Q2
All Applications given finalapproval in the quarter
Applications acted on in thequarter
New Applications received in thequarter

(fig. 26)
(fig. 27)
68138
55509
3201 2407
67623
Q2 Reports 2016-2020
Square Feet of Proposed Public Development
2016 Q2 2017 Q2 2018 Q2 2019 Q2 2020 Q2

(fig. 28)
Year
& Quarter
New
Applications
received in the
quarter
Applications
acted on in
the quarter
2016 Q1 6 1 0
2016 Q2 4 4 2
2016 Q3 3 2 2
2016 Q4 1 1 1
2017 Q1 1 1 0
2017 Q2 9 7 1
2017 Q3 1 4 2
2017 Q4 4 4 2
2018 Q1 1 3 1
2018 Q2 5 6 4
2018 Q3 2 1 0
2018 Q4 2 1 2
2019 Q1 8 5 1
2019 Q2 5 3 1
2019 Q3 0 1 1
2019 Q4 3 3 2
2020 Q1 6 5 32020 Q2 4 7 1
(fig. 29)
All Applications
given final approval
in the quarter
Public Development Applications 2016-2020
68138 (2016)55509 (2017)
3201 (2018) 2407 (2019)
67623 (2020)
114078 (2016)
198203 (2017)
23910 (2018)
97528 (2019) 94923 (2020)
Square Feet of Proposed Public Development
2016-2020 Q2 2016-2020 Year Total

(fig. 30)
0%
10%
20%
30%
40%
50%
60%
70%
80%
90%
100%
20
16
Q1
20
16
Q2
20
16
Q3
20
16
Q4
20
17
Q1
20
17
Q2
20
17
Q3
20
17
Q4
20
18
Q1
20
18
Q2
20
18
Q3
20
18
Q4
20
19
Q1
20
19
Q2
20
19
Q3
20
19
Q4
20
20
Q1
20
20
Q2
All Applications given final approvalin the quarter
Applications acted on in the quarter
New Applications received in thequarter

(fig. 31)
(fig. 32)
342 337
92
293
185
Q2 Reports 2016-2020
Number of Proposed Residential Units
2016 Q2 2017 Q2 2018 Q2 2019 Q2 2020 Q2

(fig. 33)
(fig. 34)
Year
& Quarter
New
Applications
received in the
quarter
Applications
acted on in
the quarter
2016 Q1 4 8 1
2016 Q2 5 8 2
2016 Q3 3 6 4
2016 Q4 2 6 2
2017 Q1 4 8 3
2017 Q2 5 7 1
2017 Q3 1 5 5
2017 Q4 5 3 5
2018 Q1 6 7 4
2018 Q2 3 4 3
2018 Q3 2 4 2
2018 Q4 2 5 3
2019 Q1 3 3 7
2019 Q2 4 4 1
2019 Q3 1 1 1
2019 Q4 7 3 1
2020 Q1 4 5 12020 Q2 4 2 3
Residential Development Applications 2016-2020
All Applications
given final approval
in the quarter
342 (2016) 337 (2017)
92 (2018)
293 (2019)
185 (2020)
799 (2016)
581 (2017)
310 (2018)
1065 (2019)
241 (2020)
Number of Proposed Residential Units
2016-2020 Q2 2016-2020 Year Total

(fig. 35)
0
2
4
6
8
10
12
14
16
18
20
16
Q1
20
16
Q2
20
16
Q3
20
16
Q4
20
17
Q1
20
17
Q2
20
17
Q3
20
17
Q4
20
18
Q1
20
18
Q2
20
18
Q3
20
18
Q4
20
19
Q1
20
19
Q2
20
19
Q3
20
19
Q4
20
20
Q1
20
20
Q2
All Applications given final approvalin the quarter
Applications acted on in the quarter
New Applications received in thequarter

(fig. 36)
(fig. 37)
13 1312
17
14
Q2 Reports 2016-2020
Number of Proposed Minor Subdivision Lots
2016 Q2 2017 Q2 2018 Q2 2019 Q2 2020 Q2

(fig. 38)
Year
& Quarter
New
Applications
received in the
quarter
Applications
acted on in
the quarter
2016 Q1 9 4 3
2016 Q2 21 5 3
2016 Q3 21 8 1
2016 Q4 20 8 2
2017 Q1 21 13 6
2017 Q2 16 6 3
2017 Q3 12 3 4
2017 Q4 17 6 1
2018 Q1 28 4 4
2018 Q2 12 5 0
2018 Q3 11 7 3
2018 Q4 13 3 3
2019 Q1 10 2 2
2019 Q2 21 12 6
2019 Q3 20 7 3
2019 Q4 9 3 4
2020 Q1 10 4 32020 Q2 15 4 2
(fig. 39)
Minor Subdivision Approvals 2016-2020
All Applications
given final approval
in the quarter
17 (2016)13 (2017) 12 (2018)
17 (2019)14 (2020)
45 (2016)
54 (2017) 55 (2018)51 (2019)
23 (2020)
Number of Proposed Minor Subdivision Lots
2016-2020 Q2 2016-2020 Year Total

(fig. 40)
0
5
10
15
20
25
30
35
40
45
20
16
Q1
20
16
Q2
20
16
Q3
20
16
Q4
20
17
Q1
20
17
Q2
20
17
Q3
20
17
Q4
20
18
Q1
20
18
Q2
20
18
Q3
20
18
Q4
20
19
Q1
20
19
Q2
20
19
Q3
20
19
Q4
20
20
Q1
20
20
Q2
All Applications given final approvalin the quarter
Applications acted on in the quarter
New Applications received in thequarter

(fig. 41)
(fig. 42)
109
306
5334
96
Q2 Reports 2016-2020
Number of Proposed Major Subdivision Lots
2016 Q2 2017 Q2 2018 Q2 2019 Q2 2020 Q2
(fig. 43)
(fig. 44)
Year
& Quarter
New
Applications
received in the
quarter
Applications
acted on in
the quarter
2016 Q1 8 11 4
2016 Q2 3 8 6
2016 Q3 2 9 3
2016 Q4 3 11 6
2017 Q1 2 8 4
2017 Q2 5 8 3
2017 Q3 4 7 5
2017 Q4 4 9 2
2018 Q1 5 7 3
2018 Q2 6 10 3
2018 Q3 6 11 3
2018 Q4 0 4 5
2019 Q1 4 6 7
2019 Q2 7 9 1
2019 Q3 3 5 3
2019 Q4 4 5 4
2020 Q1 6 11 32020 Q2 3 5 4
All Applications
given final approval
in the quarter
Major Subdivision Approvals 2016-2020
109 (2016)
306 (2017)
53 (2018) 34 (2019)
96 (2020)
228 (2016)
688 (2017)
199 (2018)
322 (2019)
102 (2020)
Number of Proposed Major Subdivision Lots
2016-2020 Q2 2016-2020 Year Total

(fig. 45)
0
2
4
6
8
10
12
14
16
18
20
20
16
Q1
20
16
Q2
20
16
Q3
20
16
Q4
20
17
Q1
20
17
Q2
20
17
Q3
20
17
Q4
20
18
Q1
20
18
Q2
20
18
Q3
20
18
Q4
20
19
Q1
20
19
Q2
20
19
Q3
20
19
Q4
20
20
Q1
20
20
Q2
Major Subdivision Approvals 2016-2020 New Applications received inthe quarter
Major Subdivision Approvals 2016-2020 Applications acted on in thequarter
Summary
The County saw a decrease in non-residential development applications and residential
applications this quarter when compared to last year's second quarter. Similarly, there was a drop in non-
residential application when compared to the first quarter of 2020. Commercial development this quarter
occurred on or near major roads and tended to be in towns to the west and south-east. This is similar to where
commercial developments were found last quarter which suggests that there is potential for future commercial
development in those towns. The location of industrial development this quarter is compareable to lastr
quarter. Developments of this type were found primarily along State Highway 33. Office development this
quarter occurred in Marlboro, Tinton Falls, and Howell with no discernable pattern from last quarter. Of the
three mixed-use applications received two were in municipalities along the shore. All three were located in or
near a municipality where commercial development occurred last quarter. Public development primarily
occurred north of State Highway 18. Public development projects this quarter tended to be in towns to the
north and north-west. Residential development this quarter was primarily located in eastern municipalities with
one project to the north in Holmdel. Roughly half of the minor subdivision applications received were in
municipalities near the shore while the other half were in more inland municipalities. Minor subdivisions in
municipalities near the shore were generally located away from the shore in their respective municipalities. The
major subdivisions proposed this quarter were mostly located in Marlboro and are related to a mixed use
development proposed there.
In the second quarter of 2020, the county has received 15 minor subdivision applications and 3
office, mixed use, and major subdivision development applications. Minor subdivision applications were the
most common application type, while office, mixed use, and major subdivision development applications were
the least common. Industrial development applications had the largest total proposed building area at
1,480,125 square feet. Office development applications had the least total proposed building area at 11,150
square feet. Office development decreased in square footage and industrial development increased in square
footage.
Total proposed building area of commercial developments rose in 2017 and has been on the
decline since 2018. This quarter saw a drop in both the amount of building area proposed and number of
applications received. The total amount of building area proposed for industrial development has increased
again and the number of applications has also increased this quarter. Industrial development continues to have
the largest proposed building area of all development types implying a boon in warehouse development. The
county has received 3 projects for office development in the second quarter for the last four years with this
quarter continuing that pattern. The amount of mixed/multiple use development projects received have
alternated between 3 and 4 in the past four years. This year's second quarter breaks a decline in the amount of
proposed building area for public projects with a high of 67,623 square feet. The proposed units for residential
development applications has dropped to 185 proposed units this quarter from 293 units at this time in 2019.
There has been a decrease in both the amount of lots proposed and number of minor subdivision applications
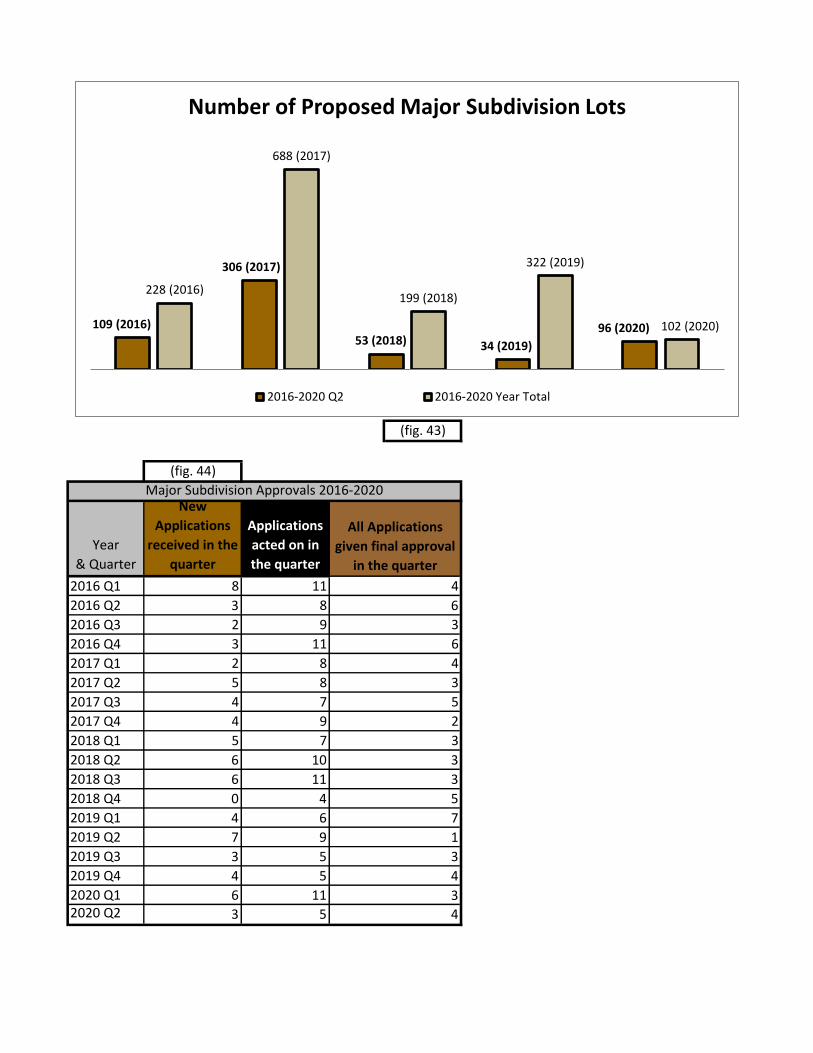
received this quarter. Finally, major subdivisions this quarter have increased in the number of lots proposed
compared to the last 2 years, but decreased in the number of applications.
Approval Status Stats for projects received in Q2 2020:
● Final Approval: 2
● Conditional Final Approval: 1
● Conditional Approval: 5
● Preliminary Approval: 2
● Conditional Preliminary Approval: 1
● Request Information: 9
● County Approval Not Required (CANR): 11
● Exempt: 13
● Incomplete: 2

Summary
The County saw a decrease in non-residential development applications and residential
applications this quarter when compared to last year's second quarter. Similarly, there was a drop in non-
residential application when compared to the first quarter of 2020. Commercial development this quarter
occurred on or near major roads and tended to be in towns to the west and south-east. This is similar to where
commercial developments were found last quarter which suggests that there is potential for future commercial
development in those towns. The location of industrial development this quarter is compareable to lastr
quarter. Developments of this type were found primarily along State Highway 33. Office development this
quarter occurred in Marlboro, Tinton Falls, and Howell with no discernable pattern from last quarter. Of the
three mixed-use applications received two were in municipalities along the shore. All three were located in or
near a municipality where commercial development occurred last quarter. Public development primarily
occurred north of State Highway 18. Public development projects this quarter tended to be in towns to the
north and north-west. Residential development this quarter was primarily located in eastern municipalities with
one project to the north in Holmdel. Roughly half of the minor subdivision applications received were in
municipalities near the shore while the other half were in more inland municipalities. Minor subdivisions in
municipalities near the shore were generally located away from the shore in their respective municipalities. The
major subdivisions proposed this quarter were mostly located in Marlboro and are related to a mixed use
development proposed there.
In the second quarter of 2020, the county has received 15 minor subdivision applications and 3
office, mixed use, and major subdivision development applications. Minor subdivision applications were the
most common application type, while office, mixed use, and major subdivision development applications were
the least common. Industrial development applications had the largest total proposed building area at
1,480,125 square feet. Office development applications had the least total proposed building area at 11,150
square feet. Office development decreased in square footage and industrial development increased in square
footage.
Total proposed building area of commercial developments rose in 2017 and has been on the
decline since 2018. This quarter saw a drop in both the amount of building area proposed and number of
applications received. The total amount of building area proposed for industrial development has increased
again and the number of applications has also increased this quarter. Industrial development continues to have
the largest proposed building area of all development types implying a boon in warehouse development. The
county has received 3 projects for office development in the second quarter for the last four years with this
quarter continuing that pattern. The amount of mixed/multiple use development projects received have
alternated between 3 and 4 in the past four years. This year's second quarter breaks a decline in the amount of
proposed building area for public projects with a high of 67,623 square feet. The proposed units for residential
development applications has dropped to 185 proposed units this quarter from 293 units at this time in 2019.
There has been a decrease in both the amount of lots proposed and number of minor subdivision applications
received this quarter. Finally, major subdivisions this quarter have increased in the number of lots proposed
compared to the last 2 years, but decreased in the number of applications.
Approval Status Stats for projects received in Q2 2020:
● Final Approval: 2
● Conditional Final Approval: 1
● Conditional Approval: 5
● Preliminary Approval: 2
● Conditional Preliminary Approval: 1
● Request Information: 9
● County Approval Not Required (CANR): 11
● Exempt: 13
● Incomplete: 2