Developing Resource use Scenarios for Europe economic Sciences and Humanities Europe . ......
72
Developing Resource use Scenarios for Europe Working Paper no 25 Authors: Marina Fischer-Kowalski (UNI-KLU), Dominik Wiedenhofer (UNI-KLU), Willi Haas (UNI-KLU), Irene Pallua (UNI-KLU), Daniel Hausknost (UNI-KLU) July 2013
Transcript of Developing Resource use Scenarios for Europe economic Sciences and Humanities Europe . ......
Developing Resource use Scenarios for Europe
Working Paper no 25
Authors: Marina Fischer-Kowalski (UNI-KLU), Dominik Wiedenhofer (UNI-KLU), Willi Haas (UNI-KLU),
Irene Pallua (UNI-KLU), Daniel Hausknost (UNI-KLU)
July 2013

THEME SSH.2011.1.2-1
Socio-economic Sciences and Humanities Europe moving towards a new path of economic growth and social development - Collaborative project
Developing Resource use Scenarios for Europe
Work Package 204 MS35 "Research paper on resource use scenarios for Europe"
Working Paper no 25
This paper can be downloaded from
Please respect that this report was produced by the named authors within the WWWforEurope project and has to be cited accordingly
www.foreurope.eu
Authors: Marina Fischer-Kowalski (UNI-KLU), Dominik Wiedenhofer (UNI-KLU), Willi Haas (UNI-KLU), Irene Pallua (UNI-KLU), Daniel Hausknost (UNI-KLU)
Reviewed by: Miklós Antal (UAB), Julia Steinberger (University of Leeds)

Developing Resource use Scenarios for Europe
Marina Fischer-Kowalski (UNI-KLU), Dominik Wiedenhofer (UNI-KLU), Willi Haas (UNI-KLU), Irene Pallua (UNI-KLU), Daniel Hausknost (UNI-KLU)
Contribution to the Project
Work package 204 will generate biophysical scenarios for resource constraints to the supply side of economic activity in Europe. Scenarios will be both oriented at natural constraints (resource scarcity) and at politically targeted constraints (European climate policies, resource use reduction goals, UNEP global contraction and convergence scenarios) and thus establish material boundaries to serve as input to the macroeconomic models developed in work package 205 and to constitute the biophysical frame for the analyses of other work packages. A particular challenge for this work package is the strong empirical interlinkage between the use of various resources (energy-materials, biomass use - land use - water use, energy - metals etc.). It does not make sense to formulate constraints independently from one another. These interlinkages may then in turn be a challenge for the economic models. There will be an internal workshop to clarify the needs and potentials of the respective economic models in terms of the specification of constraints.
Keywords: Biophysical constraints, CGE models, economic growth path, economic strategy, industrial innovation, industrial policy, innovation policy, socio-ecological transition
Jel codes: Q3, Q4, Q5

Executive Summary 1
Introduction 3
1. How to introduce biophysical constraints into
macroeconomic models 5
1.1 Diagnosis and advice from the SERICE scoping study (2010) 5
1.2 Adopting OECD‟s impact model for resource use 7
1.3 Preliminary conclusions from Chapter 1 18
2. Non-linearities in historical and contemporary
resource use 20
2.1 Incremental change versus transition / transformation 20
2.2 Socio-ecological transitions as transitions between sociometabolic regimes (the
Vienna social ecological approach) 23
2.3 Historical socio-ecological transitions as experienced in the UK, Austria, the
USA and Japan 26
2.4 Ongoing transitions from the agrarian to the industrial regime: the “insurrection
of the South” (UNDP) 30
2.5 Preliminary conclusions from global non-linear development dynamics for future
European biophysical constraints 36
3. Towards resource use scenarios for Europe 39
3.1 UNEP‟s global resource use scenarios 39
3.2 Resource use scenarios for Europe 41
3.2.1 Income and resource use patterns in Europe over the last decades 42
3.2.2 Constructing European Resource Use Scenarios 45
3.3 Discussion of scenario results 47
4. Concluding remarks 57
References 58
Project Information 65
Partners 66

Tables and Figures
Table 1 Alternative futures by 2025 concerning the global megatrend
“resource security” 13
Table 2 Alternative futures by 2025 concerning the global megatrend
“resource security”. 14
Table 3 Alternative futures by 2025 concerning the global megatrends “climate
change” and “population dynamics” 15
Table 4 Alternative futures by 2025 concerning the global megatrends “shifting
centres of political and economic gravity” and “ICT use and knowledge
sharing” 16
Table 5 Typical metabolic profiles of agrarian and industrial sociometabolic
regimes 25
Table 6 Metabolic profiles of the country groups and selected cases (2005) 33
Table 7 Cross-classification of EU27 by income level and population density
associated with different metabolic growth patterns 44
Table 8 Resource use reduction targets for EU 27 55
Figure 1 Conceptualizing general pathways how potential biophysical
constraints may affect economies 8
Figure 2 Global megatrends impacting upon Europe‟s future by 2050 11
Figure 3 Demographic transition 20
Figure 4 Environmental risk transition 21
Figure 5 Phases of a transition 22
Figure 6 UK‟s historical transition from an agrarian to an industrial regime: a
transition from biomass to fossil fuels as percentage of domestic
energy consumption (DEC) 24
Figure 7 The energy transition in the UK, from 1830 – 2000 26
Figure 8 Domestic energy consumption in Austria, from 1830 - 2000 27
Figure 9 Domestic energy consumption in the USA, from 1870 – 2005 27
Figure 10 Domestic material consumption in the USA, from 1870 - 2005 28
Figure 11 Domestic energy consumption in Japan, from 1878 - 2006 28
Figure 12 Domestic material consumption in Japan, from 1878 – 2005 28
Figure 13 Overview: The sociometabolic transition in the UK, USA, Austria and
Japan, from 1750 – 2000, in relation to changes in GDP 29
Figure 14 Phases of global per capita materials and energy use during the 20th
century. 30
Figure 15 Domestic material consumption in China, from 1970-2005 34
Figure 16 Total primary energy supply of China, 1970 - 2005 34
Figure 17 Domestic Energy Consumption in India, from 1961 - 2008 35
Figure 18 The sociometabolic transition in India, from 1961 – 2008 35
Figure 19 Domestic energy consumption in Brazil, from 1970-2005 36
Figure 20 Domestic material consumption in Brazil, from 1970-2005 36
Figure 21 Global commodity prices in constant prices, year 2000 $ 37
Figure 22 Resource use according to three different scenarios as developed and
calculated by UNEP‟s international resource panel up to 2050 40
Figure 23 Resource use and income in Europe, 2000, 2005, 2009 (DMC/cap,
GDP/cap) 43
Figure 24 DMC per capita for EU15 and new member states by density class 44
Figure 25 Material consumption of EU 27 according to four resource use
scenarios 47
Figure 26 Material resource productivity (GDP/DMC) for EU15 and the new
member states 48
Figure 27 EU 15 domestic material extraction and extra EU trade (Imports,
Exports). Index: 1970 = 100, from 1970 to 2004 49
Figure 28 EU15 domestic material extraction plus physical trade balance (=
domestic material consumption), from 1970 to 2004; left side in
absolute numbers, right side in per capita values 50
Figure 29 EU27 material imports and exports, from 2000 to 2009 50
Figure 30 Domestic material extraction plus physical trade balance of France,
Germany and UK (= domestic material consumption), from 1970 to
2004 51
Figure 31 The composition of EU27 material consumption in 2005 and a
projection for 2050 (see assumptions in the text) 53
Figure 32 The use of construction minerals in EU15 and the new member states 54
1
Executive Summary
Chapter 1 of this report reviews a number of approaches to conceptualize and operationalize biophysical constraints for economic performance. The starting point is a scoping study by Cambridge Econometrics and Sustainable Europe Research Institute (SERI) that reviews a large number of macroeconomic models investigating their ability to provide information on the interlinkages between the economy and the environment required from a sustainability viewpoint. This scoping study yields two key recommendations for macroeconomic modelling: to incorporate resource use in the explanation of economic development, and to allow for non-linear relationships, thresholds and limits (Serice 2010). The report then turns to another useful approach from OECD that makes an effort to conceptualize causal pathways linking global environmental change (originally: climate change) to economic development via policy regulations, direct biophysical impacts and price effects on global markets (OECD/Martinez-Fernandez et al. 2010). The three types of effects are discussed. In a next section, insights from a report from the FP7-NEUjobs project are presented. In this project, a wide array of (mainly) natural science literature had been screened to identify “global megatrends” that would impact European economies and policy-making. Given far-reaching uncertainties and complex interrelations, the megatrends identified (i.e. energy transitions, rising challenges to resource security and increasing climate change impacts) are grouped to envision two future world contexts for Europe, a “tough” and a more “friendly” world. For the year 2025, the features of these worlds are sketched on the basis of a literature review (NEUjobs 2012). The chapter concludes that indeed the availability and use of natural resources provides a key link between economies and the environment, but that it is advisable to deal with them not one by one, but in a systemic fashion that takes into account their strong interrelationships on the one hand, and the high uncertainty of constraints of particular resources on the other. It concludes that the future of European resource supply may be expected to be fairly different from the past, and should be expected to change to the worse, both for environmental reasons and for reasons of strongly increasing international demand and competition. Chapter 2 is devoted to a descriptive analysis of the changes in global and European resource use in the past and emphasises the non-linearities that can be observed. It focuses on long-term structural changes in the energetic base of socio-economic systems, leading to fundamental transformations in the scale and quality of society-nature interactions. Similar fundamental transformations should be expected for the (inevitable) transition from fossil to renewable energy sources. Based on a set of case studies of industrial countries for which long term data series for resource use (material and energy use) are available, it discusses the transition from the agrarian to the industrial metabolic regime and seeks to identify structural breaks in the development of energy use in the second half of the 20th century. The main finding is that a stabilization of per capita energy and resource use in most high-income countries was reached in the early 1970ies that is still lasting, after a period of accelerated growth of resource use since the end of World War II. During this time the so-called „decoupling‟ of energy and materials use from economic growth became much more pronounced, a phenomenon we describe as the “1970s syndrome”. An explanation of this common and marked turn in the upward trend of energy and materials consumption needs more research and will be further pursued in work package 201. Finally, Chapter 3 suggests four scenarios for European resource use up to the year 2050, aligning with the global resource use scenarios developed by UNEP‟s International Resource Panel (2011). A “trend scenario” prolonging Europe‟s resource use into the future proves to be very close to the “freezing” scenario proposed by UNEP for high income industrial countries, and leads to an average per-capita resource use in Europe on the same level as in the early 2000s. A “best practice scenario” generalizes the past success of some European countries in downsizing their resource use to all European countries up to 2050. The fourth scenario, the

2
“radical transformation scenario”, follows UNEP‟s “moderate contraction and convergence” scenario in halving the per capita annual resource use of European countries, leading to what is commonly called “absolute decoupling”. The last part of the chapter is devoted to the feasibility of such a scenario, on the one hand, and the consequences this might have for the European economies. The concluding remarks emphasize that a successful scenario exercise requires an intimate collaboration between macroeconomic modellers and scientists contributing from the environmental and socio-ecological angle. There will be place for such collaboration in the further course of the WWWforEurope project.

3
Introduction
It was a trial-and-error process that led to the scenario decisions incorporated into this report,
across a number of intensive discussions between our team of socio-ecologists and
macroeconomic modellers. Stepping stones of this process can be described as follows.
1) In October 2012, the Institute for Social Ecology (SEC) organized a workshop in Vienna to
explore the interests of macroeconomic modellers in WWW to incorporate scenarios of
biophysical constraints into their modelling exercises, and to gain mutual understanding of
expectations and possibilities. Agreement was reached that SEC and WIFO would prepare
presentations for the WWW Workshop on macroeconomic modelling planned by WIFO for
which, on the one hand, possibilities to operationalize biophysical constraints, on the other
hand, links from the macroeconomic model under development to biophysical constraints
would be explored.
2) In March 2013, the respective presentations were made and contributed to a shared
understanding of the structure of the tasks in WP 2.4 and 2.5. In particular, it was agreed
that the macroeconomic model in preparation would cover EU 27 (and not, as originally
envisioned, only some particular European countries), and that the scenario work should
therefore also refer to EU 27. It was also agreed that there should be at least one scenario
implying a radical European change towards a biophysically more sustainable state; as an
adequate time frame for this we agreed on 2050.
3) These agreements had certain implications for resources and timing. It became clear that
this task required an intensive and continued interaction process between the teams
involved – in contrast to the project plan asking for finalization of scenarios now, ahead of
the macroeconomic modelling. The SEC team therefore decided to reserve some labour
power for the joint development of the scenarios with the macroeconomic model in the
following months. This could be achieved more easily as we could build upon previous
work within the framework of the EU-FP7 NEUjobs project, as will be acknowledged
wherever applicable.
In effect, this milestone report comes a little prematurely: it will develop resource use scenarios
for Europe, but it cannot yet create an interface with the macroeconomic models (as they are
not mature enough yet), and it cannot yet analyse and interpret model results, as they do not
yet exist.
In this report, we make an effort to bridge the gap between natural science based insights about
environmental impacts and macroeconomic functioning. This gap is fairly wide: If we consider
for example the widely received analysis of Rockström et al. (2009) about planetary boundaries
and both the time frame and the variables included in typical macroeconomic analyses, the
required bridge would have to span a distance that needs additional scientific pillars in between.
The IPCC, for issues of climate change and energy use, has been able to build such a bridge,
4
with the help of a large interdisciplinary research community, at least to a certain extent. For the
much wider issue of natural resources and their limitations, and the impacts of these limitations
upon the economy, such a bridge does not exist yet. What we are trying to do in this report is
building some pillars of such a bridge based on socio-ecological analytical work of the past
decade.
The structure of this report is the following. In chapter 1, we review a number of approaches we
consider useful to relating biophysical constraints with macroeconomic models. In chapter 2, we
discuss the long-term variability of socioeconomic resource use (and concomitant wastes and
emissions) as an issue of non-linear change. Chapter 3, finally, will provide scenario
calculations for EU 27 with a time frame to 2050 that lean upon UNEP‟s (2011) “contraction and
convergence” scenarios and break them down from a global to a European level.
With regard to the overall goals of the project WWWforEurope, each chapter serves a different
purpose. Chapter 1 explores the framework conditions for linking European wealth and welfare
(less so: work) with changing global framework conditions, reviewing existing efforts to relate
economic to biophysical change and explores the pathways of possible interlinkages. Chapter 2
makes a strong empirical claim for on-going structural change, both within high income
industrial economies and globally. It warns against simple extrapolations of past trends into the
future, and it bears a positive message: that the strong bond between economic growth and the
use of environmental resources has been lessening in the past decades, even that Europe
could be at the verge of a new transition (that it might not yet be willing to recognise). Chapter 3
then makes an effort at preparing biophysical scenarios for an on-going modelling effort in
collaboration with economists (WP 205). What is clear is that this will require substantial
additional efforts to provide adequate input into economic models: but there is a good chance
for moving along non-conventional pathways.

5
1. How to introduce biophysical constraints into
macroeconomic models
At WWW‟s macroeconomic modelling conference in 2013 we presented the following
considerations from literature for discussion, in order to create a shared understanding of
possible (and impossible) ways to incorporate biophysical constraints in macroeconomic
models.
1.1 Diagnosis and advice from the SERICE scoping study
(2010)
In a 2010 report to DG environment, Cambridge Econometrics in collaboration with the
Sustainable Europe Research Institute SERI examined the links between macroeconomic
perspectives and sustainable development. It considered how these links are represented in
economic theory and asks if the macroeconomic modelling used today is up to the task of
evaluating policy from a sustainable development viewpoint. If not, then models risk missing out
on the analytic requirements for sustainable development: the strong (two-way) linkages
between the economy and the environment, the importance of the long term, the necessity of an
integrated approach and the danger of thresholds.
“If these issues are missed by our models, then they risk giving us the wrong answers and
leading us in the wrong direction”, the report states, and continues with the following diagnosis.
“In the neoclassical model of the economy the environment and its natural resources have
never found a strong footing.
• The ecosystem is treated as a subsystem of the economy whose main functions are the
limitless extraction of resources and the free disposal of waste.
• The environment mainly features in microeconomics, where it is assumed that the
internalisation of negative externalities through the price mechanism can solve all
ecological problems.
• Mainstream macroeconomic theory is profoundly oriented towards the goal of
continuous and exponential economic growth. It is assumed that economic growth can
increase innovation and efficiency and lead to decoupling of economic growth from
negative environmental impacts.
• The welfare of future generations is safe because there is full substitutability of natural
capital so the depletion of natural resources can be compensated via investments in
other forms of capital (a concept known as „weak sustainability‟). From a neoclassical
economics perspective, there is no need for a new macroeconomic framework for
sustainability.
6
The possibility of not being able to substitute between input factors, or of the depletion of stocks
of resources, is largely ignored. Where external factors, such as environmental emissions or
human health effects, are included in the modelling framework they are often assigned
monetary values.
An alternative macroeconomic framework is being developed by ecological economists by
extending the neoclassical framework to explicitly include the environment and its services to
the economy. In ecological economics:
• The economic system is not only embedded in the larger environmental system but is
also completely dependent on it as both a source of inputs and as a sink for the matter
or energy transformations required by economic activity.
• The assumption that capital can substitute for resources is rejected on the basis that
certain functions that the environment performs cannot be duplicated by humans
(known as „strong sustainability‟).
• Environmental constraints imply limits on economic scale and thus limits to growth.
• Ecological economists are sceptical about the possibility to dramatically change
technologies, investment and consumption patterns in a way that decouples economic
growth from environmental impacts.
In effect, ecological economists argue for a serious rethinking of standard economic
assumptions and theories. At the same time, the report has to admit that “a complete
macroeconomic model in tune with ecological economists' thinking does not yet exist”.”
(SERICE 2010, executive summary, p. iii)
In tune with its analysis, the SERICE report issues the following recommendations for improving
the representation of ecological sustainability issues in macroeconomic models.
Recommendation 1: Incorporating resource use into the explanation of economic
development
They find that “it would be possible to integrate demand equations for the physical consumption
of materials (minerals and biomass) and water into existing macroeconomic frameworks
(including feedback to economic sectors such as agriculture, mining and water supply).
Eurostat provides relatively detailed data sets on which such an analysis could be based.
However, this is only one step in setting up a system that is capable of carrying out a
comprehensive analysis. A more complete list of steps is:
• Identify and define the most important groups of resources.
• Measure the available stocks (e.g. fossil fuels) or maximum carrying capacities (e.g.
annual fresh water supply).

7
• Include the demands for these resources and, where possible, available stocks or
carrying capacities in macroeconomic models.
• Allow supplies to influence behaviour, for example (but not limited to) in price formation
in the model structures.”
The authors think that the last of these steps requires a much larger research input as the
behavioural responses to extreme outcomes are unpredictable. However, the other steps they
consider all possible with given model frameworks and supplementary analysis, and the
modelling approach required is close to that already applied for energy use. (SERICE 2010, p.
vii)
Recommendation 2: Nonlinear Relationships, thresholds, limits
“The standard modelling approach is based on linear (or log-linear) elasticities, for example an
elasticity of -0.5 would mean a 10% increase in price leads to a 5% decrease in demand.
Although there are cases where this assumption is relaxed, our view is that this type of
relationship is often forced on model parameters. This potentially negates several important
features and leads to the following issues and potential developments:
• Linear approximations of curved relationships may be reasonably accurate for small
changes, but will become less accurate as the model moves further from base.
• Threshold effects and physical limits should be taken into account. However, problems
arise in defining thresholds that have not previously been reached (e.g. mineral
resources becoming scarce), or where thresholds vary over time (e.g. annual rainfall).
• A proper treatment of asymmetrical relationships could be a relatively easy
improvement to make, with separate parameters for positive and negative relationships.
For example, if high commodity prices lead to investment in new equipment, this
equipment will still be used if prices fall again.
• The assumption that model elasticities do not change over time should be examined
more closely.” (p.viii)
While SERICE issues a number of further recommendations, our presentation below will place
particular emphasis, analytically and empirically, on the validity of the above two key
recommendations.
1.2 Adopting OECD’s impact model for resource use
While it is fairly common to describe impacts upon the environment in terms of overstretched
sinks due to increasing amounts of wastes and emissions, these adverse effects usually only
feedback upon economies through political regulation. With increasingly limited natural
resources, though, one may expect a more immediate impact upon economies. In our analysis
8
of causal pathways that might render themselves for macroeconomic modelling we borrow a
scheme from recent work on green jobs and skills in relation to climate change
(OECD/Fernandez et al. 2010) and modify it for our own context:
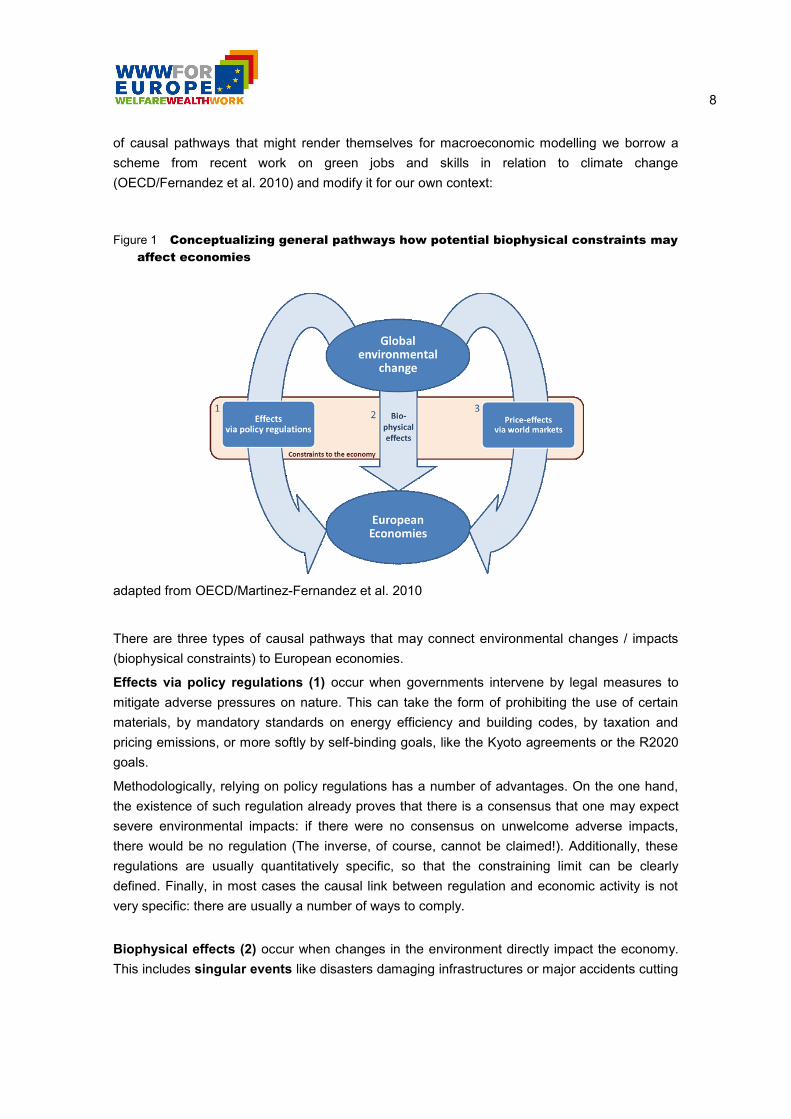
Figure 1 Conceptualizing general pathways how potential biophysical constraints may
affect economies
adapted from OECD/Martinez-Fernandez et al. 2010
There are three types of causal pathways that may connect environmental changes / impacts
(biophysical constraints) to European economies.
Effects via policy regulations (1) occur when governments intervene by legal measures to
mitigate adverse pressures on nature. This can take the form of prohibiting the use of certain
materials, by mandatory standards on energy efficiency and building codes, by taxation and
pricing emissions, or more softly by self-binding goals, like the Kyoto agreements or the R2020
goals.
Methodologically, relying on policy regulations has a number of advantages. On the one hand,
the existence of such regulation already proves that there is a consensus that one may expect
severe environmental impacts: if there were no consensus on unwelcome adverse impacts,
there would be no regulation (The inverse, of course, cannot be claimed!). Additionally, these
regulations are usually quantitatively specific, so that the constraining limit can be clearly
defined. Finally, in most cases the causal link between regulation and economic activity is not
very specific: there are usually a number of ways to comply.
Biophysical effects (2) occur when changes in the environment directly impact the economy.
This includes singular events like disasters damaging infrastructures or major accidents cutting

9
off energy and water supply, or epidemics threatening lives and temporarily reducing the labour
force. Droughts and pests may reduce regional harvests or cause disruptions of water supply to
households and industry. As long as this is about singular local or regional events, research has
shown that there may be a short term economic impact (e.g. earthquake effecting Port of Kobe,
see Toya and Skidmore 2007; economic effects of the floods in 2002, see Kletzan et al. 2003;
droughts and harvest losses, see Okuyama 2007), but in the medium and long term the
economy recovers and returns to business as usual.
What is not so clear is the impact of a rise in the frequency and extent of such events,
including more and more numerous supply disruptions of materials and energy. We would
assume that economic players will employ the following adaptation strategies, such as:
Building up emergency supply systems by investments in infrastructure and increased
stock-keeping (such as multi fuel burners, fuel and water tanks, electricity generators,
changes to production systems with reduced just-in-time deliveries)
Diversification of product portfolios, including the phasing out of highly vulnerable
production processes to increase economic robustness (e.g. selection of crops)
Fortification of existing infrastructures to make them less vulnerable (flood protection,
strengthened roof construction to deal with increasing snow loads, etc.)
The common economic denominator of these strategies is probably a rise in factor costs
(investments) and decreasing efficiency of production (c.f. Randers 2012 and his assumption on
declining productivity increases). Methodologically it seems difficult to parameterize these
impacts.
On top of this, incremental systematic environmental trends are also to be expected, for
example rising sea levels and increasing aridity in Southern Europe. These impacts on natural
conditions for production might promote a structural shift in national economies and a change in
geographic economic patterns. For example the agricultural production of Southern Europe
might be faced with water scarcity. Summer tourism in Southern Europe and winter tourism in
the Alps might be faced with unfavourable temperature changes.
Price-effects on world markets (3) occur where markets perceive tightening biophysical
constraints. So expected shortages of supply due to scarcity of energy sources or specific
materials lead to an increase in prices and may lead to increases in price volatility. In the case
of metals, declining ore grades in major mining sites trigger price effects. Or the oil price
amongst other factors might change due to new knowledge about size and accessibility of
available resources and reserves. The so called EROI, the ratio of how much energy is gained
to how much energy is required to explore or grow, extract, produce and deliver it at the point of
use, may play an increasing role, since fossil fuels show declining EROIs and renewable energy
carriers show lower EROIs than the fossil fuels in the past decades (see Hall 2008).
Whether the increase in price volatility is mainly caused by changes in the physical
fundamentals or by changes in the financial fundamentals is subject to discussion. In the past
for example speculation has amplified the volatility of commodity prices (Chevalier 2010).
Similarly, it is likely that the physical fundamentals will play an increasing role in price rises by
the end of the decade, adding to increasing volatility.
10
In addition to growing information on biophysical constraints and related environmental impacts,
as a fourth effect not included in the OECD model, also consumer preferences may be affected,
with some segments of the population adopting more sustainable consumption practices.
NEUjob‟s Global Challenges Model
The historical socio-ecological transitions, such as the fossil fuel based industrialization of
Europe and beyond, led to a new type of society with unprecedented levels of natural resource
extractions and energy and material consumption for approximately 15% of the world
population, with equally unprecedented scientific and technical knowledge and with democracy.
However, this transition is not only historical but still on-going, as 60% of the world‟s population
in the emerging economies are in a take-off or an acceleration phase towards a fossil fuels
based system (see chapter 2). Also a further socio-ecological transition away from fossil fuels
can be expected to have similar far-reaching implications as this still on-going transition into
fossil fuels, not only for production and consumption patterns, but also for many other features
of society.
There is ample evidence provided by global change research that human activity caused and
causes major changes in the functioning of natural systems on every spatial scale, from local to
global, and is transforming the earth system at an increasing pace (IPCC 2007, Karl and
Trenberth 2003, Rockström et al. 2009a, Schellnhuber 1999, UNEP 2007, Turner et al. 1990,
Vörösmarty et al. 2004, WBGU 2011). Such changes are now being accelerated by the on-
going process of industrialization in the very populous emerging economies. Thus, imagining
the further expansive continuation of the industrial sociometabolic regime for a majority of the
world, 2025 or even more so 2050, seems biophysically not feasible and threatens to further
erode humanity‟s natural base. It is very hard to know how fast this will happen, and this is
subject to debate. It is not so hard to know that some of this will happen, such as the exhaustion
of cheap fossil fuels and a number of other natural resources, and – to say the least – an
increasing volatility of the climate system. Still, these changes occur in response to, or as a
consequence of, the continuing socio-ecological transition towards fossil fuel based industrial
societies and inevitably – sooner or later – will impose a new socio-ecological transition away
from fossil fuels on societies.
Under the “global megatrends in natural conditions” the NEUjobs report subsumes energy
transitions (into and away from fossil fuels), rising challenges to resource security and
increasing climate change impacts. On the other side, NEUjobs sees elements of the social part
of the socio-ecological transition happening, related to social and technical achievements
generated by the last transition, and terms them global “societal megatrends”. The three most
important elements of the global societal megatrends identified are the continuation of the
global demographic transition, the on-going shifts in the economic and political centres of
gravity worldwide, and the growing use of information and communication technologies plus
related new forms of knowledge sharing. These megatrends, so NEUjobs argues,
fundamentally reshape the global framework conditions for Europe. As stated above, it is an
11
open question how fast and how radical these megatrends will evolve. Therefore they draw a
distinction, for each megatrend, based on existing literature, between “friendly” and “tough”
variants by 2025 and by 2050, and use these as global framework scenarios for the European
option space.
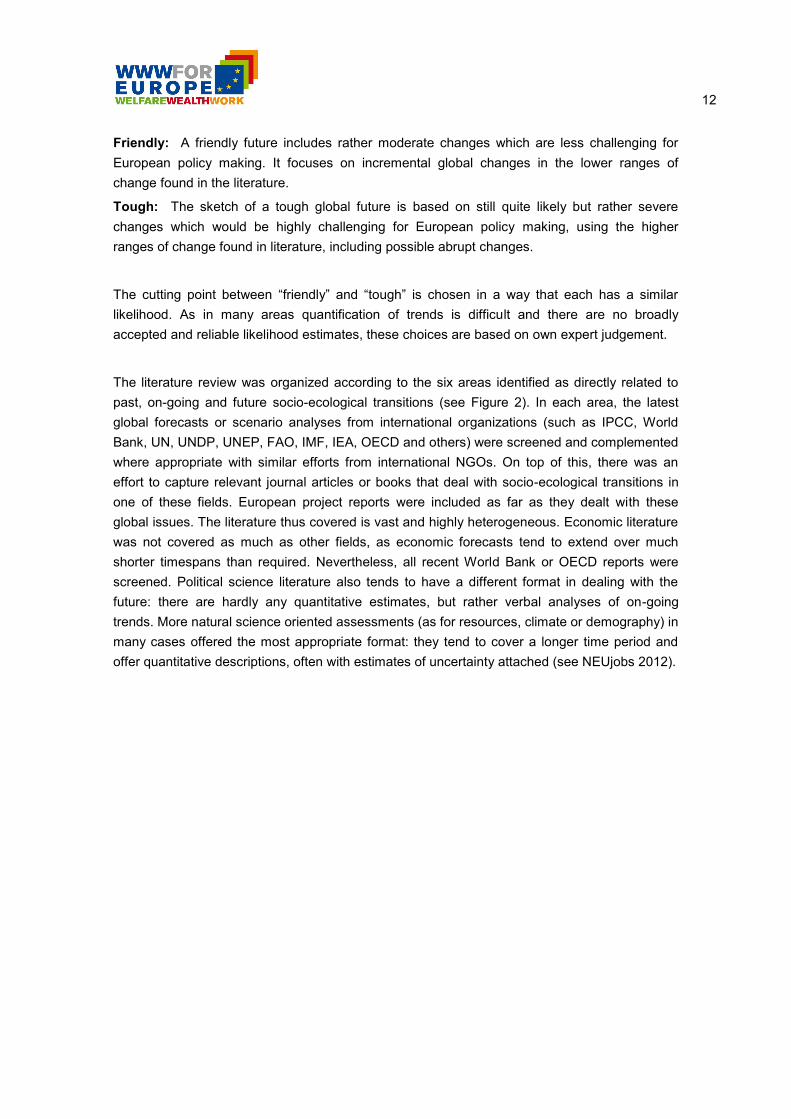
Figure 2 pictures the European option space in this (dynamic) global framework. In the centre of
the picture, there is the socio-economic reproduction of the European population at a certain
level of welfare. The population is subject to demographic change (depending on global and
internal conditions). Its reproduction, depending on the mode of production and consumption,
requires the use of natural resources the supply of which is subject to global (and internal)
conditions. It also requires a certain amount and quality of human labour, again depending on
global and internal conditions. At the top of the picture, there is the European policy process,
political, economic and technical response strategies in a changing world.
Figure 2 Global megatrends impacting upon Europe’s future by 2050
Source: NEUjobs 2012, p, 77, http:// http://www.neujobs.eu/publications/socio-ecological-
transition-and-employment-implications/socio-ecological-transitions-de
While global scenarios and key assumptions are based on an extensive review of literature,
NEUjobs makes an effort at simplifying and aggregating the options to generate two variants of
a global future world, a “friendly” and a “tough” one. The goal of this exercise is to find those key
assumptions necessary for formal modelling as well as for creating self-consistent story lines of
two possible futures. These possible futures map out the range of the possible global conditions
for 2025 and 2050. For defining “friendly” and "tough”, NEUjobs draws a distinction between a
slow rate of change that is less challenging for Europe, and a more radical or rapid version.
12
Friendly: A friendly future includes rather moderate changes which are less challenging for
European policy making. It focuses on incremental global changes in the lower ranges of
change found in the literature.
Tough: The sketch of a tough global future is based on still quite likely but rather severe
changes which would be highly challenging for European policy making, using the higher
ranges of change found in literature, including possible abrupt changes.
The cutting point between “friendly” and “tough” is chosen in a way that each has a similar
likelihood. As in many areas quantification of trends is difficult and there are no broadly
accepted and reliable likelihood estimates, these choices are based on own expert judgement.
The literature review was organized according to the six areas identified as directly related to
past, on-going and future socio-ecological transitions (see Figure 2). In each area, the latest
global forecasts or scenario analyses from international organizations (such as IPCC, World
Bank, UN, UNDP, UNEP, FAO, IMF, IEA, OECD and others) were screened and complemented
where appropriate with similar efforts from international NGOs. On top of this, there was an
effort to capture relevant journal articles or books that deal with socio-ecological transitions in
one of these fields. European project reports were included as far as they dealt with these
global issues. The literature thus covered is vast and highly heterogeneous. Economic literature
was not covered as much as other fields, as economic forecasts tend to extend over much
shorter timespans than required. Nevertheless, all recent World Bank or OECD reports were
screened. Political science literature also tends to have a different format in dealing with the
future: there are hardly any quantitative estimates, but rather verbal analyses of on-going
trends. More natural science oriented assessments (as for resources, climate or demography) in
many cases offered the most appropriate format: they tend to cover a longer time period and
offer quantitative descriptions, often with estimates of uncertainty attached (see NEUjobs 2012).
13
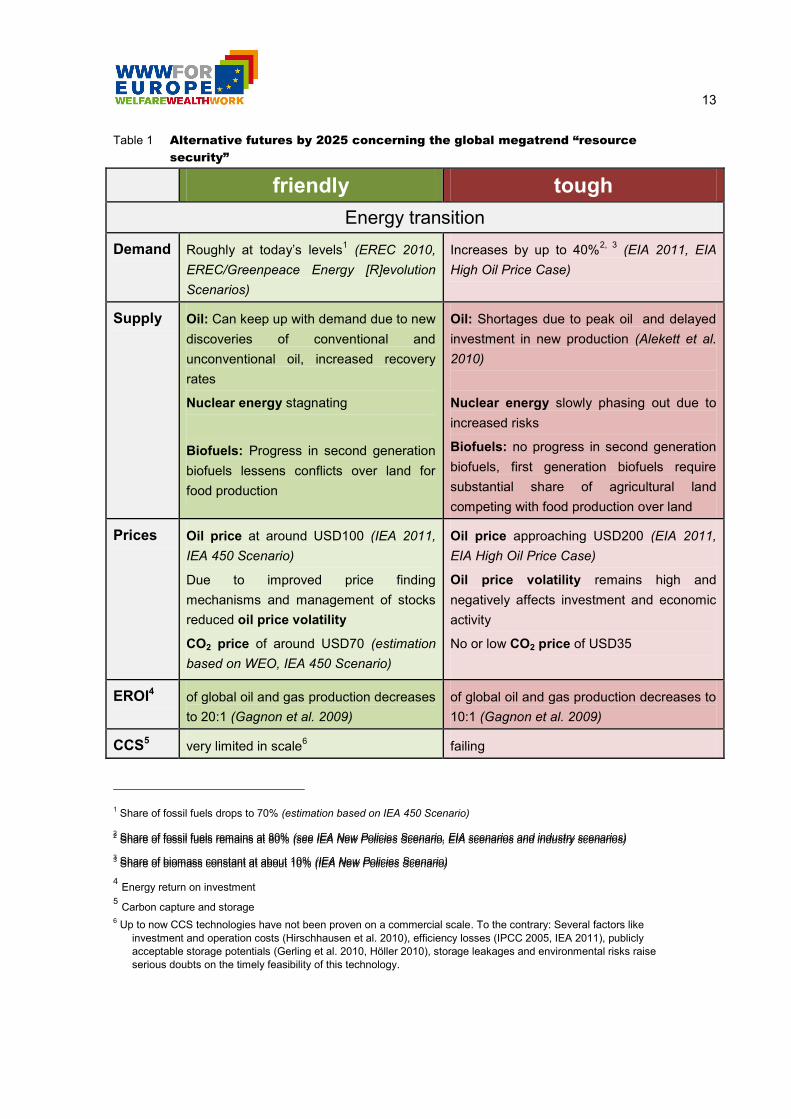
Table 1 Alternative futures by 2025 concerning the global megatrend “resource
security”
friendly tough
Energy transition
Demand Roughly at today‟s levels1 (EREC 2010,
EREC/Greenpeace Energy [R]evolution
Scenarios)
Increases by up to 40%2, 3
(EIA 2011, EIA
High Oil Price Case)
Supply Oil: Can keep up with demand due to new
discoveries of conventional and
unconventional oil, increased recovery
rates
Nuclear energy stagnating
Biofuels: Progress in second generation
biofuels lessens conflicts over land for
food production
Oil: Shortages due to peak oil and delayed
investment in new production (Alekett et al.
2010)
Nuclear energy slowly phasing out due to
increased risks
Biofuels: no progress in second generation
biofuels, first generation biofuels require
substantial share of agricultural land
competing with food production over land
Prices Oil price at around USD100 (IEA 2011,
IEA 450 Scenario)
Due to improved price finding
mechanisms and management of stocks
reduced oil price volatility
CO2 price of around USD70 (estimation
based on WEO, IEA 450 Scenario)
Oil price approaching USD200 (EIA 2011,
EIA High Oil Price Case)
Oil price volatility remains high and
negatively affects investment and economic
activity
No or low CO2 price of USD35
EROI4 of global oil and gas production decreases
to 20:1 (Gagnon et al. 2009)
of global oil and gas production decreases to
10:1 (Gagnon et al. 2009)
CCS5 very limited in scale6 failing
1 Share of fossil fuels drops to 70% (estimation based on IEA 450 Scenario)
2 Share of fossil fuels remains at 80% (see IEA New Policies Scenario, EIA scenarios and industry scenarios)
3 Share of biomass constant at about 10% (IEA New Policies Scenario)
2 Share of fossil fuels remains at 80% (see IEA New Policies Scenario, EIA scenarios and industry scenarios)
3 Share of biomass constant at about 10% (IEA New Policies Scenario)
4 Energy return on investment
5 Carbon capture and storage
6 Up to now CCS technologies have not been proven on a commercial scale. To the contrary: Several factors like
investment and operation costs (Hirschhausen et al. 2010), efficiency losses (IPCC 2005, IEA 2011), publicly
acceptable storage potentials (Gerling et al. 2010, Höller 2010), storage leakages and environmental risks raise
serious doubts on the timely feasibility of this technology.

14
Source: NEUjobs 2012, p.85
Table 2 Alternative futures by 2025 concerning the global megatrend “resource
security”.
Resource security
Demand Critical metals: +20 % increase of total
demand over 2007 (Buchert et al. 2009)
Rare Earth Elements (REE): +120%
increase over 20077
Phosporus: +10%increase over 20008
(Van Vuuren et al. 2010)
Food:
Moderate demand growth due to low
population growth (low fertility variant) and
dietary changes towards less meat in
mature economies and less food waste
Critical metals: +50% compared to 2007
(Buchert et al. 2009)
Rare Earth Elements (REE): +370%
increase over 20079 (Schüler et al. 2011)
and criticality of some REE severe
Phosporus: +60% increase over 200010
(Van Vuuren et al. 2010)
Food:
High demand growth due to high population
growth (high fertility variant) and dietary
changes of emerging economies towards the
level and diet of today‟s mature economies
Supply Critical metals: supply increases are
mitigated by efficient recycling systems
and high recovery rates, relevant
substitutions are realised, no further
export restriction from producing
countries, new mining projects, new
discoveries
Bulk metals: declining ore grades
(Giurco et al., 2010) leading to slow but
steady price increases
Phosphorus: Peak 2030 (Cordell et al.,
2010, Rosemarin 2010, Zittel 2010)
Food:
Progress towards key food security and
environmental sustainability goals (Foley
et al. 2011)
Critical metals: severe supply shortages
due to low recycling rates, low/unknown
substitutability,
> 90% share of global mining within few
countries and further export restrictions
Bulk metals: declining ore grades (Giurco et
al. 2010) leading to significant price
increases
Phosphorus: Peak 2020 (Zittel 2010, lower
range of estimate)
Food:
Food security situation problematic,
environmental impacts large
7 REE: annual growth rate of 4.5% based on literature equals +120%
8 Phosphorus: 44,5 Mt P2O5 in 2000 and 49 Mt P2O5 in 2030
9 REE 9.0% per year based on literature equals +370% and criticality of some REE more severe than projected
10 Phosphorus: 44,5 Mt P2O5 in 2000 and 78 Mt P2O5 in 2030
15
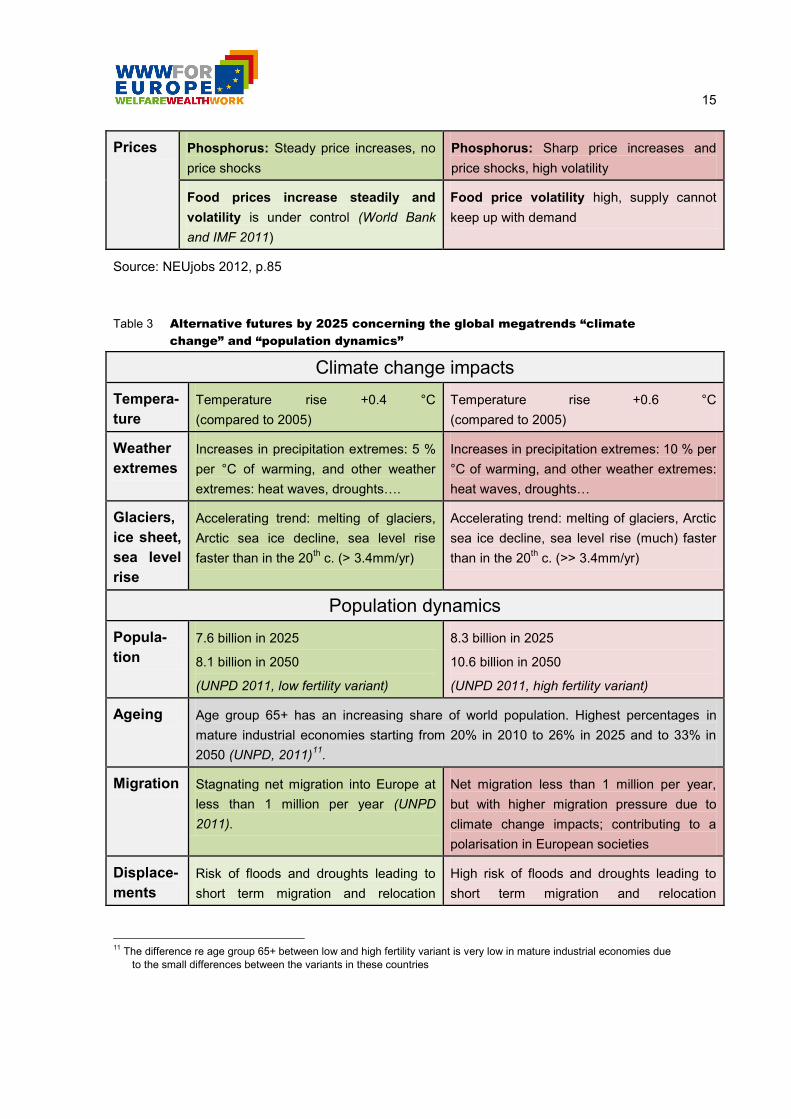
Prices Phosphorus: Steady price increases, no
price shocks
Phosphorus: Sharp price increases and
price shocks, high volatility
Food prices increase steadily and
volatility is under control (World Bank
and IMF 2011)
Food price volatility high, supply cannot
keep up with demand
Source: NEUjobs 2012, p.85
Table 3 Alternative futures by 2025 concerning the global megatrends “climate
change” and “population dynamics”
Climate change impacts
Tempera-
ture
Temperature rise +0.4 °C
(compared to 2005)
Temperature rise +0.6 °C
(compared to 2005)
Weather
extremes
Increases in precipitation extremes: 5 %
per °C of warming, and other weather
extremes: heat waves, droughts….
Increases in precipitation extremes: 10 % per
°C of warming, and other weather extremes:
heat waves, droughts…
Glaciers,
ice sheet,
sea level
rise
Accelerating trend: melting of glaciers,
Arctic sea ice decline, sea level rise
faster than in the 20th c. (> 3.4mm/yr)
Accelerating trend: melting of glaciers, Arctic
sea ice decline, sea level rise (much) faster
than in the 20th c. (>> 3.4mm/yr)
Population dynamics
Popula-
tion 7.6 billion in 2025
8.1 billion in 2050
(UNPD 2011, low fertility variant)
8.3 billion in 2025
10.6 billion in 2050
(UNPD 2011, high fertility variant)
Ageing Age group 65+ has an increasing share of world population. Highest percentages in
mature industrial economies starting from 20% in 2010 to 26% in 2025 and to 33% in
2050 (UNPD, 2011)11
.
Migration Stagnating net migration into Europe at
less than 1 million per year (UNPD
2011).
Net migration less than 1 million per year,
but with higher migration pressure due to
climate change impacts; contributing to a
polarisation in European societies
Displace-
ments
Risk of floods and droughts leading to
short term migration and relocation
High risk of floods and droughts leading to
short term migration and relocation
11
The difference re age group 65+ between low and high fertility variant is very low in mature industrial economies due
to the small differences between the variants in these countries

16
movements within Europe.
For 2050 inland migration from Europe‟s
low laying coasts (e.g. Netherlands:
5.000 persons) (IPCC 2007; Mc Leman
and Hunter 2011).
movements within Europe.
For 2050 inland migration from Europe‟s low
laying coasts (e.g. Netherlands: 50.000
persons) (IPCC 2007; Mc Leman and Hunter
2011).
Source: NEUjobs 2012, p.86
Table 4 Alternative futures by 2025 concerning the global megatrends “shifting
centres of political and economic gravity” and “ICT use and knowledge
sharing”
Shifting Economic and Political Centres of Gravity
Economi
c shift
Mature industrial economies’ share in
world GDP declines from 50% in 2011 to
45% in 2025
EU15 declines from 18% to 15%
Emerging economies’ share in world GDP
increases from 30% to 37%
China increases from 16% to 20%
India increases from 6% to 8%
(own calculations12
based on The
Conference Board 2012, base scenario)
Mature industrial economies’ share in
world GDP declines from 50% in 2011 to
40% in 2025
EU15 declines from 18% to 13%
Emerging economies’ share in world
GDP increases from 30% to 43%
China increases from 16% to 25%
India increases from 6% to 9%
(own calculations13
based on The
Conference Board 2012, pessimistic for
mature and optimistic scenario for
emerging)
World
econo-
mic
growth
Mature economies: 1,9% for 2012-2016
and 1,9% for 2017-2025
EU15: 1,5% for 2012-2016 and 1,7% for
2017-2025
Emerging: 6,0% for 2012-2016 and 3,4%
for 2017-2025
(own calculation based on The Conference
Board 2012, base scenario)
Mature economies: 1,1% for 2012-2016
and 1,3% for 2017-2025
EU15: 0,4% for 2012-2016 and 1,0% for
2017-2025
Emerging: 7,9% for 2012-2016 and 4,6%
for 2017-2025
(own calculation based on The
Conference Board 2012, pessimistic for
mature and optimistic scenario for
emerging)
12
Friendly assumes slow but steady growth in Europe that allows for adequate responses to challenges ahead and
relatively moderate growth in emerging countries so that demand for resources grows moderate as well (meaning
less challenging to European resource security). 13
Tough assumes very low growth rates for Europe that challenge stability (financially and politically through high
unemployment rates and polarization in society) and quite high growth rates in emerging economies due to growing
domestic markets and increasing trade between emerging economies themselves and with developing countries.

17
Volatility no upward or downward trend in
commodity price volatility over time
compared to recent decades (Calvo-
Gonzales et al. 2010)
Food and agricultural prices: Lessons
learnt from previous periods of high
volatility lead to successful implementation
of measures to reduce price volatility and to
better deal with consequences (FAO et al.
2011)
Oil price: due to improved price finding
mechanisms and management of stocks
reduced oil price volatility
Continued uptick in price volatility in a
number of commodities
Food and agricultural prices: Higher
and more volatile agricultural commodity
prices persist, largely due to continuing
uncertainty on the supply side, against
projected rising demand (FAO et al.
2011)
Oil price: volatility remains high and
negatively affects willingness to invest
and to engage in new economic activities
Inter-
national
relations
Shift in political power from mature to
emerging economies due to increased
economic importance (see economic shift)
leads to reformed cooperative
international relations
Common challenges dealt by weak
international cooperation
Little reform of existing international
institutions
Summit diplomacy
(see NIC and EUISS 2010, Scenario I:
“Barely Keeping Afloat” and Scenario III:
“Concert of Europe Redux”)
Shift in political power from mature to
emerging economies due to increased
economic importance (see economic
shift) leads to confrontational
international relations
Resolving common challenges
dominated by self-interested actors
Attempts to resolve challenges by
military, economic and resource/
energy competition
Increased military conflicts and
armament
(see NIC and EUISS 2010, Scenario II:
“Fragmentation” and Scenario IV:
“Gaming Reality: Conflict Trumps
Cooperation”)
ICT use and knowledge sharing
Societal
Level
Open governance: increased
transparency, participatory policy
intelligence
Improved management of complex
systems (smart grids, modelling global
dynamics, smart energy production and
consumption)
Governance by surveillance: use of
ICT tools for increasing control over
population, low openness and
transparency, low integration and
participation
Increased management of complex
systems by ICT solutions leads to
dependency on highly vulnerable
systems

18
Information and knowledge sharing: open
collaboration, learning management
systems, civil services
Information and knowledge denial:
high and successful efforts in securing
information monopolies
Individual
Level
Protection of privacy
Ambient intelligence/ ubiquitous
computing supports daily living
Social inclusion (right to internet and
digital inclusion)
New literacy (technology literacy,
customized information services,
personalized education)
Surveillance: disclosure of personal
information, threat of social pressure)
Ambient intelligence/ ubiquitous
computing creates dependency and
better enables surveillance
Social exclusion (limited access and
digital divide)
New illiteracy (financial dependence,
fragmentation of education)
Source: NEUjobs 2012, p.87f
1.3 Preliminary conclusions from Chapter 1
The following insights from the material presented in chapter 1 will carry us through the tasks
ahead.
We agree with the SERICE 2010 analysis concerning the key role of natural resources.
Natural resources are a key link between the environment and the economy. Economic
activities are based upon natural resources, and the input (amounts and qualities) of
resources used have clear implications for the “output” of the economy (i.e. wastes and
emissions) to the environment. The sustainability of economic activity is directly related
to the availability of resources. Beyond these conceptual reasons, natural resources –
in contrast to most wastes and emissions, except for CO2 - have the advantage of
statistical data availability for Europe (Eurostat) and globally. Data for material
resources are available for sufficiently long time series to render themselves useful for
statistical analysis of the interrelation between economies in monetary and in physical
terms, similar to the long tradition of economy-energy analyses.
As the assessment done for NEUjobs (2012) has shown, abundance and scarcity of
specific resources (such as certain metals, phosphorus or fossil fuels) are highly
contested issues. For all economic actors involved, estimates of available reserves
involve substantial risks of capital devaluation, and therefore tend not to be very
transparent. They are further complicated by technology assumptions, assumptions
about future energy availability and price, and of course assumptions about future
demand and substitutability. In the endeavour of finding realistic ranges it is not wise
therefore to align with certain estimates and root scenarios in specific assumptions of
future resource availability or constraints. Furthermore, the use of different resources is
highly interlinked: energy and non-energy material resources are strongly correlated,
19
the extraction and use of various metals is functionally interrelated, food and feed
availability is linked to mineral resources…
It seems advisable, therefore, to treat natural resources in a systemic, holistic fashion,
looking at the sum total of material and energy resources used by societies, as
accounted for by the MEFA framework (see Matthews et al. 2000, Haberl et al. 2004,
Fischer-Kowalski et al. 2011) and analyse the relations between these “biophysical”
features economies with their monetary features in order to create one of the pillars
supporting the bridge of understanding the interrelation between environment and the
economy.
The future context for European resource supply may be expected to be fairly different
from the past, and should be expected to change to the worse, both for environmental
reasons and for reasons of strongly increasing international demand and competition.

20
2. Non-linearities in historical and contemporary
resource use14
2.1 Incremental change versus transition / transformation
Several disciplines use the notion of transition in a variety of different contexts and in different
meanings. In thermodynamics, the term transition is used to describe the „phase transitions‟ of
substances when transforming between solid, liquid and gaseous aggregate states (Stanley
1971).
The economic historian Karl Polanyi uses transition and transformation synonymously in his
seminal book “Origins of our time: the great transformation” published in 1944. His investigation
was concerned with the transformation of society into a market economy focusing on the
political and economic dimensions of this process (Polanyi 1944).
Another use of the notion stems from demography. In 1945, Notestein (1945) wrote his classic
elaboration of transition theory, "Population: the long view." Populations with high growth rates
would become "transition growth" ones as modernization began to affect their fertility. When
industrialization and urbanization become common place, fertility would reach low levels and
the population would enter into the stage of "incipient decline."
Figure 3 Demographic transition
Source: own translation from Münz and Ullrich 2006
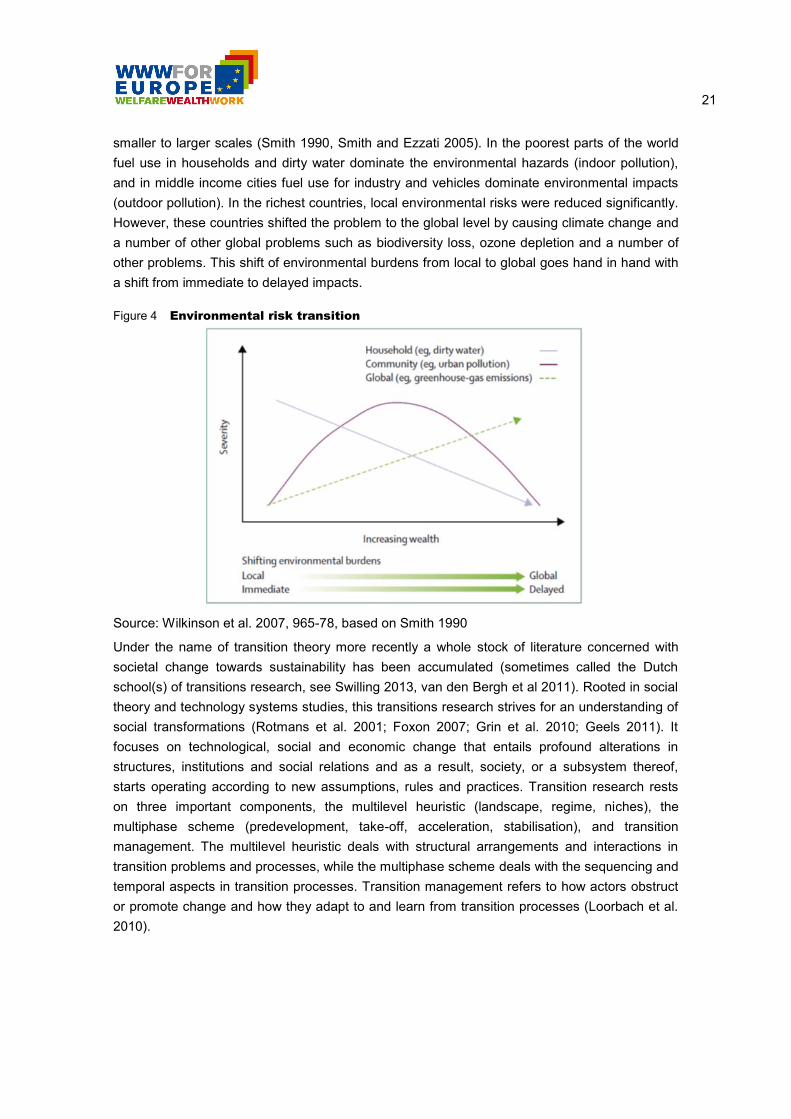
In environmental health15
, the notion of risk transition has been used by Smith to describe the
tendency of the last century‟s societal developments to shift environmental problems from
14
The following chapter is an abbreviated and slightly modified version of our report for the NEUjobs project (NEUjobs 2012). 15
The WHO (2013) defines environmental health as a topic that addresses all the physical, chemical, and biological
factors external to a person, and all the related factors impacting behaviours. It encompasses the assessment and
control of those environmental factors that can potentially affect health. It is targeted towards preventing disease
and creating health-supportive environments (see http://www.who.int/topics/environmental_health/en/)
21
smaller to larger scales (Smith 1990, Smith and Ezzati 2005). In the poorest parts of the world
fuel use in households and dirty water dominate the environmental hazards (indoor pollution),
and in middle income cities fuel use for industry and vehicles dominate environmental impacts
(outdoor pollution). In the richest countries, local environmental risks were reduced significantly.
However, these countries shifted the problem to the global level by causing climate change and
a number of other global problems such as biodiversity loss, ozone depletion and a number of
other problems. This shift of environmental burdens from local to global goes hand in hand with
a shift from immediate to delayed impacts.
Figure 4 Environmental risk transition
Source: Wilkinson et al. 2007, 965-78, based on Smith 1990
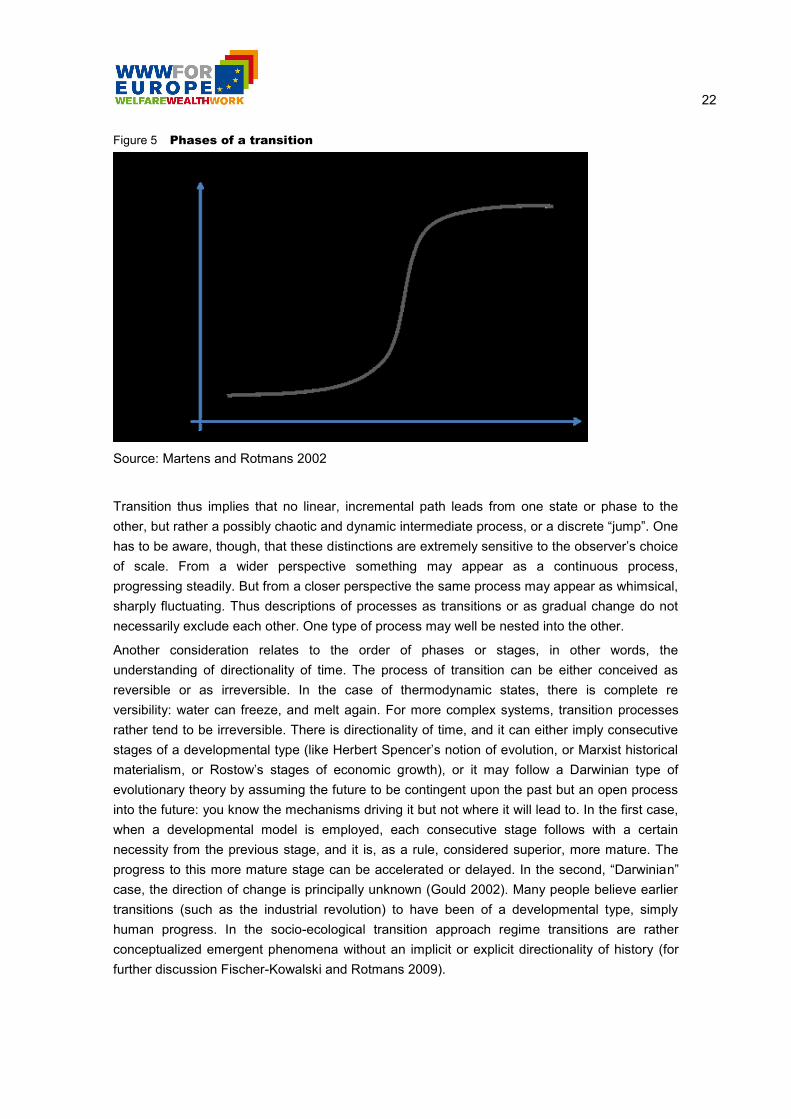
Under the name of transition theory more recently a whole stock of literature concerned with
societal change towards sustainability has been accumulated (sometimes called the Dutch
school(s) of transitions research, see Swilling 2013, van den Bergh et al 2011). Rooted in social
theory and technology systems studies, this transitions research strives for an understanding of
social transformations (Rotmans et al. 2001; Foxon 2007; Grin et al. 2010; Geels 2011). It
focuses on technological, social and economic change that entails profound alterations in
structures, institutions and social relations and as a result, society, or a subsystem thereof,
starts operating according to new assumptions, rules and practices. Transition research rests
on three important components, the multilevel heuristic (landscape, regime, niches), the
multiphase scheme (predevelopment, take-off, acceleration, stabilisation), and transition
management. The multilevel heuristic deals with structural arrangements and interactions in
transition problems and processes, while the multiphase scheme deals with the sequencing and
temporal aspects in transition processes. Transition management refers to how actors obstruct
or promote change and how they adapt to and learn from transition processes (Loorbach et al.
2010).
22
Figure 5 Phases of a transition
Source: Martens and Rotmans 2002
Transition thus implies that no linear, incremental path leads from one state or phase to the
other, but rather a possibly chaotic and dynamic intermediate process, or a discrete “jump”. One
has to be aware, though, that these distinctions are extremely sensitive to the observer‟s choice
of scale. From a wider perspective something may appear as a continuous process,
progressing steadily. But from a closer perspective the same process may appear as whimsical,
sharply fluctuating. Thus descriptions of processes as transitions or as gradual change do not
necessarily exclude each other. One type of process may well be nested into the other.
Another consideration relates to the order of phases or stages, in other words, the
understanding of directionality of time. The process of transition can be either conceived as
reversible or as irreversible. In the case of thermodynamic states, there is complete re
versibility: water can freeze, and melt again. For more complex systems, transition processes
rather tend to be irreversible. There is directionality of time, and it can either imply consecutive
stages of a developmental type (like Herbert Spencer‟s notion of evolution, or Marxist historical
materialism, or Rostow‟s stages of economic growth), or it may follow a Darwinian type of
evolutionary theory by assuming the future to be contingent upon the past but an open process
into the future: you know the mechanisms driving it but not where it will lead to. In the first case,
when a developmental model is employed, each consecutive stage follows with a certain
necessity from the previous stage, and it is, as a rule, considered superior, more mature. The
progress to this more mature stage can be accelerated or delayed. In the second, “Darwinian”
case, the direction of change is principally unknown (Gould 2002). Many people believe earlier
transitions (such as the industrial revolution) to have been of a developmental type, simply
human progress. In the socio-ecological transition approach regime transitions are rather
conceptualized emergent phenomena without an implicit or explicit directionality of history (for
further discussion Fischer-Kowalski and Rotmans 2009).
23
2.2 Socio-ecological transitions as transitions between
sociometabolic regimes (the Vienna social ecological
approach)
The sociometabolic approach to transitions makes certain choices with regard to the above
mentioned distinctions. It says the appropriate unit of analysis to investigate socio-ecological
transitions is society, interpreted as a sociometabolic system (Fischer-Kowalski and Weisz
1999) that interacts with systems in the natural environment. Particular patterns of interaction
are called “sociometabolic regime”. Socio-ecological transitions, then, are transitions between
sociometabolic regimes.
According to the sociometabolic approach, a regime, sociometabolic, is rooted in the energy
system a society depends upon, that is the sources and dominant conversion technologies of
energy. The theory of sociometabolic regimes has been developed by Sieferle (1982; 2001) and
elaborated by Fischer-Kowalski and Haberl (2007). Depending on the reasons for and the
speed of an energy transition, parts of the system may at a certain point in time be under
different energy regimes: urban industrialized centres, for instance, may coexist with traditional
agricultural communities, or industrialized countries with agrarian colonies. Such a
“synchronicity of the asynchronic” (Füllsack 2011) influences the overall course of transitions.
How these processes evolve is contingent upon specific conditions. The sociometabolic
approach shares with complex systems theory the notion of emergence: neither can one state
be deliberately transformed into the other, nor can the process be fully controlled. One is
confronted with self-organizing dynamics (Maturana and Varela 1975) to which orderly
governance or steering cannot be applied.
In the past decades, the material and energy flow accounting (MEFA) framework was
developed and is now widely used to give an operational description of sociometabolic regimes
in terms of societal resource use. MEFA allows calculating the resource use indicators domestic
material consumption (DMC) and domestic energy consumption (DEC) which measure
consumption defined as domestic resource extraction + imports – exports. DMC measures the
socio-economic use of all materials in tons (except for water and air), typically distinguishing
four main material groups: biomass, fossil energy carriers, non-metallic minerals and ores and
metals. Accounting principles and estimation procedures are highly standardized and
summarized for example in Eurostat (2009) and Fischer-Kowalski et al. (2011). DMC for
European countries is regularly reported by Eurostat. The measure for domestic energy
consumption, DEC, measured in Joule, is a comprehensive indicator for primary energy
consumption. Beyond conventional measures (such as Total Primary Energy Supply, TPES), it
does not only account for technical or commercial energy carriers, but also includes all primary
biomass used by society: all feed for livestock and plant based food for humans that is, the
primary energy sources for the provision of human work and draught power (Haberl 2001). DEC
also accounts for electricity from hydro- and nuclear power as primary energy in the form of
hydropower and nuclear heat. That is, it takes the conversion efficiency of hydro and nuclear
power plants into account (Haberl 2001). DEC much better allows for a comparison across
longer phases of history.

24
Based upon distinctions made by Sieferle (and others), the Viennese approach distinguishes
the following sociometabolic regimes (most recently in Krausmann and Fischer-Kowalski 2013):
The agrarian regime. It is based upon active (as opposed to passive, as with hunters &
gatherers) solar energy utilization. The active element consists in deliberately colonizing
terrestrial ecosystems, trying to concentrate solar energy conversion in plants useful for human
reproduction (as food and feed). Practically all energy depends on land use and the availability
of land (in some cases also fishing grounds). This allows a lifestyle at an energy consumption
level of up to 40 GJ/person and year and requires a large fraction of human labour (about 80%-
100% of the labour power of a population).
Figure 6 UK’s historical transition from an agrarian to an industrial regime: a
transition from biomass to fossil fuels as percentage of domestic energy
consumption (DEC)
Source: Krausmann et al. 2008b
The coal based industrial regime. Key feature of this regime is its ability to gain substantial
amounts of additional energy from fossil sources. This additional energy is technologically
translated into heat (for cooking and housing in urban centres) and later into mechanical power
such as the steam engine, railways and steamships, and steel production, thus creating a new
dimension of production, transportation and capital investment. The share of biomass in
domestic energy consumption (DEC) gradually declines to 20% or less, and the overall energy
level at this stage is at 50-150 GJ per person and year much higher than ever before in history.
The generation of mechanical power has at least partially become independent from humans
and animals. While agrarian societies can only count on a relatively low annual turnover of
primary energy per unit of land area (average 40-70 GJ/ha); energy is more or less evenly
spread across space. In contrast, coal and later petroleum can be extracted from concentrated
large stocks and therefore, compared to agricultural energy regimes, need only minuscule
space for extraction and production. This decoupling of energy provision from land area
removed basic limits for biophysical growth inherent to agrarian societies.

25
The oil based industrial regime. This uses, on top of and in substitution of coal, petroleum,
technologically translated into car based mobility, and later aeroplanes. Electricity provides a
universally applicable and locally available form of energy; electric motors allow for the
mechanization of a wide variety of decentralized technical processes. Petroleum is also key to
the industrialization of agriculture (“green revolution”), providing tractors, mineral fertilizers and
pesticides, and creating the opportunity to substantially raise both land and labour productivity.
Compared to any other energy carrier known before, fossil fuels offer very favourable features.
One of the most important features is their very high energy density. While transport of biomass
as energy carrier is quite limited since the energy necessary for transportation exceeds the
energy contained in transported biomass already after short distances, fossil fuels contain a
high calorific value in relatively low weight. Thus fossil energy regimes enabled unprecedented
economic, but also physical growth. Growth in agrarian regimes is mainly population driven,
with the consequence that it generally leads to a decline in energy use per capita. In
comparison, industrial growth is based on both population growth and a surge in per capita use
of natural resources (Krausmann et al. 2008a).
Based on a number of historical and contemporary case studies, typical metabolic patterns for
agrarian and industrial regimes have been reconstructed. As apparent in Table 5, the socio-
ecological transition between the agrarian and the industrial regime implies an increase of per
capita DEC and domestic material consumption (DMC) by a factor of 3 – 5. During that process
the importance of biomass as energy source decreases from over 95% to around 10 - 30%, with
increasingly more fossil fuels being used. Absolute biomass consumption, though, does not
decrease, as it is directly linked to population size in the form of food demand (Steinberger et al.
2010), and the regime transition is associated with a demographic transition triggering strong
population growth and urbanization. Population densities increase by a factor of up to 10, while
the share of agricultural population decreases sharply, from over 90% to below 10% (see Table
5).
Table 5 Typical metabolic profiles of agrarian and industrial sociometabolic regimes
Parameter Unit Agrarian
regime
Industrial
regime Factor
Energy use (DEC)
per capita [GJ/cap/yr] 40 – 70 150 – 400 3 – 5
Material use (DMC)
per capita [t/cap/yr] 3 – 6 15 – 25 3 – 5
Biomass
(share of DEC) [%] >95% 10 – 30 % 0.1 – 0.3
Agricultural population
(share of total population) [%] >90% <10% 0.1
Population density
[cap/km²] <40 <400 3 - 10
Source: Krausmann et al. 2008a; Krausmann et al. 2008b
26
2.3 Historical socio-ecological transitions as experienced in
the UK, Austria, the USA and Japan
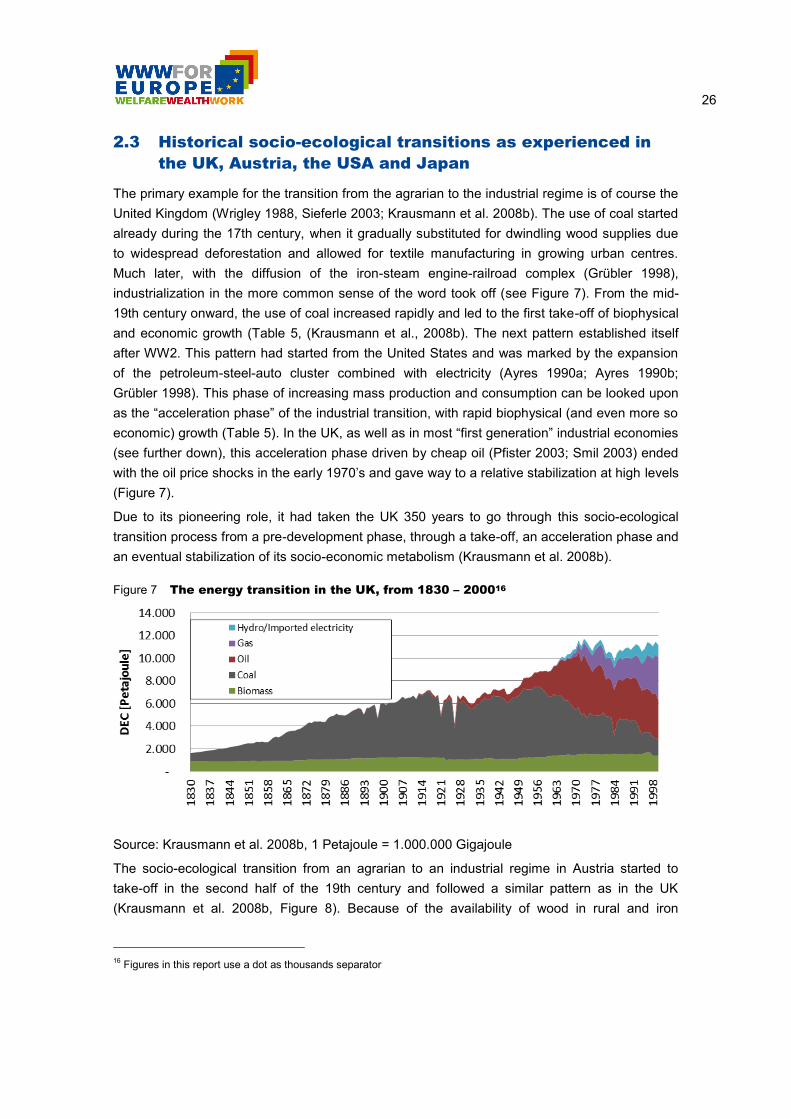
The primary example for the transition from the agrarian to the industrial regime is of course the
United Kingdom (Wrigley 1988, Sieferle 2003; Krausmann et al. 2008b). The use of coal started
already during the 17th century, when it gradually substituted for dwindling wood supplies due
to widespread deforestation and allowed for textile manufacturing in growing urban centres.
Much later, with the diffusion of the iron-steam engine-railroad complex (Grübler 1998),
industrialization in the more common sense of the word took off (see Figure 7). From the mid-
19th century onward, the use of coal increased rapidly and led to the first take-off of biophysical
and economic growth (Table 5, (Krausmann et al., 2008b). The next pattern established itself
after WW2. This pattern had started from the United States and was marked by the expansion
of the petroleum-steel-auto cluster combined with electricity (Ayres 1990a; Ayres 1990b;
Grübler 1998). This phase of increasing mass production and consumption can be looked upon
as the “acceleration phase” of the industrial transition, with rapid biophysical (and even more so
economic) growth (Table 5). In the UK, as well as in most “first generation” industrial economies
(see further down), this acceleration phase driven by cheap oil (Pfister 2003; Smil 2003) ended
with the oil price shocks in the early 1970‟s and gave way to a relative stabilization at high levels
(Figure 7).
Due to its pioneering role, it had taken the UK 350 years to go through this socio-ecological
transition process from a pre-development phase, through a take-off, an acceleration phase and
an eventual stabilization of its socio-economic metabolism (Krausmann et al. 2008b).
Figure 7 The energy transition in the UK, from 1830 – 200016
Source: Krausmann et al. 2008b, 1 Petajoule = 1.000.000 Gigajoule
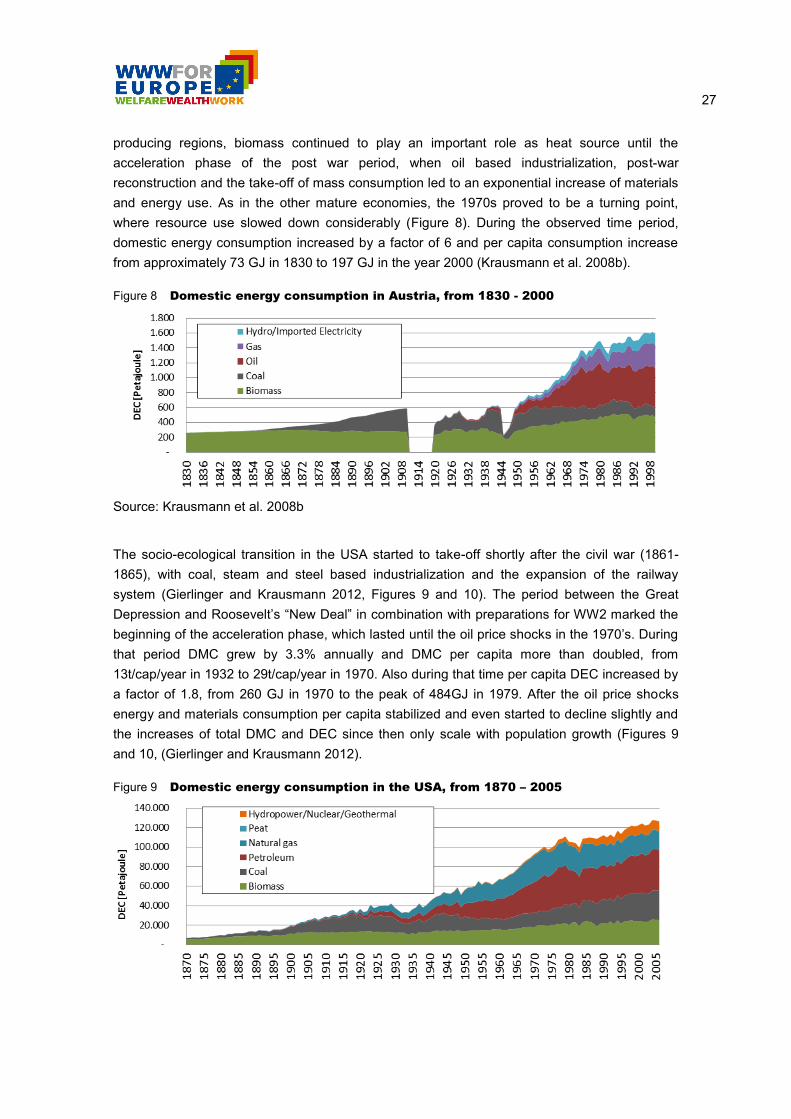
The socio-ecological transition from an agrarian to an industrial regime in Austria started to
take-off in the second half of the 19th century and followed a similar pattern as in the UK
(Krausmann et al. 2008b, Figure 8). Because of the availability of wood in rural and iron
16
Figures in this report use a dot as thousands separator
27
producing regions, biomass continued to play an important role as heat source until the
acceleration phase of the post war period, when oil based industrialization, post-war
reconstruction and the take-off of mass consumption led to an exponential increase of materials
and energy use. As in the other mature economies, the 1970s proved to be a turning point,
where resource use slowed down considerably (Figure 8). During the observed time period,
domestic energy consumption increased by a factor of 6 and per capita consumption increase
from approximately 73 GJ in 1830 to 197 GJ in the year 2000 (Krausmann et al. 2008b).
Figure 8 Domestic energy consumption in Austria, from 1830 - 2000
Source: Krausmann et al. 2008b
The socio-ecological transition in the USA started to take-off shortly after the civil war (1861-
1865), with coal, steam and steel based industrialization and the expansion of the railway
system (Gierlinger and Krausmann 2012, Figures 9 and 10). The period between the Great
Depression and Roosevelt‟s “New Deal” in combination with preparations for WW2 marked the
beginning of the acceleration phase, which lasted until the oil price shocks in the 1970‟s. During
that period DMC grew by 3.3% annually and DMC per capita more than doubled, from
13t/cap/year in 1932 to 29t/cap/year in 1970. Also during that time per capita DEC increased by
a factor of 1.8, from 260 GJ in 1970 to the peak of 484GJ in 1979. After the oil price shocks
energy and materials consumption per capita stabilized and even started to decline slightly and
the increases of total DMC and DEC since then only scale with population growth (Figures 9
and 10, (Gierlinger and Krausmann 2012).
Figure 9 Domestic energy consumption in the USA, from 1870 – 2005
28
Source: Gierlinger and Krausmann 2012
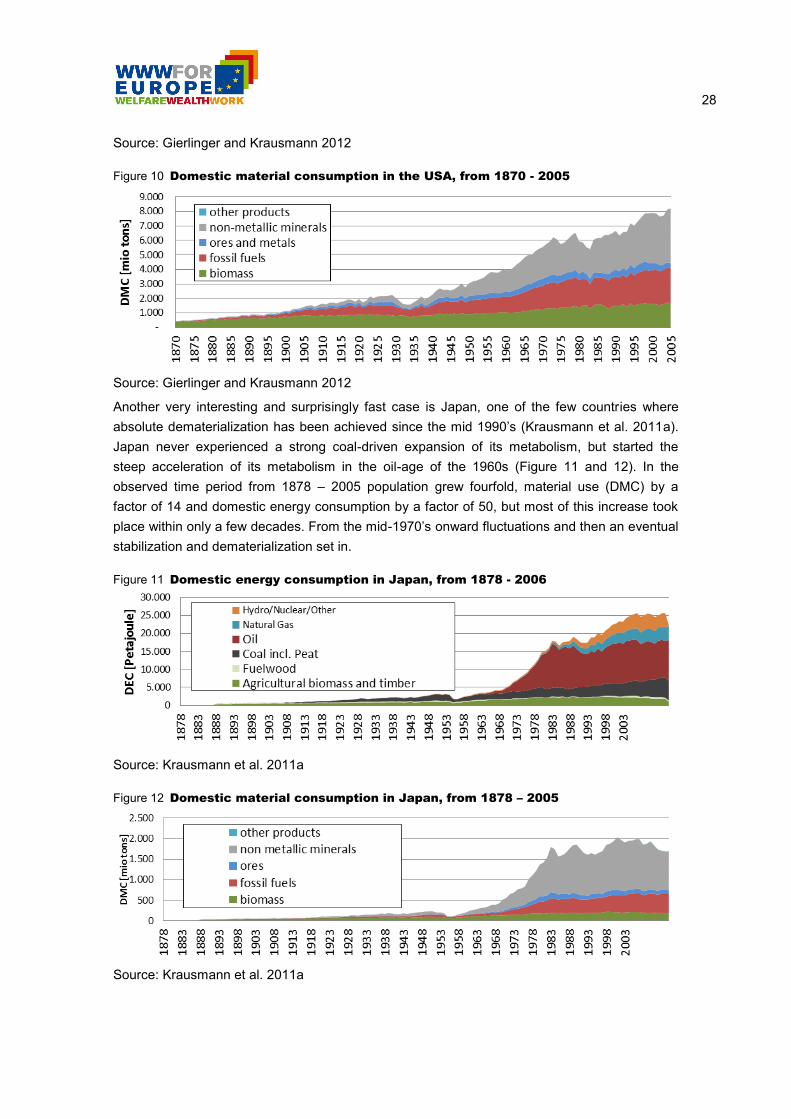
Figure 10 Domestic material consumption in the USA, from 1870 - 2005
Source: Gierlinger and Krausmann 2012
Another very interesting and surprisingly fast case is Japan, one of the few countries where
absolute dematerialization has been achieved since the mid 1990‟s (Krausmann et al. 2011a).
Japan never experienced a strong coal-driven expansion of its metabolism, but started the
steep acceleration of its metabolism in the oil-age of the 1960s (Figure 11 and 12). In the
observed time period from 1878 – 2005 population grew fourfold, material use (DMC) by a
factor of 14 and domestic energy consumption by a factor of 50, but most of this increase took
place within only a few decades. From the mid-1970‟s onward fluctuations and then an eventual
stabilization and dematerialization set in.
Figure 11 Domestic energy consumption in Japan, from 1878 - 2006
Source: Krausmann et al. 2011a
Figure 12 Domestic material consumption in Japan, from 1878 – 2005
Source: Krausmann et al. 2011a

29
The “historical” transition from an agrarian to an industrial regime as exemplified in these case
studies has led to a certain metabolic saturation in most high income OECD countries, at very
high per capita levels of energy and materials use, or just slow increases due to on-going
population growth. Some selected countries like Japan, Germany and the UK even exhibit
slightly declining levels of resource use (Gierlinger and Krausmann2012; Krausmann et al.,
2011a; Weisz et al. 2006).17
In chapter 2.5 we will make an attempt to more clearly identify the
point in time when this saturation (or even decline) in resource use set in, as a first
approximation to understanding its causes.
Figure 13 Overview: The sociometabolic transition in the UK, USA, Austria and Japan,
from 1750 – 2000, in relation to changes in GDP
Sources: Krausmann et al. 2008b;; Gierlinger and Krausmann 2012; Krausmann et al. 2011a
Pallua 2013 and Maddison 2008 for GDP and population estimates
As demonstrated in Figure 13 on a per capita base (in order to eliminate the population growth
effect), in all four case studies of high income countries the apparent saturation in resource use
occurs irrespective of a further steep increase in income. From the 1970s onward, there is
substantial “decoupling” between income and domestic materials and energy use. As this holds
not just for the four case studies for which we have long term data, but for a large majority of
high income countries (see chapter 2.4), this per capita saturation of resource consumption
even shows on the global level, for the period 1970-2000 (see figure 14).
17
For the potential role of outsourcing and international trade in allowing for a reduction in domestic resource use per
person, see chapter 3.

30
Figure 14 Phases of global per capita materials and energy use during the 20th
century.
Source: after Krausmann et al. 2009
While we can identify, for high income industrial countries, a “1970s syndrome” that still holds18
,
the global resource consumption from the year 2000 onward is again marked by a steep incline.
This incline, as we will show in the next chapter, is due to the rest of the world, in particular
large “emerging” economies.
2.4 Ongoing transitions from the agrarian to the industrial
regime: the “insurrection of the South” (UNDP)
During the same period, a number of developing countries turn into “emerging economies” and
choose the same materially and energetically intensive fossil fuels based pathway as the “old”
industrial economies had (see for example the recent report on Asia and the Pacific by UNEP
2011b).
Thus in effect this was not a “historical” socio-ecological transition. Currently, a substantial
number of countries comprising more than half of the world‟s population are following the same
transitional pathway at an accelerating pace.
From a global perspective, those countries are of special interest which are either in the
acceleration phase of the agrarian-industrial transition or do show clear signs of a take-off into
it.
18
In a next contribution to the WWW project (WP 201), we will analyse the “1970s syndrome” more deeply.
31
For an illustration, we pick the countries that the economists of Goldman Sachs in their Global
Economic Outlooks identified as BRIC and Next-11 countries and attributed them the potential
to match or even overtake the G7 economies (USA, Germany, UK, Canada, France, Italy,
Japan) in terms of absolute economic activity (GDP) and create an overall impact on the world
economy. These countries have been identified based on a “Growth Environment Score”,
consisting of 13 sub-indices grouped into indicators covering 1) macroeconomic stability
(inflation, government deficit, external debt), 2) macroeconomic conditions (investment rates,
openness of the economy), 3) technological capabilities (penetration of PCs, phones, internet),
4) human capital (education, life expectancy) and 5) political conditions (political stability, rule of
law, corruption) (O'Neill et al. 2005).
The BRICs are chosen because of their relative share of world GDP making them the largest
economies next to the G7 already (especially when PPP standards are used, see (Wilson and
Purushothaman 2003). In combination with optimistic prospects for a continuation of their
relatively high growth rates, the BRIC countries are expected to overtake the G7 in terms of
world GDP shares over the next decades (O'Neill et al. 2005; Wilson and Purushothaman
2003).
The so called Next-11 countries have also been identified as having large economic growth
potential, again depending on large populations and labour force dynamics. The Next-11‟s
contribution to global economic growth is increasing slowly across the whole group (Wilson and
Stupnytska 2007). All of the N11 have the capacity to grow at about 4% or more over the next
20 years (ibid. 2007, p. 4) and show potential to rival or even overtake some of the G7 countries
until 2050 (ibid. 2007, p. 10).
If we accept the Goldman-Sachs classification of economic dynamics and group the BRIC and
the Next-11 countries together as “emerging economies”, we can compare their sociometabolic
profiles with the mature industrial countries. All countries not covered as mature industrial or
emerging economies are for the purpose of this report subsumed as “rest of the world” (RoW).
The group of mature industrial countries as a whole has on average a per capita DEC of 277 GJ
and per capita DMC of 17 tons, while for all the emerging economies a per capita DEC of on
average 79 GJ and per capita DMC of 7 tons has been calculated (Table 6). According to a
sociometabolic regime classification, India, Indonesia, Bangladesh and Nigeria are still very
close to the agrarian pattern. India and Indonesia, according to a recent report on Asian and the
Pacific countries (UNEP 2011b) display signs of take-off not only in economic, but also in
biophysical terms. If all these “emerging economies” (that comprise almost 60% of the world
population) adjust their metabolic rates to the pattern of mature industrial economies, it would
mean a tripling of their annual per capita energy and material resource consumption. This would
imply an unprecedented explosion of anthropogenic global resource use, by far surpassing all
impacts demonstrated for the “historical” sociometabolic transition of the already mature
industrial countries.
Exactly such a process is already under way, as we will demonstrate in the following section for
a few selected cases, namely China, India and Brazil.
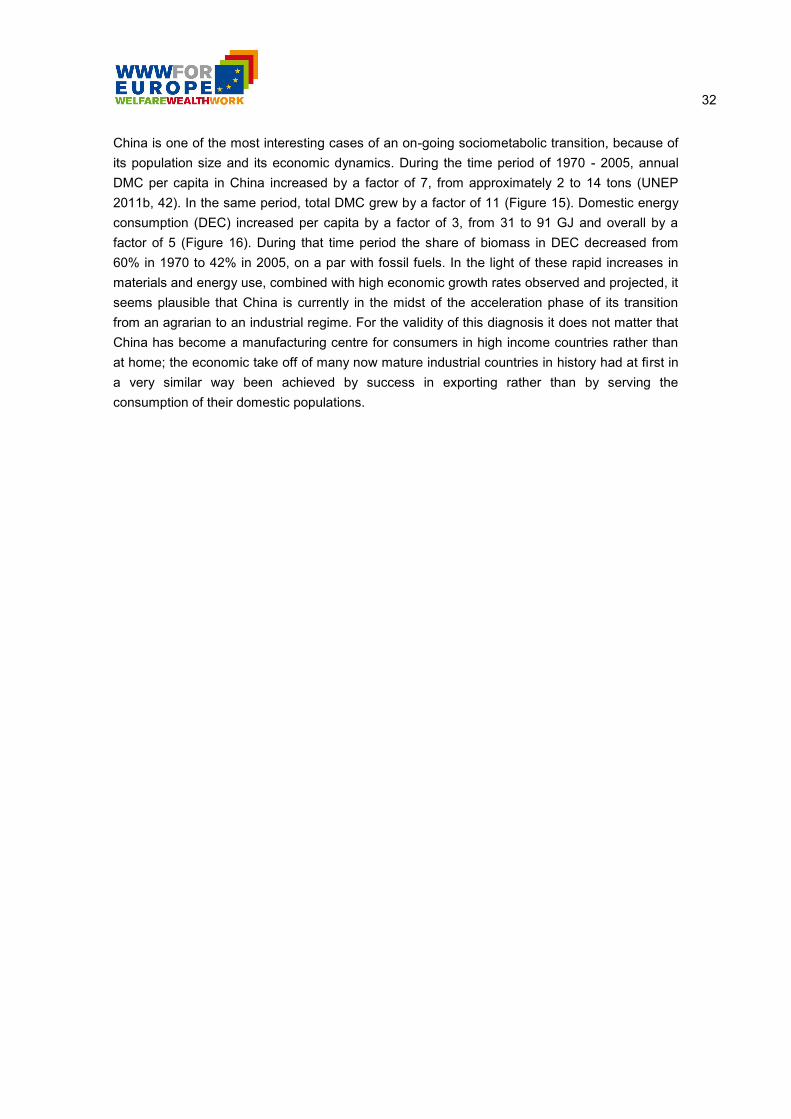
32
China is one of the most interesting cases of an on-going sociometabolic transition, because of
its population size and its economic dynamics. During the time period of 1970 - 2005, annual
DMC per capita in China increased by a factor of 7, from approximately 2 to 14 tons (UNEP
2011b, 42). In the same period, total DMC grew by a factor of 11 (Figure 15). Domestic energy
consumption (DEC) increased per capita by a factor of 3, from 31 to 91 GJ and overall by a
factor of 5 (Figure 16). During that time period the share of biomass in DEC decreased from
60% in 1970 to 42% in 2005, on a par with fossil fuels. In the light of these rapid increases in
materials and energy use, combined with high economic growth rates observed and projected, it
seems plausible that China is currently in the midst of the acceleration phase of its transition
from an agrarian to an industrial regime. For the validity of this diagnosis it does not matter that
China has become a manufacturing centre for consumers in high income countries rather than
at home; the economic take off of many now mature industrial countries in history had at first in
a very similar way been achieved by success in exporting rather than by serving the
consumption of their domestic populations.

33
Table 6 Metabolic profiles of the country groups and selected cases (2005)
Sources: Data compiled from Krausmann et al. 2009; Steinberger et al. 2010; Krausmann et al.
2011a; Gierlinger and Krausmann 2011; Schandl et al. 2008; Gonzalez-Martinez and Schandl
2008; Maddison 2008; CSIRO 2011; Mayer 2010; Singh et al. 2012
0 100 200 300 400 500
Austria
Denmark
France
Germany
Greece
Italy
Netherlands
Japan
Norway
Portugal
Spain
UK
USA
Ireland
Mature industrial (average, n=31)
Brazil
China
India
Indonesia
Nigeria
Philippines
Turkey
Emerging econ. (average, n=14)
EU27
EU12
EU15
GJ per capita
Domestic energy consumption per capita (DEC)
share of global population: 60%
share of global population: 15%
0 10 20 30
Austria
Denmark
France
Germany
Greece
Italy
Netherlands
Japan
Norway
Portugal
Spain
UK
USA
Ireland
Mature industrial…
Brazil
China
India
Indonesia
Nigeria
Philippines
Turkey
Emerging econ.…
EU27
EU12
EU15
Tons per capita
Domestic material consumption per capita
(DMC)
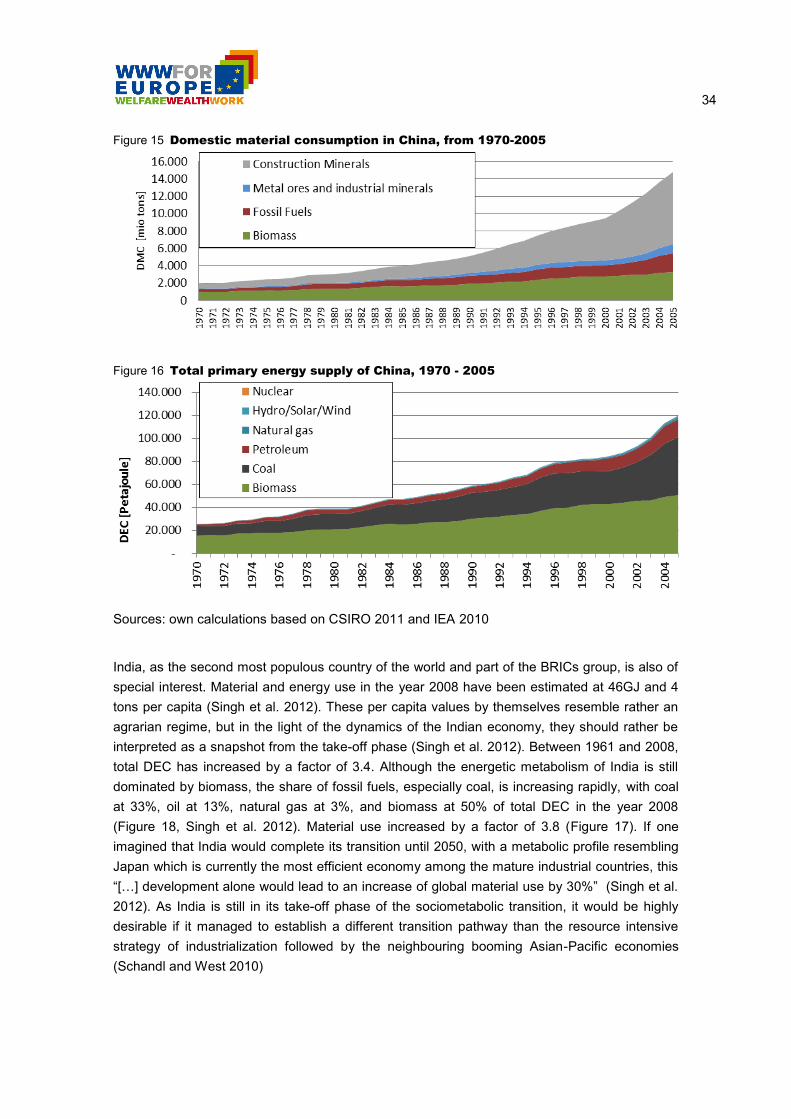
34
Figure 15 Domestic material consumption in China, from 1970-2005
Figure 16 Total primary energy supply of China, 1970 - 2005
Sources: own calculations based on CSIRO 2011 and IEA 2010
India, as the second most populous country of the world and part of the BRICs group, is also of
special interest. Material and energy use in the year 2008 have been estimated at 46GJ and 4
tons per capita (Singh et al. 2012). These per capita values by themselves resemble rather an
agrarian regime, but in the light of the dynamics of the Indian economy, they should rather be
interpreted as a snapshot from the take-off phase (Singh et al. 2012). Between 1961 and 2008,
total DEC has increased by a factor of 3.4. Although the energetic metabolism of India is still
dominated by biomass, the share of fossil fuels, especially coal, is increasing rapidly, with coal
at 33%, oil at 13%, natural gas at 3%, and biomass at 50% of total DEC in the year 2008
(Figure 18, Singh et al. 2012). Material use increased by a factor of 3.8 (Figure 17). If one
imagined that India would complete its transition until 2050, with a metabolic profile resembling
Japan which is currently the most efficient economy among the mature industrial countries, this
“[…] development alone would lead to an increase of global material use by 30%” (Singh et al.
2012). As India is still in its take-off phase of the sociometabolic transition, it would be highly
desirable if it managed to establish a different transition pathway than the resource intensive
strategy of industrialization followed by the neighbouring booming Asian-Pacific economies
(Schandl and West 2010)

35
Figure 17 Domestic Energy Consumption in India, from 1961 - 2008
Source: own calculations, based on Singh et al. 2012 and IEA 2010
Figure 18 The sociometabolic transition in India, from 1961 – 2008
Source: Singh et al. 2012
The sociometabolic transition in Brazil follows a slightly mixed pathway of industrialization, with
a large share of biomass in the DEC due to high land-availability, which allows for the large
scale production of modern biofuels and cash crops dedicated to export (Mayer 2010). Per
capita DEC and DMC for the year 2005 have been estimated at 125 GJ and 13.4 tons,
respectively. During the observed time period from 1970 - 2005, overall DMC grew by a factor of
3.5, while total DEC increased by a factor of 2.8. The time series of the metabolic profile of
Brazil suggests that it is within the acceleration phase of the sociometabolic transition (Figures
19 and 20), but continuing to rely on an untypically high share of biomass.
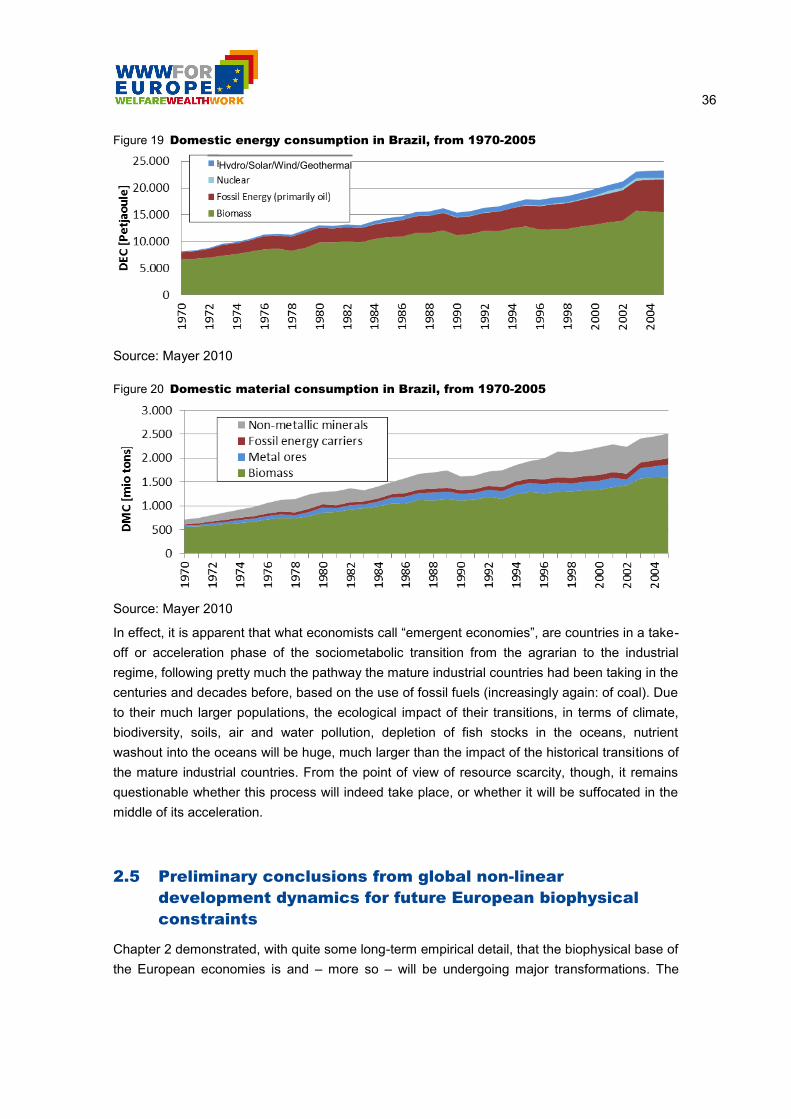
36
Figure 19 Domestic energy consumption in Brazil, from 1970-2005
Source: Mayer 2010
Figure 20 Domestic material consumption in Brazil, from 1970-2005
Source: Mayer 2010
In effect, it is apparent that what economists call “emergent economies”, are countries in a take-
off or acceleration phase of the sociometabolic transition from the agrarian to the industrial
regime, following pretty much the pathway the mature industrial countries had been taking in the
centuries and decades before, based on the use of fossil fuels (increasingly again: of coal). Due
to their much larger populations, the ecological impact of their transitions, in terms of climate,
biodiversity, soils, air and water pollution, depletion of fish stocks in the oceans, nutrient
washout into the oceans will be huge, much larger than the impact of the historical transitions of
the mature industrial countries. From the point of view of resource scarcity, though, it remains
questionable whether this process will indeed take place, or whether it will be suffocated in the
middle of its acceleration.
2.5 Preliminary conclusions from global non-linear
development dynamics for future European biophysical
constraints
Chapter 2 demonstrated, with quite some long-term empirical detail, that the biophysical base of
the European economies is and – more so – will be undergoing major transformations. The
Hydro/Solar/Wind/Geothermal

37
long-term perspective is useful because it shows that these transformations, beyond the crisis
that currently draws so much attention, play on an unprecedented historical scale.
The sociometabolic transitions on-going in emerging economies in combination with relatively
stable but quite high levels of resource consumption in the mature industrial countries reflect
themselves as increasing pressure on the world‟s resources, leading to “the most extended and
steepest boom of commodity prices ever” (World Bank 2009). With a short interruption by the
economic crisis 2007/08, commodity prices keep rising since the beginning of the 21st century
(Figure 21). This is of major importance, as the past sociometabolic transitions of the mature
industrial countries have all happened in a global context of easily available fossil fuels and
plenty of commodity frontiers for further exploitation (Bunker and Ciccantelli 2005; Bunker
2003). But this global context has changed and will be quite different in the future.
Figure 21 Global commodity prices in constant prices, year 2000 $
Source: WorldBank (2009)
The German WBGU‟s flagship report “World in Transition” came to similar conclusions: “The
idea that all people should be able to enjoy a lifestyle that equals today‟s predominant lifestyle
in the industrialised countries, characterised by the use of fossil energy carriers, cannot be
realised. To avoid non-sustainable development paths, the developing and newly industrialising
countries would have to leapfrog technological development stages. The industrial countries
should therefore lead the way off current development paths to demonstrate that it is also
possible to follow sustainable paths. A lifestyle must be found that is consistent with the guiding
principle of global sustainable development. It must also allow the catch-up development of
poorer countries, equally guided by the criteria of global sustainability, and allow for inclusion of
the so far excluded „bottom billion‟.” (WBGU 2011, p. 62).
This fundamentally changed global context and the need for systemic changes in policy and
institutional settings have also been acknowledged by several other major institutions regularly
reporting on the state of the world and the world-economy.
UNEP, for example, states in its recent report on the green economy: “Indeed, most economic
development and growth strategies encouraged rapid accumulation of physical, financial and
human capital, but at the expense of excessive depletion and degradation of natural capital,
which includes our endowment of natural resources and ecosystems. By depleting the world‟s
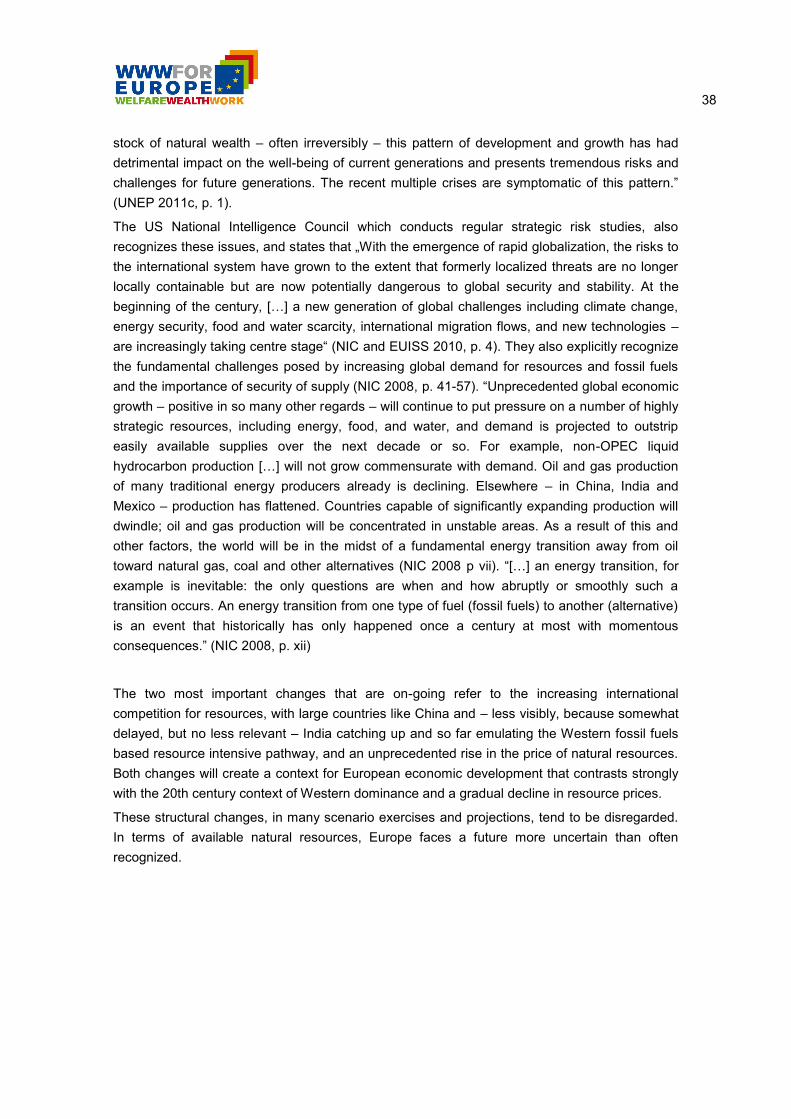
38
stock of natural wealth – often irreversibly – this pattern of development and growth has had
detrimental impact on the well-being of current generations and presents tremendous risks and
challenges for future generations. The recent multiple crises are symptomatic of this pattern.”
(UNEP 2011c, p. 1).
The US National Intelligence Council which conducts regular strategic risk studies, also
recognizes these issues, and states that „With the emergence of rapid globalization, the risks to
the international system have grown to the extent that formerly localized threats are no longer
locally containable but are now potentially dangerous to global security and stability. At the
beginning of the century, […] a new generation of global challenges including climate change,
energy security, food and water scarcity, international migration flows, and new technologies –
are increasingly taking centre stage“ (NIC and EUISS 2010, p. 4). They also explicitly recognize
the fundamental challenges posed by increasing global demand for resources and fossil fuels
and the importance of security of supply (NIC 2008, p. 41-57). “Unprecedented global economic
growth – positive in so many other regards – will continue to put pressure on a number of highly
strategic resources, including energy, food, and water, and demand is projected to outstrip
easily available supplies over the next decade or so. For example, non-OPEC liquid
hydrocarbon production […] will not grow commensurate with demand. Oil and gas production
of many traditional energy producers already is declining. Elsewhere – in China, India and
Mexico – production has flattened. Countries capable of significantly expanding production will
dwindle; oil and gas production will be concentrated in unstable areas. As a result of this and
other factors, the world will be in the midst of a fundamental energy transition away from oil
toward natural gas, coal and other alternatives (NIC 2008 p vii). “[…] an energy transition, for
example is inevitable: the only questions are when and how abruptly or smoothly such a
transition occurs. An energy transition from one type of fuel (fossil fuels) to another (alternative)
is an event that historically has only happened once a century at most with momentous
consequences.” (NIC 2008, p. xii)
The two most important changes that are on-going refer to the increasing international
competition for resources, with large countries like China and – less visibly, because somewhat
delayed, but no less relevant – India catching up and so far emulating the Western fossil fuels
based resource intensive pathway, and an unprecedented rise in the price of natural resources.
Both changes will create a context for European economic development that contrasts strongly
with the 20th century context of Western dominance and a gradual decline in resource prices.
These structural changes, in many scenario exercises and projections, tend to be disregarded.
In terms of available natural resources, Europe faces a future more uncertain than often
recognized.
39
3. Towards resource use scenarios for Europe
3.1 UNEP’s global resource use scenarios
UNEP‟s International Resource Panel published a report in 2011 assessing the potential of
decoupling resource use and environmental impacts from economic growth. On a global level,
this report presents a similar picture of the dynamics of resource use during the 20th century as
we have been showing in the earlier chapters. The main conclusion provided was that although
a decoupling between resource use and GDP could be observed, this did not prevent global
annual resource extraction from skyrocketing (materials: an eightfold increase, energy a tenfold
increase in the course of this one century). A more detailed analysis by groups of countries
according to their development status revealed that it was the increasing per capita resource
use that mainly had been driving the rising resource consumption of high income countries
while it was rather population growth that had been driving resource use of developing
countries. In the last two decades though a substantial catch-up of developing countries in
terms of per-capita consumption took place – a convergence process of sociometabolic patterns
towards the level of high income industrial countries. This triggered a new acceleration in
annual global resource extraction that would, if convergence to this level continued (a
continuation of observed trends), imply a tripling of global annual extraction of material
resources, with the severest environmental consequences. They find that this scenario
“probably represents an unsustainable future in terms of both resource use and emissions,
exceeding all measures of available resources and assessments of limits to the capacity to
absorb impacts.” (UNEP 2011a, p. 29). On the other hand, a global convergence of
sociometabolic rates is considered welcome from the standpoint of international equity. The
scenarios constructed are supposed to respond to this dilemma: achieve global equity while not
transgressing environmental boundaries.
The scenario calculations were based on an analysis of past sociometabolic data in which,
besides income, population density proved to be very relevant for a country‟s metabolic rate,
independent of economic development: the higher the population density, the lower the
metabolic rate at the same level of income. In each scenario, this difference by population
density was also maintained for the future, while population dynamics was drawn from UN-
estimates (medium variant). For the process of convergence of developing with industrial
countries it was also assumed that the composition of material resources used would emulate
the current industrial pattern, i.e. a transition from biomass-based to fossil fuel based energy
sources, and a substantial rise of the amount and share of metals and minerals would occur.
The three scenarios are:
1. The trend scenario, assuming high income industrial countries to maintain their per capita
resource consumption, and developing countries to increase their consumption rates to the
same level until 2050. This would lead to a tripling of global annual resource extraction by 2050
at a world average metabolic rate of 16t/cap*year (13t for high density, 24t for low density
countries);
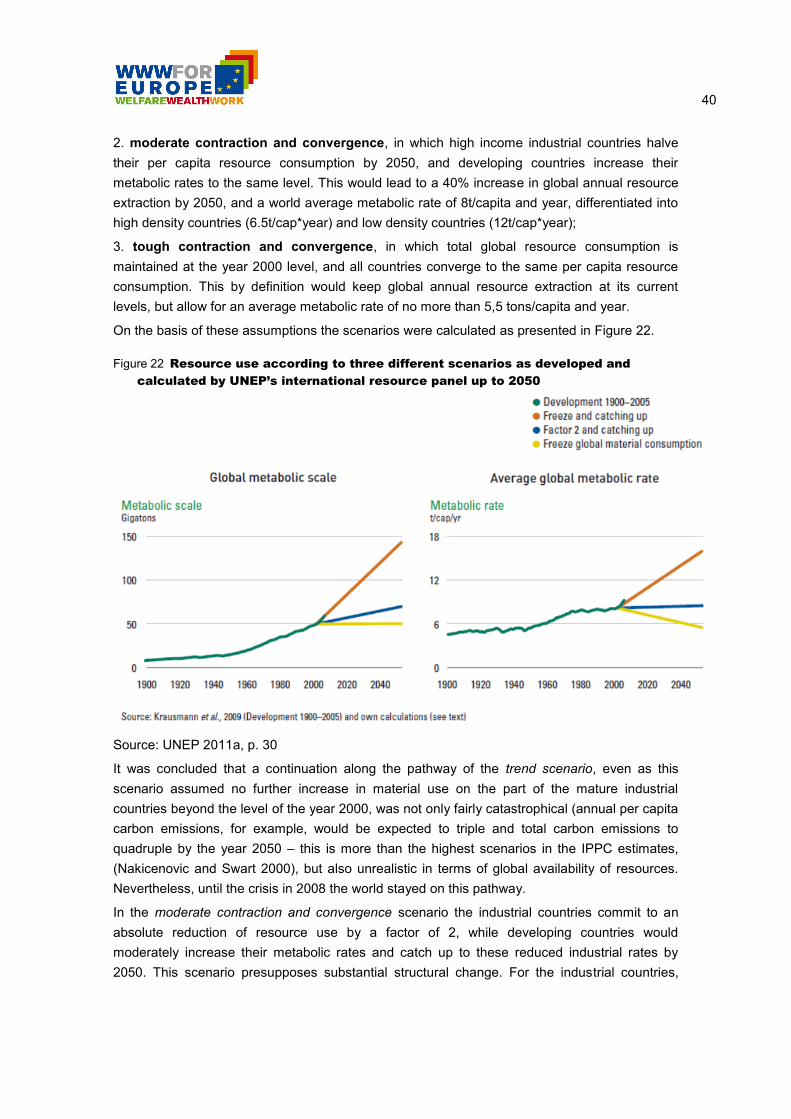
40
2. moderate contraction and convergence, in which high income industrial countries halve
their per capita resource consumption by 2050, and developing countries increase their
metabolic rates to the same level. This would lead to a 40% increase in global annual resource
extraction by 2050, and a world average metabolic rate of 8t/capita and year, differentiated into
high density countries (6.5t/cap*year) and low density countries (12t/cap*year);
3. tough contraction and convergence, in which total global resource consumption is
maintained at the year 2000 level, and all countries converge to the same per capita resource
consumption. This by definition would keep global annual resource extraction at its current
levels, but allow for an average metabolic rate of no more than 5,5 tons/capita and year.
On the basis of these assumptions the scenarios were calculated as presented in Figure 22.
Figure 22 Resource use according to three different scenarios as developed and
calculated by UNEP’s international resource panel up to 2050
Source: UNEP 2011a, p. 30
It was concluded that a continuation along the pathway of the trend scenario, even as this
scenario assumed no further increase in material use on the part of the mature industrial
countries beyond the level of the year 2000, was not only fairly catastrophical (annual per capita
carbon emissions, for example, would be expected to triple and total carbon emissions to
quadruple by the year 2050 – this is more than the highest scenarios in the IPPC estimates,
(Nakicenovic and Swart 2000), but also unrealistic in terms of global availability of resources.
Nevertheless, until the crisis in 2008 the world stayed on this pathway.
In the moderate contraction and convergence scenario the industrial countries commit to an
absolute reduction of resource use by a factor of 2, while developing countries would
moderately increase their metabolic rates and catch up to these reduced industrial rates by
2050. This scenario presupposes substantial structural change. For the industrial countries,

41
achieving a factor 2 reduction would imply resource productivity gains just triggered by resource
use reductions of about 2% annually (which is within the range of the productivity gains of the
past decades), net of any income-based rebound effects (Greening et al. 2000).
The tough scenario of contraction and convergence mainly illustrates how far one needs to go if
humanity‟s burden upon the environment should not exceed present (already high, and in some
ways too high) levels. As a policy goal such tough constraints hardly would be accepted.
These scenarios are useful as they are based upon indicators that deliver fairly comprehensive
information on resources required and used by economies. They also illustrate that European
resource use levels play a double role: as relevant share in global resource consumption, and
as a model for the developing world to emulate. In the longer run, this is also self-defeating: it
nourishes competition over the world‟s limited resource base and speeds up its depletion.
3.2 Resource use scenarios for Europe
Our efforts now are directed at constructing resource use scenarios for Europe that comply with
the spirit of UNEP‟s global scenarios. The European countries are only part of the “high income
industrial countries” figuring in UNEP‟s scenarios, and they are distinct both in current metabolic
rates and in population density (particularly from other large parts such as the US, Canada and
Australia). On the other hand, there is a certain internal heterogeneity that needs to be taken
account of in order to achieve sufficiently analogous results.
For the development of European resource use scenarios we can build on the global scenario
assumptions in two ways:
a) the observation that high income countries have experienced a saturation of their domestic
material consumption over the last decades (see chapter 2 of this report) and
b) the observation that this saturation takes place at much higher levels for countries with low
population density than for high density countries.
Since European countries, except for some of the new member states, are high income
industrial countries by UNEP‟s definition, we need to review the empirical data if both the
saturation and population density hypotheses formulated at the global level hold true for Europe
as well. Such an empirical analysis of past material use patterns in Europe would provide us
with a sound background for developing and calculating scenarios (chapter 3.2.1)
We will then proceed in analogy to UNEP‟s scenarios and develop a trend or business as usual
scenario, a scenario of freezing the present levels of material use and one transformation
scenario corresponding to the above scenario 2 of moderate contraction and convergence. We
add a best practice scenario which uses the strongest resource use reductions of some
countries as a general tendency for all EU 27 countries. Chapter 3.2 will describe these
scenarios and their assumptions. Chapter 3.3 will discuss the scenario results.
We will present our resource scenarios for the EU 27 on the aggregate level since this is the
level of analysis the macroeconomic model will use. Furthermore in constructing resource use
scenarios we are challenged with a transition away from fossil fuels. What we know is that there
exist manifold and strong interlinkages between energy and materials. At the same time due to
42
the fundamental structural change future developments cannot be deducted from past
observations. Thus insights based on internal consistency of the past might only be partially
useful since shifting energy sources might change resource use patterns - especially the
proportion of the various material categories. We trust that the sum total as aggregate is the
best indicator to capture various substitution effects as they might happen in such a transition.
In some analytical steps we include Norway and Switzerland into our analysis since the
domestic material consumption of these countries is closely interlinked with EU 27 and they can
provide a broader basis when discussing country clusters.
3.2.1 Income and resource use patterns in Europe over the last
decades
For the discussion of resource use patterns the official Eurostat data are the first choice. This
online database offers data on domestic material extraction (DE), on imports and exports (both
intra and extra EU trade) and on the domestic material consumption (DMC) from the year 2000
onward for each of the EU 27 countries and for the EU 27 as an aggregate. We will rely on
these data for analysing the clustering of countries and for discussing the different levels of
resource consumption in dependency from population density.
For analysing longer term patterns we need to refer to a second source: Weisz et al. (2005)
presents the indicators direct material input (DMI), domestic material consumption (DMC) and
physical trade balance (PTB) for EU 15 countries (but not for the new member states) for the
period 1970 to 2000 and analysed their trends and patterns in relation to population and GDP.
This data set was later extended up to 2004 (Krausmann et al. 2011b). A comparison of these
data with the Eurostat source reveals differences: Eurostat data are always about 5% higher
than the data from the SEC data base. For discussing the longer term trend of material
consumption in the EU15 countries this difference can be neglected..
In terms of the classification UNEP is using, EU27 countries are heterogeneous: there are major
differences both in income and in population density. While all of EU15 may be considered as
high income countries, the 12 New Member States have substantially lower income, and also
display patterns of resource use more closely related to what UNEP classifies as “developing”
(see also the analysis of Moll et al. (2012)). In the time period documented by data (i.e. between
the year 2000 and the year 2009) the new member states, can be characterized by a small rise
in income, but a strong rise in their metabolic rates, even beyond the level of EU15 (see Figures
23 and 24). We assume the increasing metabolic rates to be a temporary phenomenon due to
enhanced investments in infrastructure in the course of the accession process. This kind of
temporary overshoot may happen also in emerging economies. In our scenario calculations we
will therefore deal with them in analogue to the treatment of developing countries in the UNEP
scenarios: we will assume a gradual convergence with EU15 (see also Rapacki and Próchniak
(2009).

43
In Figure 23 we present GDP and DMC data from Eurostat (2013a) for EU 15 plus Norway and
Switzerland (the latter as countries associated with the EU) and the new member states for the
years 2000, 2005 and 2009.
Figure 23 Resource use and income in Europe, 2000, 2005, 2009 (DMC/cap, GDP/cap)
Source: Eurostat 2013a
Figure 24 shows the average per capita material consumption for EU15 countries with low and
high population density as well as for new member states with low and high population density.
The DMC/capita of EU15 high density countries has remained at about 15t/cap for the last three
decades. EU15 countries with low population density have as well by and large a stable
DMC/cap. Since this is a very small number of countries (see Table 7), the line is not as smooth
BG
CZ
RO
SI
SK
DE
EL
ES
FR
PT
UK
5
50
5.000 50.000
DM
C/c
ap (
log
scal
e)
GDP/cap (log scale)
2000
New member states
EU 15
BG CZ
RO
SI
SK DE EL
FR PT
UK
5
50
5.000 50.000
DM
C/c
ap (
log
scal
e)
GDP/cap (log scale)
2005
New member states
EU 15
BG SI
RO
CZ SK
DE EL FR
PT
UK
5
50
5.000 50.000
DM
C/c
ap (
log
scal
e)
GDP/cap (log scale)
2009
New member states
EU 15

44
as for the high density countries. In contrast to the more or less stabilized per capita DMC of
EU15 countries, the new member states are characterized by a high growth rate in per capita
DMC. This applies for both low and high density countries; the low density countries as
expected have a higher per capita DMC than the high density countries.
Figure 24 DMC per capita for EU15 and new member states by density class
Sources: for EU15 based on Weisz et al. 2005, Krausmann et al. 2011b; for new member states
Eurostat 2013a
Table 7 summarizes the structural differences within EU27 we have to take care of in our
scenario exercise. We create 4 country clusters for each of which we can make distinct
assumptions in line with the UNEP scenarios on the global level.
Table 7 Cross-classification of EU27 by income level and population density
associated with different metabolic growth patterns
Population density
Low density
(< 50 inhabitants per km2)
High density
(> 50 inhabitants per km2)
EU 15
Stable at 22-32 t/cap
(period 1970-2004)
NO, FI, SE
Stable at 15 t/cap
(period 1970-2004)
AT, BE, GE, FR, UK, IE, NL, DK, LU, EL, IT,
ES, PT
New member
states
Growing from 14 to 21 t/cap
(period 2000-2008)
LT, EE
Growing from 12 to 18 t/cap
(period 2000-2008)
BG, CZ, CY, LV, HU, MT, PL, RO, SI, SK
Sources: own calculations, based on Weisz et al. 2005, Krausmann et al. 2011b and Eurostat
2013a
45
3.2.2 Constructing European Resource Use Scenarios
The baseline for our scenario calculations is the material consumption as provided by Eurostat
for the year 2005. We did not use the year 2000 as our base year (as with UNEP 2011a), as in
this year data on the new member states are available for the first time. The year 2005 is the
latest available year with sufficiently reliable data for both groups of countries (data for this year
have already been used and cross-checked for several purposes). We did not choose a later
year as they soon are marked by the financial crises that induced a downward turn in resource
use dynamics that up to date is difficult to assess. It could be a once-off effect that will be
(over)compensated in the following years, or it could reduce material consumption for the EU27
in the long run.
Given this context we develop four scenarios:
Trend scenario
European high income countries maintain their per capita material consumption. Low density
transitional economies converge with the level of EU15 low density countries. High density
transitional economies still grow for a short period and then they reduce their per capita
consumption to the level of EU15 high density countries.
Rationale and assumptions
EU15 countries have already stabilised their domestic material consumption as shown in Figure
24. In the trend scenario they just continue with their 2005 per capita consumption. For
transitional economies, Rapacki and Próchniak (2009) investigate the economic convergence
with EU-15 by econometric tests and convergence analysis. According to their projections, the
process of real convergence between individual CEE-10 economies and the EU-15 may take
between 8 and 33 years. We assumed that the material consumption follows the economic
alignment. This means that new member states with low density catch up in terms of per capita
material consumption by the time the GDP according to Rapacki and Próchniak (2009) has
aligned with high income low density countries. Similarly we assumed that new member states
with high population density will match EU15 high density countries according to the timeframe
provided by Rapacki and Próchniak (2009). Since some of the high density new member states
had already higher DMC/cap values than the EU15 high density countries, we assumed a
slowing down of the growth phase till it reaches a plateau after a third of the time till full
economic convergence and then shrinks to the level of EU15 high density countries. This can
be justified by the necessary modernisation processes of infrastructure and industries. In the
DMC of these countries it can be seen in the increased material use in construction minerals
(see Figure 32 below). As soon as this one-time catching-up process of investments is
concluded the material consumption can shrink to the level of EU 15.
To calculate the total material consumption we multiplied the DMC/cap values with the UNPD‟s
population forecast (medium fertility variant, UNPD 2011).
Freezing scenario
All EU 27 countries freeze their per capita domestic material consumption at the level of the
year 2005.

46
Rationale and assumptions
This scenario is supposed to serve as a reference for the other scenarios. It is analogous to the
“high income” component in UNEP‟s trend scenario19
. The calculation just prolongs each
country‟s DMC/cap from 2005 till 2050. To calculate the total material consumption we
multiplied the DMC/cap values with the UNPD‟s population forecast (medium fertility variant,
UNPD 2011).
Best practice scenario
We assume the domestic material consumption per capita to decrease in all EU 27 countries as
in the countries with the strongest observed decline since 1970. The feasibility of this scenario
is justified by best practice of Germany, UK and France which developed their economies while
reducing their per capita material consumption at the same time.
Rationale and assumptions
Germany, UK and France as the biggest economies in Europe experienced a decrease of their
joint per capita domestic material consumption of about 28% over the period from 1970 to 2004.
This decrease was then applied to the baseline values of all EU 27 countries as an annual
percentage for the period 2006 to 2050. The assumption is that all European countries can
emulate these large economies with respect to shrinking material demands, while these
forerunners continue on their declining pathway.
Radical transformation scenario
The EU 27 halves its per capita domestic material consumption until 2050. This is done by a
simple geometric function applied to per capita material consumption rates of EU27 as a whole.
Rationale and assumptions
This is a simple application of the “contraction” rule used in the UNEP moderate contraction and
convergence scenario above, asking high income industrial countries to halve their metabolic
rates (while the rest of the world catches up to these rates). One could of course also apply a
linear function. In its “roadmap to a resource efficient Europe”, as we discuss in more detail
below, the European Commission adopted such a strategy as one of a number of variants.
19
UNEP uses the year 2000 as a reference year. Thus our scenario uses a slightly higher base level.
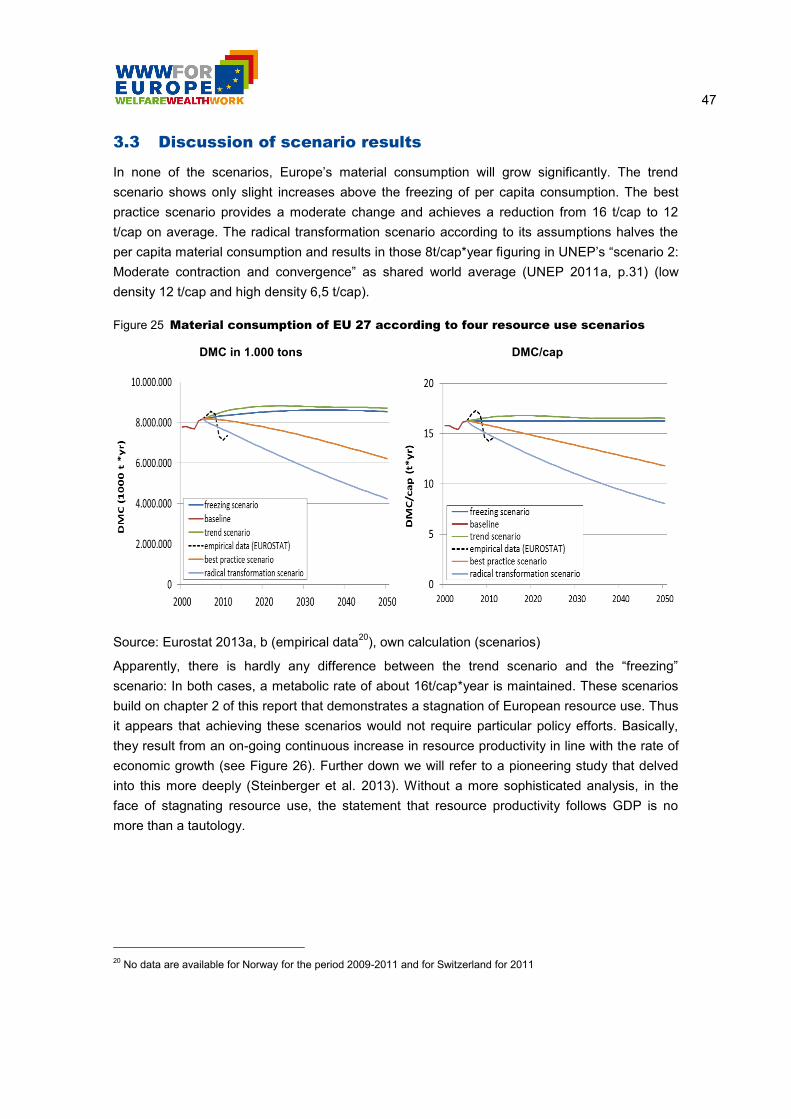
47
3.3 Discussion of scenario results
In none of the scenarios, Europe‟s material consumption will grow significantly. The trend
scenario shows only slight increases above the freezing of per capita consumption. The best
practice scenario provides a moderate change and achieves a reduction from 16 t/cap to 12
t/cap on average. The radical transformation scenario according to its assumptions halves the
per capita material consumption and results in those 8t/cap*year figuring in UNEP‟s “scenario 2:
Moderate contraction and convergence” as shared world average (UNEP 2011a, p.31) (low
density 12 t/cap and high density 6,5 t/cap).
Figure 25 Material consumption of EU 27 according to four resource use scenarios
DMC in 1.000 tons
DMC/cap
Source: Eurostat 2013a, b (empirical data20
), own calculation (scenarios)
Apparently, there is hardly any difference between the trend scenario and the “freezing”
scenario: In both cases, a metabolic rate of about 16t/cap*year is maintained. These scenarios
build on chapter 2 of this report that demonstrates a stagnation of European resource use. Thus
it appears that achieving these scenarios would not require particular policy efforts. Basically,
they result from an on-going continuous increase in resource productivity in line with the rate of
economic growth (see Figure 26). Further down we will refer to a pioneering study that delved
into this more deeply (Steinberger et al. 2013). Without a more sophisticated analysis, in the
face of stagnating resource use, the statement that resource productivity follows GDP is no
more than a tautology.
20
No data are available for Norway for the period 2009-2011 and for Switzerland for 2011
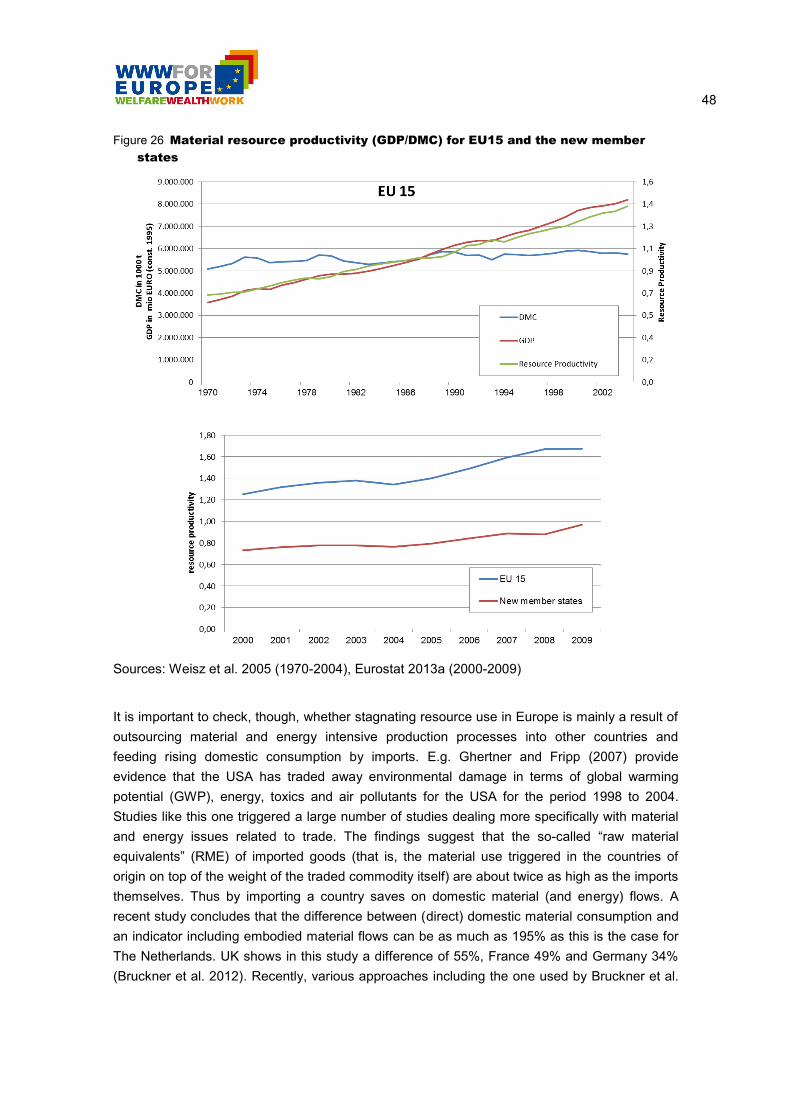
48
Figure 26 Material resource productivity (GDP/DMC) for EU15 and the new member
states
Sources: Weisz et al. 2005 (1970-2004), Eurostat 2013a (2000-2009)
It is important to check, though, whether stagnating resource use in Europe is mainly a result of
outsourcing material and energy intensive production processes into other countries and
feeding rising domestic consumption by imports. E.g. Ghertner and Fripp (2007) provide
evidence that the USA has traded away environmental damage in terms of global warming
potential (GWP), energy, toxics and air pollutants for the USA for the period 1998 to 2004.
Studies like this one triggered a large number of studies dealing more specifically with material
and energy issues related to trade. The findings suggest that the so-called “raw material
equivalents” (RME) of imported goods (that is, the material use triggered in the countries of
origin on top of the weight of the traded commodity itself) are about twice as high as the imports
themselves. Thus by importing a country saves on domestic material (and energy) flows. A
recent study concludes that the difference between (direct) domestic material consumption and
an indicator including embodied material flows can be as much as 195% as this is the case for
The Netherlands. UK shows in this study a difference of 55%, France 49% and Germany 34%
(Bruckner et al. 2012). Recently, various approaches including the one used by Bruckner et al.
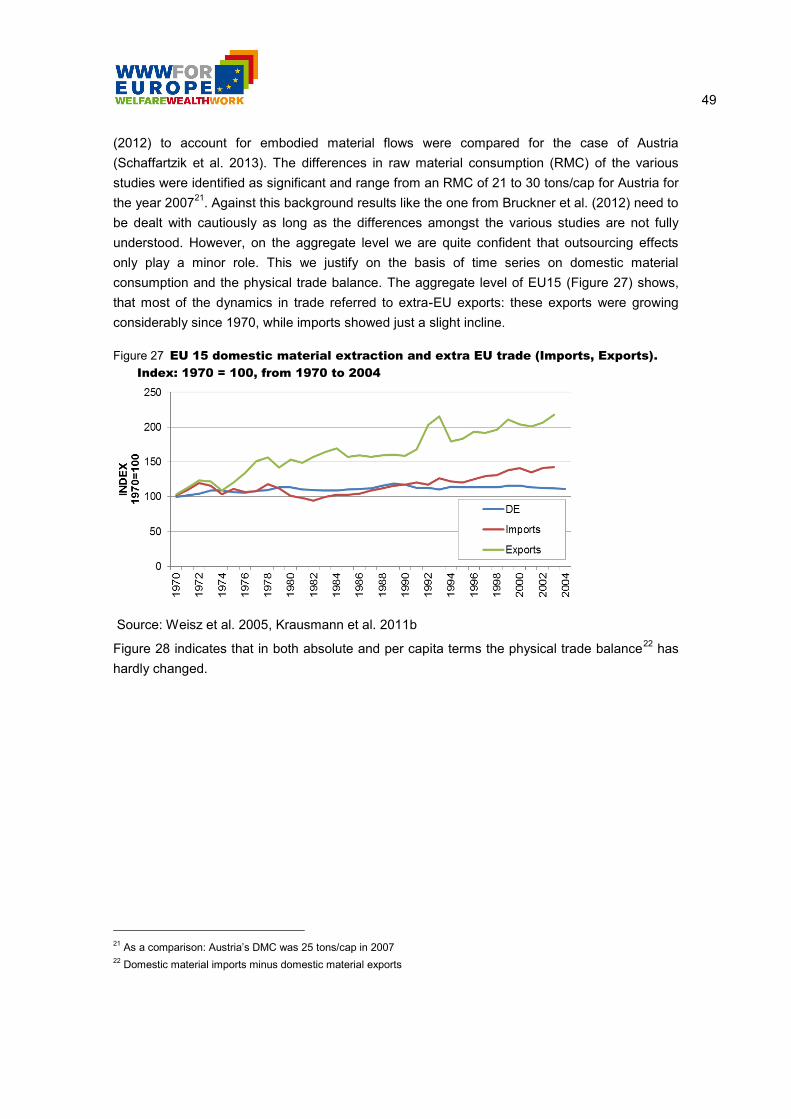
49
(2012) to account for embodied material flows were compared for the case of Austria
(Schaffartzik et al. 2013). The differences in raw material consumption (RMC) of the various
studies were identified as significant and range from an RMC of 21 to 30 tons/cap for Austria for
the year 200721
. Against this background results like the one from Bruckner et al. (2012) need to
be dealt with cautiously as long as the differences amongst the various studies are not fully
understood. However, on the aggregate level we are quite confident that outsourcing effects
only play a minor role. This we justify on the basis of time series on domestic material
consumption and the physical trade balance. The aggregate level of EU15 (Figure 27) shows,
that most of the dynamics in trade referred to extra-EU exports: these exports were growing
considerably since 1970, while imports showed just a slight incline.
Figure 27 EU 15 domestic material extraction and extra EU trade (Imports, Exports).
Index: 1970 = 100, from 1970 to 2004
Source: Weisz et al. 2005, Krausmann et al. 2011b
Figure 28 indicates that in both absolute and per capita terms the physical trade balance22
has
hardly changed.
21
As a comparison: Austria‟s DMC was 25 tons/cap in 2007 22
Domestic material imports minus domestic material exports
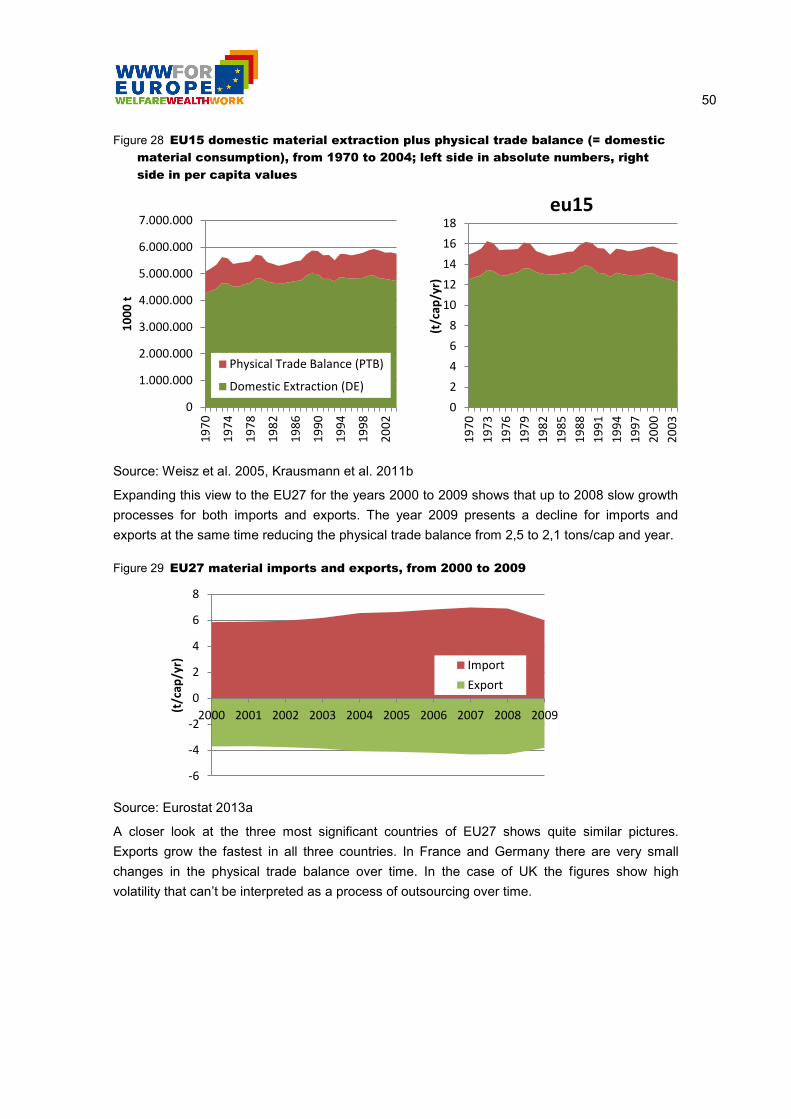
50
Figure 28 EU15 domestic material extraction plus physical trade balance (= domestic
material consumption), from 1970 to 2004; left side in absolute numbers, right
side in per capita values
Source: Weisz et al. 2005, Krausmann et al. 2011b
Expanding this view to the EU27 for the years 2000 to 2009 shows that up to 2008 slow growth
processes for both imports and exports. The year 2009 presents a decline for imports and
exports at the same time reducing the physical trade balance from 2,5 to 2,1 tons/cap and year.
Figure 29 EU27 material imports and exports, from 2000 to 2009
Source: Eurostat 2013a
A closer look at the three most significant countries of EU27 shows quite similar pictures.
Exports grow the fastest in all three countries. In France and Germany there are very small
changes in the physical trade balance over time. In the case of UK the figures show high
volatility that can‟t be interpreted as a process of outsourcing over time.
0
1.000.000
2.000.000
3.000.000
4.000.000
5.000.000
6.000.000
7.000.0001
97
0
19
74
19
78
19
82
19
86
19
90
19
94
19
98
20
02
10
00
t
Physical Trade Balance (PTB)
Domestic Extraction (DE)
0
2
4
6
8
10
12
14
16
18
19
70
19
73
19
76
19
79
19
82
19
85
19
88
19
91
19
94
19
97
20
00
20
03
(t/c
ap/y
r)
eu15
-6
-4
-2
0
2
4
6
8
2000 2001 2002 2003 2004 2005 2006 2007 2008 2009(t/c
ap/y
r)
Import
Export
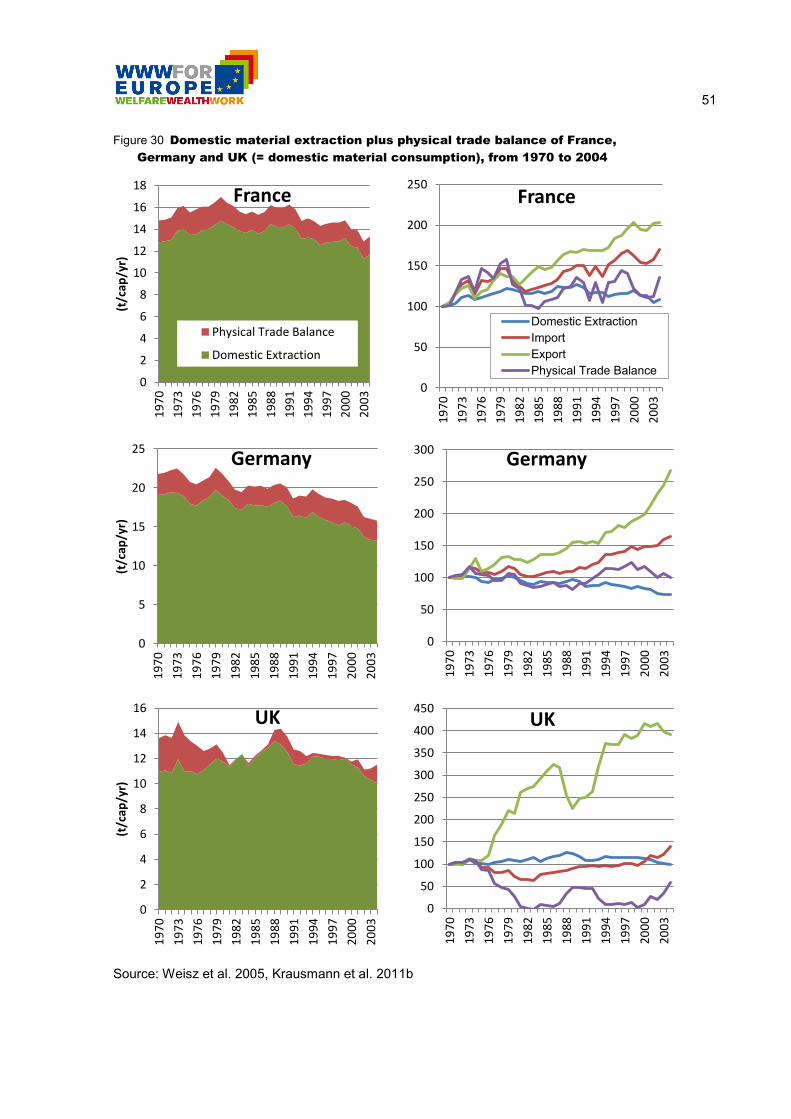
51
Figure 30 Domestic material extraction plus physical trade balance of France,
Germany and UK (= domestic material consumption), from 1970 to 2004
Source: Weisz et al. 2005, Krausmann et al. 2011b
0
2
4
6
8
10
12
14
16
18
19
70
19
73
19
76
19
79
19
82
19
85
19
88
19
91
19
94
19
97
20
00
20
03
(t/c
ap/y
r)
France
Physical Trade Balance
Domestic Extraction
0
50
100
150
200
250
19
70
19
73
19
76
19
79
19
82
19
85
19
88
19
91
19
94
19
97
20
00
20
03
France
Domestic Extraction
Import
Export
Physical Trade Balance
0
5
10
15
20
25
19
70
19
73
19
76
19
79
19
82
19
85
19
88
19
91
19
94
19
97
20
00
20
03
(t/c
ap/y
r)
Germany
0
50
100
150
200
250
3001
97
0
19
73
19
76
19
79
19
82
19
85
19
88
19
91
19
94
19
97
20
00
20
03
Germany
0
2
4
6
8
10
12
14
16
19
70
19
73
19
76
19
79
19
82
19
85
19
88
19
91
19
94
19
97
20
00
20
03
(t/c
ap/y
r)
UK
0
50
100
150
200
250
300
350
400
450
19
70
19
73
19
76
19
79
19
82
19
85
19
88
19
91
19
94
19
97
20
00
20
03
UK

52
From these data, we cannot conclude that in Europe there may have been a substantial rise in
domestic material consumption, just concealed by it being increasingly covered by imports.
Thus we end up with a diagnosis of material saturation in Europe that may be expected to
continue without major policy efforts or structural breaks.
But, as explained in chapter 3.1 above, from an international equity and environmental point of
view, freezing European material consumption is not enough: European resource use needs to
be substantially reduced.
The best practice scenario demonstrates the extent of such a reduction under the assumption
that the other European countries emulate the practices of those European countries (namely
the UK, France and Germany) that in fact had a reduction of their per capita domestic material
consumption in the period 1970-2000 of – on average – a little more than a quarter (28%).
Emulating the same degree of reduction in all European countries between 2005 and 2050
would lead to an average metabolic rate of 12t/cap year in 2050. This scenario has the
disadvantage that in each of the countries that did achieve such a reduction in the past, very
specific circumstances were responsible for this (such as a far-reaching de-industrialization in
the UK and the German reunion with closing down inefficient production sites in the East) –
circumstances that cannot simply be “emulated” by other countries, nor do they necessarily
remain the same for the forerunners. Nevertheless, this scenario teaches an important lesson:
shrinking material use is not necessarily associated with economic decline.
The radical transformation scenario, finally, demands for halving European material
consumption by 2050 and achieves what is asked for in UNEP‟s moderate contraction and
convergence scenario: an average metabolic rate of 8t/cap*year. How could this be brought
about?
To answer this question, it is useful to draw attention to the composition of European material
consumption and to discuss plausible reduction strategies for each material category for the
period up to 205023
(fig. 31).
23
In the discussion of strategies to reduce consumption of the four material categories, interlinkages between the
categories are considered but no calculation method has been used. Given the fundamental change implied with
halving the material consumption there are too many uncertainties in the quantitative relationships and elasticities
cannot be derived from empirical data of the last decades.

53
Figure 31 The composition of EU27 material consumption in 2005 and a projection for
2050
2005 2050
Source: Eurostat 2013a, own calculation, see assumptions in the text
Almost one quarter of it consists of fossil fuels (including derived products, a relatively small
amount in relation to fuels). If Europe takes its climate policies seriously, this amount should be
drastically reduced (see literature below). The use of most renewable energy sources, as soon
as investments are taken, is associated with a substantially lower amount of materials. In our
projection we assume that achieving 80% GHG emissions by 2050 entails a 70%
dematerialization of the energy supply. This also has major implications for reducing the
demand for transport infrastructure.24
Somewhat less than a quarter consists of biomass (food, feed, timber, textiles…), the large
majority of which is related to human nutrition. Reducing the animal share in human nutrition,
and reducing food waste, could account for halving biomass use in a way co-beneficial for
human health and the environment. Again there are co-implications for transport and transport
infrastructure.
Half of the materials used consist of construction minerals (cement, sand, gravel) that are
usually extracted domestically, and a large proportion of them are used for constructing and
maintaining public infrastructure (roads, harbours, dams and the like). Some of this is a one-
time investment in the course of modernization processes, as can be seen below from
comparing the construction materials use of EU15 and new member states in the last decade.
In our projection for 2050 we assume a saturation of infrastructure. Consequently additional
construction activities can be minimized and the main use of construction minerals is to
24
Fossil fuels, in terms of tons, amount to 50% of world transport (according to trade flows as presented by Krausmann
et al. 2008b).This is distributed between ships, pipes and road transport. Reducing fossil fuel use would have major
consequences in reducing transport volumes and the need for transport infrastructure.

54
maintain already existing infrastructure. We assume a 40% reduction of construction minerals
compared to 2005. Since about 70%25
of metals are used for infrastructure the same 40%
reduction as for construction minerals is assumed for ores.
Figure 32 The use of construction minerals in EU15 and the new member states
Source: Eurostat 2013a
In a recent assessment for DG Environment, beyond climate related policies, the following two
strategies were suggested as most potent to reduce materials and energy use and at the same
time providing health and other benefits: changing the human diet and stabilizing the stocks of
built-up infrastructure.
“Changing the human diet towards a lower share of animal based food. Tackling this will
have several effects:
- Positive effects on human health (less obesity, less cardiovascular diseases, lower
risk of livestock-related epidemics)
- Decreasing livestock and thus lowering pressure on land because less land area is
needed for agricultural production (i.e. market fodder for livestock)
- Lowering pressures on groundwater (nitrification)
- Savings of energy (cooling, transportation)
- Decreasing GHG emissions from ruminants
- Savings on water use
Steady stocks of built-up infrastructure and densification of settlements, reducing urban
sprawl
- decreasing material use, i.e. construction minerals, metals use in infrastructure,
- facilitating a continuous recycling of construction materials
25
Wang et al. (2007) calculate that 75% of the iron used in Europe is added to stocks in 2000. Since iron is about three
quarters of the overall metal consumption the figure can be used as an orientation. 70% was taken as a
conservative estimate.
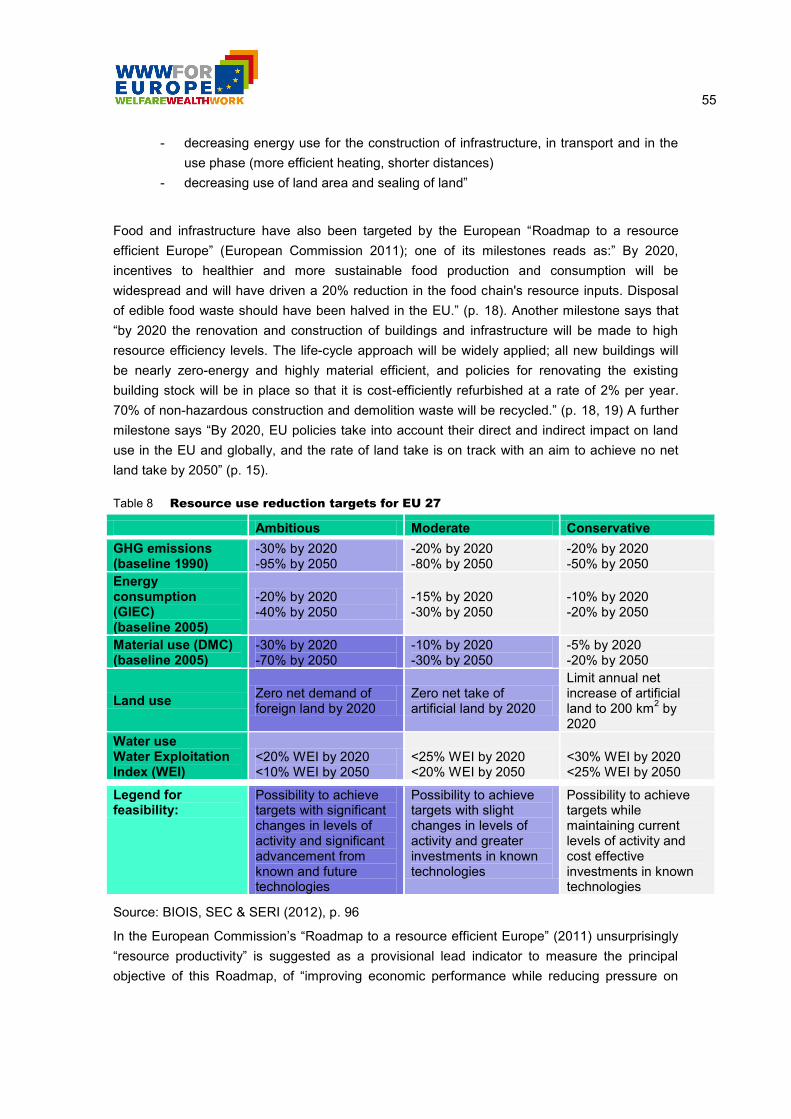
55
- decreasing energy use for the construction of infrastructure, in transport and in the
use phase (more efficient heating, shorter distances)
- decreasing use of land area and sealing of land”
Food and infrastructure have also been targeted by the European “Roadmap to a resource
efficient Europe” (European Commission 2011); one of its milestones reads as:” By 2020,
incentives to healthier and more sustainable food production and consumption will be
widespread and will have driven a 20% reduction in the food chain's resource inputs. Disposal
of edible food waste should have been halved in the EU.” (p. 18). Another milestone says that
“by 2020 the renovation and construction of buildings and infrastructure will be made to high
resource efficiency levels. The life-cycle approach will be widely applied; all new buildings will
be nearly zero-energy and highly material efficient, and policies for renovating the existing
building stock will be in place so that it is cost-efficiently refurbished at a rate of 2% per year.
70% of non-hazardous construction and demolition waste will be recycled.” (p. 18, 19) A further
milestone says “By 2020, EU policies take into account their direct and indirect impact on land
use in the EU and globally, and the rate of land take is on track with an aim to achieve no net
land take by 2050” (p. 15).
Table 8 Resource use reduction targets for EU 27
Ambitious Moderate Conservative
GHG emissions (baseline 1990)
-30% by 2020 -95% by 2050
-20% by 2020 -80% by 2050
-20% by 2020 -50% by 2050
Energy consumption (GIEC) (baseline 2005)
-20% by 2020 -40% by 2050
-15% by 2020 -30% by 2050
-10% by 2020 -20% by 2050
Material use (DMC) (baseline 2005)
-30% by 2020 -70% by 2050
-10% by 2020 -30% by 2050
-5% by 2020 -20% by 2050
Land use Zero net demand of foreign land by 2020
Zero net take of artificial land by 2020
Limit annual net increase of artificial land to 200 km
2 by
2020
Water use Water Exploitation Index (WEI)
<20% WEI by 2020 <10% WEI by 2050
<25% WEI by 2020 <20% WEI by 2050
<30% WEI by 2020 <25% WEI by 2050
Legend for feasibility:
Possibility to achieve targets with significant changes in levels of activity and significant advancement from known and future technologies
Possibility to achieve targets with slight changes in levels of activity and greater investments in known technologies
Possibility to achieve targets while maintaining current levels of activity and cost effective investments in known technologies
Source: BIOIS, SEC & SERI (2012), p. 96
In the European Commission‟s “Roadmap to a resource efficient Europe” (2011) unsurprisingly
“resource productivity” is suggested as a provisional lead indicator to measure the principal
objective of this Roadmap, of “improving economic performance while reducing pressure on

56
natural resources and the environment”, complemented by indicators on key natural resources
such as water, land, materials and carbon, that will take account of the EU‟s global consumption
of these resources. (European Commission 2011, p. 4). This resource productivity on the macro
level is defined as GDP/DMC, the latter being the indicator we based our scenarios upon. If
resource productivity is used as the main indicator for targeting future development, this implies
making assumptions about the growth or decline of GDP. Under the conditions given in Europe
in the last decades with stagnating DMC/cap, resource productivity rises practically only depend
upon the rise of GDP (given that also population is fairly constant), as obvious in figure 26
above.
In a recent very thorough econometric analysis, Steinberger et al. (2013) explored the
interrelation between GDP, resource use, resource productivity and carbon emissions for
country clusters (industrialized and emerging/developing countries) for the time period 1970-
2004. For each country, they calculated “coupling coefficients” of income and material
consumption (income elasticity), finding these coefficients generally low for mature industrial
countries (sometimes even negative, thus implying absolute decoupling), and consistently
higher for the developing/emerging group, particularly for minerals and fossil fuels.26
The most
interesting finding from the full panel analysis is the time trend identified: it can be interpreted as
the time-dependent (and income-independent) rate of improvement of material and carbon
efficiency, related to technical improvements rather than to economic growth. This time trend
coefficient is small but significant for DMC and carbon emissions across the whole sample (with
all R2 for the full equation exceeding 0.98). The existence of this time trend allows for some
economic growth while absolute dematerialization may occur. A narrow limit, though: it amounts
to 1.4% economic growth annually without affecting DMC, and only 0.9% without affecting
carbon emissions (the authors term this “autonomous technological progress”)27
. By implication,
stronger and more successful efforts at improving resource efficiency and adopting renewable
energies than occurred in the past 35 years would be required to allow for higher growth rates in
GDP while permitting reductions in resource use.
26
A test using a quadratic (Kuznets) function instead of a log-linear did generally not render significant results. 27
This type of shift over time has also been seen in life expectancy vs. income (Preston 2007) and human development
(HDI) vs. energy and carbon emissions (Steinberger and Roberts, 2010).
57
4. Concluding remarks
As stated in the introduction, a long bridge is required to span the gap between an
environmental and a macroeconomic perspective on the future of human development. The
socioecological analysis of socioeconomic resource use as attempted in this report is an
important pillar to support such a bridge. Still, the bridge has to be walked on from both sides.
Attention for causalities is typically divided: Environmentalists care for how economies will
impact upon the environment and that they potentially might trigger environmental changes
detrimental to long-term civilization and survival. Economists care for securing the (typically
much shorter term) conditions of economic growth, employment and consumption opportunities.
Environmentalists see nature as a dynamic force, economists focus on the agency of humans.
The differences in time horizons alone make it difficult to meet mid-way.
This report, within the limits of a socioecological framework, seeks to employ both perspectives.
It seeks to describe global changes that will impact the European economies via biophysical
effects, world market price effects for commodities and potential policy regulations (along the
analytical pathways sketched in Figure 1), and on a macro-level it analyses the impacts
economies have on the extent of natural resource extraction and use, and concomitant
environmental consequences. The most general take-away insight is that there is a strong
interdependency: environmental change feeds and constrains the economies, and the
economies trigger environmental change. It appears that there is major structural change on-
going in this relationship to which Europe will need to adapt.

58
References
Aleklett, K., Höök, M., Jakobsson, K., Lardelli, M., Snowden, S., Söderbergh, B., 2010. The Peak of the
Oil-Age - Analyzing the World Oil Production Reference Scenario in World Energy Outlook 2008.
Energy Policy, 38 (3), 1398-1414.
Ayres, R.U., 1990a. Technological Transformations and Long Waves. Part I. Technological Forecasting
and Social Change, 37, 1-37.
Ayres, R.U., 1990b. Technological Transformations and Long Waves. Part II. Technological Forecasting
and Social Change, 36, 111-137.
Biois, SEC, SERI, 2012. Assessment of Resource Use Indicators. Report to DG Environment.
Bruckner, M., S. Giljum, C. Lutz and K. S. Wiebe (2012). "Materials embodied in international trade –
Global material extraction and consumption between 1995 and 2005." Global Environmental Change
22(3): 568-576.
Buchert, M., Schüler, D., Bleher, D., 2009. Critical Metals for future sustainable technologies and their
recycling potential. UNEP, Nairobi, Kenya.
Bunker, S.G. Natural Values, Raw Materials, and the Costs of Space in Globalizing World Economies,
1431 to 2002. World System History and Global Environmental Change; Lund 19-22 Sept. 2003.
2003.
Bunker, S.G., Ciccantell, P.S., 2005. Globalization and the race for resources. The Johns Hopkins
University Press, Baltimore, Maryland, London.
Calvo-Gonzales, O., hankar, R., Trezzi, R., 2010. Are Commodity Prices more Volatile Now? A Long-Run
Perspective. World Bank Policy Research Working Paper No. 5460.
Chevalier, J.-M., 2010. Oil Price Volatility: Causes and Recommendations to the EU, March [retrieved
from: www.energypolicyblog.com/2010/03/12/oil-price-volatility-causesand-recommendations-to-the-
eu/, accessed on 12 December 2011].
Cordell, D., Rosemarin, A., Schröder, J.J., Smit, A.L., 2011. Towards global phosphorus security: A
systems framework for phosphorus recovery and reuse options. Chemosphere, 84, 747-758.
Durbin, J., Watson, G.S., 1950. Testing for serial correlation in least squares regressio. I. Biometrika, 37
(3-4), 409-428.
Energy Information Administration EIA, 2011. International Energy Outlook 2011. EIA, Washington.
European Commission, 2011. Roadmap to a Resource Efficient Europe. European Commission, Brussels.
European Renewable Energy Council (EREC), Greenpeace International, 2010. Energy Revolution: A
Sustainable World Energy Outlook . EREC, Greenpeace International, Brussels, Amsterdam.
Eurostat, 2009. Economy wide Material Flow Accounts. Compilation Guidelines for reporting to the 2009
Eurostat questionnaire (Version 01 - June 2009). European Statistical Office, Luxembourg.
Eurostat 2013a.Material flow accounts .
http://appsso.eurostat.ec.europa.eu/nui/submitViewTableAction.do, update 22.04.2013, accessed on
24.04. 2013
Eurostat 2013.b Material flow accounts Eurostat Database.
http://appsso.eurostat.ec.europa.eu/nui/submitViewTableAction.do, update.28.06.2013, accessed on
09.07. 2013
FAO, IFAD, IMF, OECD, UNCTAD, WFP, The World Bank, WTO, IFPRI, UN HLFT, 2011. Price Volatility
in Food and Agricultural Markets: Policy responses, Policy Report
[http://www.oecd.org/trade/agricultural-trade/48152638.pdf]. OECD, Paris.
Fischer-Kowalski, M., Weisz, H., 1999. Society as a Hybrid Between Material and Symbolic Realms.
Toward a Theoretical Framework of Society-Nature Interaction. Advances in Human Ecology, 8, 215-
251.

59
Fischer-Kowalski, M., Haberl, H., 2007. Socioecological transitions and global change: Trajectories of
Social Metabolism and Land Use. Edward Elgar, Cheltenham, UK; Northhampton, USA.
Fischer-Kowalski, M., Rotmans, J., 2009. Conceptualizing, Observing and Influencing Social-Ecological
Transitions. Ecology and Society, 14 (2), 1-3. [online] URL:
http://www.ecologyandsociety.org/vol4/iss2/art3.
Fischer-Kowalski, M., Krausmann, F., Giljum, S., Lutter, S., Mayer, A., Bringezu, S., Moriguchi, Y., Schütz,
H., Schandl, H., Weisz, H., 2011. Methodology and indicators of economy wide material flow
accounting. State of the art and reliablity across sources. Journal of Industrial Ecology, 15 (6), 855-
876
Foley, J.A., Ramankutty, N., Brauman, K.A., Cassidy, E.S., Gerber, J.S., Johnston, M., Mueller, N.D.,
'Connell, C., Ray, D.K., West, P.C., Balzer, C., Bennett, E.M., Carpenter, S.R., Hill, J., Monfreda, C.,
Polasky, S., Rockstrom, J., Sheehan, J., Siebert, S., Tilman, D., Zaks, D.P.M., 2011. Solutions for a
cultivated planet. Nature, 478 (7369), 337-342.
Foxon, T. Technological and institutional change for a transition to a low carbon economy: a co-
evolutionary framework. 2007. Porto, Portugal, Confererence: 'Economic growth, development, and
institutions - lessons for policy and the need for an evolutionary framework of analysis', November 1-
3. Paper for EAEPE (European Association for Evolutionary Political Economy). 19-12-2011.
Füllsack, M., 2011. Gleichzeitige Ungleichzeitigkeiten. Eine Einführung in die Komplexitätsforschung. VS
Verlag, Wiesbaden.
Gagnon, N., Hall, C.A.S., Brinker, L., 2009. A Preliminary Investigation of Energy Return on Energy
Investment for Global Oil and Gas Production. Energies, 2, 490-503.
Geels, F.W., 2011. The multilevel perspective on sustainability transitions: responses to seven criticisms.
Environmental Innovation and Societal Transitions, 1 (1), 24-40.
Gerling, J. P., Knopf, S., May, C., Müller, C., 2010. Neuberechnung möglicher Kapazitäten zur CO2-
Speicherung in tiefen Aquifer-Stukturen, Energiewirtschaftliche Tagesfragen, Vol. 60, No. 4.
Ghertner, D.A. and Fripp M., 2007. Trading away damage: quantifying environmental leakage through
consumption-based, life-cycle analysis. Journal of Ecological Economics, 63,2-3, 563-577
Gierlinger, S., Krausmann, F., 2012. The physical economy of the United States of America: Extraction,
trade and consumption of materials from 1870 to 2005. Journal of Industrial Ecology, 16 (3), 365-377.
Giurco, D., Prior, T., Mudd, G.M., Mason, L., Behrisch, J., 2010. Peak Minerals in Australia: A Review of
changing Impacts and Benefits. Prepared for CSIRO Minerals Down Under Flagship, by the Institute
for Sustainable Futures (University of Technology, Sydney) and Department of Civil Engineering
(Monash University). Institute for Sustainable Futures. University of Technology, Sydney, Sydney.
Gonzalez-Martinez, A.C., Schandl, H., 2008. The biophysical perspective of a middle income economy:
Material flows in Mexico. Ecological Economics, 68 (1-2), 317-327.
Gould, S.J., 2002. The Structure of Evolutionary Theory. The Belknap Press of Harvard University Press,
Cambridge, Massachusetts.
Greening, L.A., Greene, D.L., Difiglio, C., 2000. Energy Efficiency and Consumption - the Rebound Effect:
A Survey. Energy Policy, 28, 389-402.
Grin, J., Rotmans, J., Schot, J., 2010. Transitions to Sustainable Development: New Directions in the
Study of Long Term Transformative Change. Routledge, New York.
Grübler, A., 1998. Technology and Global Change. Cambridge University Press, Cambridge.
Haberl, H., 2001. The Energetic Metabolism of Societies, Part I: Accounting Concepts. Journal of Industrial
Ecology, 5 (1), 11-33.
Haberl, H., Fischer-Kowalski, M., Krausmann, F., Weisz, H., Winiwarter, V., 2004. Progress Towards
Sustainability? What the conceptual framework of material and energy flow accounting (MEFA) can
offer. Land Use Policy, 21 (3), 199-213.

60
Hirschhausen, C., Haftendorn, C., Herold, J., Holz, F., Neumann, A. and S. Rüster (2010), Europe‟s Coal
Supply Security: Obstacles to Carbon Capture, Transport and Storage, CEPS Policy Brief, 29
November 2010
Höller, S. (2010), Ablagerung von CO2 im geologischen Untergrund: Wieviel Platz gibt es in Deutschland?,
Bild des Monats, Wuppertal Institute for Climate, Environment and Energy.
International Energy Agency (IEA), 2010. World Energy Outlook 2010. IEA, Paris.
International Energy Agency (IEA), 2011. World Energy Outlook 2011. IEA, Paris.
Intergovernamental Panel for Climate Change (IPCC), 2005. Summary for Policy-makers, a Special Report
of Working Group III. [retrieved from: at: http://www.ipcc.ch/pdf/special-
reports/srccs/srccs_summaryforpolicymakers.pdf, accessed on 13 12 2011]
Intergovernamental Panel for Climate Change (IPCC), 2007. Climate Change 2007. Synthesis Report.
Contribution of Working Groups I, II and III to the Fourth Assessment Report of the Intergovernmental
Panel on Climate Change. Cambridge University Press, Cambridge, UK and New York, USA.
Karl, T.R., Trenberth, K.E., 2003. Modern Global Climate Change. Science, 302 (5651), 1719-1723.
Kletzan, D., Köppl, A., Kratena, K., 2003. Ökonomische Aspekte des Hochwassers 2002: Datenanalyse,
Vermögensrechnung und gesamtwirtschaftliche Effekte, in: (Universität für Bodenkultur, Institut für
Meteorologie und Physik), StartClim – Startprojekt Klimaschutz. Erste Analysen extremer
Wetterereignisse und ihrer Auswirkungen in Österreich. Österreichisches Institut für
Wirtschaftsforschung (WIFO), Wien.
Krausmann, F., Fischer-Kowalski, M., Schandl, H., Eisenmenger, N., 2008a. The global sociometabolic
transition: past and present metabolic profiles and their future trajectories. Journal of Industrial
Ecology, 12 (5/6), 637-656.
Krausmann, F., Schandl, H., Sieferle, R.P., 2008b. Socio-ecological regime transitions in Austria and the
United Kingdom. Ecological Economics, 65 (1), 187-201.
Krausmann, F., Gingrich, S., Eisenmenger, N., Erb, K.-H., Haberl, H., Fischer-Kowalski, M., 2009. Growth
in global materials use, GDP and population during the 20th century. Ecological Economics, 68 (10),
2696-2705.
Krausmann, F., Gingrich, S., Nourbakhch-Sabet, R., 2011a. The metabolic transition in Japan: A material
flow account for the period 1878 to 2005. Journal of Industrial Ecology, 15 (6), 877-892.
Krausmann, F., Fischer-Kowalski, M., Schaffartzik, A., Steinberger, J.K., Eisenmenger, N., and Weisz, U.
2011b. Trends and Developments of the Use of Natural Resources in the European Union. Vienna,
IFF Social Ecology. Social Ecology Working Paper. Nr. 123
Krausmann, F., Fischer-Kowalski, M., 2013. Global sociometabolic transitions. In: Singh, S.J., Haberl, H.,
Chertow, M., Mirtl, M. and Schmid, M. (Eds.), Long Term Socio-Ecological Research. Studies in
Society - Nature Interactions Across Spatial and Temporal Scales. Springer, pp. 339-365.
Loorbach, D., Frantzeskaki, N., Thissen, W., 2010. Introduction to the special section: Infrastructures and
transitions. Technological Forecasting and Social Change, 77, 1195-1202.
Maddison, A., 2008. Historical Statistics for the World Economy: 1-2006 AD.
http://www.ggdc.net/maddison/,
Martens, P., Rotmans, J., 2002. Transitions in a Globalising World. Swets & Zeitlinger Publishers, Lisse,
The Netherlands.
Matthews, E., Amann, C., Fischer-Kowalski, M., Bringezu, S., Hüttler, W., Kleijn, R., Moriguchi, Y., Ottke,
C., Rodenburg, E., Rogich, D., Schandl, H., Schütz, H., van der Voet, E., Weisz, H., 2000. The
Weight of Nations: Material Outflows from Industrial Economies. World Resources Institute,
Washington, D.C.
Maturana, H.R., Varela, F.G., 1975. Autopoietic Systems. A characterization of the living organization.
University of Illinois Press, Urbana-Champaign, Illinois.
61
Mayer, A. Resource use and material flows in the Brazilian economy, 1960-2005. [118], 1-118. 2010.
Vienna, IFF Social Ecology. Social Ecology Working Paper. 28-2-2008.
McLeman, R.A., Hunter, L.M., 2010. Migration in the context of vulnerability and adaptation to climate
change: insights from analogues. Wiley Interdisciplinary Reviews: Climate Change, 1 (3), 450-461.
Moll, S., Popescu, C., Nickel, R., 2012. EU's Resource Productivity on the increase. Eurostat.Statistics in
Focus, 22/2012
Münz, R. and Ullrich, R. 2006. Online handbook demography. http://www.berlin-
institut.org/fileadmin/user_upload/handbuch_texte/pdf_Muenz_Ulrich_Demografischer_UEbergang.p
df . Berlin - Institut für Bevölkerung und Entwicklung. accesed on 19-12-2011.
Nakicenovic, N., Swart, R. (eds.), 2000. Emission Scenarios. Cambridge University Press, Cambridge, UK.
NEUjobs, 2012. Socio-ecological transitions: definition, dynamics and related global scenarios
[http://www.neujobs.eu/publications/socio-ecological-transition-and-employment-implications/socio-
ecological-transitions-de]. Centre for European Policy Studies (CEPS), Brussels.
NIC, 2008. Global trends 2025: A Transformed World. National Intelligence Council, Washington,D.C.
NIC, EUISS, 2010. Global Governance 2025: At a Critical Juncture. National Intelligence Council,
Washington, D.C.
Notestein, F.W., 1945. Population: the long view. In: Schultz, T.W. (Eds.), Food for the world. University of
Chicago Press, Chicago, pp. 36-57.
O'Neill, J., Wilson, D., Stupnytska, A., 2005. How Solid are the BRICs? Goldman Sachs Economic
Research,
OECD, Martinez-Fernandez, C., Hinojosa, C., Iranda, G., 2010. Green jobs and skills: the local labour
market implications of addressing climate change. 8 February 2010, working document.
[www.oecd.org/dataoecd/54/43/44683169.pdf?conte ntId=44683170]. OECD (CFE/LEED), Paris.
Okuyama, Y., 2007. Economic Modeling for Disaster Impact Analysis: Past, Present, and Future.
Economic Systems Research, 19 (2), 115-124.
Pallua, I. Historische Transitionen im Energiesystem und gesellschaftliche Transformation: ein
Ländervergleich. [forthcoming]. 2013. Vienna, IFF Social Ecology. Social Ecology Working Paper
Pfister, C., 2003. Energiepreis und Umweltbelastung. Zum Stand der Diskussion über das "1950er
Syndrom". In: Siemann, W. (Eds.), Umweltgeschichte Themen und Perspektiven. C.H. Beck,
München, pp. 61-86.
Polanyi, K., 1944. The Great Transformation: The Political and Economic Origins of Our Time. Beacon
Press, Boston.
Preston, S.H., 2007. The changing relation between mortality and level of economic development.
International Journal of Epidemiology, 36 (3), 484-490.
Randers, J., 2012. 2052: A Global Forecast for the Next Forty Years (A Report to the Club of Rome).
Chelsa Green Publishing, Vermont.
Rapacki, R., Prochniak, M., 2009. The EU Enlargement and Economic Growth in the CEE New Member
Countries. Paper prepared for the Workshop "Five years of an enlarged EU - a positive -sum game",
Brussels, 13-14 november 2008. Economic papers 367. European Commission, Brussels.
Rockström, J., Steffen, W., Noone, K., Persson, A., Chapin III, F.S., Lambin, E.F., Lenton, T.M., Scheffer,
M., Folke, C., Schellnhuber, H.-J., Nykvist, B., de Wit, C.A., Hughes, T., van der Leeuw, S.E., Rodhe,
H., Sörlin, S., Snyder, P.K., Costanza, R., Svedin, U., Falkenmark, M., Karlberg, L., Corell, R.W.,
Fabry, V.J., Hansen, J., Walker, B., Liverman, D., Richardson, K., Crutzen, P., Foley, J.A., 2009a. A
safe operating space for humanity. Nature, 461, 472-475.
Rockström, J., Steffen, W., Noone, K., Persson, A., Chapin III, F.S., Lambin, E.F., Lenton, T.M., Scheffer,
M., Folke, C., Schellnhuber, H.-J., Nykvist, B., de Wit, C.A., Hughes, T., van der Leeuw, S.E., Rodhe,
H., Sörlin, S., Snyder, P.K., Costanza, R., Svedin, U., Falkenmark, M., Karlberg, L., Corell, R.W.,
Fabry, V.J., Hansen, J., Walker, B., Liverman, D., Richardson, K., Crutzen, P., Foley, J.A., 2009b.

62
Planetary Boundaries: Exploring the Safe Operating Space for Humanity. Ecology and Society, 14
(2), 32. [online] URL: http://www.ecologyandsociety.org/vol14/iss2/art32/-
Rosemarin, A. Peak Phosphorus -The Next Inconvenient Truth. Mini-Seminar Phosphorus Shortage:
European Challenges. European Parliament, Brussels. March 4, 2010. 2010. 19-12-2011.
Rotmans, J., Kemp, R., van Asselt, M., 2001. More evolution than revolution: Transition management in
public policy. Foresight, 3 (1), 15-31.
Schaffartzik, A., Eisenmenger, N., Wiedenhofer, D., 2013. The Raw Material Equivalents (RME) of Trade:
Ready for Methodological Harmonization? Oral presentation at the Annual International Conference
of Industrial ecology, Ulsan, South Korea.
Schandl, H., Fischer-Kowalski, M., Grünbühel, C.M., Krausmann, F., 2008. Sociometabolic transitions in
developing Asia. Technological Forecasting and Social Change, 76 (2), 267-281.
Schandl, H., West, J., 2010. Resource use and resource efficiency in the Asia-Pacific region. Global
Environmental Change, 20 (4), 636-647.
Schandl, H., 2011. Resource Efficiency: Economics and Outlook for Asia and the Pacific. CSIRO, UNEP,
Bangkok.
Schellnhuber, H.J., 1999. 'Earth system' analysis and the second Copernican revolution. Nature, 402
(Suppl.), C19-C23.
Schüler, D., Buchert, M., Liu, R., Dittrich, S., Merz, C., 2011. Study on Rare Earths and Their Recycling.
Öko-Institut e.V., Darmstadt.
SERICE, 2010. A Scoping Study on the Macroeconomic View of Sustainability. Final report for the
European Commission, DG Environment [http://seri.at/wp-content/uploads/2009/12/SERICE-
2010_Macroeconomic-view-of-sustainability.pdf]. Cambridge Econometrics, Sustainable Europe
Research Institute - SERI, Cambridge, Vienna.
Sieferle, R.P., 1982. Der unterirdische Wald. Energiekrise und Industrielle Revolution. C.H.Beck,
München.
Sieferle, R.P., 2001. The Subterranean Forest. Energy Systems and the Industrial Revolution. The White
Horse Press, Cambridge.
Sieferle, R.P., 2003. Sustainability in a World History Perspective. In: Benzing, B. (Eds.), Exploitation and
Overexploitation in Societies Past and Present. IUAES-Intercongress 2001 Goettingen. LIT
Publishing House, Münster, pp. 123-142.
Singh, S.J., Krausmann, F., Gingrich, S., Haberl, H., Erb, K.-H., Lanz, P., Martinez-Alier, J., Temper, L.,
2012. India's biophysical economy, 1961 – 2008. Sustainability in a national and global context.
Ecological Economics, 76, 60-69.
Smil, V., 2003. Energy at The Crossroads. Global Perspectives and Uncertainties. The MIT Press,
Cambridge Mass., London, England.
Smith, K.R., 1990. The risk transition. International Environmental Affairs, 2, 227-251.
Smith,.K.R. and Ezzati, M. (2005). How Environmental Health Risks Change With Development: The
Epidemiologic and Environmental Risk Transitions Revisited. Annu. Rev. Environ. Resour. 2005.
30:291–333
Stanley, H.E., 1971. Introduction to Phase Transitions and Critical Phenomena. Oxford University Press,
Oxford and New York.
Steinberger, J.K., Roberts, J.T., 2010. From constraint to sufficiency: the decoupling of energy and carbon
from human needs, 1975-2005. Ecological Economics, 70 (2), 425-433.
Steinberger, J.K., Krausmann, F., Eisenmenger, N., 2010. Global patterns of material use: a
socioeconomic and geophysical analysis. Ecological Economics, 69 (5), 1148-1158.
Steinberger, J.K., Krausmann, F., Getzner, M., Schandl, H., West, J., 2013. Development and
dematerialization. PLoS one, in press
63
Swilling, M., 2013. Economic crisis, long waves and the sustainability transition: An African perspective.
Environmental Innovation.and Societal.Transitions, 6 (0), 96-115.
The Conference Board. 2012. Global Economic Outlook 2012, http://www.conference-
board.org/data/globaloutlook.cfm. Accessed on 14-04-2012
Toya, H., Skidmore, M., 2007. Economic development and the impacts of natural disasters. Economics
Letters, 94 (1), 20-25.
Turner, B.L.I., Clark, W.C., Kates, R.W., Richards, J.F., Mathews, J.T., Meyer, W.B., 1990. The Earth as
Transformed by Human Action: Global and Regional Changes in the Biosphere over the Past 300
Years. Cambridge University Press, Cambridge.
UNPD, 2011. World Population Prospects, the 2010 Revision. United Nations Department of Economic
and Social Affairs, Population Division, New York.
UNEP, 2011a. Decoupling natural resource use and environmental impacts from economic growth. United
Nations Environmment Programme (UNEP), Nairobi.
UNEP, 2011b. Resource Efficiency: Economics and Outlook fo Asia and the Pacific. United Nations
Environment Program, (UNEP) Bangkog.
UNEP, 2011c Towards a Green Economy: Pathways to Sustainable Development and Poverty Eradication
– A Synthesis Report for Policy Makers. United Nations Environment Programme (UNEP).
van den Bergh, J.C.J.M., Truffer, B., Kallis, G., 2011. Environmental innovation and societal transitions:
Introduction and overview. Environmental Innovation.and Societal.Transitions, 1 (1), 1-23.
van Vuuren, D.P., Bouwman, A.F., Beusen, A.H.W., 2010. Phosphorous demand for the 1970-2100
period: A scenario analysis of resource depletion. Global Environmental Change, 20, 428-439.
Vörösmarty, C., Lettenmaier, D., Leveque, C., Meybeck, M., Pahl-Wostl, C., Alcamo, J., Cosgrove, W.J.,
Grassl, H., Hoff, H., Kabat, P., Lansigan, F., Lawford, R., Naiman, R.J., 2004. Humans Transforming
the Global Water System. Eos, Transactions, American Geophysical Union, 85 (48)
Wang, T., Müller, D. , and Graedel, T., 2007. Forging the Anthropogenic Iron Cycle. Environ. Sci. Technol.
Vol 41, p5120-5129
Weinzettel, J., Kovanda, J., 2009. Assessing Socioeconomic Metabolism Through Hybrid Life Cycle
Assessment - The Case of the Czech Republic. Journal of Industrial Ecology, 13 (4), 607-621.
Weisz, H., Krausmann, F., Eisenmenger, N., Amann, C., Hubacek, K., 2005. Development of Material Use
in the European Union 1970-2001. Material composition, cross-country comparison, and material flow
indicators. Eurostat, Office for Official Publications of the European Communities, Luxembourg.
Weisz, H., Krausmann, F., Amann, C., Eisenmenger, N., Erb, K.-H., Hubacek, K., Fischer-Kowalski, M.,
2006. The physical economy of the European Union: Cross-country comparison and determinants of
material consumption. Ecological Economics, 58 (4), 676-698.
WHO, 2013. Environmental health. World Health Organization, Geneva.
(http://www.who.int/about/contacthq/en/index.html , accessed on 01.072013)
Wilkinson, P., Smith, K.R., Joffe, M., Haines, A., 2007. A global perspective on energy: health effects and
injustices. The Lancet, 370 (9591), 965-978.
Wilson, D., Purushothaman, R., 2003. Dreaming With BRICs: The Path to 2050. Goldman Sachs
Economic Research,
Wilson, D., Stupnytska, A., 2007. The N-11: More Than an Acronym. Goldman Sachs Economic Research,
WBGU., 2011. World in transition: a social contract for sustainability; [flagship report]. Wiss. Beirat der
Bundesregierung Globale Umweltveränderungen (WBGU), Berlin.
World Bank, 2009. Global Economic Prospects - Commodities at the Crossroads. World Bank,
Washington, DC.
World Bank, IMF, 2011. Responding to Global Food Price Volatility and it's Impact on Food Security.
Report for the Development Committee Meeting, April, 16th, 2011.
64
World Petroleum Council, 2013. http://www.world-petroleum.org/index.php?/Technology/alternative-
transport-fuels-courtesy-of-aip.html, accessed on 10.07.2013
Wrigley, A.E., 1988. Continuity, Chance and Change. The Character of the Industrial Revolution in
England. Cambridge University Press, Cambridge.
Zittel, W., 2010. Assessment der Verfügbarkeit fossiler Energieträger (Erdöl, Erdgas, Kohle) sowie von
Phosphor und Kalium. Arbeitspaket 2 - Globale und regionale Rahmenbedingungen. Teilbericht 1 zur
Studie "Save our Surface" im Auftrag des Österreichischen Klima- und Energiefonds. Ludwig-
Bölkow-Systemtechnik GmbH, München.
The research leading to these results has received funding from the European Community's
Seventh Framework Programme FP7/2007-2013 under grant agreement n° 290647.
Project Information
Welfare, Wealth and Work for Europe
A European research consortium is working on the analytical foundations for a socio-ecological transition
Abstract
Europe needs a change: The financial crisis has exposed long neglected deficiencies in the present growth path, most visibly in unemployment and public debt. At the same time Europe has to cope with new challenges ranging from globalisation and demographic shifts to new technologies and ecological challenges. Under the title of Welfare, Wealth and Work for Europe – WWWforEurope – a European research consortium is laying the analytical foundations for a new development strategy that enables a socio-ecological transition to high levels of employment, social inclusion, gender equity and environmental sustainability. The four year research project within the 7th Framework Programme funded by the European Commission started in April 2012. The consortium brings together researchers from 33 scientific institutions in 12 European countries and is coordinated by the Austrian Institute of Economic Research (WIFO). Project coordinator is Karl Aiginger, director of WIFO.
For details on WWWforEurope see: www.foreurope.eu
Contact for information
Kristin Smeral
WWWforEurope – Project Management Office
WIFO – Austrian Institute of Economic Research
Arsenal, Objekt 20
1030 Vienna
T: +43 1 7982601 332
Domenico Rossetti di Valdalbero
DG Research and Innovation
European Commission
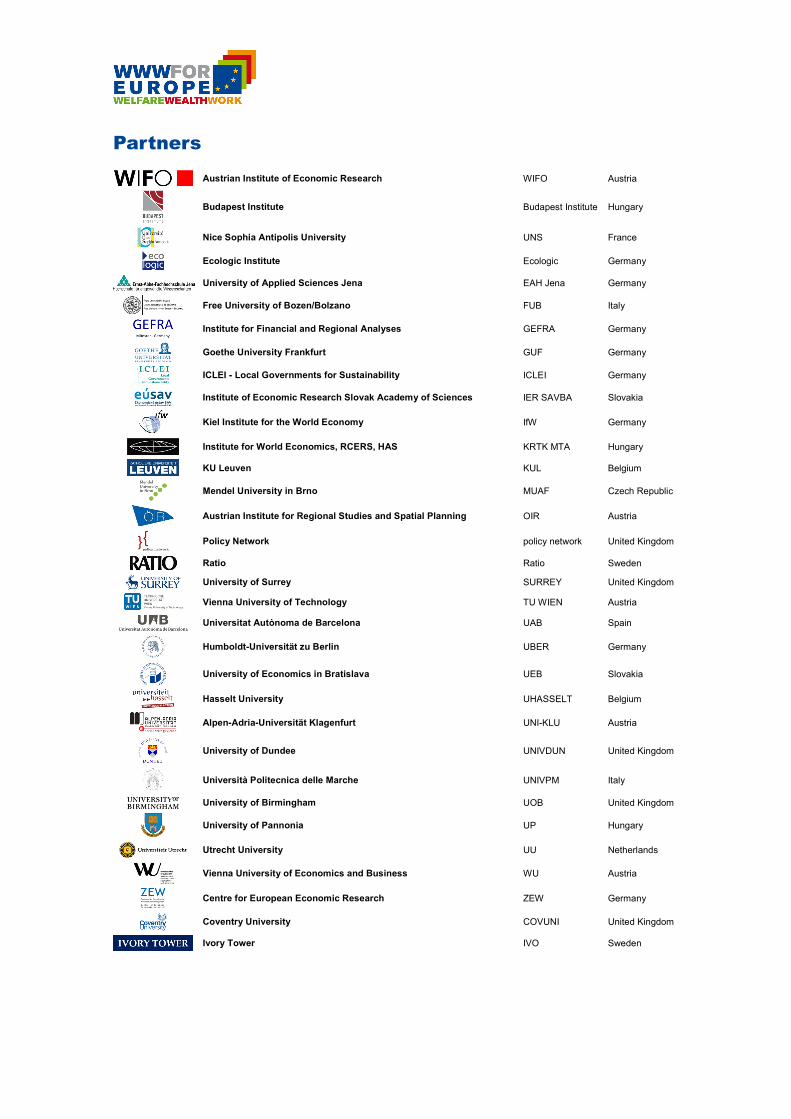
Partners
Austrian Institute of Economic Research WIFO Austria
Budapest Institute Budapest Institute Hungary
Nice Sophia Antipolis University UNS France
Ecologic Institute Ecologic Germany
University of Applied Sciences Jena EAH Jena Germany
Free University of Bozen/Bolzano FUB Italy
Institute for Financial and Regional Analyses GEFRA Germany
Goethe University Frankfurt GUF Germany
ICLEI - Local Governments for Sustainability ICLEI Germany
Institute of Economic Research Slovak Academy of Sciences IER SAVBA Slovakia
Kiel Institute for the World Economy IfW Germany
Institute for World Economics, RCERS, HAS KRTK MTA Hungary
KU Leuven KUL Belgium
Mendel University in Brno MUAF Czech Republic
Austrian Institute for Regional Studies and Spatial Planning OIR Austria
Policy Network policy network United Kingdom
Ratio Ratio Sweden
University of Surrey SURREY United Kingdom
Vienna University of Technology TU WIEN Austria
Universitat Autònoma de Barcelona UAB Spain
Humboldt-Universität zu Berlin UBER Germany
University of Economics in Bratislava UEB Slovakia
Hasselt University UHASSELT Belgium
Alpen-Adria-Universität Klagenfurt UNI-KLU Austria
University of Dundee UNIVDUN United Kingdom
Università Politecnica delle Marche UNIVPM Italy
University of Birmingham UOB United Kingdom
University of Pannonia UP Hungary
Utrecht University UU Netherlands
Vienna University of Economics and Business WU Austria
Centre for European Economic Research ZEW Germany
Coventry University COVUNI United Kingdom
Ivory Tower IVO Sweden