Developing Patient Safety Outcome Measures and Measurement ... · Measures and Measurement Tools...
175
Developing Patient Safety Outcome Measures and Measurement Tools for Antibiotic Stewardship Programs Metrics Guide This manual was developed as a result of the project entitled, “Developing Patient Safety Outcome Measures and Measurement Tools for Antibiotic Stewardship Programs,” a joint initiative made possible by a partnership between the CDC Foundation and Merck & Co., Inc., Kenilworth, NJ, USA.
Transcript of Developing Patient Safety Outcome Measures and Measurement ... · Measures and Measurement Tools...
Developing Patient Safety Outcome Measures and Measurement Tools for Antibiotic Stewardship Programs
Metrics Guide
This manual was developed as a result of the project entitled, “Developing Patient Safety Outcome Measures and Measurement Tools for Antibiotic Stewardship Programs,” a joint initiative made possible by a partnership between the CDC Foundation and Merck & Co., Inc., Kenilworth, NJ, USA.


i
Table of Contents
Introduction .......................................................................................................................iii
DASON ...............................................................................................................v
Merck.................................................................................................................ix
Project Graphic ..................................................................................................................xi
How to Use the Technical Manual ................................................................................xiii
TECHNICAL MANUAL
SECTION 1: Metrics that are both useful and feasible ........................................... 17
Days of Therapy over patient days or days present ................................... 19
C. difficile incidence ......................................................................................... 25
Redundant therapy events............................................................................. 29
Total duration .................................................................................................. 37
De-escalation performed ............................................................................... 45
SECTION 2: Metrics that were feasible, but not for routine assessments ........... 53
Readmission related to infectious diagnosis ............................................... 55
Adherence to guidelines ................................................................................. 61
SECTION 3: Metrics that did not pass feasibility testing......................................... 67
Drug-resistant infection .................................................................................. 69
Excess Use avoided ......................................................................................... 75
Adverse Drug Events ....................................................................................... 79
Appropriateness .............................................................................................. 81
MEASUREMENT TOOLS FOR ANTIMICROBIAL STEWARDSHIP PROGRAMS

ii
SECTION 4: Metrics that were feasible, but not useful ........................................... 85
DOT over admissions ...................................................................................... 87
Reporting Tool Link ......................................................................................................... 89
References ....................................................................................................................... 91
Appendices ...................................................................................................................... 93
A. Data tables and dictionaries ...................................................................... 95
B. STEWARDS Manuscript............................................................................. 111
C. Sample Reports ......................................................................................... 121
D. Appendix References ............................................................................... 171
DUKE ANTIMICROBIAL STEWARDSHIP OUTREACH NETWORK

Measurement Tools for Antimicrobial Stewardship Programs
Introduction

iv
DUKE ANTIMICROBIAL STEWARDSHIP OUTREACH NETWORK

v
Each year in the United States, over 2 million people are infected with antibiotic resistant bacteria, and nearly 25,000 die from these infections.1 In response to the growing threat of antibiotic resistance, the Centers for Disease Control and Prevention (CDC) and other major health organizations have created guidelines, standards, and recommendations to help hospitals address the need to improve use of antimicrobials.2, 3 Each of these highlights the role of monitoring, analyzing, and responding to local data for successful antimicrobial stewardship program (ASP) success. Despite the importance of data to drive action for stewardship, most facilities have limited access to local data, limited voluntary participation in the National Healthcare Safety Network (NHSN) Antimicrobial Use (AU) Option or other external comparators, and thus an impaired ability to assess the impact of ASPs.4 In addition, assessment of ASPs to this point have often focused on cost-based outcomes, which don’t give an accurate picture of the effect ASPs have on patient health, safety, and antimicrobial resistance. A critical unmet need is to identify and better define metrics that reflect the impact of ASPs on patient outcomes, population health, and the unintended consequences of antimicrobial use.
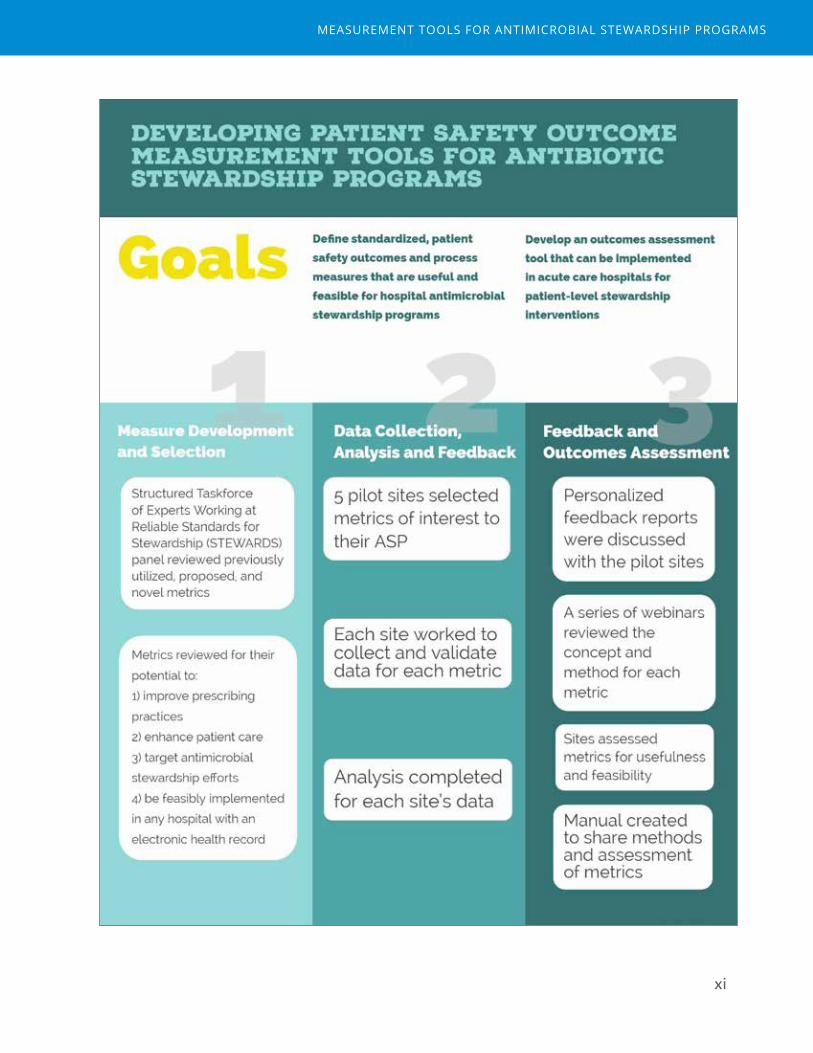
This project aimed to address the foundational need for strong metrics that reflect ASP impact on patient safety and optimized care. We called together some of the top minds in healthcare and drug resistance to create an expert panel. The Structured Taskforce of Experts Working At Reliable Standards for Stewardship (STEWARDS) panel reviewed metrics previously utilized or proposed in the medical literature, and took suggestions from the panel on additional
MEASUREMENT TOOLS FOR ANTIMICROBIAL STEWARDSHIP PROGRAMS

vi
metrics not yet described in the literature. The panel then rated and discussed the list of proposed metrics to identify those that 1) improve antimicrobial prescribing practices 2) improve patient care 3) aid in targeting antimicrobial stewardship efforts and 4) can be feasibly monitored in any hospital with an electronic health record.5 The result of this consensus process provided a list of candidate metrics from which to test the feasibility of data collection, analysis, and feedback in 5 pilot sites.
Working closely with these pilot partner sites, the feasibility of data capture and analysis as well as the utility of each candidate metric to guide local stewardship activities was assessed during on-site visits, frequent communication with the stewardship teams, and formal survey techniques.
This Guide reflects the outcome from this development and feasibility project. The Technical Manual describes in detail the steps taken to define, collect data, and analyze each piloted metric. We also discuss feasibility considerations along with suggestions for routine use.
In addition, we have created a simplified Reporting Tool for days of therapy based antibiotic use and C. difficile rates to make them accessible to front-line antibiotic stewards who have limited access to patient-level data and analysts. Simply using a spreadsheet, we have created a practical tool that will allow hospital staff to input their facility’s aggregate data and receive calculated metrics and graphs as output. We hope this Reporting Tool will facilitate and enhance communication on antimicrobial stewardship in a wide variety of hospital settings.
The Appendix includes three items: data table structures and a data dictionary, a link to the STEWARDS panel manuscript, and samples of the feedback reports we presented to each site during the evaluation phase. These feedback reports were valuable discussion pieces during our assessment of the feasibility and usefulness of each metric.
The completion of this project is certainly not a close to the work needed to demonstrate the impact of antimicrobial stewardship on patient safety. Although this Guide provides important, practical insights about the feasibility of data collection, proposed metric definitions based on electronic data, and structure for a standardized electronic dataset for patient-level analyses, it in no way provides all the answers. Major findings of this project included a lack of clinical outcomes that were felt to be feasible and useful in assessments of ASP impact. In addition, this project further demonstrates that investment into data collection and
DUKE ANTIMICROBIAL STEWARDSHIP OUTREACH NETWORK

vii
analysis tailored to an individual hospital’s electronic health records is necessary for many metrics that go beyond simple quantities of use. Thus, stewards need more support for data infrastructure and analytics. Finally, support for dedicated research into metrics identified here and in the future is necessary to fully demonstrate the impact of antimicrobial stewardship.
We hope you find this Guide to be useful in your antimicrobial stewardship practice.
Enjoy!
Rebekah Moehring, MD, MPH and Elizabeth Dodds Ashley, PharmD Duke Center for Antimicrobial Stewardship and Infection Prevention June 30, 2017
MEASUREMENT TOOLS FOR ANTIMICROBIAL STEWARDSHIP PROGRAMS

viii
DUKE ANTIMICROBIAL STEWARDSHIP OUTREACH NETWORK
ix
Antimicrobial resistance (AMR) is a major global threat to population health, with significant associated morbidity, mortality, and costs. The importance of antimicrobial stewardship (AMS) in the fight against AMR has been emphasized by the World Health Organization and reiterated in the U.S. National Action Plan to Combat AMR. Now is the time to capitalize on the current momentum around AMR to strengthen AMS practice, research, and advocacy.
In the face of emerging requirements and standards for AMS programs in a variety of settings, balanced with the consistent pressure to justify such programs against many competing priorities, the ability to demonstrate the impact of AMS on patient outcomes, population health, and the value of care is critical. Unfortunately, limited data and resources exist to help AMS programs routinely monitor the outcomes of the work they do. Moreover, the majority of outcome studies on stewardship have focused on cost savings. While these studies have been overwhelmingly favorable, the results are not compelling from the perspective of patient safety or population health.
Merck was pleased to work with the CDC Foundation, the CDC, and DASON to develop patient safety outcome measures and measurement tools for AMS programs. The goals of this project were to develop 1) standardized, patient safety outcomes measures that are meaningful and practical for hospital AMS programs and 2) an outcomes assessment tool that can be implemented in acute care hospitals.
MEASUREMENT TOOLS FOR ANTIMICROBIAL STEWARDSHIP PROGRAMS
x
We hope that the resources provided as a result of this project help to:
■ Advance AMS practice by enhancing monitoring and reporting capabilities to inform local AMS strategies
■ Inspire continued research regarding not only which interventions lead to the greatest impact on patient outcomes, population health, and value of care but also which metrics best reflect such impact
■ Stimulate advocacy for the importance of AMS and the need for resource allocation to enable success
Kind regards,
Elizabeth D. Hermsen, Pharm.D., M.B.A., BCPS-AQ(ID) Head, Global Antimicrobial Stewardship Merck & Co., Inc., Kenilworth, NJ, USA
DUKE ANTIMICROBIAL STEWARDSHIP OUTREACH NETWORK
xi
MEASUREMENT TOOLS FOR ANTIMICROBIAL STEWARDSHIP PROGRAMS

xii
DUKE ANTIMICROBIAL STEWARDSHIP OUTREACH NETWORK
xiii
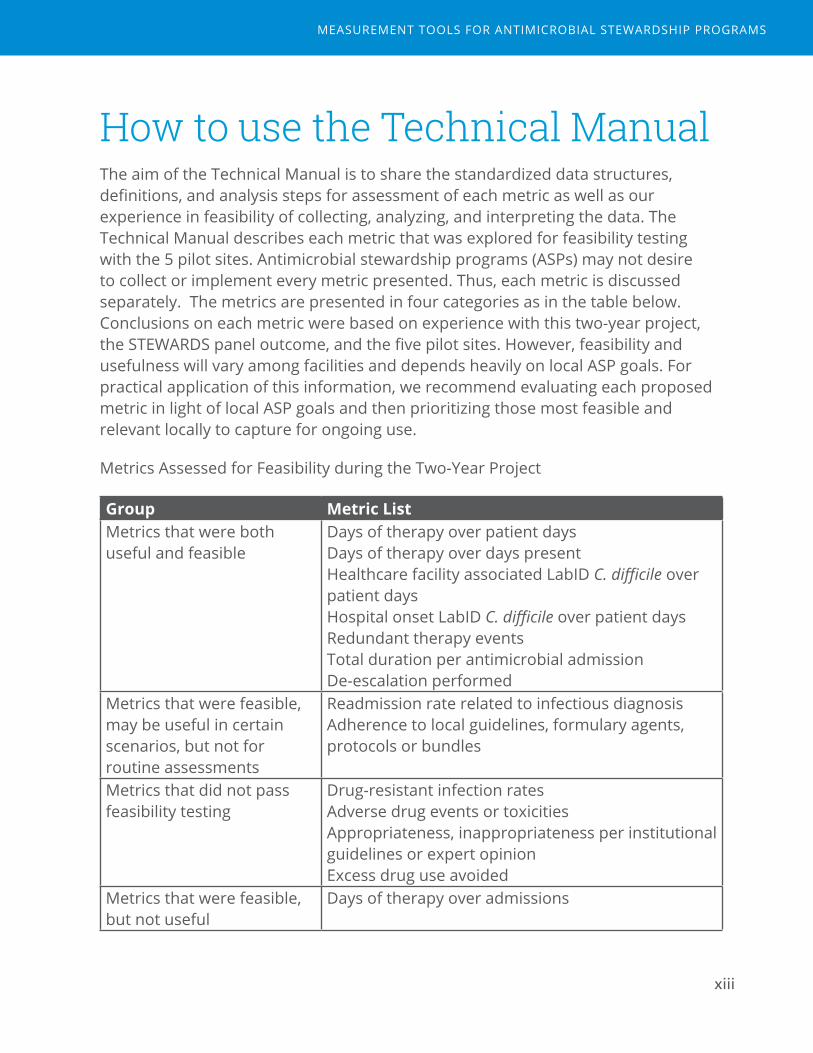
How to use the Technical Manual The aim of the Technical Manual is to share the standardized data structures, definitions, and analysis steps for assessment of each metric as well as our experience in feasibility of collecting, analyzing, and interpreting the data. The Technical Manual describes each metric that was explored for feasibility testing with the 5 pilot sites. Antimicrobial stewardship programs (ASPs) may not desire to collect or implement every metric presented. Thus, each metric is discussed separately. The metrics are presented in four categories as in the table below. Conclusions on each metric were based on experience with this two-year project, the STEWARDS panel outcome, and the five pilot sites. However, feasibility and usefulness will vary among facilities and depends heavily on local ASP goals. For practical application of this information, we recommend evaluating each proposed metric in light of local ASP goals and then prioritizing those most feasible and relevant locally to capture for ongoing use.
Metrics Assessed for Feasibility during the Two-Year Project
Group Metric ListMetrics that were both useful and feasible
Days of therapy over patient daysDays of therapy over days presentHealthcare facility associated LabID C. difficile over patient daysHospital onset LabID C. difficile over patient daysRedundant therapy events Total duration per antimicrobial admissionDe-escalation performed
Metrics that were feasible, may be useful in certain scenarios, but not for routine assessments
Readmission rate related to infectious diagnosisAdherence to local guidelines, formulary agents, protocols or bundles
Metrics that did not pass feasibility testing
Drug-resistant infection rates Adverse drug events or toxicitiesAppropriateness, inappropriateness per institutional guidelines or expert opinion Excess drug use avoided
Metrics that were feasible, but not useful
Days of therapy over admissions
MEASUREMENT TOOLS FOR ANTIMICROBIAL STEWARDSHIP PROGRAMS
xiv
Metrics were considered feasible if electronic definition development, data collection, and analysis were completed within the two-year project timeline. Metrics were considered useful if pilot sites and investigators felt that analyses using the metric could inform decisions about their ASP goals and development.
Rationale and feasibility considerations are presented for all metrics that underwent feasibility testing. For metrics that passed feasibility testing, definitions for each metric, inclusion/exclusion criteria, and the steps of analysis used during this project are also presented. We also state known limitations for each metric and suggestions for routine analysis for use by ASPs. For metrics that did not pass feasibility testing, suggestions for future investigation are offered. Data tables and dictionaries on which the analyses for these metrics were built are included in the Appendix. In our experience, these data extracts could be generated from electronic medical records using reporting functions. In most cases, we worked with an analyst on the hospital report writing team to extract data. These data extracts were not prepared by the stewards at the site. Sample feedback reports prepared by project investigators and used during this project are also provided in the Appendix.
Discussions in the Technical Manual are intended to help core stewardship personnel understand how each metric was defined and calculated, to aid in discussion with information technology specialists, and to help with education of other stakeholders involved in stewardship activities. The “Steps of Analysis” sections outline the analytic steps to produce the metrics used in this project and in the sample reports. For most presented metrics, these steps require analysts with experience manipulating large and complex datasets. We do not expect front-line stewards to perform the analyses using simple spread sheets. The data table files are large and analyses require calculations that include manipulation of date/time variables and collapsing or aggregating across records.
How to use the data dictionary
The data tables and data dictionaries are included as an Appendix to make them easily extractable for discussion with information technology specialists. These tables may also be combined into a relational database linked by a patient and admission identifier. Thus this guide provides the basic structure and information necessary to create a robust antimicrobial stewardship-focused relational database. It also describes the analytic processes taken during this pilot project to standardize and analyze these metrics across different hospital systems.
DUKE ANTIMICROBIAL STEWARDSHIP OUTREACH NETWORK
xv
How to use the sample reports
The sample feedback reports provided in the Appendix were made for the purposes of this project to aid pilot sites’ assessment of the utility of each metric, including a comparison between hospitals. This goal is different than the goal for an individual ASP performing a routine program assessment of internal data. Example feedback reports were not designed for presenting data needed for routine ASP committee review. However, the figures and tables in these sample reports can help in understanding each metric.
MEASUREMENT TOOLS FOR ANTIMICROBIAL STEWARDSHIP PROGRAMS

xvi
1DUKE ANTIMICROBIAL STEWARDSHIP OUTREACH NETWORK

Measurement Tools for Antimicrobial Stewardship Programs
1Metrics that are both useful and feasible

18
DUKE ANTIMICROBIAL STEWARDSHIP OUTREACH NETWORK
19
Days of Therapy over Patient Days or Days Present
Final assessment: Both useful and feasible.
Rationale
The goal of antimicrobial utilization (AU) metrics is to understand the volume of antimicrobial use, patterns of use, and evaluate the impact of stewardship interventions. AU metrics can be calculated on the facility-wide level, or targeted to unit- or agent-specific analyses. Comparison to an external comparator, such as the National Healthcare Safety Network (NHSN) or another network benchmark, can help identify areas to further investigate for improving use. Time trends of AU data are also helpful for tracking ongoing stewardship efforts within an institution and do not require external data to be useful to the stewardship team.
Feasibility Considerations
Many hospitals are now actively accessing antimicrobial use data via electronic medical records in order to calculate days of therapy. For hospitals initiating AU data collection, these data should be captured in a standardized way which can be converted to files compatible with the NHSN AU Option in order to allow for external benchmarking. The NHSN provides a detailed validation guide for use with the AU Option.6 Electronic data must be validated with a manual review of patient-level data. We felt validation was best completed by a collaborative team of data analysts, individuals familiar with NHSN protocols and definitions, and clinician(s) with knowledge of pharmacy practice/products as well as the electronic medical record. Areas to focus during validation of electronic pharmacy data include but are not limited to:
■ Full capture of targeted antimicrobial agents including non-formulary agents, agents with formulation changes over time, and agents formulated with diluents.
■ Mapping of agents to a standard agent list (e.g. Appendix B NHSN AU Option)
■ Mapping of hospital units with the appropriate unit type category
MEASUREMENT TOOLS FOR ANTIMICROBIAL STEWARDSHIP PROGRAMS
20
■ Accurate capture of the unit where the dose was administered
■ Accurate capture of date and time of administration
■ Accurate capture of route of administration, with exclusion of topical or non-systemic routes
The days present metric requires the ability to track individual patients’ movements between hospital units in order to count calendar days of hospital and unit exposure. These data can be complex, and require a mapping procedure to ensure consistency with units identified in the pharmacy data source as well as the patient movement data source. Additional complexities can be encountered with shared rooms/beds, and in units where there is high bed turnover, such as in labor and delivery, nurseries, and mother/baby units. Validation procedures that capture patient census snapshots per unit are most helpful to be sure no patient stays are missing from extracted files. In addition, we found it helpful to compare aggregate days counts from differing electronic sources and/or manual sources. For example, the validator compares aggregate patient days reported by the infection prevention team to those calculated from patient movement data files. Additionally, matching an individual patient’s unit location from the eMAR to the bed flow data should be completed to ensure no missing entries in either data source.
In the pilot sites for this study, infection prevention teams’ existing method for calculating patient days used a different method than that presented below, either manually counting from a daily census list or using an electronic calculation of unit census counts by month that is different than that used below from bed flow files. In our experience, previously existing methods used for patient days counts provides counts to the unit level, but rarely captures down to the individual patient level. One option for sites unable to capture patient movement data is to utilize an infection prevention source for patient days by unit and facility-wide, and then use days of therapy numerators summed from patient-level data.
During our study, all five pilot sites were able to capture and validate both eMAR data sources and bed movement data to calculate AU metrics. We found it most useful to maintain granular, datasets that captured each medication administration and each patient movement. These detailed data were large files but allowed more flexibility for performing analyses down to an individual patient admission. Other complex metrics that require re-assessments over time for an individual patient could also be pursued using the same datasets (See De-escalation performed). Datasets aggregated to
DUKE ANTIMICROBIAL STEWARDSHIP OUTREACH NETWORK

21
hospital unit and month, although very useful in understanding time trends for AU, do not provide the detail needed for patient-level analyses.
Method
Source(s) of Data:
Days of Therapy: pharmacy electronic medication administration records (eMAR) or barcode administration records (BCMA)
Patient Days: infection prevention databases or patient movement data (a.k.a bed flow data or admission/discharge/transfer data) which captures unit to unit transfers
Days Present: patient movement data (a.k.a bed flow data or admission/discharge/transfer data) which captures unit to unit transfers
Definition(s):
Table 1. Key Definitions
Metric DefinitionDays of Therapy6
One DOT represents the administration of a single agent on a given calendar day, even if multiple doses are given on that day. For example, administration of cefazolin as a single dose or as 3 doses given 8 hours apart both represent 1 DOT. Single agents are counted separately and then summed. For example, administration of vancomycin plus ceftazidime on the same calendar day would represent 2 DOT for the same calendar day.
Patient Days7 Count of the number of days a patient is present on an inpatient unit measured at a specific time each day, regardless of administrative status as “inpatient” or “observation.” The steps of analysis presented below use bed flow data and midnight as the census time.
Days Present6
Count of the number of calendar days a patient is present on an inpatient unit for any portion of the calendar day, regardless of administrative status as “inpatient” or “observation.” Days of transfer between inpatient units are not double counted for facility-wide measures. Days present cannot be summed across units to obtain a facility-wide estimate.
Inclusion/Exclusion criteria:
Patients cared for on inpatient units were included, regardless of inpatient
MEASUREMENT TOOLS FOR ANTIMICROBIAL STEWARDSHIP PROGRAMS

22
“status” when housed on the inpatient unit. Any patient who received a dose of antimicrobial while housed on the inpatient unit would be eligible for count of their denominator days as well as days of therapy. Excluded units were outpatient areas (e.g. observation units, emergency departments) and procedural areas (e.g. endoscopy suite, cardiac catheterization lab, operating room). NHSN AU Option provides further guidance on the types of units that should be included in facility-wide estimates.6 Determination of unit mapping, which units were to be included in facility-wide estimates, as well as unit type category (e.g. medical ward, hematology-oncology ward) were made in collaboration with infection prevention teams and according to NHSN AU Option. Agents included in the analyses were those targeted in the NHSN AU Option.
Datasets Needed (See Appendix A for description of data tables and data dictionary):
Data Table 1. eMAR data
Data Table 2. Patient movement data
Steps of Analysis:
1. Days of Therapy estimates from Data Table 1
a. Limit to:
i. NHSN AU Option agents
ii. Inpatient units included in facility wide
b. Collapse rows to one agent and route per calendar day, or remove multiple administrations of the same agent on a single day.
c. Assign 1 day of therapy per calendar day, agentid, route, and unit
d. Sum days of therapy by agentid and route and unit
e. Sum days of therapy by month and route and unit
f. Sum days of therapy by agentid and route (for facility-wide estimates)
g. Sum days of therapy by month and route (for facility-wide estimates)
2. Denominator estimates from Data Table 2
a. Limit to: Inpatient units included in facility wide
b. For unit-level analyses:
i. By admissionid, unitid:
1. Patient days = datepart(locationdismissaldatetime) – datepart(locationarrivaldatetime)
DUKE ANTIMICROBIAL STEWARDSHIP OUTREACH NETWORK
23
2. Days present = datepart(locationdismissaldatetime) – datepart(locationarrivaldatetime) + 1
c. For facility-level analyses:
i. By admissionid (for facility-wide estimates) collapse to first and last unit entry and save first-locationarrivaldatetime and last-locationdismissaldatetime. Calculate patient days and days present as in part 2b.
3. Calculate rates of AU by agent, unit and facility-wide, month, route:
a. DOT/1000 patient days
b. DOT/1000 days present
Education and Interpretation considerations:
Messaging AU to stakeholders must be approached strategically understanding the interests of the targeted audience. For example, an argument to change prescribing rates based on costs of agents would not be as favorably viewed by clinicians who primarily focus on patient care. End users must first understand how days of therapy and patient days or days present are calculated for an individual patient before interpreting data aggregated to unit- and facility-level sums. The concept of person-time may need some discussion and education before interpreting calculated rates.
Some confusion may occur when making the distinction between patient days and days present. The advantage of days present is that this denominator is required for NHSN AU option reporting. Patient days is a standard measure already calculated for any hospital submitting hospital acquired infection data into NHSN. Therefore, patient days may be more readily available without additional data manipulation.
There is no utility in evaluation antibiotic use by both denominators. The measures are fairly similar, but do differ by one day per hospital admission when using a midnight census definition for patient days. In our experience, midnight is a commonly used census time for patient days calculations. However, the one day difference we observed may not apply universally if different census times are utilized for patient days counts. Since days present includes the day of admission, the days present metric resulted in one additional day per hospital admission if patients were admitted after the daily census count. As a result, antibiotic use rates appeared lower with the larger days present denominator. This effect was the largest when reporting data from locations with frequent short admission such as labor and delivery wards. It is important to understand which denominator is being used locally if the stewardship team intends to compare local data to external estimates.
MEASUREMENT TOOLS FOR ANTIMICROBIAL STEWARDSHIP PROGRAMS
24
Known Limitations:1. AU estimates only give information about volume of use, not appropriateness
of use. Thus, interpretations must include plans for further investigation about appropriateness of use before determining if there is an opportunity for improvement.
2. AU data are influenced by multiple other non-modifiable factors in addition to the quality of antimicrobial stewardship: incidence of infection, incidence of multidrug resistant pathogens, patient case-mix, seasonality, and other factors that may change over time. Thus interpretation of trends in AU must consider these other factors.
3. AU estimates using DOT and denominators of patient days or days present do not assist with understanding total durations of therapy. (Further discussion on estimates of durations of therapy are presented in the metric Total Duration.)
Suggested use of metric(s) for routine review and demonstration of impact:
Evaluation of AU data can reveal opportunities for improvement, as well as improvements in use of diagnostics, microbiologic testing and interpretation, and educational needs for clinicians. AU data should be reviewed at least annually, and ideally benchmarked with an external comparator such as the NHSN. Of note, data collected into format for Data Table 1 would need additional analysis to aggregate to month and location in order to standardize for reporting into the NHSN AU Option.
Review of AU data by agent groups often assists in identifying targeted opportunities for stewardship. Helpful agent groupings have been proposed by multiple investigators, but ultimately the agent groups tracked depend on hospital formulary and known areas of interest for a particular facility. Agent groups are helpful in detecting a “squeezing of the balloon” effect where use of a targeted agent shifts toward other agents with similar spectrum of activity. For example, a fluoroquinolone focused initiative may result in reduction in fluoroquinolone use, but a concurrent increase in third- or fourth-generation cephalosporin use. The NHSN AU Option provides five agent groups to be used for local comparisons to national data: all antibacterials, anti-MRSA antibacterial agents, broad spectrum antibacterial agents predominantly used for hospital-onset/multi-drug resistant infections, broad spectrum agents predominantly used for community-acquired infections, and antibacterial agents predominantly used for surgical site infection prophylaxis.6 If areas for improvement are noted and/or focused initiatives are ongoing, then AU should be monitored and trended monthly with focus on targeted units or facility-wide rates and targeted agents or agent groups.
DUKE ANTIMICROBIAL STEWARDSHIP OUTREACH NETWORK
25
Healthcare facility-associated and Hospital-onset C. difficile LabID Events
Final assessment: Both useful and feasible.
Rationale
Prevention of C. difficile infection is a top priority for Antimicrobial Stewardship Programs (ASPs), due to the clear link between antibiotic exposures, healthcare exposures, and risks for subsequent C. difficile infection. Implementation of ASPs can reduce rates of C. difficile by approximately 50%.8 Tracking the incidence of C. difficile can help target ASP initiatives to certain areas or patient populations as well assess the impact of C. difficile focused efforts.
LabID events are used by the National Healthcare Safety Network (NHSN) as an objective, proxy measure for C. difficile infection incidence based on electronic data: positive C. difficile laboratory testing results, patient location, and admission and discharge dates.7,9 This measure of C. difficile infection was used in this project as opposed to other methods (e.g. ICD-10 diagnosis code) because of its current active use by infection prevention teams in all sites and availability.
Feasibility Considerations
C. difficile LabID events are currently collected and reported to NHSN at most US acute care hospitals by the infection prevention program. A notable exception to this is Critical Access Hospitals that do not universally report to NHSN. Some facilities may have automated or electronic definitions for measurement of LabID events. However, this outcome may not be routinely tracked and evaluated by the ASP team. No feasibility barriers were encountered for collection of LabID events at pilot sites. Access to the data did require a request to infection prevention team or direct access through NHSN.
Method
Source(s) of Data: Infection prevention surveillance database and/or NHSN
MEASUREMENT TOOLS FOR ANTIMICROBIAL STEWARDSHIP PROGRAMS
26
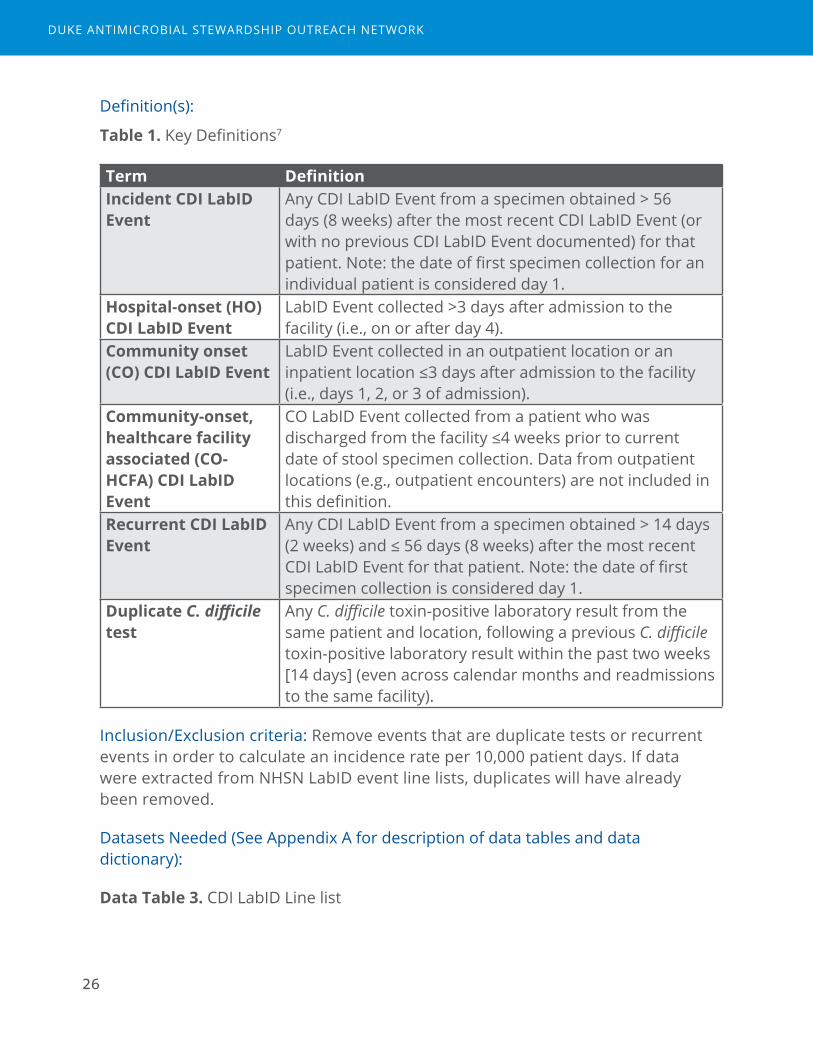
Definition(s):
Table 1. Key Definitions7
Term DefinitionIncident CDI LabID Event
Any CDI LabID Event from a specimen obtained > 56 days (8 weeks) after the most recent CDI LabID Event (or with no previous CDI LabID Event documented) for that patient. Note: the date of first specimen collection for an individual patient is considered day 1.
Hospital-onset (HO) CDI LabID Event
LabID Event collected >3 days after admission to the facility (i.e., on or after day 4).
Community onset (CO) CDI LabID Event
LabID Event collected in an outpatient location or an inpatient location ≤3 days after admission to the facility (i.e., days 1, 2, or 3 of admission).
Community-onset, healthcare facility associated (CO-HCFA) CDI LabID Event
CO LabID Event collected from a patient who was discharged from the facility ≤4 weeks prior to current date of stool specimen collection. Data from outpatient locations (e.g., outpatient encounters) are not included in this definition.
Recurrent CDI LabID Event
Any CDI LabID Event from a specimen obtained > 14 days (2 weeks) and ≤ 56 days (8 weeks) after the most recent CDI LabID Event for that patient. Note: the date of first specimen collection is considered day 1.
Duplicate C. difficile test
Any C. difficile toxin-positive laboratory result from the same patient and location, following a previous C. difficile toxin-positive laboratory result within the past two weeks [14 days] (even across calendar months and readmissions to the same facility).
Inclusion/Exclusion criteria: Remove events that are duplicate tests or recurrent events in order to calculate an incidence rate per 10,000 patient days. If data were extracted from NHSN LabID event line lists, duplicates will have already been removed.
Datasets Needed (See Appendix A for description of data tables and data dictionary):
Data Table 3. CDI LabID Line list
DUKE ANTIMICROBIAL STEWARDSHIP OUTREACH NETWORK
27
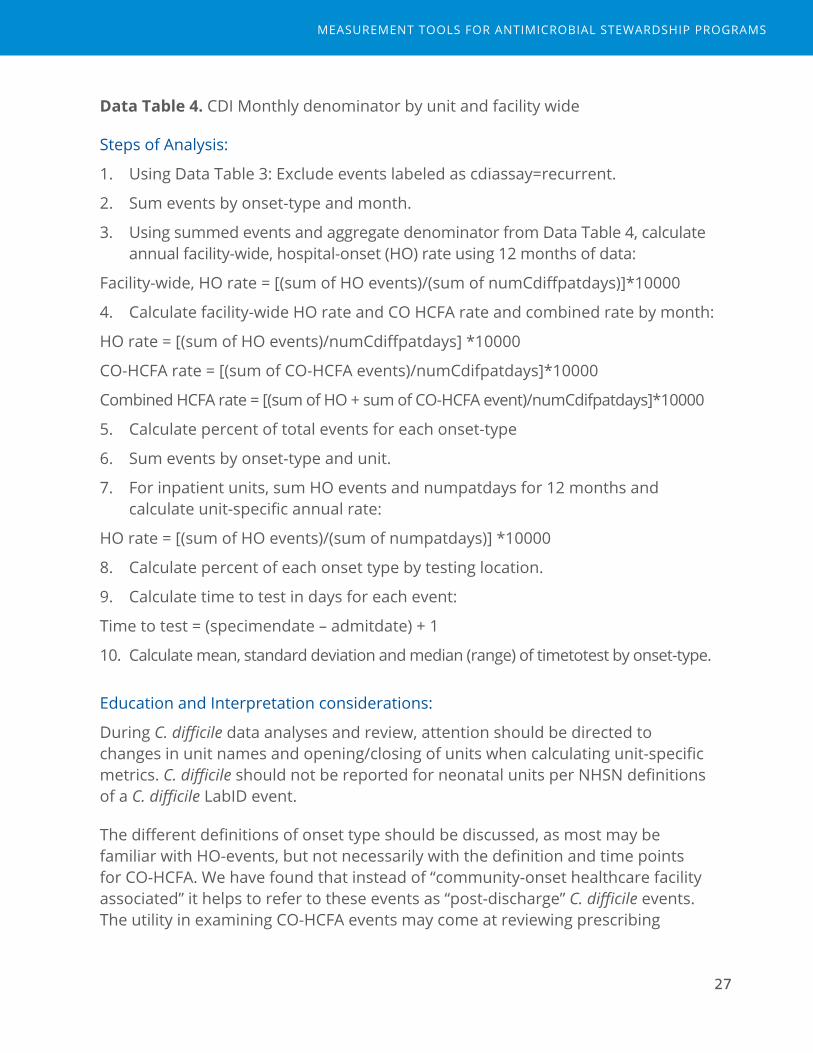
Data Table 4. CDI Monthly denominator by unit and facility wide
Steps of Analysis:
1. Using Data Table 3: Exclude events labeled as cdiassay=recurrent.
2. Sum events by onset-type and month.
3. Using summed events and aggregate denominator from Data Table 4, calculate annual facility-wide, hospital-onset (HO) rate using 12 months of data:
Facility-wide, HO rate = [(sum of HO events)/(sum of numCdiffpatdays)]*10000
4. Calculate facility-wide HO rate and CO HCFA rate and combined rate by month:
HO rate = [(sum of HO events)/numCdiffpatdays] *10000
CO-HCFA rate = [(sum of CO-HCFA events)/numCdifpatdays]*10000
Combined HCFA rate = [(sum of HO + sum of CO-HCFA event)/numCdifpatdays]*10000
5. Calculate percent of total events for each onset-type
6. Sum events by onset-type and unit.
7. For inpatient units, sum HO events and numpatdays for 12 months and calculate unit-specific annual rate:
HO rate = [(sum of HO events)/(sum of numpatdays)] *10000
8. Calculate percent of each onset type by testing location.
9. Calculate time to test in days for each event:
Time to test = (specimendate – admitdate) + 1
10. Calculate mean, standard deviation and median (range) of timetotest by onset-type.
Education and Interpretation considerations:
During C. difficile data analyses and review, attention should be directed to changes in unit names and opening/closing of units when calculating unit-specific metrics. C. difficile should not be reported for neonatal units per NHSN definitions of a C. difficile LabID event.
The different definitions of onset type should be discussed, as most may be familiar with HO-events, but not necessarily with the definition and time points for CO-HCFA. We have found that instead of “community-onset healthcare facility associated” it helps to refer to these events as “post-discharge” C. difficile events. The utility in examining CO-HCFA events may come at reviewing prescribing
MEASUREMENT TOOLS FOR ANTIMICROBIAL STEWARDSHIP PROGRAMS

28
practices at transitions of care, partnering with other facilities’ stewardship programs (e.g. long-term care facilities), and understanding the impact of inpatient antimicrobial decisions that may have unintended effects after discharge. Further, understanding the burden of community-onset (CO) prevalence of C. difficile may help motivate and better understand the role for outpatient stewardship activities.
Known Limitations:
1. C. difficile events are impacted by infection prevention and disinfection practices in addition to antimicrobial stewardship.
2. LabID events are proxy measures for “true” infection events, and may be impacted by testing practices (e.g. change in testing assay, delayed testing or over-testing), patient case mix, and colonization events.
Suggested use of metric for routine review and demonstration of impact:
C. difficile LabID HO and CO-HCFA events should be reviewed at least annually. Hospitals should be benchmarked with the NHSN SIR as a routine, in collaboration with infection prevention. If areas for improvement are noted and/or C. difficile-focused initiatives are ongoing, then HO C. difficile LabID incidence should be monitored and trended monthly with focus on targeted or high-risk units.
Interpreting C. difficile incidence alongside AU rates may be a helpful exercise to demonstrate correlation. This correlation can call providers’ attention to the unintended consequences caused by antimicrobial overuse. Monthly C. difficile incidence may not be as helpful to look for this association as a rate calculated over a longer (e.g. annual or quarterly) time period since C. difficile is an infrequent event in some facilities. Areas with C. difficile focused stewardship initiatives should aim to track both AU and C. difficile over time to look for impact.
DUKE ANTIMICROBIAL STEWARDSHIP OUTREACH NETWORK
29
Redundant therapy events
Final assessment: Both useful and feasible.
Rationale
Scenarios where patients simultaneously receive more than one antimicrobial that has activity against the same type of pathogen may represent excess exposures and be a target for intervention by Antimicrobial Stewardship Programs (ASPs). A few clinical scenarios are appropriate to have “double coverage” or “combination therapy.” For example, use of two beta-lactam agents together may be appropriate for treatment of Enterococcal endocarditis or suspected bacterial meningitis prior to the availability of microbiology data. These occurrences, however, should be very infrequent. In contrast, some redundant spectrum events may be more frequent, but have a limited duration of appropriateness. For example, “double coverage” for resistant gram-negative pathogens is generally accepted as standard care for patients with suspected ventilator associated pneumonia in institutions with higher incidence of gram-negative resistant pathogens. However, de-escalation should occur when microbiology data return in 48-72 hours. Thus, while the occurrence may be more frequent in the ICU setting, the duration of the redundant event should be short.
There may be several potential reasons that clinicians choose to use redundant antimicrobials, some of which could be improved by the ASP: correcting inadvertent errors within the ordering process and review (e.g. provider forgot to discontinue an existing order when placing a new antibiotic order), correcting misunderstandings about spectrum of activity, addressing the “more is better” mentality, and addressing concerns about resistant pathogens or source control.
Objective definitions of redundant events and redundant days of therapy could assist ASPs in review of such clinical scenarios for safety reasons as well as an evaluation of appropriateness. In fact, redundant events may be the closest scenario to a “never event” that could happen in antimicrobial stewardship. Change in the frequency or duration of redundant events could demonstrate the impact of ASP interventions to improve care and optimize antimicrobial use.
MEASUREMENT TOOLS FOR ANTIMICROBIAL STEWARDSHIP PROGRAMS
30
Feasibility Considerations
Application of the method below requires admission-level antimicrobial eMAR data. These data would be available for institutions that have already accessed pharmacy AU data sources for calculation of days of therapy. Calculation of the redundant event metrics, however, require more advanced analyst time.
All five pilot sites in our project were able to apply this metric to their antimicrobial data, but this was in large part due to the supported analyst time available through the project. Institutions preparing to implement routine measurement and reporting of this metric would require dedicated analyst time to be successful. It is difficult to estimate the analyst time needed for this metric, since this metric was developed during the course of this project as an iterative process.
Method
Source(s) of Data: Pharmacy electronic medication administration records (eMAR).
Definition(s):
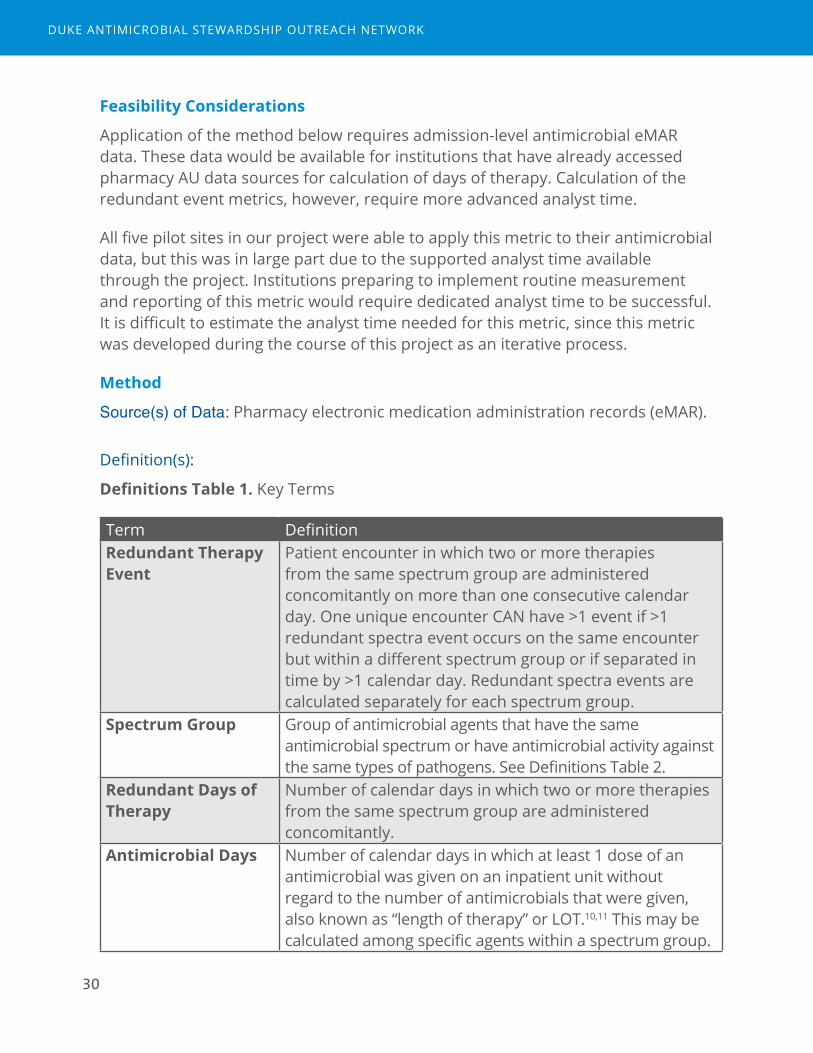
Definitions Table 1. Key Terms
Term DefinitionRedundant Therapy Event
Patient encounter in which two or more therapies from the same spectrum group are administered concomitantly on more than one consecutive calendar day. One unique encounter CAN have >1 event if >1 redundant spectra event occurs on the same encounter but within a different spectrum group or if separated in time by >1 calendar day. Redundant spectra events are calculated separately for each spectrum group.
Spectrum Group Group of antimicrobial agents that have the same antimicrobial spectrum or have antimicrobial activity against the same types of pathogens. See Definitions Table 2.
Redundant Days of Therapy
Number of calendar days in which two or more therapies from the same spectrum group are administered concomitantly.
Antimicrobial Days Number of calendar days in which at least 1 dose of an antimicrobial was given on an inpatient unit without regard to the number of antimicrobials that were given, also known as “length of therapy” or LOT.10,11 This may be calculated among specific agents within a spectrum group.
DUKE ANTIMICROBIAL STEWARDSHIP OUTREACH NETWORK
31
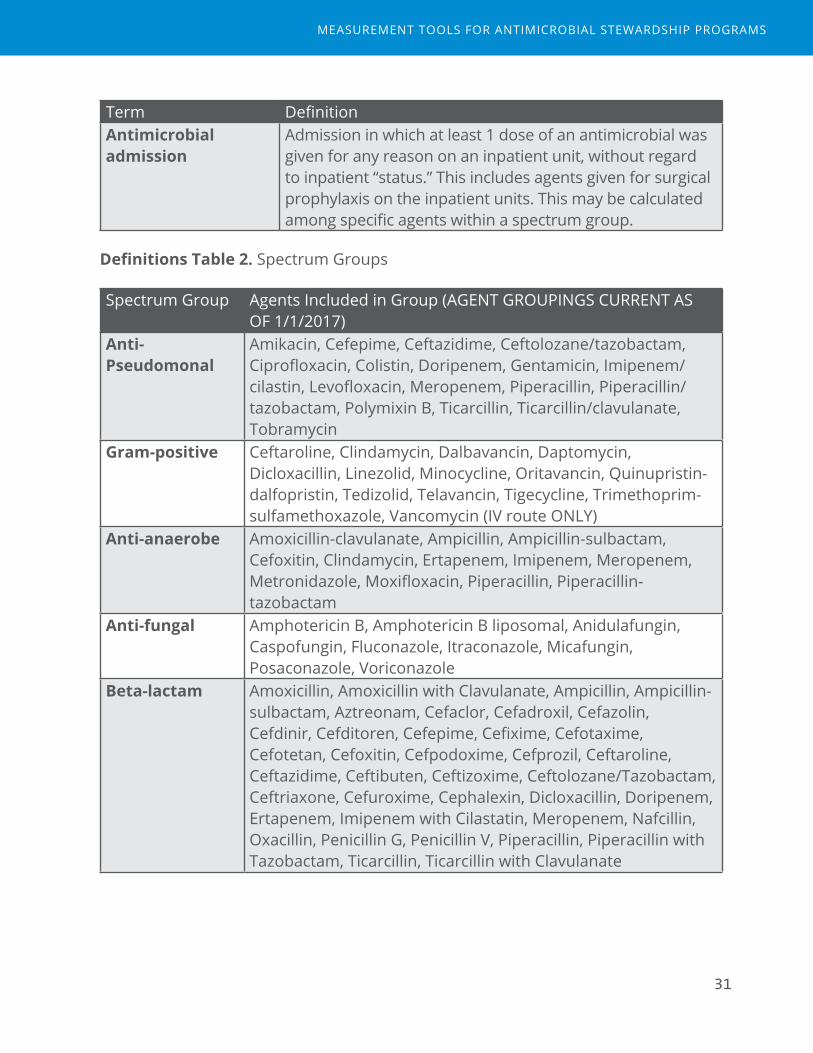
Term DefinitionAntimicrobial admission
Admission in which at least 1 dose of an antimicrobial was given for any reason on an inpatient unit, without regard to inpatient “status.” This includes agents given for surgical prophylaxis on the inpatient units. This may be calculated among specific agents within a spectrum group.
Definitions Table 2. Spectrum Groups
Spectrum Group Agents Included in Group (AGENT GROUPINGS CURRENT AS OF 1/1/2017)
Anti-Pseudomonal
Amikacin, Cefepime, Ceftazidime, Ceftolozane/tazobactam, Ciprofloxacin, Colistin, Doripenem, Gentamicin, Imipenem/cilastin, Levofloxacin, Meropenem, Piperacillin, Piperacillin/tazobactam, Polymixin B, Ticarcillin, Ticarcillin/clavulanate, Tobramycin
Gram-positive Ceftaroline, Clindamycin, Dalbavancin, Daptomycin, Dicloxacillin, Linezolid, Minocycline, Oritavancin, Quinupristin-dalfopristin, Tedizolid, Telavancin, Tigecycline, Trimethoprim-sulfamethoxazole, Vancomycin (IV route ONLY)
Anti-anaerobe Amoxicillin-clavulanate, Ampicillin, Ampicillin-sulbactam, Cefoxitin, Clindamycin, Ertapenem, Imipenem, Meropenem, Metronidazole, Moxifloxacin, Piperacillin, Piperacillin-tazobactam
Anti-fungal Amphotericin B, Amphotericin B liposomal, Anidulafungin, Caspofungin, Fluconazole, Itraconazole, Micafungin, Posaconazole, Voriconazole
Beta-lactam Amoxicillin, Amoxicillin with Clavulanate, Ampicillin, Ampicillin-sulbactam, Aztreonam, Cefaclor, Cefadroxil, Cefazolin, Cefdinir, Cefditoren, Cefepime, Cefixime, Cefotaxime, Cefotetan, Cefoxitin, Cefpodoxime, Cefprozil, Ceftaroline, Ceftazidime, Ceftibuten, Ceftizoxime, Ceftolozane/Tazobactam, Ceftriaxone, Cefuroxime, Cephalexin, Dicloxacillin, Doripenem, Ertapenem, Imipenem with Cilastatin, Meropenem, Nafcillin, Oxacillin, Penicillin G, Penicillin V, Piperacillin, Piperacillin with Tazobactam, Ticarcillin, Ticarcillin with Clavulanate
MEASUREMENT TOOLS FOR ANTIMICROBIAL STEWARDSHIP PROGRAMS
32
Inclusion/Exclusion criteria:
Patients cared for on inpatient units were included, regardless of inpatient “status” when housed on the inpatient unit. Any patient who received a dose of antimicrobial while housed on an inpatient unit would be eligible for count as an antimicrobial admission or antimicrobial day. Excluded units were outpatient areas (e.g. observation units, emergency departments) and procedural areas (e.g. endoscopy suite, cardiac catheterization lab, operating room). Administrations of agents in Definition Table 2 were included except for digestive vancomycin and respiratory (inhaled) aminoglycosides with the intent to capture systemically absorbed antimicrobials. Redundant events and redundant days of therapy were calculated on an admission level, regardless of if the patient moved from one inpatient unit to another.
At minimum, a year of antimicrobial admissions should be included in the analyses.
Datasets Needed (See Appendix A for description of data tables and data dictionary): Data Table 1. eMAR data
Steps of Analysis:
1. Define redundant events and assign spectrum group(s) according to definitions above. Some events may belong in >1 spectrum group (e.g. both anti-pseudomonal and beta-lactams).
2. Count redundant days by spectrum group
a. Per event, sum the number of calendar days where 2 or more agents from the same spectrum group were given
3. Sum antimicrobial days and antimicrobial admissions by spectrum group
4. Calculate rates by spectrum group
a. Events per 100 antimicrobial days
b. Events per 100 antimicrobial admissions
c. Redundant days of therapy per 100 antimicrobial days
d. Redundant days of therapy per 100 antimicrobial admissions
5. Calculate number of spectrum-specific events and percent of all spectrum events, sum of redundant days of therapy, and median (interquartile range) of redundant days of therapy per event.
6. Calculate the number of events, redundant days of therapy, and redundant days of therapy per event, for each specific agent combination.
DUKE ANTIMICROBIAL STEWARDSHIP OUTREACH NETWORK

33
7. Define unit of the redundant event as the unit of administration on day 1 of the event. Calculate redundant events, redundant days of therapy, and redundant days of therapy per event by unit.
Education and Interpretation considerations:
An initial understanding of antimicrobial spectrum of activity is necessary to understand why certain agents belong in each spectrum group. This, in itself, may be helpful in correcting misunderstandings about antimicrobial spectrum.
Several key points are helpful to make in understanding redundant event analyses:
1. Switch days are not categorized as redundant events. A redundant event requires two consecutive calendar days of 2 or more agents in the same spectrum category. This ensures that days when therapy is intentionally changed does not appear as a redundant event. The minimum redundant days of therapy count is 2 per event (Figure 1). In the example below, on Day 3 of therapy, the patient is intentionally changed from cefepime to meropenem and this does not represent redundant therapy but rather a conscious change in agent.
Figure 1. Examples of switch day versus a redundant event
Example 1. Switch day (day 3, NOT a redundant event)
Calendar Day 1 2 3 4Agent 1 Cefepime Cefepime CefepimeAgent 2 Meropenem Meropenem
Example 2. Redundant Event
Calendar Day 1 2 3 4Agent 1 Cefepime Cefepime CefepimeAgent 2 Meropenem Meropenem MeropenemEvent 1
Redundant DOT
1 2
Note: In Example 1, day 3 does not represent a redundant event. In Example 2, meropenem was added on day 2 and continued into day 3, which does represent a redundant event and 2 redundant days of therapy.
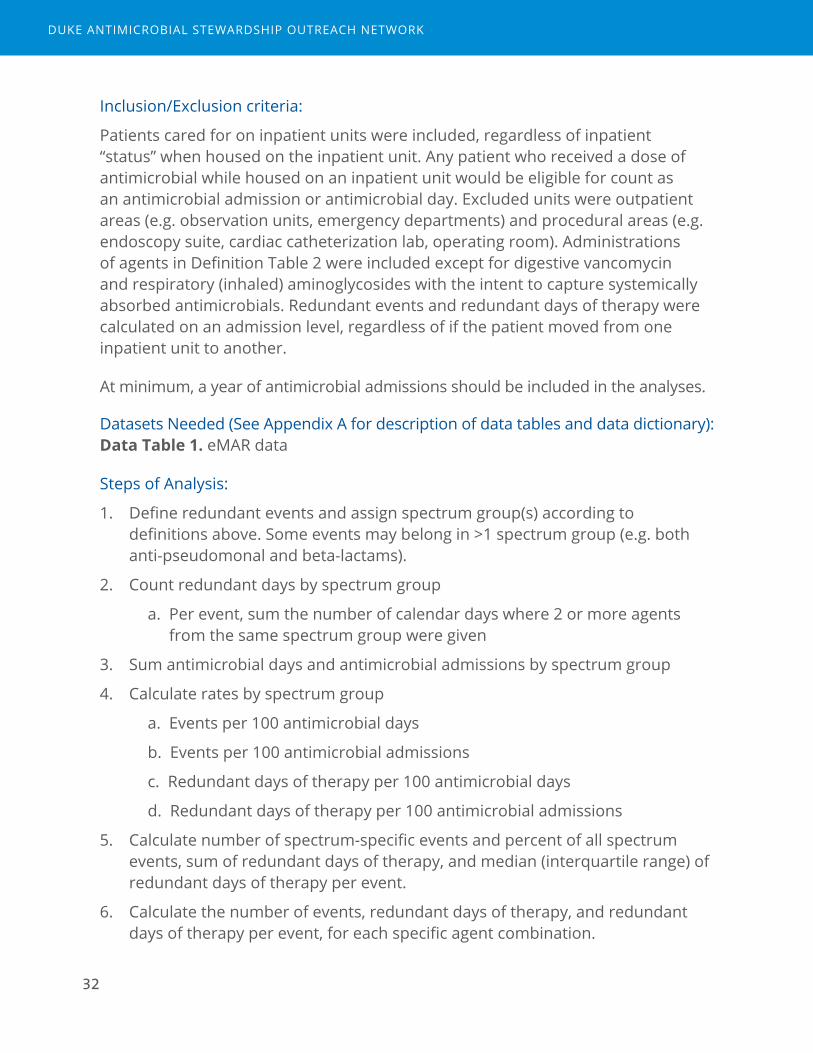
2. Events with 3 or more agents per event may require further explanation. Three-way events do not require that 3 agents were given simultaneously, only that at least 2 agents from the same group were given on the same calendar
MEASUREMENT TOOLS FOR ANTIMICROBIAL STEWARDSHIP PROGRAMS
34
day. Most 3-way events occur because one of the two agents was switched for another in the same spectrum group, and the second was also continued (Figure 2).
Figure 2. Example of redundant event involving three agents
Calendar Day
1 2 3 4 5 6 7 8
Agent 1 Pip/Tazo
Pip/Tazo
Pip/Tazo
Agent 2 Cipro Cipro Cipro Cipro Cipro Cipro Cipro CiproAgent 3 Mero Mero Mero Mero Mero MeroEvent 1
Redundant DOT
1 2 3 4 5 6 7 8
3. The same antimicrobial admission can have greater than one redundant event if:
a. The same event qualifies in more than one spectrum group
i. Example: Event involving Meropenem + Cefepime qualifies in both the beta-lactam spectrum group and the anti-pseudomonal spectrum group.
b. If there are two events separated in time by more than 1 calendar day (Figure 3).
Figure 3. Example of two redundant events within the same antimicrobial admission separated in time.
Calendar Day
1 2 3 4 5 6
Agent 1 Pip/Tazo Pip/Tazo Pip/Tazo Pip/Tazo Pip/Tazo Pip/TazoAgent 2 Cipro Cipro Cipro CiproEvent 1 2
Redundant DOT
1 2 4 5
Retrospective review and feedback of individual cases or patients identified by the redundant event metric may help in understanding how the metric is employed as well as rationale for use of redundant therapy. This can lead to better understanding of the drivers of this prescribing behavior. For example, a small number of anti-anaerobe redundant events may be related to patients who have a primary infection requiring broad therapy but have a secondary C. difficile infection
DUKE ANTIMICROBIAL STEWARDSHIP OUTREACH NETWORK
35
treated with metronidazole as well. In this scenario, double anaerobic coverage may be considered an appropriate choice, or the clinician may be able to change to a different agent without duplicate anti-anaerobe coverage for the primary infection (e.g. switch piperacillin-tazobactam to ceftazidime plus metronidazole).
Known Limitations:
1. Spectrum groups may not be meaningful to all institutions. For example, community hospital settings may not experience any redundant anti-fungal events, thus this would not be a helpful spectrum group to track longitudinally. Further, some institutions may find that redundant therapy events are very infrequent and often appropriate. Thus, redundant events may not be an intervention opportunity for their ASP.
2. Redundant events that involve renal dosing of aminoglycosides and vancomycin would not be captured because the definition of the event requires two consecutive days of redundant therapy.
3. This metric does not assess for appropriateness. An “appropriate” incidence of redundant events is unknown. We believe, however, that an external comparator or multihospital data can help in identifying where an institution may have opportunity to improve.
Suggested use of metric(s) for routine review and demonstration of impact:
Evaluation of redundant event data can reveal opportunities for improvement in antibiotic choice and duration, as well as improvements in use of diagnostics, microbiologic testing and interpretation, and educational needs for clinicians.
Redundant event data should be reviewed at least annually, and ideally benchmarked with system or network rates from other institutions. If areas for improvement are noted and/or focused initiatives are ongoing, then redundant events should be monitored and trended quarterly with focus on targeted units and spectrum groups. Monthly trending of the number of events with review of individual patients may be helpful, but rates and benchmarking likely need at least a year of data to be meaningful, depending on the frequency of events.
MEASUREMENT TOOLS FOR ANTIMICROBIAL STEWARDSHIP PROGRAMS

36
DUKE ANTIMICROBIAL STEWARDSHIP OUTREACH NETWORK

37
Total Duration
Final assessment: Both useful and feasible.
Rationale
In-hospital antimicrobial durations only capture a portion of the total antimicrobial exposure attributable to that inpatient stay. ASPs aim to impact all antimicrobial exposures that occur during admission and post-discharge by promoting appropriate durations of therapy. The goals for this analysis are to 1. quantify the total days of antimicrobial exposure attributed to that hospitalization and 2. understand the degree of antimicrobial exposure that occurs post-discharge.
Potential causes of excessive duration may be multiple. In some cases, errors in ordering or electronic system “defaults” for outpatient prescriptions may result in longer durations than intended. In other cases, extended durations may be prescribed due to lack of knowledge, uncertainty about the patient’s diagnosis or readiness for discharge, or inadequate attention to the task of calculating the intended total duration of therapy.
Measurements of total durations of therapy could assist ASPs in review of appropriate durations for syndrome-focused stewardship initiatives, help in identifying gaps in transitions in care, or areas to educate providers on appropriate management. Tracking changes in total durations could demonstrate the impact of ASP interventions to optimize antimicrobial use with shorter durations that may not be evident when evaluating in-hospital durations.
Feasibility Considerations
Application of the method below requires inpatient admission-level antimicrobial eMAR data. These data would be available for institutions that have already accessed pharmacy AU data sources for calculation of inpatient days of therapy. In addition, admission-level discharge prescription orders data must be accessed and then linked to the inpatient data source for calculation of total duration.
Three of five pilot sites in our project were able to capture electronic discharge prescription data and apply this metric. The two sites unable to capture discharge
MEASUREMENT TOOLS FOR ANTIMICROBIAL STEWARDSHIP PROGRAMS
38
prescriptions encountered barriers of competing IT priorities despite these data being present in their EHR (Epic). Capture of electronic prescriptions would have required a specific extract report which was not prioritized by their health system despite local requests from hospital leadership.
Two of the five sites had access to an existing report of electronic prescriptions from their system (Epic™), which was then subset to include only anti-infectives. This existing report provided the SIG and quantity number, but did not quantify days of therapy. Therefore, additional analyst time was required to calculate the post-discharge durations. These calculations required significant amounts of analyst time because the SIG was manually entered (approximately 80 analyst hours). Analysts used pattern matching to determine the values. In general, many entries fit into patterns like “Take X tablet every Y hours”, where the X and Y values can be used in combination with the dispensed amount to calculate the duration. In an iterative process, a pattern was added to the script, run through, assessed by the analyst to determine how many could be translated by the new pattern, and then moved to another. Analysts also filtered out topicals, drops, and other non-systemic routes, based on what was listed in the SIG. Some durations still could not be calculated because there wasn’t enough information (e.g. missing dispense amount or not enough info in the SIG). In those cases, a null duration was assigned and post-discharge days could not be calculated. In addition, the discharge prescriptions from the existing file had to be linked to inpatient admissions, a process which could have introduced error and also required analyst time (approximately 40 hours). Patient medical record number (MRN) and order date/time was matched to the encounters already stored in the inpatient database from eMAR files. If the MRN matched, and the order date fell within the admission and discharge dates, the prescribed drug was assumed to go with that admission. If the prescribed drug entry did not match to an admission (either because the MRN was not in inpatient data, or the order date did not fall within the stored admission/discharge dates for any admission for the MRN), it was not matched and therefore was not included as they were assumed to come from outpatient areas.
At the third pilot site, missing data in the electronic discharge prescriptions were discovered by manual review. This hospital’s system (McKesson) captured days duration from electronic orders data. However, upon review of a sample of patients not included in electronic discharge orders data, validators found that written prescriptions were provided to patients and an intent to prescribe upon discharge was documented in clinical discharge summaries. Some written prescriptions had been scanned into the electronic record but many had not.
DUKE ANTIMICROBIAL STEWARDSHIP OUTREACH NETWORK

39
Thus, capture of discharge prescriptions electronically was incomplete due to varied local adherence to use of the electronic record for discharge processes.
Institutions preparing to implement routine measurement and reporting of this metric would require dedicated analyst time to be successful. When preparing data extracts for electronic discharge prescriptions, a key field to include is the duration for the order (in days) as well as both MRN and admission identifiers that match and link those used for inpatient eMAR data. Finally, a manual validation of the electronic prescription data should be undertaken to detect any missing data or varied practice. A sampling of patients with and without known discharge scripts data should be reviewed in order to identify potential scenarios: the proportion with missing electronic prescriptions that received written or phone prescriptions, the proportion of patients discharged to and receiving antimicrobials from long term care facilities, and other potential reasons. Missing data, if affecting a significant amount of patients, could bias interpretations.
Method
Source(s) of Data: Described in Appendix A for each included data table.
Definition(s):
Definitions Table 1. Key Terms
Inpatient days of therapy
Number of calendar days in which at least 1 dose of an antibacterial was given, counting separate agents individually, based on electronic MAR data. Therefore 2 agents given on a single calendar day would be 2 DOT.
Discharge days of therapy
Number of intended outpatient days of therapy calculated from the sig and quantity fields in the electronic discharge prescription (e-script) data, counting separate agents individually (See Definitions Table 2).
Sum of days of therapy (days)
Inpatient days of therapy + discharge days of therapy
Total duration (or length of therapy in days)
Inpatient length of therapy + discharge length of therapy. Length of therapy (LOT) is the count of calendar days of antimicrobial exposure irrespective of number of antimicrobial agents.
MEASUREMENT TOOLS FOR ANTIMICROBIAL STEWARDSHIP PROGRAMS

40
Definitions Table 2. Example electronic prescription data and calculated discharge days of therapy
Description AMOXICILLIN 875 MG-POTASSIUM CLAVULANATE 125 MG TABLET
Sig Take 1 tablet (875 mg total) by mouth every 12 (twelve) hours.
Quantity 14 tablet(Calculated) Discharge Days of Therapy
7 days
Inclusion/Exclusion criteria:
Patients cared for on inpatient units were included, regardless of inpatient “status” when housed on the inpatient unit. Any patient who received a dose of antimicrobial while housed on an inpatient unit would be eligible for count as a day of therapy. Excluded units were outpatient areas (e.g. observation units, emergency departments) and procedural areas (e.g. endoscopy suite, cardiac catheterization lab, operating room). Agents included in the analyses were any systemic route (excluding topicals, drops), and agents included in the NHSN AU Option (e.g. excludes HIV medications.)
Datasets Needed (See Appendix A for description of data tables and data dictionary):
Data Table 1. eMAR data
Data Table 2. Patient movement data
Data Table 5. Electronic discharge prescriptions
Data Table 6. Demographic and Admission data
Data Table 7. CCS Diagnosis Category
Steps of Analysis:
1. Identify sample of inpatient admissions from patient movement data (Data table 2):
a. Apply time period restriction
b. Apply restriction to inpatient areas.
DUKE ANTIMICROBIAL STEWARDSHIP OUTREACH NETWORK
41
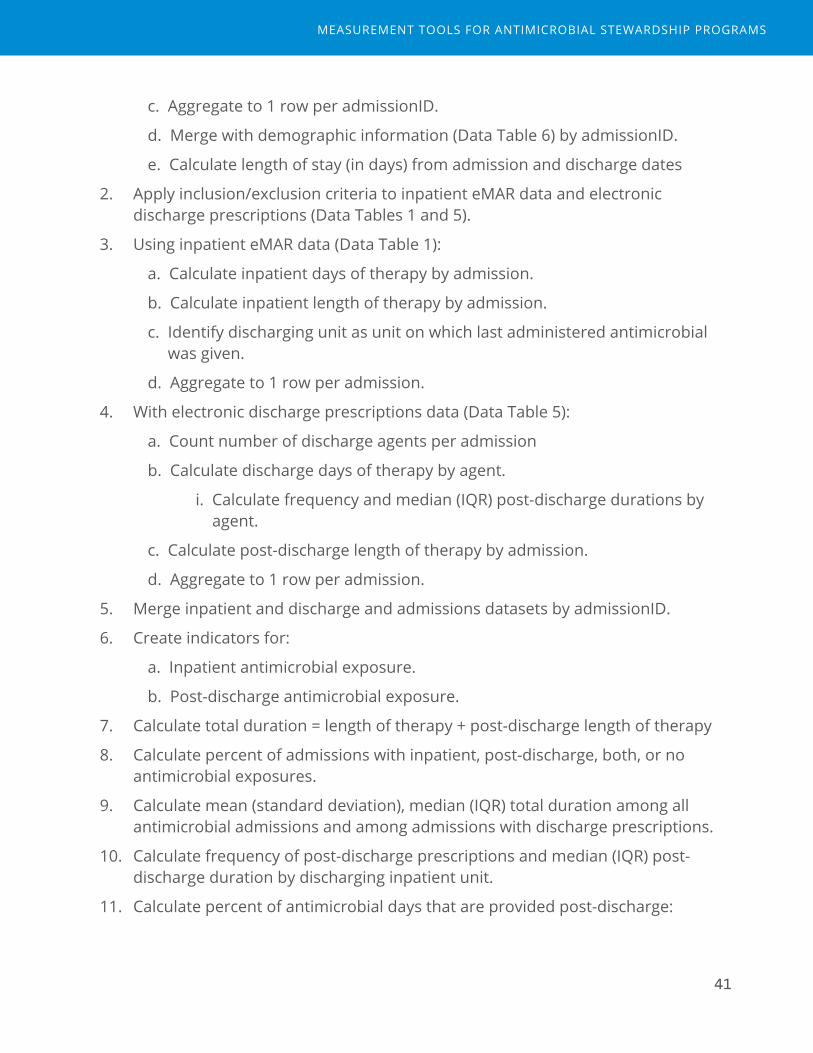
c. Aggregate to 1 row per admissionID.
d. Merge with demographic information (Data Table 6) by admissionID.
e. Calculate length of stay (in days) from admission and discharge dates
2. Apply inclusion/exclusion criteria to inpatient eMAR data and electronic discharge prescriptions (Data Tables 1 and 5).
3. Using inpatient eMAR data (Data Table 1):
a. Calculate inpatient days of therapy by admission.
b. Calculate inpatient length of therapy by admission.
c. Identify discharging unit as unit on which last administered antimicrobial was given.
d. Aggregate to 1 row per admission.
4. With electronic discharge prescriptions data (Data Table 5):
a. Count number of discharge agents per admission
b. Calculate discharge days of therapy by agent.
i. Calculate frequency and median (IQR) post-discharge durations by agent.
c. Calculate post-discharge length of therapy by admission.
d. Aggregate to 1 row per admission.
5. Merge inpatient and discharge and admissions datasets by admissionID.
6. Create indicators for:
a. Inpatient antimicrobial exposure.
b. Post-discharge antimicrobial exposure.
7. Calculate total duration = length of therapy + post-discharge length of therapy
8. Calculate percent of admissions with inpatient, post-discharge, both, or no antimicrobial exposures.
9. Calculate mean (standard deviation), median (IQR) total duration among all antimicrobial admissions and among admissions with discharge prescriptions.
10. Calculate frequency of post-discharge prescriptions and median (IQR) post-discharge duration by discharging inpatient unit.
11. Calculate percent of antimicrobial days that are provided post-discharge:
MEASUREMENT TOOLS FOR ANTIMICROBIAL STEWARDSHIP PROGRAMS

42
(Sum of discharge length of therapy / Sum of total length of therapy) *100
12. Calculate total duration by syndrome
a. Merge dataset from analysis step 5 with Data Table 7 where CCSCategory equal the codes by category in Analysis Table 1.
b. Calculate length of stay, total duration, inpatient length of therapy, and post-discharge length of therapy by syndrome.
Analysis Table 1. Infection diagnosis categories
Category CCS Code(s) CCS Code DescriptionPneumonia 122 PneumoniaUrinary tract 159 Urinary tract infectionSkin and soft tissue 197 Skin and soft tissue infectionIntra-abdominal 142 or 146 or 148 or 149 Appendicitis and other appendiceal
conditions; Diverticulosis and diverticulitis; Peritonitis and intestinal abscess; Biliary tract disease
Education and Interpretation considerations:
Review of total duration and post-discharge duration data among members of the ASP team and feeding this information back to front-line providers serves several purposes. First, it raises awareness that a key decision in infection management involves consideration of duration of therapy. Second, providers must become aware that a key opportunity to apply stewardship principles for duration of therapy comes just before discharge. This awareness may help emphasize the need for stewardship at transitions of care. In general, the concept of days of therapy occurring during and after hospitalization is not difficult to understand. The challenge in making this metric relevant is to convince providers that opportunities for improvement exist.
Essential points for education regarding this metric are the known limitations (below) and the likely underestimate of post-discharge antibiotic days given missing data. Second, an emphasis on syndromic approach to duration decisions may be more acceptable to prescribers rather than review by agent. However, key agents may also be targets to avoid in discharge prescriptions (e.g., fluoroquinolones). These data may also help engage pharmacists reviewing
DUKE ANTIMICROBIAL STEWARDSHIP OUTREACH NETWORK

43
medication reconciliation prior to discharge in taking a more active role in determining durations for antimicrobials.Known Limitations:
1. There are known missing data from admissions in which post-discharge days would not be captured by electronic discharge prescription data (e.g. discharge to long-term care settings, management of antibiotic administrations at dialysis or infusion centers or home health).
2. Difficulty in calculating durations from sig and quantity, especially for intravenous formulations.
3. Significant need for analyst time and multiple datasets as well as analysis steps may impact feasibility for many ASPs.
4. This metric does not assess for appropriateness. Appropriate durations may depend on many patient-specific factors. Assessment of durations by location and syndrome, however, may uncover areas to further investigate and improve.
5. Mean and median may not accurately capture potential opportunities, depending on the skew and shape of the distribution of total duration. Another alternative measure may be proportion of admissions with durations greater than an absolute cut off deemed appropriate (e.g. percent of admissions greater than 5 days total duration for pneumonia).
Suggested use of metric(s) for routine review and demonstration of impact:
Evaluation of total durations data can reveal opportunities for improvement in antibiotic choice and duration, as well as educational needs for clinicians.
Total durations data should be reviewed at least annually, and compared with local recommended guidelines for duration of therapy for specific syndromes. If areas for improvement are noted and/or focused initiatives are ongoing, then total duration should be monitored and trended quarterly with focus on targeted units and syndromes.
MEASUREMENT TOOLS FOR ANTIMICROBIAL STEWARDSHIP PROGRAMS

44
DUKE ANTIMICROBIAL STEWARDSHIP OUTREACH NETWORK

45
De-escalation Performed
Final assessment: Both useful and feasible.
Rationale
De-escalation is the process of adjusting antibiotics from empiric, broad-spectrum therapy when there is uncertainty of the diagnosis and pathogen causing infection to targeted, narrow-spectrum therapy as more clinical data are obtained. Discontinuing antibiotics is the “ultimate” form of de-escalation and may occur after infection has been ruled out and an alternate diagnosis is confirmed. Antimicrobial stewardship programs aim to reduce antibiotic exposures, both in broadness of antibiotics and in days of antibiotics, in order to avoid the unintended consequences of antibiotic overuse.
De-escalation is targeted in a number of ASP interventions including antibiotic time-outs, prospective audit and feedback, and syndrome-specific antimicrobial management protocols. In addition, evaluation of de-escalation may help understand where educational needs about diagnostic testing, response to and interpretation of culture data, and reassurance for “empiric” de-escalations in the face of negative cultures may lie. In addition, tracking de-escalation events where such interventions are employed could allow ASPs to demonstrate the impact of their efforts on antimicrobial exposures as a process measure.
Feasibility Considerations
Application of the method below requires admission-level antimicrobial eMAR data. These data would be available for institutions that have already accessed pharmacy AU data sources for calculation of days of therapy for individual patients. Calculation of the de-escalation events, however, requires more advanced analyst time.
All five pilot sites in our project were able to apply this metric to their antimicrobial data, but this was in large part due to the supported analyst time available through the project. Institutions preparing to implement routine measurement and reporting of this metric would require dedicated analyst time to be successful. It is difficult to estimate the analyst time needed for this metric, since this metric was developed during the course of the project as an iterative process.
MEASUREMENT TOOLS FOR ANTIMICROBIAL STEWARDSHIP PROGRAMS
46
Method
Source(s) of Data: Described in Appendix A for each Data Table used.
Definition(s):
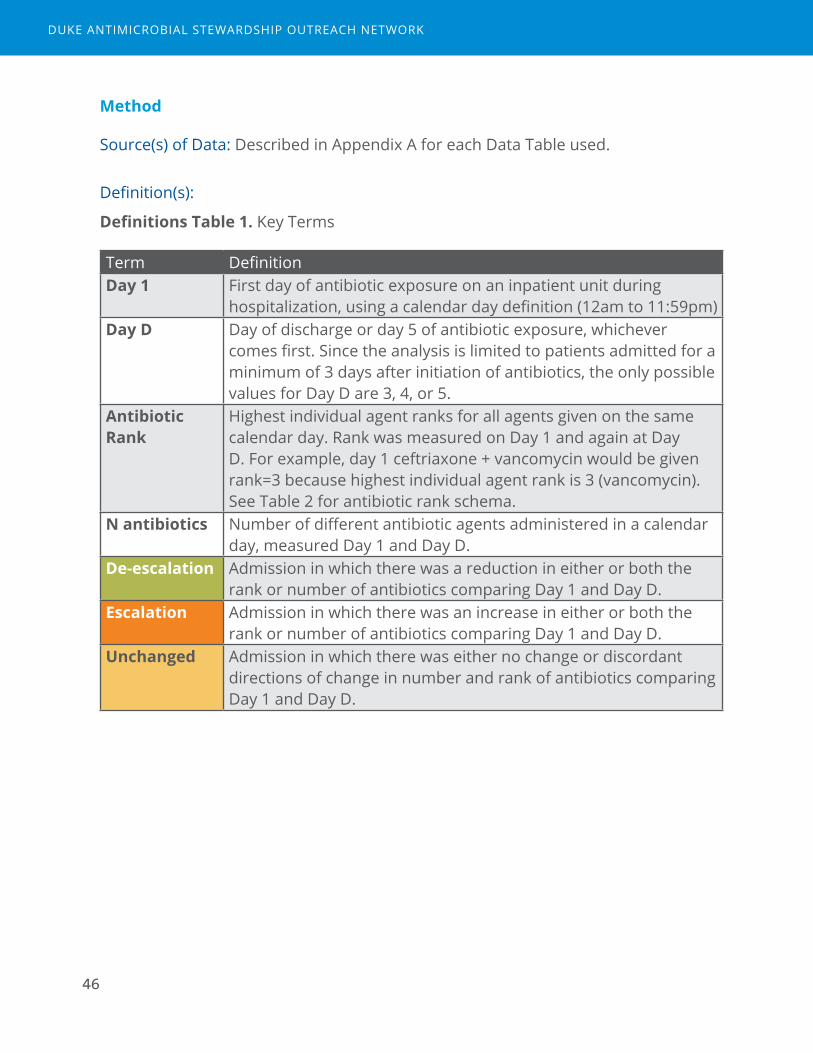
Definitions Table 1. Key Terms
Term DefinitionDay 1 First day of antibiotic exposure on an inpatient unit during
hospitalization, using a calendar day definition (12am to 11:59pm)Day D Day of discharge or day 5 of antibiotic exposure, whichever
comes first. Since the analysis is limited to patients admitted for a minimum of 3 days after initiation of antibiotics, the only possible values for Day D are 3, 4, or 5.
Antibiotic Rank
Highest individual agent ranks for all agents given on the same calendar day. Rank was measured on Day 1 and again at Day D. For example, day 1 ceftriaxone + vancomycin would be given rank=3 because highest individual agent rank is 3 (vancomycin). See Table 2 for antibiotic rank schema.
N antibiotics Number of different antibiotic agents administered in a calendar day, measured Day 1 and Day D.
De-escalation Admission in which there was a reduction in either or both the rank or number of antibiotics comparing Day 1 and Day D.
Escalation Admission in which there was an increase in either or both the rank or number of antibiotics comparing Day 1 and Day D.
Unchanged Admission in which there was either no change or discordant directions of change in number and rank of antibiotics comparing Day 1 and Day D.
DUKE ANTIMICROBIAL STEWARDSHIP OUTREACH NETWORK

47
Definitions Table 2. Antibiotic Rank
Narrow spectrum Broad spectrum Extended spectrum, including MDRO and Pseudomonas
Protected
1 2 3 41st- and 2nd-generation cephalosporinsAmoxicillin TMP/SMX Nafcillin, OxacillinMetronidazoleDoxycyclineNitrofurantoinPenicillin
CeftriaxoneAzithromycinClarithromycinAmoxcillin/clavulanateAmpicillin/sulbactamClindamycin
Antipseudomonal penicillins FluoroquinolonesAminoglycosidesVancomycinCefepime, CeftazidimeErtapenemAztreonam
Anti-pseudomonal CarbapenemColistinTigecyclineLinezolid, TedizolidDaptomycinCeftarolineCeftazidime/avibactamCeftolozane/tazobactam
Definitions Table 3. Possible outcomes comparing day 1 to day D.
N Antibiotics
Lower Same Higher
Rank
Lower De-escalation De-escalation Unchanged
Same De-escalation Unchanged EscalationHigher Unchanged Escalation Escalation
Inclusion/Exclusion criteria:
Any patient who received >24 hours of antimicrobials while housed on an inpatient unit would be eligible for inclusion, regardless of inpatient or observation “status” when housed on the inpatient unit. Excluded units were outpatient areas (e.g., observation units, emergency departments) and procedural areas (e.g. endoscopy suite, cardiac catheterization lab, operating room).
Admissions included in the analysis were adults ≥18 years, length of stay greater than 3 days after initiation of antibiotics, and occurring within a single calendar year (12 month) time period. Agents included in the analysis were only antibacterials. Antivirals and antifungals were excluded. Only antibacterials
MEASUREMENT TOOLS FOR ANTIMICROBIAL STEWARDSHIP PROGRAMS
48
included in the NHSN AU option agent list were considered.6 Administration via intramuscular, intravenous, and digestive routes was included while respiratory (inhaled) and topical agents were excluded. Additionally, patients who died prior to Day 5 after initiation of antimicrobials were excluded.
Datasets Needed (See Appendix A for description of data tables and data dictionary):
Data Table 1. eMAR data
Data Table 6. Demographic and Admission data
Data Table 7. CCS Diagnosis Category
Steps of Analysis:
1. Define eligible patients and assign inclusion/exclusion criteria:
a. Remove excluded agents, routes.
b. Remove excluded units.
c. Remove pediatric patients, age <18.
d. Remove admissions with <24 hours of antibiotic use.
e. Assign Day 1 and Day D per antibiotic admission.
f. Remove patients who died prior to or including day 5.
2. Assign number and rank on day 1 and day D.
3. Assign outcome category according to Definition Table 3. Assign de-escalation, escalation, and unchanged based on rank and number on Day 1 and Day D.
4. Calculate the percent of eligible admissions with de-escalation, escalation, and unchanged outcomes.
a. Facility-wide using all eligible admissions for 1 calendar year.
b. Among units, as defined on Day D.
c. By month, as defined on Day 1.
d. By infection syndrome, defined by AHRQ CCS categories for infection outlined in Analysis Table 1.
DUKE ANTIMICROBIAL STEWARDSHIP OUTREACH NETWORK

49
Analysis Table 1. Infection diagnosis categories
Category CCS Code(s) CCS Code DescriptionPneumonia 122 PneumoniaUrinary tract 159 Urinary tract infectionSkin and soft tissue 197 Skin and soft tissue infectionIntra-abdominal 142 or 146 or 148 or
149Appendicitis and other appendiceal conditions; Diverticulosis and diverticulitis; Peritonitis and intestinal abscess; Biliary tract disease
Gastrointestinal tract
135 Intestinal infection
Bone and joint 201 Infective arthritis and osteomyelitis (except that caused by tuberculosis or sexually transmitted disease)
ENT and upper respiratory tract
92 or 124 or 96 Otitis media and related conditions; Acute and chronic tonsillitis; Other upper respiratory infections
Central nervous system
76 or 77 or 78 Meningitis (except that caused by tuberculosis or sexually transmitted disease); Encephalitis (except that caused by tuberculosis or sexually transmitted disease); Other CNS infection and poliomyelitis
Bloodstream/Septicemia
2 (excluding admissions in combo categories below)
Septicemia (except in labor)
Pneumonia + BSI 122 and 2Urinary tract + BSI 159 and 2Skin and soft tissue + BSI
197 and 2
Intra-abdominal+BSI (142 or 146 or 148 or 149) and 2
Gastrointestinal tract+BSI
135 and 2
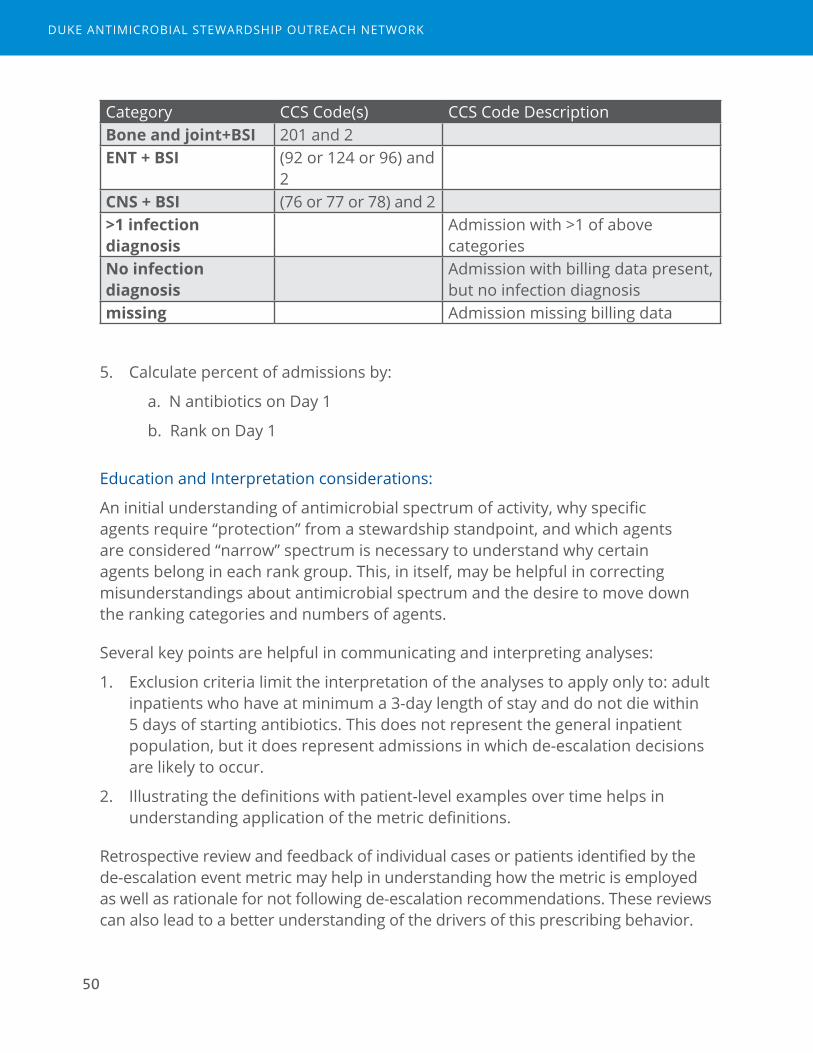
MEASUREMENT TOOLS FOR ANTIMICROBIAL STEWARDSHIP PROGRAMS
50
Category CCS Code(s) CCS Code DescriptionBone and joint+BSI 201 and 2ENT + BSI (92 or 124 or 96) and
2CNS + BSI (76 or 77 or 78) and 2>1 infection diagnosis
Admission with >1 of above categories
No infection diagnosis
Admission with billing data present, but no infection diagnosis
missing Admission missing billing data
5. Calculate percent of admissions by:
a. N antibiotics on Day 1
b. Rank on Day 1
Education and Interpretation considerations:
An initial understanding of antimicrobial spectrum of activity, why specific agents require “protection” from a stewardship standpoint, and which agents are considered “narrow” spectrum is necessary to understand why certain agents belong in each rank group. This, in itself, may be helpful in correcting misunderstandings about antimicrobial spectrum and the desire to move down the ranking categories and numbers of agents.
Several key points are helpful in communicating and interpreting analyses:
1. Exclusion criteria limit the interpretation of the analyses to apply only to: adult inpatients who have at minimum a 3-day length of stay and do not die within 5 days of starting antibiotics. This does not represent the general inpatient population, but it does represent admissions in which de-escalation decisions are likely to occur.
2. Illustrating the definitions with patient-level examples over time helps in understanding application of the metric definitions.
Retrospective review and feedback of individual cases or patients identified by the de-escalation event metric may help in understanding how the metric is employed as well as rationale for not following de-escalation recommendations. These reviews can also lead to a better understanding of the drivers of this prescribing behavior.
DUKE ANTIMICROBIAL STEWARDSHIP OUTREACH NETWORK
51
Also, unit-level and syndrome-level analyses may help identify specific targets for stewardship opportunity. For example, units with a higher “unchanged” rate compared with others may not be adequately reviewing data for de-escalation decisions and the unit could then be targeted for more in depth reviews of appropriateness, prospective audit and feedback activities, or educational initiatives. Likewise, a review of pneumonia patients in the ICU may indicate an opportunity for a ventilator associated pneumonia de-escalation protocol based on microbiologic data at day 3 and national guidelines.12
Known Limitations:
1. Antibiotic Ranks could be debated, and some ranks may not align with ASP practice at all institutions. Thus, if desired, individual institutions could adjust the ranking system to align better with site-specific practice (e.g. restricted agents). However, adjusting the ranking system would make comparison to external estimates more problematic.
2. The metric only evaluates the first antibiotic course per admission.
3. This metric does not assess for appropriateness. An “appropriate” rate of de-escalation events is unknown. We believe, however, that an external comparator or multihospital data can help investigate where an institution may have opportunity to improve.
4. Admissions that start with aggressive, combination therapies with high rank have more opportunity to de-escalate than those that start with lower rank/smaller numbers of agents. Thus, prescribing behaviors around empiric starts could impact the de-escalation outcome. Thus rank and number on day 1 should be considered a risk-adjustment factor for hospital to external comparisons.
Suggested use of metric(s) for routine review and demonstration of impact:
Evaluation of de-escalation event data can reveal opportunities for improvement in antibiotic choice and duration, as well as improvements in use of diagnostics, microbiologic testing and interpretation, and educational needs for clinicians.
De-escalation event data should be reviewed at least annually, and ideally benchmarked with system or network rates from other institutions. If areas for improvement are noted and/or focused initiatives are ongoing, then de-escalation events should be monitored and trended monthly with focus on targeted units and syndromes. Monthly trending with review of a sample of individual patients may also be helpful, but rates and benchmarking likely need at least 6 months of data to be meaningful, depending on the frequency of events.
MEASUREMENT TOOLS FOR ANTIMICROBIAL STEWARDSHIP PROGRAMS

52
2DUKE ANTIMICROBIAL STEWARDSHIP OUTREACH NETWORK
Measurement Tools for Antimicrobial Stewardship Programs
2Metrics that were feasible, but not useful for routine ASP assessments

54
DUKE ANTIMICROBIAL STEWARDSHIP OUTREACH NETWORK
55
Readmission related to infectious diagnosis
Final assessment: Feasible, may be useful in certain scenarios but not for routine assessments
Rationale
Antimicrobial stewardship programs aim to optimize the management of patients treated for infections. Stewardship teams may be challenged by providers who are concerned about the potential negative effects of interventions that aim to shorten antimicrobial durations or reduce antimicrobial exposures. Tracking readmissions due to infectious diagnoses could be used to prove no harm from stewardship interventions. Stable or improved readmissions rates along with improvements in appropriate antimicrobial management may help engage providers and hospital leadership.
Feasibility Considerations
Readmission data are readily retrievable from most systems and typically tracked by quality and patient safety groups and hospital administration. The challenges in applying this metric are several:
■ Determining which readmissions are related to an infectious diagnosis.
■ Determining when a change in rate occurs, due to the infrequency of readmissions events.
■ Attributing readmission events to antimicrobial management or quality of ASP.
These challenges are in addition to the known limitation with readmissions data that may include loss to follow up, readmission to a different facility, and/or social/behavioral and clinical factors that are independent of quality of medical care. All five pilot sites were able to provide readmissions data for the study and estimates were produced. However, review and interpretation of pilot site data as well as feedback from pilot site ASPs indicated limited utility in tracking this
MEASUREMENT TOOLS FOR ANTIMICROBIAL STEWARDSHIP PROGRAMS
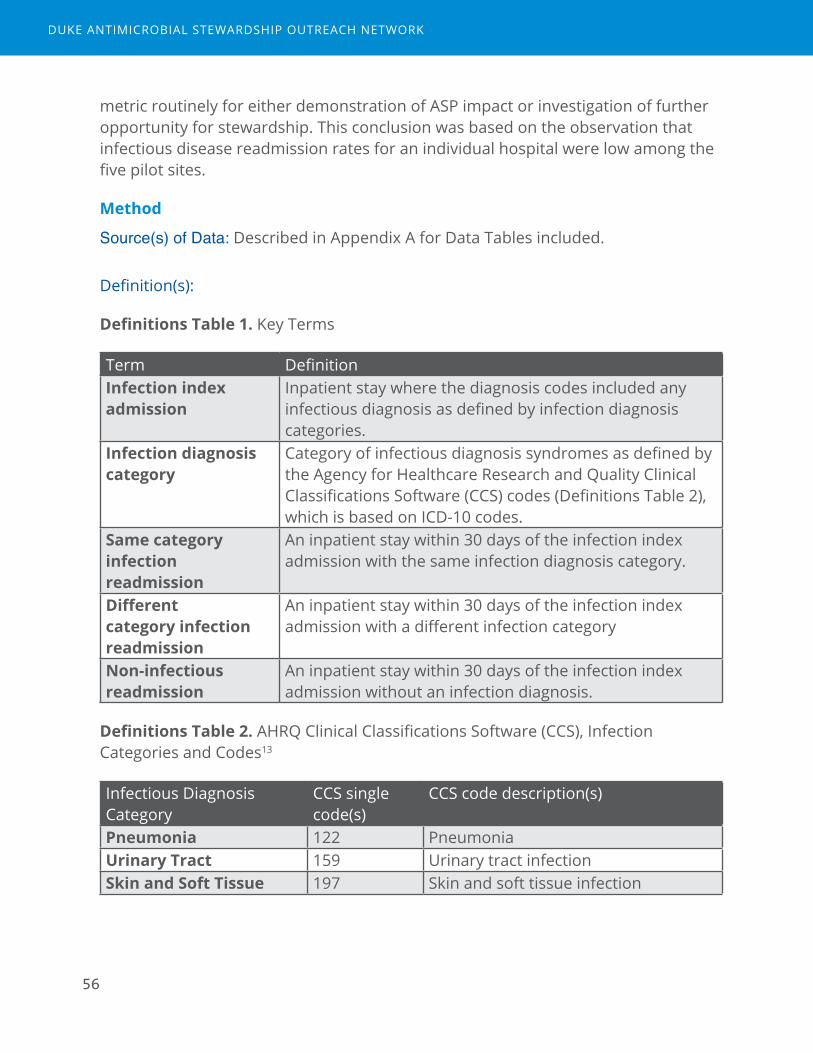
56
metric routinely for either demonstration of ASP impact or investigation of further opportunity for stewardship. This conclusion was based on the observation that infectious disease readmission rates for an individual hospital were low among the five pilot sites.
Method
Source(s) of Data: Described in Appendix A for Data Tables included.
Definition(s):
Definitions Table 1. Key Terms
Term DefinitionInfection index admission
Inpatient stay where the diagnosis codes included any infectious diagnosis as defined by infection diagnosis categories.
Infection diagnosis category
Category of infectious diagnosis syndromes as defined by the Agency for Healthcare Research and Quality Clinical Classifications Software (CCS) codes (Definitions Table 2), which is based on ICD-10 codes.
Same category infection readmission
An inpatient stay within 30 days of the infection index admission with the same infection diagnosis category.
Different category infection readmission
An inpatient stay within 30 days of the infection index admission with a different infection category
Non-infectious readmission
An inpatient stay within 30 days of the infection index admission without an infection diagnosis.
Definitions Table 2. AHRQ Clinical Classifications Software (CCS), Infection Categories and Codes13
Infectious Diagnosis Category
CCS single code(s)
CCS code description(s)
Pneumonia 122 PneumoniaUrinary Tract 159 Urinary tract infectionSkin and Soft Tissue 197 Skin and soft tissue infection
DUKE ANTIMICROBIAL STEWARDSHIP OUTREACH NETWORK
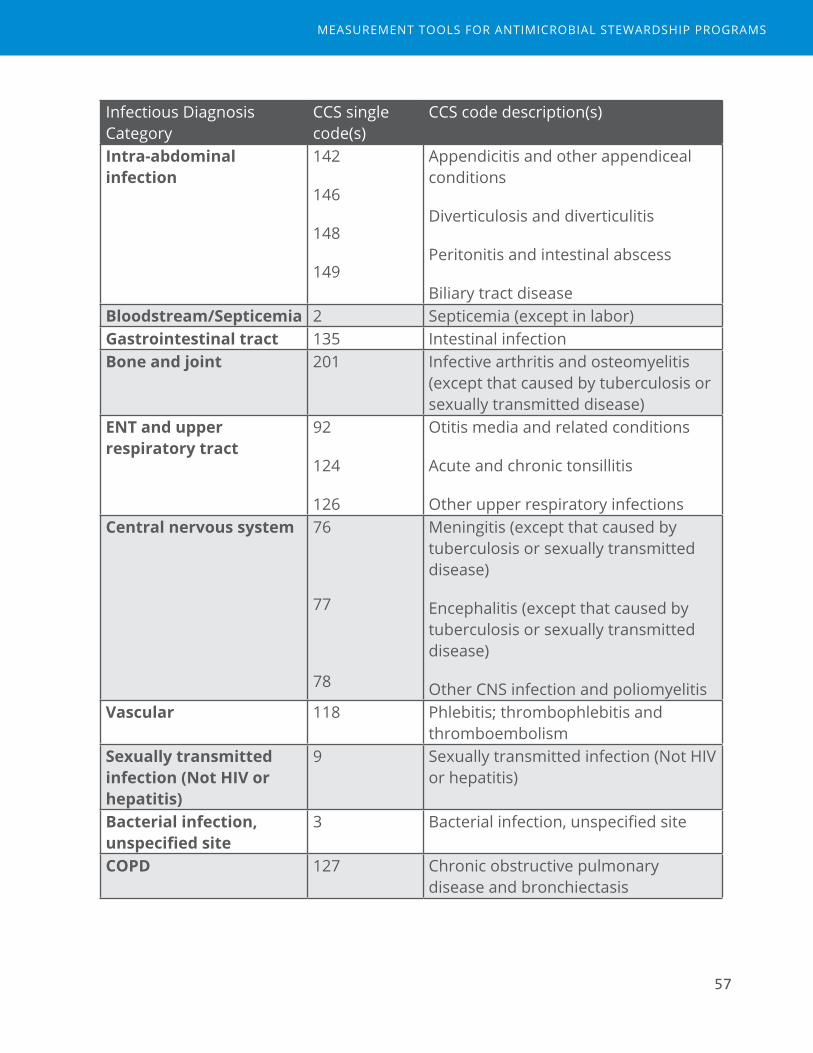
57
Infectious Diagnosis Category
CCS single code(s)
CCS code description(s)
Intra-abdominal infection
142
146
148
149
Appendicitis and other appendiceal conditions
Diverticulosis and diverticulitis
Peritonitis and intestinal abscess
Biliary tract diseaseBloodstream/Septicemia 2 Septicemia (except in labor)Gastrointestinal tract 135 Intestinal infectionBone and joint 201 Infective arthritis and osteomyelitis
(except that caused by tuberculosis or sexually transmitted disease)
ENT and upper respiratory tract
92
124
126
Otitis media and related conditions
Acute and chronic tonsillitis
Other upper respiratory infectionsCentral nervous system 76
77
78
Meningitis (except that caused by tuberculosis or sexually transmitted disease)
Encephalitis (except that caused by tuberculosis or sexually transmitted disease)
Other CNS infection and poliomyelitisVascular 118 Phlebitis; thrombophlebitis and
thromboembolismSexually transmitted infection (Not HIV or hepatitis)
9 Sexually transmitted infection (Not HIV or hepatitis)
Bacterial infection, unspecified site
3 Bacterial infection, unspecified site
COPD 127 Chronic obstructive pulmonary disease and bronchiectasis
MEASUREMENT TOOLS FOR ANTIMICROBIAL STEWARDSHIP PROGRAMS

58
Inclusion/Exclusion criteria:
Index admissions for evaluation of subsequent 30-day readmission event were considered over a 2-year study period for adults aged >=18 who were alive at discharge. Patient admissions were considered for index admission if they had full ICD-10 available and had an infection diagnosis that fell into the AHRQ CCS single categories listed in Definitions Table 2. Included index admissions did not have a readmission for the same infectious diagnosis in the prior 30 days, so the same patient could not be counted as a readmission more than once in a 30-day period.
Datasets Needed (See Appendix A for description of data tables and data dictionary):
Data Table 6. Demographic and Admission data
Data Table 7. CCS Diagnosis Category
Steps of Analysis:
1. Define index admissions:
a. Identify admissions with admission date in the designated time period.
b. Remove admissions with calculated age<18.
c. Among those in the study time period, exclude index admissions that do not have CCSCategory for infectious diagnosis.
2. Identify readmissions (all cause) within 30 days of index admission.
a. Remove any duplicate readmissions within a 30-day period.
3. Assign outcome category for all index admissions
a. Same category readmission
b. Different category infection readmission
c. Non-infectious readmission
d. No readmission
4. Calculate 30-day readmission rate as percent of index admissions
a. All cause, and by outcome category
b. Stratify by infectious diagnosis category
DUKE ANTIMICROBIAL STEWARDSHIP OUTREACH NETWORK
59
Education and Interpretation considerations:
Prescribers and ASPs are familiar with the concept and interpretation of readmission events and percent. However, interpretation of the data is limited by the low frequency of events. In pilot sites’ data, only approximately 3% of index admissions had the same category readmission and many of these were attributed to diagnoses that may or may not have been a result of infection (primarily COPD category). Proving “no harm” came from an ASP intervention may be difficult to assume if both the control and intervention groups have readmission rates close to zero. However, tracking this metric may be reassuring for some concern with possible negative patient safety outcomes that could be associated with an ASP intervention.
Known Limitations:
1. Readmissions are rare, thus, the ability to interpret a change in rate as a result of an intervention is problematic, especially with smaller populations.
2. Readmissions are influenced by multiple other non-modifiable factors in addition to the quality of antimicrobial stewardship.
3. Accuracy and thoroughness of ICD-10 diagnosis code for common infectious diseases and the AHRQ CCS Single categories, specifically, has not been formally studied. However, we hypothesize that ICD-10 codes, and therefore the CCS categories, have limited sensitivity.
4. Overlap of infectious diagnosis categories were significant, with many admissions falling into greater than 1 infectious diagnosis category. This signals both the complexity of the patient population as well as the need for validation of diagnosis codes.
5. Missing data may be an issue: in addition to diagnosis code limitations, readmission to another institution or other reasons for loss to follow up may apply.
Rationale for not including in routine ASP review and potential alternative uses:
Readmissions related to infectious diagnosis metrics as measured above are not high yield for routine tracking or demonstration of impact due to the limitations listed above.
This metric, however, may be useful as a secondary outcome for assessment of specific ASP initiatives as a “balancing” metric. Providing data that showed no change in the already low rates of readmission may provide reassurance that
MEASUREMENT TOOLS FOR ANTIMICROBIAL STEWARDSHIP PROGRAMS

60
interventions did not inadvertently result in increased readmissions or recurrence of infection. This interpretation, however, must be made cautiously with an understanding that limited sample size for an individual hospital and loss to follow up may produce type II error (maintaining a false null hypothesis). Additionally, readmission outcomes based on ICD-10 diagnosis may not be accepted by clinicians as a true measure of negative events given suspected limited sensitivity of these data.
DUKE ANTIMICROBIAL STEWARDSHIP OUTREACH NETWORK

61
Adherence to guidelines/formulary/protocol/bundle
Final assessment: Feasible, may be useful in certain scenarios but not for routine assessments
Rationale
Antimicrobial stewardship programs may collaborate with other multidisciplinary quality improvement groups on hospital-wide initiatives. ASPs may also provide local guidelines or protocols to improve standards of care. Measurement of adherence to local guidelines and protocols is a key process measure to ensure consistency in patient care. Data feedback for adherence to protocol has previously been helpful in maintaining fidelity to protocol and process in many quality improvement initiatives. Thus, adherence to local guidelines or protocols may be a way to demonstrate the impact of ASP activities as well as improvements in care processes aimed to improve patient safety. Adherence to local guidelines may be viewed as a surrogate to “appropriateness” in some situations.
Feasibility Considerations
Adherence to local guidelines/protocols is institution-specific, as elements of a local guideline/protocol may not be universal across institutions. The two pilot sites expressing interest in this metric wished to track the implementation of an existing initiative: their sepsis bundle. The site-specific adherence criteria measures described for this metric may not be directly applicable to other institutions. However, the process of collecting and interpreting these data for ASP use is a model that can provide insight for others intending to develop their own process measures for local initiatives.
The two pilot sites interested in these data already had invested information technology resources at a health system level to establish electronic data capture, perform analyses, and design an analytic dashboard to present process measure feedback for individual sites. Thus, the goals for the project were to help understand and interpret these data for local use, rather than perform the collection, analysis, and data feedback.
MEASUREMENT TOOLS FOR ANTIMICROBIAL STEWARDSHIP PROGRAMS

62
Method
Source(s) of Data:
Tableau™ dashboard for sepsis bundle adherence, based on Center for Medicare and Medicaid (CMS) SEP-1 criteria14
Definition(s):
Definitions Table 1. Sepsis (SEP-1) Bundle Elements
Sepsis Bundle
Criterion Definition for compliance
3 Hour Lactate Initial lactate measurement within 3 hours of presentation of severe sepsis.
Blood cultures
Blood cultures drawn prior to antibiotics.
Antibiotics Broad spectrum or other antibiotics administered within 3 hours of presentation.
Fluid Only if septic shock present: received resuscitation with 30 mL/kg crystalloid fluid within 3 hours of presentation of septic shock
6 Hour Repeat Lactate
Only if initial lactate is elevated, a second measurement within 6 hours of presentation of severe sepsis.
Volume assessment
Only if hypotension persists after fluid administration or initial lactate >= 4 mmol/L: received volume assessment within six hours of presentation of septic shock. Volume assessment can be met in 2 potential ways:
1. A focused exam including ALL of the following: vital signs, cardiopulmonary exam, capillary refill evaluation, peripheral pulse evaluation, skin exam
2. 2 of 4 of the following: central venous pressure measurement, central venous O2 measurement, bedside cardiovascular ultrasound, passive leg raise or fluid challenge
Vasopressors Only if hypotension persists after fluid administration, received vasopressors within six hours of presentation of septic shock
DUKE ANTIMICROBIAL STEWARDSHIP OUTREACH NETWORK
63
Inclusion/Exclusion criteria:
The SEP-1 criteria that involve elements of specific interest to ASPs are in the 3-hour bundle. Admission eligibility criteria for assessment of SEP-1 are described as follows:
Patients admitted to the hospital for inpatient acute care with an ICD-10-CM Principal or Other Diagnosis Code for sepsis (as defined by CMS), age greater than or equal to 18 years, and a length of stay less than or equal to 120 days are included in the SEP Initial Patient Population and are eligible to be sampled. Additional discharges are excluded if they meet any one of the following:
■ Directive for Comfort Care within 3 hours of presentation of severe sepsis
■ Directive for Comfort Care within 6 hours of presentation of septic shock
■ Administrative contraindication to care
■ Transfer in from another acute care facility
■ Patients with severe sepsis who expire within 3 hours of presentation
■ Patients with septic shock who expire within 6 hours of presentation
■ Patients receiving IV antibiotics for more than 24 hours prior to presentation of severe sepsis.
A one-year time period was used for the analysis of bundle adherence without age limitations.
Dataset Dictionary and Specifications:
N/A – Analysis performed within existing Tableau™ dashboard built by local information technology representatives.
Steps of Analysis:
Analysis performed included assessments of:
1. Compliance as percent compliance with each bundle criterion
2. Overall percent compliance of the bundle in which all criteria in the bundle are met
3. Adherence to sepsis bundle elements by sepsis severity (simple, severe, and shock) and over time
MEASUREMENT TOOLS FOR ANTIMICROBIAL STEWARDSHIP PROGRAMS

64
4. Additional patient outcomes (mortality, length of stay, costs) among discharges with diagnosis of sepsis
5. Percent of sepsis discharges in which providers used the sepsis order set
Education and Interpretation considerations:
Sepsis initiatives require a multidisciplinary approach. The role of ASPs in sepsis initiatives may include the following:
■ Input into sepsis order set development, especially for choice and duration of empiric antibiotics
■ Encouragement to providers to use sepsis order sets
■ Education around sepsis management for providers:
■ Appropriate diagnostic testing, including blood culture collection
■ Appropriate choice of empiric agents
■ Appropriate de-escalation when sepsis has been ruled out or a specific diagnosis and/or pathogen has been identified
Interpretation of bundle adherence data for prescribers and ASPs should include discussion of each bundle element and the definition of compliance. Further, discussion of inclusion/exclusion criteria for the analysis may help providers better understand the targeted patient population to which the bundle is intended to be applied. Overall messaging and interpretation of sepsis adherence should include an understanding of the impact of the measure of hospital performance measures and implications that may have for institutional reputation and financial outcomes.
Known Limitations:
1. Accuracy and thoroughness of ICD-10 diagnosis code for sepsis has been debated by multiple investigators. Alternative measures for electronic surveillance of sepsis are being investigated.15,16
2. High adherence to sepsis bundle criteria have not been definitively shown to improve patient outcomes, however criteria are founded on evidence-based guidelines.
DUKE ANTIMICROBIAL STEWARDSHIP OUTREACH NETWORK
65
3. ASPs may not feel responsible for sepsis initiatives and have only certain criteria of interest instead of full bundle compliance.
4. SEP-1 bundle criteria do not include a de-escalation criterion, which is a primary focus for ASPs.
Rationale for not including in routine ASP review and potential alternative uses:
Process measures such as adherence to protocol/guidelines/bundle can be useful for specific initiatives, but are difficult to apply universally. Thus, their specificity and utility should be targeted to certain time periods and institution-specific goals. For example, tracking adherence may be helpful during initial periods of implementation to help motivate fidelity to the protocol or guideline. Institutions that have already achieved high levels of adherence need not continue to track adherence metrics indefinitely.
Several groups monitoring stewardship activities actively assess adherence to protocols and guidelines, typically through intermittent samples with manual data collection. Measurement of guideline adherence is likely to remain an important function of stewardship activities,17 but it ultimately may be a more targeted assessment rather than a routine one.
MEASUREMENT TOOLS FOR ANTIMICROBIAL STEWARDSHIP PROGRAMS

66
3DUKE ANTIMICROBIAL STEWARDSHIP OUTREACH NETWORK
Measurement Tools for Antimicrobial Stewardship Programs
3Metrics that did not pass feasibility testing

68
DUKE ANTIMICROBIAL STEWARDSHIP OUTREACH NETWORK
69
Drug Resistant Infections
Final assessment: Did not pass feasibility testing.
Rationale
Preventing the development of drug-resistant infections by optimizing use of antimicrobials is a core mission of ASPs. Demonstration of the impact on drug-resistance at a local level would be a very powerful indication of ASP effect on patient outcomes.
In order to best meet the goals of the project to demonstrate patient-level impact, the study team designed data file specifications that would provide individual isolate susceptibility data. The purpose of requesting a detailed, isolate-level dataset was to link to specific interventions and initiatives from the inpatient ASP efforts to individual patient outcomes. Also, patient-level datasets would be required to capture appropriate time variables so that attribution to hospital exposure and acquisition could be best applied. Aggregate data (e.g., antibiograms), while an essential tool for ASPs in understanding local resistance rates, cannot adequately attribute events to hospital exposure or detect ASP effect because these aggregate data include community-onset events.
Data sources explored with pilot sites and feasibility barriers identified
All pilot sites attempted to capture microbiology culture data for this metric. However, only 1 of 5 sites was able to produce a validated dataset by the end of the two-year study period. An additional 2 sites were able to provide a sample dataset for validation by the end of the project, but this did not leave adequate time for analysis, data feedback, or pilot site assessment of usefulness as a metric for ASPs.
Feasibility barriers in capturing microbiology culture data during this project were multiple:
1. Lack of or limited local information technology experts to pull patient-level data from lab information systems.
2. Lack of existing reports in lab information systems or electronic medical records that provide patient-level data.
MEASUREMENT TOOLS FOR ANTIMICROBIAL STEWARDSHIP PROGRAMS

70
3. Complexity of culture and susceptibility data (e.g., large and varied numbers of bug-drug combinations) and varied data structures of different lab information systems.
4. Lack of information technology analyst time and financial resources to devote to accessing the complex microbiology data in the context of competing priorities. Project funds directed to pilot sites did not adequately cover the costs of personnel time needed to complete the data extracts.
Although not an option for the pilot sites in this study, stewards should investigate with their infection prevention team to determine if their hospital is participating in the NHSN Antibiotic Resistance (AR) Option or reporting LabID events for MRSA, VRE, carbapenem-resistant Enterobacteriaceae, methicillin-susceptible S. aureus, cephalosporin-resistant Klebsiella and/or multidrug-resistant Acinetobacter. These data may already be available for active use if voluntary reporting is occurring. Stewards are encouraged to discuss what alternative data sources may already be available through infection prevention if this metric is of interest.
MethodSource(s) of Data:
Laboratory information system
Administrative information from the electronic medical record (admission and discharge dates).
Proposed Analysis Steps
The investigators' plan for drug-resistant infection assessments are described below and will be pursued as future, ongoing work.
Two drug-resistance metrics were proposed.
1. Hospital acquired multidrug resistant organism (MDRO) prevalence density among hospitalized population:
Hospital acquired drug-resistant pathogen events / 1,000 patient days
a. Numerator: goal is to quantify MDRO healthcare acquisition events
i. Exclude specimens used for active surveillance (e.g. nasal swabs, rectal swabs) because there may be variability by site/unit due to local policy
DUKE ANTIMICROBIAL STEWARDSHIP OUTREACH NETWORK
71
ii. Include all clinical samples that may indicate colonization or infection (any type of specimen except active surveillance, includes sputum, wound)
1. Sensitivity analysis: Use sterile sites only (blood, CSF, pleural fluid, synovial fluid, bone, pericardial fluid, peritoneal fluid)
iii. Exclude community-acquired infections:
1. Hospital onset defined temporally:
a. Specimen collection date >3 calendar days after admission date
b. Admission date = the date a patient occupies an inpatient room for an overnight stay
iv. Exclude recurrent events in patients with known colonization with the MDRO defined as prior clinical culture (excluding active surveillance cultures) with MDRO over the last 1 year (essentially include only first isolates from past 1 year).
2. Percent resistance among patients with organism isolated:
(Number drug-resistant isolates / Total number of isolates) * 100
a. Numerator: goal is to understand risk of resistant pathogen among infected/colonized patients.
i. Number of first isolates of MDRO per patient over 1-year time period
ii. Exclude specimens used for active surveillance (e.g. nasal swabs, rectal swabs) because there may be variability by site/unit due to local policy
iii. Regardless of time patient spent in facility
iv. Regardless of specimen source (may indicate colonization or infection) with exception of active surveillance cultures as above
v. Include patients with history of colonization or infection, but only use first isolate as in 1.a.iv above.
MEASUREMENT TOOLS FOR ANTIMICROBIAL STEWARDSHIP PROGRAMS

72
Eleven pathogen-drug phenotypes were proposed for tracking over time to evaluate for impact of ASP.
Definition Table 1. Pathogen-drug phenotypes18
Acronym/Descriptor Genus sp. or group
Tests
1 MRSA S. aureus Resistant (R) to at least 1 of the following: methicillin, oxacillin, cefoxitin
2 VRE faecalis E. faecalis Resistant or intermediate to vancomycin
3 VRE faecium E. faecium Resistant or intermediate to vancomycin
4 Carbapenem resistant PA
P. aeruginosa Intermediate (I) or resistant (R) to at least 1 of the following: imipenem, meropenem, or doripenem
5 MDR PA P. aeruginosa Intermediate (I) or resistant (R) to at least 1 drug in at least 3 of the following 5 categories:
■ Extended-spectrum cephalosporins (cefepime, ceftazidime)
■ Fluoroquinolones (ciprofloxacin, levofloxacin)
■ Aminoglycosides (amikacin, gentamicin, tobramycin)
■ Carbapenems (imipenem, meropenem, doripenem)
■ Piperacillin Group (piperacillin, piperacillin/tazobactam)
6 FQ-R PA P. aeruginosa Resistant (R) to at least one of the following: ciprofloxacin, levofloxacin
DUKE ANTIMICROBIAL STEWARDSHIP OUTREACH NETWORK

Acronym/Descriptor Genus sp. or group
Tests
7 Carbapenem resistant AB
Acinetobacter spp. Resistant or intermediate to meropenem, imipenem, or doripenem
8 MDR AB Acinetobacter spp. Intermediate (I) or resistant (R) to at least one drug in at least 3 of the following 6 categories:
■ Extended-spectrum cephalosporins (cefepime, ceftazidime, cefotaxime, ceftriaxone)
■ Fluoroquinolones (ciprofloxacin, levofloxacin)
■ Aminoglycosides (amikacin, gentamicin, tobramycin)
■ Carbapenems (imipenem, meropenem, doripenem)
■ Piperacillin Group (piperacillin, piperacillin/tazobactam)
■ Ampicillin/sulbactam9 Carbapenem
resistant Enterobacteriaceae*
E. coli Klebsiella pneumoniae or Klebsiella oxytoca Enterobacter spp.
Resistant (R) to at least one of the following: imipenem, meropenem, doripenem, ertapenem
10 Extended spectrum cephalosporin resistant Enterobacteriaceae*
E. coli Klebsiella pneumoniae or Klebsiella oxytoca Enterobacter spp.
Resistant (R) to at least one of the following: ceftriaxone, ceftazidime, cefepime, cefotaxime
11 FQ-R Enterobacteriaceae*
E. coli Klebsiella pneumoniae or Klebsiella oxytoca Enterobacter spp.
Resistant (R) to at least one of the following: ciprofloxacin, levofloxacin, moxifloxacin
*Will also evaluate the three pathogens separately.
73
MEASUREMENT TOOLS FOR ANTIMICROBIAL STEWARDSHIP PROGRAMS

74
Known Limitations
Despite the attempt at limiting to events that are most likely attributed to that hospital and ASP impact, the definition of “hospital-acquired” may pick up additional events that were acquired outside the facility, but not detected until after 3 days of admission.
Many other factors may contribute to acquisition of MDRO outside the effects of an ASP and antimicrobial exposures. These include but are not limited to patient-level risk factors (e.g., prior exposures to other healthcare settings), hospital-level factors (e.g., tertiary care, specialized services), and the quality of infection control practices (e.g., hand hygiene).
Clear demonstration of ASP impact on incidence of resistance is not well-documented in the medical literature. ASP interventions that can be causally linked to reductions in drug-resistance have not yet been fully established. Our hope would be that once tracking of these events occur as part of routine ASP surveillance, the impact of ASPs may be better recognized.
Ideas for Future Work
The proposed definitions above must be employed using patient-level data. Baseline rates of MDRO incidence among hospitalized populations should first be described. While some of these pathogens have a large amount of literature utilizing incidence metrics and are tracked routinely (e.g. MRSA, VRE), others are less of a focus (e.g. MDR Acinetobacter). The utility of tracking the proposed metric over time (e.g. as part of routine ASP surveillance) as well as in evaluating specific ASP interventions on the patient-level needs further assessment.
DUKE ANTIMICROBIAL STEWARDSHIP OUTREACH NETWORK
75
Excess Use Avoided
Final assessment: Did not pass feasibility testing.
Rationale
The aim of ASPs is to optimize the management of infectious disease and avoid the unintended consequences of antimicrobial use. This includes identifying opportunities to stop therapy in patients who do not have infections, and to promote shorter and/or guideline-driven durations of therapy. Duration decisions, however, are often patient-specific. Many ASPs have incorporated individual review and patient specific feedback for prescribers (e.g. prospective audit and feedback). Patients targeted by ASPs are generally program-specific and focused to targeted agents and units because of limitations in personnel resources.
Estimation of days of antibiotics avoided as a result of patient-level interventions may help ASPs demonstrate their impact on patient care.
Data sources explored with pilot sites
Four pilot sites interested in applying this metric all utilized Epic™ for their electronic medical records and documentation with templated notes to indicate pharmacist interventions, termed “iVENT” notes and labeled with the type “Antimicrobial Stewardship.”
Data Table 8. Interventions
Data Table 1. eMar
Data Table 6. Demographic and Admission data
Data Table 7. CCS Diagnosis category.
Steps of analysis
1. Intervention data were described:
a. subtype
b. response
c. number of interventions per admission
MEASUREMENT TOOLS FOR ANTIMICROBIAL STEWARDSHIP PROGRAMS
76
2. Interventions were trended over time by month to determine volume changes
a. When available, stratified by primary steward vs. other clinical pharmacist
3. Interventions were stratified by unit to understand where interventions were taking place
a. When available, stratified by primary steward vs. other clinical pharmacist
b. Attribution to unit was determined based on the last unit location of an administered antimicrobial prior to the intervention. If no antimicrobial was given prior to the intervention, the intervention was attributed to the unit for the next administered antimicrobial in time. If no antimicrobials were administered during the admission, the unit was assigned as missing.
4. Percent of admissions with interventions and the length of therapy and days present were calculated
a. Among targeted agents
i. Agents targeted for prospective audit and feedback
ii. Agents targeted by restriction policies
iii. Agents targeted by IV/PO policies
iv. Agents targeted by PK/PD policies
b. Among syndromes
5. Days from first eMAR antimicrobial administration to subsequent intervention were calculated among admissions who had an intervention
a. Stratified by targeted agent and syndrome
Feasibility barriers identified
We encountered several barriers to use of intervention data and inpatient eMAR data to estimate the number of days avoided by ASP intervention.
First, pilot hospitals demonstrated significant variability in their use of intervention documentation during routine work flows, as well as the structure of their ASPs. Two of four sites had a centralized ASP with dedicated pharmacist time to delivering and documenting interventions, as well as antimicrobial stewardship interventions occurring by other decentralized clinical pharmacists on the wards.
DUKE ANTIMICROBIAL STEWARDSHIP OUTREACH NETWORK

77
Variable documentation practices for interventions were somewhat explained by employing customized lists of intervention subtype into the EPIC system.
Second, a fair amount of missing intervention data was found during analysis. Generally, intervention documentation was felt to be a burdensome task without much reward evident to clinical pharmacists. Interventions were not documented if the intervention was “rejected” by prescribers. Pilot site feedback indicated that the burden of documentation and risk for documenting the opposite recommendation to treating clinicians was a barrier when conflicts arose. Pilot site representatives also shared that a large amount of ASP effort is not adequately captured with intervention data, because a large number of patient level reviews are completed while only a proportion of these reviews result in a patient-level intervention and documentation. Thus, if a patient is reviewed but no intervention delivered, the potential impact from the ASP review is not captured. Also, other intervention types might incorporate stewardship-related activities. Several sites reported that PK/PD activities by clinical pharmacists are captured with a pharmacokinetics intervention type rather than those labeled “Antimicrobial stewardship.” A number of interventions, even when documented, had missing values for subtype and response. Since some subtypes of interventions are more likely to have impact on durations of therapy than others, these missing data made it difficult to estimate days avoided with intervention.
Third, patients likely to receive interventions were also likely to have higher levels of antimicrobial exposures. Generally, patients targeted for review had already received 1-2 days of antimicrobials prior to ASP review, and in general these also were more complex patients with longer lengths of stay. Thus, there is a selection bias toward more complex, antibiotic-exposed patients. Finding a comparator group with similar characteristics within the same hospital population is difficult. To estimate antimicrobial days avoided with ASP intervention, a similarly complex patient population not exposed to ASP intervention would need to be derived. This is difficult to do without more complex statistical methods such as propensity score matching or randomized study design. Raw (unadjusted) estimates of inpatient lengths of therapy for patients who received interventions were longer than those who did not have interventions.
Finally, eMAR data only captured in-hospital durations instead of total durations of therapy. Thus ASP interventions that would have shortened total durations may not be adequately captured. This could potentially be addressed by capturing post-discharge days of therapy (see Total Duration metric discussion).
MEASUREMENT TOOLS FOR ANTIMICROBIAL STEWARDSHIP PROGRAMS
78
Ideas for Future Investigation
Estimation of excess days avoided would be better measured with a planned research study or quality improvement project focused on identifying a reasonable comparator group (e.g., randomizing the intervention). This would also require dedicated effort to adhere to standardized documentation for improved measurement of receipt of intervention and subtype in order to demonstrate ASP impact.
Factors predictive of receipt of an intervention may also provide a means to better understand what types of patients would benefit most from review by a centralized ASP. These factors could be used to create a “flag” for real-time review of appropriateness by a clinical pharmacist on the wards. These factors could potentially be used for creating a predictive score with incorporation into EHR systems to better stratify patients based on clinical data and improve the efficiency of prospective audit and feedback activities. Finally, these predictors may help inform risk-adjustment analyses to better estimate ASP impact by use of other observational patient groups.
DUKE ANTIMICROBIAL STEWARDSHIP OUTREACH NETWORK

79
Adverse drug events/toxicities
Final assessment: Did not pass feasibility testing
RationaleASPs aim to improve patient safety by avoiding the unintended consequences of excess antimicrobial use. Adverse drug events associated with antimicrobials include a large range of severity from self-limited and transient antibiotic-associated diarrhea, to permanent and debilitating neuropathies or renal failure. Improved use of antimicrobials has a clear implication for patient safety. Impact on occurrence of antimicrobial associated adverse events is a clear target for ASPs.
Data sources explored with pilot sites and feasibility barriers identifiedA single pilot site chose to explore capture of adverse drug events for their ASP. No specific safety event drove this interest, but a general understanding of events was desired to supplement the existing voluntary safety reporting system their health system employed.
Ideas discussed included identifying use of epinephrine out of Pyxis machines to identify suspected anaphylaxis events. The pilot site team thought these data could potentially be captured, but did not have an allergy focused intervention in their ASP. Therefore, anaphylaxis events would not be as meaningful as an outcome to reflect their ASP practice. Outcomes of interest included renal impairment due to vancomycin and other nephrotoxic drugs as well as C. difficile infection. Data collected from the C. difficile infection analysis were meaningful for their ASP review.
The study team considered identification of adverse renal events attributed to antibiotic exposure using electronic data points. Existing data regarding renal failure diagnosis by ICD-10 code could be linked with vancomycin exposure as identified through eMAR data. However, upon review of diagnosis codes it was evident that attribution of the adverse event to the drug exposure versus underlying comorbid disease versus other factors (e.g., sepsis, contrast-induced nephropathy) occurring during the hospital admission was quite problematic.
MEASUREMENT TOOLS FOR ANTIMICROBIAL STEWARDSHIP PROGRAMS
80
Additional electronic laboratory data (e.g. creatinine, vancomycin level measurements) requests were not deemed to be feasible due to competing IT priorities.
Ideas for future workAdverse event reporting continues to be a difficult metric to capture feasibly using only electronic data. At this time, manual review of individual patient data and clinical scenario, including subjective components, is likely necessary to determine attribution. Even with detailed chart review or in real time, attribution of an adverse event to an antibiotic versus another cause is problematic. Focused capture of vancomycin dosing and renal/trough monitoring is a possibility, as vancomycin trough levels and doses are discrete elements that could be analyzed from laboratory systems along with date/time stamps that could be used for temporal association with drug exposures.
DUKE ANTIMICROBIAL STEWARDSHIP OUTREACH NETWORK

81
Appropriateness/inappropriateness per institutional guidelines/expert opinion
Final assessment: Did not pass feasibility testing.
Rationale
Improving and optimizing appropriateness of therapy is the ultimate goal for antimicrobial stewardship programs. Measurement of appropriateness, however, has been challenging due to subjective components and time-intense assessments required for evaluating complex clinical scenarios of infection management. A reliable electronic definitions of appropriateness could free up significant personnel time from data collection burden required to apply subjective components.
Data Sources explored with pilot sites and feasibility barriers identified
Two of the five pilot sites elected to pursue feasibility testing of measures of appropriateness for their antimicrobial stewardship program.
Pilot site A: Vancomycin dosing and monitoring medication use evaluation.
Pilot site A desired data collection burden relief involved with repetitive reviews of vancomycin dosing and monitoring medication use evaluations (MUE). Prior MUE criteria were reviewed, and discrete data elements to capture were identified. These data elements were discussed with a pharmacist analyst to explore feasibility of data capture (Table 1). However, competing priorities for this analyst reduced his ability to dedicate time to this work and despite multiple attempts to engage, the work did not go forward.
MEASUREMENT TOOLS FOR ANTIMICROBIAL STEWARDSHIP PROGRAMS
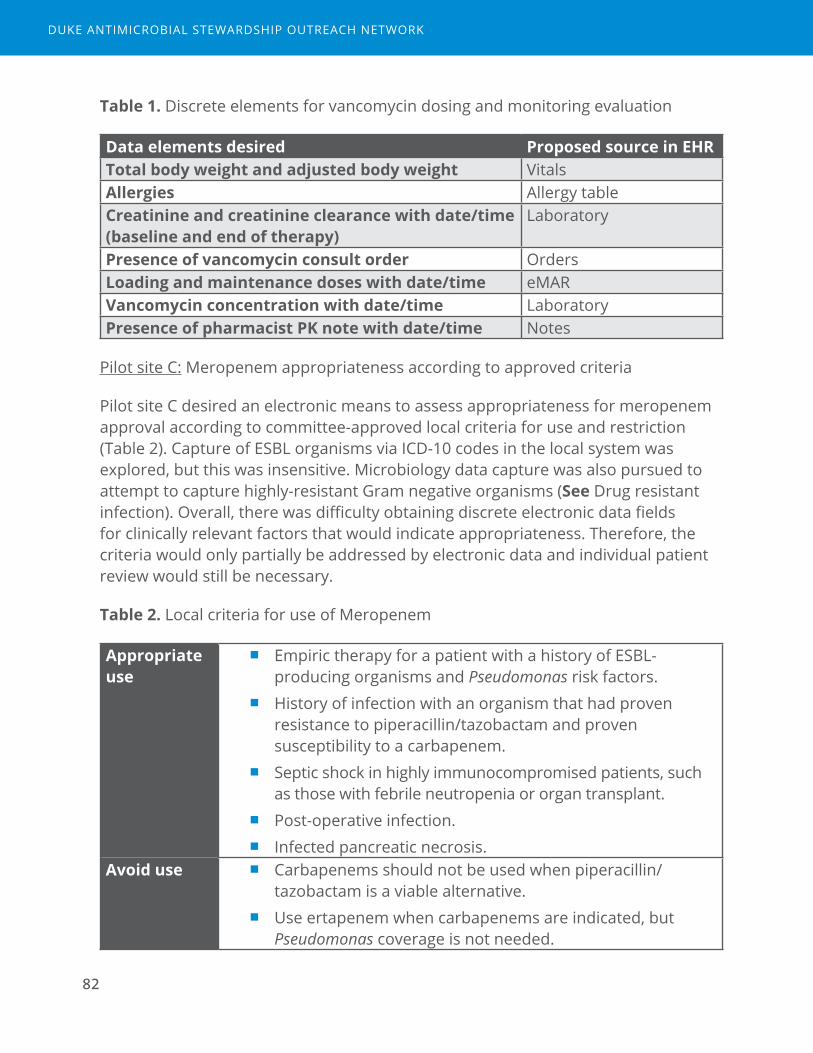
82
Table 1. Discrete elements for vancomycin dosing and monitoring evaluation
Data elements desired Proposed source in EHRTotal body weight and adjusted body weight Vitals Allergies Allergy tableCreatinine and creatinine clearance with date/time (baseline and end of therapy)
Laboratory
Presence of vancomycin consult order OrdersLoading and maintenance doses with date/time eMARVancomycin concentration with date/time LaboratoryPresence of pharmacist PK note with date/time Notes
Pilot site C: Meropenem appropriateness according to approved criteria
Pilot site C desired an electronic means to assess appropriateness for meropenem approval according to committee-approved local criteria for use and restriction (Table 2). Capture of ESBL organisms via ICD-10 codes in the local system was explored, but this was insensitive. Microbiology data capture was also pursued to attempt to capture highly-resistant Gram negative organisms (See Drug resistant infection). Overall, there was difficulty obtaining discrete electronic data fields for clinically relevant factors that would indicate appropriateness. Therefore, the criteria would only partially be addressed by electronic data and individual patient review would still be necessary.
Table 2. Local criteria for use of Meropenem
Appropriate use
■ Empiric therapy for a patient with a history of ESBL-producing organisms and Pseudomonas risk factors.
■ History of infection with an organism that had proven resistance to piperacillin/tazobactam and proven susceptibility to a carbapenem.
■ Septic shock in highly immunocompromised patients, such as those with febrile neutropenia or organ transplant.
■ Post-operative infection. ■ Infected pancreatic necrosis.
Avoid use ■ Carbapenems should not be used when piperacillin/tazobactam is a viable alternative.
■ Use ertapenem when carbapenems are indicated, but Pseudomonas coverage is not needed.
DUKE ANTIMICROBIAL STEWARDSHIP OUTREACH NETWORK
83
Ideas for future work
Measurement of appropriateness of therapy is a challenging but very important area for future work in antimicrobial stewardship measurement. In general, the challenge in measurement of appropriateness is related to the many different components and nuanced decisions required for management of infection and antimicrobials. For example, appropriateness may be measured in multiple domains:
■ Accurate diagnosis
■ Appropriate selection of empiric antimicrobials
■ Appropriate diagnostic work up
■ Appropriate dose
■ Appropriate monitoring
■ Appropriate re-evaluation of clinical progress
■ Appropriate de-escalation or streamlining
■ Appropriate drug formulation (e.g. intravenous or oral)
■ Appropriate duration of therapy
Several of the domains listed above require subjective judgments to apply criteria. These judgments require individual patient review and thus result in a large burden of personnel time for routine assessments. Furthermore, a single metric is unlikely to capture the multiple domains as described above without being overly complex. Any proposed metric would require a more focused approach for a specific clinical scenario and/or domain.
It’s unlikely that electronic data will fully remove the need for subjective reviews of appropriateness. However, relevant data elements available through “data mining” electronic health records could greatly improve the efficiency of reviews of appropriateness in real time. For routine reporting, a surrogate electronic marker for appropriateness, that admittedly has some degree of uncertainty and is more limited in scope than a global appropriateness metric, could be used to track progress without requiring in-depth subjective reviews. Vancomycin dosing/monitoring and approved criteria for restricted agents (as above) are examples of targeted focus areas for such a surrogate to be defined. Regardless, measures of appropriateness remain an area in great need for future development.
MEASUREMENT TOOLS FOR ANTIMICROBIAL STEWARDSHIP PROGRAMS

84
4DUKE ANTIMICROBIAL STEWARDSHIP OUTREACH NETWORK

Measurement Tools for Antimicrobial Stewardship Programs
4Metrics that were feasible, but not useful

86
DUKE ANTIMICROBIAL STEWARDSHIP OUTREACH NETWORK
87
Days of therapy over admissions
Final assessment: Feasible but not meaningful
Rationale
Multiple metrics for antimicrobial utilization have been proposed for use by ASPs, including days of therapy (DOT) numerators over a denominator of admissions. Currently the NHSN AU option provides the admission denominators on a facility wide level. This may help ASPs understand AU in terms of individual patient admissions rather than more abstract concepts such as person time.
Data Sources explored with pilot sites
All five pilot sites were able to capture the denominator of admissions from established facility-wide estimates already calculated by infection prevention programs. Days of therapy was calculated as described previously (See Days of therapy over denominators of patient days or days present). Evaluation of days of therapy over a denominator of 1,000 admissions was evaluated on the facility level and discussed with pilot sites. Use of this metric was compared with rates using patient days and days present among the five pilot site hospitals.
Feedback from pilot sites and interpretation of the pilot sites’ data revealed less utility in this metric of AU as compared with other facility-wide rates using denominators of person time. DOT/1000 admissions compared between hospitals were highly influenced by lengths of stay, making between facility comparisons less equitable. However, when looking at individual patients or agents, days of therapy per admission may be helpful for understanding durations of therapy.
Ideas for future work
Instead of all hospital admissions, days of therapy or length of therapy among patients with antimicrobial exposure would be a more helpful metric to aid in understanding durations of therapy. We proposed a definition for antimicrobial admission denominator as presented in Redundant events metric description: an admission in which at least 1 dose of an antimicrobial was given on an inpatient unit, without regard to inpatient status. Antimicrobial admissions could also be calculated among specific agents or groups (e.g. levofloxacin admissions or
MEASUREMENT TOOLS FOR ANTIMICROBIAL STEWARDSHIP PROGRAMS

88
fluoroquinolone admissions). The antimicrobial admission denominator should be feasible for most sites who have already established eMAR data sources at the patient level (Data Table 1). Then, length of therapy per targeted antimicrobial admission would provide information about the number of days of the targeted agent used per admission in which a patient received that targeted agent. This can be quite useful in anticipating effects and design of targeted initiatives. For example, an ASP planning on implementing a time out targeted to vancomycin might discover that the median length of therapy per vancomycin admission is only 2 days, thus the majority of vancomycin patients would not be eligible for a time out that was designed to target day 3 or 4.
The sample report used in this project that included the DOT/admission metric are included in the section on Days of therapy over a denominator of patient days or days present.
DUKE ANTIMICROBIAL STEWARDSHIP OUTREACH NETWORK
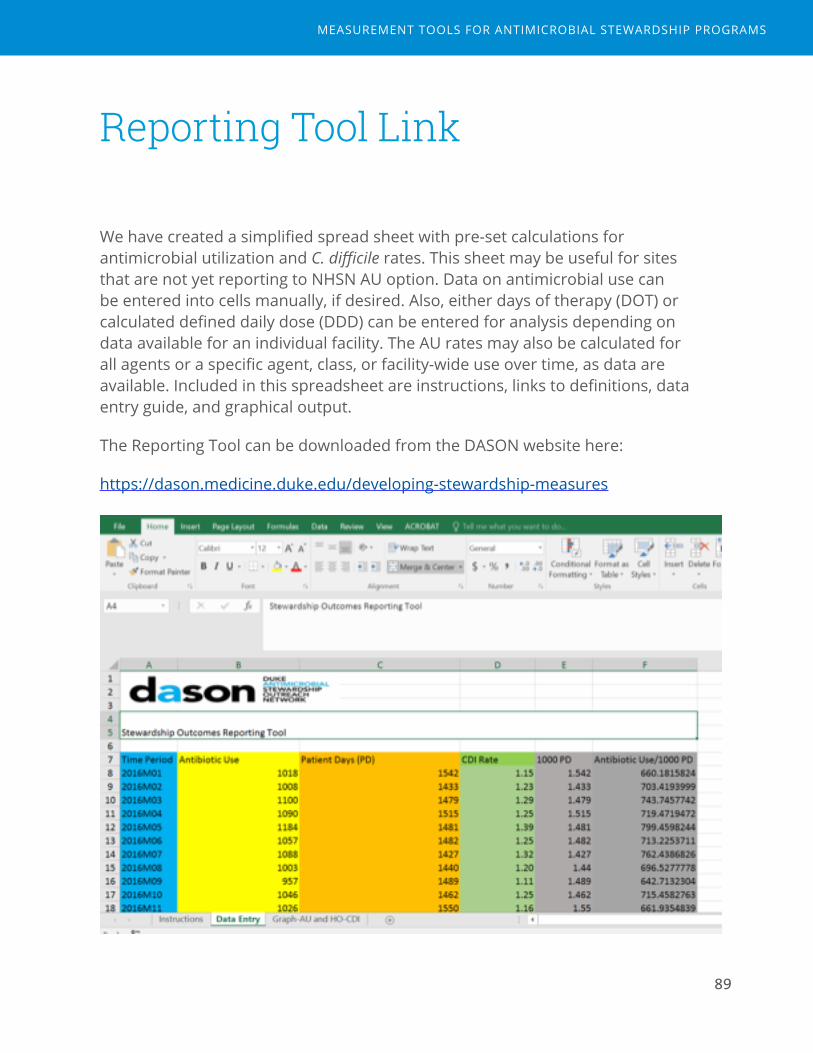
89
Reporting Tool Link
We have created a simplified spread sheet with pre-set calculations for antimicrobial utilization and C. difficile rates. This sheet may be useful for sites that are not yet reporting to NHSN AU option. Data on antimicrobial use can be entered into cells manually, if desired. Also, either days of therapy (DOT) or calculated defined daily dose (DDD) can be entered for analysis depending on data available for an individual facility. The AU rates may also be calculated for all agents or a specific agent, class, or facility-wide use over time, as data are available. Included in this spreadsheet are instructions, links to definitions, data entry guide, and graphical output.
The Reporting Tool can be downloaded from the DASON website here:
https://dason.medicine.duke.edu/developing-stewardship-measures
MEASUREMENT TOOLS FOR ANTIMICROBIAL STEWARDSHIP PROGRAMS

90
DUKE ANTIMICROBIAL STEWARDSHIP OUTREACH NETWORK

91
References
1. Antibiotic Resistance Threats in the United States, 2013. (Accessed January 5, 2017, at https://www.cdc.gov/drugresistance/threat-report-2013/index.html.)
2. Pollack LA, Srinivasan A. Core elements of hospital antibiotic stewardship programs from the Centers for Disease Control and Prevention. Clinical infectious diseases : an official publication of the Infectious Diseases Society of America 2014;59 Suppl 3:S97-100.
3. The Joint Commission. Antimicrobial Stewardship Standard. MM.09.01.01. 2017. (Accessed April 11, 2017, at https://www.jointcommission.org/prepublication_standards_antimicrobial_stewardship_standard/.)
4. Trends in U.S. Antibiotic Use. (Accessed August 21, 2017, at http://www.pewtrusts.org/en/research-and-analysis/issue-briefs/2017/03/trends-in-us-antibiotic-use.)
5. Moehring RW, Anderson DJ, Cochran RL, Hicks LA, Srinivasan A, Dodds Ashley ES. Expert Consensus on Metrics to Assess the Impact of Patient-Level Antimicrobial Stewardship Interventions in Acute-Care Settings. Clinical infectious diseases : an official publication of the Infectious Diseases Society of America 2017;64:377-83.
6. Centers for Disease Control and Prevention. National Healthcare Safety Network: Antimicrobial Use and Resistance (AUR) Options. (Accessed March 31, 2016, at http://www.cdc.gov/nhsn/acute-care-hospital/aur/index.html )
7. Centers for Disease Control and Prevention, National Healthcare Safety Network: MDRO Module. (Accessed March 31, 2016, at http://www.cdc.gov/nhsn/PDFs/pscManual/12pscMDRO_CDADcurrent.pdf.)
8. Feazel LM, Malhotra A, Perencevich EN, Kaboli P, Diekema DJ, Schweizer ML. Effect of antibiotic stewardship programmes on Clostridium difficile incidence: a systematic review and meta-analysis. The Journal of antimicrobial chemotherapy 2014;69:1748-54.
9. Durkin MJ, Baker AW, Dicks KV, et al. A comparison between National Healthcare Safety Network laboratory-identified event reporting versus traditional surveillance for Clostridium difficile infection. Infection control and hospital epidemiology 2015;36:125-31.
10. Polk RE, Fox C, Mahoney A, Letcavage J, MacDougall C. Measurement of adult antibacterial drug use in 130 US hospitals: comparison of defined daily dose and days of therapy. Clinical infectious diseases : an official publication of the Infectious Diseases Society of America 2007;44:664-70.
11. Polk RE, Hohmann SF, Medvedev S, Ibrahim O. Benchmarking risk-adjusted adult antibacterial drug use in 70 US academic medical center hospitals. Clinical infectious diseases : an official publication of the Infectious Diseases Society of America 2011;53:1100-10.
MEASUREMENT TOOLS FOR ANTIMICROBIAL STEWARDSHIP PROGRAMS

92
12. Kalil AC, Metersky ML, Klompas M, et al. Management of Adults With Hospital-acquired and Ventilator-associated Pneumonia: 2016 Clinical Practice Guidelines by the Infectious Diseases Society of America and the American Thoracic Society. Clinical infectious diseases : an official publication of the Infectious Diseases Society of America 2016;63:e61-e111.
13. Agency for Healthcare Research and Quality. Healthcare Cost and Utilization Project. Clinical Classifications Software (CCS) for ICD-10-CM/PCS. (Accessed April 25, 2017, at https://www.hcup-us.ahrq.gov/toolssoftware/ccs10/ccs10.jsp.)
14. Specifications Manual, Version 5.1, Section 2.1: Early Management Bundle, Severe Sepsis/Septic Shock (SEP-1). (Accessed January 5, 2017, at https://www.qualitynet.org/dcs/.)
15. Rhee C, Murphy MV, Li L, Platt R, Klompas M. Improving documentation and coding for acute organ dysfunction biases estimates of changing sepsis severity and burden: a retrospective study. Critical care (London, England) 2015;19:338.
16. Rhee C, Murphy MV, Li L, Platt R, Klompas M. Comparison of trends in sepsis incidence and coding using administrative claims versus objective clinical data. Clinical infectious diseases : an official publication of the Infectious Diseases Society of America 2015;60:88-95.
17. Pollack LA, van Santen KL, Weiner LM, Dudeck MA, Edwards JR, Srinivasan A. Antibiotic Stewardship Programs in U.S. Acute Care Hospitals: Findings From the 2014 National Healthcare Safety Network Annual Hospital Survey. Clinical infectious diseases : an official publication of the Infectious Diseases Society of America 2016.
18. Antibiotic Resistance Patient Safety Atlas: Phenotype Definitions. (Accessed November 12, 2016, at https://www.cdc.gov/hai/pdfs/patient-safety-atlas/AR-Patient-Safety-Atlas-Phenotype-Definitions.pdf.)
DUKE ANTIMICROBIAL STEWARDSHIP OUTREACH NETWORK

Measurement Tools for Antimicrobial Stewardship Programs
Appendices

94
ADUKE ANTIMICROBIAL STEWARDSHIP OUTREACH NETWORK

Measurement Tools for Antimicrobial Stewardship Programs
AAppendix A: Data Table StructuresThe data tables described below can be organized into a relational database for analysis of the metrics described in the Technical Manual. Linking key identifiers for each table are indicated with an asterisk and include a patient identifier and an admission or encounter identifier.

96
DUKE ANTIMICROBIAL STEWARDSHIP OUTREACH NETWORK

Data Table 1. eMAR data
The goal of Data Table 1 is to capture patient antimicrobial information.
Source of data: Pharmacy system electronic medicine administration records, where each administration of an antimicrobial agent is documented by nursing staff.
Each row or record of the file will represent each administered dose of an antimicrobial. For example, a patient who received 3 doses of the same drug on a single day will have three rows for that day. Raw electronic medication administration record data from the electronic health record would be limited to only anti-infective agents (AHFS Pharmacologic-Therapeutic Classification System code 08.00)1 and mapped to a standard list of agents and routes (e.g. NHSN AU Option list).2
For ease of linking to other NHSN datasets, units should be mapped to similar names as in NHSN for each facility, and unit type category assigned.
Field Name Format Definition NotesPatientID* Number Patient identifierAdmissionID* Number Admission or
encounter identifierAgentID Number Agent identifier Requires mappingAgentName Text Agent name,
standardized; Example: “cefazolin”
Requires mapping
ReportedAntimicrobialName Text Agent name, as reported from primary system Example: “CEFAZOLIN (ANCEF) IN SODIUM CHLORIDE 0.9% IVPB 2 G/50 ML”
AdministrationDateTime Date/Time
Date and time of antimicrobial administration Example: “11/9/2016 2:22:00 AM”
97
MEASUREMENT TOOLS FOR ANTIMICROBIAL STEWARDSHIP PROGRAMS

98
Field Name Format Definition NotesRouteCategoryID Number Route category
identifierRequires mapping
RouteName Text Route category name, standardized Example: intravenous, intramuscular, inhaled, digestive
Requires mapping
ReportedRouteName Text Route, as reported from primary system Example: “NG tube”
UnitID Number Unit identifier Requires mappingUnitName Text Unit name,
standardized to indicate preferred local name Example: “Special Care Nursery”
Requires mapping
ReportedUnitName Text Unit name, as reported from primary system Example: “SCN”
NHSNUnitID Number Unit type category identifier
Requires mapping
NHSNUnitName Text Unit type category name Example: “STEP DOWN NEONATAL NURSERY (LEVEL II)”
Requires mapping
DUKE ANTIMICROBIAL STEWARDSHIP OUTREACH NETWORK

99
Data Table 2. Patient movement data
The goal of Data Table 2 is to capture patient movement within the hospital, with a focus on capturing movements between inpatient units.
Source of data: These data have been referred to by several different names: bed movement data, bed flow data, patient movement data, admission/discharge/transfer data
Unit mapping for this table should be consistent with mapping from Data Table 1. Reported unit names out of patient movement data often differs from that extracted from pharmacy systems. Thus, attention to names for locations used by each system and those which are meaningful to front-line stewards must be reconciled.
Field Name Format Definition NotesPatientID* Number Patient identifierAdmissionID* Number Admission or
encounter identifierBedflowID Number Bedflow identifierLocationArrivalDateTime Date/
timeDate and time of arrival in location
LocationDismissalDateTime Date/time
Date and time of dismissal from location
UnitID Number Unit identifier Requires mappingUnitName Text Unit name,
standardized to indicate preferred local name Example: “Special Care Nursery”
Requires mapping
ReportedUnitName Text Unit name, as reported from primary system Example: “SCN”
NHSNUnitID Number Unit type category identifier
Requires mapping
MEASUREMENT TOOLS FOR ANTIMICROBIAL STEWARDSHIP PROGRAMS

100
Field Name Format Definition NotesNHSNUnitName Text Unit type category
name Example: “STEP DOWN NEONATAL NURSERY (LEVEL II)”
Requires mapping
DUKE ANTIMICROBIAL STEWARDSHIP OUTREACH NETWORK

101
Data Table 3. CDI LabID Line list
The goal of Data Table 3 is to capture C. difficile LabID events. Definitions for LabID events are discussed in the Technical Manual and in NHSN documents.3
Source(s) of data: NHSN or a local Infection Prevention database
Each row in the table represents a single LabID event. There are potentially multiple rows per patient. This data table is retrievable directly out of NHSN by exporting facility data (found on the Import/Export tab within NHSN). For this dataset, you will need the labidevent file which is one of the many files that is obtained through this routine query.
For facilities that do not use NHSN, a line list of C. difficile event data utilizing NHSN definitions for LabID events input to the table format below could be utilized.
Field Name Format Definition NotesPatID* Number Patient identifier This could be
mapped to PatientID in ASP database
eventID Number Event identifierLocation Text Location name Hospital unit, or
facility-wideOutpatient Text Location outpatient
versus inpatient, Y=yes, N=no
Onset Text Onset-type category: CO=community onset HO=hospital onset CO-HCFA= community onset healthcare facility associated
Cdiassay Text Incident=new event Recurrent=recurrent event
Will remove recurrent events to calculate incidence rate
MEASUREMENT TOOLS FOR ANTIMICROBIAL STEWARDSHIP PROGRAMS

102
Field Name Format Definition NotesAdmitdate Date Date of hospital
admissionLocationadmitdate Date Date of location
admissionMay be the date of transfer to a hospital unit
Specimendate Date Date of specimen collection
FWCDIF_facIncHOcount Number Event counts for facility-wide hospital-onset event
FWCDIF_admprevCOcount Number Event counts for facility-wide community-onset event
DUKE ANTIMICROBIAL STEWARDSHIP OUTREACH NETWORK
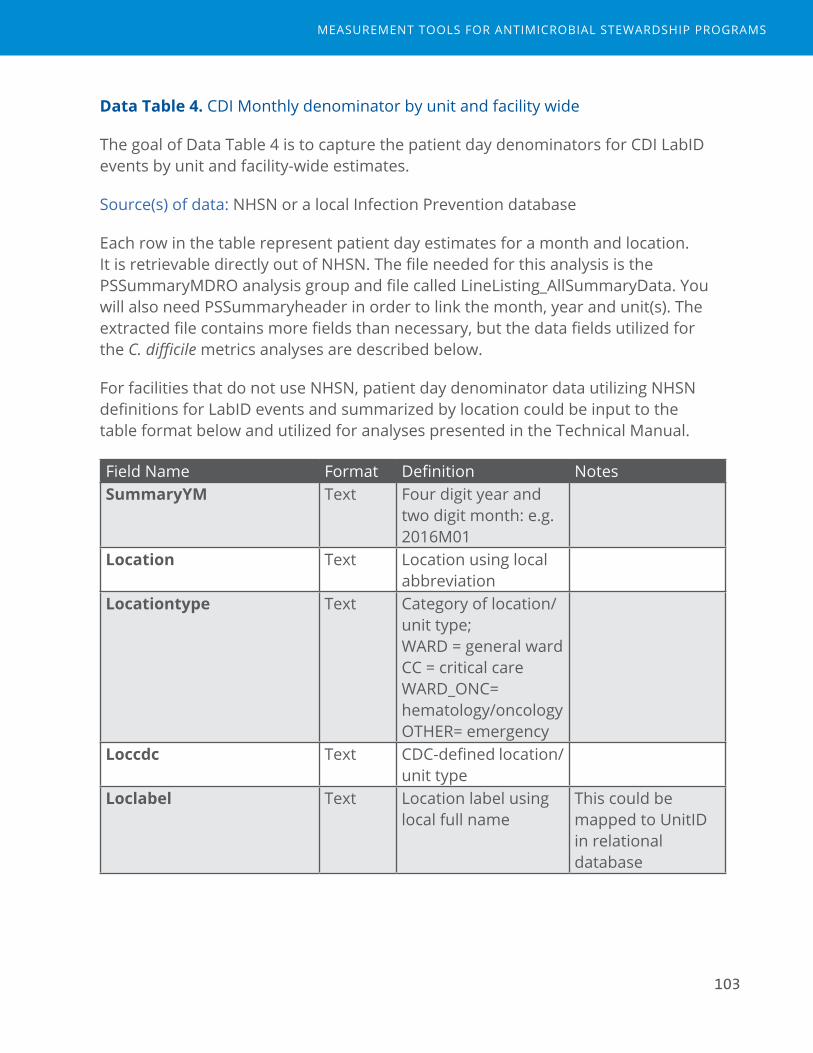
103
Data Table 4. CDI Monthly denominator by unit and facility wide
The goal of Data Table 4 is to capture the patient day denominators for CDI LabID events by unit and facility-wide estimates.
Source(s) of data: NHSN or a local Infection Prevention database
Each row in the table represent patient day estimates for a month and location. It is retrievable directly out of NHSN. The file needed for this analysis is the PSSummaryMDRO analysis group and file called LineListing_AllSummaryData. You will also need PSSummaryheader in order to link the month, year and unit(s). The extracted file contains more fields than necessary, but the data fields utilized for the C. difficile metrics analyses are described below.
For facilities that do not use NHSN, patient day denominator data utilizing NHSN definitions for LabID events and summarized by location could be input to the table format below and utilized for analyses presented in the Technical Manual.
Field Name Format Definition NotesSummaryYM Text Four digit year and
two digit month: e.g. 2016M01
Location Text Location using local abbreviation
Locationtype Text Category of location/unit type; WARD = general ward CC = critical care WARD_ONC= hematology/oncology OTHER= emergency
Loccdc Text CDC-defined location/unit type
Loclabel Text Location label using local full name
This could be mapped to UnitID in relational database
MEASUREMENT TOOLS FOR ANTIMICROBIAL STEWARDSHIP PROGRAMS
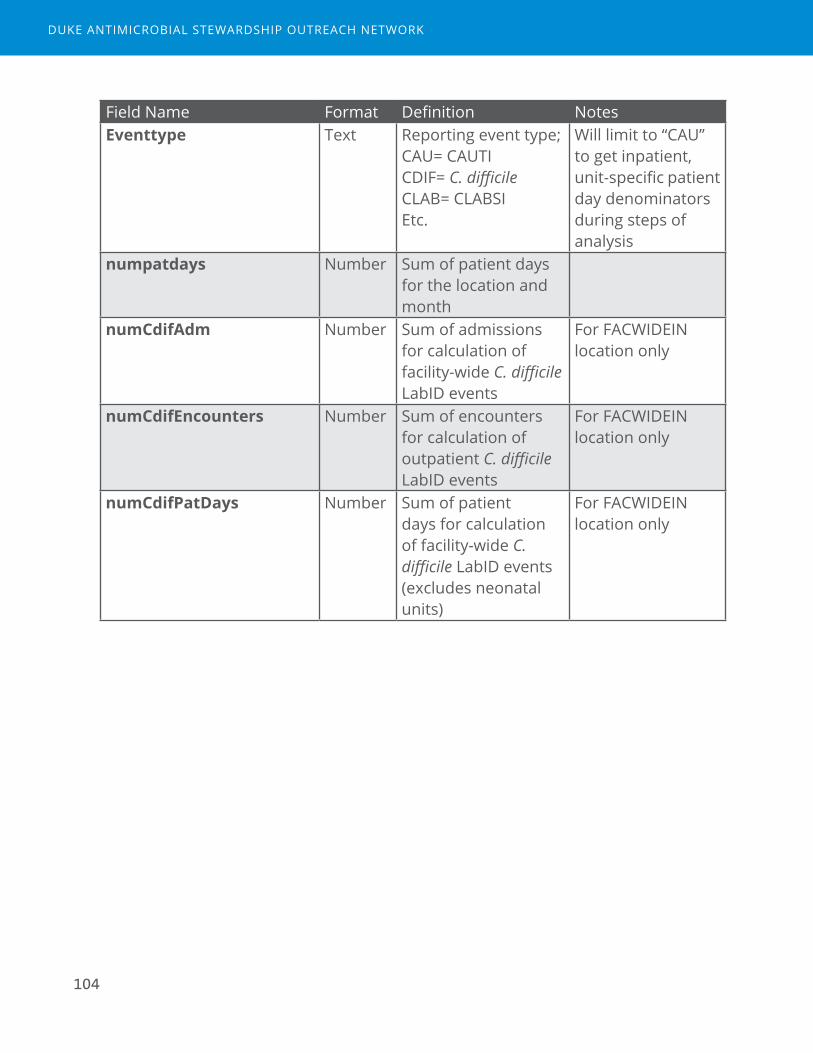
104
Field Name Format Definition NotesEventtype Text Reporting event type;
CAU= CAUTI CDIF= C. difficile CLAB= CLABSI Etc.
Will limit to “CAU” to get inpatient, unit-specific patient day denominators during steps of analysis
numpatdays Number Sum of patient days for the location and month
numCdifAdm Number Sum of admissions for calculation of facility-wide C. difficile LabID events
For FACWIDEIN location only
numCdifEncounters Number Sum of encounters for calculation of outpatient C. difficile LabID events
For FACWIDEIN location only
numCdifPatDays Number Sum of patient days for calculation of facility-wide C. difficile LabID events (excludes neonatal units)
For FACWIDEIN location only
DUKE ANTIMICROBIAL STEWARDSHIP OUTREACH NETWORK

105
Data Table 5. Electronic discharge prescriptions
The goal of data table 5 is to capture electronic prescriptions written for fill upon discharge.
Source(s) of data: Electronic discharge prescriptions or “e-scripts”
Each row in the table represents one discharge prescription for a single agent. Thus, there may be more than one row per patient and per admission.
Field Name Format Definition NotesPatientID* Number Patient identifierAdmissionID* Number Admission identifierAgentID Number Agent identifier Requires mapping,
similar to that used for the eMAR file
DischargeDrugID Number Discharge drug identifier
ReportedDrugName Text Agent name, as reported from primary system
ReportedSig Text Sig, as reported from primary system
ReportedFrequency Text Frequency, as reported from primary system
ReportedDispense Number Number of doses dispensed, as reported from primary system
ReportedDuration Number Days duration, as reported from primary system
May or may not be available
MEASUREMENT TOOLS FOR ANTIMICROBIAL STEWARDSHIP PROGRAMS
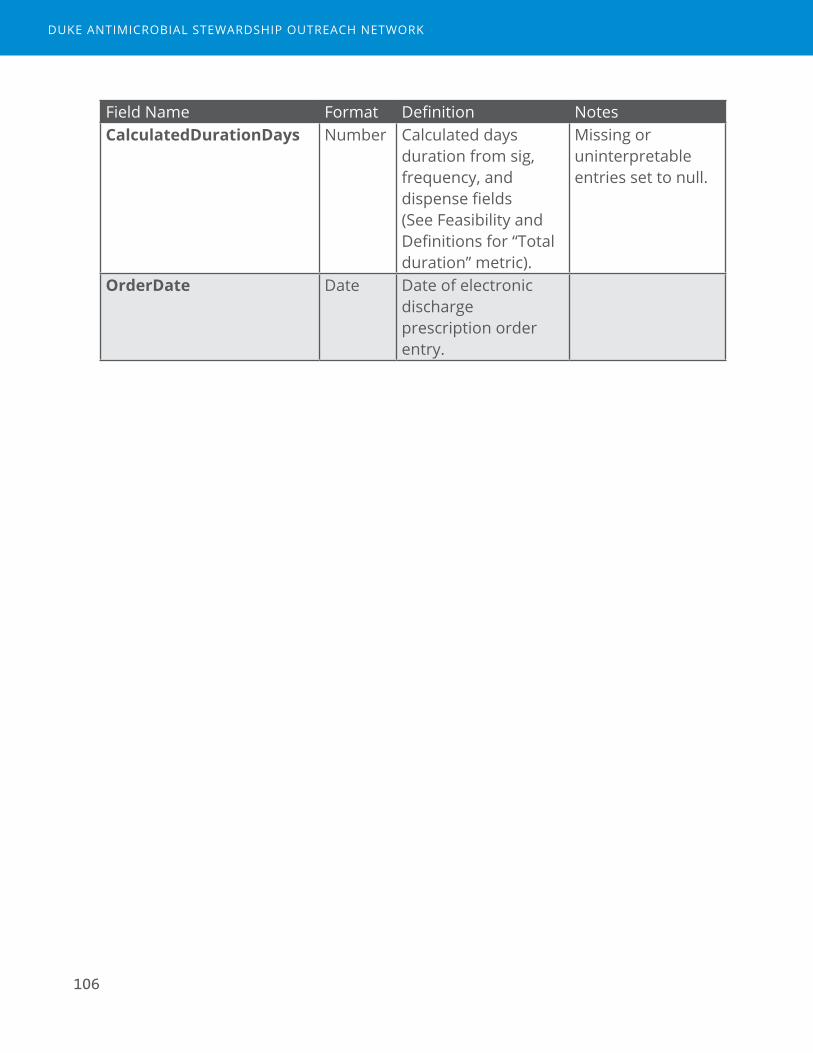
106
Field Name Format Definition NotesCalculatedDurationDays Number Calculated days
duration from sig, frequency, and dispense fields (See Feasibility and Definitions for “Total duration” metric).
Missing or uninterpretable entries set to null.
OrderDate Date Date of electronic discharge prescription order entry.
DUKE ANTIMICROBIAL STEWARDSHIP OUTREACH NETWORK
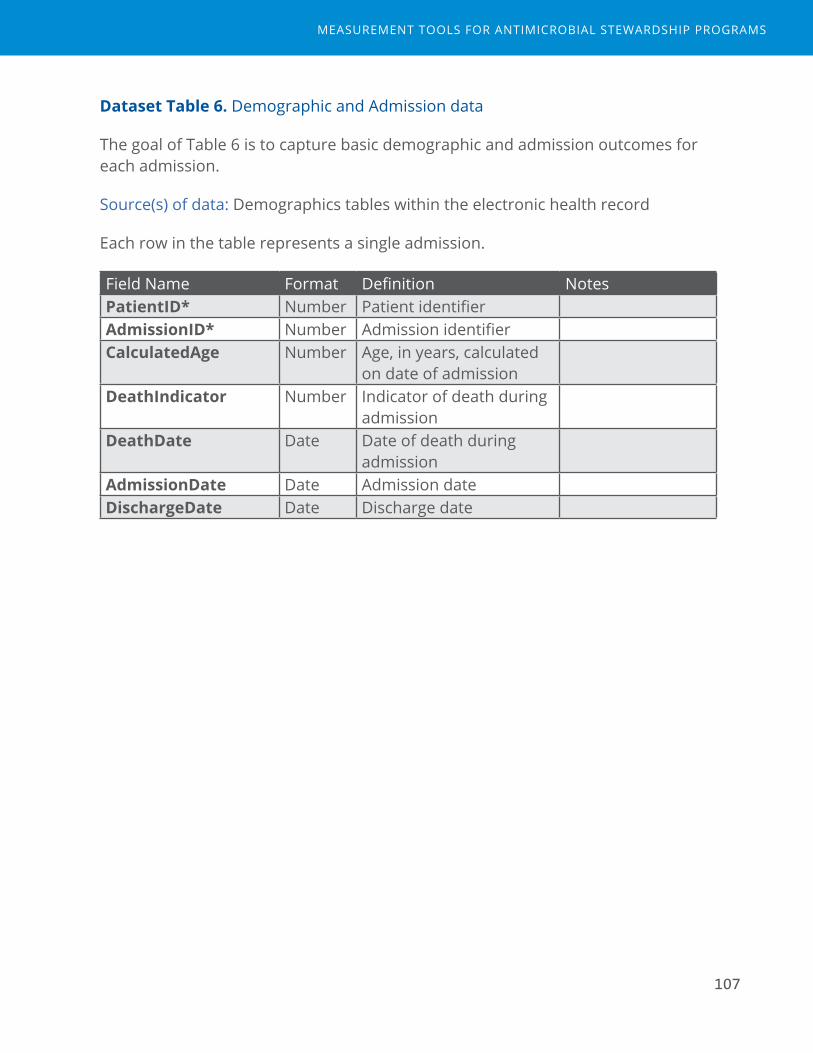
107
Dataset Table 6. Demographic and Admission data
The goal of Table 6 is to capture basic demographic and admission outcomes for each admission.
Source(s) of data: Demographics tables within the electronic health record
Each row in the table represents a single admission.
Field Name Format Definition NotesPatientID* Number Patient identifierAdmissionID* Number Admission identifierCalculatedAge Number Age, in years, calculated
on date of admissionDeathIndicator Number Indicator of death during
admissionDeathDate Date Date of death during
admissionAdmissionDate Date Admission dateDischargeDate Date Discharge date
MEASUREMENT TOOLS FOR ANTIMICROBIAL STEWARDSHIP PROGRAMS
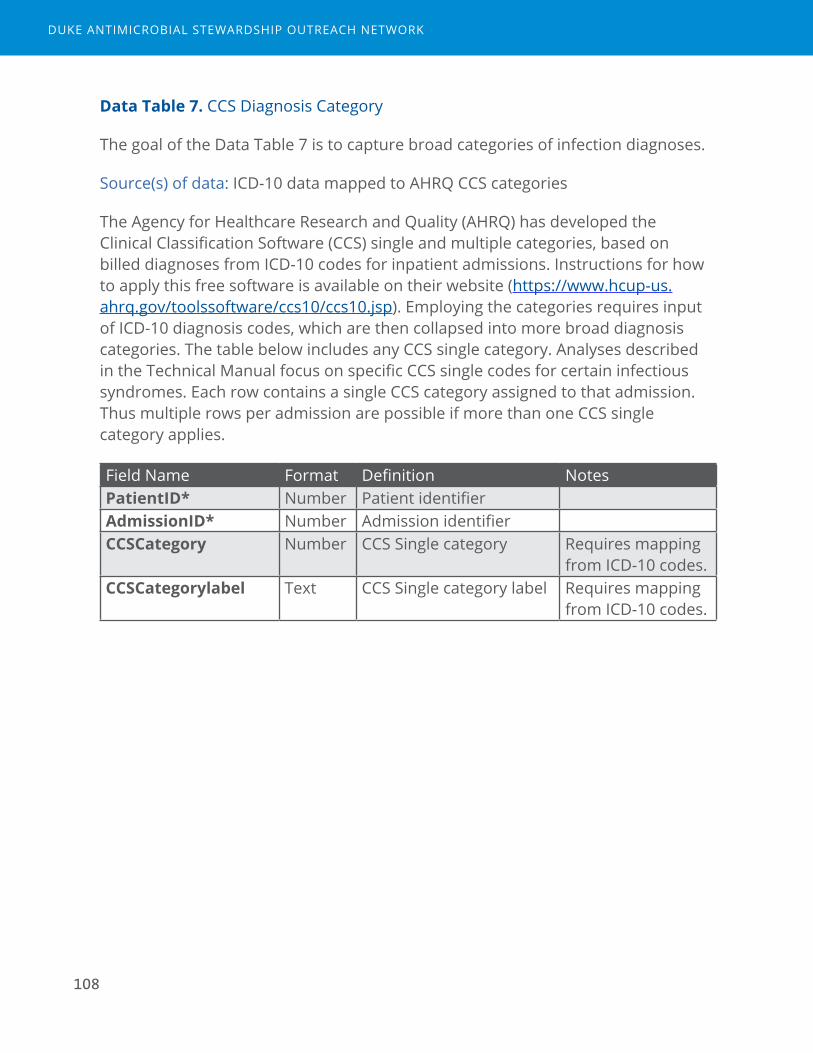
108
Data Table 7. CCS Diagnosis Category
The goal of the Data Table 7 is to capture broad categories of infection diagnoses.
Source(s) of data: ICD-10 data mapped to AHRQ CCS categories
The Agency for Healthcare Research and Quality (AHRQ) has developed the Clinical Classification Software (CCS) single and multiple categories, based on billed diagnoses from ICD-10 codes for inpatient admissions. Instructions for how to apply this free software is available on their website (https://www.hcup-us.ahrq.gov/toolssoftware/ccs10/ccs10.jsp). Employing the categories requires input of ICD-10 diagnosis codes, which are then collapsed into more broad diagnosis categories. The table below includes any CCS single category. Analyses described in the Technical Manual focus on specific CCS single codes for certain infectious syndromes. Each row contains a single CCS category assigned to that admission. Thus multiple rows per admission are possible if more than one CCS single category applies.
Field Name Format Definition NotesPatientID* Number Patient identifierAdmissionID* Number Admission identifierCCSCategory Number CCS Single category Requires mapping
from ICD-10 codes.CCSCategorylabel Text CCS Single category label Requires mapping
from ICD-10 codes.
DUKE ANTIMICROBIAL STEWARDSHIP OUTREACH NETWORK

109
Data Table 8. Interventions
The goal of Data Table 8 is to capture pharmacist interventions documented as “Antimicrobial Stewardship” interventions.
Source(s) of data: Intervention notes from the electronic health record, typically from a template form entered by a clinical pharmacist. For this study, Epic system notes called “iVENTs” were utilized.4
Each row in the table represents one intervention, thus a single admission could have multiple antimicrobial stewardship interventions.
Field Name Format Definition NotesPatientID* Number Patient identifierAdmissionID* Number Admission identifierInterventionID Number Intervention identifierInterventionname Text Agent descriptor as
reported by primary system
Type Text Antimicrobial StewardshipSubType Text Subtype of Antimicrobial
Stewardship intervention, as reported by primary system
e.g. IV/PO switch, streamlining/de-escalation
Response Text Prescriber’s response to intervention as documented by pharmacist performing the intervention
e.g. accepted, rejected
Createdby Text Pharmacist who performed the intervention
CreatedDateTime Date/Time
Date/time when intervention documentation was initiated
ClosedDateTime Date/Time
Date/time when intervention documentation was closed
MEASUREMENT TOOLS FOR ANTIMICROBIAL STEWARDSHIP PROGRAMS

110
BDUKE ANTIMICROBIAL STEWARDSHIP OUTREACH NETWORK

Measurement Tools for Antimicrobial Stewardship Programs
BAppendix B: Manuscript of Expert Panel ProcessPublished in Clinical Infectious Diseases, Volume 64, Issue 3, 1 February 2017, Pages 377–383, https://doi.org/10.1093/cid/ciw787

112
DUKE ANTIMICROBIAL STEWARDSHIP OUTREACH NETWORK
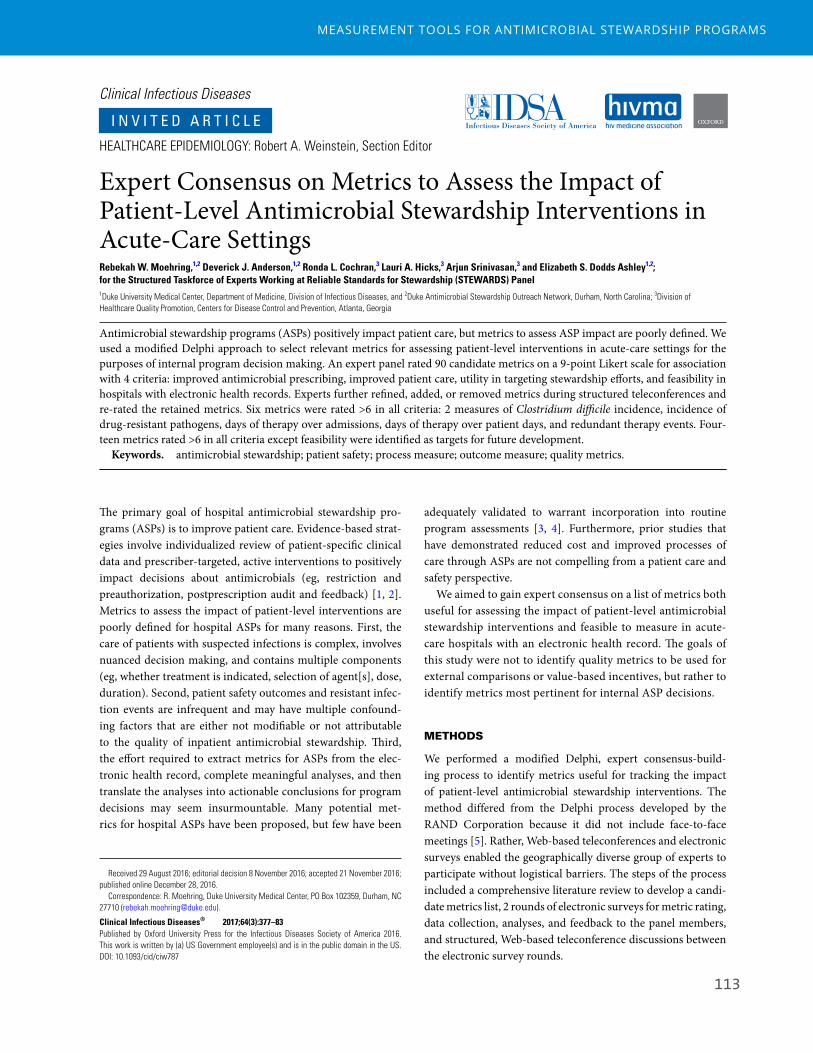
113
Clinical Infectious Diseases
Clinical Infectious Diseases® 2017;64(3):377–83
HEALTHCARE EPIDEMIOLOGY • CID 2017:64 (1 February) • 377
Expert Consensus on Metrics to Assess the Impact of Patient-Level Antimicrobial Stewardship Interventions in Acute-Care SettingsRebekah W. Moehring,1,2 Deverick J. Anderson,1,2 Ronda L. Cochran,3 Lauri A. Hicks,3 Arjun Srinivasan,3 and Elizabeth S. Dodds Ashley1,2; for the Structured Taskforce of Experts Working at Reliable Standards for Stewardship (STEWARDS) Panel1Duke University Medical Center, Department of Medicine, Division of Infectious Diseases, and 2Duke Antimicrobial Stewardship Outreach Network, Durham, North Carolina; 3Division of Healthcare Quality Promotion, Centers for Disease Control and Prevention, Atlanta, Georgia
Antimicrobial stewardship programs (ASPs) positively impact patient care, but metrics to assess ASP impact are poorly defined. We used a modified Delphi approach to select relevant metrics for assessing patient-level interventions in acute-care settings for the purposes of internal program decision making. An expert panel rated 90 candidate metrics on a 9-point Likert scale for association with 4 criteria: improved antimicrobial prescribing, improved patient care, utility in targeting stewardship efforts, and feasibility in hospitals with electronic health records. Experts further refined, added, or removed metrics during structured teleconferences and re-rated the retained metrics. Six metrics were rated >6 in all criteria: 2 measures of Clostridium difficile incidence, incidence of drug-resistant pathogens, days of therapy over admissions, days of therapy over patient days, and redundant therapy events. Four-teen metrics rated >6 in all criteria except feasibility were identified as targets for future development.
Keywords. antimicrobial stewardship; patient safety; process measure; outcome measure; quality metrics.
The primary goal of hospital antimicrobial stewardship pro-grams (ASPs) is to improve patient care. Evidence-based strat-egies involve individualized review of patient-specific clinical data and prescriber-targeted, active interventions to positively impact decisions about antimicrobials (eg, restriction and preauthorization, postprescription audit and feedback) [1, 2]. Metrics to assess the impact of patient-level interventions are poorly defined for hospital ASPs for many reasons. First, the care of patients with suspected infections is complex, involves nuanced decision making, and contains multiple components (eg, whether treatment is indicated, selection of agent[s], dose, duration). Second, patient safety outcomes and resistant infec-tion events are infrequent and may have multiple confound-ing factors that are either not modifiable or not attributable to the quality of inpatient antimicrobial stewardship. Third, the effort required to extract metrics for ASPs from the elec-tronic health record, complete meaningful analyses, and then translate the analyses into actionable conclusions for program decisions may seem insurmountable. Many potential met-rics for hospital ASPs have been proposed, but few have been
adequately validated to warrant incorporation into routine program assessments [3, 4]. Furthermore, prior studies that have demonstrated reduced cost and improved processes of care through ASPs are not compelling from a patient care and safety perspective.
We aimed to gain expert consensus on a list of metrics both useful for assessing the impact of patient-level antimicrobial stewardship interventions and feasible to measure in acute-care hospitals with an electronic health record. The goals of this study were not to identify quality metrics to be used for external comparisons or value-based incentives, but rather to identify metrics most pertinent for internal ASP decisions.
METHODS
We performed a modified Delphi, expert consensus-build-ing process to identify metrics useful for tracking the impact of patient-level antimicrobial stewardship interventions. The method differed from the Delphi process developed by the RAND Corporation because it did not include face-to-face meetings [5]. Rather, Web-based teleconferences and electronic surveys enabled the geographically diverse group of experts to participate without logistical barriers. The steps of the process included a comprehensive literature review to develop a candi-date metrics list, 2 rounds of electronic surveys for metric rating, data collection, analyses, and feedback to the panel members, and structured, Web-based teleconference discussions between the electronic survey rounds.
I N V I T E D A R T I C L E
Published by Oxford University Press for the Infectious Diseases Society of America 2016. This work is written by (a) US Government employee(s) and is in the public domain in the US.DOI: 10.1093/cid/ciw787
Received 29 August 2016; editorial decision 8 November 2016; accepted 21 November 2016; published online December 28, 2016.
Correspondence: R. Moehring, Duke University Medical Center, PO Box 102359, Durham, NC 27710 ([email protected]).
HEALTHCARE EPIDEMIOLOGY: Robert A. Weinstein, Section Editor
MEASUREMENT TOOLS FOR ANTIMICROBIAL STEWARDSHIP PROGRAMS

114378 • CID 2017:64 (1 February) • HEALTHCARE EPIDEMIOLOGY
Methods for Comprehensive Literature Review and Development of a Preliminary List of Metrics
A set of candidate metrics was compiled from a comprehensive review of published literature on antimicrobial stewardship out-comes and process measurement. First, a PubMed search was conducted using the following search terms for the time period prior to April 2015:
[((“antimicrobial management”) OR (“antibiotic manage-ment”) OR (“antimicrobial utilization”) OR (“antibiotic utiliza-tion”) (“antimicrobial utilisation”) OR (“antibiotic utilisation”) OR (“antimicrobial stewardship”) OR (“antibiotic steward-ship”)) OR (“academic detailing” AND antibiotic OR antibi-otics OR ((“Anti-Infective Agents”[Mesh]) OR “Anti-Bacterial Agents”[Mesh])] AND (patient safety OR patient outcome OR patient outcomes OR “Outcome and Process Assessment (Health Care)”[Mesh]).
Second, abstracts were screened by 2 physician and 1 pharma-cist investigators (R. W. M., D. J. A., E. D. A.) to apply inclusion and exclusion criteria. Publications met inclusion criteria if they intended to measure the effect of a patient-level stewardship intervention, which was defined as involving (1) a patient-level clinical review (either medical record review or verbal review with a primary provider) and (2) recommendation(s) made to adjust antimicrobial therapy for a specific patient. Publications were limited to inpatient, acute-care ASPs. Exclusion criteria were as follows: (1) the publication was not related to antimi-crobial stewardship, which targets adjustment, discontinuation, or optimization of antimicrobial therapy; or (2) the study inter-vention involved a “guideline” or “education” activity that did not include individual patient-level review and patient-specific intervention. The goal of the literature review was to capture a broad array of possible patient-level ASP metrics. Some pub-lications included proposed metrics based on expert opinion; others directly measured and applied the metric in a study of intervention effect.
The third step of developing the preliminary metric list included review of each publication for extraction of proposed and utilized metrics. Each metric was placed into 1 of 5 metric categories: clinical outcomes, unintended consequences, uti-lization, process measure, or financial outcomes [6]. Primary references were added to the list for metric extraction as nec-essary. Duplicate entries were removed. Similar metrics were combined and summarized into a single description.
Assembly of the Expert Panel
The Structured Taskforce of Experts Working at Reliable Standards for Stewardship (STEWARDS) panel was assembled from geographically diverse areas of the United States (Table 1). All 19 invited experts agreed to participate and completed the modified Delphi process from September through December 2015. The panel included adult and pediatric infectious dis-ease physicians and pharmacists with dedicated active practice
in antimicrobial stewardship, healthcare epidemiologists, aca-demic researchers, Veterans Affairs representatives, and Centers for Disease Control and Prevention (CDC) stewardship experts.
Methods for Electronic Survey, Expert Panel Discussions, and Data Analysis
The preliminary list of metrics were compiled into a Web-based, electronic survey via Research Electronic Data Capture (REDCap) software hosted at Duke University [7]. Experts were asked to evaluate each metric using a 9-point Likert scale by rat-ing their agreement in 4 separate criteria based on their expert opinion:
1. This metric is associated with improved antimicrobial prescribing.
2. This metric is associated with improved patient care.3. This metric is useful in targeting antimicrobial stewardship
efforts.4. This metric is feasible to monitor in any hospital with an
electronic health record.
Experts were encouraged to (1) submit free text comments on each metric or the group of metrics in each category and (2) add additional metrics that they believed should be considered for inclusion in subsequent rounds. The electronic survey also elic-ited experts’ suggestions for refinement of wording or descrip-tion of each metric.
A priori rejection and retention criteria were used to ana-lyze the results from the first electronic survey. Mean and 95% confidence intervals (CIs) were calculated for each metric and criterion. Ratings with a mean upper 95% CI bound <4 were deemed to have consensus to reject; ratings with a lower 95% CI bound >6 were deemed to have consensus to retain. Metrics that met criteria for consensus to reject in 3 or 4 criteria were removed. Metrics that met criteria for consensus to retain in 3 or 4 criteria were carried forward to the discussion and round 2 survey. All other metrics were considered “equivocal” and open for discussion, refinement, or reevaluation. All analyses and summaries of written comments were presented back to panel members by email prior to discussions.
Two Web conferences were held, each with half of the mem-bers of the expert panel in attendance. The discussion reviewed results for all metrics from the initial survey, confirmed agree-ment with retention of metrics by the a priori criteria, and allowed the panel to determine retention or removal of equiv-ocal metrics. Discussions were moderated by a CDC qualita-tive research specialist (R. L. C.), who assured that every panel member was given opportunity to participate using a stand-ardized script. Verbal consensus from the group was sought for final decisions to remove metrics, refine their description, suggest additional metrics, or retain metrics for rating in the next survey round.
DUKE ANTIMICROBIAL STEWARDSHIP OUTREACH NETWORK
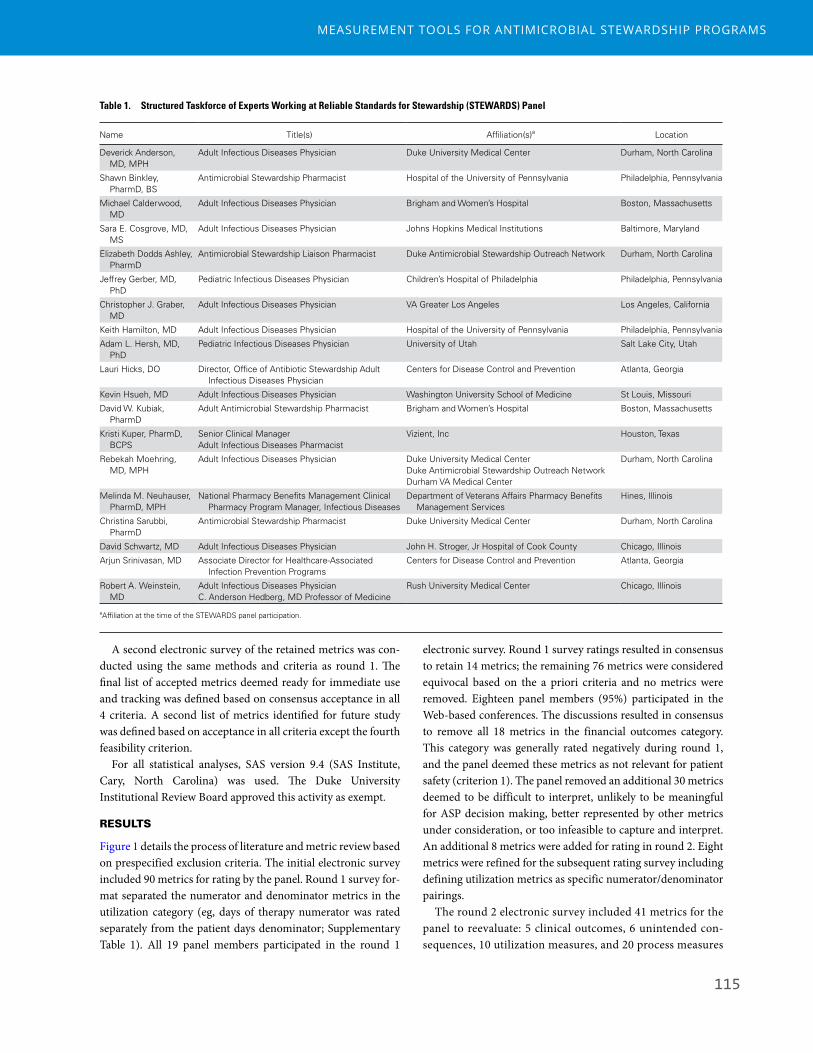
115HEALTHCARE EPIDEMIOLOGY • CID 2017:64 (1 February) • 379
A second electronic survey of the retained metrics was con-ducted using the same methods and criteria as round 1. The final list of accepted metrics deemed ready for immediate use and tracking was defined based on consensus acceptance in all 4 criteria. A second list of metrics identified for future study was defined based on acceptance in all criteria except the fourth feasibility criterion.
For all statistical analyses, SAS version 9.4 (SAS Institute, Cary, North Carolina) was used. The Duke University Institutional Review Board approved this activity as exempt.
RESULTS
Figure 1 details the process of literature and metric review based on prespecified exclusion criteria. The initial electronic survey included 90 metrics for rating by the panel. Round 1 survey for-mat separated the numerator and denominator metrics in the utilization category (eg, days of therapy numerator was rated separately from the patient days denominator; Supplementary Table 1). All 19 panel members participated in the round 1
electronic survey. Round 1 survey ratings resulted in consensus to retain 14 metrics; the remaining 76 metrics were considered equivocal based on the a priori criteria and no metrics were removed. Eighteen panel members (95%) participated in the Web-based conferences. The discussions resulted in consensus to remove all 18 metrics in the financial outcomes category. This category was generally rated negatively during round 1, and the panel deemed these metrics as not relevant for patient safety (criterion 1). The panel removed an additional 30 metrics deemed to be difficult to interpret, unlikely to be meaningful for ASP decision making, better represented by other metrics under consideration, or too infeasible to capture and interpret. An additional 8 metrics were added for rating in round 2. Eight metrics were refined for the subsequent rating survey including defining utilization metrics as specific numerator/denominator pairings.
The round 2 electronic survey included 41 metrics for the panel to reevaluate: 5 clinical outcomes, 6 unintended con-sequences, 10 utilization measures, and 20 process measures
Table 1. Structured Taskforce of Experts Working at Reliable Standards for Stewardship (STEWARDS) Panel
Name Title(s) Affiliation(s)a Location
Deverick Anderson, MD, MPH
Adult Infectious Diseases Physician Duke University Medical Center Durham, North Carolina
Shawn Binkley, PharmD, BS
Antimicrobial Stewardship Pharmacist Hospital of the University of Pennsylvania Philadelphia, Pennsylvania
Michael Calderwood, MD
Adult Infectious Diseases Physician Brigham and Women’s Hospital Boston, Massachusetts
Sara E. Cosgrove, MD, MS
Adult Infectious Diseases Physician Johns Hopkins Medical Institutions Baltimore, Maryland
Elizabeth Dodds Ashley, PharmD
Antimicrobial Stewardship Liaison Pharmacist Duke Antimicrobial Stewardship Outreach Network Durham, North Carolina
Jeffrey Gerber, MD, PhD
Pediatric Infectious Diseases Physician Children’s Hospital of Philadelphia Philadelphia, Pennsylvania
Christopher J. Graber, MD
Adult Infectious Diseases Physician VA Greater Los Angeles Los Angeles, California
Keith Hamilton, MD Adult Infectious Diseases Physician Hospital of the University of Pennsylvania Philadelphia, Pennsylvania
Adam L. Hersh, MD, PhD
Pediatric Infectious Diseases Physician University of Utah Salt Lake City, Utah
Lauri Hicks, DO Director, Office of Antibiotic Stewardship Adult Infectious Diseases Physician
Centers for Disease Control and Prevention Atlanta, Georgia
Kevin Hsueh, MD Adult Infectious Diseases Physician Washington University School of Medicine St Louis, Missouri
David W. Kubiak, PharmD
Adult Antimicrobial Stewardship Pharmacist Brigham and Women’s Hospital Boston, Massachusetts
Kristi Kuper, PharmD, BCPS
Senior Clinical ManagerAdult Infectious Diseases Pharmacist
Vizient, Inc Houston, Texas
Rebekah Moehring, MD, MPH
Adult Infectious Diseases Physician Duke University Medical CenterDuke Antimicrobial Stewardship Outreach NetworkDurham VA Medical Center
Durham, North Carolina
Melinda M. Neuhauser, PharmD, MPH
National Pharmacy Benefits Management Clinical Pharmacy Program Manager, Infectious Diseases
Department of Veterans Affairs Pharmacy Benefits Management Services
Hines, Illinois
Christina Sarubbi, PharmD
Antimicrobial Stewardship Pharmacist Duke University Medical Center Durham, North Carolina
David Schwartz, MD Adult Infectious Diseases Physician John H. Stroger, Jr Hospital of Cook County Chicago, Illinois
Arjun Srinivasan, MD Associate Director for Healthcare-Associated Infection Prevention Programs
Centers for Disease Control and Prevention Atlanta, Georgia
Robert A. Weinstein, MD
Adult Infectious Diseases PhysicianC. Anderson Hedberg, MD Professor of Medicine
Rush University Medical Center Chicago, Illinois
aAffiliation at the time of the STEWARDS panel participation.
MEASUREMENT TOOLS FOR ANTIMICROBIAL STEWARDSHIP PROGRAMS
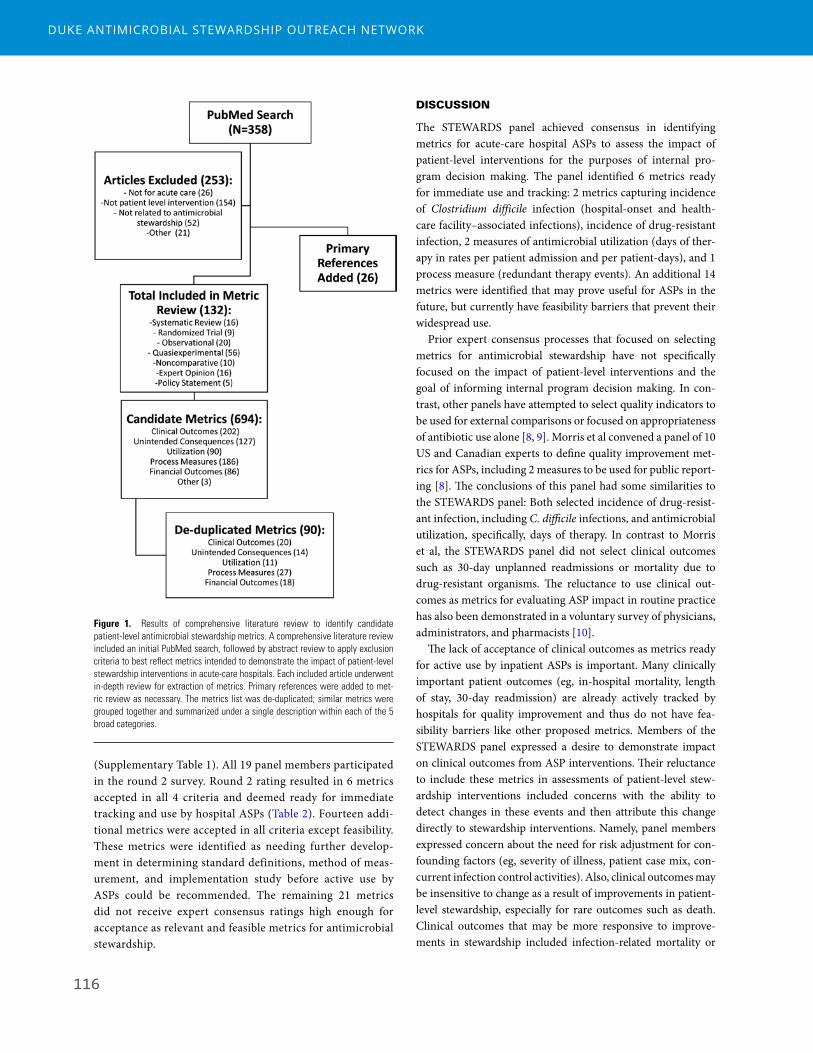
116380 • CID 2017:64 (1 February) • HEALTHCARE EPIDEMIOLOGY
(Supplementary Table 1). All 19 panel members participated in the round 2 survey. Round 2 rating resulted in 6 metrics accepted in all 4 criteria and deemed ready for immediate tracking and use by hospital ASPs (Table 2). Fourteen addi-tional metrics were accepted in all criteria except feasibility. These metrics were identified as needing further develop-ment in determining standard definitions, method of meas-urement, and implementation study before active use by ASPs could be recommended. The remaining 21 metrics did not receive expert consensus ratings high enough for acceptance as relevant and feasible metrics for antimicrobial stewardship.
DISCUSSION
The STEWARDS panel achieved consensus in identifying metrics for acute-care hospital ASPs to assess the impact of patient-level interventions for the purposes of internal pro-gram decision making. The panel identified 6 metrics ready for immediate use and tracking: 2 metrics capturing incidence of Clostridium difficile infection (hospital-onset and health-care facility–associated infections), incidence of drug-resistant infection, 2 measures of antimicrobial utilization (days of ther-apy in rates per patient admission and per patient-days), and 1 process measure (redundant therapy events). An additional 14 metrics were identified that may prove useful for ASPs in the future, but currently have feasibility barriers that prevent their widespread use.
Prior expert consensus processes that focused on selecting metrics for antimicrobial stewardship have not specifically focused on the impact of patient-level interventions and the goal of informing internal program decision making. In con-trast, other panels have attempted to select quality indicators to be used for external comparisons or focused on appropriateness of antibiotic use alone [8, 9]. Morris et al convened a panel of 10 US and Canadian experts to define quality improvement met-rics for ASPs, including 2 measures to be used for public report-ing [8]. The conclusions of this panel had some similarities to the STEWARDS panel: Both selected incidence of drug-resist-ant infection, including C. difficile infections, and antimicrobial utilization, specifically, days of therapy. In contrast to Morris et al, the STEWARDS panel did not select clinical outcomes such as 30-day unplanned readmissions or mortality due to drug-resistant organisms. The reluctance to use clinical out-comes as metrics for evaluating ASP impact in routine practice has also been demonstrated in a voluntary survey of physicians, administrators, and pharmacists [10].
The lack of acceptance of clinical outcomes as metrics ready for active use by inpatient ASPs is important. Many clinically important patient outcomes (eg, in-hospital mortality, length of stay, 30-day readmission) are already actively tracked by hospitals for quality improvement and thus do not have fea-sibility barriers like other proposed metrics. Members of the STEWARDS panel expressed a desire to demonstrate impact on clinical outcomes from ASP interventions. Their reluctance to include these metrics in assessments of patient-level stew-ardship interventions included concerns with the ability to detect changes in these events and then attribute this change directly to stewardship interventions. Namely, panel members expressed concern about the need for risk adjustment for con-founding factors (eg, severity of illness, patient case mix, con-current infection control activities). Also, clinical outcomes may be insensitive to change as a result of improvements in patient-level stewardship, especially for rare outcomes such as death. Clinical outcomes that may be more responsive to improve-ments in stewardship included infection-related mortality or
Figure 1. Results of comprehensive literature review to identify candidate patient-level antimicrobial stewardship metrics. A comprehensive literature review included an initial PubMed search, followed by abstract review to apply exclusion criteria to best reflect metrics intended to demonstrate the impact of patient-level stewardship interventions in acute-care hospitals. Each included article underwent in-depth review for extraction of metrics. Primary references were added to met-ric review as necessary. The metrics list was de-duplicated; similar metrics were grouped together and summarized under a single description within each of the 5 broad categories.
readmission related to infectious diagnoses. These metrics, however, were not accepted by the STEWARDS panel in the fea-sibility criterion due to lack of standardized definitions and the need for more experience in measurement utilizing electronic health records. Furthermore, infection-related events are a sub-set of total deaths and readmissions, which would make it even more difficult to detect a change. Thus, the need for complicated analyses, large sample size, and therefore limitations in translat-ing these data into actionable conclusions hampers the ability to adopt these metrics into routine surveillance practice for ASPs. Some STEWARDS panel members suggested that clinical out-comes may be more useful to prove “no harm” came from ASP interventions that aim to shorten duration, provide more nar-row therapy, or avoid intravenous therapy. Clinical outcomes could be utilized as a complementary metric to reassure provid-ers that interventions did not cause unintended negative clinical consequences. Although the ultimate goal for ASPs is to posi-tively impact clinical and patient safety outcomes, members of STEWARDS acknowledged that perhaps a more practical place for individual ASPs to demonstrate impact is through measures of utilization and process.
Many metrics evaluated by the panel in the utilization and process measure category were rated in the neutral range due to experts’ limited experience with the metrics or the lack of a clear, previously validated, standard definition. Furthermore, several
DUKE ANTIMICROBIAL STEWARDSHIP OUTREACH NETWORK

117HEALTHCARE EPIDEMIOLOGY • CID 2017:64 (1 February) • 381
readmission related to infectious diagnoses. These metrics, however, were not accepted by the STEWARDS panel in the fea-sibility criterion due to lack of standardized definitions and the need for more experience in measurement utilizing electronic health records. Furthermore, infection-related events are a sub-set of total deaths and readmissions, which would make it even more difficult to detect a change. Thus, the need for complicated analyses, large sample size, and therefore limitations in translat-ing these data into actionable conclusions hampers the ability to adopt these metrics into routine surveillance practice for ASPs. Some STEWARDS panel members suggested that clinical out-comes may be more useful to prove “no harm” came from ASP interventions that aim to shorten duration, provide more nar-row therapy, or avoid intravenous therapy. Clinical outcomes could be utilized as a complementary metric to reassure provid-ers that interventions did not cause unintended negative clinical consequences. Although the ultimate goal for ASPs is to posi-tively impact clinical and patient safety outcomes, members of STEWARDS acknowledged that perhaps a more practical place for individual ASPs to demonstrate impact is through measures of utilization and process.
Many metrics evaluated by the panel in the utilization and process measure category were rated in the neutral range due to experts’ limited experience with the metrics or the lack of a clear, previously validated, standard definition. Furthermore, several
process measures did not reach acceptance in the feasibility criterion due to perceived barriers in capturing the required data elements from electronic health records. For example, de-escalation from broad to narrow antimicrobial therapy is an accepted, basic principle of antimicrobial stewardship that should be responsive to patient-level interventions. This metric was accepted in all criteria except the feasibility criterion due to the state of preliminary work in defining spectrum scores [11] and de-escalation events [12] from electronic data, the need for validation of these definitions in other study populations, and the need for more experience in implementing these metrics into routine practice. As another example, the panel achieved consensus that a days of therapy numerator over dominators of either patient-days or admissions were useful to capture in hospitals with electronic health records; however, several mem-bers voiced knowledge that many facilities lack the information technology resources to capture these data. The metric used in the National Healthcare Safety Network Antibiotic Use mod-ule includes days of therapy over days present, which several STEWARDS members deemed important given its adoption by the CDC for the US national surveillance system [13]. This metric was rated with uncertain feasibility due to experts’ expe-riences in the complexity of capturing patient movement data. The traditional denominator metric of patient-days, which is currently used for infection prevention surveillance, considers
Table 2. Structured Taskforce of Experts Working at Reliable Standards for Stewardship (STEWARDS) Panel-Recommended Metrics for Assessing the Impact of Patient-Level Antimicrobial Stewardship Interventions
Group 1: Ready for Immediate Use and TrackingGroup 2: Identified as Useful but Questionable Feasibility: Recommended for
Future Study
Clinical outcomes None • Readmission: related to infectious diagnoses
Unintended consequences
• Clostridium difficile infection incidence: healthcare facility associated (includes NHSN LabID-defined community-onset, healthcare facility–associated and hospital-onset cases)
• Clostridium difficile infection incidence: hospital onset (includes NHSN LabID-defined hospital-onset cases)
• Drug-resistant infection: rate of resistant pathogen(s) isolated from clinical cultures (excludes nares and perirectal swabs used for active surveillance).
• Adverse drug events/toxicities
Utilization • Days of therapy/admission• Days of therapy/patient-days
• Days of therapy/days present• Total duration/admission• Total duration/antimicrobial admission
Process measures • Redundant therapy events • Antimicrobial error (wrong drug, dose, route or frequency occurring during ordering or monitoring)
• Appropriateness/inappropriateness per institutional guideline/expert opinion• Adherence to guidelines/formulary/protocol/bundle• Appropriate cultures performed per institutional guideline/expert opinion• Excess drug use (antimicrobial use that could have been avoided based on clin-
ical guidelines, shorter recommended duration, stopping therapy due to earlier availability of culture results, etc)
• De-escalation performed (number of occurrences)• Culture collected prior to antimicrobial being administered• Time to appropriate therapy• Proportion of patients who received initial antibiotic coverage for a targeted
nosocomial pathogen who also had positive clinical cultures (blood, respira-tory) for that target pathogen (eg, methicillin-resistant Staphylococcus aureus, Pseudomonas aeruginosa)
Group 1 metrics were accepted in 4 of 4 criteria. Group 2 metrics were accepted in 3 of 4 criteria; only the feasibility criterion was uncertain among expert panel members.
Abbreviation: NHSN, National Healthcare Safety Network.
MEASUREMENT TOOLS FOR ANTIMICROBIAL STEWARDSHIP PROGRAMS

118382 • CID 2017:64 (1 February) • HEALTHCARE EPIDEMIOLOGY
the count of patients housed on a unit measured at a certain time each day (eg, midnight census) as days at risk [14]. In con-trast, days present counts the number of patients housed on a unit for any portion of a calendar day as days at risk [13]. Thus, the days present metric requires detailed information on patient movements throughout the calendar day. This feasibility bar-rier is slowly being addressed as more electronic health record vendors move toward adding antibiotic use reporting to their products. This and the other metrics that received an uncertain feasibility rating should be evaluated in future studies focused on measurement from electronic data (Table 2, group 2).
This study has limitations. First, the STEWARDS panel con-sisted of US physicians and pharmacists with infectious disease training, particularly those with antimicrobial stewardship expertise, public health interest, and healthcare epidemiology and antimicrobial stewardship research experience. Thus, the experts’ opinions and self-reported experiences may not reflect those of stewards working in other practice settings and sys-tems. Second, the panel process did not include a face-to-face meeting, but instead involved 2 Web-based teleconferences, each with approximately half of the panel members in attend-ance due to scheduling limitations. This logistical barrier may have led to a reduction in direct sharing of ideas, but it did not result in failure to meet consensus on the final list of selected metrics. Finally, an important limitation in the output of this study is a continued generality or ambiguity in descriptions of some metrics selected in the final consensus list. For example, the STEWARDS panel did not come to a final recommendation for which measures of incidence of drug-resistant infections should be tracked or how they should be specifically defined and calculated. Based on knowledge of the many possible ways that drug-resistant events can be measured [15, 16], we believe that specific recommendations relevant to ASPs will need ded-icated consensus building work in the future. Similar future work in standardized definition development will be required for multiple metrics with feasibility barriers identified during this process (Table 2, group 2).
CONCLUSIONS
The STEWARDS panel developed a list of 6 recommended met-rics ready for active use and tracking for acute-care ASPs seeking to assess the impact of patient-level interventions. The selected measures align well with national priorities in improving and measuring antibiotic use and preventing drug resistance [17]. Measurement is a required task in both The Joint Commission antibiotic stewardship accreditation standard and the Centers for Medicare and Medicaid Services proposed antibiotic stew-ardship condition of participation [18, 19]. The metrics identi-fied by this panel form a core set of measures that ASPs can start using immediately to both meet the measurement requirements and, more importantly, assess the impact of their efforts.
In addition, the panel identified 14 metrics for future study. Future work should focus on standard definition development and overcoming feasibility barriers for metrics that are based on electronic data elements. To this end, The Duke Antimicrobial Stewardship Outreach Network is partnering with CDC and the CDC Foundation to assess the most promising of these additional metrics. Lessons learned from these efforts will help guide the implementation of the next generation of antibiotic stewardship metrics.
Supplementary DataSupplementary materials are available at Clinical Infectious Diseases online. Consisting of data provided by the author to benefit the reader, the posted materials are not copyedited and are the sole responsibility of the author, so questions or comments should be addressed to the author.
NotesAcknowledgments. The authors thank Beverly Murphy, Duke Medical
Center Library and Archives Librarian, for her assistance in guiding the lit-erature search strategy;
Elizabeth Hermsen, Merck and Co., Inc., for her input on criteria devel-opment; and
Loria Pollack, CDC, for her assistance in study design and criteria development.
Disclaimer. The views expressed in this article are those of the authors and do not necessarily represent the position or policy of the CDC, US Department of Veterans Affairs, or the US government.
Financial support. This work was supported by the CDC Foundation; the Agency for Healthcare Research and Quality (grant number K08 HS023866 to R. W. M.); and the National Institutes of Health (grant num-ber K23 AI095357 to D. J. A.). The source of this information is the Patient Tools for Antibiotic Stewardship Programs, a joint project made possible by a partnership between the CDC Foundation and Merck and Co., Inc.
Multiple STEWARDS panel members were supported by the CDC Epicenters Program grants to Duke University (Durham, North Carolina), Washington University (St Louis, Missouri), Rush University Medical Center (Chicago, Illinois), University of Pennsylvania (Philadelphia, Pennsylvania), and Harvard University (Boston, Massachusetts).
Potential conflicts of interest. Authors certifies no potential conflicts of interest. The authors have submitted the ICMJE Form for Disclosure of Potential Conflicts of Interest. Conflicts that the editors consider relevant to the content of the manuscript have been disclosed.
References1. Barlam TF, Cosgrove SE, Abbo LM, et al. Implementing an antibiotic stewardship
program: guidelines by the Infectious Diseases Society of America and the Society for Healthcare Epidemiology of America. Clin Infect Dis 2016; 62:e51–77.
2. Davey P, Brown E, Charani E, et al. Interventions to improve antibiotic prescribing practices for hospital inpatients. Cochrane Database Syst Rev 2013; CD003543.
3. Policy statement on antimicrobial stewardship by the Society for Healthcare Epidemiology of America (SHEA), the Infectious Diseases Society of America (IDSA), and the Pediatric Infectious Diseases Society (PIDS). Infect Control Hosp Epidemiol 2012; 33:322–7.
4. McGowan JE. Antimicrobial stewardship—the state of the art in 2011: focus on outcome and methods. Infect Control Hosp Epidemiol 2012; 33:331–7.
5. Fitch K, Bernstein SJ, Aguilar MD, et al. The RAND/UCLA appropriateness method user’s manual. Santa Monica, CA: RAND Corporation, 2001.
6. Dodds Ashley ES, Kaye KS, DePestel DD, Hermsen ED. Antimicrobial steward-ship: philosophy versus practice. Clin Infect Dis 2014; 59:S112–21.
7. Harris PA, Taylor R, Thielke R, Payne J, Gonzalez N, Conde JG. Research elec-tronic data capture (REDCap)—a metadata-driven methodology and work-flow process for providing translational research informatics support. J Biomed Inform 2009; 42:377–81.
8. Morris AM, Brener S, Dresser L, et al. Use of a structured panel process to define quality metrics for antimicrobial stewardship programs. Infect Control Hosp Epidemiol 2012; 33:500–6.
DUKE ANTIMICROBIAL STEWARDSHIP OUTREACH NETWORK
119HEALTHCARE EPIDEMIOLOGY • CID 2017:64 (1 February) • 383
9. van den Bosch CM, Geerlings SE, Natsch S, Prins JM, Hulscher ME. Quality indi-cators to measure appropriate antibiotic use in hospitalized adults. Clin Infect Dis 2015; 60:281–91.
10. Bumpass JB, McDaneld PM, DePestel DD, et al. Outcomes and metrics for anti-microbial stewardship: survey of physicians and pharmacists. Clin Infect Dis 2014; 59:S108–11.
11. Madaras-Kelly K, Jones M, Remington R, Hill N, Huttner B, Samore M. Development of an antibiotic spectrum score based on Veterans Affairs culture and susceptibility data for the purpose of measuring antibiotic de-escalation: a modified Delphi approach. Infect Control Hosp Epidemiol 2014; 35:1103–13.
12. Madaras-Kelly K, Jones M, Remington R, et al. Antimicrobial de-escalation of treatment for healthcare-associated pneumonia within the Veterans Healthcare Administration. J Antimicrob Chemother 2016; 71:539–46.
13. Centers for Disease Control and Prevention. National Healthcare Safety Network: antimicrobial use and resistance (AUR) options. Available at: http://www.cdc.gov/nhsn/acute-care-hospital/aur/index.html. Accessed 31 March 2016.
14. Centers for Disease Control and Prevention. National Healthcare Safety Network: MDRO module. Available at: http://www.cdc.gov/nhsn/PDFs/pscManual/12psc-MDRO_CDADcurrent.pdf. Accessed 31 March 2016.
15. Magiorakos AP, Srinivasan A, Carey RB, et al. Multidrug-resistant, extensively drug-resistant and pandrug-resistant bacteria: an international expert proposal for interim standard definitions for acquired resistance. Clin Microbiol Infect 2012; 18:268–81.
16. Cohen AL, Calfee D, Fridkin SK, et al; Society for Healthcare Epidemiology of America and the Healthcare Infection Control Practices Advisory Committee. Recommendations for metrics for multidrug-resistant organisms in healthcare set-tings: SHEA/HICPAC position paper. Infect Control Hosp Epidemiol 2008; 29:901–13.
17. United States Department of Health and Human Services. National action plan for combating antibiotic resistant bacteria (CARB report). Available at: http://www.hhs.gov/ash/advisory-committees/paccarb/reports-and-recommendations/index.html#. Accessed 26 August 2016.
18. The Joint Commission. Antimicrobial stewardship standard. Available at: https://www.jointcommission.org/prepublication_standards_antimicrobial_steward-ship_standard/. Accessed 26 August 2016.
19. Centers for Medicare and Medicaid Programs. Hospital and critical access hospital (CAH) changes to promote innovation, flexibility, and imporvement in patient care: proposed rule. Available at: https://federalregister.gov/a/2016–13925. Accessed 26 August 2016.
MEASUREMENT TOOLS FOR ANTIMICROBIAL STEWARDSHIP PROGRAMS

120
CDUKE ANTIMICROBIAL STEWARDSHIP OUTREACH NETWORK
Measurement Tools for Antimicrobial Stewardship Programs
CAppendix C: Sample Reports used during Pilot Project

122
DUKE ANTIMICROBIAL STEWARDSHIP OUTREACH NETWORK
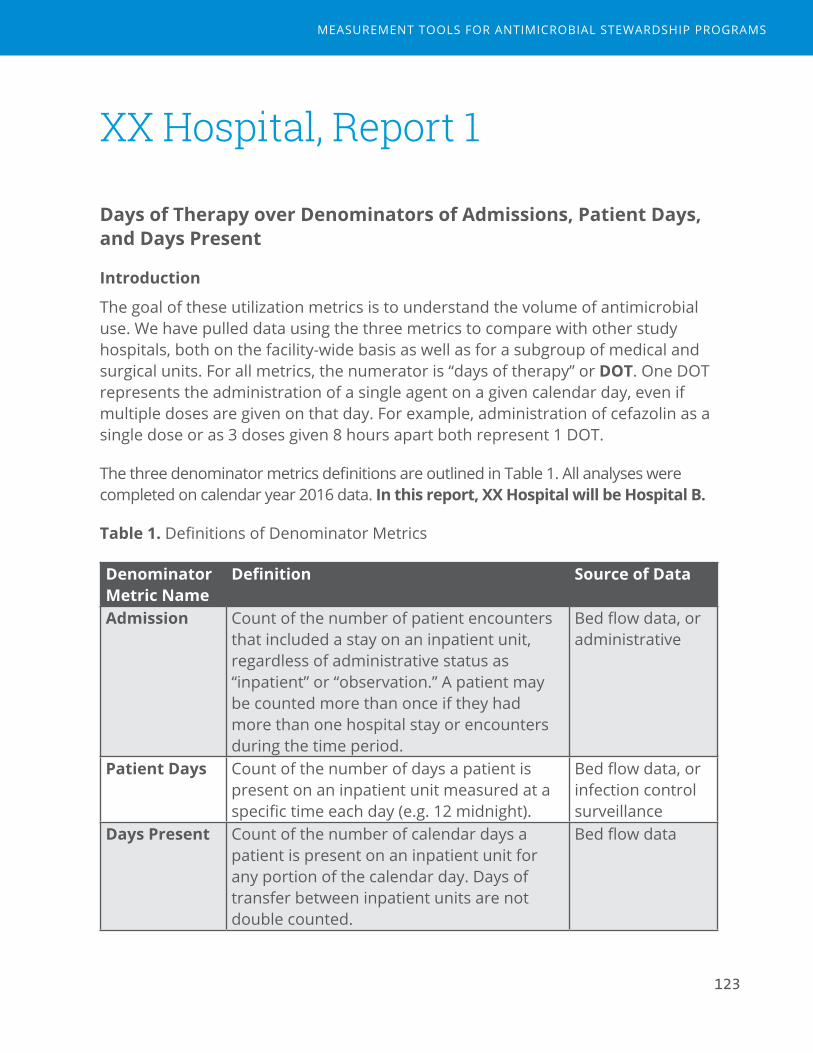
123
XX Hospital, Report 1
Days of Therapy over Denominators of Admissions, Patient Days, and Days Present
Introduction
The goal of these utilization metrics is to understand the volume of antimicrobial use. We have pulled data using the three metrics to compare with other study hospitals, both on the facility-wide basis as well as for a subgroup of medical and surgical units. For all metrics, the numerator is “days of therapy” or DOT. One DOT represents the administration of a single agent on a given calendar day, even if multiple doses are given on that day. For example, administration of cefazolin as a single dose or as 3 doses given 8 hours apart both represent 1 DOT.
The three denominator metrics definitions are outlined in Table 1. All analyses were completed on calendar year 2016 data. In this report, XX Hospital will be Hospital B.
Table 1. Definitions of Denominator Metrics
Denominator Metric Name
Definition Source of Data
Admission Count of the number of patient encounters that included a stay on an inpatient unit, regardless of administrative status as “inpatient” or “observation.” A patient may be counted more than once if they had more than one hospital stay or encounters during the time period.
Bed flow data, or administrative
Patient Days Count of the number of days a patient is present on an inpatient unit measured at a specific time each day (e.g. 12 midnight).
Bed flow data, or infection control surveillance
Days Present Count of the number of calendar days a patient is present on an inpatient unit for any portion of the calendar day. Days of transfer between inpatient units are not double counted.
Bed flow data
MEASUREMENT TOOLS FOR ANTIMICROBIAL STEWARDSHIP PROGRAMS

124
Table 2. Facility-Wide Denominator Comparison by Hospital, Calendar Year 2016
HospitalA B C D E
Admissions per 1000 48.60 20.08 18.74 11.28 15.91Patient days per 1000 290.00 77.24 68.46 39.99 65.87Days present per 1000 340.51 98.23 88.12 51.74 83.51Average Length of Stay (days)* 7.0 4.9 4.7 4.6 5.3
*Average length of stay calculated as days present/admissions.
Figure 1A-C. Overall Antimicrobial Rates, Facility-Wide by Hospital and Agent Category
0
200
400
600
800
1000
1200
A B C D E
DOT/10
0PA
TIEN
TDAYS
HOSPITAL
01002003004005006007008009001000
A B C D E
DOT/10
00DAYSPR
ESEN
T
HOSPITAL
0
1000
2000
3000
4000
5000
6000
7000
A B C D E
DOT/10
00ADMISSIONS
HOSPITAL
Miscellaneous Antiviral Antifungal Antibacterial
DUKE ANTIMICROBIAL STEWARDSHIP OUTREACH NETWORK

125
Table 2. Overall Antimicrobials for XX Hospital by Agent Category, Facility-Wide
DOT Admissions per 1000
DOT/1000 admissions
Patient days per 1000
DOT/1000 patient days
Days present per 1000
DOT/1000 days present
All agents 55,504 20.08 2764.14 77.24 718.6 98.23 565.07
Bacterial 50,068 20.08 2493.43 77.24 648.22 98.23 509.73
Antiviral 2,740 20.08 136.45 77.24 35.47 98.23 27.9
Antifungal 1,829 20.08 91.09 77.24 23.68 98.23 18.62
Miscellaneous 867 20.08 43.18 77.24 11.22 98.23 8.83
Figure 1D. Comparison of Facility-Wide Utilization Rates using Admissions, Patient Days, and Days Present Denominators
A B C D EDOT/1000admissions 6416.40 2764.14 3162.06 3488.92 3356.82
DOT/1000patientdays 1,075.31 718.6 865.57 984.02 810.76
DOT/1000dayspresent 915.8 565.07 672.43 760.6 639.52
%Relative Difference 15% 21% 22% 23% 21%
0.00
1000.00
2000.00
3000.00
4000.00
5000.00
6000.00
7000.00
Interpretation:
■ Facility wide rates varied in a similar pattern for the five hospitals, regardless of which denominator was used. However, lengths of stay made a large difference in the degree to which utilization rates varied among hospitals.
■ Both patient days and days present account for the individual days of a patient stay, whereas admissions denominators do not. Hospitals with longer lengths of stay appear to have higher rates when admissions is used.
MEASUREMENT TOOLS FOR ANTIMICROBIAL STEWARDSHIP PROGRAMS

126
■ Days present denominators are larger than patient day denominators, resulting in lower utilization rate estimates.
■ The degree to which an individual hospital’s rates are lower when moving from patient days to days present denominators depends on lengths of stay. Hospitals with shorter average lengths of stay had larger % relative differences in antimicrobial use rate estimates when comparing patient days to days present.
Figure 2. Anti-MRSA Agents, Facility-Wide by Hospital and Agent
020406080100120140160
A B C D E
DOT/10
00PATIENTDAYS
HOSPITAL
0
20
40
60
80
100
120
140
A B C D E
DOT/10
00DAYSPR
ESEN
T
HOSPITAL
0
200
400
600
800
1000
A B C D E
DOT/10
00ADMISSIONS
HOSPITAL
Daptomycin Linezolid Ceftaroline
Oritavancin Tedizolid Dalbavancin
Vancomycin(IV)
DUKE ANTIMICROBIAL STEWARDSHIP OUTREACH NETWORK

127
Table 3. Anti-MRSA Agents for XX Hospital, Facility-Wide
DOT Admissions per 1000
DOT/1000 admissions
Patient days per
1000
DOT/1000 patient
days
Days present per 1000
DOT/1000 days
presentAnti-MRSA agents
7,412 20.08 369.12 77.24 95.96 98.23 75.46
Vancomycin (Intravenous)
6,705 20.08 333.91 77.24 86.81 98.23 68.26
Daptomycin 344 20.08 17.13 77.24 4.45 98.23 3.5
Linezolid 206 20.08 10.26 77.24 2.67 98.23 2.1
Ceftaroline 157 20.08 7.82 77.24 2.03 98.23 1.6
Oritavancin 0 0 0 0 0 0 0
Tedizolid 0 0 0 0 0 0 0
Dalbavancin 0 0 0 0 0 0 0
Interpretation:
■ Facility-wide utilization rates of anti-MRSA agents varied among hospitals in a similar pattern as overall use. Alternative, non-vancomycin agent use also varied among hospitals.
■ Similar differences in rate estimates based on denominator selected were seen for anti-MRSA agents and overall antimicrobial agent use.
Table 4. Medical/Surgical Wards Only, Denominator Comparison by Hospital (All Sites), Calendar Year 2016.
HospitalA B C D E
N units Included: 12 4 5 3 6Medical 6 3 2 1 4Surgical 3 1 1 1 1
Medical/Surgical 3 0 2 1 1Admissions 22.92 9.41 15.01 7.49 11.03Patient days 108.7 35.78 47.34 23.94 48.24Days present 132.44 45.77 61.48 31.92 59.72Average LOS 5.8 4.9 4.3 4.3 5.4
MEASUREMENT TOOLS FOR ANTIMICROBIAL STEWARDSHIP PROGRAMS
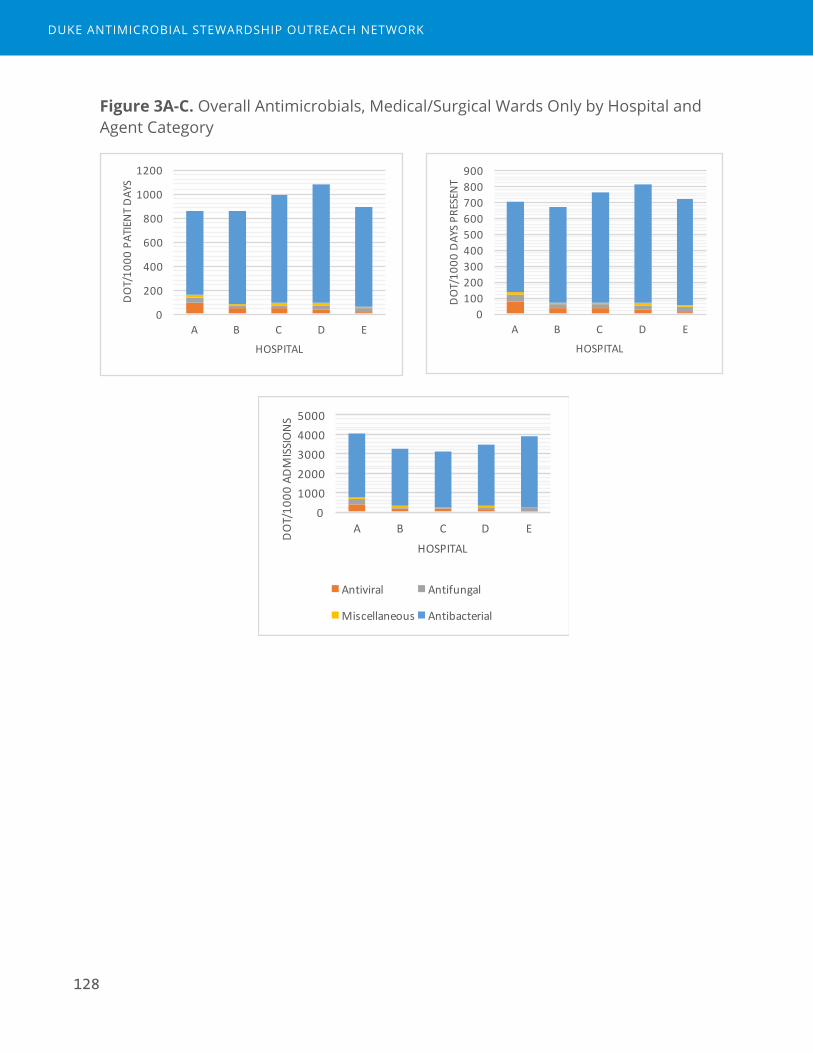
128
Figure 3A-C. Overall Antimicrobials, Medical/Surgical Wards Only by Hospital and Agent Category
0
200
400
600
800
1000
1200
A B C D E
DOT/10
00PATIENTDAYS
HOSPITAL
0100200300400500600700800900
A B C D E
DOT/10
00DAYSPR
ESEN
T
HOSPITAL
010002000300040005000
A B C D E
DOT/10
00ADMISSIONS
HOSPITAL
Antiviral Antifungal
Miscellaneous Antibacterial
DUKE ANTIMICROBIAL STEWARDSHIP OUTREACH NETWORK

129
Figure 3D. Comparison of Medical/Surgical Ward Anti-MRSA Agent Utilization Rates using Admissions, Patient Days, and Days Present Denominators
A B C D EDOT/1000admissions 4,051.88 3,263.66 3116.59 3440.99 3,895.92
DOT/1000patientdays 854.37 858.45 988.09 1076.61 890.81
DOT/1000dayspresent 701.24 670.97 760.87 807.42 719.61
%Relative Difference 18% 22% 23% 25% 19%
0.00500.00
1,000.001,500.002,000.002,500.003,000.003,500.004,000.004,500.00
Interpretation:
■ Data limited to medical and surgical wards changed the distribution of rates among hospitals compared with facility-wide estimates. This is likely related to case mix differences among hospitals.
■ The relative differences in rates calculated with patient days and days present were similar to the effects seen in facility-wide estimates and were related to lengths of stay.
MEASUREMENT TOOLS FOR ANTIMICROBIAL STEWARDSHIP PROGRAMS

130
DUKE ANTIMICROBIAL STEWARDSHIP OUTREACH NETWORK

131
XX Hospital, Report 4
Clostridium difficile
Introduction
Prevention of C. difficile infection is a top priority for Antimicrobial Stewardship Programs, due to the clear link between antibiotic exposures, healthcare exposures, and risks for subsequent C. difficile infection. Implementation of Antimicrobial Stewardship Programs (ASPs) can reduce rates of C. difficile by approximately 50%. Tracking the incidence of C. difficile can help target ASP initiatives to certain areas or patient populations as well assess the impact of C. difficile focused efforts.
This analysis utilized the NHSN definition of C. difficile infection (CDI) events called “LabID” which uses admission and discharge dates as well as the date of positive C. difficile test result to categorize events into three epidemiologic categories: hospital onset (HO), community-onset healthcare facility associated (CO-HCFA), and community onset (CO). This definition removes events that are duplicate tests or recurrent events in order to calculate an incidence (“new infection”) rate per 10,000 patient days or admissions.
The time period evaluated was calendar year 2015-2016. Behavioral health and rehabilitation units were removed from facility-wide comparisons, but included in unit level analyses (Tables 3 and 4). All analyses excluded baby units (e.g. nurseries). XX Hospital is Hospital B.
Table 1. Key Definitions
Term DefinitionIncident CDI LabID Event
Any CDI LabID Event from a specimen obtained > 56 days (8 weeks) after the most recent CDI LabID Event (or with no previous CDI LabID Event documented) for that patient. Note: the date of first specimen collection for an individual patient is considered day 1.
MEASUREMENT TOOLS FOR ANTIMICROBIAL STEWARDSHIP PROGRAMS
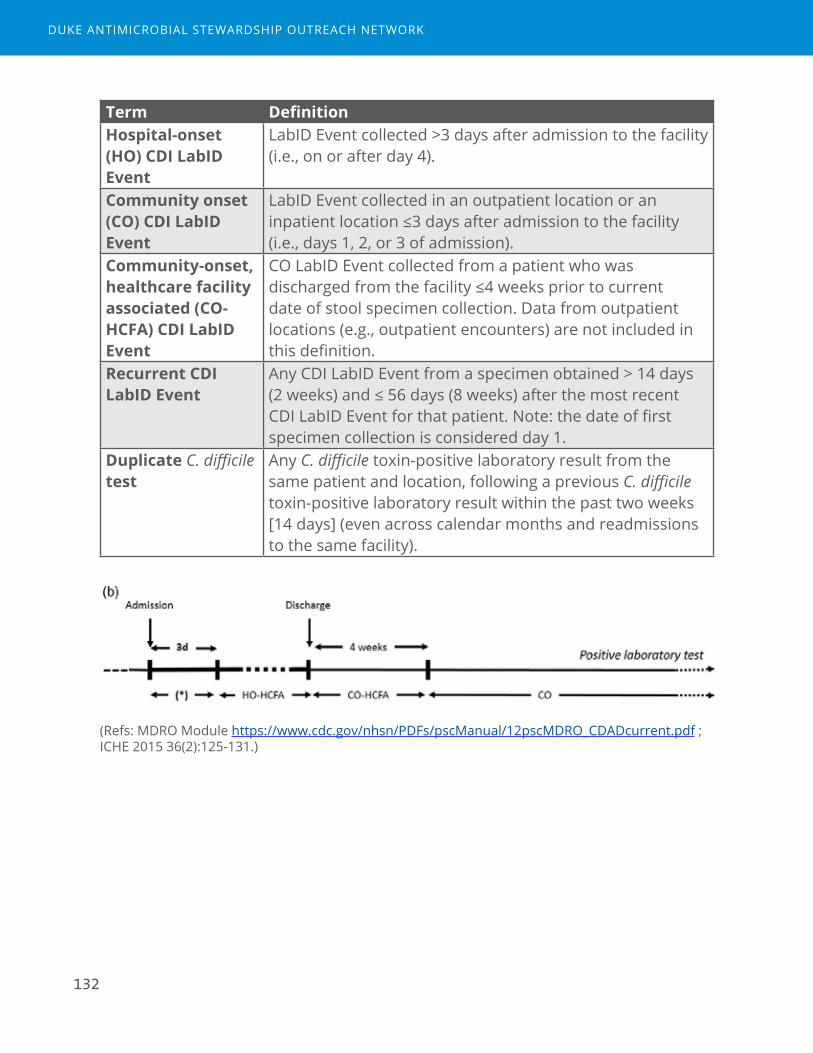
132
Term DefinitionHospital-onset (HO) CDI LabID Event
LabID Event collected >3 days after admission to the facility (i.e., on or after day 4).
Community onset (CO) CDI LabID Event
LabID Event collected in an outpatient location or an inpatient location ≤3 days after admission to the facility (i.e., days 1, 2, or 3 of admission).
Community-onset, healthcare facility associated (CO-HCFA) CDI LabID Event
CO LabID Event collected from a patient who was discharged from the facility ≤4 weeks prior to current date of stool specimen collection. Data from outpatient locations (e.g., outpatient encounters) are not included in this definition.
Recurrent CDI LabID Event
Any CDI LabID Event from a specimen obtained > 14 days (2 weeks) and ≤ 56 days (8 weeks) after the most recent CDI LabID Event for that patient. Note: the date of first specimen collection is considered day 1.
Duplicate C. difficile test
Any C. difficile toxin-positive laboratory result from the same patient and location, following a previous C. difficile toxin-positive laboratory result within the past two weeks [14 days] (even across calendar months and readmissions to the same facility).
(Refs: MDRO Module https://www.cdc.gov/nhsn/PDFs/pscManual/12pscMDRO_CDADcurrent.pdf ; ICHE 2015 36(2):125-131.)
DUKE ANTIMICROBIAL STEWARDSHIP OUTREACH NETWORK

133
Table 1. Incident HO CDI LabID Event Rates and SIRs for Calendar Year 2016, All Hospitals, Facility-wide
Hospital HO events Patient days HO CDI Incidence rate
SIR (95% CI) *
A 301 310861 9.68 1.047 (0.933, 1.170)B 58 63197 9.18 1.02 (0.738, 1.381)**C 10 63079 1.61 0.257 (0.130, 0.457)D 10 36862 2.67 0.44 (0.224, 0.785)E 36 64221 5.61 0.737 (0.521, 1.014)
*SIR risk adjustment factors: teaching status, CO prevalence, test type (e.g. PCR), # ICU beds, Oncology hospital, facility bed size, surveillance in outpatient locations (ED, observation unit); **Preliminary SIR based on 9 months of data.
Table 2. Incident LabID Events by Infection Onset Type, All Hospitals, Facility-wide, 2016
Hospital HO % (N)
CO-HCFA % (N)
CO % (N)
Total
A 47% (301) 7% (45) 46% (297) 643B 29% (58) 11% (21) 60% (119) 198C 12% (10) 14% (11) 74% (60) 81D 22% (10) 17% (8) 61% (28) 46E 28% (36) 13% (17) 59% (76) 129
MEASUREMENT TOOLS FOR ANTIMICROBIAL STEWARDSHIP PROGRAMS

134
Figure 2. Incident HO and CO-HCFA CDI LabID Event per 10,000 Patient days by Month, XX Hospital
0
5
10
15
20
25
1 2 3 4 5 6 7 8 9 10 11 12 1 2 3 4 5 6 7 8 9 10 11 12
HO CO-HCFA HOplusCO-HCFA
Table 3. HO CDI LabID Incidence by Unit in 2016, XX Hospital
Unit Name NHSN Unit type HO events Patient Days HO RateICU Medical/Surgical
Critical Care12 5845 20.53
51 Medical Ward 13 10263 12.6741 Medical Ward 10 8268 12.0952 Telemetry Ward 9 9336 9.6471 Orthopedic Ward 4 5634 7.1063 Surgical Ward 4 6314 6.3453 Medical Ward 6 10722 5.6073 Rehabilitation Ward
- Within ACH3 7050 4.26
61 Behavioral Health/Psych Ward
2 6392 3.13
DUKE ANTIMICROBIAL STEWARDSHIP OUTREACH NETWORK
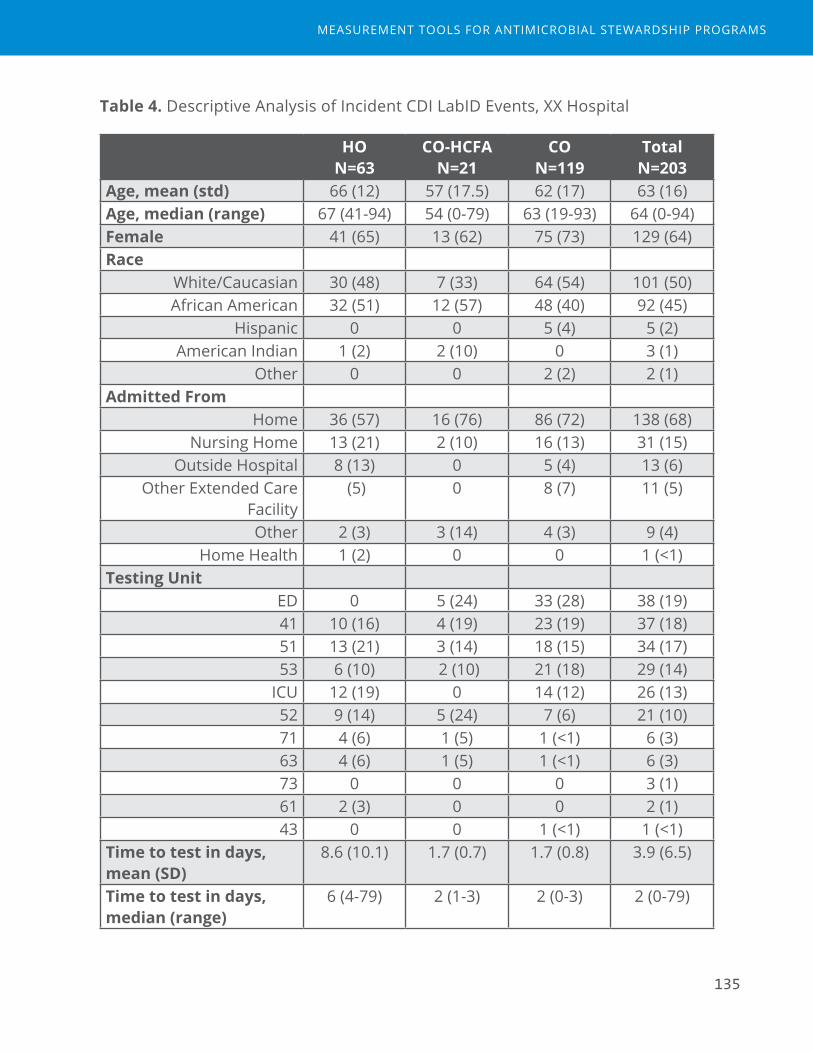
135
Table 4. Descriptive Analysis of Incident CDI LabID Events, XX Hospital
HO N=63
CO-HCFA N=21
CO N=119
Total N=203
Age, mean (std) 66 (12) 57 (17.5) 62 (17) 63 (16)Age, median (range) 67 (41-94) 54 (0-79) 63 (19-93) 64 (0-94)Female 41 (65) 13 (62) 75 (73) 129 (64)Race
White/Caucasian 30 (48) 7 (33) 64 (54) 101 (50)African American 32 (51) 12 (57) 48 (40) 92 (45)
Hispanic 0 0 5 (4) 5 (2)American Indian 1 (2) 2 (10) 0 3 (1)
Other 0 0 2 (2) 2 (1)Admitted From
Home 36 (57) 16 (76) 86 (72) 138 (68)Nursing Home 13 (21) 2 (10) 16 (13) 31 (15)
Outside Hospital 8 (13) 0 5 (4) 13 (6)Other Extended Care
Facility (5) 0 8 (7) 11 (5)
Other 2 (3) 3 (14) 4 (3) 9 (4)Home Health 1 (2) 0 0 1 (<1)
Testing Unit ED 0 5 (24) 33 (28) 38 (19)41 10 (16) 4 (19) 23 (19) 37 (18)51 13 (21) 3 (14) 18 (15) 34 (17)53 6 (10) 2 (10) 21 (18) 29 (14)
ICU 12 (19) 0 14 (12) 26 (13)52 9 (14) 5 (24) 7 (6) 21 (10)71 4 (6) 1 (5) 1 (<1) 6 (3)63 4 (6) 1 (5) 1 (<1) 6 (3)73 0 0 0 3 (1)61 2 (3) 0 0 2 (1)43 0 0 1 (<1) 1 (<1)
Time to test in days, mean (SD)
8.6 (10.1) 1.7 (0.7) 1.7 (0.8) 3.9 (6.5)
Time to test in days, median (range)
6 (4-79) 2 (1-3) 2 (0-3) 2 (0-79)
MEASUREMENT TOOLS FOR ANTIMICROBIAL STEWARDSHIP PROGRAMS

136
HO N=63
CO-HCFA N=21
CO N=119
Total N=203
Final StatusMissing 1 0 0 1
Home 25 (40) 14 (67) 71 (60) 110 (54)Nursing Home 19 (31) 3 (14) 24 (20) 46 (23)
Home Health 5 (8) 2 (10) 4 (3) 11 (5)Other 1 (2) 2 (10) 5 (4) 8 (4)
Other Hospital 4 (6) 0 4 (3) 8 (4)Death 3 (5) 0 4 (3) 7 (3)
Other Extended Care Facility
3 (5) 0 4 (3) 7 (3)
Hospice 2 (3) 0 3 (3) 5 (2)
DUKE ANTIMICROBIAL STEWARDSHIP OUTREACH NETWORK

137
XX Hospital, Report 2
Redundant Therapy Events
Introduction
Scenarios where patients simultaneously receive more than one antimicrobial that has activity against the same type of pathogen may represent excess exposures and be a target for intervention by Antimicrobial Stewardship Programs.
For this analysis, we calculated both the number of redundant therapy events as well as the number of days of redundant therapy. Five groups of agents were evaluated: anti-pseudomonal, Gram-positive, anti-anaerobe, anti-fungal, and beta-lactams (See Appendix Table). The rates of redundant events were calculated over a denominator of antimicrobial days and spectrum-group specific antimicrobial days, as well as antimicrobial admissions. We evaluated the most frequent combinations of redundant events within each spectrum group. Finally, we estimated the number of redundant days of therapy to determine how many potential antimicrobial days could be conserved with intervention.
For all analyses, the time period evaluated was calendar year 2016. In Figure 1, XX Hospital is Hospital B.
Table 1. Key Definitions
Term DefinitionRedundant Therapy Event
Patient encounter in which two or more therapies from the same spectrum group are administered concomitantly on more than one consecutive calendar day. One unique encounter CAN have >1 event if >1 redundant spectra event occurs on the same encounter but within a different spectrum group or if separated in time by >1 calendar day. Redundant spectra events are calculated separately for each spectrum group.
Spectrum Group Group of antimicrobial agents that have the same antimicrobial spectrum or kill the same types of pathogens.
MEASUREMENT TOOLS FOR ANTIMICROBIAL STEWARDSHIP PROGRAMS
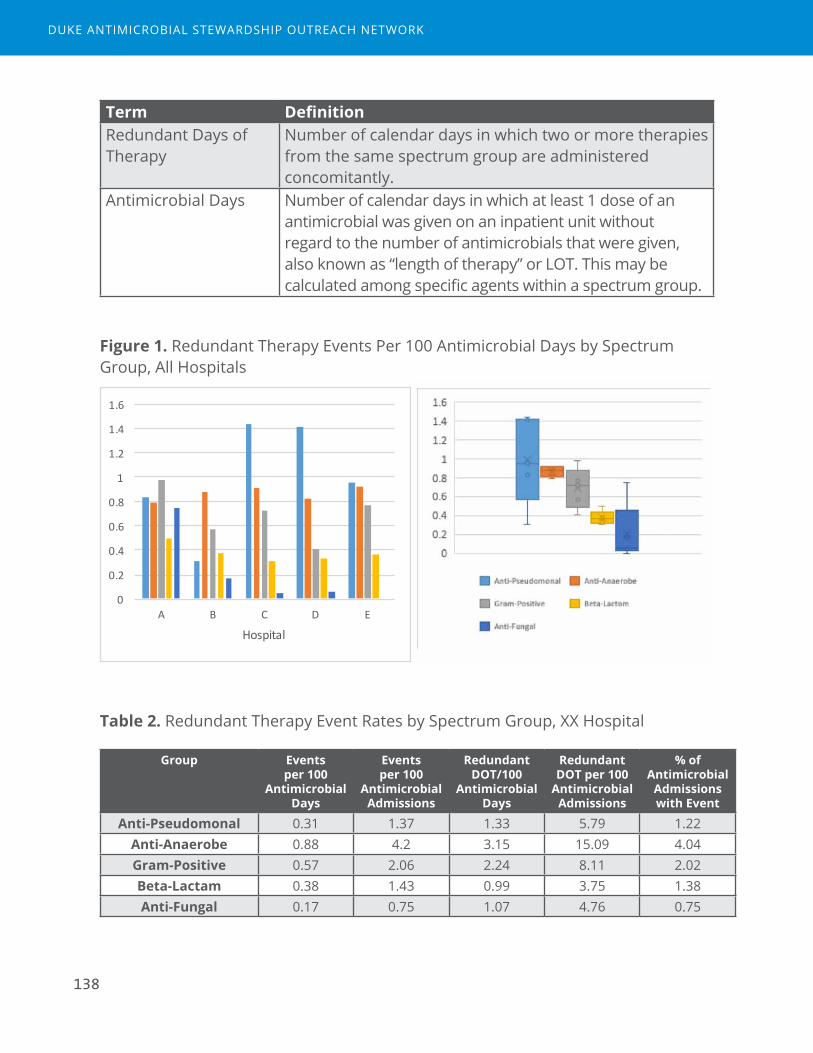
138
Term DefinitionRedundant Days of Therapy
Number of calendar days in which two or more therapies from the same spectrum group are administered concomitantly.
Antimicrobial Days Number of calendar days in which at least 1 dose of an antimicrobial was given on an inpatient unit without regard to the number of antimicrobials that were given, also known as “length of therapy” or LOT. This may be calculated among specific agents within a spectrum group.
Figure 1. Redundant Therapy Events Per 100 Antimicrobial Days by Spectrum Group, All Hospitals
0
0.2
0.4
0.6
0.8
1
1.2
1.4
1.6
A B C D E
Hospital
Table 2. Redundant Therapy Event Rates by Spectrum Group, XX Hospital
Group Events per 100
Antimicrobial Days
Events per 100
Antimicrobial Admissions
Redundant DOT/100
Antimicrobial Days
Redundant DOT per 100
Antimicrobial Admissions
% of Antimicrobial
Admissions with Event
Anti-Pseudomonal 0.31 1.37 1.33 5.79 1.22Anti-Anaerobe 0.88 4.2 3.15 15.09 4.04Gram-Positive 0.57 2.06 2.24 8.11 2.02Beta-Lactam 0.38 1.43 0.99 3.75 1.38Anti-Fungal 0.17 0.75 1.07 4.76 0.75
DUKE ANTIMICROBIAL STEWARDSHIP OUTREACH NETWORK
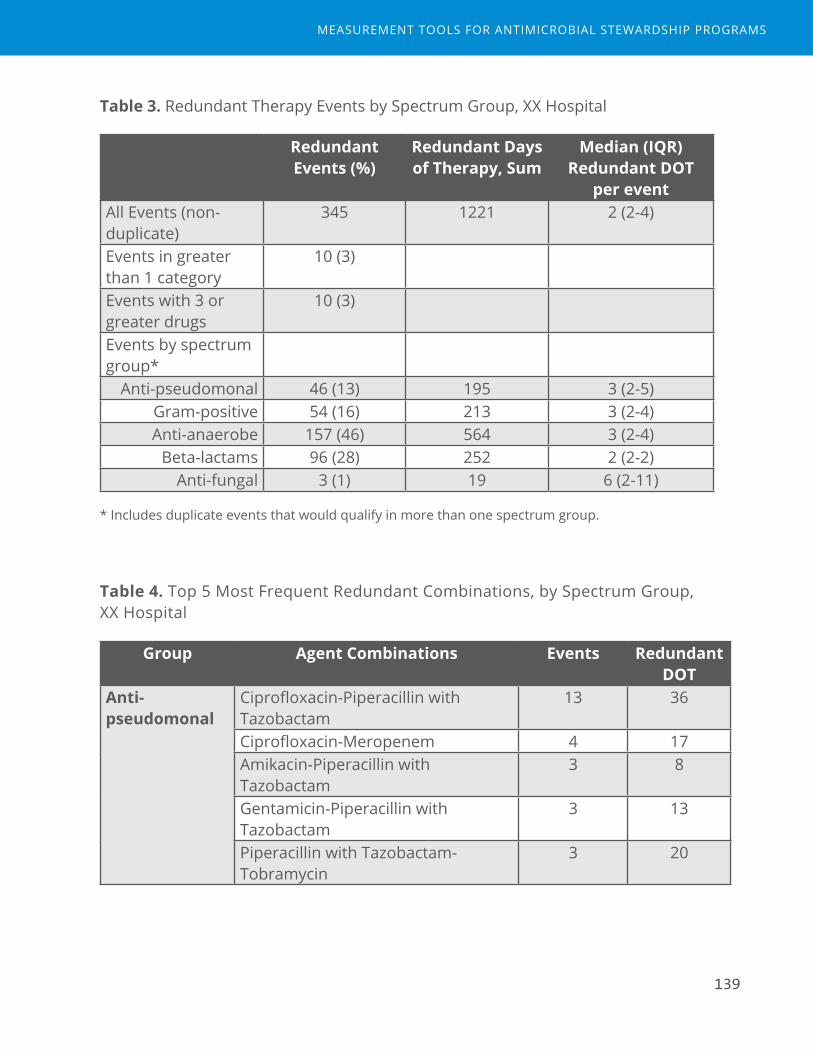
139
Table 3. Redundant Therapy Events by Spectrum Group, XX Hospital
Redundant Events (%)
Redundant Days of Therapy, Sum
Median (IQR) Redundant DOT
per eventAll Events (non-duplicate)
345 1221 2 (2-4)
Events in greater than 1 category
10 (3)
Events with 3 or greater drugs
10 (3)
Events by spectrum group*
Anti-pseudomonal 46 (13) 195 3 (2-5)Gram-positive 54 (16) 213 3 (2-4)Anti-anaerobe 157 (46) 564 3 (2-4)
Beta-lactams 96 (28) 252 2 (2-2)Anti-fungal 3 (1) 19 6 (2-11)
* Includes duplicate events that would qualify in more than one spectrum group.
Table 4. Top 5 Most Frequent Redundant Combinations, by Spectrum Group, XX Hospital
Group Agent Combinations Events Redundant DOT
Anti-pseudomonal
Ciprofloxacin-Piperacillin with Tazobactam
13 36
Ciprofloxacin-Meropenem 4 17Amikacin-Piperacillin with Tazobactam
3 8
Gentamicin-Piperacillin with Tazobactam
3 13
Piperacillin with Tazobactam-Tobramycin
3 20
MEASUREMENT TOOLS FOR ANTIMICROBIAL STEWARDSHIP PROGRAMS
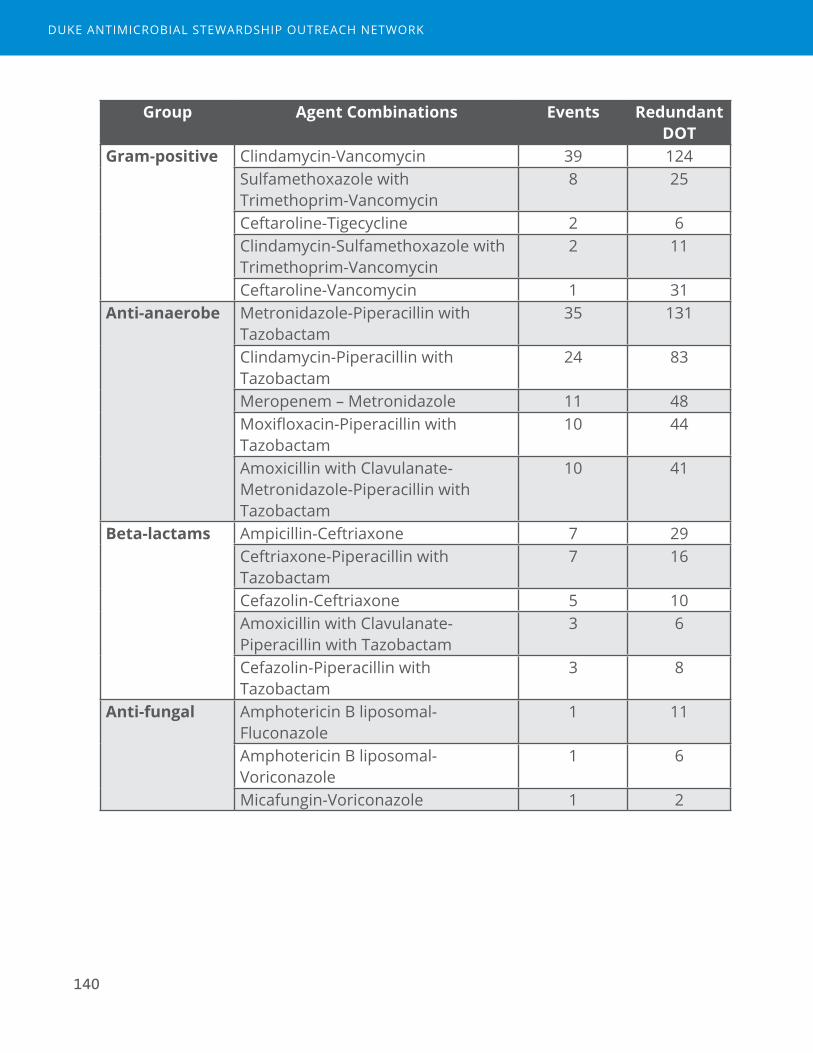
140
Group Agent Combinations Events Redundant DOT
Gram-positive Clindamycin-Vancomycin 39 124Sulfamethoxazole with Trimethoprim-Vancomycin
8 25
Ceftaroline-Tigecycline 2 6Clindamycin-Sulfamethoxazole with Trimethoprim-Vancomycin
2 11
Ceftaroline-Vancomycin 1 31Anti-anaerobe Metronidazole-Piperacillin with
Tazobactam35 131
Clindamycin-Piperacillin with Tazobactam
24 83
Meropenem – Metronidazole 11 48Moxifloxacin-Piperacillin with Tazobactam
10 44
Amoxicillin with Clavulanate-Metronidazole-Piperacillin with Tazobactam
10 41
Beta-lactams Ampicillin-Ceftriaxone 7 29Ceftriaxone-Piperacillin with Tazobactam
7 16
Cefazolin-Ceftriaxone 5 10Amoxicillin with Clavulanate-Piperacillin with Tazobactam
3 6
Cefazolin-Piperacillin with Tazobactam
3 8
Anti-fungal Amphotericin B liposomal-Fluconazole
1 11
Amphotericin B liposomal-Voriconazole
1 6
Micafungin-Voriconazole 1 2
DUKE ANTIMICROBIAL STEWARDSHIP OUTREACH NETWORK
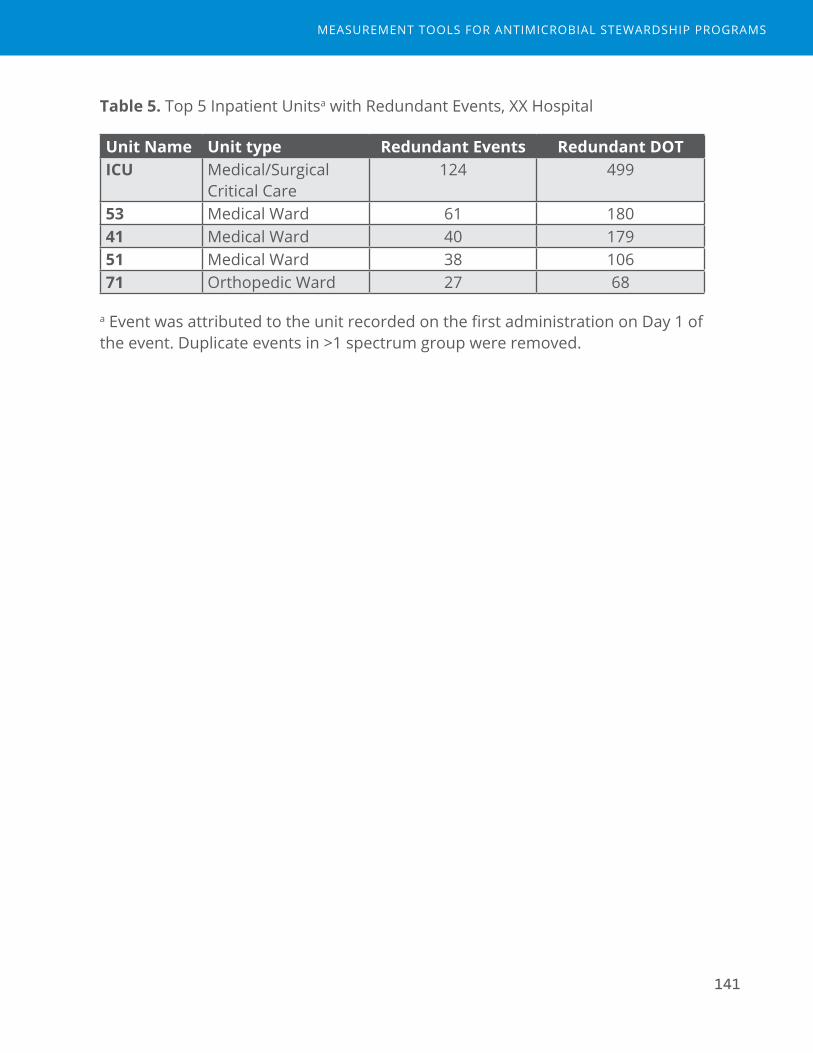
141
Table 5. Top 5 Inpatient Unitsa with Redundant Events, XX Hospital
Unit Name Unit type Redundant Events Redundant DOTICU Medical/Surgical
Critical Care124 499
53 Medical Ward 61 18041 Medical Ward 40 17951 Medical Ward 38 10671 Orthopedic Ward 27 68
a Event was attributed to the unit recorded on the first administration on Day 1 of the event. Duplicate events in >1 spectrum group were removed.
MEASUREMENT TOOLS FOR ANTIMICROBIAL STEWARDSHIP PROGRAMS

142
DUKE ANTIMICROBIAL STEWARDSHIP OUTREACH NETWORK
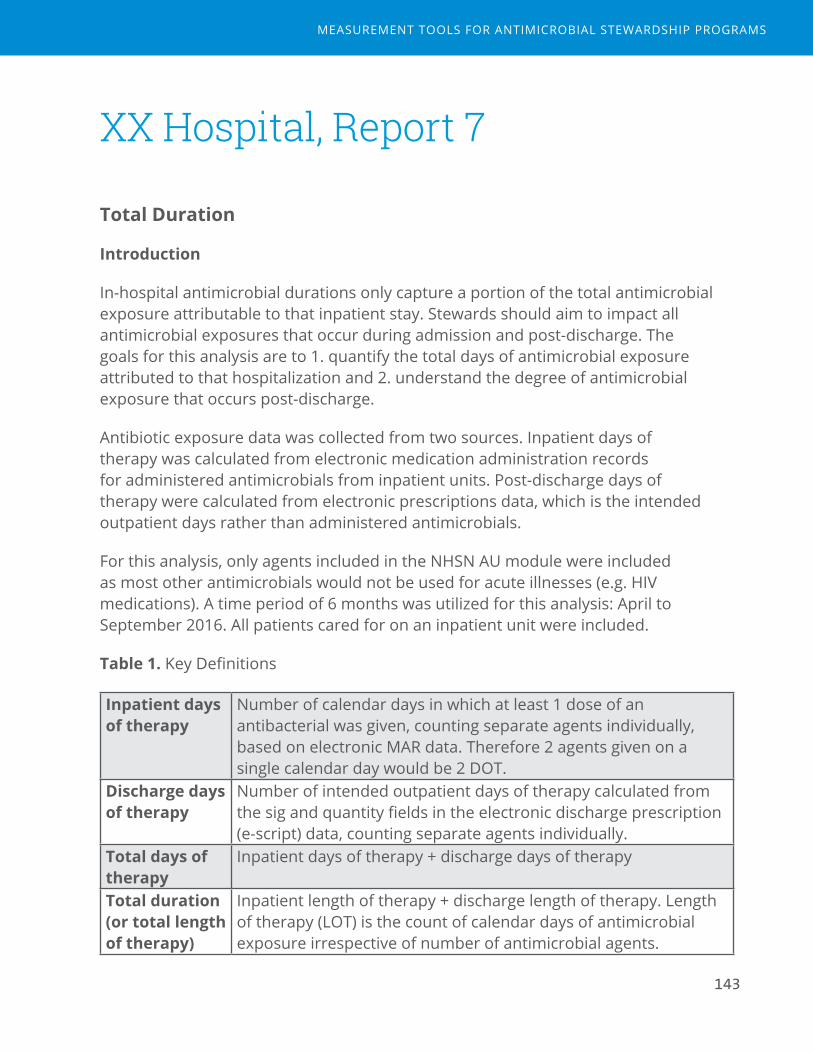
143
XX Hospital, Report 7
Total Duration
Introduction
In-hospital antimicrobial durations only capture a portion of the total antimicrobial exposure attributable to that inpatient stay. Stewards should aim to impact all antimicrobial exposures that occur during admission and post-discharge. The goals for this analysis are to 1. quantify the total days of antimicrobial exposure attributed to that hospitalization and 2. understand the degree of antimicrobial exposure that occurs post-discharge.
Antibiotic exposure data was collected from two sources. Inpatient days of therapy was calculated from electronic medication administration records for administered antimicrobials from inpatient units. Post-discharge days of therapy were calculated from electronic prescriptions data, which is the intended outpatient days rather than administered antimicrobials.
For this analysis, only agents included in the NHSN AU module were included as most other antimicrobials would not be used for acute illnesses (e.g. HIV medications). A time period of 6 months was utilized for this analysis: April to September 2016. All patients cared for on an inpatient unit were included.
Table 1. Key Definitions
Inpatient days of therapy
Number of calendar days in which at least 1 dose of an antibacterial was given, counting separate agents individually, based on electronic MAR data. Therefore 2 agents given on a single calendar day would be 2 DOT.
Discharge days of therapy
Number of intended outpatient days of therapy calculated from the sig and quantity fields in the electronic discharge prescription (e-script) data, counting separate agents individually.
Total days of therapy
Inpatient days of therapy + discharge days of therapy
Total duration (or total length of therapy)
Inpatient length of therapy + discharge length of therapy. Length of therapy (LOT) is the count of calendar days of antimicrobial exposure irrespective of number of antimicrobial agents.
MEASUREMENT TOOLS FOR ANTIMICROBIAL STEWARDSHIP PROGRAMS

144
Table 2. Example from electronic prescription data
Description AMOXICILLIN 875 MG-POTASSIUM CLAVULANATE 125 MG TABLET
Sig Take 1 tablet (875 mg total) by mouth every 12 (twelve) hours.
Quantity 14 tablet(Calculated) Discharge Days of Therapy
7 days
Table 3. Description of Antimicrobial Exposures Among 25931 Inpatient Admissions
Total number of admissions 25931Admissions with inpatient antimicrobials* 14429 (56%)Admissions with discharge antimicrobials* 4527 (17%)Total Admissions with antimicrobial exposure (during and after admission)
14646 (56%)
Number of Discharge Antimicrobials per admission 0 21404 (83%)1 3713 (14%)2 718 (3%)3 85 (<1%)4 8 (<1%)5 2 (<1%)6 1 (<1%)
Total Duration among all antimicrobial admissions mean (std) 9.5 (15.4)median (IQR) 4 (2-12)
N missing 192
*NHSN AU drugs only https://www.cdc.gov/nhsn/pdfs/pscmanual/11pscaurcurrent.pdf.
DUKE ANTIMICROBIAL STEWARDSHIP OUTREACH NETWORK
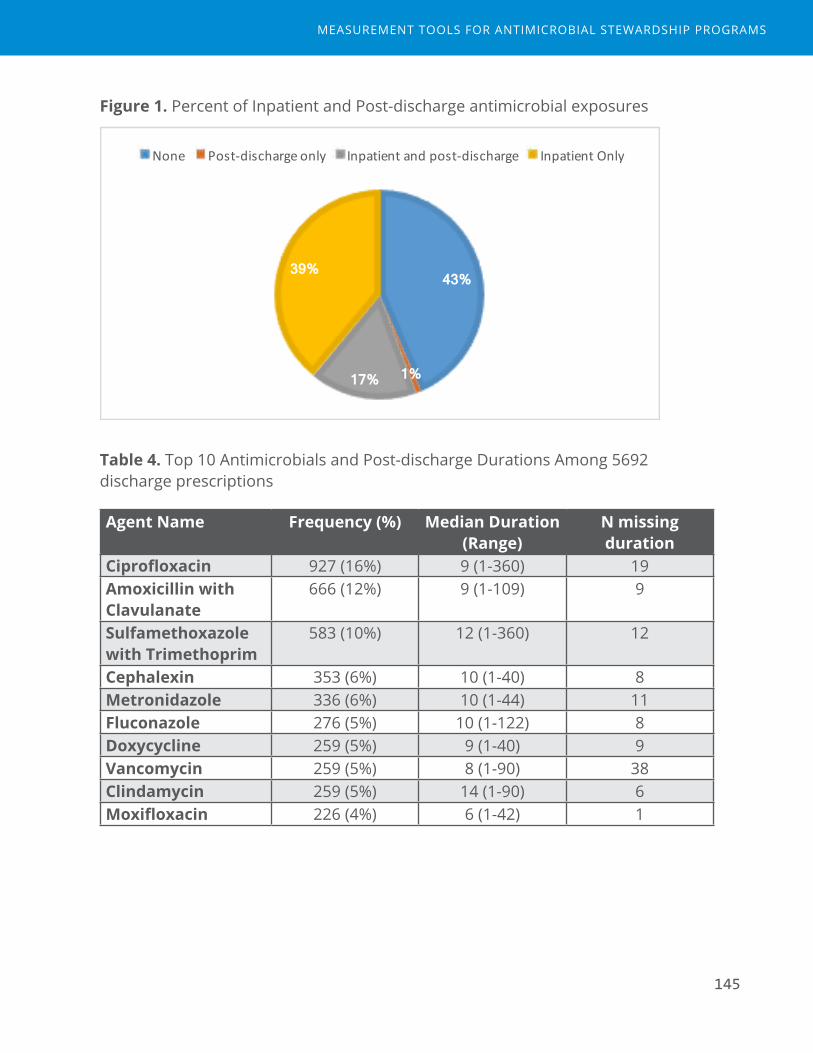
145
Figure 1. Percent of Inpatient and Post-discharge antimicrobial exposures
43%
1% 17%
39%
None Post-dischargeonly Inpatientandpost-discharge InpatientOnly
Table 4. Top 10 Antimicrobials and Post-discharge Durations Among 5692 discharge prescriptions
Agent Name Frequency (%) Median Duration (Range)
N missing duration
Ciprofloxacin 927 (16%) 9 (1-360) 19Amoxicillin with Clavulanate
666 (12%) 9 (1-109) 9
Sulfamethoxazole with Trimethoprim
583 (10%) 12 (1-360) 12
Cephalexin 353 (6%) 10 (1-40) 8Metronidazole 336 (6%) 10 (1-44) 11Fluconazole 276 (5%) 10 (1-122) 8Doxycycline 259 (5%) 9 (1-40) 9Vancomycin 259 (5%) 8 (1-90) 38Clindamycin 259 (5%) 14 (1-90) 6Moxifloxacin 226 (4%) 6 (1-42) 1
MEASUREMENT TOOLS FOR ANTIMICROBIAL STEWARDSHIP PROGRAMS
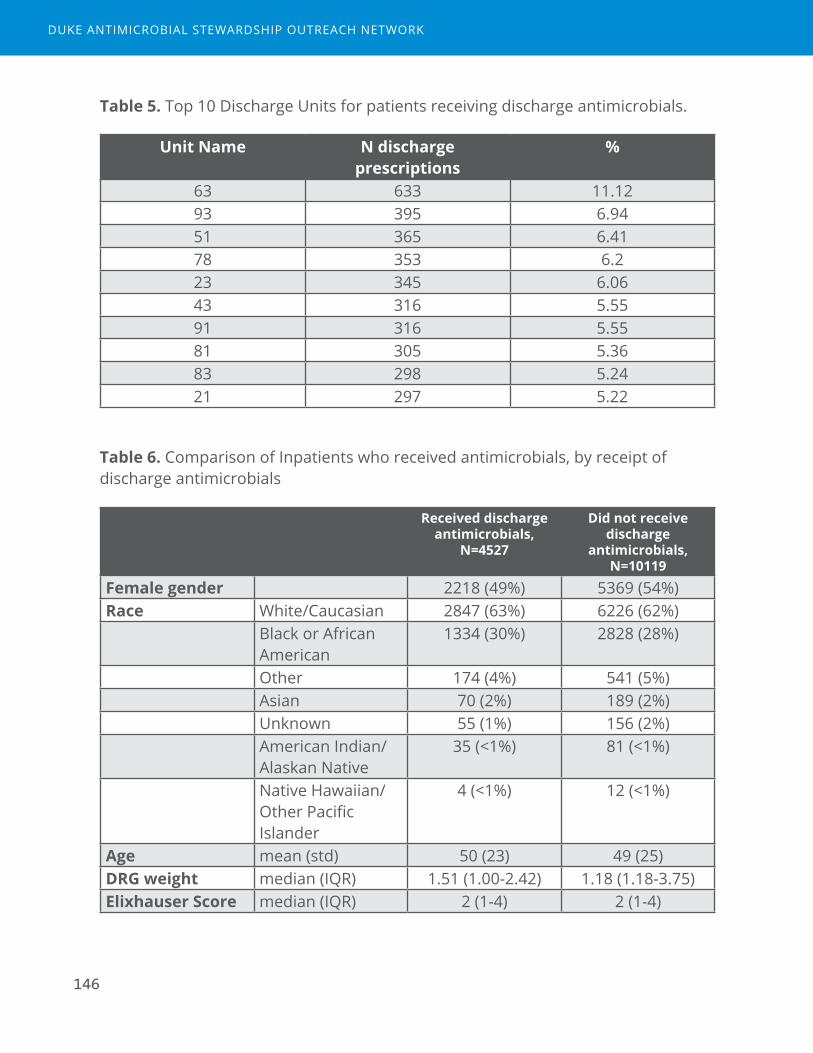
146
Table 5. Top 10 Discharge Units for patients receiving discharge antimicrobials.
Unit Name N discharge prescriptions
%
63 633 11.1293 395 6.9451 365 6.4178 353 6.223 345 6.0643 316 5.5591 316 5.5581 305 5.3683 298 5.2421 297 5.22
Table 6. Comparison of Inpatients who received antimicrobials, by receipt of discharge antimicrobials
Received discharge antimicrobials,
N=4527
Did not receive discharge
antimicrobials, N=10119
Female gender 2218 (49%) 5369 (54%)Race White/Caucasian 2847 (63%) 6226 (62%)
Black or African American
1334 (30%) 2828 (28%)
Other 174 (4%) 541 (5%)Asian 70 (2%) 189 (2%)Unknown 55 (1%) 156 (2%)American Indian/Alaskan Native
35 (<1%) 81 (<1%)
Native Hawaiian/Other Pacific Islander
4 (<1%) 12 (<1%)
Age mean (std) 50 (23) 49 (25)DRG weight median (IQR) 1.51 (1.00-2.42) 1.18 (1.18-3.75)Elixhauser Score median (IQR) 2 (1-4) 2 (1-4)
DUKE ANTIMICROBIAL STEWARDSHIP OUTREACH NETWORK
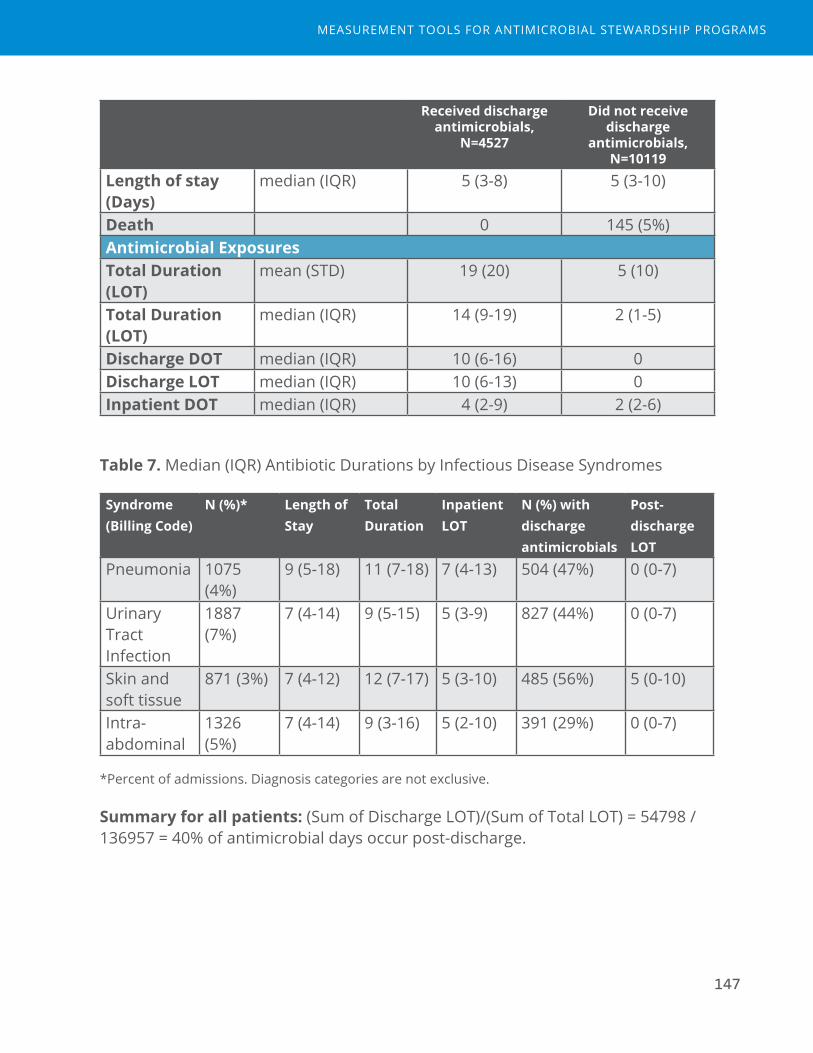
147
Received discharge antimicrobials,
N=4527
Did not receive discharge
antimicrobials, N=10119
Length of stay (Days)
median (IQR) 5 (3-8) 5 (3-10)
Death 0 145 (5%)Antimicrobial ExposuresTotal Duration (LOT)
mean (STD) 19 (20) 5 (10)
Total Duration (LOT)
median (IQR) 14 (9-19) 2 (1-5)
Discharge DOT median (IQR) 10 (6-16) 0Discharge LOT median (IQR) 10 (6-13) 0Inpatient DOT median (IQR) 4 (2-9) 2 (2-6)
Table 7. Median (IQR) Antibiotic Durations by Infectious Disease Syndromes
Syndrome (Billing Code)
N (%)* Length of Stay
Total Duration
Inpatient LOT
N (%) with discharge antimicrobials
Post-discharge LOT
Pneumonia 1075 (4%)
9 (5-18) 11 (7-18) 7 (4-13) 504 (47%) 0 (0-7)
Urinary Tract Infection
1887 (7%)
7 (4-14) 9 (5-15) 5 (3-9) 827 (44%) 0 (0-7)
Skin and soft tissue
871 (3%) 7 (4-12) 12 (7-17) 5 (3-10) 485 (56%) 5 (0-10)
Intra-abdominal
1326 (5%)
7 (4-14) 9 (3-16) 5 (2-10) 391 (29%) 0 (0-7)
*Percent of admissions. Diagnosis categories are not exclusive.
Summary for all patients: (Sum of Discharge LOT)/(Sum of Total LOT) = 54798 / 136957 = 40% of antimicrobial days occur post-discharge.
MEASUREMENT TOOLS FOR ANTIMICROBIAL STEWARDSHIP PROGRAMS

148
DUKE ANTIMICROBIAL STEWARDSHIP OUTREACH NETWORK
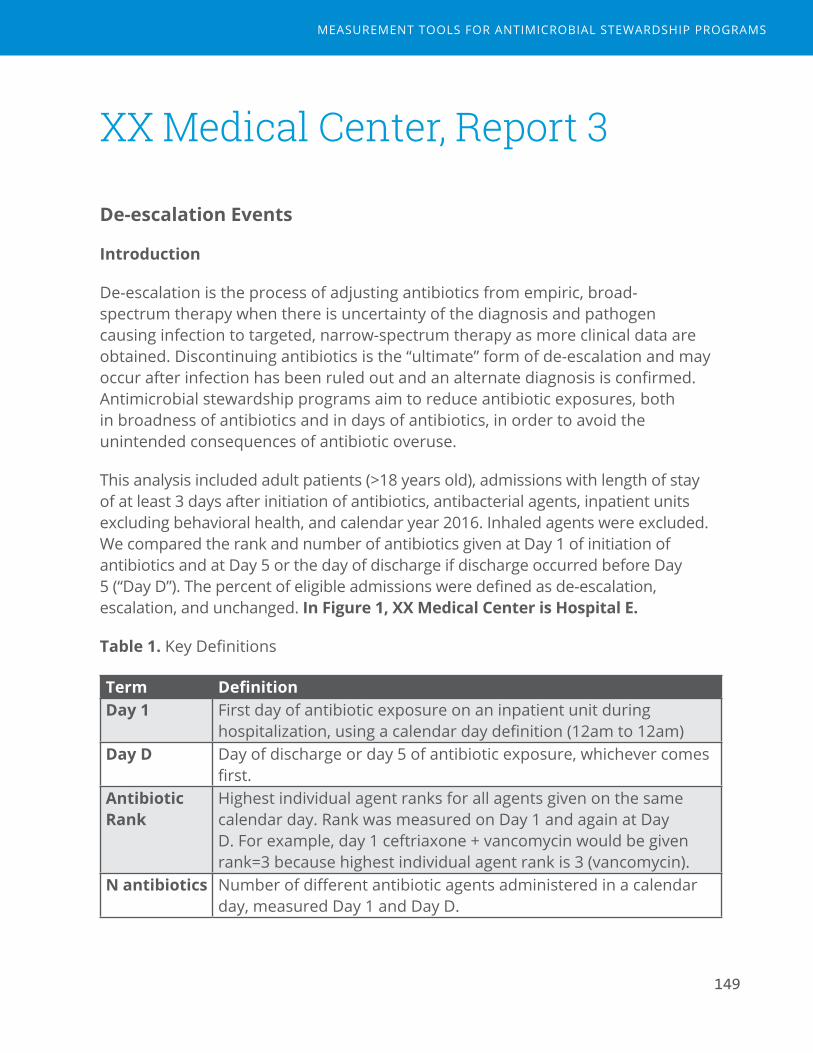
149
XX Medical Center, Report 3
De-escalation Events
Introduction
De-escalation is the process of adjusting antibiotics from empiric, broad-spectrum therapy when there is uncertainty of the diagnosis and pathogen causing infection to targeted, narrow-spectrum therapy as more clinical data are obtained. Discontinuing antibiotics is the “ultimate” form of de-escalation and may occur after infection has been ruled out and an alternate diagnosis is confirmed. Antimicrobial stewardship programs aim to reduce antibiotic exposures, both in broadness of antibiotics and in days of antibiotics, in order to avoid the unintended consequences of antibiotic overuse.
This analysis included adult patients (>18 years old), admissions with length of stay of at least 3 days after initiation of antibiotics, antibacterial agents, inpatient units excluding behavioral health, and calendar year 2016. Inhaled agents were excluded. We compared the rank and number of antibiotics given at Day 1 of initiation of antibiotics and at Day 5 or the day of discharge if discharge occurred before Day 5 (“Day D”). The percent of eligible admissions were defined as de-escalation, escalation, and unchanged. In Figure 1, XX Medical Center is Hospital E.
Table 1. Key Definitions
Term DefinitionDay 1 First day of antibiotic exposure on an inpatient unit during
hospitalization, using a calendar day definition (12am to 12am)Day D Day of discharge or day 5 of antibiotic exposure, whichever comes
first.Antibiotic Rank
Highest individual agent ranks for all agents given on the same calendar day. Rank was measured on Day 1 and again at Day D. For example, day 1 ceftriaxone + vancomycin would be given rank=3 because highest individual agent rank is 3 (vancomycin).
N antibiotics Number of different antibiotic agents administered in a calendar day, measured Day 1 and Day D.
MEASUREMENT TOOLS FOR ANTIMICROBIAL STEWARDSHIP PROGRAMS

150
Table 2. Antibiotic Rank
Narrow spectrum Broad spectrum Extended spectrum, including MDRO and Pseudomonas
Restricted
1 2 3 41st- and 2nd-generation cephalosporins
Amoxicillin
TMP/SMX
Nafcillin, Oxacillin
Metronidazole
Doxycycline
Nitrofurantoin
Penicillin
Ceftriaxone
Azithromycin
Clarithromycin
Amoxcillin/clavulanate
Ampicillin/sulbactam
Clindamycin
Antipseudomonal penicillins
Fluoroquinolones
Aminoglycosides
Vancomycin
Cefepime, Ceftazidime
Ertapenem
Aztreonam
Anti-pseudomonal Carbapenem
Colistin
Tigecycline
Linezolid, Tedizolid
Daptomycin
Ceftaroline
Ceftazidime/avibactam
Ceftolozaone/tazobactam
Table 3. De-escalation Outcome, Day 1 versus Day D, XX Medical Center
N (%)N Antibiotics
Lower Same Higher
Rank
Lower 2492 (31) 203 (3) 25 (<1)
Same 377 (5) 4075 (51) 469 (6)Higher 19 (<1) 128 (2) 231 (3)
DUKE ANTIMICROBIAL STEWARDSHIP OUTREACH NETWORK

151
Figure 1. De-escalation Outcome, All Hospitals
33% 31% 38%
52% 53% 51%
15% 16% 11%
0% 10% 20% 30% 40% 50% 60% 70% 80% 90%
100%
C D E
Escalation
Unchanged
De-escalation
Figure 2. Percent De-escalation by Month in 2016, XX Medical Center
38% 37% 38% 40% 39%
43% 38% 38% 39%
36% 36% 31%
12% 11% 11% 10% 9% 8% 9% 11%
9% 12% 12% 11%
0%
5%
10%
15%
20%
25%
30%
35%
40%
45%
1 2 3 4 5 6 7 8 9 10 11 12
Percent
MonthonDay1
PercentDe-escalation PercentEscalation
MEASUREMENT TOOLS FOR ANTIMICROBIAL STEWARDSHIP PROGRAMS

152
Table 4. Descriptive Table of De-escalation Outcome, XX Medical Center
De-Escalation (N=3072)
Escalation (N=828)
Unchanged (N=4119)
Total (N=8019)
Age, Mean (SD) years 62.0 (17.4) 62.5 (17.2) 61.9 (17.1) 62.0 (17.2)Female Gender 1774 (57.7%) 434 (52.4%) 2303 (55.9%) 4511 (56.3%)Race, N (%)
White/Caucasian 1221 (39.7%) 347 (41.9%) 1574 (38.2%) 3142 (39.2%)American Indian/Alaskan Native
948 (30.9%) 244 (29.5%) 1314 (31.9%) 2506 (31.3%)
Black or African American
821 (26.7%) 210 (25.4%) 1138 (27.6%) 2169 (27.0%)
Asian 19 (0.6%) 2 (0.2%) 18 (0.4%) 39 (0.5%)Hispanic or Latino 2 (0.1%) 0 (0.0%) 0 (0.0%) 2 (0.0%)Other 0 (0.0%) 0 (0.0%) 2 (0.0%) 2 (0.0%)Unknown 61 (2.0%) 25 (3.0%) 73 (1.8%) 159 (2.0%)
Elixhauser Comorbidity Score, Mean (SD)
3.6 (2.1) 4.2 (2.1) 3.7 (2.0) 3.7 (2.1)
Length of stay prior to Day 1
<= 1 day 1669 (54.3%) 567 (68.5%) 2197 (53.3%) 4433 (55.3%)2 - 5 days 1312 (42.7%) 243 (29.3%) 1801 (43.7%) 3356 (41.9%)> 5 days 91 (3.0%) 18 (2.2%) 120 (2.9%) 229 (2.9%)Missing 0 (0.0%) 0 (0.0%) 1 (0.0%) 1 (0.0%)
De-escalation Day (days from Day 1 to Day D)
3 488 (15.9%) 22 (2.7%) 1117 (27.1%) 1627 (20.3%)4 871 (28.4%) 80 (9.7%) 718 (17.4%) 1669 (20.8%)5 1713 (55.8%) 726 (87.7%) 2284 (55.5%) 4723 (58.9%)
Infection Diagnosis Category
Bacterial infection, unspecified site
15 (0.5%) 14 (1.7%) 42 (1.0%) 71 (0.9%)
Bloodstream/Septicemia
38 (1.2%) 11 (1.3%) 20 (0.5%) 69 (0.9%)
Bone and joint 6 (0.2%) 5 (0.6%) 17 (0.4%) 28 (0.3%)COPD 434 (14.1%) 58 (7.0%) 626 (15.2%) 1118 (13.9%)Central nervous system 5 (0.2%) 1 (0.1%) 3 (0.1%) 9 (0.1%)ENT and upper respiratory tract
27 (0.9%) 4 (0.5%) 66 (1.6%) 97 (1.2%)
GI tract 31 (1.0%) 10 (1.2%) 55 (1.3%) 96 (1.2%)Intra-abdominal infection
74 (2.4%) 35 (4.2%) 153 (3.7%) 262 (3.3%)
DUKE ANTIMICROBIAL STEWARDSHIP OUTREACH NETWORK
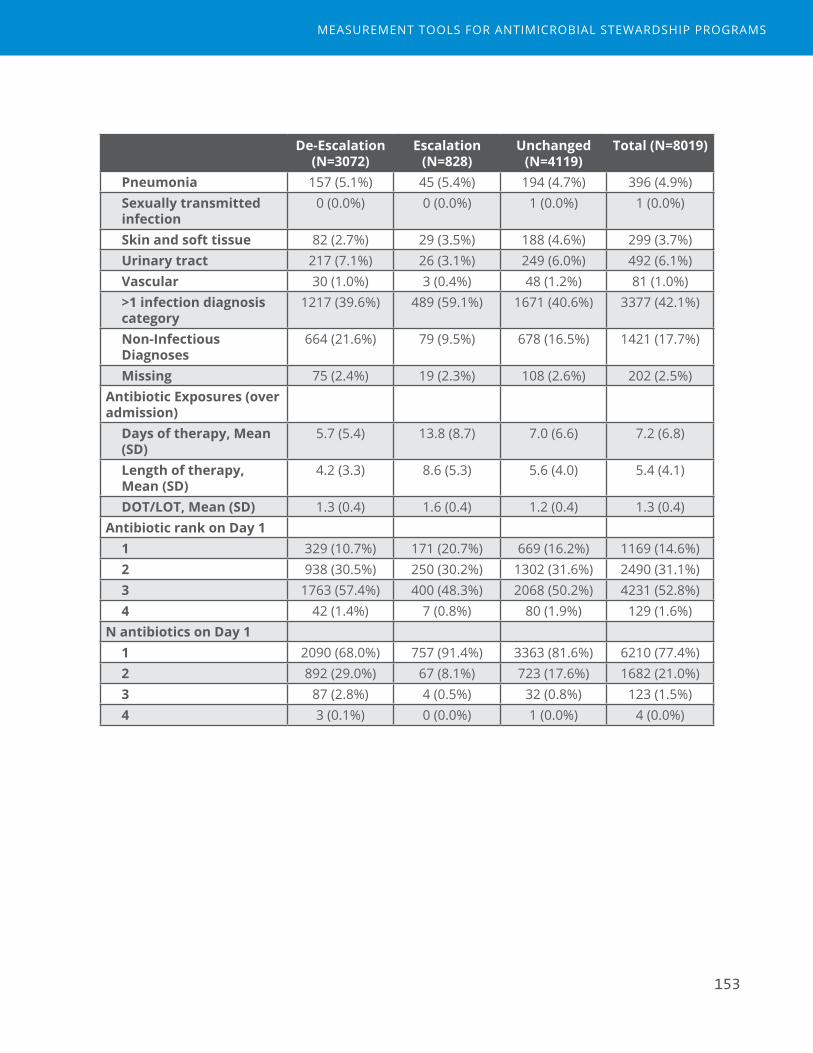
153
De-Escalation (N=3072)
Escalation (N=828)
Unchanged (N=4119)
Total (N=8019)
Pneumonia 157 (5.1%) 45 (5.4%) 194 (4.7%) 396 (4.9%)Sexually transmitted infection
0 (0.0%) 0 (0.0%) 1 (0.0%) 1 (0.0%)
Skin and soft tissue 82 (2.7%) 29 (3.5%) 188 (4.6%) 299 (3.7%)Urinary tract 217 (7.1%) 26 (3.1%) 249 (6.0%) 492 (6.1%)Vascular 30 (1.0%) 3 (0.4%) 48 (1.2%) 81 (1.0%)>1 infection diagnosis category
1217 (39.6%) 489 (59.1%) 1671 (40.6%) 3377 (42.1%)
Non-Infectious Diagnoses
664 (21.6%) 79 (9.5%) 678 (16.5%) 1421 (17.7%)
Missing 75 (2.4%) 19 (2.3%) 108 (2.6%) 202 (2.5%)Antibiotic Exposures (over admission)
Days of therapy, Mean (SD)
5.7 (5.4) 13.8 (8.7) 7.0 (6.6) 7.2 (6.8)
Length of therapy, Mean (SD)
4.2 (3.3) 8.6 (5.3) 5.6 (4.0) 5.4 (4.1)
DOT/LOT, Mean (SD) 1.3 (0.4) 1.6 (0.4) 1.2 (0.4) 1.3 (0.4)Antibiotic rank on Day 1
1 329 (10.7%) 171 (20.7%) 669 (16.2%) 1169 (14.6%)2 938 (30.5%) 250 (30.2%) 1302 (31.6%) 2490 (31.1%)3 1763 (57.4%) 400 (48.3%) 2068 (50.2%) 4231 (52.8%)4 42 (1.4%) 7 (0.8%) 80 (1.9%) 129 (1.6%)
N antibiotics on Day 11 2090 (68.0%) 757 (91.4%) 3363 (81.6%) 6210 (77.4%)2 892 (29.0%) 67 (8.1%) 723 (17.6%) 1682 (21.0%)3 87 (2.8%) 4 (0.5%) 32 (0.8%) 123 (1.5%)4 3 (0.1%) 0 (0.0%) 1 (0.0%) 4 (0.0%)
MEASUREMENT TOOLS FOR ANTIMICROBIAL STEWARDSHIP PROGRAMS
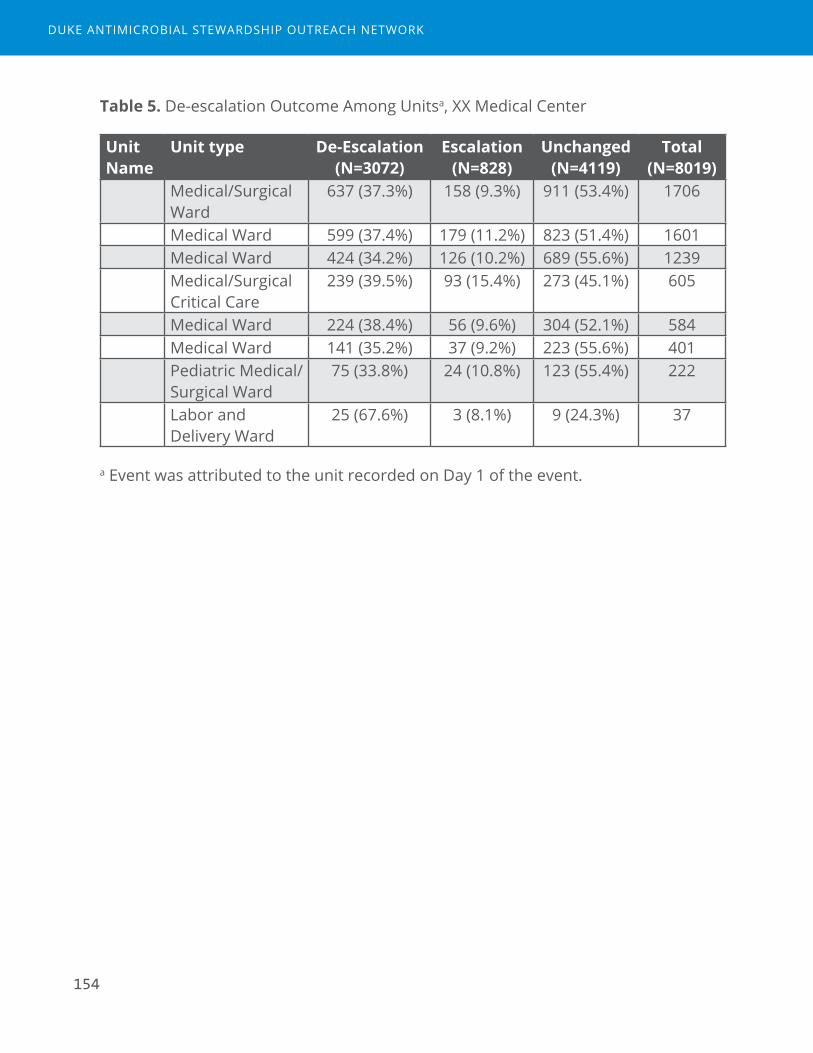
154
Table 5. De-escalation Outcome Among Unitsa, XX Medical Center
Unit Name
Unit type De-Escalation (N=3072)
Escalation (N=828)
Unchanged (N=4119)
Total (N=8019)
Medical/Surgical Ward
637 (37.3%) 158 (9.3%) 911 (53.4%) 1706
Medical Ward 599 (37.4%) 179 (11.2%) 823 (51.4%) 1601Medical Ward 424 (34.2%) 126 (10.2%) 689 (55.6%) 1239Medical/Surgical Critical Care
239 (39.5%) 93 (15.4%) 273 (45.1%) 605
Medical Ward 224 (38.4%) 56 (9.6%) 304 (52.1%) 584Medical Ward 141 (35.2%) 37 (9.2%) 223 (55.6%) 401Pediatric Medical/Surgical Ward
75 (33.8%) 24 (10.8%) 123 (55.4%) 222
Labor and Delivery Ward
25 (67.6%) 3 (8.1%) 9 (24.3%) 37
a Event was attributed to the unit recorded on Day 1 of the event.
DUKE ANTIMICROBIAL STEWARDSHIP OUTREACH NETWORK

155
XXX Hospital, Report 5
Readmission Due to Infectious Diagnoses
Introduction
Antimicrobial stewardship programs aim to optimize the management of patients treated for infections. Stewardship teams may be challenged by providers who worry about the potential negative effects of interventions that aim to shorten antimicrobial durations or reduce antimicrobial exposures. Tracking readmissions due to infectious diagnoses can be used to prove no harm came from stewardship interventions. Stable or improved readmissions rates along with improvements in appropriate antimicrobial management may also help engage providers and hospital leadership.
We aimed to identify 30-day readmission rates following index admissions that reported a billing code (ICD-10) for multiple infectious diagnosis categories. Index admissions for adults (>18 years), housed on an inpatient unit, with ICD-10 diagnosis data were followed for 30 days to determine if there was readmission to the same hospital. Inpatient admissions were considered if the patient was housed on an inpatient unit in bed movement data and there were ICD-10 data available for that admission. Thirty day readmissions were defined in four outcome groups: 1. Same category infectious diagnosis, 2. Different category infectious diagnosis, 3. Non-infectious diagnosis, or 4. No readmission.
For all analyses, the time period evaluated was two years from October 2014 to September 2016. In Figure 1, XXX Hospital is Hospital C.
Table 1. Key Definitions
Term DefinitionInfection index admission
Inpatient stay where the diagnosis codes included an infectious diagnosis as defined by infection diagnosis categories.
Infection diagnosis category
Category of infectious diagnosis syndromes as defined by the Agency for Healthcare Research and Quality Clinical Classifications Software (CCS) codes (Appendix table), which is based on ICD-10 codes.
MEASUREMENT TOOLS FOR ANTIMICROBIAL STEWARDSHIP PROGRAMS

156
Term DefinitionSame category infection readmission
An inpatient stay within 30 days of the infection index admission with the same infection diagnosis category.
Different category infection readmission
An inpatient stay within 30 days of the infection index admission with a different infection category
Non-infectious readmission
An inpatient stay within 30 days of the infection index admission without an infection diagnosis.
Figure 1. Thirty day readmissions among admissions with infectious diagnoses, All Hospitals
3% 4% 7% 0%
0%
0% 8% 7%
8%
0%
2%
4%
6%
8%
10%
12%
14%
16%
C D E
PercentofIndexAd
missions
Hospital
Non-infectious
DifferentInfection
Same Infection
DUKE ANTIMICROBIAL STEWARDSHIP OUTREACH NETWORK
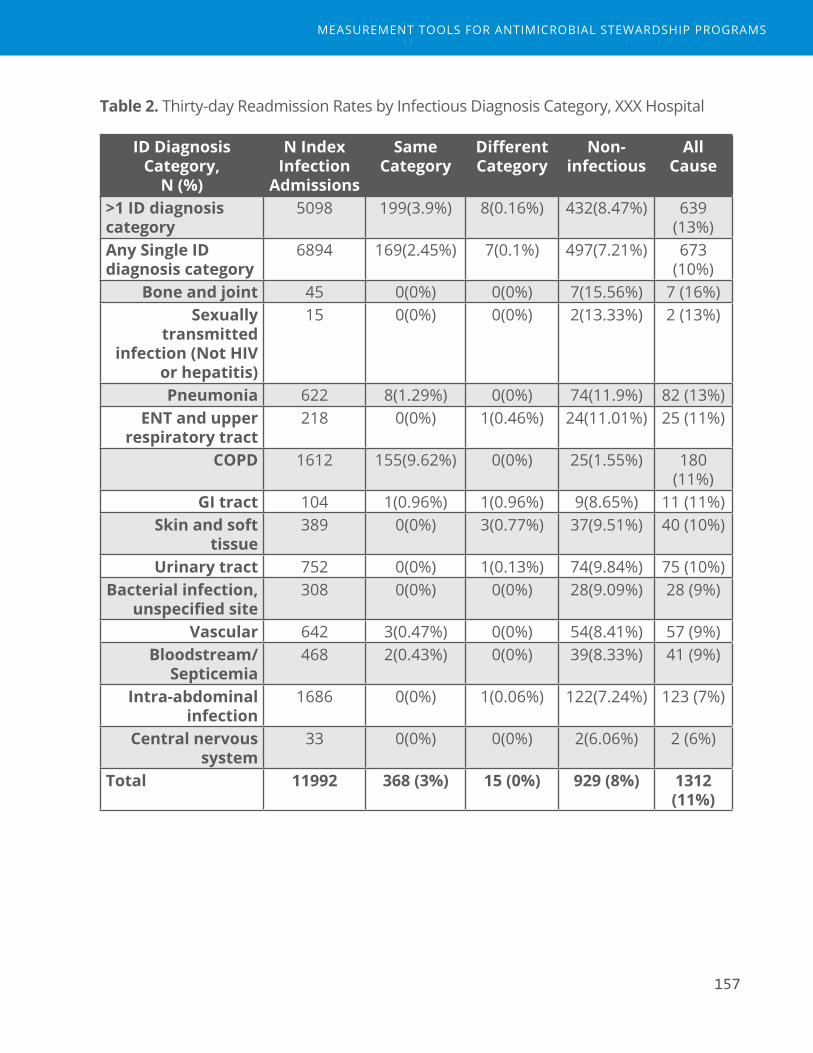
157
Table 2. Thirty-day Readmission Rates by Infectious Diagnosis Category, XXX Hospital
ID Diagnosis Category,
N (%)
N Index Infection
Admissions
Same Category
Different Category
Non-infectious
All Cause
>1 ID diagnosis category
5098 199(3.9%) 8(0.16%) 432(8.47%) 639 (13%)
Any Single ID diagnosis category
6894 169(2.45%) 7(0.1%) 497(7.21%) 673 (10%)
Bone and joint 45 0(0%) 0(0%) 7(15.56%) 7 (16%)Sexually
transmitted infection (Not HIV
or hepatitis)
15 0(0%) 0(0%) 2(13.33%) 2 (13%)
Pneumonia 622 8(1.29%) 0(0%) 74(11.9%) 82 (13%)ENT and upper
respiratory tract 218 0(0%) 1(0.46%) 24(11.01%) 25 (11%)
COPD 1612 155(9.62%) 0(0%) 25(1.55%) 180 (11%)
GI tract 104 1(0.96%) 1(0.96%) 9(8.65%) 11 (11%)Skin and soft
tissue 389 0(0%) 3(0.77%) 37(9.51%) 40 (10%)
Urinary tract 752 0(0%) 1(0.13%) 74(9.84%) 75 (10%)Bacterial infection,
unspecified site 308 0(0%) 0(0%) 28(9.09%) 28 (9%)
Vascular 642 3(0.47%) 0(0%) 54(8.41%) 57 (9%)Bloodstream/
Septicemia 468 2(0.43%) 0(0%) 39(8.33%) 41 (9%)
Intra-abdominal infection
1686 0(0%) 1(0.06%) 122(7.24%) 123 (7%)
Central nervous system
33 0(0%) 0(0%) 2(6.06%) 2 (6%)
Total 11992 368 (3%) 15 (0%) 929 (8%) 1312 (11%)
MEASUREMENT TOOLS FOR ANTIMICROBIAL STEWARDSHIP PROGRAMS
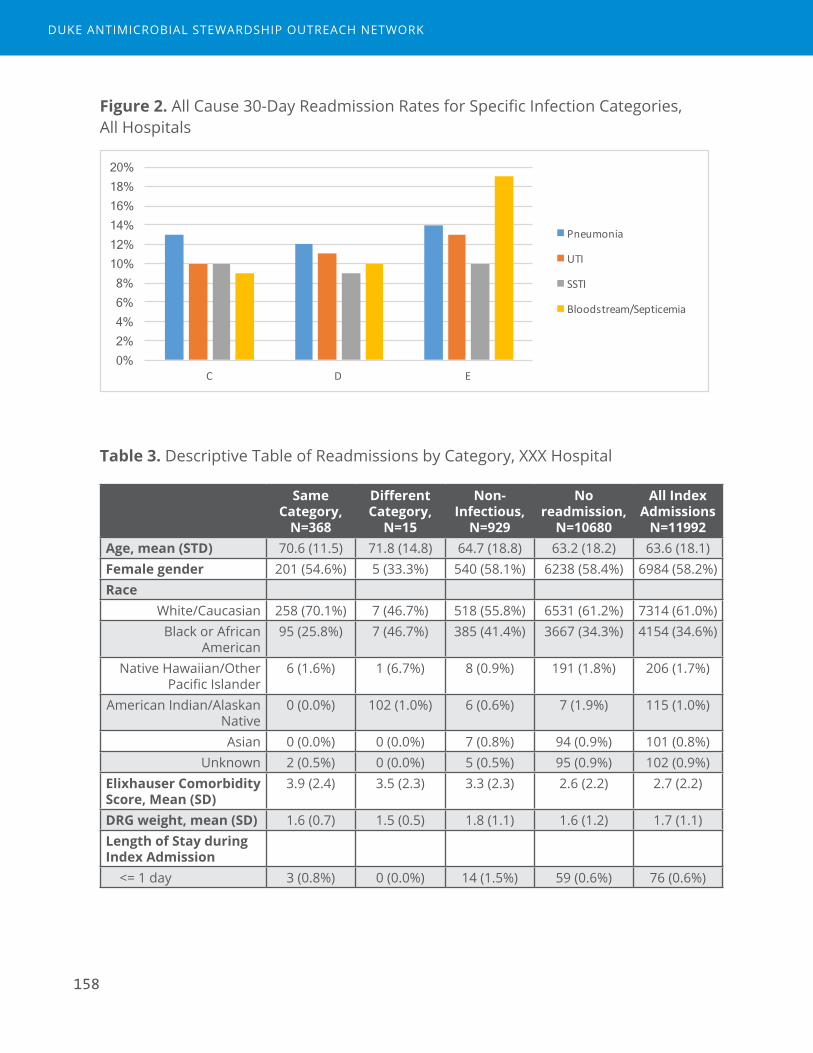
158
Figure 2. All Cause 30-Day Readmission Rates for Specific Infection Categories, All Hospitals
0% 2% 4% 6% 8%
10% 12% 14% 16% 18% 20%
C D E
Pneumonia
UTI
SSTI
Bloodstream/Septicemia
Table 3. Descriptive Table of Readmissions by Category, XXX Hospital
Same Category,
N=368
Different Category,
N=15
Non-Infectious,
N=929
No readmission,
N=10680
All Index Admissions
N=11992Age, mean (STD) 70.6 (11.5) 71.8 (14.8) 64.7 (18.8) 63.2 (18.2) 63.6 (18.1)Female gender 201 (54.6%) 5 (33.3%) 540 (58.1%) 6238 (58.4%) 6984 (58.2%)Race
White/Caucasian 258 (70.1%) 7 (46.7%) 518 (55.8%) 6531 (61.2%) 7314 (61.0%)Black or African
American 95 (25.8%) 7 (46.7%) 385 (41.4%) 3667 (34.3%) 4154 (34.6%)
Native Hawaiian/Other Pacific Islander
6 (1.6%) 1 (6.7%) 8 (0.9%) 191 (1.8%) 206 (1.7%)
American Indian/Alaskan Native
0 (0.0%) 102 (1.0%) 6 (0.6%) 7 (1.9%) 115 (1.0%)
Asian 0 (0.0%) 0 (0.0%) 7 (0.8%) 94 (0.9%) 101 (0.8%)Unknown 2 (0.5%) 0 (0.0%) 5 (0.5%) 95 (0.9%) 102 (0.9%)
Elixhauser Comorbidity Score, Mean (SD)
3.9 (2.4) 3.5 (2.3) 3.3 (2.3) 2.6 (2.2) 2.7 (2.2)
DRG weight, mean (SD) 1.6 (0.7) 1.5 (0.5) 1.8 (1.1) 1.6 (1.2) 1.7 (1.1)Length of Stay during Index Admission <= 1 day 3 (0.8%) 0 (0.0%) 14 (1.5%) 59 (0.6%) 76 (0.6%)
DUKE ANTIMICROBIAL STEWARDSHIP OUTREACH NETWORK
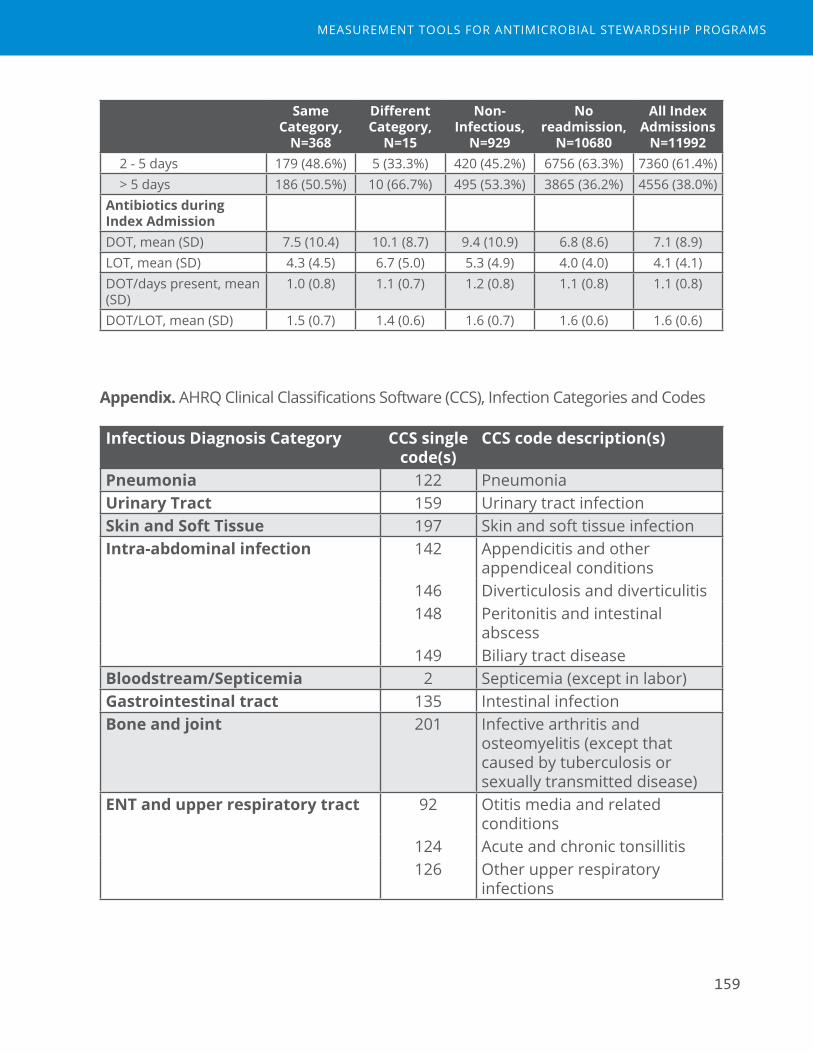
159
Same Category,
N=368
Different Category,
N=15
Non-Infectious,
N=929
No readmission,
N=10680
All Index Admissions
N=11992 2 - 5 days 179 (48.6%) 5 (33.3%) 420 (45.2%) 6756 (63.3%) 7360 (61.4%) > 5 days 186 (50.5%) 10 (66.7%) 495 (53.3%) 3865 (36.2%) 4556 (38.0%)Antibiotics during Index AdmissionDOT, mean (SD) 7.5 (10.4) 10.1 (8.7) 9.4 (10.9) 6.8 (8.6) 7.1 (8.9)LOT, mean (SD) 4.3 (4.5) 6.7 (5.0) 5.3 (4.9) 4.0 (4.0) 4.1 (4.1)DOT/days present, mean (SD)
1.0 (0.8) 1.1 (0.7) 1.2 (0.8) 1.1 (0.8) 1.1 (0.8)
DOT/LOT, mean (SD) 1.5 (0.7) 1.4 (0.6) 1.6 (0.7) 1.6 (0.6) 1.6 (0.6)
Appendix. AHRQ Clinical Classifications Software (CCS), Infection Categories and Codes
Infectious Diagnosis Category CCS single code(s)
CCS code description(s)
Pneumonia 122 PneumoniaUrinary Tract 159 Urinary tract infectionSkin and Soft Tissue 197 Skin and soft tissue infectionIntra-abdominal infection 142 Appendicitis and other
appendiceal conditions146 Diverticulosis and diverticulitis148 Peritonitis and intestinal
abscess149 Biliary tract disease
Bloodstream/Septicemia 2 Septicemia (except in labor)Gastrointestinal tract 135 Intestinal infectionBone and joint 201 Infective arthritis and
osteomyelitis (except that caused by tuberculosis or sexually transmitted disease)
ENT and upper respiratory tract 92 Otitis media and related conditions
124 Acute and chronic tonsillitis126 Other upper respiratory
infections
MEASUREMENT TOOLS FOR ANTIMICROBIAL STEWARDSHIP PROGRAMS
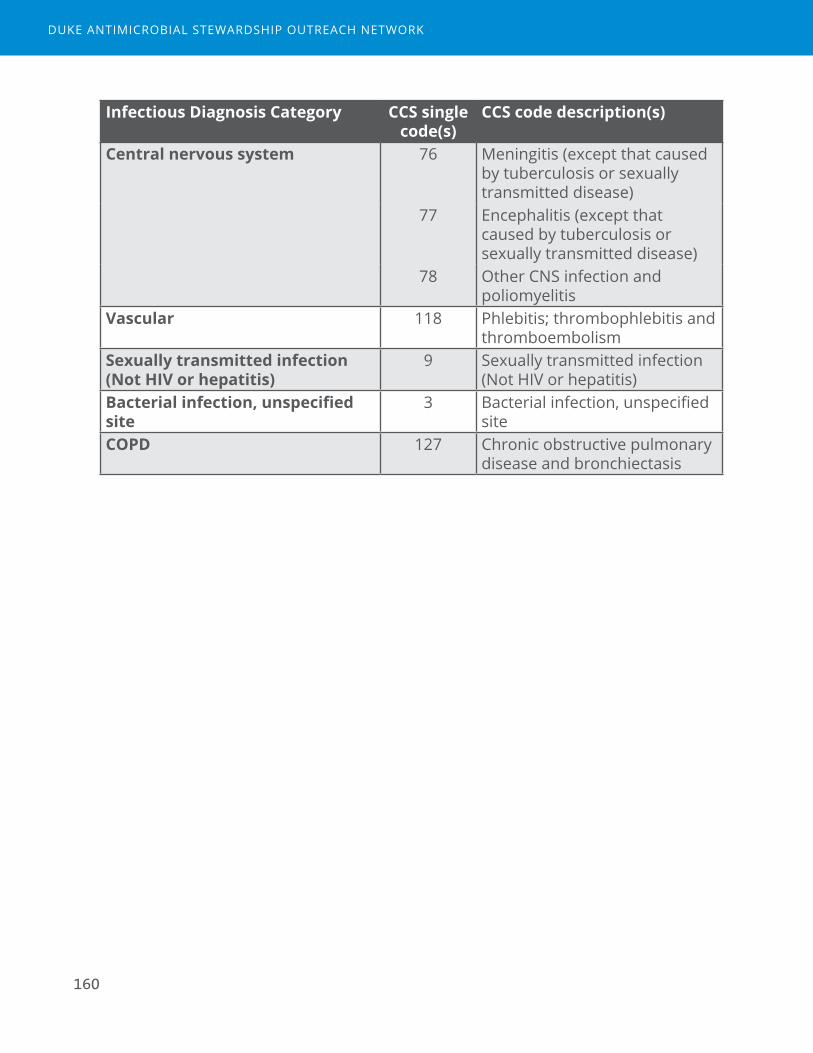
160
Infectious Diagnosis Category CCS single code(s)
CCS code description(s)
Central nervous system 76 Meningitis (except that caused by tuberculosis or sexually transmitted disease)
77 Encephalitis (except that caused by tuberculosis or sexually transmitted disease)
78 Other CNS infection and poliomyelitis
Vascular 118 Phlebitis; thrombophlebitis and thromboembolism
Sexually transmitted infection (Not HIV or hepatitis)
9 Sexually transmitted infection (Not HIV or hepatitis)
Bacterial infection, unspecified site
3 Bacterial infection, unspecified site
COPD 127 Chronic obstructive pulmonary disease and bronchiectasis
DUKE ANTIMICROBIAL STEWARDSHIP OUTREACH NETWORK

161
Hospital X, Report 7
Adherence to Bundle, Sepsis
Introduction
Sepsis has become a high priority initiative for many acute care hospitals, especially with the reporting of the SEP-1 measure to the Center for Medicare and Medicaid (CMS). This measure includes 3-hour and 6-hour bundles of compliance in eligible patients with sepsis (Table).
Table. Sepsis (SEP-1) Bundle Elements
Sepsis Bundle
Criterion Definition for compliance
3 Hour Lactate Initial lactate measurement within 3 hours of presentation of severe sepsis.
Blood cultures Blood cultures drawn prior to antibiotics.Antibiotics Broad spectrum or other antibiotics administered within 3
hours of presentation.Fluid Only if septic shock present: received resuscitation with 30
mL/kg crystalloid fluid within 3 hours of presentation of septic shock
6 Hour Repeat Lactate Only if initial lactate is elevated, a second measurement within 6 hours of presentation of severe sepsis.
Volume assessment
Only if hypotension persists after fluid administration or initial lactate >= 4 mmol/L: received volume assessment within six hours of presentation of septic shock. Volume assessment can be met in 2 potential ways:1. A focused exam including ALL of the following: vital signs,
cardiopulmonary exam, capillary refill evaluation, peripheral pulse evaluation, skin exam
2. 2 of 4 of the following: central venous pressure measurement, central venous O2 measurement, bedside cardiovascular ultrasound, passive leg raise or fluid challenge
Vasopressors Only if hypotension persists after fluid administration, received vasopressors within six hours of presentation of septic shock
MEASUREMENT TOOLS FOR ANTIMICROBIAL STEWARDSHIP PROGRAMS

162
The SEP-1 criteria that involve elements of specific interest to ASPs are in the 3-hour bundle. Admission eligibility criteria for assessment of SEP-1 are described as follows:
Patients admitted to the hospital for inpatient acute care with an ICD-10-CM Principal or Other Diagnosis Code for sepsis (as defined by CMS), age greater than or equal to 18 years, and a length of stay less than or equal to 120 days are included in the SEP Initial Patient Population and are eligible to be sampled. Additional discharges are excluded if they meet any one of the following:
■ Directive for Comfort Care within 3 hours of presentation of severe sepsis
■ Directive for Comfort Care within 6 hours of presentation of septic shock
■ Administrative contraindication to care
■ Transfer in from another acute care facility
■ Patients with severe sepsis who expire within 3 hours of presentation
■ Patients with septic shock who expire within 6 hours of presentation
■ Patients receiving IV antibiotics for more than 24 hours prior to presentation of severe sepsis.
Sepsis initiatives require a multidisciplinary approach. The role of Antimicrobial Stewardship Programs (ASPs) in sepsis initiatives may include the following:
■ Input into sepsis order set build, especially for choice and duration of empiric antibiotics
■ Encouragement to providers to use sepsis order sets
■ Education around sepsis management for providers
■ Appropriate diagnostic testing, including blood culture collection
■ Appropriate choice of empiric agents
■ Appropriate de-escalation when sepsis has been ruled out or a specific diagnosis and/or pathogen has been identified
DUKE ANTIMICROBIAL STEWARDSHIP OUTREACH NETWORK
163
Assessments of compliance include percent compliance with each bundle criterion as well as overall percent compliance in which all criteria in the bundle are met. The Tableau program allows for assessments of adherence to sepsis bundle elements by sepsis severity (simple, severe, and shock) and over time. Additional patient outcomes (mortality, length of stay, costs) can also be assessed. In addition, we assessed the percent of sepsis discharges in which providers used the sepsis order set. The time period examined was calendar year 2016.
Summary of compliance data from Tableau output (attached)
1. PF experienced between 157 and 195 sepsis discharges each month in 2016. Some seasonality was observed in the volume of sepsis patients by month, which likely corresponds to cold and flu season.
Overall Compliance with 3-Hour Bundle
2. Percent compliance with all four 3-Hour bundle criteria varied between 42.6% and 62.6% per month in 2016.
3. Some downward trend at the end of 2016 was observed, with the lowest compliance rate observed in November 2016 (42.6%).
4. The bundle criteria with lowest compliance rates in November and December 2016 included both blood culture collection and antibiotics, which were both in the high 60s to 70%.
Compliance with Antibiotics Criterion
5. Compliance rates for administration of broad spectrum or other antibiotics administered within 3 hours declined slightly during 2016 from 81.8% (January) to 73.2% (December).
Compliance with Blood Culture Criterion
6. Compliance rates for collection of blood cultures prior to administration of antibiotics declined slightly during 2016 from 80.1% (January) to 70.5% (December).
Use of Sepsis Order Sets
7. Use of sepsis order sets among patients diagnosed with sepsis in 2016 was 72% (range per month 69%-83%).
8. The monthly trend of order set use was generally stable through the end of 2016.
Additional Outcomes
9. Length of stay (average 6.3 days) and mortality (5.5%) did not appreciably change over time during 2016 for patients with sepsis.
MEASUREMENT TOOLS FOR ANTIMICROBIAL STEWARDSHIP PROGRAMS

164
DUKE ANTIMICROBIAL STEWARDSHIP OUTREACH NETWORK
165
Hospital 123, Report 6
Excess Use Avoided
Introduction
The goals for this analysis are to understand two aspects of patient-level stewardship interventions:
1. Where stewardship interventions were delivered
2. How stewardship interventions may impact days of therapy for individual patients.
The data used in this analysis come from Epic iVENTs with the category of “Antimicrobial Stewardship,” which are intervention notes placed by clinical pharmacists when a stewardship-focused patient-level intervention is made to primary prescribers.
Part one of the analysis aims to describe the types and volume of stewardship iVENTs. For ASPs with a centralized model, we also describe if iVENTs were delivered by the primary stewards of the ASP versus other decentralized clinical pharmacists. In this analysis, more than one iVENT for the same admission was included in counts and percents.
Part two of the analysis aims to understand the distribution of iVENT interventions among patients exposed to specific antibiotics and with specific syndromes. We evaluated the proportion of admissions with at least 1 iVENT and the days of therapy (DOT) or lengths of therapy (LOT) over the whole admission, utilizing eMAR data from inpatient units. Antimicrobials used in the analysis included an antibacterial, antifungal, or antiviral agent as defined in the NHSN AU module given with an intravenous, intramuscular, or digestive route (excluded inhaled). We also describe the proportion of antimicrobial admissions who received iVENTs among study hospitals.
For all analyses, the time period evaluated was 6 months from April to September 2016. In Figure 3, Hospital 123 is Hospital C.
MEASUREMENT TOOLS FOR ANTIMICROBIAL STEWARDSHIP PROGRAMS

166
Table 1. Key Definitions
Term DefinitionAntimicrobial admission
Hospital admission involving a stay on an inpatient unit, where at least one antimicrobial was administered. Targeted antimicrobial admissions are specific to a particular agent.
Length of Therapy Count of calendar days of antimicrobial exposure irrespective of number of antimicrobial agents.
Days Present Count of calendar days a patient is present on an inpatient unit for any portion of the calendar day. Days of transfer between inpatient units are not double counted.
Part 1: Types and Volume of iVENTs
Table 1. iVENT Descriptive Data*
TotalN %
Subtype 1185Missing 415 35%
Renal dosing 605 51%DC antimicrobial therapy 38 3%
Dose / Frequency adjustment 37 3%Restricted abx monitoring 24 2%
Duration of therapy change 14 1%Drug change 13 1%
Narrow antimicrobial therapy 8 1%Broaden antimicrobial therapy 7 1%
Add antimicrobial therapy 6 1%Alert: Allergy 5 1%
Alert: Drug-Drug interaction 5 1%IV to PO 5 1%
ID consult recommended 3 1%
DUKE ANTIMICROBIAL STEWARDSHIP OUTREACH NETWORK
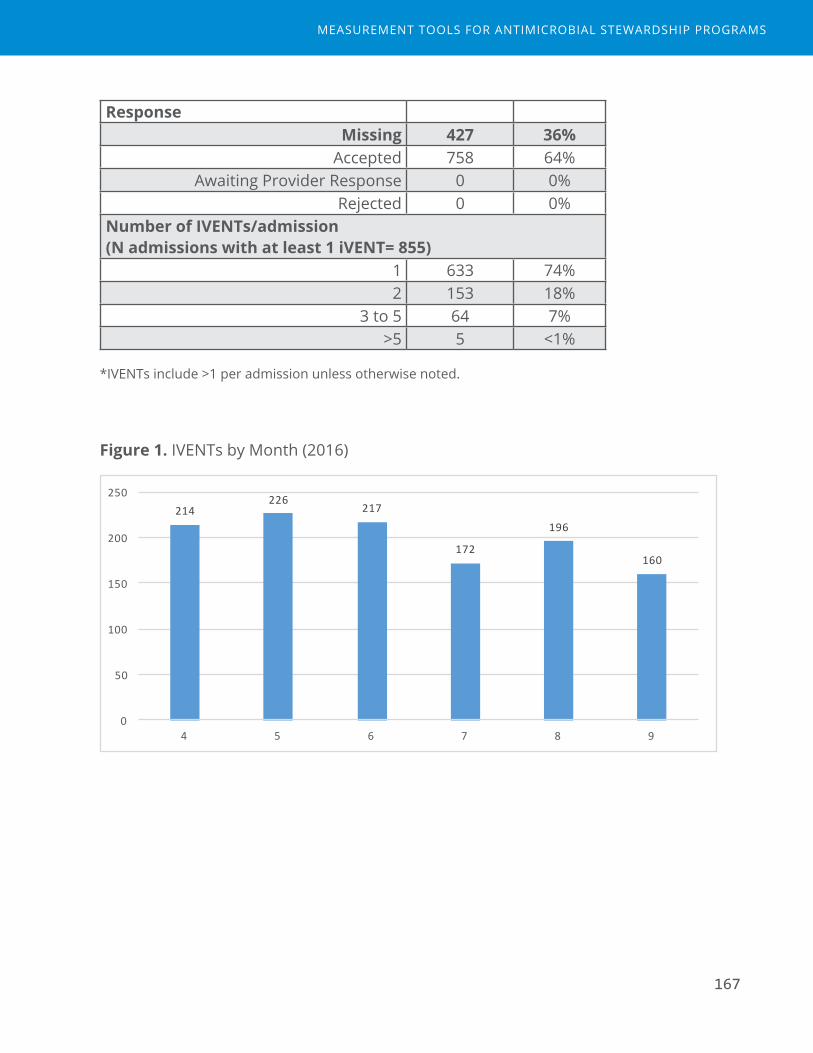
167
ResponseMissing 427 36%
Accepted 758 64%Awaiting Provider Response 0 0%
Rejected 0 0%Number of IVENTs/admission (N admissions with at least 1 iVENT= 855)
1 633 74%2 153 18%
3 to 5 64 7%>5 5 <1%
*IVENTs include >1 per admission unless otherwise noted.
Figure 1. IVENTs by Month (2016)
214226
217
172
196
160
0
50
100
150
200
250
4 5 6 7 8 9
MEASUREMENT TOOLS FOR ANTIMICROBIAL STEWARDSHIP PROGRAMS
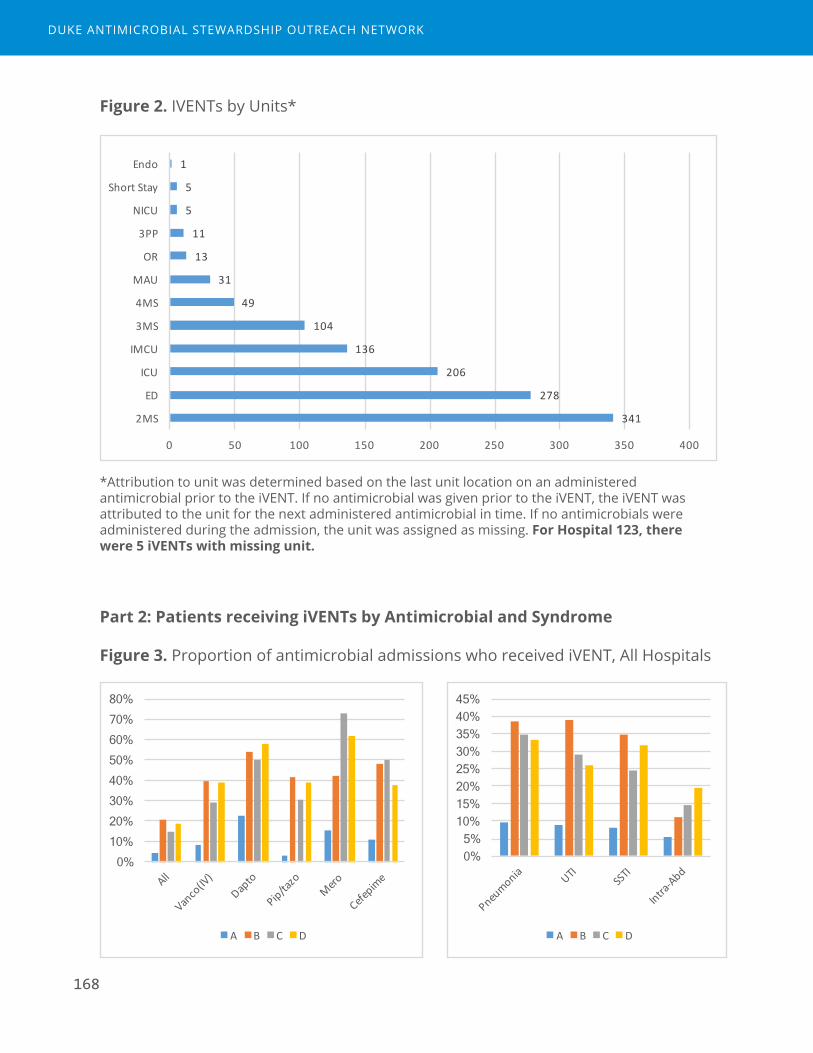
168
Figure 2. IVENTs by Units*
341
278
206
136
104
49
31
13
11
5
5
1
0 50 100 150 200 250 300 350 400
2MS
ED
ICU
IMCU
3MS
4MS
MAU
OR
3PP
NICU
ShortStay
Endo
*Attribution to unit was determined based on the last unit location on an administered antimicrobial prior to the iVENT. If no antimicrobial was given prior to the iVENT, the iVENT was attributed to the unit for the next administered antimicrobial in time. If no antimicrobials were administered during the admission, the unit was assigned as missing. For Hospital 123, there were 5 iVENTs with missing unit.
Part 2: Patients receiving iVENTs by Antimicrobial and Syndrome
Figure 3. Proportion of antimicrobial admissions who received iVENT, All Hospitals
0% 5%
10% 15% 20% 25% 30% 35% 40% 45%
A B C D
0% 10% 20% 30% 40% 50% 60% 70% 80%
A B C D
DUKE ANTIMICROBIAL STEWARDSHIP OUTREACH NETWORK

169
Table 2. Proportion of specific antibiotic admissions who received iVENTs
Admissions Received IVENT
% LOT, median
(IQR)
Days Present
LOT/days present
Days from first administration to subsequent
iVENT*All agents (NHSN) 4767 703 15% 2 (2-4) 4 (3-7) 0.67 (0.40-0.88) 0 (0-2)
Targeted agents for PAFVancomycin (IV) 947 274 29% 3 (2-4) 6 (4-10) 0.36 (0.23-0.53) 2 (1-3)
Daptomycin 30 15 50% 1 (1-2) 7.5 (5-14) 0.20 (0.13-0.38) 0 (0-0)
Linezolid (IV or PO)
37 20 54% 4 (2-5) 9 (7-14) 0.33 (0.20-0.50) 0 (0-3.5)
Piperacillin/tazobactam
999 302 30% 3 (2-5) 6 (4-9) 0.67 (0.40-0.80) 0 (0-2)
Meropenem 77 56 73% 4 (3-7) 10 (7-17) 0.44 (0.23-0.67) 0 (0-1)
Ertapenem 17 6 35% 1 (1-1) 4 (7-13) 0.14 (0.08-0.20) 0 (0-1)
Cefepime 201 100 50% 3 (2-5) 7.5 (5-11) 0.50 (0.29-0.67) 0 (0-1)
Ceftriaxone 801 98 12% 2 (1-4) 5 (4-7.5) 0.50 (0.33-0.67) 1 (0-2)
Targeted agents for PK/PDAmikacin (IV) 0
Gentamicin (IV) 0
Tobramycin (IV) 3 3 100% 1 (1-2) 9 (1-13) 0.15 (0.11-1.0) 0 (0-10)
Targeted agents for IV/PO switchAzithromycin (IV) 273 38 14% 2 (1-3) 5 (4-7) 0.50 (0.29-0.67) 2 (0-3)
Doxycycline (IV) 90 17 19% 3 (2-5) 6 (4-9) 0.60 (0.33-0.75) 1 (0-2)
Levofloxacin (IV) 754 247 33% 2 (1-3) 6 (4-9) 0.33 (0.25-0.50) 0 (0-2)
Moxifloxacin (IV) 0
Ciprofloxacin (IV) 281 56 20% 2 (1-4) 4 (3-7) 0.50 (0.33-0.75) 1 (0-2)
Clindamycin (IV) 337 42 12% 2 (2-3) 4 (3-7) 0.50 (0.33-0.80) 1 (0-3)
Linezolid (IV) 29 18 62% 4 (2-4) 11 (7-16) 0.26 (0.19-0.45) 0 (0-3)
Fluconazole (IV) 93 32 34% 4 (2-8) 14 (7-36.5) 0.29 (0.88-0.14) 0 (0-4)
*among admissions with iVENTs.
Table 3. Proportion of admissions with infectious syndromes who received iVENTs.
Syndrome Admissions Received iVENT
% LOT per admission
Days Present
LOT/days present
Days from first administration to subsequent
iVENT
Pneumonia 726 253 35% 5 (3-7) 6 (4-9) 0.75 (0.60-0.89) 0 (0-2)
UTI 734 214 29% 3 (2-6) 5 (4-8) 0.67 (0.50-0.86) 0 (0-2)
SSTI 404 98 24% 4 (3-7) 5 (4-9) 0.83 (0.67-1.0) 1 (0-3)
Intra-abd 728 105 14% 3 (2-5) 4 (3-7) 0.75 (0.50-1.0) 0 (0-2)
UTI=urinary tract infection; SSTI=skin and soft tissue infection; Intra-abd=intra-abdominal infection
MEASUREMENT TOOLS FOR ANTIMICROBIAL STEWARDSHIP PROGRAMS

170
DDUKE ANTIMICROBIAL STEWARDSHIP OUTREACH NETWORK

Measurement Tools for Antimicrobial Stewardship Programs
DAppendix D: Appendix References

172
DUKE ANTIMICROBIAL STEWARDSHIP OUTREACH NETWORK

Appendix References
1. American Hospital Formulary Service Drug Information: Pharmacologic-Therapeutic Classification. 2016. (Accessed March 31, 2016, at http://www.ahfsdruginformation.com/ahfs-pharmacologic-therapeutic-classification/.)
2. Centers for Disease Control and Prevention. National Healthcare Safety Network: Antimicrobial Use and Resistance (AUR) Options. (Accessed March 31, 2016, at http://www.cdc.gov/nhsn/acute-care-hospital/aur/index.html )
3. Centers for Disease Control and Prevention, National Healthcare Safety Network: MDRO Module. (Accessed March 31, 2016, at http://www.cdc.gov/nhsn/PDFs/pscManual/12pscMDRO_CDADcurrent.pdf.)
4. Kullar R, Goff DA, Schulz LT, Fox BC, Rose WE. The "epic" challenge of optimizing antimicrobial stewardship: the role of electronic medical records and technology. Clinical infectious diseases : an official publication of the Infectious Diseases Society of America 2013;57:1005-13.
173
MEASUREMENT TOOLS FOR ANTIMICROBIAL STEWARDSHIP PROGRAMS