
DEVELOPING NPCR Data Quality Indicators to Improve Population-Based Central Cancer Registry Data...
39
DEVELOPING DEVELOPING NPCR Data Quality Indicators to Improve Population-Based Central Cancer Registry Data Karen Ledford, RHIA, CTR C Cardinez, G Clutter, R Intlekofer, M Lewis, F Michaud, J Nichols, H Weir, R Wilson
Transcript of DEVELOPING NPCR Data Quality Indicators to Improve Population-Based Central Cancer Registry Data...

DEVELOPINGDEVELOPINGNPCR Data Quality Indicators to
Improve Population-Based Central Cancer Registry Data
Karen Ledford, RHIA, CTR
C Cardinez, G Clutter, R Intlekofer, M Lewis, F Michaud, J Nichols, H Weir, R Wilson

Objective• NPCR Goals
– High quality data submitted to NPCR-CSS
– Continuous quality improvement of data

Background• NPCR Cancer Surveillance System
(NPCR-CSS)– Annual data submission– Critical and non-critical data items and edits
• NPCR-CSS Data Evaluation Reports– Feedback to individual registries– Completeness, timeliness, quality (edits only)
Methods• Quality Improvement Workgroup
– Internal CDC-NPCR – Developed NPCR Quality Improvement Plan
• Evaluated reported data items not included in Data Evaluation Reports
• Evaluated data items required to be collected but not reported
• Reviewed quality indicators evaluated by SEER

Results• NPCR-CSS Annual Data Submission
– CORE Data (changed from Critical)• Describes basic cancer incidence• Primary site, histology, laterality, age, race/ethnicity,
stage– ADVANCED Data (changed from Non-critical)
• Identifies and describes high risk populations and survival
• County, census tract, treatment, vital status

Results• NPCR Data Quality Indicator Graphs
– Based on analysis of 24 month data– 7 indicators in a set of 11 graphs– Comparison across NPCR registries– Distributed December 2004– Feedback
• Each state• Logistics Workgroup

Data Quality Indicators• % Other, Ill-defined, and NOS Primary Site• % Non-specific Morphology• % Unknown Diagnostic Confirmation or Not
Microscopically Confirmed• % Unknown or Unspecified Laterality for Paired
Organs• % Death Certificate Only• % Unknown Summary Stage (all sites, breast,
colorectal, lung & bronchus, prostate)

Sample DQI Graph% Other, Ill-defined, and NOS Primary Site [400]
All Sites Combined*, Both GendersIndividual State Registries and NPCR Registries Combined, 2001 diagnosis year
0
1
2
3
41 2 3 4 5 6 7 8 9 10 11 12 13 14 15 16 17 18 19 20 21 22 23 24 25 26 27 28 29 30 31 32 33 34 35 36 37 38 39 40 41 42 43 44 45 46
NP
CR
State registries
Perc
enta
ge
Other and ill-defined (C76.0-76.8)Unknown primary site (C80.9)
*Invasive cases only, excludes basal and squamous cell carcinomas of the skin except when these occur on the skin of the genital organs and in situ cancers except urinary bladder.

Results• NPCR-CSS 2005 Data Evaluation Reports
– Included Data Quality Indicator Report• Comparison across years for single registry• Table format• Core and Advanced data • 1998–2002 data years
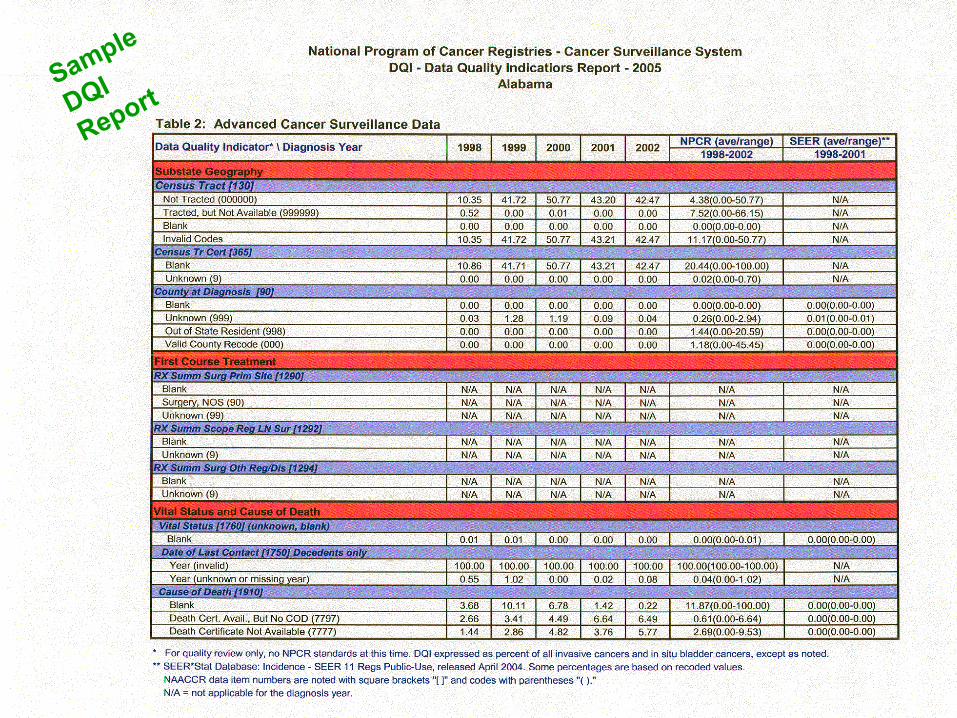
Sample DQI ReportSample
DQI
Report
Results• Reconvened NPCR Logistics
Workgroup– First convened 1999
• Forum for NPCR-CSS Implementation
– Now forum for all NPCR related data issues

Next Steps • Continue to develop quality
improvement plan
• Send additional graphs as topics identified
• Comparison of 2001 to 2003 diagnosis years to assess improvement

Results• NPCR Priorities for Funded
Registries– Collect, report, and use high
quality CORE cancer surveillance data
– Move toward same for ADVANCED cancer surveillance data

DISPLAYINGDISPLAYINGNPCR Data Quality Indicators to
Improve Population-Based Central Cancer Registry Data
Cheryll Cardinez, MSPH
M Lewis, F Michaud, G Clutter, RC Intlekofer, K Ledford, PJ Nichols, H Weir, RJ Wilson

Who Do You See?
Background• Seven measures for Data Quality Indicator graphs
– Other, ill-defined primary site– Morphology– Microscopic confirmation– Laterality– Race– Death clearance only– Stage (all cancers combined, female breast, colon and
rectum, lung and bronchus, prostate)
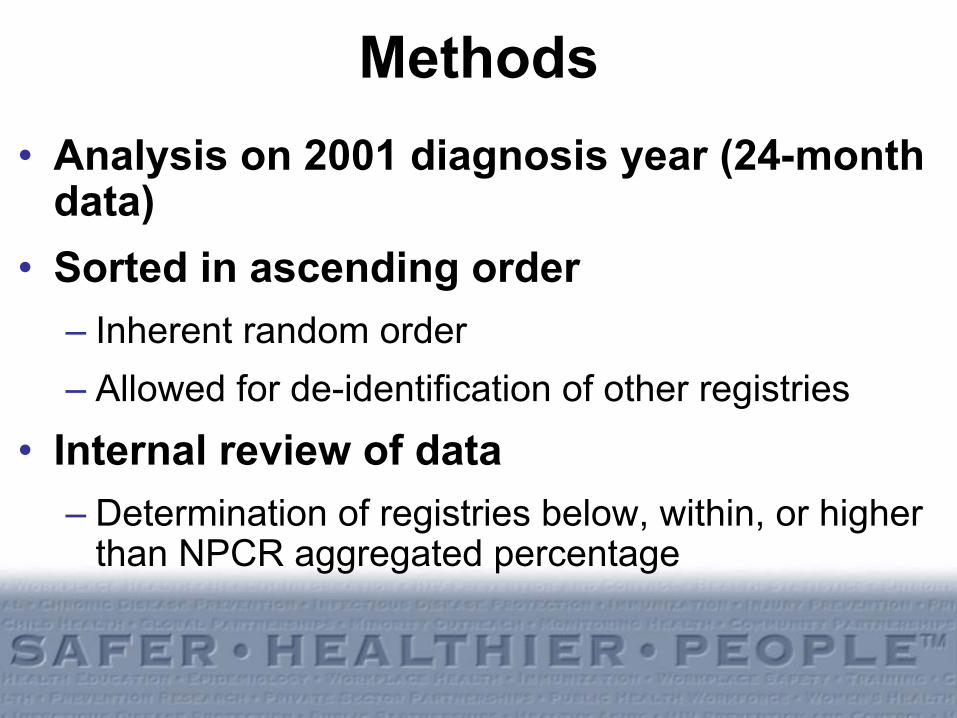
Methods• Analysis on 2001 diagnosis year (24-month
data)• Sorted in ascending order
– Inherent random order– Allowed for de-identification of other registries
• Internal review of data– Determination of registries below, within, or higher
than NPCR aggregated percentage

Results
0
2
4
6
8
10
12
14
16
18
20
22
1 2 3 4 5 6 7 8 9 10 11 12 13 14 15 16 17 18 19 20 21 22 23 24 25 26 27 28 29 30 31 32 33 34 35 36 37 38 39 40 41 42 43 44 45 46N
PCR
State Registries
Perc
enta
ge
% Unknown Summary Stage 2000 [759]All Sites Combined*, Both Genders
Individual State Registries & NPCR Registries Combined, 2001 Diagnosis Year
*Invasive cases only, excludes basal and squamous cell carcinoma of the skin except when these occur on the skin of the genital organs and in situ cancers except urinary bladder. Death certificate only, pathology laboratory only, and unknown primary site cases were also excluded.
below within above

Discussion• Different data presentation allows for:
– Identification of training opportunities– Improvement in registry operations– Incremental improvement of data

Lessons Learned• Separation of stacked bars in microscopic
confirmation graph• Presentation of two different graphs
– Unknown– Not microscopically confirmed

Lessons Learned
0
1
2
3
4
5
6
7
8
1 2 3 4 5 6 7 8 9 10 11 12 13 14 15 16 17 18 19 20 21 22 23 24 25 26 27 28 29 30 31 32 33 34 35 36 37 38 39 40 41 42 43 44 45 46N
PCR
State Registries
Perc
enta
ge
Unknown Not microscopically confirmed
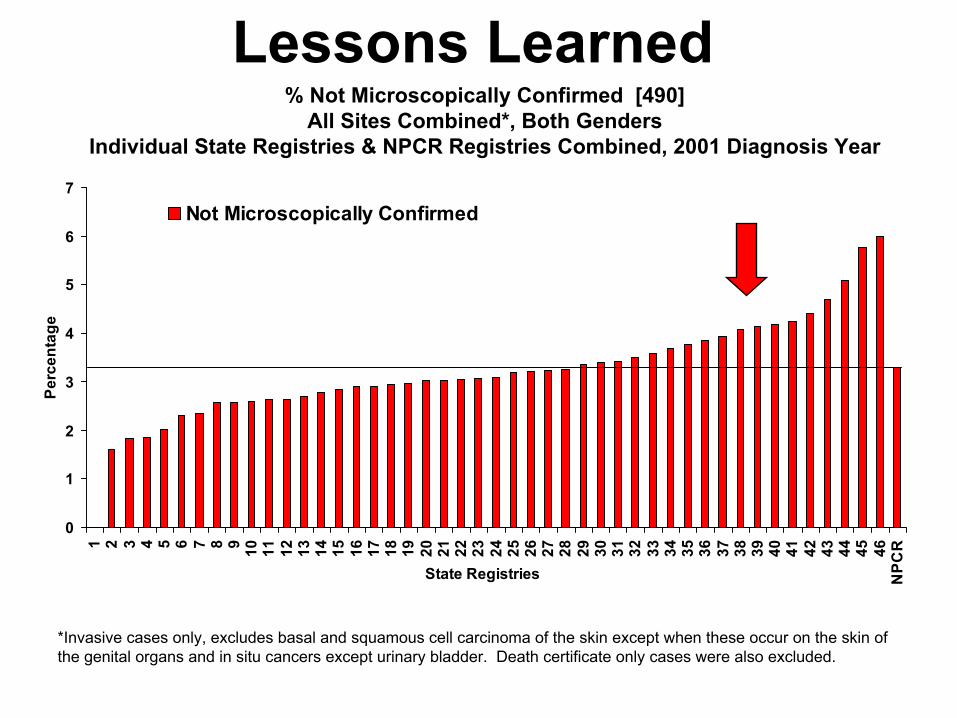
% Unknown Diagnostic Confirmation or Not Microscopically Confirmed [490]All Sites Combined*, Both Genders
Individual State Registries & NPCR Registries Combined, 2001 Diagnosis Year
*Invasive cases only, excludes basal and squamous cell carcinoma of the skin except when these occur on the skin of the genital organs and in situ cancers except urinary bladder. Death certificate only cases were also excluded.

Lessons Learned
0
1
2
3
4
1 2 3 4 5 6 7 8 9 10 11 12 13 14 15 16 17 18 19 20 21 22 23 24 25 26 27 28 29 30 31 32 33 34 35 36 37 38 39 40 41 42 43 44 45 46N
PC
R
State Registries
Perc
enta
ge
Unknown
% Unknown Diagnostic Confirmation [490]All Sites Combined*, Both Genders
Individual State Registries & NPCR Registries Combined, 2001 Diagnosis Year
*Invasive cases only, excludes basal and squamous cell carcinoma of the skin except when these occur on the skin of the genital organs and in situ cancers except urinary bladder. Death certificate only cases were also excluded.
Lessons Learned
0
1
2
3
4
5
6
7
1 2 3 4 5 6 7 8 9 10 11 12 13 14 15 16 17 18 19 20 21 22 23 24 25 26 27 28 29 30 31 32 33 34 35 36 37 38 39 40 41 42 43 44 45 46N
PCR
State Registries
Perc
enta
ge
Not Microscopically Confirmed
% Not Microscopically Confirmed [490]All Sites Combined*, Both Genders
Individual State Registries & NPCR Registries Combined, 2001 Diagnosis Year
*Invasive cases only, excludes basal and squamous cell carcinoma of the skin except when these occur on the skin of the genital organs and in situ cancers except urinary bladder. Death certificate only cases were also excluded.

Next Steps• Addition of bar for aggregated SEER data• Additional data items may be included
– Unknown age at diagnosis
– Unknown month of diagnosis
– Collaborative stage

INTERPRETING & USINGINTERPRETING & USINGNPCR Data Quality Indicators to
Improve Population-Based Central Cancer Registry DataReda J. Wilson, MPH, RHIT, CTR
C Cardinez, G Clutter, R Intlekofer, K Ledford, M Lewis, F Michaud, J Nichols, H Weir

Background• Data quality importance
widely recognized
• NPCR committed to continued improvement

Objective• To utilize indicators documenting
data quality for continuous quality improvement and to identify and document training needs.

Methods• NPCR-CSS data analyzed
• Feedback to CCR to document:
– Data quality
– Identify areas for improvement
– Document training needs
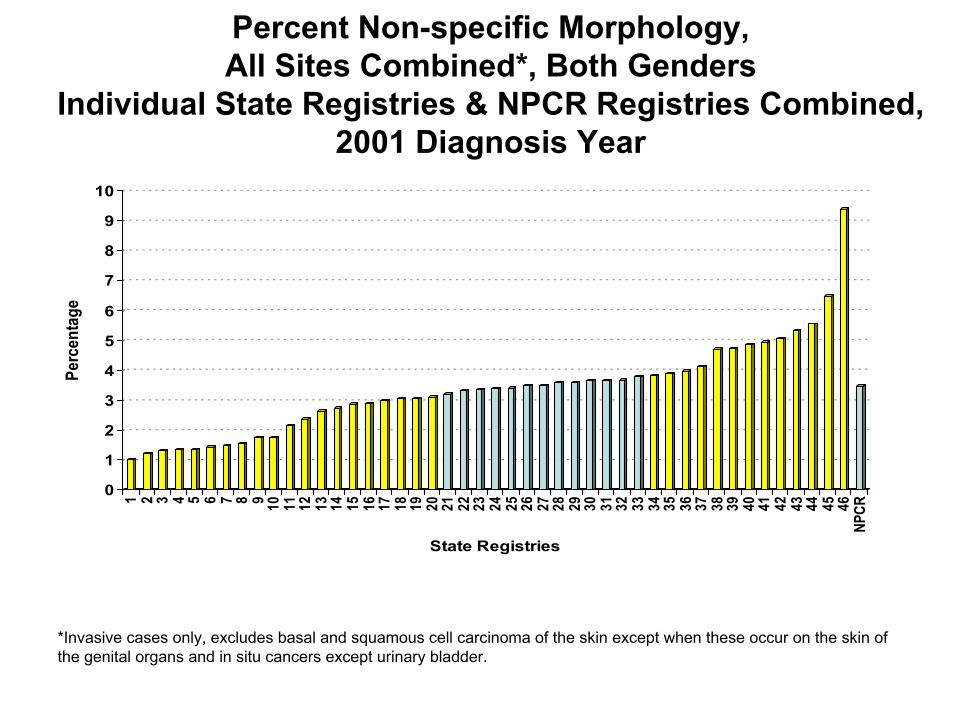
Percent Non-specific Morphology, All Sites Combined*, Both Genders
Individual State Registries & NPCR Registries Combined, 2001 Diagnosis Year
0
1
2
3
4
5
6
7
8
9
10
Perc
enta
ge
1 2 3 4 5 6 7 8 9 10 11 12 13 14 15 16 17 18 19 20 21 22 23 24 25 26 27 28 29 30 31 32 33 34 35 36 37 38 39 40 41 42 43 44 45 46NP
CR
State Registries
*Invasive cases only, excludes basal and squamous cell carcinoma of the skin except when these occur on the skin of the genital organs and in situ cancers except urinary bladder.

Percent Unknown or Unspecified LateralityPaired Organs Only, All Sites Combined*, Both Genders
Individual State Registries & NPCR Registries Combined, 2001 Diagnosis Year
0
2
4
6
8
10
12
14
16
Perc
enta
ge
1 2 3 4 5 6 7 8 9 10 11 12 13 14 15 16 17 18 19 20 21 22 23 24 25 26 27 28 29 30 31 32 33 34 35 36 37 38 39 40 41 42 43 44 45 46N
PCR
State Registries
1 side-unspecified unknown
* *
*Invasive cases only, excludes basal and squamous cell carcinoma of the skin except when these occur on the skin of the genital organs and in situ cancers except urinary bladder.

Percent Unknown RaceAll Sites Combined*, Both Genders
Individual State Registries & NPCR Registries Combined,2001 Diagnosis Year
0
1
2
3
4
5
Perc
enta
ge
1 2 3 4 5 6 7 8 9 10 11 12 13 14 15 16 17 18 19 20 21 22 23 24 25 26 27 28 29 30 31 32 33 34 35 36 37 38 39 40 41 42 43 44 45 46NP
CR
State Registries
*Invasive cases only, excludes basal and squamous cell carcinoma of the skin except when these occur on the skin of the genital organs and in situ cancers except urinary bladder.

Results• Potential factors affecting data
quality– Insufficient source documentation
– Training needs
– Insufficient non-hospital casefinding
– Death Clearance
Results• Importance of Data Quality
Indicators– Affects incidence rates
– Quality data necessary for research
Results• Additional training required
– Reporting sources• Review all documentation• Review all casefinding sources
– CCR• Data item consolidation• Non-hospital casefinding• Death clearance• Self assessment
• Reassess data quality each year
CCR Activities Implemented• Information sharing
– Reporting sources– Policy makers– Advisory groups– Department administration– Other cancer programs
• New processes– CCR policies– Feedback to reporting sources
• Site visits by hospital registrars
Conclusions• Provides means and
justification– Training
– Additional resources
• Documents high quality
Next Steps• NPCR work with grantees
– Assist with improvement opportunities
– Establish baselines
– Determine need for additional standards

Take Home PointsNPCR is dedicated to:• Quality data collection
• Evaluation
• Documenting quality
• Identifying training needs
Contact InformationKaren Ledford, RHIA, CTR [email protected]
770-488-4869
Cheryll Cardinez, MSPH [email protected]
Reda J. Wilson, MPH, RHIT, CTR [email protected]