Developing Load Reduction Estimates Caused by Interrupting and/or Curtailing Large Customers
52
Developing Load Reduction Estimates Caused by Interrupting and/or Curtailing Large Customers By Carl L. Raish 2000 AEIC Load Research Conference
-
Upload
tamesis-tanith -
Category
Documents
-
view
21 -
download
0
description
Developing Load Reduction Estimates Caused by Interrupting and/or Curtailing Large Customers. By Carl L. Raish 2000 AEIC Load Research Conference. Tampa Electric’s Interruptible Rate Class. 32 Customers, 72 Accounts 1,631.5 GWH for Class in 1999 22.8 GWH per Account - PowerPoint PPT Presentation
Transcript of Developing Load Reduction Estimates Caused by Interrupting and/or Curtailing Large Customers
Developing Load Reduction Estimates Caused by Interrupting and/or Curtailing Large Customers
By Carl L. Raish2000 AEIC Load Research Conference

July 31, 2000
2000 AEIC Load Research Conference
2
Tampa Electric’s Interruptible Rate Class
• 32 Customers, 72 Accounts• 1,631.5 GWH for Class in 1999• 22.8 GWH per Account• 7.6 MW Average Non-coincident Peak• 285.9 MW 1999 Class Peak• 174.3 MW at 1999 Winter Peak• 60.8 MW at 1999 Summer Peak

July 31, 2000
2000 AEIC Load Research Conference
3
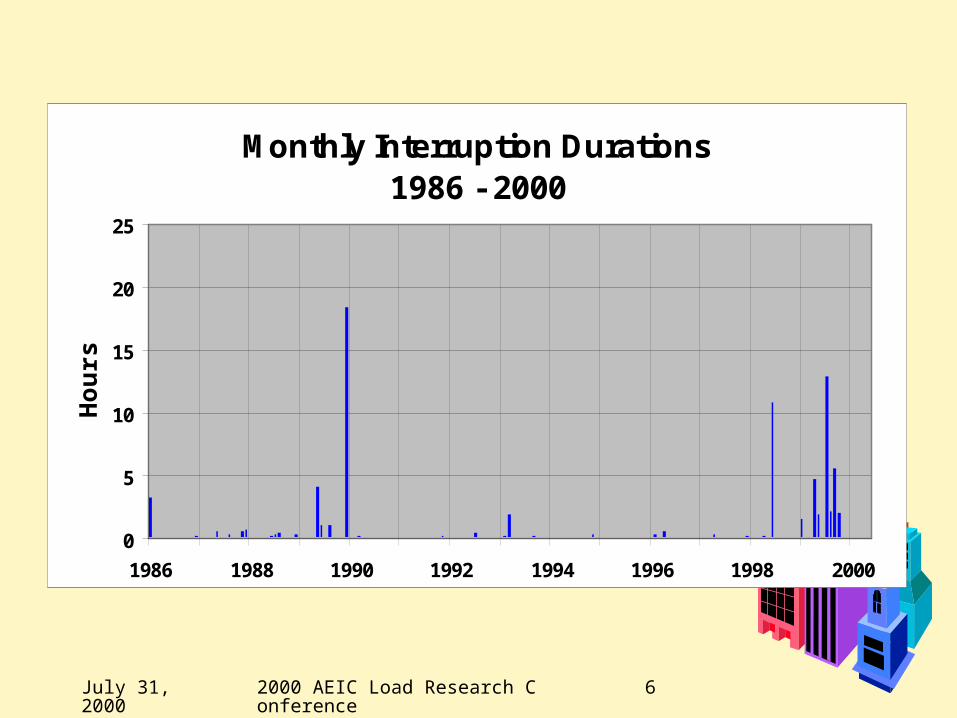
As a result of statewide generation shortages in 1999 the number of
interruptions was at a record level

July 31, 2000
2000 AEIC Load Research Conference
4
Monthly Interruption Frequencies1986 - 2000
0
2
4
6
8
1986 1988 1990 1992 1994 1996 1998 2000

July 31, 2000
2000 AEIC Load Research Conference
5
Annual Interruption Frequencies
0
2
4
6
8
10
12
14
16
18
1986 1988 1990 1992 1994 1996 1998 2000
July 31, 2000
2000 AEIC Load Research Conference
6
Monthly Interruption Durations1986 - 2000
0
5
10
15
20
25
1986 1988 1990 1992 1994 1996 1998 2000
Ho
urs

July 31, 2000
2000 AEIC Load Research Conference
7
Annual Interruption Durations
0
5
10
15
20
25
30
35
1986 1988 1990 1992 1994 1996 1998 2000
Ho
urs

July 31, 2000
2000 AEIC Load Research Conference
8
Reduction Estimates at Individual Account Level
• Need to estimate amount of load interrupted in MW and MWH during 1998 and 1999
• Use account 15-minute data for the year (100% load research sample in place)
• For each interruption, select demands for the day prior to and the day of interruption

July 31, 2000
2000 AEIC Load Research Conference
9
Customer 50089 Day Before and Day of Interruption
0
1
2
3
4
5
6
7
8
0:00 6:00 12:00 18:00 0:00 6:00 12:00 18:00 0:00
MW
July 28 and 29

July 31, 2000
2000 AEIC Load Research Conference
10
Reduction Estimates at Individual Account Level
• Notification is typically sent out 2 hours before actual interruption
• Find 10 closest matching day-pairs (without interruptions) -- match demands for the entire day before and the day of interruption up to 3 hours before start of interruption
• Average the 10 day-pairs together by interval

July 31, 2000
2000 AEIC Load Research Conference
11
Customer 50089 Day Before and Day of Interruption
0
1
2
3
4
5
6
7
8
0:00 6:00 12:00 18:00 0:00 6:00 12:00 18:00 0:00
MW
Jul 28,29 10 Day Avg

July 31, 2000
2000 AEIC Load Research Conference
12
Reduction Estimates at Individual Account Level
• Run linear regression on intervals prior to interruption • Model actual demand as a function of average demand• If R-square > .5 and there are no outliers, then use the
regression estimate.• Otherwise, use the 10-day average demands

July 31, 2000
2000 AEIC Load Research Conference
13
Customer 50089 Before Interruption
3
4
5
6
7
4.5 4.7 4.9 5.1 5.3 5.5 5.7 5.9 6.1 6.3 6.5
10 Day Avg MW
Act
ual
MW
July 31, 2000
2000 AEIC Load Research Conference
14
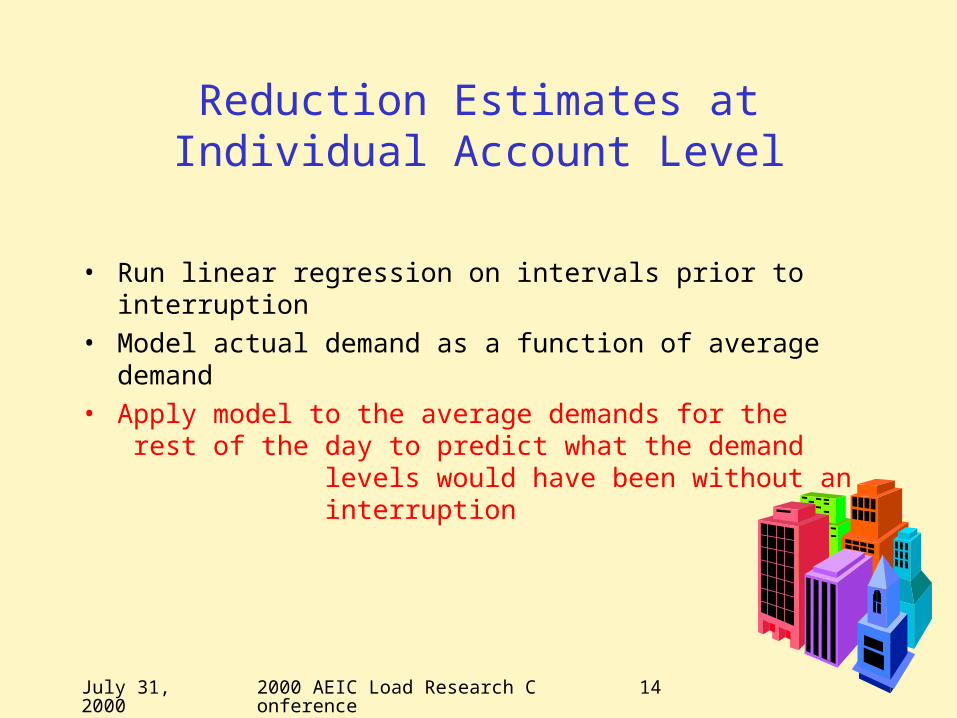
Reduction Estimates at Individual Account Level
• Run linear regression on intervals prior to interruption • Model actual demand as a function of average demand• Apply model to the average demands for the rest of
the day to predict what the demand levels would have been without an interruption

July 31, 2000
2000 AEIC Load Research Conference
15
Customer 50089 Day Before and Day of Interruption
0
1
2
3
4
5
6
7
8
0:00 6:00 12:00 18:00 0:00 6:00 12:00 18:00 0:00
MW
Jul 28,29 10 Day Avg Regress

July 31, 2000
2000 AEIC Load Research Conference
16
Reduction Estimates at Individual Account Level
• Interruption / curtailment starts when the percentage difference between the actual demand and the predicted demand is negative and its absolute value is greater than all differences prior to the interruption
• Interruption / curtailment ends when residual goes positive after the interruption end time or the residual percentage is 2/3 of the maximum

July 31, 2000
2000 AEIC Load Research Conference
17
Customer 50089 Day Before and Day of Interruption
-6
-4
-2
0
2
4
6
8
0:00 6:00 12:00 18:00 0:00 6:00 12:00 18:00 0:00
MW
Jul 28,29 Regress Residual

July 31, 2000
2000 AEIC Load Research Conference
18
Reduction Estimates at Individual Account Level
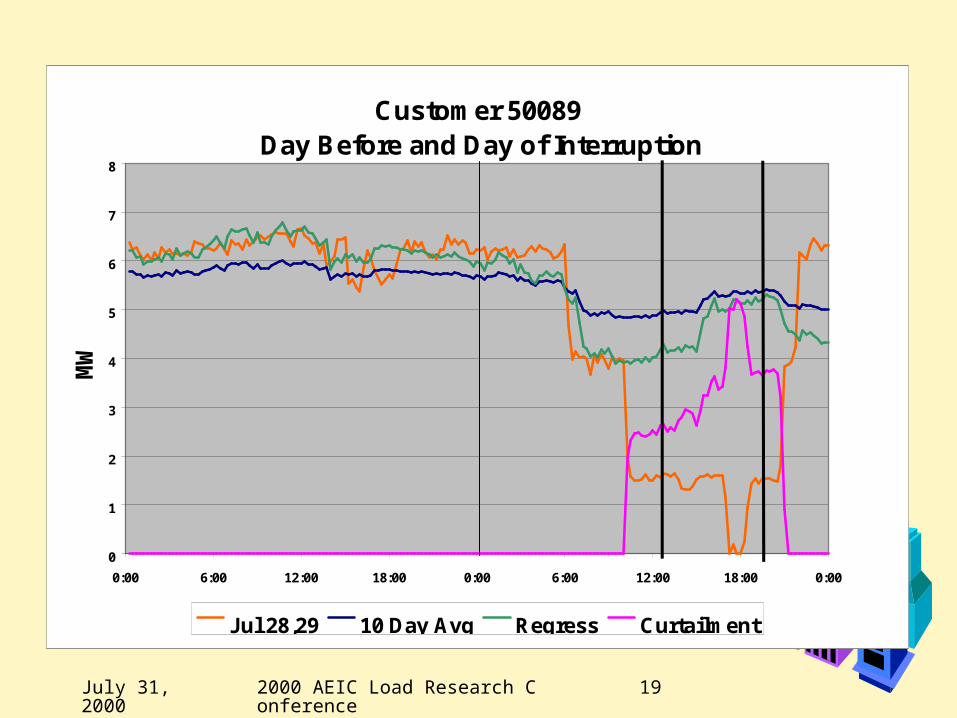
• Interruption / curtailment amount is the difference between the actual and predicted demands
July 31, 2000
2000 AEIC Load Research Conference
19
Customer 50089 Day Before and Day of Interruption
0
1
2
3
4
5
6
7
8
0:00 6:00 12:00 18:00 0:00 6:00 12:00 18:00 0:00
MW
Jul 28,29 10 Day Avg Regress Curtailment

July 31, 2000
2000 AEIC Load Research Conference
20
Customer 20143 Day Before and Day of Interruption
0
0.2
0.4
0.6
0.8
1
1.2
0:00 6:00 12:00 18:00 0:00 6:00 12:00 18:00 0:00
MW
Jul 28,29 10 Day Avg Regress Curtailment

July 31, 2000
2000 AEIC Load Research Conference
21
Customer 20143Before Interruption
0.7
0.8
0.9
1
1.1
1.2
0.8 0.85 0.9 0.95 1 1.05 1.1 1.15
10 Day Avg MW
Act
ual
MW

July 31, 2000
2000 AEIC Load Research Conference
22
Reduction Estimates at IS Class Level
• Sum individual account reduction amounts on an interval-by-interval basis to obtain class totals

July 31, 2000
2000 AEIC Load Research Conference
23
IS Class Jul 29, 1999
0
50
100
150
200
250
300
0:00 3:00 6:00 9:00 12:00 15:00 18:00 21:00 0:00
MW
pred actual curtailed act+curt

July 31, 2000
2000 AEIC Load Research Conference
24
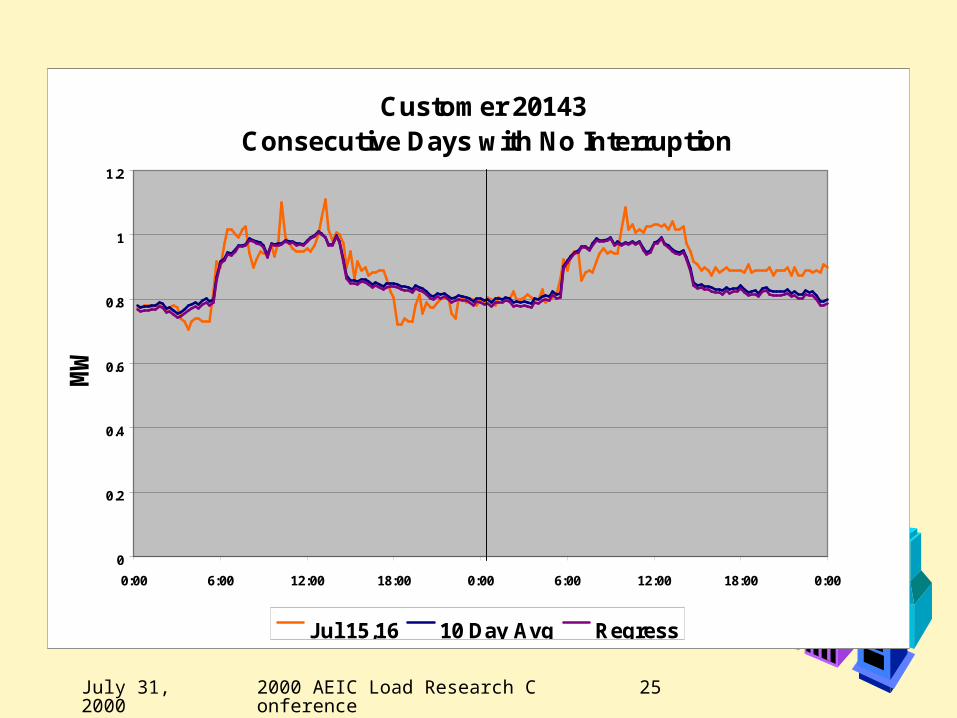
Apply the same method and compare results on some days in
1999 without interruptions
July 31, 2000
2000 AEIC Load Research Conference
25
Customer 20143 Consecutive Days with No Interruption
0
0.2
0.4
0.6
0.8
1
1.2
0:00 6:00 12:00 18:00 0:00 6:00 12:00 18:00 0:00
MW
Jul 15,16 10 Day Avg Regress

July 31, 2000
2000 AEIC Load Research Conference
26
Customer 20143 Consecutive Days with No Interruption
0
0.2
0.4
0.6
0.8
1
1.2
1.4
0:00 6:00 12:00 18:00 0:00 6:00 12:00 18:00 0:00
MW
Jul 22,23 10 Day Avg Regress

July 31, 2000
2000 AEIC Load Research Conference
27
Customer 50089 Consecutive Days with No Interruption
0
1
2
3
4
5
6
0:00 6:00 12:00 18:00 0:00 6:00 12:00 18:00 0:00
MW
Jul 15,16 10 Day Avg Regress

July 31, 2000
2000 AEIC Load Research Conference
28
Customer 50089 Consecutive Days with No Interruption
0
1
2
3
4
5
6
0:00 6:00 12:00 18:00 0:00 6:00 12:00 18:00 0:00
MW
Jul 22,23 10 Day Avg Regress

July 31, 2000
2000 AEIC Load Research Conference
29
IS Class Consecutive Days with No Interruption
0
50
100
150
200
250
300
0:00 6:00 12:00 18:00 0:00 6:00 12:00 18:00 0:00
MW
Jul 15,16 10 Day Avg Regress

July 31, 2000
2000 AEIC Load Research Conference
30
IS Class Consecutive Days with No Interruption
0
50
100
150
200
250
0:00 6:00 12:00 18:00 0:00 6:00 12:00 18:00 0:00
MW
Jul 22,23 10 Day Avg Regress
July 31, 2000
2000 AEIC Load Research Conference
31
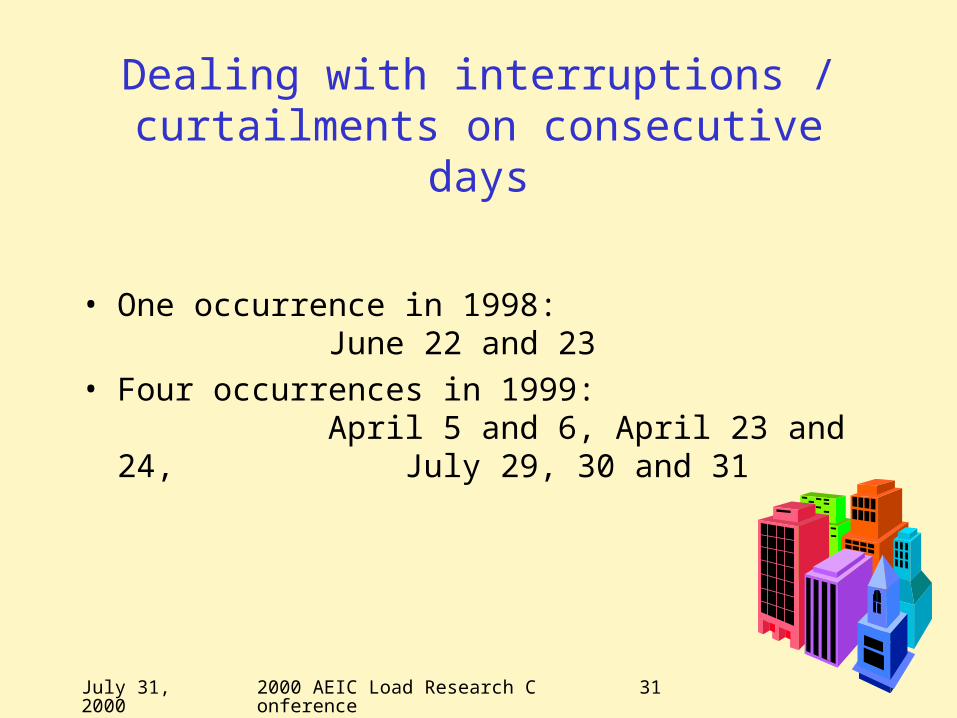
Dealing with interruptions / curtailments on consecutive days
• One occurrence in 1998: June 22 and 23
• Four occurrences in 1999: April 5 and 6, April 23 and 24,
July 29, 30 and 31
July 31, 2000
2000 AEIC Load Research Conference
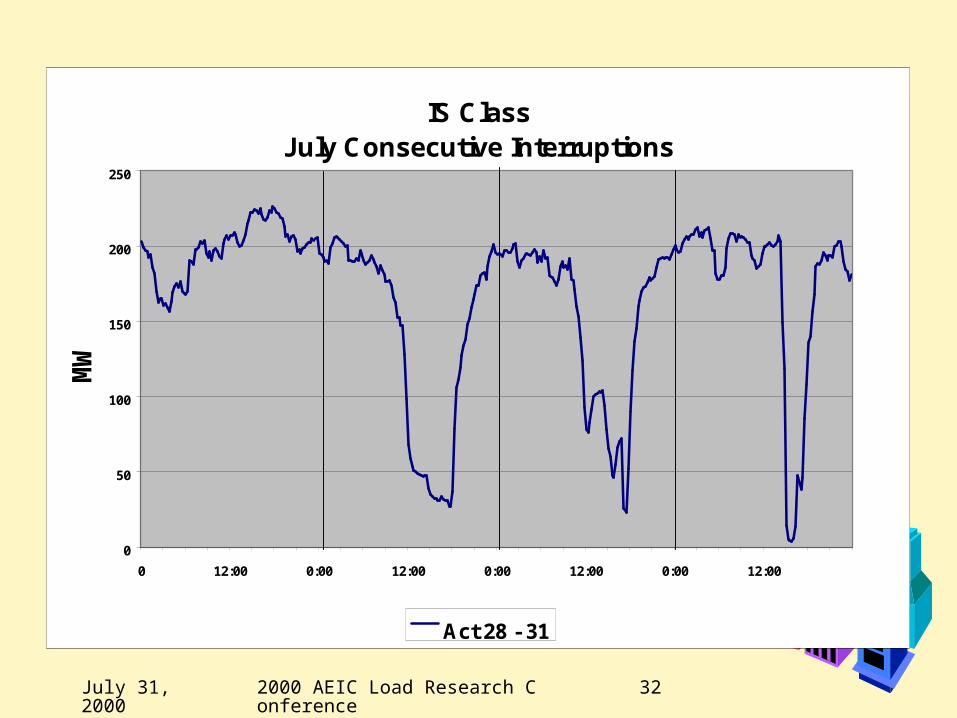
32
IS ClassJuly Consecutive Interruptions
0
50
100
150
200
250
0 12:00 0:00 12:00 0:00 12:00 0:00 12:00
MW
Act 28 - 31

July 31, 2000
2000 AEIC Load Research Conference
33
IS ClassJuly Consecutive Interruptions
0
50
100
150
200
250
300
0 12:00 0:00 12:00 0:00 12:00 0:00 12:00
MW
Act 28 - 31 Act 21 - 23

July 31, 2000
2000 AEIC Load Research Conference
34
IS ClassJuly Consecutive Interruptions
0
50
100
150
200
250
300
0 12:00 0:00 12:00 0:00 12:00 0:00 12:00
MW
Act 28 - 31 Act 21 - 23 Pred 29

July 31, 2000
2000 AEIC Load Research Conference
35
IS ClassJuly Consecutive Interruptions
0
50
100
150
200
250
300
0 12:00 0:00 12:00 0:00 12:00 0:00 12:00
MW
Act 28 - 31 Act 21 - 23 Pred 30

July 31, 2000
2000 AEIC Load Research Conference
36
IS ClassJuly Consecutive Interruptions
0
50
100
150
200
250
300
0 12:00 0:00 12:00 0:00 12:00 0:00 12:00
MW
Act 28 - 31 Act 21 - 23 Pred 31

July 31, 2000
2000 AEIC Load Research Conference
37
IS ClassJul 31, 1999
0
50
100
150
200
250
300
0:00 3:00 6:00 9:00 12:00 15:00 18:00 21:00 0:00
MW
pred actual curtailed act+curt
July 31, 2000
2000 AEIC Load Research Conference
38
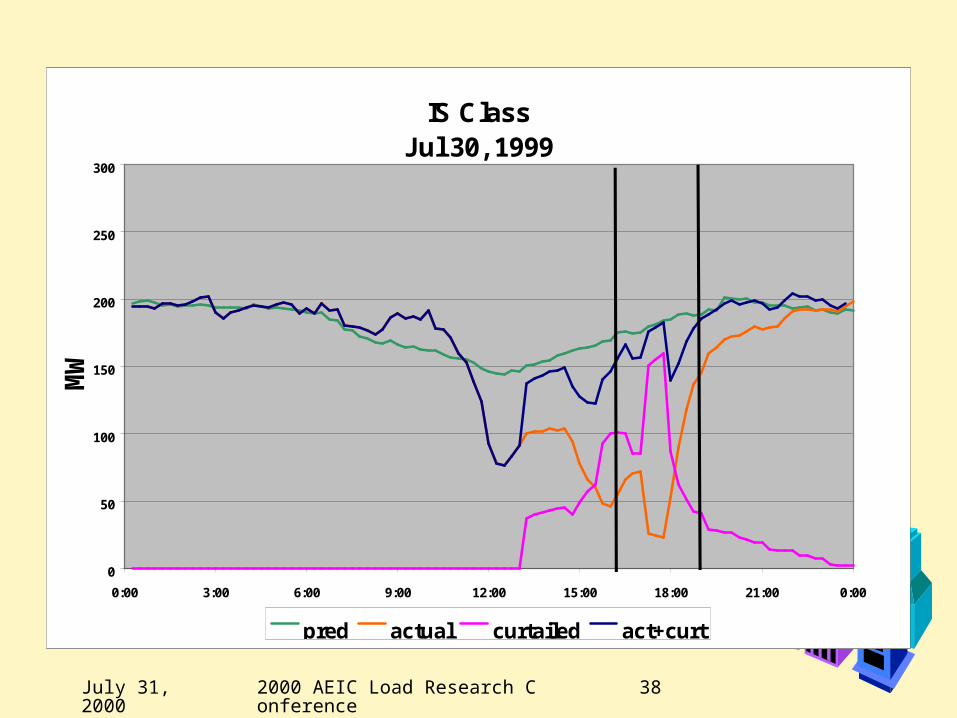
IS ClassJul 30, 1999
0
50
100
150
200
250
300
0:00 3:00 6:00 9:00 12:00 15:00 18:00 21:00 0:00
MW
pred actual curtailed act+curt

July 31, 2000
2000 AEIC Load Research Conference
39
Dealing with voluntary curtailments occurring more than three hours before the start of the actual
interruption
• Three occurrences:June 19, 1998; April 26, 1999;
July 30, 1999

July 31, 2000
2000 AEIC Load Research Conference
40
IS ClassJul 30, 1999
0
50
100
150
200
250
300
0:00 3:00 6:00 9:00 12:00 15:00 18:00 21:00 0:00
MW
pred actual curtailed act+curt

July 31, 2000
2000 AEIC Load Research Conference
41
IS ClassApr 26, 1999
0
50
100
150
200
250
300
0:00 3:00 6:00 9:00 12:00 15:00 18:00 21:00 0:00
MW
pred actual curtailed act+curt

July 31, 2000
2000 AEIC Load Research Conference
42
IS ClassApr 26, 1999
0
50
100
150
200
250
300
0:00 3:00 6:00 9:00 12:00 15:00 18:00 21:00 0:00
MW
pred actual curtailed act+curt
July 31, 2000
2000 AEIC Load Research Conference
43
Shortest Interruption
• April 3, 1998 12:52 - 13:05

July 31, 2000
2000 AEIC Load Research Conference
44
IS ClassApr 3, 1998
0
50
100
150
200
250
300
0:00 3:00 6:00 9:00 12:00 15:00 18:00 21:00 0:00
MW
pred actual curtailed act+curt

July 31, 2000
2000 AEIC Load Research Conference
45
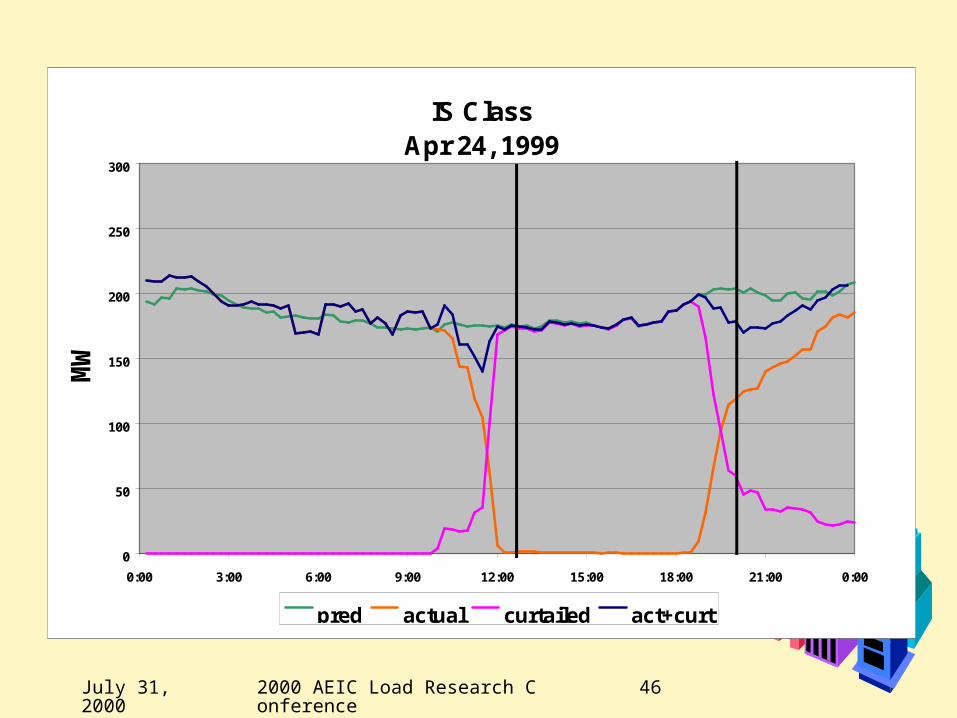
Longest Interruption
• April 24, 1999 12:30 - 20:04
July 31, 2000
2000 AEIC Load Research Conference
46
IS ClassApr 24, 1999
0
50
100
150
200
250
300
0:00 3:00 6:00 9:00 12:00 15:00 18:00 21:00 0:00
MW
pred actual curtailed act+curt

July 31, 2000
2000 AEIC Load Research Conference
47
Winter Morning Interruption
• January 6, 1999 06:37 - 08:14

July 31, 2000
2000 AEIC Load Research Conference
48
IS ClassJan 6, 1999
0
50
100
150
200
250
300
0:00 3:00 6:00 9:00 12:00 15:00 18:00 21:00 0:00
MW
pred actual curtailed act+curt
July 31, 2000
2000 AEIC Load Research Conference
49
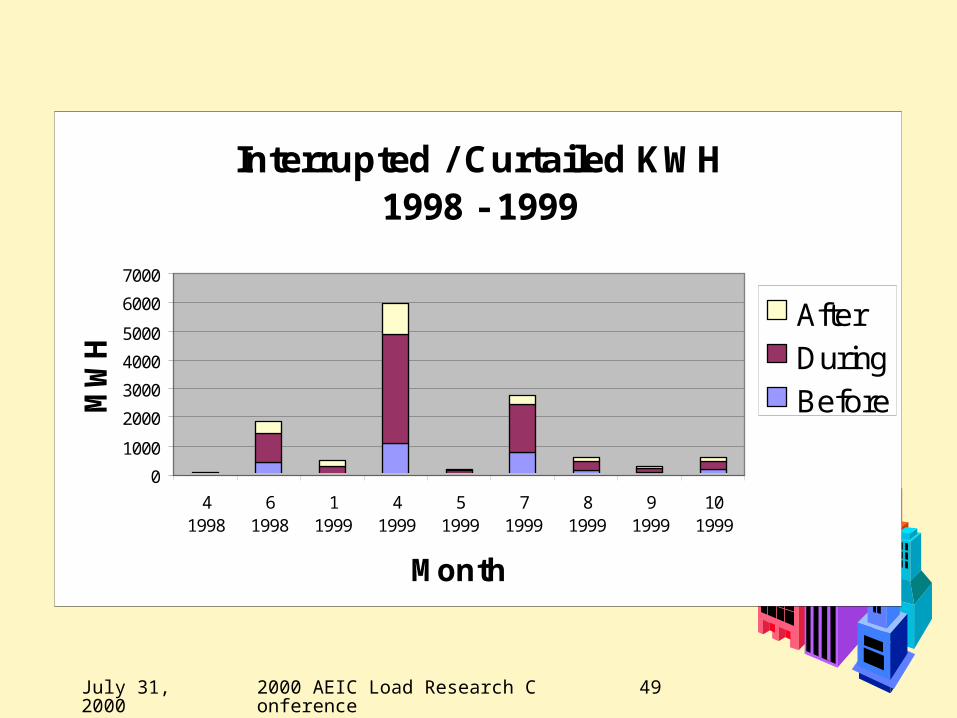
Interrupted / Curtailed KWH1998 - 1999
0
1000
2000
3000
4000
5000
6000
7000
41998
61998
11999
41999
51999
71999
81999
91999
101999
Month
MW
H
AfterDuringBefore

July 31, 2000
2000 AEIC Load Research Conference
50
MWH Interrupted / Curtailed1998
22%
56%
22%
before
during
after

July 31, 2000
2000 AEIC Load Research Conference
51
MWH Interrupted / Curtailed1999
21%
61%
18%
before
during
after

July 31, 2000
2000 AEIC Load Research Conference
52
Follow-up Analysis
• Analyze the impact on Individual Customer and IS Class load as a result of third party purchases
• Focus on impacts associated with new notification system during May 2000
• Customer notification includes hourly forecasts of:– Probability of Interruption– Probability of third party purchase– Third party purchase price levels– Duration of purchase