Developing Graphical User Interfaces in Python using PyQt ...
38
TKP4555 Advanced Simulation Developing Graphical User Interfaces in Python using PyQt for Laboratory Use Brittany Hall November 30, 2017
Transcript of Developing Graphical User Interfaces in Python using PyQt ...

TKP4555 Advanced Simulation
Developing Graphical UserInterfaces in Python usingPyQt for Laboratory Use
Brittany Hall
November 30, 2017

Contents
Contents 1
List of Figures 2
1 Introduction 3
2 Experiment Description 52.1 General Description . . . . . . . . . . . . . . . . . . . . . . . . 5
3 PyQt Modules 63.1 Introduction . . . . . . . . . . . . . . . . . . . . . . . . . . . . 63.2 Widgets . . . . . . . . . . . . . . . . . . . . . . . . . . . . . . 7
3.2.1 Window and Dialog Widgets . . . . . . . . . . . . . . . 73.3 Layout Managers . . . . . . . . . . . . . . . . . . . . . . . . . 8
3.3.1 Style . . . . . . . . . . . . . . . . . . . . . . . . . . . . 83.3.2 Layouts . . . . . . . . . . . . . . . . . . . . . . . . . . 93.3.3 Example . . . . . . . . . . . . . . . . . . . . . . . . . . 9
3.4 Threads, Signals and Slots . . . . . . . . . . . . . . . . . . . . 103.4.1 Threads . . . . . . . . . . . . . . . . . . . . . . . . . . 103.4.2 Signals and Slots . . . . . . . . . . . . . . . . . . . . . 113.4.3 Example . . . . . . . . . . . . . . . . . . . . . . . . . . 12
4 Using QtDesigner 144.1 What is Qt Designer? . . . . . . . . . . . . . . . . . . . . . . . 14
4.1.1 pyuic4 . . . . . . . . . . . . . . . . . . . . . . . . . . . 154.2 Installing FellesLab Widgets . . . . . . . . . . . . . . . . . . . 15
5 Two Tanks GUI 175.1 Installation . . . . . . . . . . . . . . . . . . . . . . . . . . . . 175.2 How it Works . . . . . . . . . . . . . . . . . . . . . . . . . . . 185.3 Custom Widget Examples . . . . . . . . . . . . . . . . . . . . 21
5.3.1 Start, Stop, Pause Buttons Widget . . . . . . . . . . . 215.3.2 PID Controller Input Widget . . . . . . . . . . . . . . 255.3.3 Plotting Widget . . . . . . . . . . . . . . . . . . . . . . 30
6 Conclusion 35
1

List of Figures
2.1 Illustration of the two tank experiment . . . . . . . . . . . . . 5
3.1 Specifying window geometry in PyQt [3] . . . . . . . . . . . . 83.2 Simple example using layout and window widgets . . . . . . . 103.3 Simple example of use of signals and slots . . . . . . . . . . . 13
4.1 Blank Main Window template in QtDesigner . . . . . . . . . . 144.2 QtDesigner Widget Box with QFellesLabWidgets . . . . . . . 16
5.1 Two tanks laboratory GUI . . . . . . . . . . . . . . . . . . . . 185.2 Open and closed valves, respectively . . . . . . . . . . . . . . . 185.3 GUI Manual Mode . . . . . . . . . . . . . . . . . . . . . . . . 195.4 GUI Automatic Mode . . . . . . . . . . . . . . . . . . . . . . 195.5 State space illustration of start, pause and stop buttons . . . . 205.6 Start, Pause and Stop button widget . . . . . . . . . . . . . . 215.7 Controller GUI . . . . . . . . . . . . . . . . . . . . . . . . . . 265.8 Illustration of real-time plotting utilities . . . . . . . . . . . . 31
2

Chapter 1
Introduction
Software development is a huge industry in the western world and is esti-mated to be worth over US $407.3 billion [9]. One sub-sector of the softwareindustry is the development of graphical user interfaces (GUIs). A GUI al-lows users to interact with electronic devices through graphical icons andvisual indicators instead of using the command line. GUIs were introducedto make computers more user friendly since the command-line interface hasa large learning curve. Users perform actions in a GUI by direct manipu-lation of graphically elements. GUIs can be developed for many differentcapabilities. Commonly used operating systems utilize GUIs: Windows, ma-cOS, Ubuntu, etc [4]. In this report, we focus on the use of GUIs to controlexperimental setups in a laboratory.
Constructing GUIs from scratch requires a large knowledge of program-ming and significant time. This is why some software has been developed tohelp users create GUIs faster and require less programming knowledge. Onesuch software is LabVIEW; LabVIEW is a relatively well known commer-cially available software for applications that require test, measurement, andcontrol with rapid access to hardware and data [5]. It advertises itself as asoftware that helps simplify hardware integration and reduces the complexityof programming required to create a user interface. While this wide range ofcapabilities is attractive, LabVIEW requires a yearly license to be purchasedwith prices ranging from 3200 NOK/year to 53640 NOK/year. Thus, findingan open source alternative is attractive to universities and companies.
PyQt, combined with a communication framework, is one such opensource alternative; it is a Python compatible version of Qt, which is a crossplatform software development kit owned by Nokia that can be used onvarious software and hardware platforms with little or no change to the un-derlying codebase [8]. PyQt is distributed under the General Public License(GPL) meaning that we can use the free version of PyQt as long as we don’tsell our code; if we want to sell our product, we must purchase a commerciallicense of PyQt. It has the benefit of being run as a native application; thus,it has the same capabilities and speed as other native applications. PyQt ismainly used for developing multi-platform applications and GUIs, which iswhy a separate communication framework is required to make it competitiveto LabVIEW. There are open source communication frameworks available
3

in Python so this is not a limiting issue; one example is the Python moduleminimalmodbus which always for communication with instruments from acomputer using the Modbus protocol.
PyQt capabilities are discussed within the framework of a GUI for aspecific laboratory experiment, known as the Two Tanks experiment, in thisreport. It is worth noting that PyQt has many more capabilities that werenot used to create this particular GUI and thus not discussed in this report.A description of the experiment is given in Chapter 2. The main PyQtmodules utilized for the creation of this GUI are explained in general inChapter 3. How each component was created for the GUI is discussed indetail in Chapter 5.
4

Chapter 2
Experiment Description
2.1 General Description
A GUI was created for the Two Tank experiment in the Process ControlLaboratory and is illustrated in Figure 2.1. The setup consists of two tanks,each of which has an inlet and an outlet stream. A thermocouple measuresthe temperature inside each tank. The inlet stream consists of room temper-ature water. On each outlet stream is a solenoid valve; this valve type meansthat the valve is either completely open or closed. A controller is attachedto each solenoid valve.
The two outlet streams connect, after the valves, allowing the outletstreams to mix. A thermocouple is located downstream of the mixing pointand measures the temperature of the mixed stream.
A single usb serial analog to digital converter is used for communication.This allows a computer to receive measurements from the thermocouple,send/receive signals to the solenoid valves to open or close, and send/receivesignals to the controllers. The purpose of this experiment is to tune thecontrollers to get the temperature of the mixed stream to a desired set point.
Figure 2.1: Illustration of the two tank experiment
5

Chapter 3
PyQt Modules
3.1 Introduction
PyQt allows programers to use much of the functionality of Qt in Python;this includes a comprehensive set of widgets, flexible layout managers, stan-dard GUI features for applications, easy communication between applicationcomponents, threading classes, widget styles, input/output and networking,support for QtDesigner, etc [6].
PyQt4 has a number of Python extension modules that makes it conve-nient to program GUIs. For the Two Tank experiment, we utilized the twofollowing main modules: QtCore and QtGui. The QtCore module containsthe core of non-GUI classes, including event loop and Qt’s signal and slotmechanism [6]. The QtGui module contains the majority of the GUI classes.
PyQt4 also has a couple of utility programs that are useful:
• pyuic4 corresponds to the Qt uic utility that converts GUIs createdusing Qt Designer to Python code.
• pyrcc4 corresponds to the Qt rcc utility that embeds resources de-scribed by a resource collection file in a Python module. This is onlyincluded if Qt includes a XML module.
• pylupdate4 corresponds to the Qt lupdate utility and it extracts allof the translatable strings from Python code and creates or updatestranslate files. This is only included if Qt includes the XML module.
The pyuic4 can be used to translate GUIs created in QtDesigner into pythoncode that is then the GUI to be used. How to use pyuic4 is discussed inmore detail in Chapter 5.
Throughout this chapter there are a series of examples that illustratehow to use some PyQt features. Further discussion of how these featureswere used to construct a GUI for the Two Tanks experiment is conducted inChapter 5. Also in Chapter 5, illustrative code is discussed for several of thewidgets constructed for the GUI.
6
3.2 Widgets
The Qt widget module provides a set of UI elements that allow for the cre-ation of classic desktop-style user interfaces. Widgets are the primary ele-ments for creating user interfaces in Qt. They can display data and statusinformation, receive user input, and provide a container for other widgetsthat should be grouped together [3]. A widget not embedded in a parentwidget is called a window.
The QWidget class gives the basic capability to render the screen andhandle user input events. Any UI elements that Qt provides are subclassesof QWidget or are used in connection with a QWidget subclass.
3.2.1 Window and Dialog Widgets
Every GUI needs to have a main window that provides the screen space uponwhich the user interface is built. Windows visually separate applications andtypically allow users to resize and position the applications as desired. Thiscan be created in PyQt by using the QMainWindow class.
QMainWindow is used to set up menus, toolbars, and dock widgets. Toadd a menu bar to the main window, for example, a menu is created and thenadded to the main window’s menu bar using menuBar(). QMainWindow hasits own layout where the programmer can add a menu bar, tool bar, otherdockable widgets, and a status bar. Once actions are created they must beadded to the main window. Both main windows and dialogs can be createdusing QtDesigner or by manually coding them in Python.
If a QWidget is not assigned a parent, it automatically becomes a window.Typically only one window is allowed to not have a parent: the primarywindow.
Dialog windows are used as secondary windows that give the user optionsor choices. These are created using the subclassing QDialog along with wid-gets and layouts. PyQt provides a number of ready-made standard dialogsthat can be used for tasks like opening a file or selecting a font. Dialogwindows can also be used to create a window that confirms a user actuallywants to exit an application when the close button is pushed.
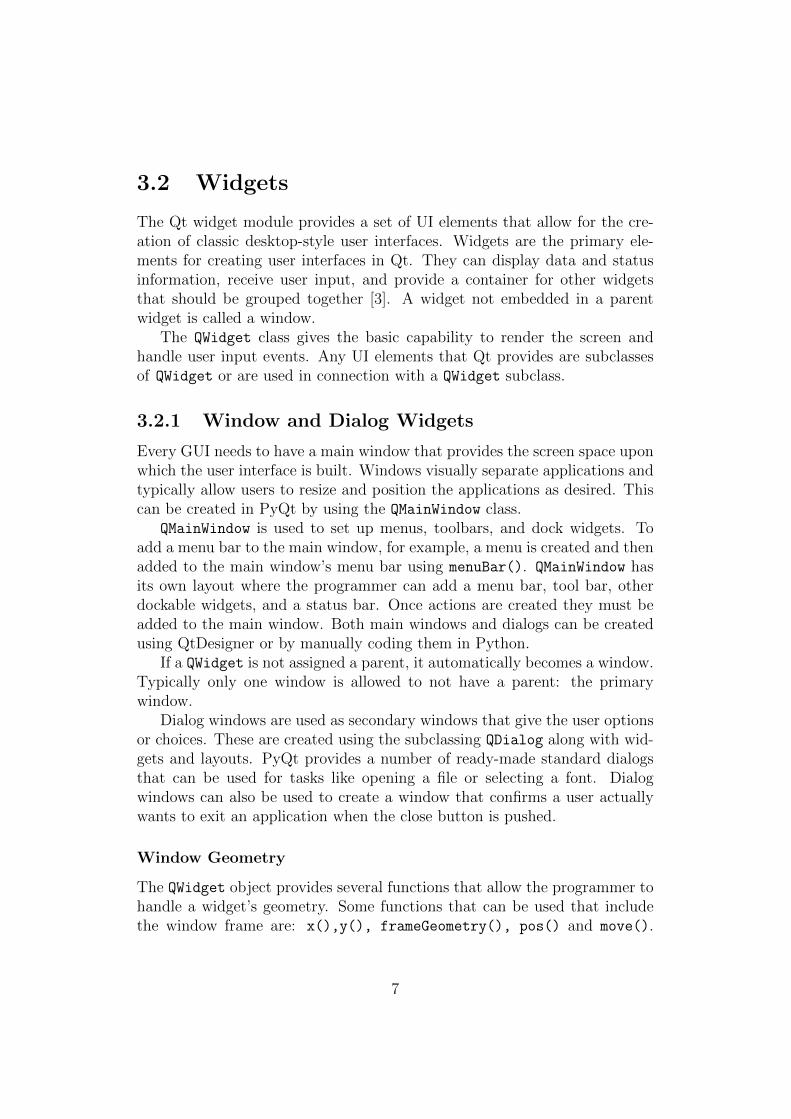
Window Geometry
The QWidget object provides several functions that allow the programmer tohandle a widget’s geometry. Some functions that can be used that includethe window frame are: x(),y(), frameGeometry(), pos() and move().
7

Functions that exclude the window frame (i.e. just affect the widget’s geom-etry) are: geometry(), width(), height(), rect() and size(). Figure3.1 illustrates most of the available functions to specify the geometry of thewindow.
Figure 3.1: Specifying window geometry in PyQt [3]
3.3 Layout Managers
QLayout is the base class of geometry managers. It is an abstract baseclass that is inherited by the concrete classes QBoxLayout, QGridLayout,QFormLayout, and QStackedLayout, which all determine where widgets arelocated in the main window. QLayout takes as input the name of a QWidget
and a parent. This specifies how a widget will appear in the main window.
3.3.1 Style
The style encapsulates the look and feel of a GUI. PyQt utilizes the QStyle
class to do all the drawing so that they look exactly like native widgets. Thismeans that whatever operating system the GUI is run on, it will adopted thestyle of that OS. For more customizable appearances, QStyleSheets can beused in addition to supplement what can already be done in QStyle.
8

3.3.2 Layouts
Layouts are a way to arrange child widgets within their own container. Eachwidget gives its size requirements to the layout through the sizeHint andsizePolicy properties and then the layout automatically distributes the avail-able space. The designer can also specify where to position widgets within awindow as well.
3.3.3 Example
We look at a simple example of generating a window with a grid layout thathas 16 push buttons. This example shows how to create a window, specifythe layout, and create push buttons. The code below utilizes the three classesQApplication, QWidget, QGridLayout and their methods [7].
1 import sys2 from PyQt4 . QtCore import ∗3 from PyQt4 . QtGui import ∗45 def window ( ) :6 app = QApplication ( sys . argv )7 win = QWidget ( )8 g r id = QGridLayout ( )9
10 for i in range ( 1 , 5 ) :11 for j in range ( 1 , 5 ) :12 g r id . addWidget ( QPushButton ( ”B”+str ( i )+str ( j ) ) , i , j )13 win . setLayout ( g r id )14 win . setGeometry (100 ,100 ,200 ,100)15 win . setWindowTitle ( ”PyQt” )16 sys . e x i t ( app . exec ( ) )1718 i f name == ’ ma in ’ :19 window ( )
The result is shown in Figure 3.2.
9

Figure 3.2: Simple example using layout and window widgets
The first three lines define the widget QWidget and specify the layoutQGridLayout. Next, the for loop in lines 10-12 creates the sixteen dif-ferent buttons QPushButton, labels them, and adds them to the grid lay-out (addWidget). Then we add the layout to the widget (setLayout),specify the widget geometry (setGeometry) and specify the window title(setWindowTitle). Finally we specify what to do when the application islaunched. While this is a trivial example, it illustrates how few lines of codeare required to create a window, specify properties like the layout, geometryand window tile, and add widgets to the window.
3.4 Threads, Signals and Slots
3.4.1 Threads
A thread contains different tasks to be performed. A software program maycontain multiple threads with each one having different tasks to be performed.For most GUIs, it is common to create at least two different threads: one forthe main window (main thread), and one that can handle behind the scenetasks (worker thread). This allows users to perform actions in the GUI whilethe data collection still operates.
For a laboratory GUI, it is important to have at least two threads. Onethread that will collect data from the experiment and the other that willhandle any user requests emitted from the GUI. The main thread will beidle until an action is performed in the GUI; then the main thread will takepriority over the worker thread and send the tasks to be performed. Afterthe tasks from the main thread are performed, the worker thread tasks willthen continue. The tasks contained in a thread are specified using signals
10
and slots.
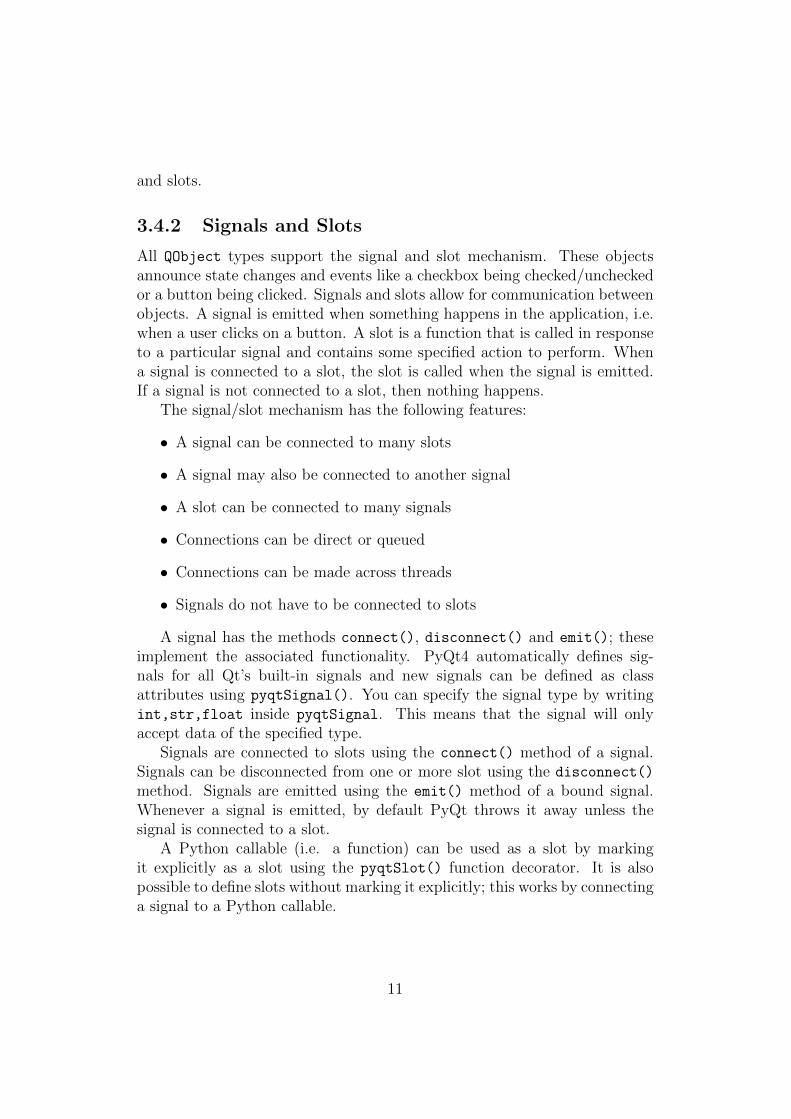
3.4.2 Signals and Slots
All QObject types support the signal and slot mechanism. These objectsannounce state changes and events like a checkbox being checked/uncheckedor a button being clicked. Signals and slots allow for communication betweenobjects. A signal is emitted when something happens in the application, i.e.when a user clicks on a button. A slot is a function that is called in responseto a particular signal and contains some specified action to perform. Whena signal is connected to a slot, the slot is called when the signal is emitted.If a signal is not connected to a slot, then nothing happens.
The signal/slot mechanism has the following features:
• A signal can be connected to many slots
• A signal may also be connected to another signal
• A slot can be connected to many signals
• Connections can be direct or queued
• Connections can be made across threads
• Signals do not have to be connected to slots
A signal has the methods connect(), disconnect() and emit(); theseimplement the associated functionality. PyQt4 automatically defines sig-nals for all Qt’s built-in signals and new signals can be defined as classattributes using pyqtSignal(). You can specify the signal type by writingint,str,float inside pyqtSignal. This means that the signal will onlyaccept data of the specified type.
Signals are connected to slots using the connect() method of a signal.Signals can be disconnected from one or more slot using the disconnect()
method. Signals are emitted using the emit() method of a bound signal.Whenever a signal is emitted, by default PyQt throws it away unless thesignal is connected to a slot.
A Python callable (i.e. a function) can be used as a slot by markingit explicitly as a slot using the pyqtSlot() function decorator. It is alsopossible to define slots without marking it explicitly; this works by connectinga signal to a Python callable.
11

3.4.3 Example
This example demonstrates the use of signal and slots in PyQt [1].
1 import sys2 from PyQt4 import QtGui , QtCore34 class Example ( QtGui . QWidget ) :56 def i n i t ( s e l f ) :7 super ( Example , s e l f ) . i n i t ( )89 s e l f . i n i t U I ( )
1011 def i n i t U I ( s e l f ) :1213 l cd = QtGui .QLCDNumber( s e l f )14 s l d = QtGui . QSl ider ( QtCore . Qt . Hor izonta l , s e l f )1516 vbox = QtGui . QVBoxLayout ( )17 vbox . addWidget ( l cd )18 vbox . addWidget ( s l d )1920 s e l f . setLayout ( vbox )21 s l d . valueChanged . connect ( l cd . d i sp l ay )2223 s e l f . setGeometry (300 , 300 , 250 , 150)24 s e l f . setWindowTitle ( ’ S i gna l & s l o t ’ )25 s e l f . show ( )2627 def main ( ) :2829 app = QtGui . QApplication ( sys . argv )30 ex = Example ( )31 sys . e x i t ( app . exec ( ) )3233 i f name == ’ ma in ’ :34 main ( )
This creates the GUI shown in Figure 3.3.
12

Figure 3.3: Simple example of use of signals and slots
First define the LCD number using QLCDNumber and the slider QSlider
(lines 13-14). Then we define the layout (QVBoxLayout) and add the two wid-gets to it (addWidget). We then connect the slider so that when it changes,it emits the new value on the LCD number display (line 21). Finally, wespecify the window geometry and the title.
Here the signal of the slider, sld.valueChanged, is connected to thedisplay slot of the lcd number. Therefore, when the user slides the sliderbar, the number is emitted and displayed above. Again this trivial exampleillustrates how few lines of code are required to create a simple GUI thanksto PyQt.
13
Chapter 4
Using QtDesigner
4.1 What is Qt Designer?
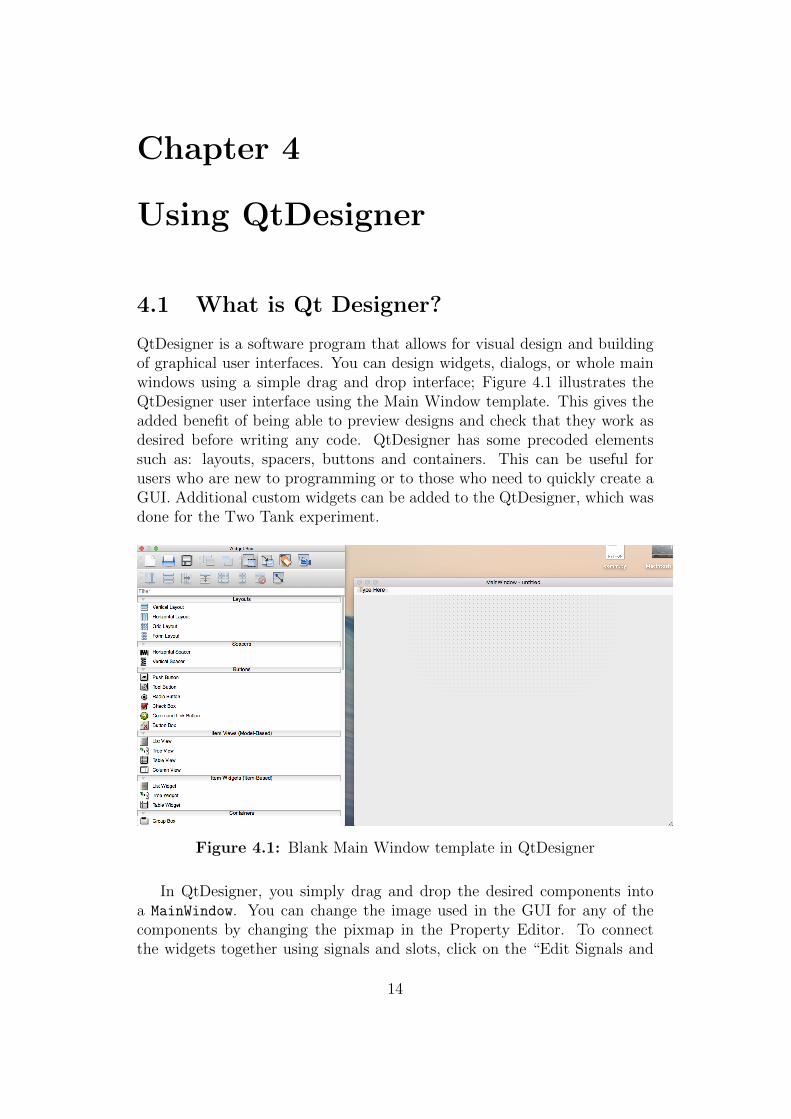
QtDesigner is a software program that allows for visual design and buildingof graphical user interfaces. You can design widgets, dialogs, or whole mainwindows using a simple drag and drop interface; Figure 4.1 illustrates theQtDesigner user interface using the Main Window template. This gives theadded benefit of being able to preview designs and check that they work asdesired before writing any code. QtDesigner has some precoded elementssuch as: layouts, spacers, buttons and containers. This can be useful forusers who are new to programming or to those who need to quickly create aGUI. Additional custom widgets can be added to the QtDesigner, which wasdone for the Two Tank experiment.
Figure 4.1: Blank Main Window template in QtDesigner
In QtDesigner, you simply drag and drop the desired components intoa MainWindow. You can change the image used in the GUI for any of thecomponents by changing the pixmap in the Property Editor. To connectthe widgets together using signals and slots, click on the “Edit Signals and
14

Slots” button in the Widget Box. This will allow you to connect the widgetstogether and select from the available signals and slots in each widget.
QtDesigner generates a XML .ui file to store designs but the uic utilitycan be used to generate code that will create the user interface. To specificallycreate Python code, pyuic4 should be used in the command line to translatethe design to Python code. Exactly how to use this interface is outlined infurther detail below.
4.1.1 pyuic4
The pyuic4 is a command line interface to the uic module and the followingsyntax should be used:
1 pyuic4 [ opt ions ] . ui−f i l e
This allows you to transform any GUIs made in QtDesigner into Python codewhich can then be launched and used as GUI.
4.2 Installing FellesLab Widgets
Before you can create your own GUI using the widgets that have been createdfor the Two Tanks experiment, you must set the following path (assumingPython 2.7 is used):
1 export PYQTDESIGNERPATH = ‘ ‘ [ use r ] / l i b /python2 .7/ s i t e−packages /2 f e l l e s l a b / q t p l u g i n s ”
Then you must launch the QtDesigner from the terminal:
1 open −a de s i gne r #for Mac OSx2 des igner−qt4 #for Ubuntu ( Linux )
This will launch the QtDesigner with all available FellesLab widgets. Cur-rently there are five available widgets: thermocouple, real-time plotting of 1CV and 2 MVS, solenoid valve, PID controller, and a trio of buttons (start,stop, and pause). When loaded into QtDesigner, they should appear in theleft hand column in the Widgets Box and be listed under QFellesLabWidgets(Figure 4.2).
15

Figure 4.2: QtDesigner Widget Box with QFellesLabWidgets
Then you can use the widgets as you would any other built-in widget tocreate a GUI.
16
Chapter 5
Two Tanks GUI
5.1 Installation
To use the Two Tanks GUI, the following dependencies are required (onlybeen tested on Ubuntu and Mac OSx):
• Ubuntu (Linux)
1 sudo apt i n s t a l l python−s e r i a l python−pip qt4−de s i gne r2 qt4−dev−t o o l s pyqt4−dev−t o o l s pyqtgraph3 sudo pip i n s t a l l minimalmodbus
• Mac OSx (using Mac Ports)
1 sudo port i n s t a l l qt4−mac qt4−c reator−mac py27−pyqt42 py27−pip py27−s e r i a l pyqtgraph3 sudo pip i n s t a l l minimalmodbus
The felleslab module can be downloaded from GitHub: https://github.
com/sigveka/FellesLab.After these dependencies are installed and the module has been down-
loaded, the following install procedure should be used:
1 python setup . py bu i ld2 python setup . py i n s t a l l −−p r e f i x = ‘ ‘${HOME}”
Each time you want to run the GUI, you must append the path to the Pythonpath so that you can import the felleslab module:
1 export PYTHONPATH=${PYTHONPATH}/ [ path to f e l l e s l a b ]
In addition, if any changes are made to the code, the install must be rebuilt.
17

5.2 How it Works
At its current stage in development, the GUI for the Two Tanks Experimentis shown in Figure 5.1.
Figure 5.1: Two tanks laboratory GUI
There are two operation modes for the experiment: manual control orautomatic control. The operation mode is determined by turning the con-troller on or off using the radio button located in the controller widget (upperright corner). In manual mode, users can open or close the solenoid valvesby clicking on the valve images. If the valve is open, the image will be white;if the valve is closed, the image will be red (Figure 5.2).
Figure 5.2: Open and closed valves, respectively
18

In manual mode, the user can set the manipulated variable set point inthe controller widget. The information flow in manual mode is illustrated inFigure 5.3.
Figure 5.3: GUI Manual Mode
In automatic control, the user can no longer close or open the valves;thus clicking on the valve images in this mode will result in no action beingperformed. Instead, the state of the valves is manipulated by the controller.Users manually input the desired controller settings in the controller widgetbox in the GUI. In the same box, users can specify the controlled variable setpoint. In this mode, the controller will decide what the valve settings shouldbe by using a separate algorithm. Currently this controller algorithm has notbeen implemented. The information flow in automatic mode is illustrated inFigure 5.4.
Figure 5.4: GUI Automatic Mode
When the GUI is first launched, users will notice at the bottom of theGUI three buttons: start, stop and pause. Of the three buttons only thestart button is enabled initially, i.e. is the only button that can be pressed.Pushing the start button begins the data collection and also changes the stateof the button. The real time plotting of the temperature and valve positionbegins. The start button becomes disabled and the pause and stop buttonsbecome enabled. If the pause button is pressed, the data collection is pausedmeaning that data is still being recorded but not displayed in the real-timeplots. If the stop button is pressed, the data collection is stopped and all
19
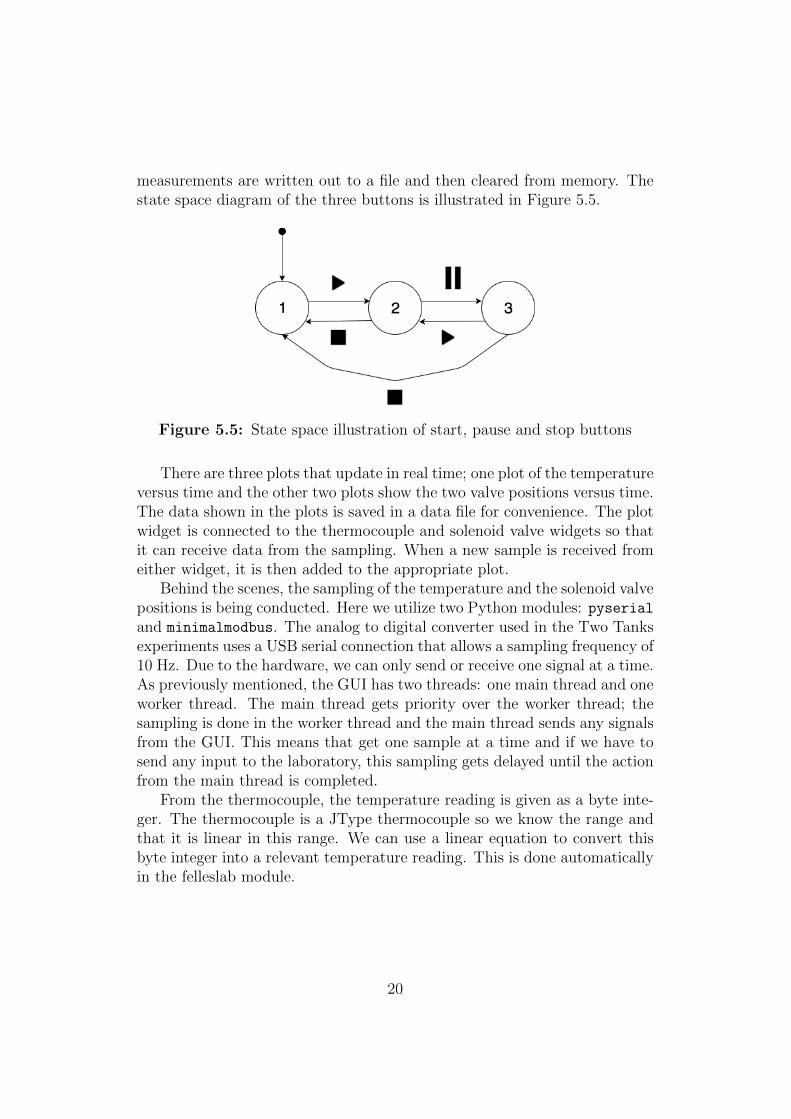
measurements are written out to a file and then cleared from memory. Thestate space diagram of the three buttons is illustrated in Figure 5.5.
Figure 5.5: State space illustration of start, pause and stop buttons
There are three plots that update in real time; one plot of the temperatureversus time and the other two plots show the two valve positions versus time.The data shown in the plots is saved in a data file for convenience. The plotwidget is connected to the thermocouple and solenoid valve widgets so thatit can receive data from the sampling. When a new sample is received fromeither widget, it is then added to the appropriate plot.
Behind the scenes, the sampling of the temperature and the solenoid valvepositions is being conducted. Here we utilize two Python modules: pyserialand minimalmodbus. The analog to digital converter used in the Two Tanksexperiments uses a USB serial connection that allows a sampling frequency of10 Hz. Due to the hardware, we can only send or receive one signal at a time.As previously mentioned, the GUI has two threads: one main thread and oneworker thread. The main thread gets priority over the worker thread; thesampling is done in the worker thread and the main thread sends any signalsfrom the GUI. This means that get one sample at a time and if we have tosend any input to the laboratory, this sampling gets delayed until the actionfrom the main thread is completed.
From the thermocouple, the temperature reading is given as a byte inte-ger. The thermocouple is a JType thermocouple so we know the range andthat it is linear in this range. We can use a linear equation to convert thisbyte integer into a relevant temperature reading. This is done automaticallyin the felleslab module.
20

5.3 Custom Widget Examples
The widgets below were created for the Two Tanks experiment. However,they were written as generically as possible so that the widgets could beutilized in other GUIs with no or minor changes required. The code givenin the widgets below is for illustrative purposes so that each widget couldbe run on its own (without needing the felleslab module); the implementedcode for the GUI utilizes much of the code below so the idea is still thesame. The solenoid valve, thermocouple widgets, and the code requiredfor communication are not discussed here since they were written by SigveKarolius. The full GUI source code can be found on GitHub as discussed atthe beginning of this Chapter.
5.3.1 Start, Stop, Pause Buttons Widget
The start, stop, and pause buttons illustrate a few of the previously metionedbuilt in PyQt widgets such as: QMainWindow, QWidget, QPushButton, QApplication,
QPixmap, QHBoxLayout, QVBoxLayout, QIcon, QCoreApplication, and pyqtSlot.The buttons are grouped together into one widget; this could be added toQtDesigner since a plugin file has also been coded for it. The widget iscoded such that the buttons are enabled or disabled depending on which oneis clicked as discussed above. Figure 5.6 shows how the buttons would lookin a GUI.
Figure 5.6: Start, Pause and Stop button widget
The code below creates and displays this trio of buttons.
1 import sys2 from PyQt4 . QtGui import ( QPushButton , QWidget , QIcon ,3 QApplication , QPixmap , QHBoxLayout , QVBoxLayout ,
21

4 QMainWindow)5 from PyQt4 . QtCore import QCoreApplication , pyqtS lot6 from f e l l e s l a b . i c on s import ∗78 class MainWindow(QMainWindow ) :9
10 def i n i t ( s e l f , parent = None ) :11 super (MainWindow , s e l f ) . i n i t ( parent )12 s e l f . button widget = ButtonWidget ( s e l f )13 s e l f . setCentra lWidget ( s e l f . button widget )14 s e l f . setWindowTitle ( ’Two Tank Experiment ’ )15 s e l f . setWindowIcon ( QIcon ( ’ chemistry−lab−instrument . svg ’ ) )1617 #Button Widget18 class ButtonWidget (QWidget ) :1920 def i n i t ( s e l f , parent ) :21 super ( ButtonWidget , s e l f ) . i n i t ( )22 s e l f . s t a t e = 0 #de f a u l t s t a t e o f i d l e23 s e l f . i n i t U I ( )24 s e l f . StartButton . c l i c k e d . connect ( s e l f . o n c l i c k )25 s e l f . PauseButton . c l i c k e d . connect ( s e l f . o n c l i c k )26 s e l f . StopButton . c l i c k e d . connect ( s e l f . o n c l i c k )2728 @property29 def s t a t e ( s e l f ) :30 return s e l f . s t a t e3132 @state . s e t t e r33 def s t a t e ( s e l f , va lue ) :34 s e l f . s t a t e = value3536 def i n i t U I ( s e l f ) :37 #Def in ing Buttons38 s e l f . StartButton = QPushButton ( ” Star t ” )39 s e l f . StartButton . setObjectName ( ’ S ta r t ’ )40 s e l f . PauseButton= QPushButton ( ”Pause” )41 s e l f . PauseButton . setObjectName ( ’ Pause ’ )42 s e l f . StopButton = QPushButton ( ”Stop” )43 s e l f . StopButton . setObjectName ( ’ Stop ’ )44
22

45 #Button icons46 i c o n s t a r t = QIcon ( )47 i con pause = QIcon ( )48 i c o n s t o p = QIcon ( )49 i c o n s t a r t . addPixmap (QPixmap( ’ play . svg ’ ) ,50 QIcon . Normal )51 i c o n s t a r t . addPixmap (QPixmap( ’ p l a y d i s a b l e d . svg ’ ) ,52 QIcon . Disabled )53 s e l f . StartButton . s e t I c on ( i c o n s t a r t )54 i con pause . addPixmap (QPixmap( ’ pause . svg ’ ) ,55 QIcon . Normal )56 i con pause . addPixmap (QPixmap( ’ paus e d i s ab l ed . svg ’ ) ,57 QIcon . Disabled )58 s e l f . PauseButton . s e t I c on ( i con pause )59 i c o n s t o p . addPixmap (QPixmap( ’ stop . svg ’ ) ,60 QIcon . Normal )61 i c o n s t o p . addPixmap (QPixmap( ’ s t o p d i s a b l e d . svg ’ ) ,62 QIcon . Disabled )63 s e l f . StopButton . s e t I c on ( i c o n s t o p )6465 #Spec i f y i n g bu t ton s e t t i n g s f o r i n i t i a l s t a t e66 i f s e l f . s t a t e == 0 : #i d l e ( d e f a u l t s t a t e )67 s e l f . StartButton . setEnabled ( True )68 s e l f . PauseButton . s e tD i sab l ed ( True )69 s e l f . StopButton . s e tD i sab l ed ( True )70 e l i f s e l f . s t a t e == 1 : #sampling71 s e l f . StartButton . s e tD i sab l ed ( True )72 s e l f . PauseButton . setEnabled ( True )73 s e l f . StopButton . setEnabled ( True )74 e l i f s e l f . s t a t e == 2 : #paused75 s e l f . StartButton . setEnabled ( True )76 s e l f . PauseButton . s e tD i sab l ed ( True )77 s e l f . StopButton . setEnabled ( True )7879 #Def in ing Layout80 hbox = QHBoxLayout ( )81 hbox . addStretch (1 )82 hbox . addWidget ( s e l f . StartButton )83 hbox . addWidget ( s e l f . PauseButton )84 hbox . addWidget ( s e l f . StopButton )85
23
86 s e l f . setLayout ( hbox )878889 @pyqtSlot ( )90 def o n c l i c k ( s e l f , event=None ) :91 send ing button = s e l f . sender ( ) #ge t t i n g but ton name92 btn name = str ( send ing button . objectName ( ) )93 i f btn name == ’ Star t ’ :94 o l d s t a t e = s e l f . s t a t e95 s e l f . s t a t e = 1 #changing s t a t e to sampling96 s e l f . StartButton . s e tD i sab l ed ( True )97 s e l f . PauseButton . setEnabled ( True )98 s e l f . StopButton . setEnabled ( True )99 e l i f btn name == ’ Pause ’ :
100 o l d s t a t e = s e l f . s t a t e101 s e l f . s t a t e = 2 #changing s t a t e to paused102 s e l f . StartButton . setEnabled ( True )103 s e l f . PauseButton . s e tD i sab l ed ( True )104 s e l f . StopButton . setEnabled ( True )105 e l i f btn name == ’ Stop ’ :106 o l d s t a t e = s e l f . s t a t e107 s e l f . s t a t e = 0 #changing s t a t e to i d l e108 s e l f . StartButton . setEnabled ( True )109 s e l f . PauseButton . s e tD i sab l ed ( True )110 s e l f . StopButton . s e tD i sab l ed ( True )111112 def main ( ) :113 app = QApplication ( sys . argv )114 GUI = MainWindow ( )115 GUI . show ( )116 sys . e x i t ( app . exec ( ) )117118 main ( )
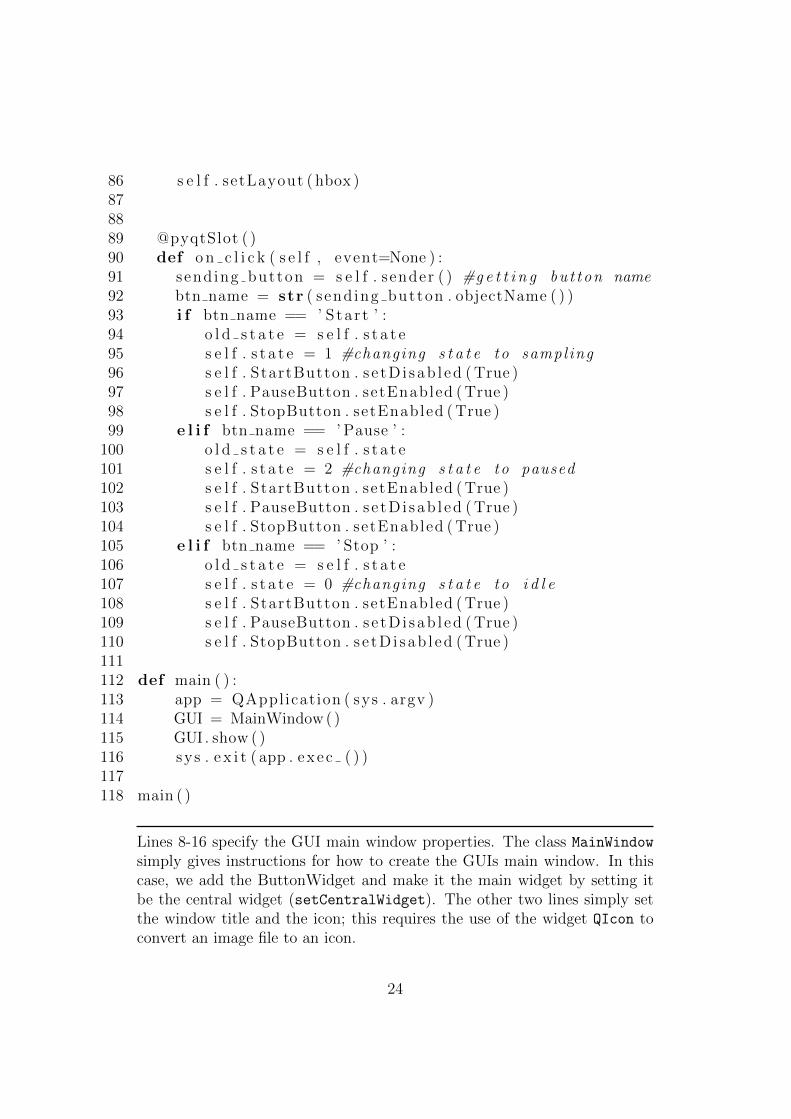
Lines 8-16 specify the GUI main window properties. The class MainWindow
simply gives instructions for how to create the GUIs main window. In thiscase, we add the ButtonWidget and make it the main widget by setting itbe the central widget (setCentralWidget). The other two lines simply setthe window title and the icon; this requires the use of the widget QIcon toconvert an image file to an icon.
24

Lines 19-111 is the code for the class ButtonWidget; this creates thethree buttons, adds images to the buttons, specifies what actions to per-form when a button state changes, and sets the layout for the widget. Theinit method is a Python method that is a constructor method for a class.init is called whenever an object of the class is constructed. This means
that whenever we create a ButtonWidget object we will perform the actionsincluded in this method. The full details of it will not be discussed here butit is common to use this method in the creation of PyQt GUIs. Here we callanother function and connect the buttons to a PyQt slot; this slot specifieswhat action is taken when each button is clicked.
The initUI function is where the buttons are created and their func-tionality is programmed. First the three buttons, using QPushButton, arecreated and given object names (lines 39-44). Next the buttons are givenicons using QIcon. We can use the widget QPixmap to specify icons that willappear only when the button is in a specific state (i.e., Normal (enabled)or Disabled). Each icon is then added to its respective button (lines 47-64).Next we specify which buttons are enabled or disabled depending on thestate value (lines 67-78). Note that we manually set the state value in theinit . Currently the default is to have only the start button enabled but
this can be changed to fit the users needs/desires. The layout of how thewidget will look in the main window is then defined (lines 81-87). We wantall the buttons to be next to each other so we use the widget QHBoxLayout;this horizontally aligns all the buttons.
Finally we create a slot using pyqtSlot where we specify what happenswhen a button is clicked. This slot is only used because signals were con-nected to it; this was done in the init function in lines 25-27. Once allof this is programmed, we still need to display the GUI; this is what is donein the function main. We then call this function and the GUI is displayed.
Note that in this example the buttons are not connected to anything sothey don’t perform any function. In a full GUI, each button (signal) wouldbe connected to a slot that would then specify some desired action. Forexample, in the Two Tanks experiment, the start button would begin thedata collection and start the real-time plot; the pause button would pausethe real-time plot and the data collection; the stop button would end thedata collection and result in the data being written out to a file.
5.3.2 PID Controller Input Widget
This example illustrates a GUI where users can set a PID controller’s tuningparameters and specify the set points. Users can set the gain, integral timeconstant, derivative time constant, manipulated variable and controlled vari-
25

able values. In addition, the user can turn the controller on and off so manualcontrol can also be used. Note that this widget simply provides the desiredsettings to a PID controller. It needs to be connected to a controller algo-rithm for it to actually work as a controller. This example illustrates the useof the following widgets and functionalities: QDoubleSpinBox, QGroupBox,QRadioButton, QSlider, pyqtSlot and pyqtSignal. The final product isas shown in Figure 5.7, where the figure on the left is what the widget lookslike when the controller is off and the figure on the right is what the widgetlooks like when the controller is on.
Figure 5.7: Controller GUI
This is generated using the following code.
1 import sys2 from PyQt4 . QtGui import (QGroupBox , QLabel , QDoubleSpinBox ,3 QGridLayout , QHBoxLayout , QWidget , QApplication ,4 QRadioButton , QIcon , QMainWindow , QSl ider )5 from PyQt4 . QtCore import pyqtSlot , Qt , pyqtS igna l67 class Window(QMainWindow ) :8 def i n i t ( s e l f , parent=None ) :9 super (Window , s e l f ) . i n i t ( parent )
10 s e l f . c o n t r o l l e r = Contro l lerWidget ( s e l f )11 s e l f . setCentra lWidget ( s e l f . c o n t r o l l e r )12 s e l f . setWindowTitle ( ’ C o n t r o l l e r ’ )1314 class Contro l lerWidget (QWidget ) :1516 p ro po r t i on a l = pyqtS igna l ( f loat )17 i n t e g r a l = pyqtS igna l ( f loat )18 d e r i v a t i v e = pyqtS igna l ( f loat )19 MV sp = pyqtS igna l ( f loat )20 CV sp = pyqtS igna l ( f loat )
26

2122 def i n i t ( s e l f , parent ) :23 super ( Control lerWidget , s e l f ) . i n i t ( )24 s e l f . i n i t U I ( )25 s e l f . on . togg l ed . connect ( s e l f . b tn s ta t e )26 s e l f . s e t p o i n t . valueChanged [ str ] . connect ( s e l f . CVSetPoint )27 s e l f . ga in . valueChanged [ str ] . connect ( s e l f . c o n t r o l l e r s e t t i n g s )28 s e l f . t au i . valueChanged [ str ] . connect ( s e l f . c o n t r o l l e r s e t t i n g s )29 s e l f . taud . valueChanged [ str ] . connect ( s e l f . c o n t r o l l e r s e t t i n g s )30 s e l f . MV manual . s l i d e r R e l e a s e d . connect ( s e l f . mv state )3132 def i n i t U I ( s e l f ) :33 #Group box34 group box = QGroupBox( ’ C o n t r o l l e r S e t t i n g s ’ )3536 #Spin but ton Labe l s37 gain = ”K<sub>c</sub>”38 Kc = gain . decode ( ’ ut f−8 ’ )39 s e l f . g a i n l a b e l = QLabel (Kc)40 s e l f . g a i n l a b e l . s e t S t y l e S h e e t ( ” font : 25 pt” )41 time1 = ”τ<sub>i</sub>”42 tau i = time1 . decode ( ’ ut f−8 ’ )43 s e l f . t a u i l a b e l = QLabel ( t au i )44 s e l f . t a u i l a b e l . s e t S t y l e S h e e t ( ” font : 25 pt ” )45 time2 = ”τ<sub>d</sub>”46 taud = time2 . decode ( ’ ut f−8 ’ )47 s e l f . t a u d l a b e l = QLabel ( taud )48 s e l f . t a u d l a b e l . s e t S t y l e S h e e t ( ” font : 25 pt” )4950 #Spin bu t tons51 s e l f . ga in = QDoubleSpinBox ( )#Gain52 s e l f . t au i = QDoubleSpinBox ( )#In t e g r a l time cons tant53 s e l f . taud = QDoubleSpinBox ( )#Der i va t i v e time cons tant54 s e l f . GAIN 0 = s e l f . ga in . va lue ( )55 s e l f . TAUI 0 = s e l f . t au i . va lue ( )56 s e l f .TAUD 0 = s e l f . taud . va lue ( )57 s e l f . ga in . setKeyboardTracking ( Fa l se )58 s e l f . t au i . setKeyboardTracking ( Fa l se )59 s e l f . taud . setKeyboardTracking ( Fa l se )60 s e l f . s e t p o i n t = QDoubleSpinBox ( )#CV se t p o i n t61 s e l f . s e t p o i n t . setHidden ( True )
27

62 s e l f . s e t p o i n t l a b e l = QLabel ( ’CV Setpo int ’ )63 s e l f . s e t p o i n t l a b e l . setBuddy ( s e l f . s e t p o i n t )6465 #On−Off Buttons66 s e l f . on = QRadioButton ( ” C o n t r o l l e r On” )67 s e l f . on . setChecked ( Fa l se )#Defau l t to have c o n t r o l l e r o f f6869 #S l i d e r70 s e l f . MV manual = QSl ider (Qt . Hor i zonta l )71 s e l f . MV manual label = QLabel ( ’MV Setpo int ’ )7273 #Layout74 contro l sLayout = QGridLayout ( )75 contro l sLayout . addWidget ( s e l f . g a i n l a b e l , 0 , 0 )76 contro l sLayout . addWidget ( s e l f . gain , 0 , 1 )77 contro l sLayout . addWidget ( s e l f . s e t p o i n t l a b e l , 0 , 2 )78 contro l sLayout . addWidget ( s e l f . s e tpo in t , 0 , 3 )79 contro l sLayout . addWidget ( s e l f . t a u i l a b e l , 1 , 0 )80 contro l sLayout . addWidget ( s e l f . taui , 1 , 1 )81 contro l sLayout . addWidget ( s e l f . MV manual label , 1 , 2 )82 contro l sLayout . addWidget ( s e l f . MV manual , 1 , 3 )83 contro l sLayout . addWidget ( s e l f . t aud labe l , 2 , 0 )84 contro l sLayout . addWidget ( s e l f . taud , 2 , 1 )85 contro l sLayout . addWidget ( s e l f . on , 2 , 2 )86 contro l sLayout . setRowStretch (3 , 1 )8788 layout = QHBoxLayout ( )89 layout . addLayout ( contro l sLayout )90 s e l f . setLayout ( layout )919293 @pyqtSlot ( )94 def CVSetPoint ( s e l f , event=None ) :95 s e l f . s e t p o i n t v a l u e = s e l f . s e t p o i n t . va lue ( )96 s e l f . CV sp . emit ( s e l f . s e t p o i n t v a l u e )9798 @pyqtSlot ( )99 def c o n t r o l l e r s e t t i n g s ( s e l f , event=None ) :
100 i f s e l f . ga in . va lue ( ) != s e l f . GAIN 0 :101 s e l f . GAIN 0 = s e l f . ga in . va lue ( )102 s e l f . g a in va lue = s e l f . ga in . va lue ( )
28

103 s e l f . p r op o r t i o na l . emit ( s e l f . g a in va lue )104 e l i f s e l f . t au i . va lue ( ) != s e l f . TAUI 0 :105 s e l f . TAUI 0 = s e l f . t au i . va lue ( )106 s e l f . t a u i v a l u e = s e l f . t au i . va lue ( )107 s e l f . i n t e g r a l . emit ( s e l f . t a u i v a l u e )108 e l i f s e l f . taud . va lue ( ) != s e l f .TAUD 0:109 s e l f .TAUD 0 = s e l f . taud . va lue ( )110 s e l f . taud va lue = s e l f . taud . va lue ( )111 s e l f . d e r i v a t i v e . emit ( s e l f . taud va lue )112113 @pyqtSlot ( )114 def btns ta t e ( s e l f , event=None ) :115 i f s e l f . on . isChecked ( ) == True :116 s e l f . s e t p o i n t . setHidden ( Fa l se )117 s e l f . MV manual . setHidden ( True )118 else :119 s e l f . s e t p o i n t . setHidden ( True )120 s e l f . MV manual . setHidden ( Fa l se )121122 @pyqtSlot ( )123 def mv state ( s e l f , event=None ) :124 MV setpoint = s e l f . MV manual . va lue ( )125 s e l f . MV sp . emit ( MV setpoint )126127 a p p l i c a t i o n = QApplication ( sys . argv )128129 #Making Window130 window = Window( )131 window . setWindowTitle ( ’ Group Box ’ )132 window . r e s i z e (220 , 100)133 window . show ( )134135 sys . e x i t ( a p p l i c a t i o n . exec ( ) )
As was the case for the previous example, all the code in class Window is forthe creation of the main window and is only used for testing/this example todisplay the controller widget. The class ControllerWidget contains all thenecessary code to design a GUI for a PID controller input.
In the class ControllerWidget, six signals are defined using pyqtSignal:one for the proportional part of the controller, one for the integral part
29

of the controller, one for the derivative part of the controller, one for thecontroller state (off or on) and the other two are for the manipulated variableset point and the controlled variable set point respectively (lines 16-20).Each signal is given a specified object type to accept; in this case all theobjects except only floats. Next in the init function, the signals areconnected to slots lines(25-30); the slots are defined in lines 93-128. Thefirst slot CVSetPoint takes the controlled variable set point and emits thevalue whenever the controlled variable set point is changed by the user. Thesecond slot controllersettings emits the new tuning parameter if eitherthe gain, integral time constant or derivative time constant is changed. Thethird slot btnstate changes what is displayed if the controller is turned onby clicking the radio button. The final slot mv state emits the manipulatedvariable set point if it is changed.
In the initUI function, the components of the PID controller input areconstructed. Using QGroupBox, we can collect all the components into onebox making it easy to use this as a widget/plugin in QtDesigner. We thencreate all the labels for the spin buttons; we can use utf-8 and html notationto get greek letters and subscripts (lines 37-48). The spin buttons are thencreated using QDoubleSpinBox; this allows for float values in comparisonto QSpinBox which only accepts integer values (lines 51-63). We turn thekeyboard tracking off so that signals will only be emitted when the user hasset the whole desired value; if it was on then a signal would be emitted forevery value change instead of just the final value (lines 57-59). For example,if a user wanted to type 1,35 then a signal would be emitted for 1, for 1,3and for 1,35; since this is not desired, we turn off the keyboard tracking.
Next we create an on button and use a QRadioButton and set the defaultstate to be unchecked using setChecked(False) since we want the defaultstate of the controller to be off. When the controller is turned off, we canset the manipulated variable value using the slider. This is created usingQSlider and when the value is changed it emits a signal. This signal isconnected to a slot so that the new manipulated variable value is emitted.Finally we specify the layout of the controller; we use QGridLayout to createthe layout of the controllers and then add this to the overall layout usingQHBoxLayout (lines 74-90).
5.3.3 Plotting Widget
The plotting widget illustrates the use of pyqtgraph which is a graphics anduser interface library for Python that makes use of the QtGUI platform (viaPyQt) for its high performance graphics and numpy for calculations [2]. Anexample of the plots is shown below for a set of data points.
30

Figure 5.8: Illustration of real-time plotting utilities
This is generated using the code displayed below. This code differs slightlyfrom the code implemented in the GUI but it illustrates the idea of how touse pyqtgraph to plot data in real time. The main differences lie in the datathat is plotted. In the actual GUI, the plotting widget is connected to thethermocouple and solenoid valve widgets and receives the emitted temper-ature and valve position. Also note that here we simply programmed theplotting widget to be inside the main window, which is of course not how itis implemented in the lab GUI.
31

1 from PyQt4 . QtGui import ∗2 from PyQt4 . QtCore import ∗3 import numpy as np4 import pyqtgraph as pg5 import random6 import sys7 import datet ime89 class Window(QMainWindow ) :
10 def i n i t ( s e l f ) :11 super (Window , s e l f ) . i n i t ( )12 s e l f . setWindowTitle ( ’ Plot ’ )13 s e l f . setGeometry (50 ,50 ,800 ,800)14 s e l f . home ( )15 global i , v ,T, s16 i = 017 #Valve p o s i t i o n18 v = [0 , 100 , 100 , 100 , 0 , 0 , 0 , 100 , 0 , 0 , 0 , 0 , 0 , 100 , 100 , 0 ]19 #Temperature20 T = [20 , 21 , 21 , 22 , 23 , 23 , 24 , 22 , 21 , 22 , 25 , 25 , 22 , 20 , 21 , 22 ]21 #Time22 s = [1 , 2 , 3 , 4 , 5 , 6 , 7 , 8 , 9 , 10 , 11 , 12 , 13 , 14 , 15 , 16 ]2324 def home( s e l f ) :25 pg . setConf igOpt ion ( ’ background ’ , ’w ’ )26 pg . setConf igOpt ion ( ’ foreground ’ , ’ k ’ )2728 #Temperature p l o t widge t29 l a b e l S t y l e = { ’ c o l o r ’ : ’ k ’ , ’ font−s i z e ’ : ’ 16px ’}30 s e l f . tempPlt = pg . PlotWidget ( s e l f )31 s e l f . tempPlt . s e t T i t l e ( ’ Contro l l ed Var iab le ’ , s i z e=’ 16px ’ )32 s e l f . tempPlt . s e tLabe l ( ’ l e f t ’ , ’ Temperature ’ ,33 un i t s=’C ’ ,∗∗ l a b e l S t y l e )34 s e l f . tempPlt . s e tLabe l ( ’ bottom ’ , ’Time ’ ,35 un i t s=’ s ’ ,∗∗ l a b e l S t y l e )36 s e l f . tempPlt . move (200 ,50)37 s e l f . tempPlt . r e s i z e (450 ,200)38 s e l f . t imer3 = pg . QtCore . QTimer ( )39 s e l f . t imer3 . t imeout . connect ( s e l f . cUpdate )40 s e l f . t imer3 . s t a r t (200)41
32
42 #Valve 1 p l o t widge t :43 s e l f . va lve1Pl t = pg . PlotWidget ( s e l f )44 s e l f . va lve1Pl t . s e t T i t l e ( ’ Manipulated Var iab le ’ , s i z e=’ 16px ’ )45 s e l f . va lve1Pl t . s e tLabe l ( ’ l e f t ’ , ’ Valve Pos i t i on ’ ,46 un i t s=’\% ’ ,∗∗ l a b e l S t y l e )47 s e l f . va lve1Pl t . s e tLabe l ( ’ bottom ’ , ’Time ’ ,48 un i t s=’ s ’ ,∗∗ l a b e l S t y l e )49 s e l f . va lve1Pl t . move (200 ,550)50 s e l f . va lve1Pl t . r e s i z e (450 ,200)51 s e l f . t imer3 = pg . QtCore . QTimer ( )52 s e l f . t imer3 . t imeout . connect ( s e l f . cUpdate )53 s e l f . t imer3 . s t a r t (200)5455 #Valve 2 p l o t widge t :56 s e l f . va lve2Pl t = pg . PlotWidget ( s e l f )57 s e l f . va lve2Pl t . s e t T i t l e ( ’ Manipulated Var iab le ’ , s i z e=’ 16px ’ )58 s e l f . va lve2Pl t . s e tLabe l ( ’ l e f t ’ , ’ Valve Pos i t i on ’ ,59 un i t s=’\% ’ ,∗∗ l a b e l S t y l e )60 s e l f . va lve2Pl t . s e tLabe l ( ’ bottom ’ , ’Time ’ ,61 un i t s=’ s ’ ,∗∗ l a b e l S t y l e )62 s e l f . va lve2Pl t . move (200 ,300)63 s e l f . va lve2Pl t . r e s i z e (450 ,200)64 s e l f . t imer3 = pg . QtCore . QTimer ( )65 s e l f . t imer3 . t imeout . connect ( s e l f . cUpdate )66 s e l f . t imer3 . s t a r t (200)6768 s e l f . show ( )6970 def cUpdate ( s e l f ) :71 global i , v , T, s72 s e l f . tempPlt . p l o t (np . array ( [ s [ i ] ] ) , np . array ( [T[ i ] ] ) ,73 pen=None , symbol=’ o ’ )74 s e l f . va lve1Pl t . p l o t (np . array ( [ s [ i ] ] ) , np . array ( [ v [ i ] ] ) ,75 pen=None , symbol=’ s ’ )76 s e l f . va lve2Pl t . p l o t (np . array ( [ s [ i ] ] ) , np . array ( [ v [ i ] ] ) ,77 pen=None , symbol=’ s ’ )78 i += 17980 def run ( ) :81 app=QApplication ( sys . argv )82 GUI = Window( )
33
83 sys . e x i t ( app . exec ( ) )84 run ( )
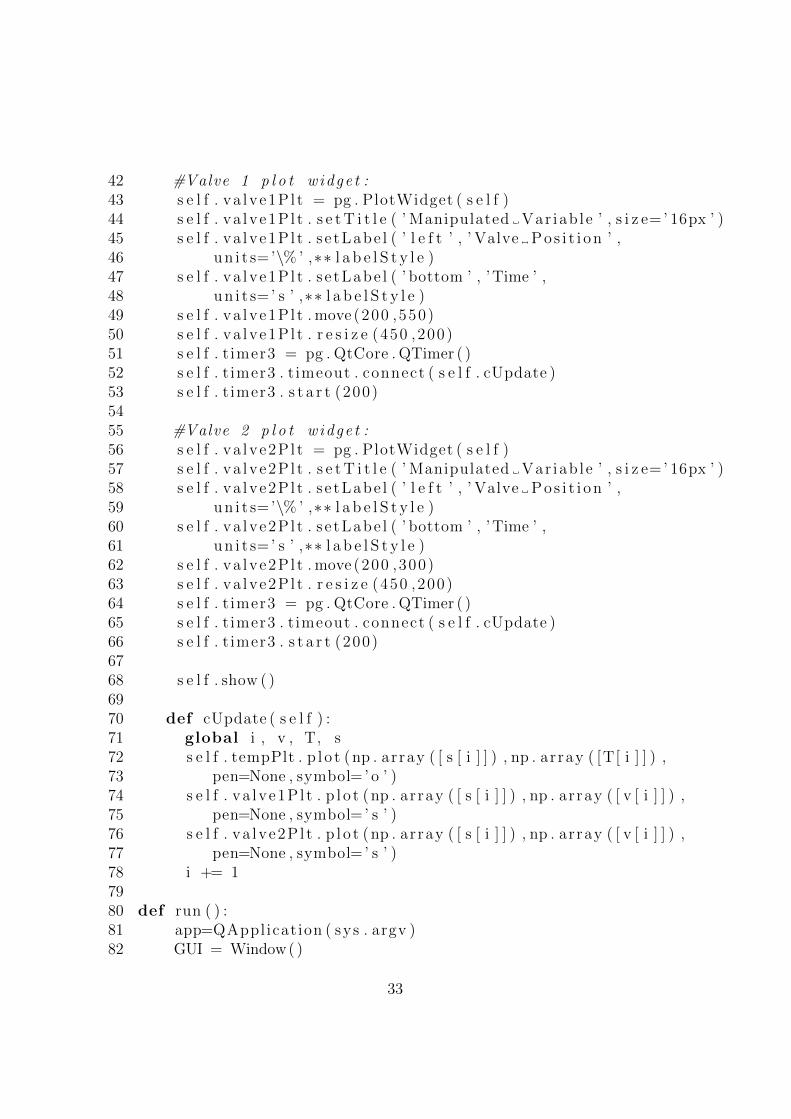
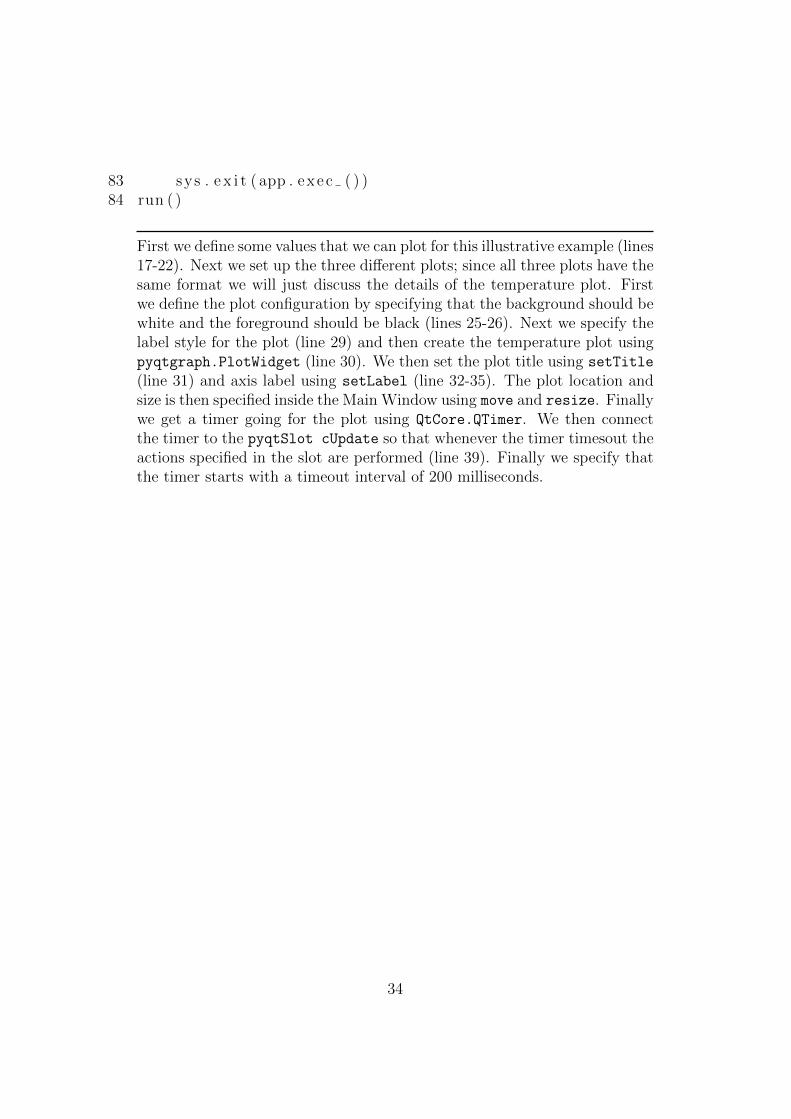
First we define some values that we can plot for this illustrative example (lines17-22). Next we set up the three different plots; since all three plots have thesame format we will just discuss the details of the temperature plot. Firstwe define the plot configuration by specifying that the background should bewhite and the foreground should be black (lines 25-26). Next we specify thelabel style for the plot (line 29) and then create the temperature plot usingpyqtgraph.PlotWidget (line 30). We then set the plot title using setTitle
(line 31) and axis label using setLabel (line 32-35). The plot location andsize is then specified inside the Main Window using move and resize. Finallywe get a timer going for the plot using QtCore.QTimer. We then connectthe timer to the pyqtSlot cUpdate so that whenever the timer timesout theactions specified in the slot are performed (line 39). Finally we specify thatthe timer starts with a timeout interval of 200 milliseconds.
34

Chapter 6
Conclusion
PyQt is an attractive open source alternative to LabView for the creation ofGUIs for laboratory experiments. While LabView does provide more built-inutilities, the expensive price tag makes it unviable in certain circumstances.PyQt allows for a lot of customization making it applicable to a wide rangeof applications.
PyQt is a well documented Python module making it relatively easy tofigure out how to use it. Using PyQt requires basic knowledge of Pythonsyntax and logic; however, it is also possible to use QtDesigner to create aGUI for people who are not as comfortable with programming. Since PyQtis open source, it is also easier to maintain or change any of the code for theGUI; this is in strong contrast to LabView which can require professionalspecialists to provide maintence. PyQt has numerous functionalities beyondthose discussed in this report making it possible to create GUIs for just aboutany desired application.
This project proved that it is possible to use PyQt to create a GUI for alaboratory experiment. While some further work needs to be done to improvethe GUI, the current functionalities are: receive temperature measurements,plot temperature measurements in real time, send controller settings, open/-close solenoid valves, and start/pause/stop the experiment. Additional workthat needs to be done to improve the GUI is outlined below:
• Inherit maximum and minimum values for the set point from the ma-nipulated variable and controlled variable types
• Check that the experiment is connected; check that connection is tocorrect hardware
• Implement the controller algorithm
• Validate that all signals and slots work as desired
• Validate the plotting widget
• Confirm that data is saved as desired
The GUI widgets were even constructed in such a way as to be generic (withthe exception of the plot widget) so that they may be utilized to make othergraphic user interfaces.
35
This project utilized many of the built-in capabilities of PyQt and showedthe proof of concept that PyQt could be used to develop a GUI that workswith real time data collection and excepts user inputs. Based on this exam-ple usage, PyQt is recommended as a feasible replacement for LabView todevelop GUI for laboratory experiments.
36

Bibliography
[1] Jan Bodnar. Events and Signals in PyQt4. Nov. 2017. url: http://zetcode.com/gui/pyqt4/eventsandsignals/.
[2] Luke Campagnola. PyQtGraph. Nov. 2017. url: http://www.pyqtgraph.org/documentation/index.html.
[3] The Qt Company. Qt Documentation. Oct. 2017. url: http://doc.qt.io/qt-5/.
[4] Computer Hope. GUI. Oct. 2017. url: https://www.computerhope.com/jargon/g/gui.htm.
[5] National Instruments. Labview. Oct. 2017. url: http://www.ni.com/en-us/shop/labview.html.
[6] Riverbank Computing Limited. PyQt4 Reference Guide. Oct. 2017. url:http://pyqt.sourceforge.net/Docs/PyQt4/.
[7] Tutorials Point. PyQt-QGridLayout Class. Nov. 2017. url: https://www.tutorialspoint.com/pyqt/pyqt_qgridlayout_class.htm.
[8] Wikipedia. Qt (software).
[9] Wikipedia. Software Industry.
37