Developing an integrated Demand Management process for ... · given me the space I needed to...
165
i Developing an integrated Demand Management process for ensuring future electricity supply LM Padachi 22052119 Dissertation submitted in fulfilment of the requirements for the degree Magister in Development and Management Engineering at the Potchefstroom Campus of the North-West University Supervisor: Dr R Pelzer May 2014
Transcript of Developing an integrated Demand Management process for ... · given me the space I needed to...

i
Developing an integrated Demand
Management process for ensuring
future electricity supply
LM Padachi
22052119
Dissertation submitted in fulfilment of the requirements for the
degree Magister in Development and Management Engineering
at the Potchefstroom Campus of the North-West University
Supervisor: Dr R Pelzer
May 2014

i
ABSTRACT
South Africa (SA) faces an electricity shortage in the next three to five years due to the demand for
electricity exceeding supply. But that does not mean industry needs to grind to a halt. Rather it
demands a concerted and coordinated effort to ensure that the electricity resources, which are
available, are used with optimum efficiency and minimal waste, even as Eskom invests in bringing
new generation capacity online.
Electricity constraints are far from a uniquely South African phenomenon; rather, they are a reality
faced by countries in the developed and the developing world. As a global reality, this gives Eskom
and every South African, the opportunity to share in solutions to the issue. There is a vested interest
for everyone to use less electricity wherever possible. That interest lies in reducing the cost of living
or doing business in reducing the impact on the environment and in ensuring demand doesn’t exceed
supply.
In response to the energy challenges facing South Africa, Eskom has established an Integrated
Demand Management (IDM) Division. IDM is dedicated to ensuring security of electricity supply
through coordinating and consolidating the various initiatives aimed at optimising electricity use and
balancing electricity supply and demand. A key aspect of this programme is the promotion and
implementation of more energy-efficient technologies, processes and behaviours amongst all
consumers.
Through IDM, all of Eskom’s demand management initiatives are brought together in a single
programme. In the past there was a degree of confusion for customers when it came to promoting
demand management initiatives; this was due to various departments within Eskom selling demand
management solutions in isolation from each other. As a result, these were neither synchronised nor
optimised. The result was confusing and difficult for customers to engage meaningfully with Eskom’s
demand reduction initiatives.

ii
The IDM objective is to ensure single ownership of Demand Side Management (DSM) strategies,
objectives and operations throughout Eskom. It takes a market-driven approach to understand and
meet consumer requirements and provides a platform from which Eskom can collaborate with
government, external stakeholders and consumers.
Since inception at the end of the 2012 financial year, the DSM programme in South Africa has realised
a verified demand power saving of 3076 Megawatts (MW). This was achieved as a result of the
various technologies implemented, ranging from Compact Fluorescent Lights (CFL’s) to optimisation
of processes at deep underground mines. The saving achieved to date is mainly due to the initiatives
in the residential sector contributing 2333 MW.
Concerns were therefore raised regarding the slow uptake of electrical energy savings in the
Commercial and Industrial (C&I) sectors. One of the biggest problems cited for poor performance in
these sectors is the onerous Energy Services Company (ESCO) funding approval process for Energy
Efficiency Demand Side Management (EEDSM).
Energy Services Companies (ESCOs) face major problems in obtaining approval for EEDSM projects via
the ESCO model funding process. Some of these problems are: the evaluation process being too
lengthy and too technical; project proposals being rejected as the evaluation process is not well
understood; the need for various reviews by separate technical, financial, and procurement
committees; Eskom did not negotiate contracts in a simple, efficient manner. In view of these
problems, there was an urgent need for an improved process.
This dissertation covers the development of a new IDM process called the Standard Offer (SO) for
Project Developers (PDs) participating in the Commercial and Industrial (C&I) sector of South Africa.
The study will develop a process to simplify the ESCO funding model for better market uptake on
energy efficiency projects.
The benefits of implementing this approach will streamline the process of evaluating project
proposals, reducing the burden on Eskom staff and facilitating a larger pipeline of energy efficiency
projects.

iii
The new SO process was implemented and tested on a large retail store in South Africa. Each step
was evaluated against the requirements of the new process and compared against the present ESCO
process.
It was proven through implementation, the new SO process is successful in increasing market uptake
for EEDSM, improving approval turnaround times and reducing the burden on Eskom staff.

iv
PREFACE AND ACKNOWLEDGEMENTS
“I believe I can do all things through Christ who strengthens me”
-Philippians 4:13Philippians 4:13Philippians 4:13Philippians 4:13----
It is my aspiration that this dissertation encourages the increased uptake of energy efficiency
in South Africa and the rest of Africa. Whosoever wishes to increase their knowledge,
continue research in the topic or implement the strategies, I wish you the best of success.
I would firstly like to thank God for blessing me with this opportunity to do my masters, and
for granting me the wisdom, knowledge and grace to complete my dissertation.
I thank my wife Maria, and my children Justin and Nicholas who have encouraged me and
given me the space I needed to complete my dissertation. Your support has made me believe
I can achieve anything I put my mind and heart into for the benefit of my family.
Thank you to my parents who never stopped believing in my ability to succeed.
A special thanks to my supervisor, Dr Ruaan Pelzer for his guidance, time and advice
throughout the study.
Thank you to Eskom for giving me the opportunity to do my masters. I have thoroughly
enjoyed working on this dissertation, which I believe will benefit myself and the employees
of the IDM department.
Thank you to my project team at Eskom for being committed and passionate in developing
the new process.
-ThankThankThankThank youyouyouyou----

v
TABLE OF CONTENTS
ABSTRACT..............................................................................................................................................................................i
PREFACE AND ACKNOWLEDGEMENTS.................................................................................................................iv
TABLE OF FIGURES.......................................................................................................................................................viii
LIST OF TABLES.................................................................................................................................................................ix
LIST OF ABBREVIATIONS…….…………………………………………………………………………………………….…xi
Chapter 1: Introduction..............................................................................................................................1
1.1. Background: Electrical energy situation................................................................................................................1
1.2. Global trend driving forces...........................................................................................................................................2
1.3. South African electricity situation............................................................................................................................4
1.4. State of the electricity system – The need for energy management...........................................................6
1.5. History of Energy Efficiency / DSM in Eskom.......................................................................................................8
1.6. Opportunity for electrical Energy efficiency in South Africa.........................................................................9
1.7. Motivation for this study.............................................................................................................................................11
1.8. Objectives of the study.................................................................................................................................................11
1.9. Scope of the study..........................................................................................................................................................12
1.10. Layout of dissertation...............................................................................................................................................12
Chapter 2: Demand Side Management................................................................................................14
2.1. Introduction.....................................................................................................................................................................14

vi
2.2. Overview of Demand Side Management..............................................................................................................14
2.3. EEDSM in South Africa................................................................................................................................................21
2.4. The Eskom DSM Fund..................................................................................................................................................26
2.5. Conclusion.........................................................................................................................................................................38
Chapter 3: Preliminary investigations into the development of the new process...............40
3.1. Introduction.....................................................................................................................................................................40
3.2. What is a Standard Offer? .........................................................................................................................................40
3.3. International Experience with Standard Offer.................................................................................................41
3.4. Environmental scan towards the development of Standard Offer...........................................................42
3.5. Identifying possible barriers to Standard Offer in South Africa................................................................43
3.6. Possible overlaps/synergies with other IDM initiatives................................................................................46
3.7. Conclusion.........................................................................................................................................................................48
Chapter 4: The Standard Offer – A new process for implementing EEDSM............................49
4.1. Introduction.....................................................................................................................................................................49
4.2. System Thinking Approach........................................................................................................................................51
4.3. Applying Systems Thinking Approach to determine high leverage interventions............................53
4.4. Development of the new Standard Offer process.............................................................................................63
4.5. Conclusion......................................................................................................................................................................102
Chapter 5: Case study.............................................................................................................................105
5.1. Introduction...................................................................................................................................................................105
5.2. Discussion……………………………………………………………………………………………………………...................134
5.3. Conclusion……………………………………………………………………………………………………………………........138

vii
Chapter 6: Conclusion.............................................................................................................................139
6.1. Overview…………………………………………………………………………………………………………………...............139
6.2. Market response to SO in South Africa..............................................................................................................140
6.3. Recommendations for future work......................................................................................................................143
6.4. Final concluding remarks……………………………………………………………………………………………..........144
Chapter 7: References............................................................................................................................145
Chapter 8: Appendix...............................................................................................................................148
8.1. Annexure A: SO checklist developed for TEC evaluation........................................................................148

viii
TABLE OF FIGURES
Figure 1-1: Global levels of investment, 2011 (3) ................................................................................. 3
Figure 1-2: Development of primary energy consumption, Energy revolution scenarios (5) ................. 4
Figure 1-3: Eskom's net energy capacity mix (6) .................................................................................. 5
Figure 1-4: Planned capacity expansion projects (6) ............................................................................ 5
Figure 1-5: Age of Eskom's generation fleet (6) ................................................................................... 6
Figure 1-6: Annual electricity supply gap forecast (7) .......................................................................... 7
Figure 1-7: Typical summer and winter profiles in SA (8) ..................................................................... 8
Figure 1-8: Demand savings (MW) achieved since inception of DSM (11) .......................................... 10
Figure 2-1: Load shapes associated with DSM (14) ............................................................................ 15
Figure 2-2: Timelines of DSM in SA (22) ............................................................................................. 23
Figure 2-3: Eskom EEDSM fund mechanism (23) ................................................................................ 27
Figure 2-4: ESCO Model (9) ............................................................................................................... 28
Figure 2-5: ESCO model process flow ................................................................................................ 29
Figure 4-1: Simplified view of the project life cycle model (34) .......................................................... 50
Figure 4-2: Interrelationship diagram ................................................................................................ 56
Figure 4-3: Systemic Scorecard .......................................................................................................... 59
Figure 4-4: Key stakeholders to SO (31) ............................................................................................. 60
Figure 4-5: Degree of stakeholder involvement (31) .......................................................................... 61
Figure 4-6: Development of the new SO process flow ....................................................................... 66
Figure 4-7: SO project team structure ............................................................................................... 70
Figure 4-8: Industrial and Commercial electricity consumption patterns in SA ................................... 74
Figure 5-1: Proposed weekday lighting power profiles of the Customer .......................................... 118
Figure 5-2: Load profile for Weekday, Saturday and Sunday (38) .................................................... 125
Figure 5-3: Actual project performance in comparison to the baseline ............................................ 133
Figure 6-1: Market response to the SO programme (39) .................................................................. 141

ix
LIST OF TABLES
Table 2-1: Phases of the ESCO process with corresponding timelines ................................................ 31
Table 3-1: Comparison of IDM funding options ................................................................................. 46
Table 4-1: Gate approvals ................................................................................................................. 51
Table 4-2: Framework for managing complex situations (33) ............................................................. 52
Table 4-3: Affinity diagram (clustering the problems into themes) .................................................... 55
Table 4-4: Rethinking limiting assumptions ....................................................................................... 62
Table 4-5: SO process flow and activities for A1 ................................................................................ 68
Table 4-6: RACI to determine new process flow for A1 ...................................................................... 69
Table 4-7: RACI for activity flow A2 ................................................................................................... 71
Table 4-8: RACI for activity flow B1-B7 .............................................................................................. 78
Table 4-9: RACI for activity flow C ..................................................................................................... 79
Table 4-10: Summary of SO parameters ............................................................................................ 81
Table 4-11: Governance comparison between the ESCO and SO process ........................................... 83
Table 4-12: SO process risks and mitigations ..................................................................................... 84
Table 4-13: RACI for activity flow D1 and 2 ........................................................................................ 85
Table 4-14: RACI for activity flow E .................................................................................................... 85
Table 4-15: RACI for activity flow F1 .................................................................................................. 86
Table 4-16: RACI for activity flow F2 .................................................................................................. 88
Table 4-17: Vendor registration process ............................................................................................ 89
Table 4-18: RACI for activity flow G ................................................................................................... 89
Table 4-19: Screening and registration template ............................................................................... 91
Table 4-20: RACI for activity flow H ................................................................................................... 92
Table 4-21: RACI for activity flow I ..................................................................................................... 93
Table 4-22: RACI for activity flow J .................................................................................................... 94
Table 4-23: RACI for activity flow K .................................................................................................... 95
Table 4-24: RACI for activity flow L .................................................................................................... 97
Table 4-25: RACI for activity flow M .................................................................................................. 98
Table 4-26: RACI for activity flow N ................................................................................................... 99

x
Table 4-27: RACI for activity flow O ................................................................................................. 100
Table 4-28: RACI for activity flow P .................................................................................................. 101
Table 4-29: RACI for activity flow Q ................................................................................................. 101
Table 4-30: Comparison between the ESCO and new SO process .................................................... 103
Table 5-1: SO application process with suggested timelines to complete each phase ...................... 106
Table 5-2: Comparison between the SO and ESCO process for activity F1 ........................................ 108
Table 5-3: Customer site information .............................................................................................. 109
Table 5-4: Comparison between the SO and ESCO process for activity F2 ........................................ 111
Table 5-5: Eskom vendor registration process ................................................................................. 112
Table 5-6: Project registration template .......................................................................................... 113
Table 5-7: Comparison between SO and ESCO process for activity H ............................................... 114
Table 5-8: New EE technology specification .................................................................................... 116
Table 5-9: Comparison between SO and ESCO process for activity I ................................................. 119
Table 5-10: Summarised request of the project to the PEC .............................................................. 120
Table 5-11: Project Risks and Mitigations ........................................................................................ 121
Table 5-12: Employment opportunities to be created subject to PEC approval ................................ 122
Table 5-13: Comparing the SO baseline development against the ESCO process.............................. 126
Table 5-14: Comparison between the ESCO and SO process for activity L ........................................ 127
Table 5-15: Project Plan .................................................................................................................. 129
Table 5-16: Comparing SO process to ESCO process ........................................................................ 130
Table 5-17: Comparing SO process to ESCO process for activity N ................................................... 131
Table 5-18: Comparison of the suggested timelines SO ................................................................... 131
Table 6-1: SO project pipeline ......................................................................................................... 131

xi
LIST OF ABBREVIATIONS
ASP Aggregated Standard Product
BBBEE Broad Based Black Economic Empowerment
BRA Benefits Realisation Approval
C&I Commercial and Industrial
CFL Compact Fluorescent Lamp
CIC Capital Investment Committee
CIDB Compliance Industry Development Board
CO2 Carbon Dioxide
COC Certificate of Completion
CRA Concept Release Approval
DOE Department of Energy
DPE Department of Public Enterprise
DR Demand Response
DRA Definition Release Approval
DSM Demand Side Management
DTI Department of Trade and Industry
E REV Energy Revolution
ECS Energy Conservation Scheme
EE Energy Efficiency
EEDSM Energy Efficiency Demand Side Management
ERA Execution Release Approval
ESCO Energy Services Company
FRA Finalisation Release Approval
FY Financial Year
HVAC Heating, Ventilation and Air Conditioning
IDM Integrated Demand Management
IEC International Electrotechnical Commission
LF Load factor
LM Load Management
LOA Letter of Authority
LOI Letter of Intent
LPU Large Power users
M&V Measurement and Verification
MAD Measure Acceptance Date
MAP Measure Acceptance Period
MD Maximum Demand
MYPD Multi – Year Price Determination (tariff application)
NEC New Engineering Contract
NERSA National Energy Regulator of South Africa

xii
OHSACT Occupational Health and Safety Act
PA Performance Assessment
PBB Power Buy Back
PC Performance Contracting
PCP Power Conservation Programme
PD Project Developer
PEC Project Evaluation Committee
PLCM Project Life Cycle Model
PM Project Manager (employed by IDM)
PMO Programme Management Office
PR Public Relations
PTC Procurement Tender Committee
RACI Responsible, Accountable, Consulted, Informed
RMR Residential Mass Rollout
SA South Africa
SANS South African National Standards
SD&L Supplier Development and Localisation
SHE Safety Health and Environmental
SO Standard Offer
SOP Standard Offer Programme
SOW Scope of Work
SP Standard Product
STA Systems Thinking Approach
SWH Solar Water Heating
TEC Technical Evaluation Committee
TOU Time of Use
US United States

1
Chapter 1
1. INTRODUCTION
1.1. BACKGROUND: ELECTRICAL ENERGY SITUATION
Throughout the last decade, the global arena has demonstrated that the electricity supply value chain
is at a crossroad. Current global electricity supply and demand trends are unsustainable from an
economic, environmental and social perspective. The sustainability of these elements requires a shift
in the traditional methodology of ensuring power system security and adequacy. Recently, matching
power supply and demand has largely consisted of increasing supply side capacity, based on demand
growth trajectories. This philosophy has seen major investment initiatives in power utility
infrastructure.
To this end, a transition has already commenced in the form of introducing demand response and
energy efficiency programs into the supply demand mix. Demand response and energy efficiency look
at managing demand and energy usage from the end user perspective. Demand response and energy
efficiency programs are fast providing customers new options for managing their energy costs along
with providing power utilities new options that steer towards reliable supply at reduced costs.
Demand response and energy efficiency programs are showing positive advancement towards
improved system reliability, cost avoidance of new power plants, energy usage reduction, improved
system efficiency, improved risk management, positive environmental impacts and improved
customer service.
Current adverse power system events due to operating close to safety margins, is resulting in the
development and practice of demand response around the globe; South Africa is no exception.
Governments and utility regulators are increasing support for the implementation of demand
response and energy efficiency programs into the supply demand balance.

2
The benefits of embracing demand response and energy efficiency programs in terms of reduced
energy costs; economic, political and environmental sustainability is evolving the mind-sets of
consumers and utilities alike. Such holistic thinking of these benefits is evidence that utilities are
venturing towards a systems thinking perspective rather than purely technocratic approaches to
ensuring power system security and adequacy (1).
1.2. GLOBAL TREND DRIVING FORCES
Currently, the greatest motivation for energy efficiency can be attributed to global concerns for
escalating costs related to energy usage worldwide. Through energy efficiency, countries are able to
successfully minimise greenhouse gas emissions and simultaneously prolong energy supplies in a
manner that is cost, time and environmentally effective. Developed countries have long been market
leaders in energy efficiency. However, despite obstacles that continue to challenge developing and
transitional countries, they are fast expanding their own markets for energy efficiency with consumer
goods and services becoming more widely available. Energy efficiency improves energy security and
system reliability and thereby reduces the potential for disruptions from brownouts or blackouts (2).
In 2011, the total investment in energy efficiency globally was similar in magnitude to supply-side
investment in renewable or fossil fuel electricity generation (Figure 1-1). Although this is a step in the
right direction, EE is still two-thirds less than fossil fuel subsidies. This investment is unevenly spread
across countries and market sectors namely; industrial, commercial, and residential (3).
Countries worldwide are attempting to become more proactive in their responses to climate change
and the risks surrounding it. This may be regarded as another driving force behind global energy
efficiency. Since 1950, measured Carbon emissions have shown industrialised countries are
responsible for 74% of emissions, while developing countries contribute 26% of emissions. These
statistics have since changed drastically with emissions of developed countries having now reduced to
60% and projected emissions of developing countries seen to outgrow developed countries from as
early as 2020, if no steps are taken to prevent this (4).

3
Figure 1-1: Global levels of investment, 2011 (3)
Figure 1-2 illustrates the forecast increase in primary energy consumption in the world. In the
reference (Ref) bar, the base case scenario, the demand for energy over the next 40 years, will
increase by over 63%, with fossil fuels growing over 87%. Carbon emissions will double by 2050,
making the reference case scenario unsustainable. In the Energy Revolution (E Rev) scenario, fossil
fuel usage decreases by 45%, with annual per capita greenhouse emissions dropping from 3.8
tonnes/capita, to 1.2 tonnes/capita. Although the focus on renewable energy grows almost 340% in
the energy revolution scenario, it is insufficient to supply the world’s demand for energy; hence
energy efficiency and Demand Side Management will play a pivotal role in future scenario (5).

4
Figure 1-2: Development of primary energy consumption, Energy revolution scenarios (5)
1.3. SOUTH AFRICAN ELECTRICITY SITUATION
Eskom is South Africa’s main electricity supplier, generating approximately 95% of the electricity used
in South Africa and more than 40% of the electricity used in Africa. The company generates, transmits
and distributes electricity to 4.9 million customers in the industrial, mining, commercial, agricultural
and residential sectors. Eskom has a maximum self-generated capacity of 41 647 MW. Eskom’s net
capacity shown in Figure 1-3 indicates that 85% of power produced by Eskom is from coal supplied
power stations (6).

5
Figure 1-3: Eskom's net energy capacity mix (6)
Due to the growth in demand in South Africa, coupled with ageing power stations and the shortage of
supply, Eskom plans to add additional capacity of 11 126 MW to the electricity grid by 2019 (Figure 1-
4) (6).
Figure 1-4: Planned capacity expansion projects (6)

6
1.4. STATE OF THE ELECTRICITY SYSTEM – THE NEED FOR ENERGY
MANAGEMENT
The South African electrical power system is constraint. Most of the power stations are in mid-life and
require increased maintenance (Figure 1-5), but maintenance has constantly been shifted in order to
ensure demand in South Africa is met. The current strategy of shifting maintenance can no longer be
sustained (6).
Figure 1-5: Age of Eskom's generation fleet (6)
Since 2008, Eskom has maintained a stable power supply, but balancing supply and demand has been
a national challenge. Eskom is doing significant maintenance to address backlogs, while at the same
time meeting demand. The Supply side is also constrained due to the unreliability of some of the
power stations and power imports. Figure 1-6 illustrates the forecasted gap between supply and
demand. Year 2012 shows an electricity gap of 9 TWh, which is the equivalent of about 1000 MW
base load capacity. 1 TWh is approximately equivalent to the annual energy consumption of 200 000
households in South Africa (7).

7
Figure 1-6: Annual electricity supply gap forecast (7)
With the supply/demand imbalance continuing to grow, there is a very real risk the gap between
supply and demand will reach a point of no recovery for Eskom. A method of closing this gap would
be to continuously increase supply at the same rate of demand growth, which is neither feasible nor
economical. The time and cost constraints of attempting to expand supply to meet demand cannot be
depicted as a practical solution, therefore, more realistic goals can be met by addressing demand
management.
Figure 1-7 illustrates South Africa’s summer and winter load profiles. It can be seen that in winter, the
demand for electricity is much higher than in summer, for a shorter period of time. The demand
forecast for winter in 2012 was just under 37 000 MW, this means that the electrical system would be
tight if a higher system peak was experienced. A colder than expected winter puts added pressure on
the system, for every 1 degree centigrade decrease in winter temperature, electricity demand will
increase by 600-700MW during the evening peak (8).
The summer load profile is much flatter, peaking around 33 000 MW; therefore if there is a system
constraint, the system will remain constrained for the entire day. Most power station planned
maintenance is done in summer when demand is lower, so that maximum capacity is available to

8
meet demand in winter. A warmer than expected summer could also be a problem, as it increases air
conditioning load and demand can increase by up to 400 MW (8).
Figure 1-7: Typical summer and winter profiles in SA (8)
1.5. HISTORY OF ENERGY EFFICIENCY / DSM IN ESKOM
Based on international experience with DSM, Eskom developed its own EEDSM initiative, which was
necessitated by the need to create a long-term mitigation strategy to minimise the risk of load
shedding and to secure the electricity supply nationwide.
These have become the key responsibilities of DSM interventions, driven by the cost and time
constraints associated with electrical energy savings. Over the past decade the Eskom DSM Initiative
has collectively motivated the savings of electricity nationwide.
The initiative has seen the national political sector, the energy regulator (NERSA) and major economic
sectors coming together collectively with Eskom to drive and manage the effort. The DSM initiative
strives to provide a long term solution to the supply/demand situation by creating a more energy
efficient lifestyle for consumers, to the entire energy management system of the country. This will
prove beneficial to all areas affected by electricity supply.
It was determined that the evening peak of electricity usage should be addressed by demand savings
initiatives within the mining, industrial and commercial sectors in South Africa using ESCOs as

9
implementation agents. This was the main focus of the DSM department along with implementing a
Hot Water Load management system within local municipalities.
The electricity crisis in the Western Cape in 2007, sparked a greater need for electrical energy savings
in the peak demand period. This was when DSM recognised and initiated a greater urgency in their
programme. Despite this, January 2008 motivated a higher emphasis on implementing savings
throughout the day, which diverted the attention to energy efficient projects, specifically those that
could be implemented in the shortest time. The greatest savings have been generated through the
initiative of incandescent light bulbs with Compact Fluorescent Lamps (CFLs) being fitted in homes
nationwide between 2003 and 2009 (9).
The supply/demand gap may be practically addressed and closed with such continued DSM initiatives
provided there is no decline in adequate funding to DSM. Electricity prices are foreseen to increase
gradually over coming years, however it should not be taken for granted that this will result in a
definite change of consumer choice towards a more energy efficient lifestyle. Electricity may be
regarded as a “priceless” resource to consumers who may willingly use electricity, despite price hikes.
It is imperative to initiate and maintain an electrical savings mentality in every area of energy usage in
order to minimise energy consumption and reduce the risk of load shedding, thus securing an
uninterrupted energy supply to all consumers. From a business perspective, DSM is extremely
beneficial to South Africa because DSM measures have proven to be:
• the most cost-effective mechanism for demand reduction;
• to have the least economic impact;
• to take the quickest time to implement;
• one of the most effective climate change mitigation strategies; and
• A strong resource to improve overall energy productivity.
1.6. OPPORTUNITY FOR ELECTRICAL ENERGY EFFICIENCY IN SA
Since inception to the end of financial year 2012, the DSM programme in South Africa has realised a
verified demand saving of 3076 MW (10) as at 31 March 2012 (Figure 1-8). This is almost the
equivalent of a six unit coal fired power station. A single power station’s generator unit contributes

10
about 600 MW to the national grid. In the past five years demand-side management has “freed up”
more than five generators (a typical power station has six).
The targets were achieved as a result of the various technologies that were installed, ranging from
CFL’s to optimisation of processes at deep underground mines. The residential sector has achieved
the greatest savings of 2333 MW. This was achieved via the installation of a mass rollout CFL
programme, installation of solar water heaters using a rebate scheme, and offering heat pump
incentives.
The industrial sector has achieved savings of 596 MW via the installation of efficient lighting systems,
motor systems, heating ventilation and cooling (HVAC), compressed air systems and process
optimisation. The commercial sector has achieved savings of 125 MW via the installation of efficient
lighting, motor systems and HVAC systems. The agricultural sector has achieved savings of 18 MW via
the installation of efficient pump systems (11).
Figure 1-8: Demand savings (MW) achieved since inception of DSM (11)
From the achievements to date, it is clear that more needs to be done in the industrial, commercial
and agricultural sectors, as these comprise medium to large power users. A market survey conducted
by IDM (12), showed there is a market potential for demand savings of 700 MW and 3565 MW in the

11
commercial and industrial sectors, respectively. However when setting targets for these sectors, it
would be realistic to assume a market penetration of 50% due to EEDSM barriers explained in chapter
two.
1.7. MOTIVATION FOR THIS STUDY
From the information provided in this chapter, the need for this study can be summarised as follows:
• South Africa faces an energy shortage in the next three to five years due to the demand for
electricity exceeding supply.
• The industrial sector has achieved a total demand saving of 596 MW versus a 50% market
potential of 1782 MW.
• The commercial sector has achieved a total demand savings of 125 MW versus a 50% market
potential of 300 MW.
• The ESCO funding model is lengthy, time consuming and lacks transparency, resulting in poor
market uptake to generate good energy efficiency projects.
• The industrial and commercial sector presents good opportunities for energy savings,
especially by implementing a streamlined funding model.
• A new procedure is required that will address the problems experienced by both customers
and ESCOs; this will lead to better market uptake.
1.8. OBJECTIVES OF THE STUDY
The study will focus on the development of an innovative streamlined management and funding
model that will:
• increase market uptake on EEDSM in South Africa;
• reduce the burden on Eskom staff;
• reduce Eskom’s risk by paying for performance;
• improve the time taken to evaluate EEDSM projects.

12
1.9. SCOPE OF THE STUDY
The scope of the study entails:
• Investigating the barriers facing both customer and ESCOs with regards to EEDSM.
• Analysing the issues/problems with the current ESCO process.
• Developing a new process to overcome the challenges faced with the ESCO process.
• Applying and testing the new process on a large retail facility (commercial) in South Africa.
• Analysing the results of the new process in terms of market uptake, time taken to approve
and budget commitments.
1.10. LAYOUT OF DISSERTATION
Chapter 1 – Introduction - the introduction provides a background to the study. This includes an
overview of global and national electricity consumption problems and the need for energy
management in South Africa. The demand savings contribution from the commercial and industrial
sectors is introduced versus the market potential, thereby presenting an opportunity for a new
process to stimulate market uptake.
Chapter 2 – Demand Side Management - this chapter provides an insight to international best
practice on Demand Side Management, lessons learnt and barriers to market. It also explains the
South African ESCO funding model and issues therefrom.
Chapter 3 – Preliminary investigation into the development of the new process - this chapter
provides an insight into the SO approach. It also investigates areas of overlap and synergies between
current IDM processes.
Chapter 4 – The SO Model, a new process for implementing EEDSM - the new SO process is
introduced. It takes the reader through the full development process and explains each activity flow.
The SO process is compared against the ESCO funding model in order to assess evaluation times,
process effectiveness, critical controls, roles and responsibilities.

13
Chapter 5 – Results - the new SO process is implemented and verified on a commercial facility.
Chapter 6 – Conclusion - this chapter concludes the study with market uptake results of the Standard
Offer Programme, and recommendations for future work to ensure future security of supply.

14
Chapter 2
2. DEMAND SIDE MANAGEMENT
2.1. INTRODUCTION
This chapter provides an insight into international best practice on Demand Side Management (DSM).
It provides an overview of DSM, and the evolution thereof. Thereafter the research investigates DSM
from a South African perspective, which includes the country’s goals and objectives, needs and
benefits, barriers to market and the NERSA policy. It also explains the ESCO funding model process
and the challenges experienced by industry.
2.2. OVERVIEW OF DEMAND SIDE MANAGEMENT
DSM may be described as a method of influencing the demand for electricity via policies, programs or
actions, which alter consumer’s electricity usage in a positive way (13). An immediate benefit of DSM
to a consumer is its ability to reduce high electricity input costs. Utilities often view DSM as a more
attractive, cost effective and environmentally friendly option compared to supply side generation.
DSM collectively encompasses many, “load shape objectives” namely, Load Management (LM) and
Energy Efficiency (EE), which collectively assist in the reduction of energy consumption by customers.
There are essentially four, “load shape objectives” encompassed within DSM. These are:
• Load Management objectives which are classified as mainly Peak Clipping, Valley Filling and
Load Shifting.
• The saving of energy is referred to as energy efficiency, also known as energy conservation,
which is the process of lowering the total energy used. Figure 2-1 illustrates the four load
shape objectives commonly associated with DSM (14).

15
Figure 2-1: Load shapes associated with DSM (14)
2.2.1 LOAD MANAGEMENT
Load management programs may either reduce electricity peak demand or shift demand from on
peak to non-peak periods. Various mechanisms are used in Load Management programmes to
provide relief to utilities during peak periods of consumption. Such methods include interruptible
load tariffs, time-of-use rates, real-time pricing, direct load control and voluntary demand response
programmes. They are designed to help control consumption through price control (14).
Time of use (TOU) electricity tariffs contribute significantly to the effectiveness of load management
systems and their success in lowering demand during peak periods. This reduction in demand also
contributes toward a reduction of power supply construction costs associated with utilities. Load
management programs coupled with end-use energy efficiency will result in higher combined savings,
whilst still working as a cost-effective demand side solution.
2.2.2 ENERGY EFFICIENCY
Energy efficiency entails the reduction in overall energy use whilst maintaining or improving the level
of production output. Energy efficiency improvements involve the replacement of inefficient
technologies with efficient technologies that permanently reduce electrical energy consumption
during operating hours.

16
In general most consumers of electrical energy have hidden electrical problems that lead to wastage
of electrical energy, mainly; compressed air leakages, dirty plant filters, poor insulation,
misconfigured operating controls or even broken equipment, which are often overlooked (15). To
improve electrical energy efficiency consumers need to (16):
a) Understand present usage of electrical energy, which entails analysis of electrical usage at the
point of purchase and at the point of use.
b) Benchmark plant performance against similar plants in terms of electrical input cost versus
production output.
c) Understand when electrical energy is used; most medium to large power users are on a TOU
tariff, which means they are charged cheaper electrical rates between standard and off-peak
times of the day as compared to peak times. By understanding where energy is being used,
consumers can shift plant production from peak to off-peak times.
d) Understand where electrical energy is used by compiling an inventory of all electrical loads, and
thereafter determine how much electricity is used per load. Good savings opportunities are
identified by targeting high consuming loads first.
e) Match electrical usage to plant requirement by what is used to what is needed.
f) Maximise plant electrical system efficiencies by ensuring all plant equipment i.e. pumps,
compressors, and electric motors are operating as efficiently as possible.
There are many benefits in opting for energy efficiency, as opposed to opting for new supply options.
Energy efficiency has proven to be more cost effective, speedier, safer and more reliable. New supply
requires construction of new generation, distribution and transmission infrastructure. Energy
efficiency effectively allows for these costs to be bypassed in addition to reducing costs associated
with the maintenance and replacement of equipment. This is due to the longer life-span of energy
efficient products as compared to other technologies. Many of the risks associated with generation,
which often create high costs for operators, are also effectively avoided through energy efficiency
(17).
Efficiency may be achieved from small scale interventions such as fitting energy efficient light bulbs,
to larger interventions such as energy efficient process optimisation at deep underground mines.

17
2.2.3 EVOLUTION OF DSM
Steep increases in fuel prices, inflation and interest rates in the 1970s severely affected many utilities’
ability to finance, operate and maintain electrical systems. To be financially sustainable, utilities
increased electricity tariffs. This was met with drastic change in the behaviour of users who protested
by decreasing energy use, resulting in incorrect costing and demand forecasting for the utilities,
which were the initial basis of the planning process. Inaccurate projections coupled with the difficulty
of resource planning started to become a major concern for utilities at the time (18).
To address the situation, utilities began to develop energy saving programmes. The driving forces of
such initiatives were based on the use of energy efficient technologies coupled with customer
communication on energy saving. Unfortunately these initiatives were unsuccessful as they were not
as user friendly as envisaged.
A more customer orientated option was DSM, which holistically considered utilities, the needs of
customers and the available technology options of the time.
The optimisation of the demand interface by utilities through the development of a logical framework
that doubled as a marketing strong-point in which supply-side planners were persuaded to look at
demand as a variable commodity. This framework was able to accommodate changes in supply and
demand requirements at the same rate, and not in isolation.
By the 1990s Load Management, energy conservation and energy efficiency were collectively
understood as DSM. They aimed to decrease the need for electrical energy and generation capacity.
Research has shown in the United States alone, by 1993, more than 20 million participants were
involved in more than 2300 DSM initiatives, which had been launched by a minimum of 600 utilities.
Annual expenditures were measured in the billions of dollars, energy savings were measured in
billions of kilowatt-hours and peak load reductions in thousands of megawatts (18).
The focus on DSM was however short-lived and shifted more towards the idea of reducing costs and a
better reliance on utilities. International competition, environmental compliance and power-quality
concerns prompted customers to search for technology solutions. There was a greater emphasis
placed on the reduction of costs by wholesalers and this added pressure on utility executives.

18
DSM was not seen as a useful aid toward market expansion as it was implemented purely as an
energy efficiency option. Utilities viewed unregulated energy service businesses as goldmines and
spent endless amounts of money pursuing these options with little consideration for regulated, retail
clients. In some cities, efficiency programs were mandated by the energy regulator, thereby forcing
compliance, whilst in other cities, institutions were developed to encourage energy and technology
research.
With the new millennium, utilities tended to stray from customer DSM programmes and it was only
those mandated by law that remained in existence. Today, the focus of utilities has reverted to
customer retention by understanding customer segmentation and developing DSM programmes
attractive to those segments; as a result DSM is once again growing and having a positive impact on
the environment (18).
2.2.4 GLOBAL BARRIERS TO EEDSM
The lack of participation from financial institutions globally has had a negative impact in many
countries on the achievement of EEDSM (19). Loans for EEDSM are not easily available as they are
regarded as high risk transactions, due to the motivation for the loans stemming from expected
savings from reduced energy consumption. Neither are these loans asset-based, thus seeing financial
institutions being more reluctant to assist in the process. Split-incentives are more widely received in
many areas as they see two parties in a transaction meeting halfway to implement energy savings. A
typical example is where a residential developer installs EE equipment and potential owners and
investors cover the cost of everyday usage. There are also many other barriers to energy efficiency
investment (19) which include:
• High project development costs with payback periods greater than five years, which have a
negative impact on investing in EEDSM projects.
• Limited demand for EE goods, whereby the unit cost per item remains expensive, which
reduces the potential to negotiate on economies of scale.
• Limited financing institutions that understand the benefits of EE.
• Perceived risks of implementing new technologies.
• Other higher return projects have lower risks and are more attractive.
• Procurement policies favour lowest cost equipment and do not consider the long term
running costs of the equipment.

19
• Import duties on EE equipment result in higher prices.
• Lack of appliance standards and building EE codes.
Another contributing factor towards a gross market failure in EE, is the lack of information to invested
parties. DSM and ESCOs were designed to combat such challenges, but need to be further educated
on the primary needs of investors. ESCOs need to tailor-make solutions to accommodate different
communities and their specific needs in order to have the maximum desired effect. Due to this
technicality in promoting EE, the full desired potential is yet to be reached on an international scale
(19).
2.2.5 IMPLEMENTATION CHALLENGES TO EEDSM IN DEVELOPING COUNTRY’S
Developing countries are further disadvantaged by additional barriers to EE; this includes
informational, financial, technical and behavioural barriers (19). Examples of which are:
• Information about EE technologies are not widely communicated nor are they widely
available in developing countries and what is, is not of the best quality.
• Many developing countries are unable to afford the costs that accompany efficient
technologies; neither are they able to access funding to support these ideas.
• The role of government is very important in the success of EE in a country and lack of
participation by governments in the form of policy or financial incentives, leads to a lack of
success of EEDSM.
• Developing countries are presented with many contrasting issues that prevent a consensus
on how to promote EE topics, such as informational issues, financial issues including
incentives or subsides, market-based initiatives and regulations.
• Developing countries face other pressing issues, such as food and water security; hence
prioritising EEDSM is not a high priority.
• ESCOs were designed to assist a general target market and developing countries need to
adapt such structures to suit their target markets and requirements. The implementation of
such programs without considering local needs such as supplier development and
localisation, results in a lack of success and additional frustrations, which in turn result in a
reluctance to re-try.

20
• The diverse economic and social make-up of developing countries make it difficult for them to
be compared at international levels, which results in further difficulties in ascertaining their
needs and the potential for EE improvements.
2.2.6 INTERNATIONAL OUTLOOK ON DSM
EEDSM has been implemented successfully in more than thirty countries. This has resulted in many
countries deferring the need to build new coal fired power stations, thereby contributing positively to
a greener environment.
In the United States (US), the Arab oil embargo of 1973 triggered the implementation of EEDSM,
which resulted in positive growth in that economy. In 2000, the countries energy intensity index when
compared to year 1975, reduced by forty percent thereby making EE the country’s largest growing
energy resource when compared to oil, gas, coal and nuclear energy (20).
Towards the latter part of 1980, the US implemented more than 1,300 EEDSM programs, which
resulted in reducing the peak load by 1.4 percent. Between 1985 and 1995, more than five hundred
utilities started to implement EEDSM programs, thereby reducing peak load by 29 GW. Seeing the
benefits of EEDSM, utilities in the US began increasing their investment in EEDSM from 900 million US
dollars in 1990, to 2,700 million US dollars in 1994 (20).
In Australia, electricity generation is predominately from coal, which is used to power large
aluminium plants. The cheap supply of electricity from coal has resulted in high energy consumption
and low focus on EE. This situation has created a good market for Energy Services Companies to
target customers with high energy consumption.
In Indonesia, the country focuses mainly on the residential sector to clip peak loads. The EEDSM
initiatives are targeted at household lighting and appliances, as well as street lighting. Similar to other
countries the Indonesian government acknowledges that EEDSM programs (including labelling of
appliances) is cheaper than building new power plants; therefore strong focus is on creating
awareness of EEDSM (17).

21
2.3. EEDSM IN SOUTH AFRICA
Prior to 2003, due to the prevalence of surplus generation capacity and the perception that EE could
erode Eskom’s revenue and profitability, DSM was not viewed as a priority in South Africa. Promotion
of energy efficiency was undertaken as a ‘PR’ exercise rather than a business priority (9). As per
Figure 2-2, the first approach into DSM in South Africa began in 1990 with the introduction of TOU
tariffs.
In 2003, the threat of capacity (MW) deficits was brought to the forefront when electricity demand
increased sharply, especially during winter. It was realised preventative action needed to take place
before shortages became a real problem.
To address this issue, the National Electricity Regulator of South Africa (NERSA) and Eskom reached
an agreement regarding the formal implementation of DSM in 2003. NERSA then developed goals and
guidelines in the form of a policy in 2003 that were carried out by Eskom from 2004 onwards. The
main idea was to shift high electricity usage from peak demand periods to off peak periods. Annual
targets were set at 152 MW (21).
As per the policy set out by NERSA, Eskom was allowed to fund customers via qualified ESCOs. Load
shifting projects could be subsidised up to 100% in terms of start-up and installation costs, and energy
efficiency projects by up to 50%. ESCOs at the time mainly targeted municipal ripple load control and
industrial/mining projects. The real savings per DSM project were recorded and tracked by a technical
audit department at Eskom.
Year 2005 saw the implementation of a new incentive programme for industrial customers and
municipalities. This was in the form of the Demand Market Participation (DMP) programme. A
reduction in electricity consumption by active participants was rewarded with financial compensation
when requested by Eskom’s System Operator.
In 2006 a very aggressive DSM intervention was implemented in the Western Cape to cope with the
capacity shortfall in the region brought about by a technical failure at the Koeberg power station. The
DSM intervention in the Western Cape consisted of the following:
• A mass-roll out of 5.5 million EE compact fluorescent light bulbs in the residential sector.

22
• A “Power Alert” was promoted through television broadcasts to illustrate constraints on the
electrical grid so that consumers could become actively involved in reducing electricity
consumption.
• Gas stoves were subsidised and made available at exchange points in order to reduce electric
usage during cooking times.
• 20 000 geyser blankets were given to residential consumers in order to reduce heat losses
from electric geysers.
In 2007, the Western Cape DSM programme was extended to other provinces in light of the potential
energy shortage the country faced. Subsidised Solar Water Heating (SWH) was actively promoted at
this time to reduce peak demand for electricity and also to make it affordable for home owners to
purchase a unit.
Load shedding in January 2008 showed the gains achieved through the DSM programme were not
sufficient to address a system in crisis, and the Power Conservation Programme (PCP) was
subsequently developed to ensure electricity demand would be kept to manageable levels.
Following the restoration of system stability in May 2008 and the lower electricity demand brought
about by the economic downturn and increased tariffs; it was decided by government not to
implement PCP. A Voluntary Energy Conservation Scheme with Eskom’s Top 250 customers was
however introduced.
Eskom continued to pursue EEDSM initiatives within the established NERSA frameworks and targets.
However, greater emphasis was placed on EE programmes than on load management programmes,
as electrical constraints were being experienced throughout the day and not just in peak times.
Eskom used television broadcasts and the Internet to communicate energy status and electrical grid
constraints as well as EE savings achieved, and gave regular updates on the building of the new power
station.

23
Figure 2-2: Timelines of DSM in SA (22)
2.3.1 THE NEED FOR EEDSM IN SOUTH AFRICA
A large percentage of the South African economy is generated from the mining and other energy
intensive industries. In order for the economy to grow and strengthen further, any possibility of an
energy crisis has to be avoided. Coal is recognised as the predominant fuel source of power
generation in South Africa. This overwhelming reliance on coal has brought about damaging effects
on the environment (23). This has resulted in large amounts of CO2 emissions and marks South Africa
as a major CO2 emitter per capita globally.
EE and DSM have been recognised by government as vital components in South Africa to establish a
strategy of sustainable development. According to the, “White Paper on Energy Policy,” published by
the South African government in 1998, energy services and products need to be more accessible to
consumers in all sectors of the economy (24). Simultaneously, the negative effects of energy
conversion on the environment must be considered and avoided wherever possible.

24
2.3.2 GOALS AND OBJECTIVES OF SOUTH AFRICA’S EE STRATEGY
South Africa’s national EE Strategy is to ensure affordable energy for all. This will be achieved by
promoting sustainable energy development and efficient use of energy, which will positively impact
on human health and the environment (25). It is therefore important Eskom, and in particular IDM
aligns with the country’s goals and objectives of the strategy by:
• Promoting EE, this will allow for a more positive impact on the environment. A saving of 1
kWh on the demand side leads to a saving of approximately 1 litre of water and 0.9 kg of
carbon dioxide at the power station (supply side).
• Creating a market for EE that will lead to employment opportunities for potential ESCOs,
installers, suppliers and the youth.
• Ensuring through EE that there is adequate supply of electrical energy for all users, and to
consider the poor when requesting tariff increases and implementing EE measures.
• Contributing to the reduction of Greenhouse Gases. An additional benefit of EE.
• Enhancing energy security, through EE that could protect the country against external or
international energy supply issues and resultant price hikes, as currently experienced.
• Reducing or deferring the necessity for additional power generation capacity. Currently, the
generation capacity is at a level lower than required to satisfy the rising national maximum
demand, but overcoming this is achievable through EEDSM.
2.3.3 THE BENEFITS OF ENERGY EFFICIENCY DEMAND SIDE MANAGEMENT
(EEDSM) IN SA
The social and economic benefits of successfully implementing EEDSM as seen by IDM and other key
stakeholders are highlighted as follows (26):
• Achieving the IDM targets over a sustained period is essential to ensure security of supply in
South Africa. The impact of power disruptions and resultant costs on the economic sector are
more damaging than funding EEDSM or practising greater levels of efficiency in the corporate
sector, which will assist greatly in preventing such disruptions.

25
• EEDSM provides a cheaper alternative to supply side generation. The unit cost of new
capacity generation is far greater than that of the conservation of the same amount through
EEDSM programmes. Therefore, it is evident that supply cost of electricity will be
substantially reduced through effective DSM strategies.
• EEDSM, through energy efficient technologies can be considered a vital contributor towards
the reduction of climate change within a country achieving environmental benchmarks and
improving social welfare.
• The lifespan of current energy sources such as coal is extended through effective EEDSM and
this in turn allows for the country’s economic resources to be efficiently distributed.
• Efficiency in homes may allow for a better quality of lighting, improved quality of refrigeration
storage (freshness of food is retained), and positive impact on the environment.
• Buying Time; the most valuable commodity that may be salvaged through EEDSM is its ability
to reduce electrical demand in a short space of time, thereby contributing to security of
supply. Applying EEDSM measures effectively will give Eskom the opportunity to plan
effectively (due to no load shedding) in a less stressful environment. This will allow the
company the needed time to make key decisions on building or deferring construction of new
power stations.
2.3.4 BARRIERS TO ENERGY EFFICIENCY IN SOUTH AFRICA
According to the National EE strategy of South Africa (25), the barriers to EE in South Africa need to
be clearly understood in order to be overcome. Barriers that could impact the development of IDM
funding solutions:
• ESCOs are available to conduct energy audits in companies to advise clients on appropriate
energy efficiency opportunities available to them, the benefits of these and why they should be
pursued. Industry, however, has misconceptions about EEDSM and is reluctant to change any of
their existing processes. There is a misconception that a change to EE will bring about disruptions
and a lack in productivity and there are underlying fears that previous incompetence may surface
regarding neglected energy savings opportunities.

26
• There are insufficient sources of funding available in South Africa for EEDSM. Experience drawn
from international examples has shown that without public or utility funding, EEDSM
programmes are not likely to function at optimal levels.
2.3.5 REGULATORY POLICY ON DSM IN SOUTH AFRICA
In 2004, NERSA promulgated the Regulatory Policy on Energy Efficiency and Demand-Side
Management (EEDSM) for the South African Electricity Industry (21).
This EEDSM Policy made EEDSM planning and implementation one of the license conditions of all
major electricity distributors. The responsibilities and obligations of distributors of electricity and
ESCOs were defined in this policy. An independent Monitoring and Verification (M&V) body,
accountable to NERSA, was established to ensure EEDSM implementation is audited. The EEDSM
Fund is to be administered by Eskom in line with a set of rules as implemented by NERSA.
2.4. THE ESKOM DSM FUND
The Eskom EEDSM fund established by NERSA was considered to be consistent with international best
practice (23). NERSA established the following rules and procedures for the deployment of Funds as
shown in Figure 2-3.
• Eskom would be required to implement EEDSM as a condition for the approval of Eskom’s
tariff increases in accordance with the regulatory policy on EEDSM. Eskom would submit an
EEDSM rollout plan to NERSA.
• Eskom would establish the EEDSM Fund and recover the direct EEDSM costs from the tariffs
in the manner specified by NERSA.
• Eskom would evaluate and approve EEDSM projects submitted by ESCOs and any customers
that have internal ESCO capability. This process is called the ESCO process.
• NERSA would approve the benchmark criteria for approval of EEDSM projects by Eskom.
• ESCOs would investigate feasible projects with customers and obtain a Letter of Intent from
those customers. A project proposal would then be submitted to Eskom DSM.

27
• The Independent Measurement and Verification (M&V) would be initiated before
implementation of the project to verify the MW reduction and/or energy to be saved per
EEDSM project and report to the NERSA, Eskom DSM, and customers.
• ESCOs would be required to have a maintenance or performance Contract with a customer.
• All maintenance costs would be borne by the customer.
Figure 2-3: Eskom EEDSM fund mechanism (23)

28
2.4.1 ESCO PROCESS
The ESCO mechanism is targeted at Energy Services Companies (ESCOs) or customers who are
specialists in energy management. ESCOs who are accredited by Eskom operate by establishing a
three-way partnership between themselves, Eskom and a customer as per Figure 2-4, and use their
knowledge of Demand Side Management technologies and programmes to determine the best way of
obtaining electricity savings at the customer’s premises (9).
Figure 2-4: ESCO Model (9)
2.4.2 PRINCIPLES OF THE ESCO MODEL
Eskom will, as a service to customers, identify a number of different ESCOs in South Africa on the
Eskom data-base, which a customer may appoint to undertake the Energy Studies in respect of its
various Installations. The ESCOs being independent, will in its own right and on its own initiative
pursue the conclusion of an agreement and the undertaking of the Energy Study directly with a
customer and not as an agent or representative of Eskom (9).
Eskom gives no representation or warranty and undertakes no liability regarding the skill, expertise or
suitability of the ESCOs to undertake the Energy Study. On completion of an Energy Study and
pursuant to the agreement concluded between a customer and the ESCOs, the findings of such study

29
will be presented by the ESCOs to the customer for consideration. Should the recommendations of
the ESCOs contained in the Energy Study be accepted by a customer, the ESCOs will submit the
Application to Eskom for consideration for and on behalf of the customer.
On receipt of the Application, Eskom will audit the Application for compliance prior to submitting the
Application for technical, cost-benefit and financial evaluation as per Figure 2-5, by various
committees within Eskom.
Eskom will have absolute discretion to approve or reject any Application. Should an Application be
approved by Eskom, Eskom will appoint the ESCOs to undertake the procurement, installation and
commissioning of the DSM Measures. Prior to installation of the DSM Measures the energy
consumption at the Installation will be measured and verified by the M&V Entity in accordance with
the Measurement Guideline.
Figure 2-5: ESCO model process flow

30
2.4.3 ESCO PROCESS CHALLENGES
According to the World Bank group (23) and the local ESCO market in South Africa (27), the biggest
challenge experienced with the ESCO process is the time taken by IDM to evaluate projects, which
could take up to 15 months.
In general the ESCO model process activities were not well defined (28).The process itself lacked
control and transparency. There were no clear roles and responsibilities for the parties involved
leading to lengthy approval turnaround times. Table 2-1 presents a summarised view of the typical
phases of the ESCO process, with the corresponding timelines to complete the various activities. From
the table it can be seen that IDM has major control over Phase 2 (project evaluation) and Phase 4
(contracting), which takes up to 15 months to complete. Although IDM does not have direct control
over Phases 1, 3, 5 and 6 it does raise concerns that the time taken on these phases is so lengthy.

31
Table 2-1: Phases of the ESCO process with corresponding timelines
Phase 1
Activity
Average time to complete
activity 1 to 3
(DSM investigation by
ESCOs)
1. ESCOs market DSM to obtain Letter of
Intent (LOI)
2. ESCOs conduct detailed audit at customer
site
3. ESCOs formulate project and submits to
IDM for funding
(3 to 6 months)
Phase 2
Activity
Average time to complete
activity 4 to 8
(Project evaluation by IDM)
4. Technical evaluation
5. PEC approval
6. Request M&V to develop baseline
7. Financial evaluation
8. Commercial evaluation
(6 to 12 months)
Phase 3 Activity Average time to complete
activity 9
Develop project baseline
(M&V)
9. M&V to develop project baseline to
determine “as is” operation of the facility
12 weeks
Phase 4
Activity
Average time to complete
activity 10 & 11
(Contracting)
10. ESCO signs implementation contract with
IDM
11. Customer signs DSM agreement with IDM
(3 to 15 months)
Phase 5
Activity
Average time to complete
activity 12
(Implementation)
12. ESCO implements project at customer site
as per the conditions of contract
(project dependent, average
– 12 months)
Phase 6
Activity
Average time to
complete activity 13 &
14
(Performance assessment &
maintenance)
13. Performance assessment by M&V
14. Customer maintains implemented savings
for 5 years
(Up to 3 months)

32
2.4.4 DETAILS AND CHALLENGES EXPERIENCED WITH ACTIVITY FLOW 1 - 14
As per Table 2-1 the activities/steps in each phase will be discussed together with the challenges
experienced with each activity.
� Phase 1 - Activity flow 1 (ESCOs market DSM to obtain LOI)
This activity entails the customer signing a LOI with the ESCO to conduct an audit at the customer’s
site to identify possible energy efficiency interventions. The LOI has an expiry date, (usually three
months) therefore the customer can terminate the agreement if he is not satisfied with the services
of the ESCO and could appoint another ESCO.
Challenges with activity flow 1: ESCOs often find it difficult to sell the ESCO model to customers as
the programme rules are not transparent or well defined. There is generally a lack of understanding
of the risks associated with the ESCO model by the ESCO. In some cases it could take up to 3 months
to obtain a LOI from a customer.
� Phase 1 - Activity flow 2 and 3 (ESCOs conduct detailed audit and submits project to
IDM)
The ESCO conducts a detailed energy audit which includes the identification of large electricity users,
plant layouts, historical data and process flows, which will inform the development of a project
proposal. The project proposal details the possible and recommended interventions for electricity
demand reduction. After completion of an energy audit, the ESCO produces a proposal on the energy
savings initiative to the customer which must be signed off by the customer and thereafter submitted
to Eskom for funding purposes.
Challenges with activity flow 2 and 3: ESCOs allocate time and funding to investigate EEDSM projects
that may eventually not even be funded by Eskom due to incorrect information. Project investigations
could take up to 3 months to conclude. After conducting an energy audit, the customer could also
decide not to go-ahead with the project due to budget limitations.

33
� Phase 2 - Activity flow 4 (Technical evaluation of project by IDM):
The first level of evaluation revolves around the technical aspects of the project. The technical team
members will check as a minimum:
• That the existing technology at the customer site is well defined.
• That the proposed technology is clearly described including conformance to specifications.
• That the proposed solution increases production (i.e. gives the client a competitive edge).
• That the proposed load profiles are based on actual measured or manufacturer specifications.
• That the methods used to establish the savings are defined.
• That there are variables that could affect the proposed savings ie. production increases, seasonal
changes, time of use, commodity price influence.
• What the MW and MWh savings are.
• Whether the proposed savings will be achieved monthly or yearly and in winter or summer.
• What the estimated Implementation period of the project is.
• What the monetary savings to the client due to the intervention are.
• What the lifespan of the company or mine is.
Challenges with activity flow 4: there was insufficient staffing in the technical section of IDM to
evaluate projects; hence staff could not cope adequately with the incoming workload. Good
commercial sector EE projects were being disqualified because they operated outside the evening
peak periods, and there were no incentives to encourage EE projects. Time to evaluate projects could
take as long as 3 months. Projects were being registered by TEC personnel, which should have been
the responsibility of the project manager (PM).
� Phase 2 - Activity flow 5 (Project evaluation committee approval)
On approval from the TEC, the PM would submit the project to the Project Evaluation Committee
(PEC) for approval. The PEC has a mandate to only approve the technical aspects of the project. On
approval the committee would recommend the project go to the financial and commercial
committees for approval.
Challenges with activity flow 5: at the PEC meeting, proposals were often rejected as the PM could
not adequately address the questions raised by committee members. Frequent requests for more
information had to be made to the ESCO by the PM, leading to delays.

34
� Phase 2 – Activity flow 6 (M&V request)
On approval from PEC, and based on a high confidence level (>90%) that the investment and
commercial committee will approve the project, the PM will request an independent Measurement &
Verification (M&V) team to develop an M&V plan and baseline report of the project at the customer
site.
Challenges with activity flow 6: The M&V teams do not receive a copy of the project proposal from
the ESCO, hence it is crucial that the PM supply as much information on the M&V request form.
Often the PM did not complete the M&V request form adequately, which led to a misunderstanding
of the request.
� Phase 2 - Activity flow 7 (Financial evaluation)
Whilst the baseline is being developed, the PM will submit the project to the financial committee. The
financial committee evaluates the submission against the NERSA benchmarks and the Eskom financial
plan. The committee ensures there are funds available to support the application, as well as to check
the cash flow for the project. The committee also checks the correct governance process is followed
and that all possible risk are identified and mitigations are in place.
Challenges with activity flow 7: No major challenges were experienced with activity flow 7.
� Phase 2 activity flow 8 (Commercial evaluation) and phase 4 Activity flow 10 (ESCO
signs contract with IDM)
On approval from the Finance committee, the project is submitted to a project buyer at the
commercial department. The appointed buyer will check the project for:
• Tax Clearance and VAT registration Certificates
• Compliance with the Construction Industry Development Board certificate (CIDB)
• Financial statements
• BBBEE certificates
• Detailed cost breakdown and cost comparisons with similar projects
• Compliance to Supplier Development and Localisation (SD&L) objectives

35
Once checked the buyer will prepare a mandate for the Procurement Tender Committee (PTC)
approval. At PTC, the mandate is either approved or rejected. If approved the buyer will negotiate a
discount and conclude a contract with the ESCO, after which the New Engineering Contract (NEC) is
drawn up and signed by Eskom and the ESCO. The main terms of the NEC include:
• Contract value
• Project start and end dates
• Scope of work (SOW)
• Retentions – (normally 7.5%. of which 5% will be released on project completion and 2.5% after
measure acceptance date)
• Requirements of the project
• Site information
• Project Plan and deliverables and milestones
• Penalties for non- performance on the proposed savings
Challenges with activity flow 8 and 10: the commercial department did not negotiate contracts in a
simple, time efficient manner. The requests for discounts during negotiations led to delays. ESCOs
price a project on benchmark values and did not understand why discounts should be given. New
requirements were implemented without the knowledge of the ESCOs. The commercial process for
EEDSM funding was lengthy and slow and could take up to 12 months to complete. A buyer had to
evaluate a project in detail to determine whether the costs as submitted were in fact correct or if the
ESCO was making a profit that was not in line with expectations. In some cases this took many
months as the ESCO had to justify the costs in processes that Eskom staff had little or no expertise in.
Thus it was very difficult for Eskom to decide on a cost to provide to the ESCO. The NEC penalties do
not encourage over performance on projects; the ESCO was penalised for underperformance and
there were no rewards for over performance. In addition, in many of the cases, the ESCO had
committed to a price that Eskom would pay to a customer and now had to go back to the customer
with a revised cost. This led to further delays.
� Phase 3 - Activity flow 9 (M&V baseline development)
Following on the M&V request from the PM, the M&V team has to develop the plan and baseline
report at the customer site. The goal of this process is to establish a baseline from which to measure
future savings. The customer and the ESCo have to agree with, and sign off on the M&V baseline.

36
Challenges with activity flow 9: At times, due to workload, the M&V teams could not go to site to
conduct baseline measurements as planned. The cost of the metering equipment could also be costly
as compared to the project cost and size
� Phase 4 - Activity flow 10 (ESCO signs contract with IDM)
This step including the challenges is discussed under activity flow 8.
� Phase 4 - Activity flow 11 (Customer signs DSM agreement with IDM)
Following the evaluation procedures, the next step is for the customer to sign the DSM agreement.
This takes into account the savings as measured against the signed off baseline, as well as highlighting
the main penalties imposed for the non-achievement of the expected savings, termination of the
contract and penalty for a permanent reset of the baseline. The standard duration for these
agreements is five years. The customer’s obligation starts on the Measure Acceptance Date (MAD),
whereby the project risk is transferred by the ESCO to the customer.
Challenges with activity flow 11: The DSM Agreement which has to be signed between Eskom and
the customer is onerous, leading to more delays as both the customer and Eskom legal teams need to
vet it. This activity could take up to 15 months to complete while the customer’s legal team might
insist that Eskom change clauses in their favour.
� Phase 5 - Activity flow 12 (Project implementation)
Prior to implementation starting, it is important for the PM to check the Baseline report, DSM
agreement and the NEC are all signed. The customer is then required to facilitate the project
implementation by providing access to facilities. Implementation begins and progress payments are
made to the ESCO on deliverables at site as per the NEC contract. The ESCO will be expected to
implement the project in a timeous and professional manner.
Project implementation may take up to 12 months, depending on the customer and the technologies
being implemented. When the project is complete the PM will ensure a completion certificate is
signed between the ESCO, Customer and Eskom. This confirms the work has been completed as per
the NEC contract; at this point Eskom will release the 5% retention to the ESCO. The PM will also
instruct the M&V team to verify the actual savings delivered by the ESCO on site.

37
Challenges with activity flow 12: Due to the lengthy approval process, a situation could arise that
process changes could have been implemented by the customer from the time the proposal was
submitted to project implementation hence changing the initial baseline.
� Phase 6 - Activity flow 13 (Performance assessment)
Upon completion of the project, a post-implementation M&V will be undertaken, to ensure the
project meets all requirements laid out in the signed contracts. Further M&V is undertaken for a
period of three months called the Measure Acceptance Period (MAP).
On successful completion of the project, a customer and the ESCO are then expected to jointly sign a
Measurement Acceptance Date (MAD) certificate, at which point the project is officially handed over
to the customer. At this point the balance of the retention is released to the ESCO and the risk of the
project is transferred to the customer.
In cases where there is a non- performance reported during the MAP by the M&V team, the following
criteria will be used to rectify the situation:
� Upon commissioning, the M&V entity will undertake the measurement and verification for a
period of three (3) months to ascertain the performance of the proposed system. Where
possible, the ESCO will be allowed to fine tune the system to ensure compliance on the MW
proposal.
� Should the M&V results be within the acceptable error allowance of 10%, no penalties will be
invoked and the performance will then be accepted by both the customer and Eskom DSM.
The system’s performance MW reduction value will then be used as the system’s capability
value.
� Should the M&V results be beyond the acceptable 10% allowance error, the ESCO shall be
provided with one month’s opportunity to rectify the system’s performance to an acceptable
performance of 90% (minimum). The ESCO shall carry the cost incurred thereof.
� If, on completion of the rectification period, the project’s performance is still beyond the
acceptable 10% error, penalties shall be imposed by Eskom DSM to the ESCO. The ESCO will
be liable to pay the penalties.

38
Challenges with activity flow 13: ESCOs complain that the Megawatt reduction must be measured
between the original baseline and the actual Megawatts after implementation of the EEDSM project
(no baseline scaling). Condonable days should be excluded from performance assessment and the
assessment period extended with the number of condonable days.
� Phase 6 - Activity flow 14 (Customer maintains savings for 5 years)
The customer will officially take over the DSM project on the measure acceptance date and maintain
the savings over five years. Eskom will undertake regular M&V monitoring to ensure the project
continues to go according to plan and meets the accepted baselines, while the customer’s role will be
to sustain the project over this period as per the requirements of the DSM agreement.
Challenges with activity flow 14: it often happens that projects that performed during the PA,
start to underperform during the maintenance phase. The main reasons could be:
• Lack of personnel to take over the DSM measure.
• Limited knowledge by the customer of the installed technology.
• Shortage of skilled resources to maintain equipment.
• Limited interest from site personnel, who may only be interested in production targets and
safety.
2.5. CONCLUSION
Chapter 2, provides an insight into international best practice on Demand Side Management, lessons
learnt and barriers to market implementation. It also explains the ESCO funding model and challenges
thereof.
Both locally and internationally, EEDSM has proven to be a critical lever towards ensuring balance
between supply and demand. Every effort must be made by all stakeholders, particularly national
government, Eskom and NERSA to address the barriers to EEDSM in order to ensure future electricity
supply.
In the opinion of many ESCOs, Eskom appeared to be a barrier to EEDSM implementation rather than
being a facilitator of EEDSM projects. Furthermore, the large uncertainty and delays in the Eskom
evaluation process created risks and made many projects difficult to finance and implement.

39
In the next chapter a preliminary investigation into the development of a new process is conducted in
order to address the challenges of the ESCO process and increase the level of EE in SA. The chapter
will also investigate areas of overlap and synergies between other IDM processes and funding models.

40
Chapter 3
3. PRELIMINARY INVESTIGATIONS INTO THE DEVELOPMENT
OF THE NEW PROCESS
3.1. INTRODUCTION
It was shown in Chapter 2 that the need exists for a new process to evaluate EEDSM projects based
on the challenges experienced with the ESCO process. Preliminary investigations were conducted to
identify solutions to addressing the challenges experienced in approving EEDSM projects. An
international scan was conducted and one of the solutions to reduce the overall time from
application to execution was the introduction of the Standard Offer (SO) process.
Global research shows other countries have implemented SO successfully. In this chapter the new SO
process is introduced. It will look at:
• International experiences with SO.
• An environmental scan towards the development of SO in South Africa.
• Possible barriers to SO in South Africa.
• Possible overlaps/synergies with other IDM initiatives.
3.2. WHAT IS A STANDARD OFFER?
According to an international definition (23), “The Standard Offer is a mechanism for acquiring
demand-side resources (EE and load management) under which a utility (or a government agency)
purchases energy savings using a pre-determined and pre-published rate in cents per kWh based on
verified savings. Any energy user (utility customer) or ESCO that can deliver energy savings is paid the
fixed amounts per kWh (the Standard Offer amounts) upon completion of the EE project and
certification of the achieved savings by an authorised M&V organisation”.

41
3.3. INTERNATIONAL EXPERIENCE WITH SO
The roots of the SO programme can be traced back to energy regulators in the United Stated (US)
who promote the uptake of EEDSM. The funding mechanism of this programme was to offer
performance based incentives to customers that reduced energy consumption via the installation of
EE technologies. The energy payment for every kWh saved was standard. The condition of contract
and requirements of the programme were also standard, hence the name, “Standard offer” (23).
The application of SO as practised in the US varied considerably. Some utilities used SO to target the
industrial and commercial sector, whilst other utilities reached out to the residential sector. Some
utilities requested customers to use Project Developers (PDs), whilst other utilities allowed customers
to be their own PD.
According to the World Bank (23), New Jersey introduced a Standard Offer Programme (SOP) in 1992
and saved almost 1 100 GWh from 1992 to 1997. Currently New Jersey offers attractive incentives to
industrial and commercial customers that can reduce peak load by 200 kW via the services of an
ESCO.
In late 1999, a law was passed in other parts of the US such as Texas, for utilities to reduce 10% of
annual growth in demand through EEDSM. Under the law, SO programs are offered by third parties
such as ESCOs, suppliers and contractors to implement EE technologies at a consumer’s premises. The
EE intervention must produce measured energy and demand savings for a period of 10 years. The
utility provided incentive payments based on deemed savings, (theoretically calculated) and not just
measured savings. Four years later Texas reported a peak demand saving of 341 MW (29).
California also developed SO contracts in response to the federal legislation, thereby offering
attractive rates to the market. However these contracts differed from the conventional SO approach,
targeting renewable and cogeneration type of projects as compared to the traditional lighting
technology contracts. California went on to offer lucrative tax incentives to renewable generators in
the early 1980s, however in the late 1980s the tax incentives had been stopped, leading therefore to
an unintended consequence of the SO contracts not being available (30).

42
3.4. ENVIRONMENTAL SCAN TOWARDS THE DEVELOPMENT OF SOP
An environmental scan was performed to identify pertinent external macro-level issues and
requirements in SA that must be taken into account in the design and implementation of the SOP
(31). These are:
3.4.1 POLITICAL
Funding from NERSA via a tariff increase is expected to be made available to IDM in support of
electrical EE initiatives. Allocation of these funds towards the SOP needs to be discussed and agreed
upon between IDM and NERSA. IDM must ensure that the SOP budget will be ring fenced and must
not be reallocated to other IDM funding solutions.
3.4.2 SOCIAL
The skills shortage in SA is a major concern; this has an impact on ESKOM. They are required to secure
and maintain sufficient personnel with the required skills in management and engineering as well as
those in the artisan and technical fields in order to ensure a greater efficiency in the usage of
electricity.
Some of the reasons for the skills shortages may be attributed to there being a national and global
need for people skilled in those areas. Companies that offer attractive remuneration packages are
most likely to receive the bulk of the skills pool. There is also very limited training available to artisans
in the EE field as compared to other engineering fields; thereby leaving less than adequate numbers
of artisans to work with the latest EE technologies.
3.4.3 TECHNOLOGICAL
To achieve large scale infrastructure development urgently needed to grow the SA economy,
technology will be required. This will entail large investments by Eskom and other role players
currently involved with energy efficient technologies such as CFL’s and other new EE technologies, to
create an environment whereby local manufacturing of EE technologies can be encouraged through
supply and demand.

43
3.4.4 LEGISLATION
The Broad-Based Black Economic Empowerment (BBBEE) Act, (53 of 2003), (33) and respective Codes
of Good Practice require government departments and state owned enterprises implement black
economic empowerment measures to develop and establish black entrepreneurship in the economy.
Eskom therefore has to ensure that opportunities are created for BBBEE companies by setting aside a
pool of funds for their development. Eskom’s policy must support and promote the participation of
BBBEE companies in the areas of manufacturing, extraction, EE and professional consulting.
3.4.5 ENVIRONMENTAL
Due to global issues such as climate change, there is a drive throughout the world to achieve a
reduction in demand for energy and to improve energy efficiency. The attainment of energy efficiency
is deemed to be the fastest, cheapest and cleanest way to extend the world’s energy supplies and to
reduce greenhouse gas emissions.
There is a growing involvement of environmental pressure groups and other stakeholders who have
expectations utilities such as Eskom will improve EE nationally. The effectiveness of these
programmes will have to be visible more immediately, as well as sustainable.
3.5. IDENTIFYING POSSIBLE BARRIERS TO SO IN SA
There have been issues identified as possible barriers for the implementation of SO in South Africa
and should these not be correctly understood and addressed, could result in the ineffective
implementation of the programme resulting in the country not attaining targeted energy savings (31).
3.5.1 BARRIER 1: PERCEPTIONS REGARDING THE COST OF IMPLEMENTING EE
TECHNOLOGIES
There are perceptions by commercial and industrial customers that technology based energy
efficiency interventions cannot be justified due to the perceived lengthy payback periods. Customers
are of the view, even though energy costs are rising the cost of implementing energy efficiency
measures relative to the cost of energy, is still high. Energy efficiency measures are often perceived
as disrupting production processes. In view of this, EE measures are not actively and rapidly being
implemented.

44
To address this barrier, both Eskom and ESCOs need to demonstrate to energy consumers the
benefits that will accrue after the initial capital outlay towards the SO programme is made.
3.5.2 BARRIER 2: VOLATILITY OF THE RAND
Due to volatility of the South African Rand on the currency market, customers find it difficult to
appropriately budget for the import of energy efficient technologies. The volatility leads to
unwillingness by customers to invest in EE solutions towards the SO approach.
To address this barrier the ESCOs will need to reassure customers by stabilising the costs of EE
technologies and taking out the necessary financial forward cover. It is also necessary for the DTI and
the SA Reserve Bank to engage on foreign exchange and importation of goods, and to create
mechanisms to enable EE technologies to be produced in SA. This mechanism will create much
needed jobs in SA, and will stabilise the supply side value chain.
3.5.3 BARRIER 3: SCEPTICISM REGARDING THE EFFICACY OF ESCOS
Customers in South Africa do not show a great inclination to the use of ESCOs to attain the more
efficient use of energy. This could be attributed to this being a fairly new concept in this country and
there has been no official standardisation of their service levels or expectations in terms of
performance. Therefore ESCOs are not the first option in the market when implementing energy or
cost efficiency measures.
To address this barrier, the market needs to be educated on the benefits of using ESCOs as well as the
rate of successfully implemented plans and projects so they are a more attractive option for
commercial and industrial customers.
3.5.4 BARRIER 4: PROTECTION OF TRADE SECRETS BY INDUSTRIAL CUSTOMERS
The need to protect trade secrets has prevented industrial processes being made available to ESCOs
by many companies. Therefore ESCOs keep their distance from addressing processes and rather focus
on standard technology applications such as pumps, boilers, compressors, etc.
To address this barrier, industrial customers should be made aware that through confidentiality
agreements and contracts, they will be well protected against sharing of information with third
parties. They should also be given the opportunity to use Eskom to develop and implement their own
energy efficiency projects.

45
3.5.5 BARRIER 5: COMPETITION FOR ESCOS FROM LARGE INDUSTRIAL
COMPANIES
ESCOs would benefit most from the larger industrial companies as they could yield larger profits;
however, as these companies have their own electrical and mechanical engineers, they move towards
implementing their own EE measures in-house rather than using ESCOs.
To address this barrier, the value of ESCOs needs to be highlighted for industrial companies to be
encouraged to use them. The ESCOs need to explain the use of in-house resources can also prove to
be in-effective as these resources focus on other plant related matters that are more pressing than
becoming EE.
3.5.6 BARRIER 6: APPROVAL REQUIRED FROM NERSA FOR THE SOP
The implementation of the SO is dependent on the pricing being worked into the NERSA Multi-Year
Pricing Determination (MYPD) application. This can be a time consuming process, which could
negatively affect the perceptions of the proposed SO on the market, resulting in consumers declining
to take up the concept.
To address this barrier, consultation time with NERSA must be accounted for in the planning stages so
it does not delay the process when pricing and principles need to be decided upon.
3.5.7 BARRIER 7: LACK OF AWARENESS AND UNDERSTANDING OF EE
TECHNOLOGIES
EE advisors are often perceived as being too expensive to consult with in order to become more
educated on the range of energy efficiency products or benefits available. Without the use of these
consultants, customers do not have access to enough information.
To address this barrier, EE advisors should offer a low cost or no cost advisory service to customers in
an attempt to recover this cost when at a later stage the customer decides to implement EE solutions.
Also the advisor needs to create a greater sense of awareness of EE technologies and their benefits to
increase a customer’s willingness to participate in EE.

46
3.6. POSSIBLE OVERLAPS/SYNERGIES WITH OTHER IDM INITIATIVES
The implementation of the SO has to be considered against the likelihood there will be are areas of
overlap or synergies with other IDM funding models that could lead to confusion in the market; hence
understanding the existing funding models is important. Table 3-1 shows a comparison of all IDM
funding programmes in SA with reference to project size, target sector and payment structures.
Table 3-1: Comparison of IDM funding options
Programmes /
funding models
Description Project size
(MW)
Target
sector
Payment structure
ESCO Model
Payment for Demand (MW)
savings made to ESCO, based
on actual verified savings,
with 5 year sustainability
agreements with the
customer
Generally
> 500 kW
Industrial &
mining
Progress payments made during
implementation. Final payment
based on average benchmark of
R5.25 million per MW saved
Performance
contracting(PC)
ESCOs tender for the
installation of large blocks of
EE technologies at multiple
sites in SA
Total 3 year
savings
> 30GWh
Industrial
and mining,
limited
commercial
applications
Payments based on actual M&V'd
savings every 3 months, for a
period of 3 years. Payment of
55c/kWh during high rate
10c/kWh during low rate period.
Standard Product
(SP)
A rebate is paid directly to the
customer for installing
predetermined EE
technologies.
Ranging
from 1kW to
250kW
Commercial
and
agricultural
Rebate calculated based on
number of in-efficient
technologies replaced, benchmark
rates and estimated load factors.
Product lends itself towards a
deemed savings approach rather
than an M&V’d approach.
Aggregated
Standard Product
(ASP)
Eskom allows ESCOs to
aggregate individual customer
projects through a single
contract.
Min: 1MW
Max : 5MW
Commercial
and
agricultural
Calculation of rebates the same as
the SP. Aggregated payments for
every 1MW of delivery.

47
Programmes /
funding models
Description Project size
(MW)
Target
sector
Payment structure
Residential Mass
Rollouts (RMR)
ESCOs are appointed to
replace EE technologies with a
"basket" of standard EE
technologies in the residential
sector
Min: 5MW
Max: 20MW
Residential Payment based on standard
pricing of the "basket" of standard
technologies.
CFL Mass Rollout
Eskom procures large volumes
of CFL’s that are implemented
via a mass door-to-door
campaign at residences
Based on a
tendering
process.
generally
>100MW
projects
Residential Payment for CFL’s to suppliers
based on delivery to site.
Progress payments to
ESCOs/installers based on actual
installation substantiated by
audited database
Demand
Response (DR)
The DR programme contracts
with customers that have
flexible load to switch part of
their plant operation on
request from Eskom.
No ESCOs are involved in this
programme
Min: 1MW Large
industrial
Multiple fixed rates per MWh
reduced are paid to the customer.
No capital payment to customer
Power Buy Backs
(PBB)
Power buyback would involve
Eskom paying industrial
customers a rate per MWh
over extended periods of time
for not consuming power
>10MW Large
industrial
Fixed rate per MWh over a
defined period.
Energy
Conservation
Scheme (ECS)
ECS consumers will receive an
energy allocation based on
their consumption over a
baseline period. Should
consumers exceed their
monthly energy allocations,
excess energy tariffs
(penalties) will be charged to
discourage excessive usage.
>25GWh/a Large
industrial
No payment

48
When the proposed SOP is compared with the current IDM initiatives as per Table 3-1, several areas
of overlap can be identified. These being:
• The targeted customers being commercial and industrial customers.
• Channels to market via ESCOs.
• Incentives/subsidies are similar.
The target customer overlap occurs in the commercial, mining and industrial sectors. The current
IDM programme entails using ESCOs to approach and visit interested customers and at their request,
perform energy audits to determine possible EE interventions. The basic premise of the SO
programme is also to utilise ESCOs so as to deliver energy and cost savings from commercial and
industrial customers.
3.7. CONCLUSION
The development of the SO process needs to be unique to avoid overlap with current IDM
programmes. The SO program will furthermore require a fundamental culture and mind shift from an
Eskom point of view. One of the critical dimensions of the success of the system is rapid response to
deployment of resources. If the system is to succeed to its full potential, authority must be delegated
down from senior Eskom management and enforced accordingly.

49
Chapter 4
4. THE SO - A NEW PROCESS FOR IMPLEMENTING EEDSM
4.1. INTRODUCTION
It was shown in Chapter 2 and 3 that the need exists for a new process to evaluate and approve
EEDSM projects by IDM, especially in the commercial and industrial sectors of SA. The new system
that will form part of IDM’s processes for evaluating projects will therefore need to address the
following:
• Increased market uptake for Energy Efficiency
• Streamlined funding approval process
• Reduced burden on Eskom staff
• Reduced Eskom risk by making payments performance-based on measured and verified savings
• Improved time taken to evaluate EEDSM projects
In this chapter the method in developing the new SO process is explained. At Eskom, there are
various methods to solve complex situations in order to develop a new process; one of these
methods is called the, “Systems Thinking Approach (STA)” by Dr. Julian Day (33). This process entails
the understanding of complex situations and how to address them. The benefit of this method is that
it leads to high leverage interventions whereby managing the right things achieves extensive gains.
On determination of the high leverage interventions, the next step is to develop and align the new
process to Eskom’s Project Life Cycle Model (PLCM), which is a policy in the company. The PLCM
approach is used to govern the management of projects and the approvals authorising the project
investment decisions to proceed to the next phase of the life cycle (34).

50
The PLCM model is a series of sequential phases, which a project passes through from the initiation
of the project to the closeout of the project (34). The simplified view of the PLCM as per Figure 4-1
consists of six phases namely; Pre-project planning; Concept Development; Definition; Execution,
Finalisation and Post project benefit realisation.
Figure 4-1: Simplified view of the project life cycle model (34)
The phase, stages and gates of the PLCM are defined as:
• Phases; A project phase is a section of a project life cycle, with logical activities. These phases
ensure appropriate governance is in place to avoid risks in the process, by obtaining
authority to proceed to the next phase.
• Stages; The Eskom reference PLCM uses the term ‘stage’ to refer to a subdivision of a phase.
It defines specific objectives and deliverables for a particular subdivision. For the purposes of
this study, the stages are also referred to as activities.
• Gates; A Stage Gate (or Decision Gate) is a pre-defined decision control point between
phases and/or stages of the project, to reassess the effort in progress and to change or
terminate the project if necessary. It is a mandatory decision control point requiring a
management decision to authorise the project to proceed or to change the scope of work, or

51
to terminate the project or a portion of the project. It provides management with a means to
manage risk. Each gate has a specific function as seen in Table 4-1.
Table 4-1: Gate approvals
Phase Gate Approvals
Pre-Planning Concept Release
Approval - CRA
Senior Management
Concept Definition Release
Approval - DRA
Technical / Legal / NERSA
Definition Execution Release
Approval - ERA
Investment & Commercial Committee
Execution Implementation Release
Approval - IRA
Project Evaluation Committee (PEC)
Finalisation Finalisation Release
Approval - FRA
Sector Manager
Post project Benefits Realisation
Approval - BRA
Measurement and Verification
4.2. SYSTEM THINKING APPROACH
According to Dr. Julian Day, (33) when a situation becomes complex there are multiple perspective
and divergent value systems and all are entirely legitimate. Table 4-2 summarises the framework and
techniques developed by him for managing complex situations, for example the ESCO process; it goes
on to explain the principle, technique applied and the process followed to determine high leverage
interventions.

52
Table 4-2: Framework for managing complex situations (33)
No. Principle Technique Process
1 Mind reading is unreliable
and leads to unmanageability
Brain dump Offload the problem and make
the mess visible
2 If there was no variables in a
problem then there would be
no need for manages.
Cluster the problem
into themes
Identify critical variables and
name them well
3 A project is a system of
interacting variables that must
make sense and be
manageable. Don’t manage
something that is not
understood.
Interrelationship
diagram (ID)
Understand variables
interconnections
4 Managing the right things and
expecting good outcomes
Scorecard (staircase) Discover high leverage
interventions
5 The purpose of a project is to
add value to its stakeholders.
Aligned expectations are
crucial to project success.
Stakeholder value
hierarchy
Discover what stakeholders
value
6 Projects create new futures.
Problems cannot be solved by
using the same kind of
thinking when the problem
was created
Thinking outside the
box
Surface and rethink limiting
assumptions
7 Projects implement decisions
to change something. The
distinction between old and
new must be sharp and clear
Stop/Start decisions Design high leverage
interventions
8 Represent the project
outcome concretely to
understand it. Make the
project manageable
Rich pictures Envision a concrete and
compelling future state
9 Strong commitments drive
project action not good
intentions. Make
commitments during
conversations
Traffic light matrix Establish a team and ensure
team members make strong
commitments
10 Transcend complexity through
learning’s. Learn to receive
constructive feedback
Action learning Reflect critically to make project
improvements

53
4.3. APPLYING SYSTEMS THINKING APPROACH TO DETERMINE HIGH
LEVERAGE INTERVENTIONS
The new process is designed using the technique shown in Table 4-2; steps 1 to 8 will be applied to
determine high leverage interventions; thereafter the new process will be developed.
Steps 1 to 10 can be categorised as follows:
• Steps 1 to 4 entail making sense of the problem.
• Step 5 to 8 shows the thought process in becoming creative in looking for a new solution.
• Steps 9 and 10 will be integrated into the development of the new process under section 4.4;
hence it will not be explained in isolation.
• Step 1: Brain dump – (offload the story and make the problem visible)
In order to determine the activities in the pre-planning phase as per Figure 4-1, it is crucial to describe
the problems within the current ESCO process. As indicated in chapter 2, the challenges with the
ESCO process (23) (28) are:
There was insufficient staffing in the initial DSM group in Eskom and they could not cope adequately
with the incoming workload. Proposals were often rejected as the proposal evaluation process was
not well understood. EEDSM proposals were managed through an inefficient system which was not
easy to use, time consuming and lacked transparency.
Clarity was needed on how to calculate MW savings outside peak times. The submissions from ESCOs
often did not have the information required for a decision to be made. Frequent requests for more
information had to be made with corresponding delays.
At times, due to the workload, the M&V teams could not go to site to conduct baseline
measurements as planned. The cost of the M&V meters compared to project size could also be high.
The commercial processes did not allow contracts to be negotiated in a simple, time efficient manner.
The requests for discounts during negotiations led to delays. ESCO prices the project on benchmark
values and could not understand why discounts should be provided. New requirements were
implemented without the knowledge of the ESCOs.

54
The commercial process for EEDSM funding was lengthy and could take up to 15 months to complete.
Eskom procurement had to evaluate the project in detail to determine whether the costs as
submitted were in fact correct or if the ESCO was making a profit that was not in line with
expectations. This took many months in some cases as the ESCO had to justify the costs in processes
that Eskom staff had little or no expertise in. Thus it was very difficult for Eskom to decide on a cost
to provide to the ESCO.
In addition, in many of the cases, the ESCOs had committed to a price that Eskom would pay to the
customer and now had to go back to the customer with a revised price. This led to further delays.
The DSM Agreement, which had to be signed between Eskom and the customer, is onerous and
required in-depth discussions by lawyers of Eskom and the customer, therefore leading to more
delays.
• Step 2: Identifying critical variables and naming them well
Having offloaded the problem in the form of an unstructured brain dump, the next step was to start
making sense of the variables that need to be managed. The challenge was to synthesise a tighter
understanding around these variables. This was achieved by looking for variables that have an affinity
with each other and clustering them together to form themes. Each theme needs to be named in
such a way that it accurately captures the meaning within the theme. Table 4-3 shows how an affinity
diagram can be used to structure the problem.

55
Table 4-3: Affinity diagram (clustering the problems into themes)
Number Cluster the problem into themes Variables
1 Evaluation process not well understood, managed on an
inefficient system, time consuming Streamlined process
2 Insufficient staffing, could not cope with incoming work
load Reduced burden on staff
3 Due to turn around time of up to 18 months on the ESCO
process, the market uptake for this model was slow Increased market uptake
4
The commercial processes did not negotiate contracts in a
simple, time efficient manner. The requests for discounts
during negotiations led to delays. The ESCOs price the
project on the benchmark values and could not understand
why discounts should be provided. New requirements are
implemented without the knowledge of the ESCOs.
Commercial evaluation
5
The DSM Agreement, which has to be signed between
Eskom and the customer is onerous, leading to more delays
as both the customer and Eskom legal teams need to vet.
Contract simplification
6
M&V teams could not go to site to conduct baseline
measurements as planned. The cost of the M&V meters
compared to project size could also be high.
Measurement and
verification
7
Clarity was needed on how to calculate MW savings outside
the peak times. The submissions from ESCOs often did not
have the information required for a decision to be made.
Frequent requests for more information had to be made
with corresponding delays.
Technical evaluation
8
In many of the cases, the ESCO had committed to a price
that Eskom would pay to the customer and now had to go
back to the customer with a revised price.
Pricing
• Step 3: Understanding variables by applying the Interrelationship Diagram
(ID)
To make sense of step 2, it is important to understand the interconnections between these variables.
In general, stakeholders agree on the name of the variables; however the problem starts when
stakeholders disagree on the state they would like the variable to be in. Therefore an

56
interrelationship diagram as per Figure 4-2 was used to determine the interconnections between the
variables. As per Figure 4-2 there are no dual arrows between variables, as the technique in this step
calls for the arrows to go in one direction only, as two variables when compared with each other
cannot be equally strong.
Figure 4-2: Interrelationship diagram
Figure 4-2 shows all the variables (as determined in step 2) placed closely to each other to determine
the relationship and impact each variable has on each other. The variables are compared using the
arrows. The “out:in ratio” example (2:5); (0:7), etc. is obtained by tallying the number of arrows
pointing out of a variable versus the number of arrows pointing into a variable. This establishes the
role of each variable, namely:
• Increased market uptake (0:7) – The ratio indicates that this variable is influenced by 7 other
variables in the system as there are zero arrows leaving the variable and seven arrow flowing
into the variable. Therefore it is massively impacted by 7 variables in the situation; hence this
variable is known as the outcome.

57
• Streamlined process (2:5) – The ratio indicates that this variable is influenced by 5 other
variables in the system. It is massively impacted by 5 variables in the situation; hence this
variable is also known as the outcome.
• Reduced burden on staff (1:6) – The ratio indicates that this variable is influenced by 6 other
variables in the system. It is massively impacted by 6 variables in the situation; hence this
variable is also known as the outcome.
• Contract simplification (7:0) – The ratio indicates this variable influences 7 other variables in
the situation. It has a massive impact on the situation and for this reason it functions in the
role of a driver.
• Commercial evaluation (5:2) – The ratio indicates that this variable influences 5 other
variables in the situation. It has a massive impact on the situation and for this reason it
functions in the role of a driver.
• Measurement and Verification (5:2) – The ratio indicates that this variable influences 5 other
variables in the situation. It has a massive impact on the situation and for this reason it
functions in the role of a driver.
• Pricing (6:1) - The ratio indicates that this variable influences 6 other variables in the
situation. It has a massive impact on the situation and for this reason it functions in the role
of a driver.
• Technical Evaluation (3:4) – The ratio indicates that this variable has a fairly even “out: in
ratio” and does not function strongly as drivers or outcomes and can be called links. These
variables do some influencing in the situation, but are also influenced by other variables in
the situation.

58
• Step 4 – Scorecard (staircase)
Interrelationship diagrams can get complicated as seen in Figure 4-2; however they can be re-
arranged for simplicity. Figure 4-3 shows how an interrelationship diagram can be rearranged into a
scorecard that looks like a staircase. The stronger a variable functions in the role of a driver, the
nearer it is positioned to the bottom of the staircase. The stronger a variable functions in the role of
an outcome, the nearer it is positioned to the top of the staircase. Variables with even “out: in” ratios
are placed in the middle of the staircase and links drivers to outcomes.
In order to climb a flight of stairs and reach the top step, it is necessary to start climbing from the
bottom. It is futile to expect outcomes to be in a good state if drivers are mismanaged.
In Figure 4-3 it shows Eskom is spending extensive time on commercial evaluation, technical
evaluation, and staff, however from the faces it can be seen that the state of these variables are sad,
therefore it can be concluded these variables are being under managed to a certain extent.
The staircase can now be used as a scorecard. Working from the bottom up, we were able to assess
how well we were managing the situation by determining the current state of each variable in the
scorecard, and how much time we are currently spending on managing each variable in the
scorecard. Based on this technique the SO team agreed all four drivers were in a bad state and
needed to be fixed to achieve the desired outcome.

59
Figure 4-3: Systemic Scorecard
• Step 5: Determining what stakeholders value
The purpose of developing a new process is to add value to the stakeholders; hence it is important to
discover who the stakeholders are and what they value.
5.1 Identifying key stakeholders in the SO process (31)
Primary stakeholders, that could impact Eskom’s SO initiative are depicted in Figure 4-4, which is
based on their individual impact as well as their direct involvement on the strategic level of SO
initiative. SO initiative needs to be introduced and communicated to the targeted stakeholders.

60
Figure 4-4: Key stakeholders to SO (31)
One of the key stakeholders in the SO process are the ESCOs. A workshop was arranged with them to
discuss the proposed new process. The overall response from the ESCOs showed very keen interest in
the new SO process and to some extent indicated they will be able to respond to the SO timeously.
5.2 Degree of stakeholder involvement
Figure 4-5 shows the degree of stakeholder involvement in the implementation of the SO process.
From the stakeholder mapping exercise it can be seen that Eskom, ESCOs as well as M&V agencies
score high on the implementation of the new initiative. Therefore, alignments of these stakeholders
as well as the clear roles they are expected to play are critical to the successful implementation of the
SO. Government departments such as DPE, DTI, DOE, and NERSA are envisaged to play an important
policy and regulatory role in setting the landscape for the new programme.

61
Figure 4-5: Degree of stakeholder involvement (31)
• Step 6: Surface and re-think limiting assumptions
Table 4-4 shows four current assumptions initially made in isolation regarding the status of the
drivers. However after applying the technique of step six, interesting new thoughts on each
assumption started to develop which helped to be creative in the design of the new process.

62
Table 4-4: Rethinking limiting assumptions
No. Variables Current assumptions Interesting new
thoughts
1 Contract simplification
Driver (7:0)
• The Eskom legal department does not
have time to simplify contracts.
• It will take time for customers to
understand the new contract.
• The legal department
has appointed
dedicated people to
simplify contracts.
• The customers are
looking forward to a
less onerous contract.
2 Commercial evaluation
(Driver (5:2)
• The commercial department in Eskom
does not understand what IDM’s
objectives are and therefore are not
aligned.
• The commercial department will not
understand the concept of paying for
energy as it does not fall under the
goods and services category.
• The commercial
department is equally
frustrated with the
slow process and is
therefore looking
forward to a process
whereby risk and
performance can be
transferred to the PD.
• In this way the need
for discounts are not
applicable.
3 M&V
Driver (5:2)
• The M&V teams will not support the
proposed SO process due to a deemed
savings approach.
• M&V welcomed the
idea of a new process,
as it could mean that
the PD will do their
own measurements
and the teams will do
the verification of the
measurements
4 Pricing
Driver (6:1)
• The offer rate (c/kWh) to market
needs to be sufficiently high for good
uptake on EEDSM
• The market will
accept a reasonable
price, provided the
existing process is
streamlined.
• Step 7: Determine high leverage interventions
The next step is to determine high leverage interventions, which when focused on, will lead to
maximum results. Based on step 3, high leverage interventions are also known as drivers. These
drivers are:

63
• Contract simplification - Simplify the contracts between Eskom and Project Developer
• Commercial evaluation - Streamline the project approval process and scale-up projects
• Measurement and Verification – outsourcing the measurements
• Pricing – Provide PDs a pre-determined amount for delivered energy savings
• Technical evaluation (Link) - Provide transparency to PDs to calculate savings.
By focusing on these drivers a new process will evolve that will address the key objectives (outcomes)
namely:
• Increased market uptake for Energy Efficiency.
• Streamlined approval process.
• Reduced burden on Eskom staff.
• Eskom’s risk reduced by making the payments performance-based and pay only for measured
and verified savings.
• Step 8 – Envision a concrete and compelling future state
It is envisaged that the SO approach, would allow Eskom to “purchase” energy savings from ESCOs
and customers using a pre-determined and pre-published price. Implementation of this approach will
streamline the process of evaluating project proposals and disbursing the incentives or subsidies,
thereby reducing the burden on Eskom staff and facilitating a larger pipeline of projects.
4.4. DEVELOPMENT OF THE NEW SO PROCESS
In developing the new process steps, the immediate focus and attention was on the following drivers
(high leverage interventions) as identified in steps 1 to 8 above:
• Contract simplification - Simplify the contracts between Eskom and Project Developer
• Commercial evaluation - Streamline the project approval process and scale-up projects
• Measurement and Verification – outsourcing the measurements
• Pricing – Provide PDs a predetermined rate in c/kWh in for delivered energy savings

64
• Technical evaluation (Link) - Provide transparency to PDs to calculate energy savings
By focusing on these drivers a new process will evolve that will address the key objectives (outcomes)
namely:
• Increase market uptake for EE
• Streamlined approval process
• Reduced burden on Eskom staff
• Eskom’s risk reduced by making the payments performance-based and pay only for measured
and verified savings
Reflecting on the ESCO process, it was also found that the process activities were not well defined.
The process in itself lacked controls and there were no clear roles and responsibilities of the parties
involved. At the time the process was not aligned to the PLCM. Therefore in setting the criteria for
the new SO process, it had to be ensured:
a) That the activity Process flows are well defined.
b) Critical controls for each activity are in place.
c) Roles and responsibilities (RACI) are documented for the Activities.
d) That the process is linked to Eskom’s Project Life Cycle Model (PLCM), which is now policy in
the company.
As per the PLCM discussed in the introduction of this chapter, the objective of the pre-planning phase
is to define the needs of the new process and how it will be addressed. The concept phase entails the
design of the new process. The definition phase entails the governance and regulatory approvals for
the new process, followed by the execution phase; which is project implementation and
commissioning as per the project plan. On completion the project can now be closed out and signed
off by all parties involved - called the finalisation phase. The final step is the post project tracking,
maintenance and performance monitoring to determine the benefits realisation.
The criteria also call for clear roles and responsibilities of the activities. The PLCM describes this as the
RACI, which stands for Responsible (R), Accountable (A), Consulted (C), Informed (I).

65
The Accountable person is the individual who is ultimately answerable for the activity or decision.
This includes “Yes” or “No” authority and veto power. This person has ownership of the outcome
results of the decisions. The Responsible person is the individual who actually does the work and
completes the activity. The Responsible person is responsible for implementation. Responsibility can
be shared. The person that is consulted often has the opportunity to influence the decisions. More
than one person can be consulted. The person that is informed is notified of the results or outcomes.
The benefits of applying the RACI help to identify process roles and activities that must be
accomplished per activity; it also Increase productivity through clearly defined functional areas, key
responsibilities, and decision points. It allows for transparency of the process.
The Critical Controls are controls whose effectiveness will contribute materially to the achievement of
the Eskom strategic objectives and budgets or are required for contractual or regulatory compliance.
Critical Controls are a critical component towards driving continuous improvement and in embedding
a discipline of control consciousness into the business. Both senior management and auditors can
often get assurance that the specified risk has not occurred, (or that the controls mitigating such risk
has been effectively deployed), by monitoring a single critical control. This is typically a control that
covers a range of risks or control objectives and is detective in nature. Where a critical control fails,
management would look to evaluating the individual components of the standard controls to
evaluate the extent to which the risk may or may not have been mitigated. If Critical control is not
selected the control is automatically classified as a Standard control. Standard controls are the
controls or a set of controls, (both detective and preventative) that will best achieve the control
objectives for a specific process (35).
4.4.1 PRE - PLANNING PHASE
The pre-planning phase entails the mapping out of a new process flow and thereafter setting up a
project team. Based on the STA (steps 1 to 8), the process criteria and the sequence of the PLCM, the
new process flow as per Figure 4-6 from activity flow A1 to R was developed. The development steps
in the new process will be discussed in detail in this section. Some activities will be explained in more
detail as compared to other activities.

66
Figure 4-6: Development of the new SO process flow
• Activity flow A1
a) Determine the new process flow
This step addresses the thinking and criteria behind the new process flow from the pre-planning
phase to the finalisation phase. In developing the new process, the aim is to streamline the
current project approval process to the point that the SO contract is signed and executed. In
developing the building blocks of the new process, it was necessary to comply with the process
criteria and ensure the following outcomes were incorporated into the new process steps,
namely;
• A shorter approval process however still remaining within the governance structure.
• The process is open and transparent.

67
• That administration of the SO is simple.
• That the PD knows the rate in c/kWh they would be paid upon successful delivery of
monitored and verified savings.
• That a mandate for approval from the Procurement Tender Committee (PTC) is required
for the delegation of authority for concluding agreements for the SOP.
• That this delegation will be vested in the PEC committee.
• PEC will evaluate the SO submissions technically and financially based on a pre-
determined list of criteria to conclude individual contracts between Eskom and the PDs;
hence no need for individual projects going to CIC and PTC.
• That payment to PD will be based on performance as per the SO performance contract;
therefore no need to sign a New Engineering Contract (NEC) or DSM agreement.
With the above considered the different steps and logical flow of the new SO process were developed
from Activity flow A1 to R as per Figure 4-6. These steps are also captured in Table 4-5 for ease of
reading.

68
Table 4-5: SO process flow and activities for A1
Phase in the PLCM Activity flows Parties involved
1. Pre-planning
A1 – Determine the new process flow
A2 – Establish project team
Eskom – IDM
2. Concept
Determine the following:
B1 – Eligible bidders
B2 – Technology selection
B3 – Market sector
B4 – Project size
B5 – Rate (c/kWh)
B6 – Contract terms
Eskom - IDM
C – Determine the M&V methodology M&V
3. Definition
D1 – Governance approval
D2 – Programme risks and mitigations
E – Publish the SO
Eskom – IDM
F1 – PD markets SO to obtain LOI
F2 – PD formulates project submission to IDM
G – PD registers as a vendor with Eskom
PD
4. Execution
H – Project screening and registration
I – assessment and approval of application by TEC
J – PEC approval
Eskom - IDM
K – M&V request, scope and baseline measured M&V
L – PD signs SO contract PD
M – PD implements project PD
5. Finalisation
N – Disposal of old technology
O – Post Measure acceptance period
P – Project sign off, submit invoice for payment
PD
6. Post project
Q - Annual M&V assessment over 3 year sustainability
period
M&V
R – Payment of invoice over 3 years Eskom - IDM

69
b) Determining the RACI
In chapter 2, it was noted that the ESCO process lacked transparency. Both the ESCOs and PM did
not fully understand who was accountable when and responsible for what, hence it was
concluded that the ESCO process was managed inefficiently.
The purpose of developing a RACI for the new process is to assign clear accountability and
responsibility to key role players involved in this activity. The RACI was developed for activity flow
A1 in order to determine clear accountability, and responsibility as per Table 4-6.
Table 4-6: RACI to determine new process flow for A1
RESPONSIBLE ACCOUNTABLE CONSULTED INFORMED
L. Padachi
IDM
M&V / NERSA
PMO / PD
c) Determining the critical control
The critical controls developed as per Figure 4-6 are to ensure the activities are approved at each
phase by an authorised person or committee before the activity can progress to the next phase.
As indicated in the introduction of this chapter, the critical controls are
CRA/DRA/ERA/IRA/FRA/BRA approvals.
• Activity flow A2
a) Establish project team
Being appointed as the Project Leader, the author of this document was requested to establish a
team to set the criteria for the initial SO pilot programme. Having applied the STA and mapping
out the process, it was easy to identify the team members and their roles thereof. Figure 4-7
shows a programme structure of the team composition for the initial development of the SO pilot
programme.

70
Figure 4-7: SO project team structure
As confidentiality of the project team members will be respected, the names of certain individuals will
not be shown in the structure. The project team would be responsible for:
• Establishing the criteria of the SO programme – L. Padachi
• Developing the process flow and activities – L. Padachi
• Technical requirements of the SO programme – M. Ndlovu
• Developing the SO M&V protocols – M&V team member
• Developing the SO contract – Legal team member supported by L. Padachi
• Determining the SO price – Project team member supported by L. Padachi
• Seeking governance approval to streamline the commercial process – Commercial team
member
• Publish the SO programme – Marketing team member
b) Determining the RACI
The development of the RACI was simple as each team member was informed of their role and
key outputs. The team agreed that senior management would be informed as opposed to
consulted on the process development.

71
Table 4-7: RACI for activity flow A2
RESPONSIBLE ACCOUNTABLE CONSULTED INFORMED
Project team
IDM (L. Padachi)
M&V
Senior Management
c) Determining the critical control
The critical controls for activity A2 was to ensure team members sign a non- disclosure
agreement for the duration of the programme development. The intention was not to create
expectations to the market early in the process as some PDs would hold back project submissions
instead of submitting via other funding models.
d) Applying the gate approval
Governance plays an important role in the successful development of the process. Therefore for
the process to proceed to the concept phase, the preplanning phase has to be signed off. The
work done in this phase, which includes identifying the process flow and developing the team,
was then presented to the senior management committee for approval. At the time the
committee did not fully understand the benefits of the new process and requested for a pilot to
be performed. The committee thereafter approved the CRA gate, allowing the process to move to
the Concept phase.
4.4.2 CONCEPT PHASE
The concept phase includes the development of the SO criteria. Following approval of the CRA gate,
the SO criteria were developed; this includes the determination of eligible bidders, technology
selection, targeted market sector, project size, offer rates and contract terms.
• Activity flow B1
a) Determining eligible bidders
It was shown in the ESCO process that only registered ESCOs could submit projects to Eskom for
funding consideration; this resulted in a poor pipeline of projects for IDM’S approval. For greater

72
market uptake the SO process should allow for broader market participation, hence the team
allowed the following types of organisations called “Project Developers” (PDs) to provide
proposals to Eskom under the Program – this is also aligned to international best practice.
• Any customer of Eskom or municipal electricity providers in the commercial and industrial
sectors; and
• Energy service company (ESCO), defined as a business entity that provides any or all of the
following services: energy engineering, energy efficiency design, equipment installation,
equipment maintenance and financing services on a performance contracting basis.
The rationale behind not only allowing ESCOs to bid is that many large organisations have the
competency, capacity and resources to undertake their own energy efficiency programmes and they
should therefore be eligible to partake in the program.
Furthermore, by including other organisations other than ESCOs, including Large Power Users (LPUs),
the intention is to increase the pipeline of projects undertaken and the potential to deliver a
significant amount of MWs within a short period of time.
b) Critical control
In this step it is mandatory for the PD to sign an agreement with the energy consumer or facility
owner to transfer ownership of verified energy savings from the energy consumer or facility
owner to the PD. The intent of this is to avoid potential disputes between the facility owner and
PD if the project underperforms during the measure acceptance period (MAP).
• Activity flow B2
a) Technology selection
The purpose of this activity is to publish a list of approved technologies that are eligible for
consideration under the SOP. In the past ESCOs would often submit projects with technologies
that were not tested nor approved, which resulted in high failure rates at customers’ facilities.

73
In selecting the technology the team agreed there were two main types of technologies for
consideration; pre-approved and have been successful implemented via the ESCO model and
unknown or not pre-approved. It was decided, only pre-approved technologies should
immediately be considered for the program within the first year as the aim of the program was
for rapid deployment.
Unapproved or unknown technologies have to go through a process to become approved and will
only be eligible for long-term considerations within the SOP. The current technologies that have
been deemed to be part of the SOP:
• Energy efficient lighting and HVAC systems
• Building management systems (BMS)
• Electrical hot water systems
• Process Optimisation systems including pumps, motors, compressed air etc.
• Solar water heaters
• Light Emitting Diodes (LED) down lighters
• Renewable energy (Photo Voltaic cells)
b) Critical controls
As per the technical manager’s recommendation, for a product to be considered part of the SOP,
compliance with Eskom’s minimum technical specification is required. In addition, the following is
required as a basis of the technical evaluation of proposed products:
• Technical data specification sheet;
• Letter of Authority (LOA), where applicable; and
• Valid test reports by an independently recognised test laboratory based on SANS/IEC testing
standards.

74
• Activity flow B3
a) Determining the market sector for SO implementation
The decision to develop the SO for the commercial and industrial sectors was based on the
energy consumption patterns of these sectors. A typical weekday profile for a commercial and
industrial customer in SA can be seen in Figure 4-8. From these profiles it can be seen that both
industrial and commercial sectors consume a substantial amount of energy between the core
hours of 6.00 am to 10.00 pm. Therefore eligible energy efficiency measures on the new
programme must reduce electric energy consumption at the project site between 6.00 am to
10.00 pm, Monday to Friday in order to cater for both sectors.
Figure 4-8: Industrial and Commercial electricity consumption patterns in SA
b) Critical controls
The critical control in developing this activity is to ensure energy savings achieved before 6.00 am
and after 10.00 pm on weekdays and on weekends will not be considered towards payment for
energy reduction as these hours are outside the Eskom peak times. Currently there is adequate
capacity to supply SA outside of peak times.

75
• Activity flow B4
a) Setting the project size
The eligible project sizes have been set between 50 kW and 5 MW limits. The development of the
lower boundary limit has been imposed so as not to constrain the system with many small
projects, which could lead to an administrative burden on staff. With respect to the development
of the upper limit, projects may not be greater than 5MW in order to limit the PD exposure to
financial and technical risks.
b) Critical controls
The critical control in developing this activity is to ensure projects below 50 kW and over 5 MW
are not passed through the system for approval. By failing to comply the PM could be
accountable for wasteful expenditure.
• Activity flow B5
a) Determining the SO rate
The development of the SO rate is based on the NERSA approved benchmark of R5.25 million for
every one MW saved over a sustainability period of 5 years (9). In calculating the offer, the
following principles were used to convert R 5.25m/MW into an energy rate in c/kWh:
The SO focuses on energy savings between 6.00 am and 10.00 pm (16hrs/day), weekdays only,
with contract duration of three years, using this information the equation was applied as follows:
� Energy (MWh) = Power (MW) * (8760 X LF)…………...........equation 1
� Cost (R/MW) = Energy (MWh) * rate ( c/MWh )…………….equation 2
Calculating the Load factor (LF) refers:
• Load reduction duration from 6.00 am to 10.00 pm = 16hrs/day
• 16hrs/day x 5 days (Monday to Friday) = 80hrs/week
• 80hrs/week x 52 week/year = 4160 hours/pa
• There are 8760hrs/pa

76
Hence the LF = 4160hrs/8760hrs = 47.5%. (This is in line with the constraint periods in SA)
� Therefore Energy (MWh) = 1 MW X 8760 x 47.5% = 4160MWh/pa (as per equation 1)
By applying equation 2, the rate is calculated as follows:
� Rate (c/kWh) = Cost (R/MW) / MWh
= 5.25/4160 X 1000
= R 1.26/kWh
� The sustainability period for SO is 3 years, therefore R1.26/kWh divided by 3 years = 42c/kWh
per annum.
• Activity flow B6
a) Developing the SO contract terms
The challenges experienced with the ESCO process regarding the NEC contract and DSM
agreement, has prompted the need for a new contracting mechanism with PD. The legal team
member from Eskom led this activity and with the teams input, it was decided the principles and
conditions of the SO contract should be:
• Performance based – pay PDs for measured and verified savings.
• Transfer risk to the PDs – implementation and performance risk is transferred to the PD;
hence no need to use the conditions of the NEC contract, thereby completely eliminating
the need for the NEC.
• Sustainability period – spread the balance of the performance payment over three years,
thereby eliminating the need for the DSM agreement.
• Transfer liability to the PD – Eskom will not undertake any liability regarding the skills and
expertise of the PD; neither will Eskom guarantee the approved technology will achieve
the desired energy savings. The PD must also indemnify Eskom against all damages
suffered if any.

77
• Insurance – the PD must take out its own insurance during the implementation of the
project and sustainability period.
• Laws and Regulations – the PD must ensure that the approved technology complies with
all laws and regulations related to the installation at the facility.
• Maintenance – the PD is responsible to maintain and repair the approved technology for
three years.
The principles were agreed with the team and thereafter the SO contract was developed making
provisions for baseline development, payment terms, and obligations of the parties, indemnities,
guarantees, dispute resolutions, breach and termination of contract.
b) Critical control
The SO contract must be signed by both IDM and the PD before the project can be implemented,
failing in which the PD will not be compensated for work done.
• Activity flow B7
c) Developing the SO payment terms
One of the challenges experienced with the ESCO process was the NEC contract payment terms.
The NEC is designed to penalise the ESCO for underperformance and there are no rewards for
over performance. The NEC penalties do not encourage over performance on projects.
In developing the SO payment terms, cognisance had to be taken of the ESCO challenge as well as
the principles used in developing the SO contract, namely:
• Reduce Eskom’s risk by making the payments performance-based and pay only for measured
and verified savings - no energy savings achieved, equals no payment to the PD.
• Eliminate the need for using the NEC contract terms and conditions, as the implementation
and performance risk is transferred to the PD.
• The payment is spread over a period of three years, called the sustainability period, therefore
eliminating the need for a DSM agreement.

78
Considering the above and in view of the fact that the PD carries the financial risk for
underperformance, it was decided to financially reward the PD for an over performance of 10%.
The SO team also decided the first payment to the PD would only be made after verification of
performance by M&V called the Measure Acceptance Date (MAD). Initial thinking was to pay 60% of
the contract value to the PD on MAD, and thereafter release 40% over the sustainability period of 3
years.
The market was consulted. There was poor support for the payment terms proposed. Potential PDs
indicated they will not be able to cope financially if 40% of the contract value is paid over 3 years.
Considering the concerns raised and that the risks are carried by the PD, it was agreed to change the
payment terms to release 70% of the contract value on MAD and 30% over the sustainability period
of 3 years.
The SO contract value is calculated as follows:
Contract value = (kW savings x 4160hrs/pa) X (rate x sustainability period)…..equation 3
To ensure the sustainability of the verified energy savings after MAD, retention of 30% will be held by
IDM. This retention will be paid over the sustainability period of 3 years. The first performance
payment (10%) based on the verified savings by M&V will be made 12 months from MAD. The second
performance payment (10%) will be made 24 months from MAD. The third performance payment
(10%) will be made 36 months from MAD.
a) Determining the RACI
Based on this activity B1 –B7 the RACI was developed as per Table 4-8.
Table 4-8: RACI for activity flow B1-B7
RESPONSIBLE ACCOUNTABLE CONSULTED INFORMED
IDM
SO project team
Finance /NERSA
PD
b) Determining critical controls
The PM must ensure that the sum of all payments to the PD must not exceed the SO contract
value plus 10% allocation for over performance. To enhance this control it was requested that the
finance department lock in the SO contract value on the finance payment system.

79
� Activity flow C
a) Determining the M&V methodology
The M&V team member advised that the same M&V protocols and standards namely SATS50010
will be used in the SO approach as used in the ESCO process; while at the same time allowing for
it to be more flexible and streamlined in the spirit of the programme, in order to accelerate
energy savings opportunities. A general M&V guideline was developed for the SO process.
To highlight, the M&V steps for the SO process are:
• Eskom will appoint M&V body to generate the M&V plan
• PD will purchase and install measuring equipment
• Baseline developed by the M&V body
• Project implemented by the PD
• Certification of completion (COC) produced
• Post Implementation report and verification of COC
• Conduct Performance assessment 1
• Continue Performance assessment in year 2,3 and 4
b) Critical controls
The PD cannot start project implementation if the project baseline is not accepted and signed off
by M&V/ IDM and the PD.
c) Determining the RACI
Based on the M&V requirements the RACI was developed accordingly for activity flow C as per
Table 4-9.
Table 4-9: RACI for activity flow C
RESPONSIBLE ACCOUNTABLE CONSULTED INFORMED
M&V
M&V
IDM
PD
d) Applying the gate control

80
Governance plays an important role in the successful development of the process, therefore for
the process to proceed to the definition phase; the concept phase has to be approved. The work
done on this phase was presented to the technical evaluation committee and the legal
department for consideration and approval. The committees approved the DRA gate and allowed
the process to continue to the next phase; being the definition phase.
4.4.3 DEFINITION PHASE
It was acknowledged that the commercial process to evaluate ESCO projects was lengthy and could
take up to 15 months, (or longer in some cases) to complete. Eskom procurement had to evaluate
each individual project in detail to determine whether the costs as submitted, were in fact correct or
if the ESCO was making a profit not in line with expectations.
� Activity flow D1
a) Governance approval
To overcome the challenge experienced in the commercial process, a Standard Offer, (blanket
strategy) approach was requested to shorten the process, but to remain within the governance
structure. The intention is to enter into various SO contracts for individual projects. This will allow
IDM to manage a group of projects with the same conditions and not to present individual
projects each time to the investment and procurement committees.
In order to make the new process a reality and overcome the challenges experienced in the
commercial process, bulk approval of funds from the investment committee and a mandate from
the procurement committee was urgently needed.
Therefore a request was made to the Investment committee seeking approval for the following:
• To implement the IDM Standard Offer (pilot) Commercial and Contracting Strategy for Energy
Efficient Savings up to a maximum total budget value not exceeding R 30 000 000, excluding
Value Added Tax (VAT) for the total combined contracts for a period of 36 months. The
savings expressed in kW and kWh, with the related costs distribution over the sustainability
period, were also submitted to the investment committee as shown in Table 4-10.

81
Table 4-10: Summary of SO parameters
Based on the submission, the investment committee as a minimum calculated the financial
implications and proposed benefits to Eskom. The net present value, internal rate of return, and
payback periods were calculated and thereafter the committee agreed to allocate a budget to the
programme.
Following on from the Investment approval a request to the Procurement Tender Committee (PTC)
was made for approval:
• That the PEC be granted a mandated to conclude contracts with compliant PDs for a
maximum contract period of 36 months.
• The rate in (c/kWh) for energy savings will be fixed per technology group.
• An initial payment of 70% of the anticipated total savings in respect of each particular
contract is made after commissioning and the verification of savings and the outstanding
balance paid thereafter at a rate of three payments of 10% each per year, for three years,
with adjustments made to the final payments to compensate for any anticipated savings not
achieved.
• That the pro forma contract, compiled by the Legal department is approved as standard
documentation for the enablement of contracting with potential PDs.

82
• That the Senior General Manager (SGM) of IDM be authorised to delegate further, to take all
necessary steps to give effect to the above, including the signing of any agreements, consents
or other documentation necessary or related thereto.
• Only pre-approved technologies be accepted to participate in the SO programme
• PDs be appointed as per Eskom vendor registration process.
• Savings be verified by an independent measurement and verification (M&V) organisation
before any payments are made to the PD.
The committee reviewed the submission and further requested for a comparison to be shown
between the current ESCO process and the proposed SO process in terms of the tendering
method followed, determination of the contract price, channels to market, payment terms, etc.
The comparison was done as shown in Table 4-11. Upon which the committee granted approval.
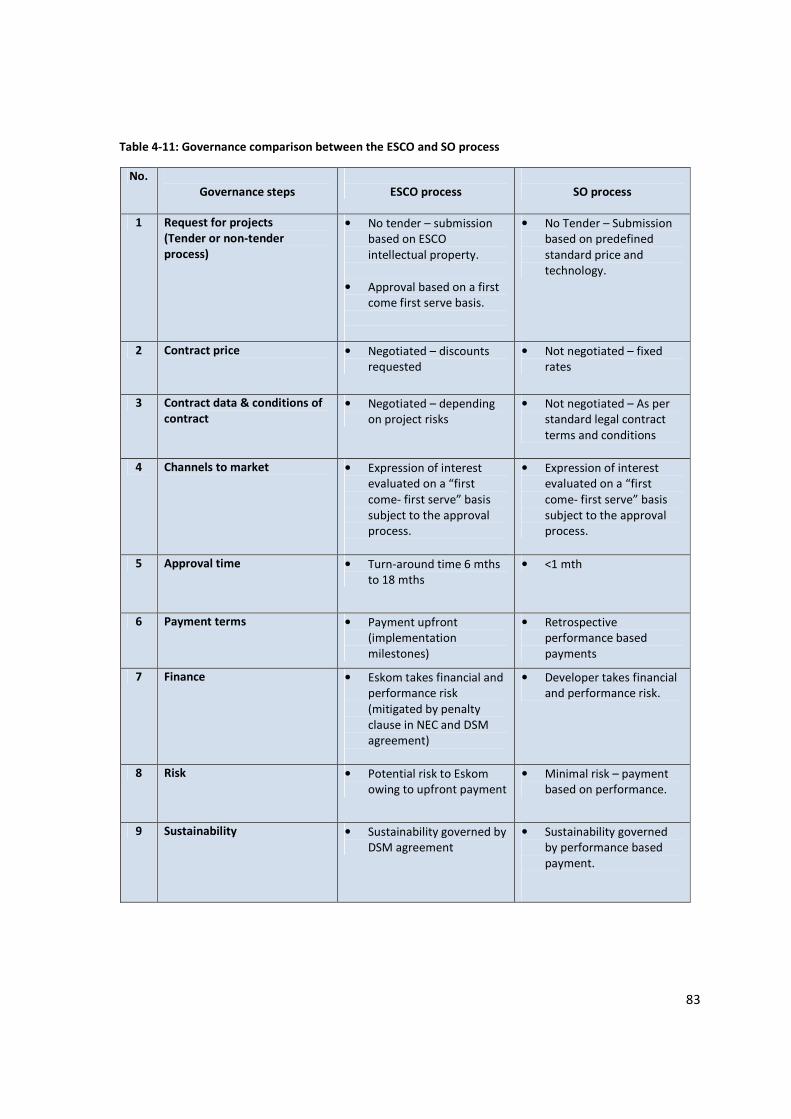
83
Table 4-11: Governance comparison between the ESCO and SO process
No.
Governance steps
ESCO process
SO process
1 Request for projects
(Tender or non-tender
process)
• No tender – submission
based on ESCO
intellectual property.
• Approval based on a first
come first serve basis.
• No Tender – Submission
based on predefined
standard price and
technology.
2 Contract price • Negotiated – discounts
requested
• Not negotiated – fixed
rates
3 Contract data & conditions of
contract
• Negotiated – depending
on project risks
• Not negotiated – As per
standard legal contract
terms and conditions
4 Channels to market • Expression of interest
evaluated on a “first
come- first serve” basis
subject to the approval
process.
• Expression of interest
evaluated on a “first
come- first serve” basis
subject to the approval
process.
5 Approval time • Turn-around time 6 mths
to 18 mths
• <1 mth
6 Payment terms • Payment upfront
(implementation
milestones)
• Retrospective
performance based
payments
7 Finance • Eskom takes financial and
performance risk
(mitigated by penalty
clause in NEC and DSM
agreement)
• Developer takes financial
and performance risk.
8 Risk • Potential risk to Eskom
owing to upfront payment
• Minimal risk – payment
based on performance.
9 Sustainability • Sustainability governed by
DSM agreement
• Sustainability governed
by performance based
payment.

84
� Activity flow D2
a) Risks and mitigations
In every new process risks and mitigations have to be identified upfront. This is a key step for ERA
gate approval. Table 4-12 summarises the new process risks and mitigations per category as
identified by the SO team.
Table 4-12: SO process risks and mitigations
Category Risk Description Mitigation Strategies
Contractually Unfair dealings and preferential
treatment may have a negative
influence on credibility of the SO
Programme.
One of the great strengths of this program is that
the offer will be made available to the general
marketplace. The process is open, transparent and
should dispel fears of preferential treatment.
M&V M&V capacity may negatively
affect the operations of the SOP.
Allow the PD to purchase metering equipment to
determine M&V plan, which must be verified by the
M&V body.
Financial
outlays
PD may not take up the SOP due to
lack of external finance to enable
them to fund the project.
By issuing the SO contract upfront prior to
implementation should enable PD to secure funding.
Furthermore, 70% of the contract cost will be paid
on commissioning and verification of the project.
Pricing and
incentives
Pricing and incentives may be
inadequate.
Market uptake will be monitored to determine an
adequate pricing level with-in the limits of average
NERSA benchmarks.
Sustainability Sustainability of the energy savings
may not be achieved, resulting in
loss of long-term energy savings.
No energy savings equals no payment by Eskom,
hence a retention of 30% is held by IDM, and will be
paid out over the 3 years sustainability period.
Process Procedural issues may impede the
speed of the market response,
which may negatively affect the
SOP market uptake.
Transparent and streamlined process will enhance
the uptake of the programme.
Technology
failure
Failure of the implemented
technology in the sustainability
phase.
PD must insure the Approved Technology for the
duration of the Sustainability Period,

85
b) Determining the RACI
The RACI was developed for activity flow D1 and 2 as per Table 4-13.
Table 4-13: RACI for activity flow D1 and 2
RESPONSIBLE ACCOUNTABLE CONSULTED INFORMED
IDM
Commercial & Finance
N/A
Legal department
c) Critical controls
The PEC has now been granted a mandate to conclude contracts with compliant PDs; this
mandate must be respected and strictly adhered to, as the committee is authorised to conduct
technical, financial and commercial approvals. In the ESCO process, PEC was authorised to
conduct technical approvals only.
� Activity flow E
a) Publishing the SO
On completion of steps A to D, the marketing department under the leadership of the marketing
team member was requested to publish the SO programme nationally. The intention of
publishing the SOP nationally is to achieve greater market uptake for EEDSM. To apply for funding
under the SOP, the Project Developer has to follow the application process steps from activity
flow F to R as per Figure 4-6.
b) Determining the RACI
The RACI was developed for activity flow E as per Table 4-14
Table 4-14: RACI for activity flow E
RESPONSIBLE ACCOUNTABLE CONSULTED INFORMED
IDM
Marketing department
M&V
PD/Customers/Public

86
c) Determining Critical controls
Information on the SO programme must not be shared with the market prior to the official
publishing of the offer to the public, as it could be perceived that certain PDs will have a
competitive advantage.
� Activity flow F1 (Start of the SO application process)
a) PD markets SO to obtain LOI from Customers
It was mentioned in Chapter 2, that ESCOs find it difficult to sell the ESCO process to customers to
obtain a LOI. The reason being the ESCO programme rules are not well defined, nor transparent.
Time taken to obtain a LOI from a customer could be as long as 3 months.
In developing activity F1, steps similar to the ESCO process were followed; with the difference
being the new SO process rules are well defined and very transparent.
This step entails the PD marketing the SO programme to potential customers to participate in the
programme. Where a customer opts to partner with a PD to act on their behalf, the customer is
required to sign a letter of intent to confirm this agreement for the entire contract period. The SO
contract will thus be placed between IDM and the Project Developer.
b) Determining the RACI
Based on the activity outcomes, The RACI was developed as per Table 4-15.
Table 4-15: RACI for activity flow F1
RESPONSIBLE ACCOUNTABLE CONSULTED INFORMED
PD
PD
Customer
IDM
c) Determining the critical Controls
The critical control in this step is to ensure that the LOI is signed between the PD and the customer/
The LOI allows the PD to claim ownership of the verified energy savings after project execution from

87
the customer. If the LOI is not signed, the PD could be exposed to performance risk at a later stage; as
payment for verified energy savings are made to the PD and not the customer.
d) Suggested time to obtain LOI
As this activity requires extensive marketing and follow-ups to the customer; the suggested time
to complete this activity is set at 3 weeks in the new SO process.
� Activity flow F2
a) PD formulates project submission to IDM
It was mentioned in Chapter 2, that ESCOs allocate time and funding to investigate projects that
may eventually not even be funded by Eskom due to incorrect technical information provided.
This is frustrating for the ESCO, as it takes time to develop a project.
To overcome this challenge, the technical team was instructed to develop project submission
templates to ensure that correct information is supplied by the PD. The templates must be shared
with the PD upfront, thereby ensuring greater transparency of requirements.
This step is used to gather information on the project where the PD will become familiar with the
SO requirements. The PD must gather the following information:
• PD Details and background
• Project Site Information
• Project Summary and background
• Customer background
• Project Scope of work
• Energy savings calculations
• Load profiles
• Project finance
• Project risks
• Environmental issues

88
Determining the RACI
Based on the activity outcomes, The RACI was developed as per Table 4-16.
Table 4-16: RACI for activity flow F2
RESPONSIBLE ACCOUNTABLE CONSULTED INFORMED
PD
PD
Customer
IDM
b) Critical controls
The critical control in developing this process is to ensure the PD complies with all the
information requested on the project submission template, after which the project proposal must
be signed off by the customer before the project is submitted to IDM. Past experience with the
ESCO process, shows customers often did not see the final project submission made to IDM.
c) Suggested time to formulate project submission
The suggested time to complete this activity is set at 4 weeks in the new process. This will allow
sufficient time for the PD to gather the necessary information to formulate the project.
� Activity flow G
a) PD registers as a vendor
This step is similar to the ESCO process step and involves the evaluation and registration of the PD
as a vendor to do business with Eskom. This step is a gate keeper, and failing to register as a
vendor will prevent the PD from doing business with Eskom or receiving payments.
Knowing this upfront, the PD must comply with all the requirements of the vendor process as per
Table 4-17, to ensure the company will be registered with Eskom.

89
Table 4-17: Vendor registration process
Requirements Description
1 Original cancelled cheque or letter from the bank, verifying banking details
2 Certified copy of business registration documents of company
3 Tax clearance certificate
4 Proof of registration with UIF
5 Proof of registration with compensation fund for workers
6 A copy of the CIDB (Construction Industry Development Board) certificate
7 Proof of professional registration
8 Shareholder certificates or the shareholder’s agreement
9 Confirming the percentage of Black ownership and Black management within
the business
10 Latest verified annual financial statement confirming annual turnover, Net Profit
Before Tax (NPBT) and total cost of labour
11 Letter signed off by an auditor or certified accounting officer confirming the
entity is newly incorporated and is in its first year of operation
b) Determining the RACI
Based on the vendor registration requirements, The RACI was developed for this activity as per
Table 4-18.
Table 4-18: RACI for activity flow G
RESPONSIBLE ACCOUNTABLE CONSULTED INFORMED
IDM
Eskom vendor management
department
PD
PM

90
c) Determining the critical controls
The critical control in this activity is to ensure the PD complies with the requirements of the
vendor registration process. Non-compliance will lead to extensive delays in the registration
process, causing frustration to both the PD and Eskom.
d) Suggested time to register a PD as vendor
The suggested time to register a PD as a vendor is set at 2 weeks provided all the vendor
requirements are met.
4.4.5 EXECUTION PHASE
� Activity flow H
a) Project screening and registration
Based on the challenges with the ESCO model process, projects submitted to IDM were often not
registered as they were not well understood by the PM. Therefore this step was developed to
ensure proper controls and templates are in place for the PM to better understand the project
and requirements thereof.
Furthermore every project must be registered by the PM to ensure effective tracking of the
project from a time, cost and quality point of view. PDs also requested some form of project
identification as they often worked on multiple projects at the same site.
This step involves the screening and registration of the project by the PM as per the newly
developed registration template by the technical team. The new template as seen in Table 4-19 is
self-explanatory and therefore directs the project manager to look for specific fields in the project
submission.

91
Table 4-19: Screening and registration template
No. Screening fields To be completed by PM
1 Project Number
2 *Project Name
3 Customer Name
4 *IDM Sector
5 *Technology
6 *Group Customer Service Areas
7 *IDM Regional
8 *National Province
9 ESCo (if applicable)
10 Project Developer Name
11 PD Contact Number
12 Letter of Intent provided? Yes / No / Not Applicable
13 *Project Manager/Energy Advisor
14 *Proposed Demand Savings
15 Technical Load Factor
16 *Proposed Energy Saving
17 *IDM Funding Category
(Please select)
Standard Product / Standard Offer
/ Performance contracting / ESCO
18 *Maximum Project Cost to Eskom
19 *Time to Implement (in months)
20 Project Status (Please select)
21 *Proposed Start Date
22 *Proposed End Date
23 M&V Request submitted
(if applicable)
24 When is it anticipated that the project will
be claimed (Please Select)

92
b) Determining Critical control
* Denotes Compulsory information required by the Programme Management Office (PMO); if not
completed this project will be rejected and will not be registered on the (PMO) database.
c) Determining the RACI
Based on the activity outcome, the RACI was developed for this activity as per Table 4-20.
Table 4-20: RACI for activity flow H
RESPONSIBLE ACCOUNTABLE CONSULTED INFORMED
IDM
PM
PD
PMO
d) Suggested time to screen and register a project
As this activity requires the gathering of information, the suggested time for the PM to complete
this activity is set at 1 week.
� Activity flow I
a) TEC evaluation
This step is similar to the ESCO process step, whereby the PM submits the project to a Technical
Evaluation Committee (TEC). TEC will assess the technical soundness and viability of the
submission before it can be presented to the Project Evaluation Committee (PEC) for approval.
The challenges experienced with this step in the ESCO process was the requirements for TEC
evaluation not being well understood. It lacked transparency, hence projects were often rejected.
To overcome these challenges the technical department developed a project checklist (Annexure
A) that was transparent and entailed all the requirements of the committee. The checklist covered
five main parts, which the PM must comply with, namely:

93
Part A: General project information
Part B: Technical information
Part C: Requirements for specific technologies
Part D: Information required for PEC submission
Part E: M&V
Together with the checklist, the PM has to also submit the following information to the TEC for
approval.
• Project scope of work
• Technology overview
• Load profiles
• Load reduction calculations
b) Determining the RACI
Based on the activity flow, the RACI was developed for this activity as per Table 4-21.
Table 4-21: RACI for activity flow I
RESPONSIBLE ACCOUNTABLE CONSULTED INFORMED
PM
TEC
PD
PMO
c) Determining the Critical controls
The PM also has to comply with the requirements of TEC by completing the standard checklist
developed by the technical team for the SO programme as per annexure A. The checklist was
developed to ensure transparency of TEC requirements. These requirements will direct both the
PD and PM to submit necessary information to TEC for evaluation. The enhanced checklist
prompts the PM to make sure the submission is all inclusive.
d) Suggested time for TEC approval
Based on the level of detail required from TEC upfront, an approval time of two weeks was set for
a project to be approved at TEC.

94
� Activity flow J
a) PEC approval
Based on the approval of step D, the PEC committee received a new mandate that will enable the
committee members to approve a SO project from a technical, financial and commercial point of
view.
Previously in the ESCO process, the PEC only had a mandate to approve the technical part of the
project, thereafter recommending the project to the financial and commercial committees
respectively, which led to unnecessary project delays.
Due to the urgency and need for EE projects the PEC committee chairman decided to have a
committee meeting once a week to speed up the evaluation process.
The committee requested the following documents be submitted in order for the committee to
make an informed decision:
• The project registration form completed by the PM
• TEC checklist completed by the PM
• Overview of the project risks and possible mitigations
b) Determining the RACI
Based on the activity flow the RACI was developed for this activity as per Table 4-22.
Table 4-22: RACI for activity flow J
RESPONSIBLE ACCOUNTABLE CONSULTED INFORMED
PM
PEC
PD
PMO
c) Critical controls
The PEC has now been granted a mandate to conclude contracts with compliant PDs, this
mandate must be respected and strictly adhered to, as the committee is now authorised to

95
conduct technical, financial and commercial approvals. In the ESCO process the PEC was
authorised to conduct technical approvals only.
d) Suggested time for PEC approval
Seeing that the PEC agreed to meet weekly, the committee’s approval time was initially set at 1
week, however the requirements of the committee are detailed, hence it was decided to re-set
the approval time to 2 weeks.
� Activity flow K
a) M&V request & Baseline developed
In this step an M&V entity is appointed by Eskom, via the request of the PM, to establish an
independent baseline at the customer’s facility to determine the current electrical energy
consumption. The M&V organisation is an independent third party and the costs of the M&V are
paid by Eskom. The process followed by the M&V body is similar to that of the ESCO process;
hence no developmental changes were made to this step as compared to the ESCO process.
b) Determining the RACI
Based on the activity flow the RACI was developed for this activity as per Table 4-23.
Table 4-23: RACI for activity flow K
RESPONSIBLE ACCOUNTABLE CONSULTED INFORMED
PM
TEC
PD
PMO
c) Determining the critical controls
The baseline development is a key step in the SO process, as the incentive payments to PDs are
determined by comparing the actual performance of the project against the baseline. The
baseline must be signed off by the PD, M&V and IDM.

96
d) Suggested time to develop a baseline
The time proposed by the M&V entity to develop a baseline is 6 weeks.
� Activity flow L
a) PD signs SO contract
The signing of the SO contract is to ensure a legal contract exists between Eskom and the PD.
Payment based on performance to the PD, is governed by the conditions of this contract. The
development of the SO contract is a major shift in thinking from the ESCO process contract
mechanism, as the project risks are transferred to the PD.
In the ESCO process it was seen that the contracting process with the ESCO was an onerous task.
Contracts were lengthy and could take up to 12 months to conclude.
In the new process the SO contract was developed, (as per activity flow B6) to be simple and easy
to understand.
In this step the PD is now ready to sign the new SO contract. The development of the SO contract
makes provision for:
• Baseline development
• Eligible technologies
• Measurement acceptance date
• Payment structures
• M&V
• Payment and refund processes
• Product developers’ obligations
• Eskom’s obligations
• Guarantee and indemnities
• Dispute resolution
• Breach and Termination

97
The PM has to populate the SO contract, by completing the required fields namely:
• PD details
• Details of the Customer
• Details of the approved technology
• Minimum kWh savings
• Duration of contract
• Domicile address of both Eskom and the PD
On completion of the above, the PD is sent a copy of the contract for signatures, thereafter the
contract is signed by the authorised person in IDM.
b) Determining the RACI
Based on the activity flow the RACI was developed for this activity as per Table 4-24
Table 4-24: RACI for activity flow L
RESPONSIBLE ACCOUNTABLE CONSULTED INFORMED
PM
Senior General Manager
(IDM) / PD
Legal department
M&V
c) Critical controls
The SO contract must be signed by both IDM and the PD before the project can be implemented.
If implementation starts without the contact being signed, the PD will not be compensated
retrospectively.
d) Suggested time to sign SO contract
The suggested time to conclude the signing of the SO contract is 1 week; this is to allow the PD to
fully understand the contract conditions and risks thereof.

98
� Activity flow M
a) PD implements project
In developing this activity, it had to be ensured the PD takes full accountability for the project
implementation, the speed and quality of the installation. The PD must implement, complete and
commission the Approved Technology at the Facility at its sole cost and risk.
Based on the author’s experience with the ESCO process, project implementation could take
longer than 12 months to complete with the ESCOs continuously asking for more extensions. This
negates the whole purpose of rapid implementation of EEDSM projects in SA. Due to this, the
SOP is designed to allow the PD only 6 months in which to complete the project implementation.
b) Determining the RACI
Based on the activity flow the RACI was developed for this activity as per Table 4-25.
Table 4-25: RACI for activity flow M
RESPONSIBLE ACCOUNTABLE CONSULTED INFORMED
PD
PD
PM
M&V
c) Determining the critical controls
Prior to implementation the PM needs to ensure the M&V Plan, Baseline and SO contract have all
been signed.
d) Suggested time to implement project
The maximum time that is allowed for project implementation is six months as EE savings are
urgently needed.
� Activity flow N
a) Disposal of old technologies
An extract from the new SO contract specifies:

99
“Dispose of old luminaries or other goods or equipment which needs to be disposed of, in
accordance with the requirements of the Hazardous Substances Act no. 15 of 1973, Environmental
Conservation Act no. 73 of 1989 and regulations of the Department of Water Affairs and Forestry,
and any additional applicable legislation.”
b) Determining the RACI
Based on the activity flow the RACI was developed for this activity as per Table 4-26.
Table 4-26: RACI for activity flow N
RESPONSIBLE ACCOUNTABLE CONSULTED INFORMED
PD
PD
PM
M&V
c) Determining the critical controls
The PD must obtain a certificate by an independent disposer indicating the disposal of equipment
or other goods was executed in an environmentally friendly manner and they will not be reused.
d) Suggested time to dispose of old technology
The suggested time for the PD to dispose of the old technology is two weeks.
� Activity flow O
a) Post M&V assessments
This activity flow is as per the M&V guideline developed for the SO programme (37). On
completion of the project, the PD will submit a certificate of completion (CoC) to the PM for
approval. On approval, the PM will notify M&V to conduct the first performance assessment.
The PD provides the M&V entity with post implementation data, including installation details and
disposal certificates. The M&V body will perform an assessment over a period of 4 weeks, called
the measure acceptance period (MAP) and thereafter produce the first performance assessment
(PA) report.

100
b) Determining the RACI
Based on the activity flow the RACI was developed for this activity as per Table 4-27.
Table 4-27: RACI for activity flow O
RESPONSIBLE ACCOUNTABLE CONSULTED INFORMED
M&V body
M&V body
PD
PM
c) Determining the critical controls
The PM must check if there are any variables that could affect the verified savings negatively.
Often due to seasonality and Customer production patterns, performance can vary. Projects
might underperform during the measure acceptance period but will then catch up during the
course of the year.
d) Suggested time to produce a PA report
According to the M&V guideline, the suggested time to produce a signed performance
assessment report is 6 weeks subject to the necessary information being available.
� Activity flow P
a) PD submits 1st
invoice for payment
In this step, the PM will instruct the PD to submit the first invoice to IDM for payment based on
the PA report. Based on activity flow B7, IDM will pay 70% of the contract value to the project
developer on the Measure Acceptance Date (MAD), and within 30 days of receipt of a valid tax
invoice.
b) Determining the RACI
Based on the activity flow, the RACI was developed for this activity as per Table 4-28.

101
Table 4-28: RACI for activity flow P
RESPONSIBLE ACCOUNTABLE CONSULTED INFORMED
PM
PD
Finance
M&V
c) Determining critical controls
The PM must use the accepted PA report to calculate the rebate payable to the PD in line with the
SO terms and conditions.
d) Suggested time to pay invoice
According to the SO contract, the PD will get paid within 30 days of receipt of a valid tax invoice.
� Activity flow Q
a) Annual M&V assessment over 3 years
This activity is as per the M&V guideline developed for the SO programme (36). The second
performance assessment will be calculated twelve months after the commencement of the
sustainability period (from MAD). Metered data for twelve months will be used to determine the
project performance between 6.00 am to 10.00 pm Monday to Friday, only.
The PM will again calculate the rebate value based on the PA report, and will thereafter instruct
the PD to invoice another 10% of the contract value.
b) [Determining the RACI]
Based on the activity flow, the RACI was developed for this activity as per Table 4-29.
Table 4-29: RACI for activity flow Q
RESPONSIBLE ACCOUNTABLE CONSULTED INFORMED
M&V body
M&V body
PD
PM

102
c) Determining the critical controls
The PM must ensure good records and proper filing are in place as the PD must be paid over a
period of 3 years. If the PM leaves IDM within the 3 years, a proper handover to the new PM
must be done with both PM’s signing a take-over certificate.
4.5. CONCLUSION
In this Chapter the new SO process was developed using the framework for managing complex
situations under the Systems Thinking Approach. The ten steps of this approach were applied in
determining high leverage interventions, where managing the right things lead to large improvement
gains.
Thereafter the process was aligned to Eskom’s PLCM model, which is a series of sequential phases a
process passes through from the initiation to the close out. The PLCM allowed the framework to
develop a process that is transparent, showing clear roles and responsibilities of each activity and
locking in critical controls and approval gates for each phase.
By applying the above techniques, three of the five objectives were embedded in the new process;
namely:
• Streamlined approval process
• Eskom’s risk reduced by making the payments performance-based and pay only for measured
and verified savings
• Improve time taken to evaluate EEDSM projects
The other two objectives can only be determined after the new process has been opened to the
market and tested as a case study; to recap these two objectives are:
• Increased market uptake for Energy Efficiency
• Reduced burden on Eskom staff
Comparing the SO application process to the ESCO process as per Table 4-30, it can be seen that the
SO process should significantly reduce time taken to evaluate EEDSM projects.

103
Table 4-30: Comparison between the ESCO and new SO process
Phases Activities ESCO process New SO process
Phase 1
Activity
Average time to
complete activity 1 to
3
Suggested time to
complete activity 1 to
3
DSM investigation by
ESCOs
1. ESCOs market DSM to obtain
Letter of Intent (LOI)
2. ESCOs conduct detailed audit
at customer site
3. ESCOs formulate project and
submits to IDM for funding
3 to 6 months
7 weeks
Phase 2
Activity
Average time to
complete activity 4 to
8
Suggested time to
complete activity 4 to
8
Project evaluation by
IDM
4. Technical evaluation
5. PEC approval
6. Request M&V to develop
baseline
7. Financial evaluation
8. Commercial evaluation
6 to 12 months
7.5 weeks
Phase 3 Activity Average time to
complete activity 9
Suggested time to
complete activity 9
Develop project
baseline
M&V
9. M&V to develop project
baseline to determine “as is”
operation of the facility
12 weeks
6 weeks
Phase 4
Activity
Average time to
complete activity 10 &
11
Suggested time to
complete activity
10&11
Contracting
10. ESCO signs implementation
contract with IDM
11. Customer signs DSM
agreement with IDM
3 to 15 months
2 weeks
Phase 5
Activity
Average time to
complete activity 12
Suggested time to
complete activity 12
Implementation
12. ESCO implements project at
customer site as per the
conditions of contract
(project dependent,
average – 12 months)
Up to 6 months
Phase 6
Activity
Average time to
complete activity
13 & 14
Average time to
complete activity
13 & 14
Performance
assessment &
maintenance
13. Performance assessment by
M&V
14. Customer maintain savings for
5 years
(Up to 3 months)
6 weeks

104
In the next chapter the new SO process will be applied to a commercial facility to test the process
against:
• approval time lines from submission to execution of the project;
• process effectiveness in comparison to the ESCO process;
• the critical controls of each activity.

105
Chapter 5
5. CASE STUDY
5.1. INTRODUCTION
In the previous chapter the new SO process was developed. In this chapter the new SO process will be
implemented and tested on a large commercial retail facility in SA. The case study will be tested
against the new SO process to validate the following:
• approval time lines from submission to execution of the project
• process effectiveness in comparison to the ESCO process
• the critical controls of each activity
As the confidentiality of the PD, the Customer and the M&V entity will be respected, the name and
location of the Project will remain anonymous. It will therefore be referred to as, “project A” for the
remainder of the case study. The customer will be referred to as, “the Customer”.
In this case study, the Customer requested the services of a PD to reduce electrical energy use at the
Customer’s retail stores nationally. Many PDs were screened by the Customer and finally a decision
was taken by the Customer to appoint a locally based PD. After signing the LOI with the Customer the
PD conducted a high level investigation at the Customers stores and recommended to the Customer
that the existing in-efficient lighting system be retrofitted with EE lighting technologies, using the SO
process.
This case study focused on the details of the lighting retrofit opportunity at the first 30 retail stores of
the Customer in Gauteng and the northern regions of SA using the SO process. The new SO process
developed in Chapter 4 is summarised in Table 5-1. The rest of this chapter will follow the logical flow
as shown in Table 5-1 with the letter sequencing being used. The SO project application process starts
from activity F1 and ends at R. Key observations will be discussed at each activity flow.

106
Table 5-1: SO application process with suggested timelines to complete each phase
Phases Activities New SO process
Phase 1
Activity
Suggested time to complete
activity F1 and F2
EEDSM investigation by PD
F1 - PD markets SOP to obtain LOI from the
customer
F2 – PD formulates project submission to IDM
7 weeks
Phase 2
Activity
Suggested time to complete
activity G to K1
Evaluation of project by IDM
G- PD registers as a vendor with Eskom
H- Project screening and registration by PM
I – Assessment and approval of project by TEC
J – PEC approval of project
K 1 - PM request M&V to develop project
baseline
7.5 weeks
Phase 3 Activity Suggested time to complete
activity K2
Development of project
baseline
K2 - M&V to develop project baseline to
determine “as is” operation of the various
stores
6 weeks
Phase 4
Activity
Suggested time to complete
activity L
Contracting
L - PD signs SO contract with IDM
2 weeks
Phase 5
Activity
Suggested time to complete
activity M and N
Implementation
M – PD implements project as per the terms
of the SO contract
N – PD disposes of old technology
Up to 6 months
Phase 6 Activity Suggested time to complete
activity O and P
Performance assessment &
maintenance
O – Post measure acceptance period
performed by M&V
P – Project sign off and first invoice submitted
for payment by the PD
Q – Annual M&V assessment over 3 year
sustainability period
R – IDM releases retention money over
contract period
6 weeks

107
Step 1 - PD markets SO programme to obtain LOI from the Customer (activity flow F1)
(Time suggested to obtain LOI - 3 weeks, actual time spent - 2 weeks)
Following on the launch of the Standard Offer Programme (SOP) by IDM, PDs began approaching
customers to market the new SOP immediately.
Early July 2012, the PD made contact with the Customer to set up an appointment to promote the
SOP. Two weeks later the Customer met with the PD. The PD understood the requirements of the
SOP and was comfortable in selling the SO concept to the Customer. In the marketing phase the PD
set the scene by explaining the electricity shortage situation in SA and the need for rapid
implementation of electricity saving projects. The PD further went on to explain the rules and
requirements of the new programme, which was published on Eskom’s website. This gave the
programme credibility as the PD was able to refer the Customer to the website for further
information and verification of the SOP rules. The PD explained the financial, technology and
environmental benefits of implementing the SO to the customer. The Customer, seeing the benefits
of such a programme, signed a LOI with the PD on the 27 July 2012.
1.1 Key observations on activity F1
According to the PD, obtaining the LOI was much quicker than anticipated. The suggested time
allocated for this step is three weeks to allow the Customers legal department to sign the LOI. The LOI
was signed in two weeks, which demonstrated the Customer was keen on energy savings and also
understood the new process requirements and the risks thereof.
The PD indicated some discomfort in signing the LOI, as the Customer added an extra clause that
instructs the PD to use the Customers maintenance team to do the installations of the new lighting
technologies; the reasons being the Customers maintenance team understood the facilities electrical
system and operations better than the PD. The PD complied with this request despite losing potential
profit on the installation. The PD was also aware that the LOI would expire in 2 months, and
thereafter the customer could approach another PD to perform the work if the PD failed to submit an

108
application to IDM within the required time. The PD also indicated that he was willing to break even
(from a cost perspective) on the first project in order to build up his company profile.
Aside from the LOI, positive feedback was received from the PD regarding IDM’s approach to publish
the SO rate nationally. By knowing exactly what IDM’s financial contribution to the project would be,
the PD was enabled to proactively sell the SOP, thereby creating a healthy pipeline of projects for the
PD.
1.2 Comparing the SO process against the ESCO process for activity F1
In comparison to the ESCO process for the same activity (Table 5-2), the SO process has proven to be
an easy sell to the Customer. The process is transparent and well understood by all parties. The time
taken to obtain a LOI is significantly reduced thereby leading to greater market penetration in the
commercial and industrial sector.
Table 5-2: Comparison between the SO and ESCO process for activity F1
OBTAINING LOI
Key
Observations
ESCO process SO process
1
• ESCOs find it difficult to sell the
ESCO process to customers as the
programme rules are neither well
defined nor transparent.
• The ESCO process was not published
on Eskom’s website at the time.
• The PD indicated that it was an
easy sell to market the SOP.
• The SOP process was transparent
and well understood.
• The SOP programme was published
on Eskom’s website.
2 • The time taken for ESCOs to obtain
a signed LOI from customers could
take up to 2 months.
• The suggested time for the PD to
obtain a signed LOI is set at 3
weeks.

109
1.3 Critical Controls for activity F1
The PM has to check the LOI is signed between the PD and the Customer. If the LOI is not signed it will
be regarded as null and void, in addition the PD could expose himself to performance risk at a later
stage in the process. The PM also has to make sure the LOI has not expired when reviewing the
project.
Step 2: PD formulates project and submits to IDM for funding approval (activity flow F2)
(Time suggested to formulate project - 4 weeks, actual time spent - 3 weeks)
Following on from the signing of the LOI, the PD started the detailed energy audit at the Customer’s
facility on the 30 July 2012. The audit included the identification of large electricity users, plant
layouts, historical data and process flows, which informed the development of a project proposal. By
the modelling of consumption data, problem stores were identified, and comprehensive energy
audits completed. Technical opportunities were identified pertaining to voltage supply, refrigeration,
and lighting, with the focus on lighting for this case study. The key project information of the
Customer’s stores is summarised in Table 5-3.
Table 5-3: Customer site information
Site information
Type of customer Food retailer
Total electricity usage (kWh) all stores 569 000 000
Electricity usage per m2 per annum 573
Operating hours of stores 7 days per week with varying operating schedules
for weekdays, Saturdays and Sundays
Time of operations During the week, from 8.00 am to 8.00 pm, on
Saturday and Sunday from 8.00 am to 5.00 pm.
Site location/s All provinces in SA

110
Following the audit the PD requested the necessary SO project templates from the PM at IDM. The PD
completed the template, which was then signed off by the Customer and submitted to IDM for
funding consideration on the 17 August 2012.
2.1 Key observations on activity F2
Formulating the project submission by the PD was quicker than anticipated. The PD indicated the
success factors that contributed positively to packaging a speedy project proposal to IDM were:
• Prior to signing the LOI, the Customer already had an energy management policy for the
group, which called for a reduction in operating expenditure and of greenhouse gases and
emissions. Each store manager had to comply with the policy.
• The Customer appointed a dedicated Energy Manager at head office to assist the PD to
gather project information from the stores.
• The Customer had permanent meters that recorded electricity usage at 30 minute intervals.
Although the PD submitted the project to IDM before the suggested timeline of 4 weeks, clarification
on the SO template was needed by the PD, which was addressed by the PM. In one instance the PM
identified discrepancies in the submission, which the PD had to rectify.
2.2 Comparing the SO process against the ESCO process for activity F2
When compared to the ESCO process (Table 5-4), it was found the PD had a higher confidence level in
the SO process with regards to project approval.

111
Table 5-4: Comparison between the SO and ESCO process for activity F2
Formulating project proposals
Key
observations
ESCO process SO process
1
• ESCOs allocate time and funding to
investigate EEDSM projects that may
eventually not be funded by IDM due to
incorrect technical information provided or
budget constraints.
• The PD had a high confidence level
of project approval, as the rules
rates, and the technologies of the
SOP are published upfront.
• SO budget drawdowns are shared
with PD at regular intervals.
2 • Time taken to develop a project can be
greater than 3 months.
• Suggested time to formulate a
project proposal is set at 4 weeks.
2.3 Critical controls for activity F2
The PM has to ensure the project submission from the PD is signed off by the Customer before the
project can be considered for IDM funding. Based on experience from the ESCO process, some project
submissions to IDM were not seen by the Customer; hence the Customer did not know what potential
financial and legal risks could follow on the project.
Step 3: Register PD as a vendor with Eskom (Activity flow G)
(Time suggested to register PD as a vendor - 2 week, actual time spent - 4 weeks)
Following the project submission to IDM on the 17 August 2012, the PD then started the vendor
registration process with Eskom. On the 20 August 2012, the PD submitted vendor forms as per Table
5-5 to Eskom to be registered as a vendor. The forms were checked by the project administrator at
IDM who found that the PDs tax clearance certificate had expired. The PD was then notified
immediately to rectify the situation.

112
Table 5-5: Eskom vendor registration process
Requirements Description
1 Original cancelled cheque or letter from the bank verifying the banking details.
2 Certified copy of business registration documents of company.
3 Valid and original tax clearance certificate
4 Proof of registration with UIF.
5 Proof of registration with compensation fund for workers.
6 A copy of the CIDB (Construction Industry Development Board) certificate.
7 Proof of professional registration.
8 Shareholder certificates or the shareholder’s agreement.
9 Confirmation of % black ownership and black management within the company.
10 Latest verified annual financial statements confirming annual turnover, Net
Profit Before Tax (NPBT) and total cost of labour.
11 Letter signed off by an auditor or a certified accounting officer confirming that
the entity is newly incorporated and is in its first year of operation.
3.1 Key observations on activity flow G
The suggested timeline to register the PD as a vendor is 2 weeks provided all vendor requirements
are met. The actual time spent was 4 weeks; hence the PD was registered on the 14 September 2012.
The reasons for the delay:
• The PD had to source the latest copy of his company’s tax clearance certificate as the one
submitted with the project had expired.
• The PD had to seek clarity from CIDB on the minimum requirements to be accredited by the
Board.
3.2 Comparing the SO process against the ESCO process for activity G
The vendor registration steps for the ESCO process and SO processes are the same; hence there was
no need to do a comparison of the processes.

113
3.3 Critical controls for activity G
This step is a mandatory requirement for all PDs, failing to register as a vendor will prevent the PD
from receiving payments or doing business with Eskom.
Step 4: Project Screening and registration by PM (Activity flow H)
(Time suggested to screen and register project - 1 week, actual time spent - 3 days)
Upon registering as a vendor, the PM started the screening and registration of the project on 17
September 2012. This was in line with the newly developed project registration template shown in
Table 5-6. The template directed the PM to look for specific fields in the project submission. Some
information was not available in the project submission hence the PM immediately requested this
information from the PD. Once completed the PM submitted the information to the Programme
Management Office (PMO) for a project number to be allocated.
Table 5-6: Project registration template
Project Number 2012xxxx
Project Name Project A
Programme funding model Standard Offer
Sector Commercial
Technology Lighting
Distribution Region Central, Northern, North West
ESCO (if applicable) Project Developer
Customer Name The Customer
Letter of Intent (LOI) Yes
Proposed Megawatt savings 0.4264
Technical Load Factor 0.49
Proposed MWh savings per annum 1 774
Project Cost R 2 234 802
Time to Implement (in months) 4 months
Project Status Submission to PEC
Proposed Start Date November 2012
Proposed End Date End January 2013
M&V Request submitted (if applicable) Pending

114
4.1 Key observations on activity flow H
It was anticipated the screening and registration of projects would take at least 1 week, however due
to the implementation of the new SO project registration template (Table 5-6) the time taken by the
project manager to complete the task was 3 days.
The PM indicated the project registration process was a pleasant experience and fairly simple. Certain
fields of the template were filled in by the PD and verified by the PM. The registration template
guided the PM to look for key information in the project proposal, which led to a quicker turnaround
time and reduced the administrative burden on the PM.
The DSM manager at the time was not happy that the PM did not screen the project in parallel with
the vendor registration process. Although the vendor registration is mandatory, the PM could have
followed up with the vendor management department as to the delays, and thereafter taken
calculated risks to proceed with the screening of the project, which will be subject to the tax
clearance certificate coming later.
4.2 Comparison between SO and ESCO process for activity H
When comparing the SO to the ESCO process as per Table 5-7, it can be seen the new SO process are
transparent thereby leading to better screening controls, which result in projects being registered
quicker.
Table 5-7: Comparison between SO and ESCO process for activity H
Project Screening and registration
Observations ESCO process SO process
1
• Projects were not registered by IDM, as the
registration process was not transparent and
not well understood by the PD and PM.
• Project registration was quick,
transparent and well
understood by the PD and PM.
2 • Registrations were managed using an
inefficient system, which was not easy to
use, time consuming and lacked
transparency.
• The new Registration template
shown in Table 5-6 was easy to
understand and enhanced the
working relationship between
the PD and PM.
3 • Frequent requests for more information had
to be made with corresponding delays.
• Additional information was
requested once by the PM.
4 • Project screening and registration could take
up to 2 months.
• Suggested time to screen and
register project up 1 week.

115
4.3 Critical controls for activity H
The PM had to ensure the information required in Table 5-6 was provided timeously. This information
is used by the Programme Management Office (PMO) to capture key information on the project to
allow for better statistical reporting to key stakeholders and serves as a tracking number for the PD.
Step 5: TEC Evaluation (Activity flow I)
(Time suggested for evaluation by TEC – 2 weeks, actual time spent - 1 week)
After project registration, the PM submitted the project to the Technical Evaluation Committee (TEC)
on 24 September 2012, in the format requested by the committee. The TEC assessed the technical
soundness and viability of the project for approval to the Project Evaluation Committee (PEC). The
TEC requirements in the new process were transparent, and easy to understand. The templates
developed for TEC submission were based on experienced gained from the ESCO process. The PM
submitted and explained the following information to the TEC which covered:
• The project SOW
• Description of the new EE technology
• Electrical load profiles showing current consumption at the Customer’s stores
• Load reduction calculations
� Scope of work
The SOW from the project submission packaged by the PM entailed the conversion/ replacement and
upgrade of the T8 (Tubular diameter) fluorescent light fittings to T5 EE fluorescent light fittings. The
conversion upgrades of the old white reflector T8 type fitting to a highly efficient aluminium reflector,
was done replacing the double T8 lamps and ballast (magnetic or electronic) with a new single T5
lamp and ballast. The conversion allows for a minimal reduction in light output, while considerably
reducing total system power usage. The conversion was scoped according to the number of lamps,
height and application of the luminaire.

116
To arrive at the SOW the PD had to conduct an audit on the first group of 81 stores. From this, a batch
of 30 stores based on priority was selected for phase 1. The steps taken by the PD to arrive at the
SOW were:
• A detail audit process which includes a site inspection, counting all light fittings and lamps,
reviewing operating parameters was concluded.
• Tariff and billing information was gathered for the stores total electrical energy consumption.
• The above information was then processed, analysed and used as input in the design process.
• Proposed energy optimisations, highlighted by savings per site per target area, were
presented to the client for final selection.
� A description of the new technology (specification)
The PD submitted the specification to IDM as per Table 5-8 with the intention to retrofit the old
technology with the following new technology. The technology was assessed by the TEC and was
given the go-ahead within the project.
Table 5-8: New EE technology specification
Type Length Product name Rated
Power
Lumen
[lm @
250C]
Colour
rendering
index
(CRI)
Correlated
colour
temperature
(CCT)
[K]
Service
Life
(hours)
T5 5 Ft Lumilux T5 49W 4300lm 80..89
4000 18 000
T5 4 Ft Lumilux T5 54W 4850lm 80..89
4000 18 000
The conversion reduced the light level by about 20%, which translates into a lux level measured 1m
above floor level, of around 900 lux. Extensive customer surveys conducted by the PD indicated this
reduction in light level would be sufficient for the Customer. The Customer requested the new
technology comply with the minimum lighting specification as per the Occupational Health and Safety
Act (OHSACT).

117
� Electrical load profiles
Determining the electrical load profiles was conducted by the PD. According to the PD, this step was
fairly quick, as the Customer has a metering solution, which consists of main and back-up meters.
These permanently installed meters record data at 30 min intervals and are read by an external
metering company and stored on a database. On all sites included in this project the main meters
have been certified by an independent metering company.
To determine the current electrical consumption of the Customer, the PD used multiple data sources;
namely kWh consumption and audit information, which is processed, analysed and used as input in
the development of the electrical load profiles. Information obtained from the site audits is used to
determine the current lighting demand. A full record of all the fittings installed, lamps in fitting and
lamps out was gathered and documented. This process accurately recorded the lighting kW demand
for each site.
With specifications known for the installed system and the solution, a power reduction can be
calculated per fitting. Given the store operating times, a daily energy saving is established for each
proposed solution. Grouping the solutions into the respective functional areas, energy savings are
quantified per target area. The 24 hour electrical load profile after retrofit is modelled under perfect
conditions, with a key switch already in place to switch all or specific lights off after store closure, and
on for store opening.
All the sites included in this proposal have a simulated profile for a total lighting load and for each
target area. Figure 5-1 shows the total lighting load profiles for each store (baseline). The proposed
profile shows the actual load, with lamps out at the time of the audit.

118
Figure 5-1: Proposed weekday lighting power profiles of the Customer
� Load reduction calculations
In formulating the baseline, the PD with the Customer made a few assumptions, namely:
• The power factors of the various lights are stable.
• The frequency of the electric supply is stable.
• There will be no other energy interventions on the lights by the client.
• There will be no new lights added to the project scope.
• The operating schedule of the post-implementation case will be the same as the current lighting
system.
� Project checklist
The PM had to complete the project checklist as per annexure A to ensure all information relating to
the project had been submitted. The checklist covers parts A to E, as follows:
Part A: General project information
Part B: Technical information
Part C: Requirements for specific technologies
Part D: Information required for PEC submission
Part E: M&V information

119
5.1 Key observations on activity flow I
It was anticipated that the evaluation by the TEC would take 2 weeks to complete due to the level of
information required. Actual time taken by TEC to evaluate the project was 1 week and was
completed on 21 September 2012. According to the senior manager of the technical department, the
main reason for the quick turnaround time was the result of a quality submission by the PM to the
committee. The PM complied with the templates, checklist and requirements of TEC. The PM also
indicated the new project checklist developed for the SOP was a huge improvement as compared to
the ESCO process checklist. By following the checklist the PM knew exactly what was required by TEC.
5.2 Comparing the SO process against the ESCO process for activity I
When comparing the SO to the ESCO process as per Table 5-9, it can be seen the new SO process is
transparent and clear with regards to the information needed to evaluate the project, thereby leading
to improved approval times.
Table 5-9: Comparison between SO and ESCO process for activity I
TEC evaluation
observations ESCO process SO process
1 • There was insufficient staffing in the
technical section to evaluate projects;
hence staff could not cope adequately
with the incoming workload.
• The PM is now accountable to
complete the TEC checklist,
hence less burden on the
technical section resources.
2 • Proposals were often rejected as the
proposal evaluation process was not
well understood.
• The new TEC checklist guided
the PM and PD as to the
requirements of TEC, thereby
leading to better
understanding of the process.
3 • Good commercial sector EE projects
were being disqualified because they
operated outside the evening peak
periods, and there were no incentives
to encourage energy efficiency
projects.
• The new process encourages
good EE projects that save
energy between 6.00 am to
10.00 pm.
4 • Time taken to evaluate projects
could be as long as 3 months.
• Suggested time to evaluate
projects is set at 2 weeks.

120
5.3 Critical controls for activity I
The PM had to comply with the requirements of TEC by completing the checklist as per Annexure A
prior to PEC submission.
Step 6: PEC approval (Activity flow J)
(Time suggested for PEC approval - 2 weeks, actual time spent 1 week)
Following on TEC approval the PM prepared and submitted the project to the PEC members on 01
October 2012 for review. Due to the urgent need for EE projects the PEC Chairman decided to have a
committee meeting once a week; hence the PEC meeting was held on 04 October 2012. The
requirements of the PEC were clear. The committee requested the following documents from the PM
in order to make an informed decision on the project:
• The project registration form completed by the PM
• TEC checklist completed by the PM
• An overview of the project risks and possible mitigations
Considering the above, the PM presented at PEC on 04 October 2013, and requested the PEC approve
the implementation of the SO project to reduce the lighting electrical load by 426.4 kW at various
Customer stores. The PM summarised the energy savings, cost and time to implement the project as
per Table 5-10. This gave the committee a summarised view of what was required for easy decision
making.
Table 5-10: Summarised request of the project to the PEC
Rebate Value 42 c/kWh
kW Saving (Average Monthly) 426.4 kW
kWh Saving (Yearly @ 4,160hrs) 1 773 652 kWh
Total Capped Value (IDM’s contribution only) R 2 234 802
Project Implementation period 4 months

121
As per the request of PEC, the PM with the PD had to also identify possible project risks and
mitigations. These risks as shown in Table 5-11 were summarised with the mitigations. As per Table 5-
11, the PD had to rate the risk impact from a score of 1 to 10. Thereafter the PD with the PM had to
determine the probability factor of the risk materialising. The risk level was then calculated by
multiplying the risk impact with the probability. A low risk will be shown in a green highlight, the
medium risk will be shown in yellow, and high risks in Red.
Table 5-11: Project Risks and Mitigations
Risk description Risk
Impact
(A)
Probability
(B)
Risk Level
(A x B)
MITIGATION
1. Component
failures. 5 2 Low (10)
• A warranty period of 3 years was given to the
Customer to exchange any faulty equipment.
2. PD ability to
complete project
on time. 7 3 Low (21)
• Suppliers will be given sufficient lead time to
plan the ordering of equipment for the
project.
• The PD will plan the work to ensure minimal
disruption to the Customer’s trading hours.
• Installation contractors will work in a team to
speed up installation time.
3. Installation of
switching devices
that change the
simulated lighting
profile.
8 5 Medium (40)
• A key switch is inherently planned into the
lighting design. The energy management
program with daily dashboards will manage
the correct use of the switch.
4. Safety, Health
and Environmental
(SHE) incidents
occurring.
10 4 Medium (40)
• A SHE plan will be compiled, to be reviewed
by IDM and implemented during project
execution. This plan will also address safe
disposal of old light fittings.
5.Supplier
Development and
Localisation
(SD&L)targets not
being met.
8 5 Medium (40)
• SD&L performance to be tracked throughout
project execution by the PM and feedback
given to the commercial department.

122
Another key criterion of the PEC was to determine how many new employment opportunities would be created
in South Africa if the project was approved. The PD via the PM submitted a resource plan to PEC as per Table 5-
12, showing the number of new employment opportunities that would be created subject to project approval
by PEC.
Table 5-12: Employment opportunities to be created subject to PEC approval
Employment Opportunities PD feedback
• The number of new employment
opportunities that will be created due to the
IDM Funded project.
• This project will require a total of 4 senior technicians
(electrical) and 12 electrical assistants to implement
the project over and above the Customers resources.
Training that will be offered to new (and existing)
employees.
• On the job and class room training will be held for the
new resources.
• Characterise the new employees by age.
• Female or Male.
• Youth between 18 and 35.
• Male.
Duration of the employment of these new
employees.
• 2 to 4 months.
The PEC reviewed all the information submitted to the committee, which included:
• The project registration form completed by the PM.
• TEC checklist completed by the PM.
• An overview of the project risks and possible mitigations.
• Employment opportunities identified on the project.
• Power Point presentation of the project request by the PM.
• Excel spread sheets showing the calculations of the electrical load profiles.
• Project proposal as submitted by the PD.
On review of the above, the PEC granted approval of the project on the 04th
October 2012. The PD
was informed of the outcome by the PM.

123
6.1 Comparing the SO process against the ESCO process for activity J
With the ESCO process, projects were often rejected as the PM could not adequately address the
questions raised by PEC members. Frequent requests for more information had to be made to the
ESCO by the PM, leading to corresponding delays. With the SO process the information required by
the PEC was prompted at the TEC phase via the newly developed SO templates and checklist. 95% of
questions normally asked at PEC are now covered by the TEC templates and checklist. If the PD and
PM comply with these requirements, the approval from the PEC will be quick.
6.2 Critical controls for activity J
On approval from the PEC, the PM had to ensure the PD does not start implementation prior to the
baseline and SO contract being signed. The PD assumed the project could start based on PEC
approval. As a control measure the PM followed up with a letter to the PD.
Step 7: Baseline development (Activity flow K)
(Suggested time to develop baseline - 6 weeks, actual time spent - 4 weeks)
Following on from the PEC approval on the 04 October 2012, the PM completed the M&V request
form (activity K1) on the 05 October 2012. This request was submitted to the M&V entity to start with
the development of the baseline, which consisted of the load profiles and the relevant electrical
energy consumption of the Customer.
The purpose of independent M&V is to measure and verify the savings that will occur due to the
replacement of existing 1.5m and 1.2m (and further) T8 fluorescent lamps with 5 foot and 4 foot T5
fittings at 30 corporate stores nationally. According to the M&V request form compiled by the PM,
the anticipated reduction in demand is 426.4 kW from 6.00 am to 10.00 pm on weekdays; this is
equivalent to 1774 MWh savings per annum.
The M&V team used the same M&V guidelines for EEDSM projects (38), which also conform to SA
National Standards (SANS) 50010:2011 (37), while at the same time allowing for a more flexible and
streamlined process in the spirit of the SO in order to accelerate energy savings opportunities.
To develop the baseline (activity K2), the M&V team had to first scope the project by gathering site
information. The site information gathered (38) covers these situations:

124
• The stores operate 7 days a week with varying operation schedules for weekdays, Saturdays
and Sundays.
• During the week, they operate from 8.00 am to 8.00 pm, on Saturdays and Sundays from 8.00
am to 5.00 pm.
• The different stores operate on different electricity tariff structures. Among these are
Eskom night save, City Power Low voltage, Eskom Mini-flex, Tshwane LV and many others.
The M&V team performed a site visit middle of October 2012. The team indicated it was not possible
to do a comprehensive measurement of all the installed lighting at each site due to constraints on
time and extensive travel requirements. Rather, certain stores were visited in the Gauteng area,
which include Bedfordview, Florida, Sunward Park and Rosebank.
The M&V team indicated the accuracy of the scoping study depends on the accuracy of the database
submitted by the PD of existing lights and their associated light quantities. Unfortunately, the M&V
team cannot verify every single quantity of lights at each facility. Therefore, if the database provided
by the client is inaccurate in any way, then those inaccuracies could creep into the savings
calculations.
The development of the baseline was based on the current lighting system capacity and the lighting
operating schedule. The overall power consumption of the existing lighting system was established
based on the quantities of the fittings that were confirmed during the site visit and their actual power
consumption. A multi-meter was used to determine the power consumption for every half hour
interval of operation. The same procedure will be used to determine the load profile and the energy
consumption of the newly installed fittings after the EE intervention is finished. The team then
formulated a baseline for all the stores rather than individual stores as per Figure 5-2.

125
Figure 5-2: Load profile for Weekday, Saturday and Sunday (38)
7.1 Key observations on activity K:
The request to the M&V body was submitted on the 5th
October 2012. According to the M&V entity,
the estimated time to set a baseline for the project is 6 weeks, however the actual time spent on
setting the baseline was 4 weeks. The baseline was completed and signed on the 5th
November 2012.
This was a remarkable achievement by the M&V entity. The PD also played a key part in the M&V
process by ensuring all M&V requirements were met timeously and facilitated easy access to the
Customer site.
7.2 Comparing the SO process against the ESCO process
In comparison to the ESCO process, the time taken to develop the project baseline using the SO
process was significantly reduced. Table 5-13 explains some of the reasons for this.

126
Table 5-13: Comparing the SO baseline development against the ESCO process
Baseline development
Observations ESCO process SO new process
1 • At times, due to the workload, the
M&V teams cannot go to site to
conduct baseline measurements as
planned.
• The cost of the M&V meters
compared to project size could also be
costly.
• Due to the accuracy of the
information and database
from the PD, the M&V team
was able to develop the
baseline timeously.
2 • Baseline developments could take up
to 3 months depending on the
technology
• Suggested time to develop
baseline is up to 6 weeks.
7.3 Critical controls
Once the baseline had been developed, the PM ensured the baseline was signed off by the PD, IDM
and the M&V entity respectively. This is a key step, as future savings will be compared to the baseline.
Step 8: PD signs SO contract (Activity flow L)
(Suggested time to sign SO contract - 1 week, actual time spent 1 week)
On approval of the baseline, the PM prepared the SO contract for signatures. The PM had to populate
the SO contract, by completing the following required fields:
• PD details.
• Site details of the stores.
• Details of the approved technology.
• Minimum kWh savings.
• Duration of contract.
• Domicile address of both Eskom and the PD.
On completion of the above, the PD was sent a copy of the SO contract for signatures. The PD signed
the contract on the 07 November 2012 and thereafter the authorised person in IDM signed the
contract on the 13 November 2012

127
8.1 Key observations on activity L
At first, the PD requested clarity on many clauses in the contract, especially on the liabilities and
obligations of the parties, the PD engaged the PM who provided the necessary clarity. The PM was
well versed in the contract and did not require legal support to provide clarity to the PD. The PD was
then comfortable to sign the SO contract. The suggested time to complete this process step was 1
week. The PM populated the contract in one day. The signing of the contract by the PD was done 2
days after the baseline was signed off. The contract had to be couriered back to Eskom Head Office;
hence IDM received and signed the contract on the 13 November 2012.
8.2 Comparing the SO process against the ESCO process for activity L
In comparison to the ESCO process, the time taken to conclude and sign a SO contract with the PD
was significantly reduced. Table 5-13 explains some of the reasons for this.
Table 5-14: Comparison between the ESCO and SO process for activity L
Contract
Observations ESCO Process SO process
1 • The NEC penalties do not encourage over
performance on projects. The NEC is
designed to penalise the ESCO for
underperformance and not reward over
performance.
• The SO contract
encourages over
performance of 10%.
Incentives are paid for
over performance.
2 • The DSM Agreement which has to be
signed between Eskom and the customer is
onerous and lengthy, thereby requiring in-
depth discussions between the Eskom legal
department and the Customer.
• The SO contract was
simple to understand.
• The PD clearly
understood that the
contract is performance
based and no savings
equals no payment.
3 • Turnaround times of up to 15 months were
reported in signing the DSM agreement.
• Signing of the SO
contract could take up
to 1 week.

128
8.3 Critical controls for activity L
The PM has to ensure the SO contract is signed between an authorised person in IDM and the PD;
thereafter 2 copies of the contract are made, one for the PM file and the other for the PD.
Step 9: Project implementation (Activity flow M)
(Suggested time to implement project - 6 months, actual time spent - 4 months)
Upon signing the SO contract the PM instructed the PD to start with the project implementation. The
PD submitted a project plan as per Table 5-15 to the PM detailing how the project would be
implemented over a period of 4 months at 30 sites. The plan was accepted by the PM and the project
implementation started on the 01 December 2012. Due to the holiday season during December, most
of the project work to assemble the new light fittings was done off site.

129
Table 5-15: Project Plan
In week 1, the PD procured all the components and material related to the project. In week 2 the
manufacturing of the new light fittings began. By week 6 the new fittings were delivered to the
various stores as needed. Once the new light fittings arrived on site, the old fittings were removed
and replaced with the new fittings over a period of 2 days. Disposal of the old fittings was done in
parallel 2 weeks into the implementation cycle. The project completion certificate was signed off on
the 16 April 2013.

130
9.1 Key observations on activity M:
During the installation phase the PD submitted regular progress reports to the PM. Towards the end
of the implementation the PD reported a delay in progress, due to the Customers contractor having
to prioritise the construction of a new store for the Customer. The PD acted fast and used his own
team to complete the last phase of the project. The implementation was then completed within the
contract period. The quicker the installation the quicker the energy savings could be achieved, the
quicker the PD could claim the incentives from IDM.
The time proposed by IDM to complete project installation was 6 months. The PD completed the
implementation in four months.
9.2 Comparing the SO process against the ESCO process
With the ESCO process, project implementation could take up to 2 years to complete due to the
complexity of the project and working conditions at the project sites (Figure 5-16). The ESCO process
also allows for project implementation greater than 6 months. With the SO process the PD is
informed upfront that the project must be completed within 6 months due to the urgent need to
reduce electrical demand in SA.
Table 5-16: Comparing SO process to ESCO process
Project implementation
Observations ESCO process SO process
1 • Customers make internal changes to the facility
as they not willing to wait a long time for
approval from IDM. This affects the ESCOs
baseline negatively, which impacts the EE
savings negatively.
• Customers are willing to wait a
short time for funding from IDM
to implement EE projects, hence
they do not implement EE
measures on their own accord.
2 • Time to implement projects could be as long as
two years depending of the technology and site
conditions.
• Suggested time to implement
project up to 6 months.

131
9.3 Critical controls for activity M
The PM instructed the PD to submit regular progress reports on the project. The reports had to
highlight potential site risks and challenges. The PM also requested early warning notification from
the PD if the project was not going according to plan.
Step 10: PD disposes of old technology (Activity flow N)
(Suggested time to dispose old technology - 2 week, actual time spent 1 week)
Whist the project was in the implementation phase, the PD began disposing of the old technology,
(light fittings) from the completed project sites. The PD used an external company to dispose of the
old light fittings. Over 13000 fittings were disposed of in two batches. An independent disposal
certificate was signed thereafter.
10.1 Key observations on activity flow N
The SO process allows the PD to dispose of old technology; the PD appointed an external company to
dispose the old technology. Concerns were raised by M&V that there were no controls in place for
IDM to validate the credibility of the disposal company. In future the SO process should include a step
to validate potential disposal companies.
10.2 Comparing the SO process against the ESCO process
The comparison between the SO and ESCO process is shown in Table 5-17.
Table 5-17: Comparing SO process to ESCO process for activity N
Project implementation
Observations ESCO process SO process
1 • IDM is responsible to appoint a disposal
company to dispose of old technology. Often
due to the commercial process, the disposal
company is not appointed timeously; hence the
old technology is not collected from the
customer’s facility. This then becomes a health
and safety issue.
• The PD is responsible for
disposing of old technology.
Knowing this upfront, the PD will
appoint a disposal company to
remove the old technology from
the customer site thereby
mitigating possible health and
safety risks.

132
Critical Controls for activity N
The PM had to ensure the old technology was disposed of in accordance with the requirements of the
Hazardous Substances Act no. 15 of 1973, Environmental Conservation Act no. 73 of 1989 and
regulations of the Department of Water Affairs and Forestry, and in terms of any additional applicable
legislation.
Step 11: Post Measure Acceptance Period (Activity flow 0)
(Suggested time to measure post performance - 6 weeks, actual time spent - 4 weeks)
Following on project completion on the 16 April 2013, the M&V team conducted a post
implementation site visit on 30 April 2013, to determine whether the EEDSM project had been
implemented as originally intended. The M&V team performed a walkthrough of the various stores
under the guidance of the PD. The team was able to see the newly installed light fixtures and was
therefore satisfied with the implementation of the project. The team thereafter produced a post
implementation report which contained the original system description, the proposed EEDSM
measure, information on the actual installation on site and any deviations from the intended plan.
The post implementation report was signed by the team on 06 May 2013. Thereafter the team
started with the post measure acceptance period, which covered the period from 01 May to 31 May
2013 in accordance with SA National Standards (SANS) 50010:2011.
11.1 Key observations
Figure 5-3 compares the measured baseline to the actual weekday performance recorded during the
MAP. Based on the actual savings, it is clear that the project is reducing electrical load as intended.

133
Figure 5-3: Actual project performance in comparison to the baseline
11.2 Critical controls for activity O
The PM had to check for variables that could affect the verified savings negatively; often due to
seasonality and Customer production patterns during the year, the project performance could vary.
Projects might underperform during the verification of savings in the first month of performance, but
will then catch up during the course of the year to ensure the yearly average performance is
achieved. In this project, the savings remained constant despite seasonal changes; hence the
performance assessment report was signed off by the M&V team on the 01 June 2013 followed by
the performance assessment certificate, which was signed on the 04 June 2013.
11.3 Comparing ESCO process to SO for activity O
No comparison was made between the processes as the M&V team used the same guidelines for
both processes.
Step 12 PD submits first invoice for payment (activity flow P)
Based on the successful implementation of the project and good energy savings achieved during the
MAP the PM instructed the PD to submit the first invoice to IDM for payment based on the
independent PA report. As per the rules of the SO programme, the PD submitted an invoice for 70%
of the contract value on the 12 June 2013. The PM processed the invoice and thereafter submitted
the invoice to the finance department for payment to be made to the PD.

134
12.1 Key observation on activity P
Unfortunately the invoice was not paid within 30 days as per the SOP rules. This was due to Eskom
having adopted a new financial system; hence the project administrators needed training and access
to operate the new system prior to processing invoices.
12.2 Comparison with the ESCO process
No comparison was made between the processes as the financial administrator at Eskom use the
same system to process invoices irrespective of the funding type.
12.3 Critical controls
The PM had to ensure that the invoice submitted was based on the performance assessment report
and was within the contract condition.
Step 13: Annual M&V assessment over 3 year sustainability period (Activity Q)
Over the next three years during the sustainability period, annual invoices together with the M&V
performance acceptance reports will be submitted to IDM. In the sustainability period, the first
performance payment (10%) will be made 12 months from the Measure Acceptance Date (MAD). The
MAD is the date when all parties sign and accept the project performance. The second performance
payment (10%) will be made 24 months from MAD. The third performance payment (10%) will be
made 36 months from MAD.
13.1 Key observation
The project is currently in its first year of the sustainability period; hence no key findings can be
reported at present.
5.2. DISCUSSION
The new SO process was applied to a large commercial facility in SA to validate the:
• Approval turnaround time lines from submission to execution of the project.
• Process effectiveness in comparison to the ESCO process.
• Critical controls of each activity.

135
For purposes of the discussion the focus will be on the approval turnaround time from the point
where the PD marketed the SOP to obtain a LOI from the Customer (activity F1) through to project
execution and completion (activity P). Table 5-18 summarises and compares the activities of the
suggested SO process timelines against the actual case study timelines.
Although IDM does not have full control over Phase 1 (DSM investigation), these activities were
completed well within the suggested SO turnaround time of 7 weeks. Similar activities in the ESCO
process could take between 3 to 6 months to complete. In discussions with the PD, the reason for the
improved turnaround time was attributed to:
• The SO process being an easy sell to the Customer, therefore obtaining a LOI was not difficult.
• The SO process is transparent and was well understood by both the PD and the Customer.
• The Customer contributed significantly by appointing a dedicated energy manager at head
office to assist the PD to gather project information from the stores.
• The Customer implemented an energy management policy for the group, which called for a
reduction in operating expenditure and greenhouse gas emissions.
Phase 2 entails the evaluation of the project by IDM. In this phase the suggested time to evaluate the
project using the SO process is 7.5 weeks. The PD submitted the project to IDM on the 17 August
2012. The actual time spent on phase 2 (IDM evaluation) was 6 weeks. This is a large improvement
when compared to the ESCO process, which could take between 6 to 12 months to complete. The
remarkable turnaround time as indicated by IDM staff was attributed to:
• The project registration template being clear, transparent and easy to understand.
• The new SO templates developed for TEC evaluation prompted and guided the PM to look for
key information in the project proposal; thereby reducing the administrative burden on the
PM.
• A quality submission from the PD.
• The PM complying with the templates, checklist and requirements of TEC.
• The new SO project checklist (Annexure A), was shared with the PD upfront. By following the
checklist the PD and the PM knew exactly what was required by TEC.
• The PEC chairman holding PEC meetings at least once a week.

136
Table 5-18: Comparison of the suggested timeline with the case study
Phases Activities New SO process Case study
Phase 1
Activity
Suggested time to
complete activity F1 and
F2
Actual time spent
on activity F1 and
F2
DSM
investigation
F1 - PD markets SO to obtain Letter of
Intent (LOI) from customer
F2 – PD formulates project submission
to IDM
7 weeks
5 weeks
Phase 2
Activity
Suggested time to
complete activity G to K1
Actual time spent
on activity G to K1
Evaluation by
IDM
G- PD registers as a vendor with Eskom
H- Project screening and registration
by PM
I – Assessment and approval of project
by TEC
J – PEC approval of project
K 1- PM request M&V to develop
project baseline
7.5 weeks
6 weeks
Phase 3 Activity Suggested time to
complete activity K2
Actual time spent
on activity K2
Develop project
baseline
K2 -M&V to develop project baseline
to determine “as is” operation of the
facility
6 weeks
4 weeks
Phase 4
Activity
Suggested time to
complete activity L
Actual time spent
on activity L
Contracting
L - PD signs SO contract with IDM
1 weeks
1 week
Phase 5
Activity
Suggested time to
complete activity M and
N
Actual time spent
on activity M&N
Implementation
M – PD implements project as per the
terms of the SO contract
N – PD disposes of old technology
Up to 6 months
4 months
Phase 6 Activity Suggested time to
complete activity O and P
Actual time spent
on activity O and P
Performance
assessment &
maintenance
O – Post measure acceptance period
performed by M&V
P – Project sign off and first invoice
submitted for payment by the PD
6 weeks
6 weeks

137
Phase 3 entails the development of the project baseline. This phase is performed by M&V. The
request to the M&V team was submitted on the 5th October 2012. According to the team, the
estimated time to set a baseline is 6 weeks; however the actual time spent on setting the baseline
was 4 weeks. The baseline was completed and signed on the 5th
November 2012. This was a
remarkable achievement by the M&V entity. The quick turnaround time was due to credible data
being made available to the M&V team upfront. The PD and the Customer also played a key part in
the M&V process by ensuring information was readily available with easy access to site stores.
Phase 4 entails the signing of the SO contract between IDM and the PD. The suggested time to
complete this phase is 1 week as the contract terms and conditions are standard. The signing of the
contract by the PD was done 2 days after the baseline was signed off and thereafter couriered to
Eskom head office for signature. Overall the contract was signed between the PD and Eskom within a
week. This is a large improvement when compared to the ESCO process, which could take between 6
to 12 months to sign a contract.
Phase 5 entails the actual implementation of the project. The suggested time to complete this phase
using the SO process is 6 months due to the urgent need for energy savings. The PD completed the
implementation and disposed of the old light fittings within four months. Disposal of the old fittings
was done in parallel to implementation. The project completion certificate was signed off on the 16
April 2012.
Phase 6 entails the post measure acceptance period. Following on project completion on the 16 April
2013, the M&V team conducted a post implementation site visit on 30 April 2013 to determine
whether the EEDSM project had been implemented as originally intended; thereafter the team
started with the post measurements, which covered the period from 01 May to 31 May 2013. Based
on the actual savings achieved it is clear the project was reducing load as intended, proving the
project is a huge success. The performance assessment report was signed off by the M&V team on 01
June 2013 followed by the performance assessment certificate, which was signed on the 04 June
2013. As per the rules of the SO programme, the PD submitted an invoice for 70% of the contract
value on the 12 June 2013.

138
5.3. CONCLUSION
The case study demonstrates the new SO process significantly reduces the overall time from project
submission to execution when compared to the ESCO process. The timelines suggested for IDM to
evaluate projects (phase 2) and conclude the SO contract with the PD (phase 4) was predetermined to
take 8.5 weeks. The similar phases in the ESCO process could take up 15 months to evaluate. From
the case study the evaluation of phase 2 and 4 by IDM has taken 6.5 weeks, hence the predetermined
evaluation time is considered to be reasonable. Although IDM does not have direct control over
phase 1, 3, 5 and 6 the case study has shown positive time improvements being made in these
phases.

139
Chapter 6
6. CONCLUSION
6.1. OVERVIEW
The South African electrical power system is currently constraint. This is due to Eskom’s aging power
stations requiring increased maintenance in the summer and winter months. Also, levels of
unplanned maintenance at various power stations are increasing sharply. And the delays in
construction of new power stations could lead to negative economic growth and added pressure on
the existing power system.
Although the DSM programme has significantly contributed to lowering the demand in SA by 3076
MW from 2004 to the end of financial year 2012 (10), more energy efficiency interventions are
urgently needed between the power supply constraint periods of 6.00 am to 10.00 pm, Monday to
Friday. These interventions will contribute towards keeping the lights on in South Africa and will
create much needed space for power station maintenance.
The literature survey in Chapter 2 has shown there is still an opportunity for EEDSM in SA and the rest
of the world, especially in the commercial and industrial sectors. The potential for EEDSM in SA,
ranges from 2000 MW up to 4000 MW (12). The market penetration will be dependent on
overcoming barriers to EEDSM and simplifying the current ESCO funding process, which takes up to
15 months for approval of a good EE project.
To overcome these challenges and to unlock the market potential, an international scan was
performed in Chapter 3 to investigate possible solutions to approving EEDSM projects in SA. One of
the solutions to reduce the overall time from application to execution was the introduction of the
Standard Offer (SO) process. Global research shows other countries have implemented SO
successfully; however, in the case of SA the SO process as adopted internationally could not be used

140
in its current form; hence a new SO process was developed based on a hybrid of the ESCO funding
process and international best practise.
Chapter 4 entails the development of the new SO process in line with the Systems Thinking Approach
(STA), to solve complex situations and Eskom’s Project Life Cycle Model (PLCM). The new SO process
that will form part of IDM’s processes for evaluating EEDSM projects was developed to increase
market uptake for EEDSM, reduce the burden on IDM staff, improve the time taken to evaluate
EEDSM projects and reduce Eskom’s risk by making performance based payments to the PD.
Once the SOP was developed it was then tested on a large commercial retail facility in SA, to
determine the effectiveness of the new process in relation to the time taken to evaluate and approve
EEDSM projects as compared to the ESCO process. The effectiveness of the critical controls was also
tested.
6.2. MARKET RESPONSE TO SO IN SA
The launch of SOP was well received by stakeholders involved in the programme. The SO concept
spread fast to both commercial and industrial sectors. The programme attracted large commercial,
‘blue chip’ property groups that were keen on becoming EE and reducing their carbon footprint and
operational costs. Better working relationships began to evolve between customers, PDs and Eskom
as the new SO process was transparent and well understood. Many customers congratulated IDM for
initiating the programme and creating much needed jobs for SA by the use of PD.
Although IDM funding does not cover the full project cost of the SO initiative, customers are keen to
participate on the programme due to short approval turn-around times, which lead to quicker energy
savings resulting in quicker operational cost savings. These cost savings generated will be used to off-
set the shortfall in IDM funding, thereby reducing pay back periods significantly. In other instances,
many PDs offer a no cost energy saving solution to the customer in return for a signed LOI and a
percentage of the profits as a result of the energy saving project.
Many PDs sell the SO concept in phases to customers; they first start with the lighting projects and
then move on to other technologies such as HVAC, compressed air and renewable energy systems.

141
The main reason for this is to limit the upfront marketing and audit costs. On successful completion of
the first project, many Customers use the same PD to investigate other opportunities.
The SOP has succeeded in increasing the market uptake for EEDSM projects. Many service providers,
ranging from lighting suppliers to heavy mining engineering companies, have participated in the
programme to the extent the initial SOP pilot programme budget of R30 million had to be increased
to R500 million to cater for the influx of projects received by IDM.
As per Figure 6-1, 349 projects were submitted to IDM from 01 April 2012 to 25 October 2013 (39).
The proposed demand and energy savings of these projects are equivalent to 141 MW and 590 GWh
respectively. April, May and June 2013 saw a slow start to the SOP, which can be attributed to the
initial marketing of the programme by both IDM and the PD in the first 3 months; thereafter project
submissions started to steadily increase.
The total costs of the projects submitted to IDM amount to R 740 million against a SOP budget of R
500 million. This is indicative of a strong market uptake for SOP. Fortunately for IDM, project
acceptance is only done after approval by PEC, therefore PEC must commit funds up to R 500 million
and thereafter request further funds to accommodate the balance of the projects and future projects.
Figure 6-1: Market response to the SO programme (39)

142
The status of the projects submitted to IDM under SOP can be seen in Table 6-1. The table shows 349
projects were received by IDM from 01 April 2012 to 25 October 2013 of which:
• 72 Projects have been verified, resulting in a demand saving of 22 MW and EE savings of 137
GWh.
• 10 projects are currently in the verification phase, (measure acceptance period) of the process,
which will contribute 6 MW of demand savings and 24 GWh of energy savings.
• 60 projects are in the implementation phase, which will result in a demand saving of 47 MW and
energy savings of 166 GWh on completion and verification.
• 51 projects are in the contracting phase, which will contribute to a savings of 21 MW and 77 GWh
respectively on completion and verification.
• 1 project at PEC for evaluation with a proposed demand savings of 0.5 MW and energy savings of
1.8 GWh.
• 155 Projects have recently been submitted to IDM with a proposed demand and energy savings
of 44 MW and 184 GWh respectively. These projects are currently undergoing project screening,
registration and technical evaluations.
Table 6-1: SO project pipeline
Project Pipeline
phases (Status)
Number of
projects
Demand savings
(MW)
Energy Savings
(GWh)
Sector
Verified 72 22 137 I&C
Verification 10 6 24 I&C
Implementation 60 47 166 I&C
Contracting 51 21 77 I&C
PEC 1 0.5 1.8 I&C
Recently
submitted
proposals
155 44 184 I&C
Total 349 141 590

143
Thus far from a technology perspective, lighting and HVAC technologies make up the bulk of the
projects submitted, followed by renewable energy technologies. PD have indicated that SO works
best in situations where customers are planning to replace or retrofit old technologies as part of their
maintenance cycle.
6.3. RECOMMENDATION FOR FUTURE WORK
Due to the overshoot in the SOP budget, a better tracking mechanism needs to be developed to
capture project submissions from PD that are submitted via head office and regional IDM offices. A
web based portal is needed to create a single point of entry for all projects submitted to IDM. In
addition GPS co-ordinates of the project sites that participate in the SOP need to be captured, this will
avoid duplication of project submissions by the PD. Sharing of information via the internet must be
set up to inform the PD which sites have participated in the SO programme already. This will avoid
unnecessary phone calls and travel to potential customers by the PD in the marketing phase of the
SOP.
Other sources of funding, such as government tax incentives, low interest bank loans, carbon offset
funding need to be explored to complement the current SOP funding for even greater uptake on the
programme.
The current SOP caters mainly for the retrofitting of existing facilities with limited focus on new
facilities; this is due to existing facilities having a credible baseline that can be used to determine
current energy consumption. Future work needs to focus on a methodology to determine an
acceptable mechanism for what a new facility baseline would be without any EE intervention in order
to qualify for SO funding.
Work is also needed in improving Supplier Development and Localisation (SD&L) in SA. The majority
of EE technologies are imported into SA, hence financial incentives need to be set aside for Suppliers
and Developers that manufacture EE technologies in SA.

144
6.4. FINAL CONCLUDING REMARKS
It was proven through implementation that the new SO process is successful in:
• Increasing the market uptake for EE projects in the I&C sector.
• Streamlining the funding approval process by IDM.
• Reducing the burden on Eskom staff.
• Reducing Eskom’s risk by making the payments to PD based on performance only.
Both Customers and PDs have expressed appreciation to IDM for providing the Industry with an
alternative funding model that is transparent and simple to understand.

145
7. REFERENCES
1. Eskom. Integrated Demand Management. Eskom PO BOX 1091, Johannesburg, 2000, SA : Eskom,
2009.
2. Mansueti, Larry. National Action Plan for Energy Efficiency Vision for 2025: a framework for
change: a resource of the National Action Plan for Energy Efficiency. [Washington, DC] : US
Department of Energy, 2008.
3. Hoevens, Maria van der. Energy Efficiency Market Report. s.l. : International Energy Agency, 2013.
ISBN 978-92-64-19122-8.
4. A.T, Mattoon. Bogging Down in the Sinks. US : World Watch, 1998.
5. Teske, Sven. Energy Revolution. Stuttgart, Germany : Green Peace International, 2007.
6. Eskom. Eskom Integrated Report. Johannesburg : Eskom, 2012.
7. Medium Term Risk Mitigation Plan. Johannesburg : Eskom, 2009.
8. Lakmeeharan, Kannan. State of the power system update. Johannesburg : Eskom, 2012.
9. Team, IDM. IDM hanbook. Johannesburg : Eskom, 2011. v1.0.
10. Eskom. Measurement and verification performance report. Johannesburg : Assurance and
Forensic, 2012/13.
11. IDM. IDM Annual report to NERSA . Johannesburg : Eskom, 2012. v01.
12. Laing, DR. Henry. Assessment of DSM potential in SA. Johannesburg : Ozone Consulting, 2009. v1.
13. Energy demand-side management: New perspective for a new era. Sanya, Carley. 1, s.l. :
Association for Public Policy Analysis and Management, 2012, Vol. 31. 6-32.
14. River, C. Primer on demand-side management with an emphasis on price responsive programs.
Oakland California : Charles River Association (prepared for the World Bank), 2005.
15. Demand side management: "Deand response, intelligent energy systems, and smart loads".
Palensky Peter and Dietmar Dietrich. 3, s.l. : IEEE, 2011, Vol. 7. 381-388.
16. SADC Industrial Energy Management Project. Seven Steps to Energy Management Awareness.
Pretoria : Energy Training Foundation of SA in collaboration with the University of Pretoria, 1998.

146
17. Finamore, Barbara. Demand Side Management in China. New York : National Resource Defense
Council, 2003.
18. Gellings, Clark W. Need for smart grids. Minnesota : EPRI, 2011.
19. Singh, Ashok Sarkar and Jas. Financing Energy Efficiency. Washington DC : World Bank, 2009.
20. H, Nadel S and Geller. Smart Energy Policies . Washington DC : Tellus Institute, 2001. E012.
21. NERSA. Regulatory policy on EEDSM for SA. Regulatory policy on EEDSM for SA. Pretoria : NERSA,
2004. Rev 0.
22. Eskom. Electricity pricing definition. Johannesburg : Eskom, 2007.
23. Limaye, Dilip. Implementing Energy Efficiency and Demand Side Management - SA Standard offer
model. Washington DC : The World Bank Group_ESMAP, 2010. 007/10.
24. White Paper on the Energy Policy of the Republic of South Africa. Department of Minerals and
Energy. Pretoria : Department of Minerals and Energy, 1998. ISBN-0-9584235-8-X.
25. Department of Minerals and Energy. National Energy Efficiency Strategy of SA. Johannesburg :
Department of Minerals and Energy, 2008. 32342.
26. IDM. The need for Integrated Demand Management. Johannesburg : Eskom, 2009.
27. Practical problems experienced with Industrial DSM projects. Kleingeld, Prof M. Pretoria : CRCED,
2009. 1.
28. EH, Mathews. An alternative funding model for EEDSM. Pretoria : HVAC international, 2005.
29. Steven, Nadel. Energy efficiency resource standards: Experience and recommendations. US :
American Council for an Energy Efficient Economy, 2006.
30. Renewable energy policy and electricity restructuring: a california case study. Ryan Wiser, Steven
Pickle, Charles Goldman . 6, USA : Elsevier, 1998, Vol. 26. ISSN 0301 - 4215.
31. Israel, PB. Standard offer strategy v1.0. Johannesburg : Eskom, 2008. 1.
32. Government of SA. Act, Broad Based Black Economic Empowerment "No. 53. (2003).". Pretoria :
Goverment Gazette, 2004. 463, 25899.
33. Day, DR. Julian. Systems Thinking. Johannesburg : Eskom, 2013.
34. PMO Centre of excellence. Eskom standard project life cycle model policy. Johannesburg : Eskom,
2013. EP 32-115.
35. Engelbrecht, J. Process Control Manual for Integrated Demand Management. Johannesburg :
Eskom, 2013. 240-68428469.

147
36. Measurement and Verification of Energy Savings. s.l. : SABS Standards Division, 2011. ISBN 978-0-
626-26352-2.
37. The Measurement and Verification Guideline for EEDSM Management Projects and Programmes.
Johannesburg : Eskom, 2010.
38. M&V Entity. M&V Scoping report and M&V plan. Johannesburg : Eskom, 2012.
39. IDM. SOP status report. Johannesburg : IDM PMO, 2013. 1.

148
8. APPENDIX
8.1. ANNEXURE A: SO CHECKLIST DEVELOPED FOR TEC EVALUATION
Part DETAILS/DESCRIPTION
A [PART A: GENERAL PROJECT INFORMATION]
1. Name of the project manager
2. IDM Sector
3. Name of the project
4. DSM Database Number
5. What is the proposed demand savings (kW)
6. What is the proposed energy savings (kWh)
7. What is the Project Load factor?
8. Are the before and after load profiles included in
the proposal and excel spread sheet provided
9. Project type EE LM RLM
10. Funding model
11. Rm/MW or c/kWh (benchmark)
12. Rm/MW or c/kWh (project)
13. Total project cost (R)
14. Technology to be installed
15. Project implementation period
16.
Short summary of project – How are savings
achieved?
17. Are the PDs name, contact details, and physical
address in the proposal?
Yes No
18. Has the PD been registered i.e. do they have a
vendor no?
Yes No
19. Is the PDs background included in the proposal? Yes No
20. Are the Customer name, contact details, and
physical address in the proposal?
Yes No
21. Is the Customer’s background included in the Yes No

149
proposal?
22. Has the client/customer signed off on the
proposal?
Yes No
23. Is the Letter of Intent (LOI) submitted and signed
by the client/customer?
Yes No
24. Has the customer agreed to pay the top-up (the
excess amount not paid by Eskom – if any)?
Yes No
25. Are all parties involved (PDs, Customer, sub-
contractors, etc.) aware of :
• Agreement provisions
• M&V guidelines
• Need to have M&V plan and baseline buy-in
before implementation
M&V’s need to access the site and stakeholders
directly?
Yes No
26. Is the scope of work clearly described (this must
include a schematic diagram if applicable)?
Yes No
27. Has the PD been informed that a Project Quality
Plan (PQP) must be submitted before
contracting?
Yes No
28. Has the PD submitted a SHE/SHEQ Plan? Yes No
29. Are there any current existing DSM project/s on
the site?
Yes No
30. What is the performance of the old project (as
per M&V)?
[PART B: TECHNICAL INFORMATION]
TECHNICAL INFORMATION YES NO N/A DETALS/COMMENTS
31. Is the current existing technology well
described?
32. Is the description of the proposed technology
clearly described (including supplier
specifications)?
33. Are the proposed technologies correctly split
(e.g. lighting and sensors, plant upgrades etc.)?
Proposed technologies should not be presented
in a consolidated manner.
34. Does the proposed solution increase production
(i.e. give the client a competitive edge)?
35. Is the proposed profile based on actual
measured or manufacturer specifications?
36. Are the before and after load profiles included in

150
the proposal and presentation (The plots must
be MW/kWh vs. half hourly/hourly for weekday,
Saturday, Sunday)?
37. Is the methodology for the establishment of the
savings (Energy and Demand) included in the
proposal (required later by M&V)?
38. Are the variables that could affect the savings
included (e.g. production increase, seasonal
variations, time of usage etc.)?
39. If a demand shift is being proposed, is it energy
neutral? Give the reason for the shift during the
specific period of day, use of shifting etc.
40. If the project type is LM, what other DSM
options have been considered, (can the
equipment/ process be used for energy
efficiency. (e.g. compressor to run continuously
with a higher efficiency as opposed to only being
switched off during peak periods)?
[PART C: REQUIREMENTS FOR SPECIFIC TECHNOLOGIES]
Lighting Technology
41 What type of ballast/lamp will be used and is it suitable
for the environment in which it will be used? (e.g. Down
lighters used in University halls)
Provide details such as manufacturer, product code,
photometrics and LOA
42 What are the existing and proposed lamp lumens (lm)? Existing
Proposed:
43 What are the existing and proposed lux levels (lx)? Existing:
Proposed:
44 What is the existing and proposed lamp power
(Wattage)?
Existing:
Proposed:
45 What is the existing and proposed lamp lumen
depreciation?
Existing:
Proposed:
46 What is the colour rendering index (CRI)?
47 What is the mercury content of the proposed lights?
48 What is the existing and proposed lamp Efficacy (l/m)? Existing:
Proposed:
49 What is the proposed lamp economical life? Proposed:

151
Yes No N/A DETAILS/ COMMENTS
50 Are all the standards upheld and not compromised in
terms of the lighting fixtures?
(i.e. Mining Act Regulations, OHS Act etc.)?
51 Are the installers licenced with CIDB?
52 Are there disposal costs involved? If so how will the
disposal of the old technology be done.
53 Is the PD aware that an independent party will be
required for disposals and that disposal certificates are
required to be sent/ copied to M&V teams?
54 What are the factors that could negatively impact the
lamp life (e.g. sensors)?
55 If there are sensors, are separate profiles included in the
proposal?
[PART D: INFORMATION REQUIRED FOR PEC]
D INFORMATION REQUIRED FOR PEC YES NO N/A DETAILS/COMMENTS
56 Decision Required
57 ESCO/Project developer’s background
58 Customer’s background
59 Letter of Intent
60 Scope of work (also to include all the relevant
information stated in Table 3 and)
61 Technology overview
62 Schematic diagram
63 Load profiles
64 Load reduction calculation
65 Capped value calculation
66 Finance
67 Environmental issues
68 Risks and mitigation
69 Employment/job opportunities
70 Decision Required
E [PART E: MEASUREMENT & VERIFICATION (M&V)]
71 Is the M&V request for this project ready for
submission?
Yes No

152