Developing an Input Output based method to estimate a ...
34
Developing an Input–Output based method to estimate a national-level EROI (energy return on investment) Lina Brand-Correa, Paul Brockway, Claire Carter, Tim Foxon, Anne Owen and Peter Taylor January 2017 Centre for Climate Change Economics and Policy Working Paper No. 237 Sustainability Research Institute Paper No. 103
Transcript of Developing an Input Output based method to estimate a ...

Developing an Input–Output based method to
estimate a national-level EROI
(energy return on investment)
Lina Brand-Correa, Paul Brockway, Claire Carter,
Tim Foxon, Anne Owen and Peter Taylor
January 2017
Centre for Climate Change Economics and Policy
Working Paper No. 237
Sustainability Research Institute
Paper No. 103

The Centre for Climate Change Economics and Policy (CCCEP) was established by the University of Leeds and the London School of Economics and Political Science in 2008 to advance public and private action on climate change through innovative, rigorous research. The Centre is funded by the UK Economic and Social Research Council. Its second phase started in 2013 and there are five integrated research themes:
1. Understanding green growth and climate-compatible development 2. Advancing climate finance and investment 3. Evaluating the performance of climate policies 4. Managing climate risks and uncertainties and strengthening climate services 5. Enabling rapid transitions in mitigation and adaptation
More information about the Centre for Climate Change Economics and Policy can be found at: http://www.cccep.ac.uk.
The Sustainability Research Institute (SRI) is a dedicated team of over 20 researchers working on different aspects of sustainability at the University of Leeds. Adapting to environmental change and governance for sustainability are the Institute’s overarching themes. SRI research explores these in interdisciplinary ways, drawing on geography, ecology, sociology, politics, planning, economics and management. Our specialist areas are: sustainable development and environmental change; environmental policy, planning and governance; ecological and environmental economics; business, environment and corporate responsibility; sustainable production and consumption. More information about the Sustainability Research Institute can be found at:
http://www.see.leeds.ac.uk/sri. This working paper is intended to stimulate discussion within the research community and among users of research, and its content may have been submitted for publication in academic journals. It has been reviewed by at least one internal referee before publication. The views expressed in this paper represent those of the author(s) and do not necessarily represent those of the host institutions or funders.

1
TABLE OF CONTENTS
Abstract 4
About the Authors 5
1. Introduction 6
2. A national-level EROI: the concept 7
2.1. Background 7
2.2. The benefits of a national-level EROI 9
2.3. Conceptual issues and choices 10
2.3.1. Boundary of analysis 10
2.3.2. Accounting for embodied energy inputs 13
2.3.3. Temporality 13
2.3.4. Accounting for energy quality 14
3. A national-level EROI: the data and the methodology 16
3.1. Input-Output and Energy 16
3.2. EROInat(UK): Data 16
3.3. EROInat(UK): Methodology 17
4. Results and Discussion 19
5. Conclusions and Policy Implications 21
Appendix A 22
References 29

2
ABSTRACT
Concerns have been raised that declining energy return on energy investment (EROI) from
fossil fuels and low levels of EROI for alternative energy sources could constrain the ability of
national economies to continue to deliver economic growth and improvements in social
wellbeing. However, in order to test these concerns on a national scale, there is a conceptual
and methodological gap in relation to calculating a national-level EROI and analysing its policy
implications. We address this by developing a novel application of an Input-Output
methodology to calculate a national-level indirect energy investment, one of the components
needed for calculating a national-level EROI. This is a mixed physical and monetary approach
using Multi-Regional Input-Output data and an energy extension. We discuss some
conceptual and methodological issues relating to defining EROI for a national economy, and
describe in detail the methodology and data requirements for the approach. We obtain initial
results for the UK for the period 1997-2012, which show that the country’s EROI has been
declining since the beginning of the 21st Century. We discuss the policy relevance of
measuring national-level EROI, and propose avenues for future research.
KEYWORDS
EROI, Multi-Regional Input-Output, net energy analysis, resource depletion, biophysical economics, energy transition.
ACKNOWLEDGEMENTS
We would like to thank Michael Carbajales-Dale for very useful comments on a previous
version of this paper. Additionally, we would like to thank Charles Hall and Jessica Lambert
for their contributions to the original abstract for this paper. We gratefully acknowledge the
support of the Engineering and Physical Sciences Research Council (EPSRC) and Arup for
contributing to the PhD CASE (Collaborative Award in Science and Engineering) scholarship
under grant reference EP/K504440/1 of Paul Brockway. Anne Owen’s time (and Paul
Brockway’s time in the latter stages of this paper) was funded as part of the research
programme of the UK Energy Research Centre (UKERC), supported by the UK Research
Councils under EPSRC award EP/L024756/1. The support of the Economic and Social
Research Council (ESRC) is also gratefully acknowledged in contributing to the PhD of Claire
Carter. The work contributes to the research programme of the ESRC Centre for Climate
Change Economics and Policy. Finally, we acknowledge the support of Colciencias for
contributing to the PhD of Lina Brand Correa.
Submission date 20-12-2016 Publication date 30-12-2017

About the Authors
Lina Brand-Correa is a Postgraduate Researcher at the University of Leeds. She focuses on the general topics of energy, society, and economic systems. She is particularly interested in understanding how energy provisioning systems are related to society and the economy, with a special focus on human well-being. For this purpose, she uses concepts such as exergy, useful work, Energy Return on Energy Invested (EROI), energy services on one hand, and economic growth, development, human wellbeing, human needs on the other. Paul Brockway is a Research Fellow in Phase 3 (2014-2019) of the UK Energy Research Council (UKERC) Theme 4: Energy, Economy and Societal Preferences. His research is focussed on studying macroeconomic energy-economy interactions, through primarily the lens of exergy analysis. Exergy is considered as 'available energy', and enables the study of the energy conversion chain from primary to final to useful stages - where it is lost in exchange for energy services. Claire Carter is currently undertaking a doctoral research degree at the Science & Policy Research Unit (SPRU), University of Sussex. She is researching global energy return on energy invested (EROI or EROEI) over time from the range of energy supply technologies using a system dynamics modelling approach. Tim Foxon is Professor of Sustainability Transitions at SPRU, University of Sussex. His research explores the technological and social factors relating to the innovation of new energy technologies, the co-evolution of technologies and institutions for a transition to a sustainable low-carbon economy, and relations and interdependencies between energy use and economic growth. He is co-leader of the CCCEP project on systemic approaches to low-carbon transitions. Anne Owen is a Research Fellow in Material Flow Accounting and Input-output Analysis at the University of Leeds. She is currently working on developing an input-output database for the UK capable of tracing all the flows of goods and services that result on the UK’s final demand for products. When data on the raw materials extracted by sector and the energy used by sector is added to this database, she will be able to calculate the full supply chain impacts of the products we consume. These impacts take into account materials and energy used both in the UK and in the countries we trade with. Peter Taylor has over twenty years of experience working on a wide range of energy and climate change issues. He is currently Professor of Sustainable Energy Systems in the Centre for Integrated Energy Research, a joint venture between the faculties of Engineering and Environment. He is also a member of the UK Energy Research Centre and the Centre for Climate Change Economics and Policy. Peter’s work focuses on interdisciplinary research combining science, technology, economics and policy to enhance the understanding of, and policy responses to, the challenges of accelerating the transition to sustainable low-carbon energy systems.

4
1. Introduction
The concept of energy return on energy investment (EROI) is part of the field of study
of net energy analysis (NEA), and is one way of measuring and comparing the net
energy availability to the economy from different energy sources and processes. In
broad terms, it can be understood as “the ratio of energy returned from an energy-
gathering activity compared to the energy invested in that process” (Hall & Kiltgaard
2012, p.310). Building on a long history of ideas in biophysical economics (see, for
example, Cleveland, 1987), this concept has been used by e.g. Hall and Kiltgaard
(2012) as a basis for further developing an energy-focused approach to the economy.
This approach is driven by concerns around a decline in the EROI of fossil fuels and
low levels of EROI for alternative energy sources. In the case of fossil fuels, it is argued
that the depletion of easily recoverable fossil fuel reserves is outpacing technological
advancements for the improvement of fossil fuel extraction, leading to decreasing
values of EROI for these fossil energy sources (see e.g. Dale et al. 2011; Gagnon et
al. 2009; Lambert et al. 2013). Moreover, some authors (Hall et al. 2014; e.g. Dale &
Benson 2013) have argued that the EROIs of many renewable energy technologies
necessary to decarbonise global energy supply are currently lower than the fossil fuels
that they need to replace. However, it should be recognized that the EROI of renewable
energy sources varies hugely depending on the technology and location. For instance,
Raugei et al. (2012) and Kubiszewski et al. (2010) calculate that, for electricity
generation, the latest solar and wind technologies respectively have EROI values
comparable to gas -or coal- fired power plants. The future trends in the EROI of
renewable energy systems are also very uncertain – being dependant both on the pace
of technological innovation (which may increase EROI) and the need for increased
back-up generation and storage (which may decrease EROI from a full energy system
perspective).
The higher the EROI of an energy supply technology, the more “valuable” it is in terms
of producing (economically) useful energy output. In other words, a higher EROI allows
for more net energy to be available to the economy, which is valuable in the sense that
all economic activity relies on energy use to a greater or lesser extent. Analyses of the
EROI of different energy sources and extraction/capture processes using particular
technologies are relatively common, e.g. see Cleveland (2005), Brandt (2011), and
Hall, Lambert, & Balogh (2014). These are important in terms of presenting a picture
of the potential contribution of individual energy sources to the energetic needs of the
economy. However, less attention has so far been paid to determining EROI values
for national economies, which requires a different methodological approach to
traditional EROI analyses due to the mix of particular resource locations, exploitation
times and technologies applied to “produce” energy, i.e. to extract fossil fuels and
capture flows of renewable energy in a given national territory.
This paper aims to help with the need to develop a method for measuring EROI for
national economies, in particular for calculating indirect energy investment, and thus
contribute to the growing field or NEA. It does so by proposing a novel application of
an Input-Output methodology using Multi-Regional Input-Output data for the UK for the

5
period 1997-2012. This approach is described in detail in section 3, followed by the
presentation and discussion of results in section 4, and some conclusions and policy
recommendations in section 5. But firstly we explain the importance of a national-level
EROI in section 2, describe how it differs from other types of EROI, and discuss some
of the methodological issues associated with EROI calculations in general.
2. A national-level EROI: the concept
Our aim in this paper is to develop an Input-Output based methodology, to calculate a
national-level EROI (𝐸𝑅𝑂𝐼𝑛𝑎𝑡). We start with a succinct background of the EROI
concept and its different types. We then follow by putting forward some arguments on
the conceptual relevance of a 𝐸𝑅𝑂𝐼𝑛𝑎𝑡 as we have defined here. Finally, this section
discusses persistent conceptual issues in the EROI literature and a description of the
conceptual choices we made.
2.1. Background
EROI (or EROEI) is a key metric in NEA. The concept of net energy (i.e. amount of
usable energy after extraction and processing) dates back from the second half of the
20th Century (e.g. Hall, Lavine, & Sloane, 1979; Hall, 1972; Smith, 1960). The term
(EROI) however, was first used by Cleveland et al. (1984). It is a dimensionless
number1 that expresses the result of energy returns over energy invested.
Most EROI studies consider an energy supply technology for a particular resource type
and in a particular location. Such studies typically have the “mine-mouth” (or “well-
head” or “farm-gate”) as the boundary drawn for evaluating the energy return in relation
to the energy required to get it, without further transformation processing (Murphy &
Hall 2010). These EROI calculations are often referred to as “standard” EROI
(𝐸𝑅𝑂𝐼𝑠𝑡𝑛𝑑) (Murphy et al. 2011):
𝐸𝑅𝑂𝐼𝑠𝑡𝑛𝑑 =
𝑒𝑛𝑒𝑟𝑔𝑦 𝑜𝑢𝑡𝑝𝑢𝑡 𝑓𝑟𝑜𝑚 𝑒𝑥𝑡𝑟𝑎𝑐𝑡𝑖𝑜𝑛
𝑑𝑖𝑟𝑒𝑐𝑡 𝑎𝑛𝑑 𝑖𝑛𝑑𝑖𝑟𝑒𝑐𝑡 𝑒𝑛𝑒𝑟𝑔𝑦 𝑖𝑛𝑝𝑢𝑡𝑠
(1)
A simple graphical description can be found in Figure 1, showing how 𝐸𝑅𝑂𝐼𝑠𝑡𝑛𝑑 for a
particular energy resource (oil) compares to other EROI calculations with extended
system boundaries. Other, less common, types of EROI calculations for a single
energy source vary depending on the chosen system boundary (e.g. 𝐸𝑅𝑂𝐼𝑝𝑜𝑢
and 𝐸𝑅𝑂𝐼𝑒𝑥𝑡) and thus including more or fewer stages along the energy transformation
1 It is worth noting that EROI values in general are often expressed as ratios.

6
chain. 𝐸𝑅𝑂𝐼𝑠𝑡𝑛𝑑 is more commonly used to compare different fuels or energy carriers,
or when analysing changes in EROI of a specific fuel over time and the consequences
for the wider economy (see for example Hall et al., 2014; Murphy and Hall, 2011).
Figure 1. Types of EROI
𝐸𝑅𝑂𝐼𝑠𝑡𝑛𝑑: standard EROI.
𝐸𝑅𝑂𝐼𝑝𝑜𝑢: EROI at the point of use.
𝐸𝑅𝑂𝐼𝑒𝑥𝑡: extended EROI.
When a number of energy resources are examined within certain geographical limits,
such as a country, then another type of EROI is needed: a societal or national-level
EROI. As far as we are aware, the only attempt to calculate a societal EROI (𝐸𝑅𝑂𝐼𝑠𝑜𝑐)
was undertaken by Lambert et al. (2013; 2014). They estimate the average EROI for
all energy supply technologies deployed by a nation. 𝐸𝑅𝑂𝐼𝑠𝑜𝑐 is calculated by dividing
the average energy obtained per dollar of spending (summed over different fuel inputs
to the economy) by the primary energy needed to obtain one dollar’s worth of economic
production. Their results suggest that countries with higher societal EROIs have higher
standards of living, as measured by the Human Development Index (HDI). However,
their calculations are based on price and energy intensity information. There is a
danger that using a price-based approach introduces distortions to the calculated
EROI2.
Earlier attempts to calculate the net energy for a country include Leach (1975) and
Peet et al. (1987), but they did not include trade in their calculations, a key element in
2 Prices represent both physical and non-physical factors at play in the economy and hence do not necessarily reflect resource availability or accessibility. Under the assumption of perfectly competitive markets, prices can be assumed to reflect quality, accessibility and scarcity. However, the underlying assumptions for perfectly competitive markets can be contested. Moreover, scarcity in this context represents economic scarcity (supply relative to demand) at a particular moment in time and does not necessarily reflect absolute resource scarcity (availability).

7
a globalised world. More recent studies that attempted national-level net energy
estimations include the studies by King et al. (2015; 2015), King (2015), Fizaine and
Court (2016), and Raugei and Leccisi (2016). However, these studies diverge from our
own in that they have either not used an Input-Output framework to account for trade
in calculating indirect energy, or they have focused on single energy sources rather
than the whole production of energy by a nation. An exception to this is the study
undertaken by Herendeen (2015), where an Input-Output framework is used to
connect net energy with the price of energy and other goods and services. We will
discuss their results in more detail when presenting the results from this first
application.
2.2. The benefits of a national-level EROI
There are three key reasons why a national-level EROI is important. Firstly, traditional
energy analyses do not usually address directly the issue of resource depletion (or
reduced accessibility, i.e. resources that are more difficult to extract/capture)3. Yet,
this is important because if a country is understood to require a given level of net
energy input to support its economic activity, a declining EROI trend would imply that
the total gross energy requirements of the economy could rise, even without economic
growth. In this case, a national-level EROI becomes relevant as a key metric in the
energy-economy analysis toolbox.
Secondly, when measured over time to take account of dynamic effects, EROI can
provide valuable information about the extent of resource depletion and technological
change in resource extraction/capture4. Here the system boundary for EROI is
established at the resource extraction/capture5 level, rather than including
downstream transformation processes. Therefore, a national-level EROI time series
can be analysed together with other national-level energy-economic studies. This
would provide additional information to improve our understanding as to how the
dynamics of resource depletion (or accessibility) and technological change relate to
energy quality and the dynamics of conversion efficiencies.
3 In traditional energy analyses this might be addressed indirectly through prices and price projections, or perhaps through data and projections on reserves. However, we believe that EROI gives a better picture of resource depletion and accessibility, one that is based on energy accounting of extraction/capture processes. 4 A declining EROI over time indicates that resource depletion is outpacing technological change (Murphy et al. 2011), i.e. the quantity of output of a certain energy resource (or its accessibility) (Dale et al. 2012) is declining faster than the advancements in technology to harvest it more efficiently. 5 We use both of these terms in order to include both the extraction of energy resource stocks (e.g. coal, oil and gas) and the capture of energy flows through its conversion to electricity (e.g. wind and solar).

8
Thirdly, EROI has economic relevance since large energy returns in excess of the
corresponding energy investments enable diverse economic activities. This is the case
as the physical energy cost of energy supply is likely to have a larger economic impact
than might be expected from its cost share6. This is because if the physical cost of
energy production rises then this might severely impact the productive resources
available to the rest of the economy (in terms of labour, physical infrastructure and
investment capital, for instance). A national-level EROI can help understand the
potential for growth or change of a national economy in relation to the physical energy
cost of extracting/capturing the energy it requires.
2.3. Conceptual issues and choices
The main persistent7 conceptual issues in the EROI literature are: how to define the
boundary of analysis (as shown in Figure 1), how to account for embodied8 energy
inputs, how to deal with temporality and how to account for energy quality. We will
discuss each of them in turn, providing our own conceptual choices for this specific
definition of 𝐸𝑅𝑂𝐼𝑛𝑎𝑡. Our choices do not necessarily intend, however, to point towards
final solutions to these methodological issues, but rather contribute to the discussion
of defining EROI at a national level.
2.3.1. Boundary of analysis
There is a consensus around the accounting starting point for EROI in general,
regardless of the type. EROI “assumes that the energy in the ground (or coming from
the sun) is not to be counted as an input” (Herendeen 2004, p.284). Therefore, EROI
accounts for energy inputs once they have been either extracted or harnessed for
human purposes, but not the energy content of the resource that is being
extracted/harnessed9.
6 The cost share theorem states that changes in energy costs should not affect the macro-economy, since energy costs are a small fraction of total economic activity. However, an ecological economics analysis argues that the cost share theorem breaks down, as energy is a more significant input for economic activity than applied by its cost share (Kümmel 2013; Ayres et al. 2013). 7 These issues are still being identified in recent EROI publications (Murphy et al. 2011; Brandt & Dale 2011), but are largely the same as those that Leach (1975) identified and were discussed in a NEA workshop held in August 1975 at Stanford, California. 8 By embodied energy we mean all the energy that went into a process. This is different from embedded energy, which relates to the energy content of specific materials or infrastructures. 9 Note that this start point of accounting for energy contrasts with the approach of another assessment tool: Life Cycle Analysis (LCA). In LCA the energy that is present in the environment or the energy source is the start point for accounting in measures of, for instance, cumulative energy demand.

9
However, there are three main considerations when assessing boundaries for EROI.
Firstly, how many energy processing and transformation stages to take into account:
primary energy, final consumption (of energy carriers) or useful energy10? Secondly,
a decision is required as to the inclusion of energy inputs at each of the energy stages
under analysis, i.e. should these inputs include embodied energy in capital equipment,
operation and maintenance energy, energy consumed by the labour force, etc. Thirdly,
a consideration is required as to the range of energy sources that will be analysed,
within what geographical limits and in which time frame.
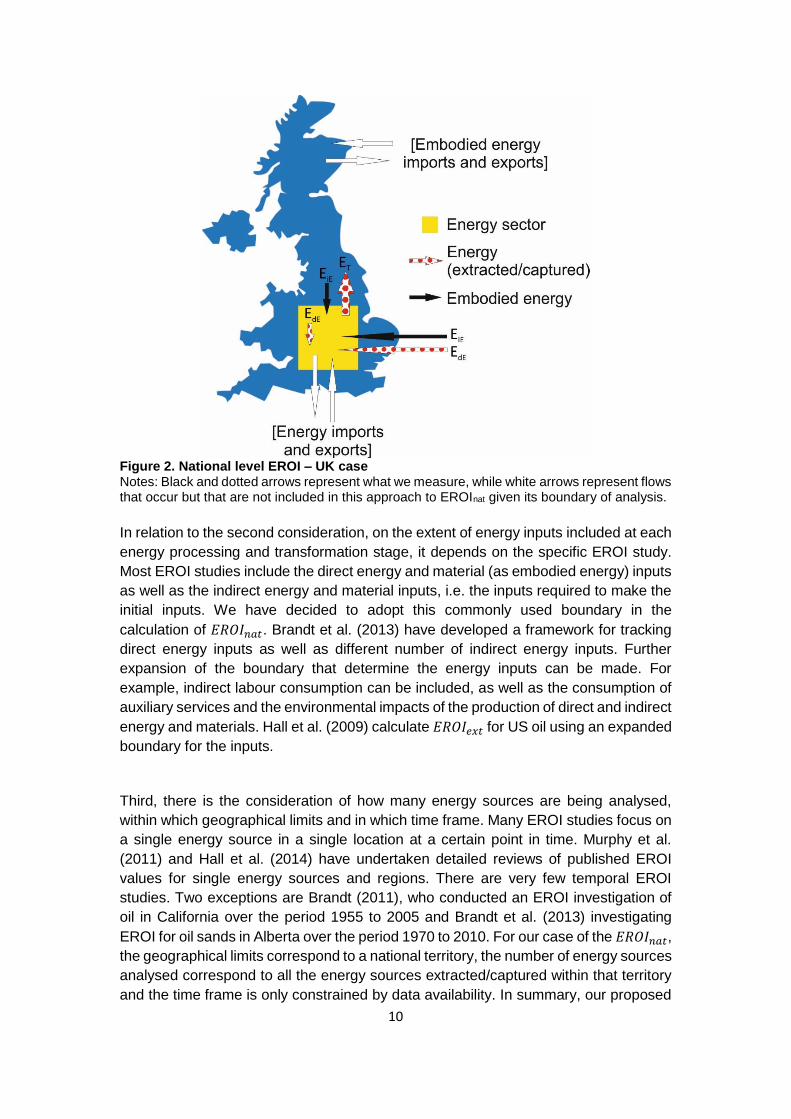
In relation to the first consideration, how far to go along the energy chain in order to
include more processing and transformation stages depends on the type of EROI (see
Figure 1). Our definition of 𝐸𝑅𝑂𝐼𝑛𝑎𝑡 establishes this boundary at the first stage of
extraction/capture of energy sources. In terms of most energy reporting (e.g.
International Energy Agency –IEA- Energy Balances), this means energy “production”.
Energy “production” does not include energy imports but it does include energy
exports. In other words, we are assessing the energy extracted/captured in a country
(energy returned), regardless of whether or not is then exported and without
accounting for energy imports (see Figure 2). This means that a country that imports
all of its primary energy will not have an EROI value when using this methodology.
Conversely, if a country export all of its primary energy, it will still have an EROI value
when using this methodology.
10 Primary energy generally refers to the energy extracted or captured from the natural environment (e.g. crude oil, coal, hydropower, etc.) (IEA & Eurostat 2005). Final energy (also called secondary energy) generally refers to energy as it is delivered to the final economic consumer, after undergoing transportation and transformation processes (e.g. gasoline, diesel, electricity, etc.) (IEA & Eurostat 2005). At the point of use, final energy undergoes one last transformation process as it passes through an end-use conversion device, for example furnaces, electric appliances or light bulbs. End-use devices transform energy into a form that is useful for human purposes, hence the term “useful energy” as the outcome of this last conversion process.
10
Figure 2. National level EROI – UK case Notes: Black and dotted arrows represent what we measure, while white arrows represent flows that occur but that are not included in this approach to EROInat given its boundary of analysis.
In relation to the second consideration, on the extent of energy inputs included at each
energy processing and transformation stage, it depends on the specific EROI study.
Most EROI studies include the direct energy and material (as embodied energy) inputs
as well as the indirect energy and material inputs, i.e. the inputs required to make the
initial inputs. We have decided to adopt this commonly used boundary in the
calculation of 𝐸𝑅𝑂𝐼𝑛𝑎𝑡. Brandt et al. (2013) have developed a framework for tracking
direct energy inputs as well as different number of indirect energy inputs. Further
expansion of the boundary that determine the energy inputs can be made. For
example, indirect labour consumption can be included, as well as the consumption of
auxiliary services and the environmental impacts of the production of direct and indirect
energy and materials. Hall et al. (2009) calculate 𝐸𝑅𝑂𝐼𝑒𝑥𝑡 for US oil using an expanded
boundary for the inputs.
Third, there is the consideration of how many energy sources are being analysed,
within which geographical limits and in which time frame. Many EROI studies focus on
a single energy source in a single location at a certain point in time. Murphy et al.
(2011) and Hall et al. (2014) have undertaken detailed reviews of published EROI
values for single energy sources and regions. There are very few temporal EROI
studies. Two exceptions are Brandt (2011), who conducted an EROI investigation of
oil in California over the period 1955 to 2005 and Brandt et al. (2013) investigating
EROI for oil sands in Alberta over the period 1970 to 2010. For our case of the 𝐸𝑅𝑂𝐼𝑛𝑎𝑡,
the geographical limits correspond to a national territory, the number of energy sources
analysed correspond to all the energy sources extracted/captured within that territory
and the time frame is only constrained by data availability. In summary, our proposed

11
approach attempts to calculate 𝐸𝑅𝑂𝐼𝑛𝑎𝑡 from a territorial production perspective (as
opposed to a consumption perspective).
2.3.2. Accounting for embodied energy inputs
Depending on the chosen boundaries for the calculation of EROI, and data availability,
a particular methodology can be applied for the accounting of embodied energy inputs.
The two main methodologies used are process analysis and Input-Output (IO) (Murphy
et al. 2011). The former is most commonly used; it is a bottom-up approach most
appropriate when assessing a single energy source through clearly defined processing
stages (Murphy et al. 2011). As data collection can be problematic and time consuming
when using this approach, published LCA data sets are sometimes used (see for
example Harmsen et al. (2013)). Also, as Arvesen and Hertwich (2015) note, care is
needed to ensure that LCA boundary conditions are consistent with the EROI
calculation.
Given the boundary definition of our 𝐸𝑅𝑂𝐼𝑛𝑎𝑡, we have chosen to use IO; a top-down
approach that is more appropriate when the boundary is expanded to multiple
processes (Murphy et al. 2011), e.g. when considering activities at a national level.
This is due to it being able to quantify interrelationships across economic sectors
(Murphy et al. 2011), and even enable the attribution of embodied energy inputs to
traded goods and services. Physical flows are estimated from monetary economic data
in this approach.
2.3.3. Temporality
The timing of energy inputs and energy outputs over the functional life of the supply
technology is important, since there are typically high energy inputs at the beginning
(construction) and at the end (decommissioning) of the life of the energy extraction or
capture location (see Figure 3). The issue of temporality does not, however, involve
any sort of discounting of time (as it does in other types of metrics such as cost-benefit
analysis). This is discussed in detail for the case of photovoltaic panels by Dale (2012)
and Dale & Benson (2013), and in King et al. (2015).

12
Figure 3. EROI inputs over time
However, when the boundary is expanded over larger geographical spaces and
several energy sources, as obtaining such data for all energy sources is impractical,
therefore a pragmatic approach is required. For our 𝐸𝑅𝑂𝐼𝑛𝑎𝑡 we assume that the
temporal patterns of energy inputs will balance out, since not all energy extraction or
capture projects will be at the same stage of development. Therefore accounting for
𝐸𝑅𝑂𝐼𝑛𝑎𝑡 in any given year broadly reflects the whole country’s EROI across all energy
sources irrespective of the stage of development of specific energy extraction and
capture projects. However, as Murphy et al. (2011, p.1893) point out “this assumption
would be accurate only if the system is in ‘steady state’, i.e., not growing or shrinking”.
Note that this pragmatic assumption may fail to capture shortfalls in energy available
to the economy for an interim period. For example, in the context of rapid mitigation to
address climate change, there is a need to invest heavily in the capture or extraction
technology for particular energy sources in a short period of time. In these sorts of
periods, 𝐸𝑅𝑂𝐼𝑛𝑎𝑡values would be very low, and would be followed by periods of higher
𝐸𝑅𝑂𝐼𝑛𝑎𝑡 once the technologies are in place (Dale & Benson 2013).
2.3.4. Accounting for energy quality
How to account for the differences in energy quality of the different energy sources
has been a persistent methodological issue in energy analysis, and hence also for
conducting NEA. It is important to account for energy quality because thermal energy
and electricity, for example, are very different in terms of their capacity to do work, but
also in their density, cleanliness, ease of storage, safety, flexibility of use, etc. These

13
differences should be accounted for since they are relevant for societies and
economies. However, and despite its importance, most EROI studies do not undertake
any form of energy quality adjustment.
There are, in general, two approaches for accounting for differences in energy quality:
price-based and physical units (Murphy et al. 2011, pp.1896–1899). The price-based
approach is used more often when accounting for energy inputs using a top-down
approach given the extent of economic data (e.g. Lambert et al. 2014). However, this
approach rests on contentious assumptions of competitive markets and lack of
accounting for externalities (Cleveland et al. 2000).
The physical units approach on the other hand, should be used more often in process
analysis, where detailed physical data are available. Moreover, there is recent work
that has been using physical units (particularly exergy11) to account for
thermodynamic energy quality at a national-level (Brockway et al. 2014; Warr et al.
2010; Brockway et al. 2015; Williams et al. 2008). Nonetheless, it is important to
acknowledge that exergy does not account for certain aspects of energy quality that
are important for economic purposes (e.g. capacity for storage, cleanliness,
transportability, density, and so on) (Cleveland et al. 2000; Murphy et al. 2011).
The type of quality adjustment we have made in our methodology is closer to the
physical units approach. We have relied on the physical content method used by many
energy agencies, by which the primary energy equivalent of any renewable energy
source is its physical energy content (IEA 2016). Given that our boundary of analysis
is taken at the production stage, this correction is less important than if we chose final
consumption as the boundary of analysis. Therefore, we consider that further energy
quality adjustments are a key part of future research, ideally using useful exergy,
particularly considering the social and economic importance of being able to fairly
compare different energy sources based on their usefulness.
11 Exergy can be defined as “the maximum possible work that may be obtained from a system by bringing it to the equilibrium in a process with reference surroundings” (Kostic 2012, p.816). As Gaggioli & Wepfer (1980, p.823) state, exergy “is synonymous with what the layman calls ‘energy’. It is exergy, not energy, that is the resource of value, and it this commodity, that ‘fuels’ processes, which the layman is willing to pay for”. For further details on exergy see Wall (1986; 1977; 2003), Kanoglu et al. (2012), Dincer (2002), Rosen (2006; 2002), Sciubba and Wall (2007).

14
3. A national-level EROI: the data and the methodology
3.1. Input-Output and Energy
Like many other energy analysis techniques, energy IO analysis was developed in the
1970s driven by the oil price shock of the time (Casler & Wilbur 1984). It has been
mainly used to quantify energy flows through the different economic sectors (see for
example Bullard & Herendeen, 1975; Bullard, Penner, & Pilati, 1978; Wright, 1974).
However, to the best of our knowledge, it has not been used to directly calculate a
national-level EROI value. Perhaps the study by Peet et al. (1987) is the closest, but it
focused on specific sectors (i.e. oil and electricity) only, in addition to calculating net
energy and not EROI specifically. We will now describe the data that we use to
calculate 𝐸𝑅𝑂𝐼𝑛𝑎𝑡 for the UK (𝐸𝑅𝑂𝐼𝑛𝑎𝑡(𝑈𝐾)) for 1997-2012, followed by a detailed
description of the IO methodology.
3.2. EROInat(UK): Data
We use IEA data (IEA 2015) and a Multi-Regional Input-Output (MRIO) model to
construct a Multi-Regional Input-Output model for the UK (UKMRIO), using IO data
produced by the UK’s Office of National Statistics (ONS 2014). This data is
supplemented with additional data on UK trade with other nations and how these other
nations trade between themselves from the University of Sydney’s Eora MRIO
database. The Eora MRIO database (Lenzen et al. 2013) is used to disaggregate the
UK’s import and export data to further sectors from other world regions. Since Eora
contains data from almost 200 countries, we are able to select the most appropriate
regional grouping for the trade data. For this study, we construct six regions: the UK,
the Rest of Europe, the Middle East (to account for trade with this oil producing region),
China, the Rest of the OECD, and the Rest of the World. The UKMRIO is based on
106 sectors, two of which are energy industries/sectors relevant to our boundary
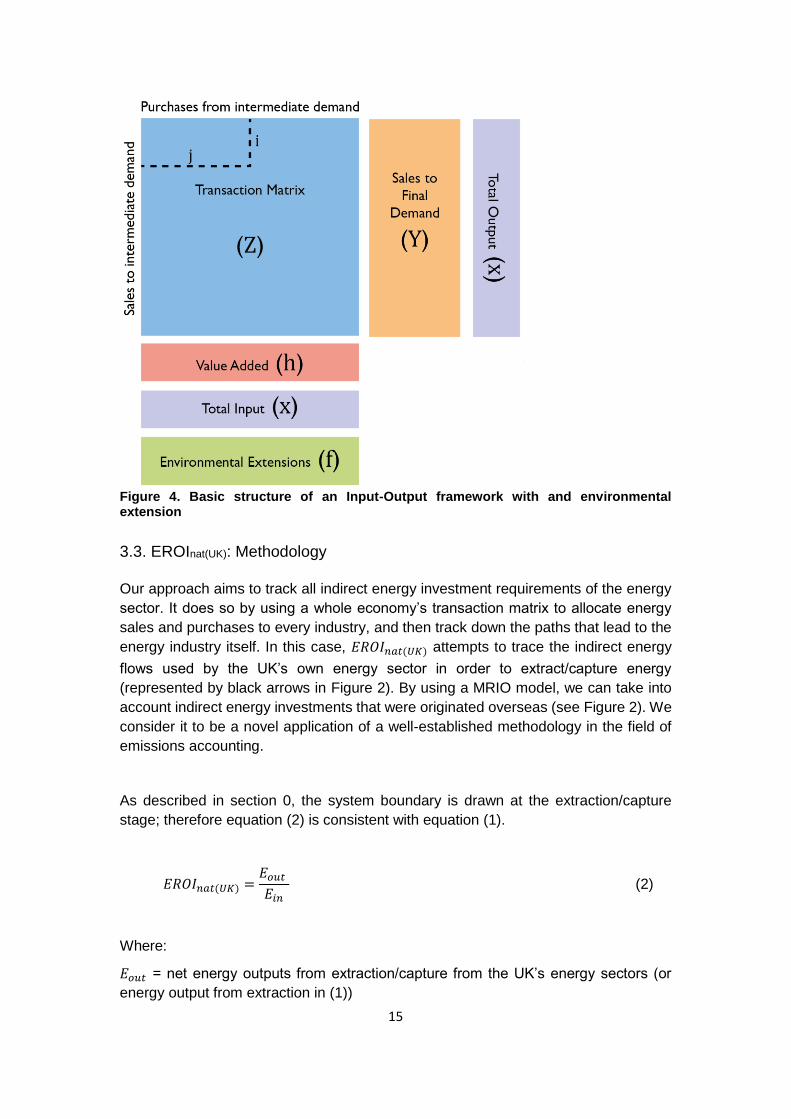
definition (i.e. extraction/capture industries). A basic structure of an Input-Output model
is shown in Figure 4. Following a standard procedure in IO modelling, an
environmental extension for energy use relating to each transaction is added in
physical units (MJ), though the main IO table is based on monetary units (Roberts
1978). This could be considered a drawback of this dataset, which uses a direct impact
coefficient approach (or energy intensity approach). However, its use is justified by
data availability (there are no MRIO energy extended databases that we know of that
use a hybrid-unit approach12) and unit consistency.
12 A single region IO hybrid-unit matrix with an energy extension was constructed by Guevara (2014) for Portugal using IEA (International Energy Agency) data.
15
Figure 4. Basic structure of an Input-Output framework with and environmental extension
3.3. EROInat(UK): Methodology
Our approach aims to track all indirect energy investment requirements of the energy
sector. It does so by using a whole economy’s transaction matrix to allocate energy
sales and purchases to every industry, and then track down the paths that lead to the
energy industry itself. In this case, 𝐸𝑅𝑂𝐼𝑛𝑎𝑡(𝑈𝐾) attempts to trace the indirect energy
flows used by the UK’s own energy sector in order to extract/capture energy
(represented by black arrows in Figure 2). By using a MRIO model, we can take into
account indirect energy investments that were originated overseas (see Figure 2). We
consider it to be a novel application of a well-established methodology in the field of
emissions accounting.
As described in section 0, the system boundary is drawn at the extraction/capture
stage; therefore equation (2) is consistent with equation (1).
𝐸𝑅𝑂𝐼𝑛𝑎𝑡(𝑈𝐾) =
𝐸𝑜𝑢𝑡
𝐸𝑖𝑛 (2)
Where:
𝐸𝑜𝑢𝑡 = net energy outputs from extraction/capture from the UK’s energy sectors (or
energy output from extraction in (1))

16
𝐸𝑖𝑛 = direct and indirect energy inputs (from the UK and abroad) to the UK’s energy
sectors (as in (1))
The energy return at a national level, 𝐸𝑜𝑢𝑡 is calculated as follows:
𝐸𝑜𝑢𝑡 = 𝐸𝑇 − 𝐸𝑑𝐸 (3)
Where:
𝐸𝑇 = total primary energy produced in the UK. This is taken from “production” in IEA
energy balances.
𝐸𝑑𝐸 = total UK energy sector’s direct energy use (both from the UK and the other 5
regions) used to extract/capture UK’s energy. This is taken from “energy industry own
use” in IEA energy balances.
Similarly, the energy invested in producing this, 𝐸𝑖𝑛 is calculated as:
𝐸𝑖𝑛 = 𝐸𝑑𝐸 + 𝐸𝑖𝐸 (4)
Where:
𝐸𝑖𝐸 = total indirect energy use (both from the UK and the other 5 regions) used to
extract/capture UK’s energy. In other words, this is the embodied energy used by the
UK’s energy extracting/capture sectors in order to produce energy.
Having constructed the UKMRIO model, 𝐸𝑖𝐸 can be calculated, following the detailed
matrix algebra IO procedure described in Appendix A, together with a simple numerical
example.
Finally, the EROI at a national level for the UK is calculated by substituting these
expressions into equation (2), as follows:
𝐸𝑅𝑂𝐼𝑛𝑎𝑡(𝑈𝐾) =
𝐸𝑇 − 𝐸𝑑𝐸
𝐸𝑑𝐸 + 𝐸𝑖𝐸 (5)

17
4. Results and Discussion
Applying the UK IO data, IEA data and MRIO model to equation (5), we calculated
𝐸𝑅𝑂𝐼𝑛𝑎𝑡(𝑈𝐾) for the period 1997-2012. We found that the 𝐸𝑅𝑂𝐼𝑛𝑎𝑡 for the UK for the
period increased from 5.6 in 1997 to a maximum value of 9.6 in 2000, before gradually
falling back to a value of 6.2 in 2012 (Figure 5). This means that for every unit of energy
the UK energy extracting/capture sectors have invested, they have obtained an
average of 7.9 units of energy during the period 1997-2012. In other words, on
average, 12% of the UK’s extracted/captured energy does not go into the economy or
into society for productive or well-being purposes, but rather needs to be reinvested
by the energy sectors to produce more energy.
Figure 5. 𝑬𝑹𝑶𝑰𝒏𝒂𝒕(𝑼𝑲) (1997-2012): Comparison of results with and without indirect
energy (EiE)
This of course has implications for the energy sector, for resource management and
technology development, and for the economy, as described in section 0. If Fizaine
and Court (2016) are right in their assessment, where a minimum societal EROI of 11
is required for continuous economic growth (assuming the current energy intensity of
the US economy), the UK is below that benchmark.
Figure 5 also shows the relevance of including indirect energy (EiE) in the calculation
of 𝐸𝑅𝑂𝐼𝑛𝑎𝑡(𝑈𝐾). A 𝐸𝑅𝑂𝐼𝑛𝑎𝑡 calculation, using only energy industry’s own use as the
energy inputs gives higher values because there is an element missing in the
denominator. By including indirect energy use (EiE), using the IO methodology
described in section 0, we obtain a more complete view of the energy invested into the
energy producing sectors. This is the key contribution of the methodology we outline
here and a step forwards in the EROI literature. Our calculations for the UK without
including indirect energy (EiE) are a same order of magnitude to King et al.’s (2015)
calculations of EROI (or net power ratio –NPR as they call it).
-
2
4
6
8
10
12
14
16
18
20
1997 1998 1999 2000 2001 2002 2003 2004 2005 2006 2007 2008 2009 2010 2011 2012
ERO
Inat
(uk)
EROInatUK EROInatUK no EiE

18
The evolution of the energy returned (numerator Eout) and the energy invested
(denominator Ein) are shown in Figure 6. Since 1999 the UK’s production of energy
has been declining steadily (compensated by increased imports). For a national-level
EROI from a production perspective, this means that we are extracting/capturing less
energy by using a relatively stable stream of energy inputs. Thus the steady decline of
𝐸𝑅𝑂𝐼𝑛𝑎𝑡(𝑈𝐾) from 2003 onwards.
Figure 6. Energy Returned (Eout) and Energy Invested (Ein) in the UK (1997-2012)
Furthermore, considering that oil and gas dominate the UK’s energy production mix
(see Figure 7), changes in the EROI values of these particular fuels are likely to
dominate the changes in the UK’s 𝐸𝑅𝑂𝐼𝑛𝑎𝑡. From past literature reviews on the EROI
of different energy sources, there seems to be a consensus that coal has the highest
EROI, followed by oil and then gas (Dale et al. 2012; Murphy & Hall 2010). Therefore,
the steeper decline of 𝐸𝑅𝑂𝐼𝑛𝑎𝑡(𝑈𝐾) from 2010 onwards is explained by a reduction in
the proportion of those three fossil fuels in the UK’s total production.
-
2.00
4.00
6.00
8.00
10.00
12.00
1997 1998 1999 2000 2001 2002 2003 2004 2005 2006 2007 2008 2009 2010 2011 2012
EJ
Eout: Energy Returned Ein: Energy Invested

19
Figure 7. UK energy production: share of energy sources 1997-2012
Data taken from IEA (2015).
Table 1. UK's rate of production of different energy sources (1997-2010 and 2010-2012)
Energy Source Change in Production (%)
1997-2010 2010-2012
Coal and coal products -0.6 0.0
Crude, NGL and feedstocks -0.5 -0.1
Natural gas -0.3 -0.2
Nuclear -0.4 0.1
Hydro -0.1 0.4
Solar/wind/other 13.5 14.2
Biofuels and waste 1.6 0.7
Data taken from IEA (2015).
One drawback of our approach to calculating a national-level EROI is that it cannot
provide energy source specific information of which moments in time energy
investments are made and energy returns are obtained. However, we believe that by
providing a time-series, our proposed approach provides an important element of
temporal dynamics at a national scale. The greater availability of IO data would allow
for time-series to be constructed for other countries, and we suggest this to be
undertaken as future research. In this sense, we present our results to the academic
community in the hopes of opening a constructive discussion.
5. Conclusions and Policy Implications
This paper developed and applied a new approach to quantify EROI for national
economies, particularly when it comes to calculating indirect energy inputs. It
contributes to the growing literature on net energy analysis. The approach is based on
Input-Output analysis and is, to the best of our knowledge, a novel application of MRIO
0%
10%
20%
30%
40%
50%
60%
70%
80%
90%
100%
Coal and coal products Crude, NGL and feedstocks Natural gas NuclearHydro Solar/wind/other Biofuels and waste

20
datasets which has been enabled by the advances in IO data gathering and computing
power. Its key contribution is to provide an estimation of indirect energy investments
at a national level. Hence, we consider it a step forwards towards the called made by
Murphy and Hall (2010, p.115) for improved “quantity and quality on the data on
‘energy costs of energy generating industries’”.
The relevance of a national-level EROI lies in its potential to inform national-level
energy policy making. 𝐸𝑅𝑂𝐼𝑛𝑎𝑡(𝑈𝐾) over time provides information on the relative
resource depletion and technological change in the UK’s energy sector. We found that
the UK as a whole has had a declining EROI in the first decade of the 21st century,
going from 9.6 in 2000 to 6.2 in 2012. This information is important, particularly for a
country that is aiming to transition to a low-carbon economy, where high values of
national-level EROI would contribute to a successful transition. These initial results
show that more and more energy is having to be used in the extraction of energy itself
rather than by the UK’s economy or society.
Other authors (Herendeen 2015; Carey W King et al. 2015) have attempted to connect
EROI values to the price of energy and other services in order to give them more policy
relevance. We argue that the methodology described here has the potential to inform
national and international energy policy. Once developed further, for more countries
and more years, the results can answer important questions such as: Which countries
are extracting and capturing energy with a better return to their energy invested?
Which countries are doing better in terms of technological development and/or
resource conservation? How do 𝐸𝑅𝑂𝐼𝑛𝑎𝑡 values for different countries relate to their
energy imports and exports? Therefore, we suggest two avenues for future research:
first, apply this methodology for more countries and more years; and second, extend
the methodology to develop a national-level EROI from a consumption perspective,
i.e. expanding the boundary of analysis (an effort that would complement the work of
Herendeen (2015)).
As a final thought, in 1974 the US passed a law such that “all prospective energy
supply technologies considered for commercial application must be assessed and
evaluated in terms of their ‘potential for production of net energy’” (Berndt 1982). This
was triggered by the 1973-74 oil crisis. Once oil supply issues had returned to normal
the law was abandoned as the additional calculations were regarded as unnecessary.
Given the emerging interest in alternative tools for energy analysis and the pressing
need of a transition to a low carbon economy, perhaps it is time to reinstate the
importance of undertaking such analysis. Even if the EROI values of renewables may
increase in future from current relatively low values –there is contrasting evidence on
current values (Raugei et al. 2012; Kubiszewski et al. 2010)- we need to better
understand what that would imply for our economies and societies. For the guidance
of national energy policy, EROI at a national level could help inform policy decisions
that aim to manage an energy transition (Carbajales-Dale et al. 2014).

21
APPENDIX A
A note on notation: A bold lower case letter represents a vector. A bold capital letter
represents a matrix. Non-bold lower case and capital letter represent scalars. A vector
with a “hat” ( ̂ ) represents a diagonal matrix, whose diagonal elements are the
elements of the vector. 𝐈 is the identity matrix, and is a matrix of zeros whose diagonal
is made of ones.
Consider the transaction matrix Z (Figure A 1). In the top left hand corner of Z is the
UK data, followed by 5 world regions (the Rest of Europe, the Middle East, China, the
Rest of the OECD, and the Rest of the World). Each region contains 106 industry
sectors. Z displays sales by each industry in rows and the columns represent
purchases by each industry. In other words, reading across a row reveals which other
industries a single industry sells to and reading down a column reveals who a single
industry buys from in order to make its product output. A single element, 𝑧𝑖𝑗, within 𝐙
represents the contributions from the 𝑖𝑡ℎ supplying sector to the 𝑗𝑡ℎ producing sector
in an economy. The 𝐙 matrix is in monetary units.

22
Figure A 1. Basic Structure of the UK MRIO.
Reading across the table, the total output (𝑥𝑖) of sector 𝑖 can be expressed as:
𝑥𝑖 = 𝑧𝑖1 + 𝑧𝑖2 + ⋯ + 𝑧𝑖𝑛 + 𝑦𝑖 (A 1)
where 𝑦𝑖 is the final demand for the product produced by the particular sector.
Essentially, the IO framework shows that the total output of a sector can be shown to
be the result of its intermediate and final demand. Similarly if a column of the IO table
is considered, the total input of a sector is shown to be the result of its intermediate
demand and the value added in profits and wages (𝐡). The sum across total output (𝐱)
and total input (𝐱) will be equal.
If each element, 𝑧𝑖𝑗, along row 𝑖 is divided by the output 𝑥𝑗, associated with the
corresponding column 𝑗 it is found in, then each element 𝑧𝑖𝑗 in 𝐙 can be replaced with:
𝑎𝑖𝑗 =𝑧𝑖𝑗
𝑥𝑗 (A 2)

23
forming a new matrix 𝐀, known as the direct requirements matrix. Element 𝑎𝑖𝑗 is
therefore the input as a proportion of all the inputs in the production recipe of that
product.
Equation (A 2) can be re-written as:
𝑧𝑖𝑗 = 𝑎𝑖𝑗𝑥𝑗 (A 3)
Substituting for (A 3) in (A 1) forms:
𝑥𝑖 = 𝑎𝑖1𝑥1 + 𝑎𝑖2𝑥2 + ⋯ + 𝑎𝑖𝑛𝑥𝑛 + 𝑦𝑖 (A 4)
Which, if written in matrix notation is = 𝐀𝐱 + 𝐲 . Solving for 𝐱 gives:
𝐱 = (𝐈 − 𝐀)−𝟏𝐲 (A 5)
(A 5) is known as the Leontief equation and describes output 𝐱 as a function of final
demand 𝐲. (𝐈 − 𝐀)−𝟏 is known as the Leontief inverse (denoted hereafter as 𝐋).
Therefore (A 5) can be re-written as:
𝐱 = 𝐋𝐲 (A 6)
Consider a row vector 𝐟 of annual energy produced required by each industrial sector
(an environmental extension in Figure 4). Then it is possible to calculate the energy
intensity (𝐞) by dividing the total energy input of each sector by total sector output (𝐱),
in terms of joules per pound for example, as follows:
𝐞 = 𝐟�̂�−𝟏 (A 7)
In other words, 𝐞 is the coefficient vector representing energy per unit of output.
Multiplying both sides of (A 6) by 𝐞 gives:
𝐞𝐱 = 𝐞𝐋𝐲 (A 8)
and from (A 7) we simplify (A 8) to:

24
f = 𝐞𝐋𝐲 (A 9)
However, we need the result (𝐟) as a flow matrix (𝐅), rather than a scalar, and so we
use the diagonalised �̂� and �̂�:
𝐅 = �̂�𝐋�̂� (A 10)
𝐅 is produced energy in matrix form, allowing the UK’s use of energy from the full
supply chain of extraction/capture to be determined. 𝐅 is calculated by pre-multiplying 𝐋
by energy per unit of output and post-multiplying by final demand. Energy is reallocated
from extraction/capture sectors to the sectors that use this produced energy.
We will use input-output analysis techniques to calculate total indirect energy use (both
from the UK and the RoW) used to extract/capture UK’s energy. This is 𝐸𝑖𝐸 in (5) from
the main text. To calculate 𝐸𝑖𝐸 we calculate a new flow matrix 𝐅𝟎 which shows the UK’s
total use of energy from the full supply chain if there was no flow to the energy sectors.
The indirect energy use is therefore the difference between 𝐅 and 𝐅𝟎.
To calculate 𝐅𝟎, we generate a new version of the transactions matrix, 𝐙𝟎, which is
exactly the same as 𝐙 apart from the fact that 𝐙𝟎 has zeros in the cells that represent
the UK energy sector’s expenditure on all other energy products.
Let 𝐙𝟎 contain 𝑛 regions and 𝑚 sectors. Sectors 𝑐 to 𝑒 are the energy sectors and
region 𝑘 is the UK. An element of 𝐙𝟎 is 𝑧𝑖𝑗𝑟𝑠0which represents the monetary flow from
sector 𝑖 in country 𝑟 to sector 𝑗 in country 𝑠. We know that 𝑧𝑖𝑗𝑟𝑠0 = 0 if 𝑖 and 𝑗 belong to
the set of energy sectors (𝑐 to 𝑒) and if region 𝑠 = 𝑘 (the UK). In other words:
𝐙𝟎 = 𝑧𝑖𝑗𝑟𝑠0 = {
0 𝑖𝑓 𝑖, 𝑗 ∈ {𝑐, … , 𝑒} 𝑎𝑛𝑑 𝑠 = 𝑘
𝑧𝑖𝑗𝑟𝑠0𝑜𝑡ℎ𝑒𝑟𝑤𝑖𝑠𝑒
} (A 11)
Then 𝐅𝟎 = �̂�(𝐈 − 𝐙𝟎𝐱−�̂�)
−𝟏 �̂� (A 12)
and
𝐸𝑖𝐸 = ∑ ∑ ∑ 𝐹𝑖𝑗𝑟𝑘 −
𝑗 ∈ {𝑐,…,𝑒}𝑗 ∈ {𝑐,…,𝑒}
𝐹𝑖𝑗𝑟𝑘0
𝑛
𝑟
(A 13)

25
Essentially, ∑ ∑ ∑ 𝐹𝑖𝑗𝑟𝑘
𝑗 ∈ {𝑐,…,𝑒}𝑗 ∈ {𝑐,…,𝑒}𝑛𝑟 is the sum of all the direct and indirect energy
that forms energy inputs to make UK energy products.
∑ ∑ ∑ 𝐹𝑖𝑗𝑟𝑘0
𝑗 ∈ {𝑐,…,𝑒}𝑗 ∈ {𝑐,…,𝑒}𝑛𝑟 is the sum of the direct energy that forms energy inputs to
make UK energy products.
And the difference is the sum of the indirect energy that forms energy inputs to make
UK energy products.
Finally, we do this for each of the 16 years (1997-2012) we have data for.
We present here a simple numerical example. Let’s assume we have a 3 region model
(UK, rest of the world 1 - RoW1 and rest of the world 2 - RoW2). Each region has 4
sectors, two of which are energy producing sectors.
Z, y, h, x, f and e are presented in Figure A 2.
Figure A 2. Numerical example: Z, y, h, x, f and e.
After applying equations (A 1) to (A 10) we obtain 𝐅, shown in Figure A 3.
Figure A 3. Numerical example: F.
UK RoW1 RoW2
Agri Manu Energy1 Energy2 Agri Manu Energy1 Energy2 Agri Manu Energy1 Energy2 y y y x
Agri 100 30 5 3 6 10 10 4 3 5 5 2 500 10 5 698
Manu 20 200 10 6 10 8 6 2 5 4 3 1 300 4 2 581
Energy1 15 20 100 25 10 2 2 2 5 1 1 1 100 4 2 290
Energy2 15 15 100 25 2 2 2 0 1 1 1 0 100 2 1 267
Agri 10 6 2 1 75 22 4 3 2 4 4 1 8 450 4 596
Manu 2 15 0 1 15 150 7 5 4 4 3 2 2 250 1 461
Energy1 2 1 1 2 12 15 75 18 4 1 1 2 2 80 1 217
Energy2 2 1 2 1 12 12 75 18 1 0 0 1 1 80 1 207
Agri 30 20 5 3 60 40 10 6 1000 20 10 5 30 60 600 1899
Manu 5 50 1 1 10 100 2 2 100 2500 15 15 30 60 400 3291
Energy1 5 3 2 5 10 6 4 10 100 150 1500 300 6 12 400 2513
Energy2 2 2 5 3 4 4 10 6 50 150 250 300 6 12 300 1104
h 490 218 57 191 370 90 10 131 624 451 720 474
x 698 581 290 267 596 461 217 207 1899 3291 2513 1104
f 10 15 300 100 0 0 1 1 0 0 2 3
e 0.01 0.03 1.03 0.37 - - 0.00 0.00 - - 0.00 0.00
UK
RoW1
RoW2
UK RoW1 RoW2
Agri Manu Energy1 Energy2 Agri Manu Energy1 Energy2 Agri Manu Energy1 Energy2
Agri 8.7 0.4 0.1 0.0 0.2 0.2 0.1 0.0 0.1 0.1 0.1 0.0
Manu 0.8 12.2 0.3 0.1 0.5 0.4 0.2 0.1 0.2 0.1 0.1 0.0
Energy1 26.7 31.4 178.2 18.3 18.3 6.6 4.3 2.2 8.3 2.7 1.6 1.4
Energy2 9.4 9.7 24.7 45.2 3.7 2.1 1.3 0.4 1.7 0.8 0.5 0.3
Agri - - - - - - - - - - - -
Manu - - - - - - - - - - - -
Energy1 0.0 0.0 0.0 0.0 0.1 0.1 0.6 0.1 0.0 0.0 0.0 0.0
Energy2 0.0 0.0 0.0 0.0 0.1 0.1 0.2 0.5 0.0 0.0 0.0 0.0
Agri - - - - - - - - - - - -
Manu - - - - - - - - - - - -
Energy1 0.0 0.0 0.0 0.0 0.1 0.1 0.0 0.0 0.2 0.3 0.9 0.3
Energy2 0.0 0.1 0.0 0.0 0.1 0.1 0.0 0.0 0.3 0.5 0.4 1.3
UK
RoW1
RoW2
UK RoW1 RoW2

26
In order to calculate 𝐸𝑖𝐸, following equations (A 11) and (A 12), we create 𝐅𝟎 from 𝐙𝟎.
The latter is shown in Figure A 4 and the former is shown in Figure A 5.
Figure A 4. Numerical example: Z0
Figure A 5. Numerical example: F0
Finally, we apply equation (A 13) and obtain 𝐸𝑖𝐸 of 117.64.
Assuming we obtain from the IEA for our numerical example 𝐸𝑇 = 425 and 𝐸𝑑𝐸 = 130,
we can insert these components in equation (5) and obtain 𝐸𝑅𝑂𝐼𝑛𝑎𝑡(𝑈𝐾) = 1.1
𝐸𝑅𝑂𝐼𝑛𝑎𝑡(𝑈𝐾) =425 − 130
130 + 117.64
UK RoW1 RoW2
Agri Manu Energy1 Energy2 Agri Manu Energy1 Energy2 Agri Manu Energy1 Energy2 y y y x
Agri 100 30 5 3 6 10 10 4 3 5 5 2 500 10 5 698
Manu 20 200 10 6 10 8 6 2 5 4 3 1 300 4 2 581
Energy1 15 20 0 0 10 2 2 2 5 1 1 1 100 4 2 165
Energy2 15 15 0 0 2 2 2 0 1 1 1 0 100 2 1 142
Agri 10 6 2 1 75 22 4 3 2 4 4 1 8 450 4 596
Manu 2 15 0 1 15 150 7 5 4 4 3 2 2 250 1 461
Energy1 2 1 0 0 12 15 75 18 4 1 1 2 2 80 1 214
Energy2 2 1 0 0 12 12 75 18 1 0 0 1 1 80 1 204
Agri 30 20 5 3 60 40 10 6 1000 20 10 5 30 60 600 1899
Manu 5 50 1 1 10 100 2 2 100 2500 15 15 30 60 400 3291
Energy1 5 3 0 0 10 6 4 10 100 150 1500 300 6 12 400 2506
Energy2 2 2 0 0 4 4 10 6 50 150 250 300 6 12 300 1096
h 490 218 267 252 370 90 10 131 624 451 720 474
x 698 581 290 267 596 461 217 207 1899 3291 2513 1104
f 10 15 300 100 0 0 1 1 0 0 2 3
e 0.01 0.03 1.03 0.37 - - 0.00 0.00 - - 0.00 0.00
UK RoW1 RoW2
UK
RoW1
RoW2
Agri Manu Energy1 Energy2 Agri Manu Energy1 Energy2 Agri Manu Energy1 Energy2
Agri 8.66 0.43 0.04 0.02 0.15 0.20 0.13 0.05 0.08 0.08 0.05 0.03
Manu 0.74 12.16 0.15 0.10 0.45 0.36 0.20 0.06 0.22 0.15 0.08 0.04
Energy1 14.96 17.97 109.95 0.19 11.01 3.77 2.49 1.34 4.97 1.53 0.94 0.81
Energy2 5.20 4.89 0.08 38.63 1.08 1.05 0.64 0.11 0.54 0.42 0.25 0.10
Agri - - - - - - - - - - - -
Manu - - - - - - - - - - - -
Energy1 0.02 0.02 0.00 0.00 0.10 0.11 0.62 0.06 0.03 0.01 0.01 0.01
Energy2 0.02 0.01 0.00 0.00 0.10 0.10 0.25 0.46 0.02 0.01 0.00 0.01
Agri - - - - - - - - - - - -
Manu - - - - - - - - - - - -
Energy1 0.03 0.04 0.00 0.00 0.06 0.08 0.02 0.02 0.25 0.29 0.92 0.27
Energy2 0.04 0.07 0.00 0.00 0.08 0.13 0.05 0.02 0.32 0.49 0.44 1.32
UK
RoW1
RoW2
UK RoW1 RoW2

27
References
Arvesen, A. & Hertwich, E.G., 2015. More caution is needed when using life
cycle assessment to determine energy return on investment (EROI).
Energy Policy, 76, pp.1–6. Available at:
http://linkinghub.elsevier.com/retrieve/pii/S0301421514006338 [Accessed
December 4, 2014].
Ayres, R.U. et al., 2013. The underestimated contribution of energy to
economic growth. Structural Change and Economic Dynamics, 27, pp.79–
88. Available at: http://dx.doi.org/10.1016/j.strueco.2013.07.004.
Berndt, E.R., 1982. From Technocracy to Net Energy Analysis: Engineers,
Economists and Recurring Energy Theories of Value,
Brandt, A.R., 2011. Oil depletion and the energy efficiency of oil production:
The case of California. Sustainability, 3, pp.1833–1854.
Brandt, A.R. & Dale, M., 2011. A General Mathematical Framework for
Calculating Systems-Scale Efficiency of Energy Extraction and
Conversion: Energy Return on Investment (EROI) and Other Energy
Return Ratios. Energies, 4(12), pp.1211–1245. Available at:
http://www.mdpi.com/1996-1073/4/8/1211/ [Accessed February 6, 2015].
Brandt, A.R., Dale, M. & Barnhart, C.J., 2013. Calculating systems-scale
energy efficiency and net energy returns: A bottom-up matrix-based
approach. Energy, 62, pp.235–247. Available at:
http://dx.doi.org/10.1016/j.energy.2013.09.054.
Brandt, A.R., Englander, J. & Bharadwaj, S., 2013. The energy efficiency of oil
sands extraction: Energy return ratios from 1970 to 2010. Energy, 55,
pp.693–702. Available at:
http://linkinghub.elsevier.com/retrieve/pii/S0360544213002776.
Brockway, P.E. et al., 2014. Divergence of trends in US and UK Aggregate
Exergy Efficiencies 1960-2010. Environmental Science & Technology,
48(16), pp.9874–9881. Available at:
http://www.see.leeds.ac.uk/fileadmin/Documents/research/sri/workingpap
ers/SRIPs-64.pdf.
Brockway, P.E. et al., 2015. Understanding China’s past and future energy
demand: An exergy efficiency and decomposition analysis. Applied
Energy, 155, pp.892–903. Available at:
http://linkinghub.elsevier.com/retrieve/pii/S0306261915007151.
Bullard, C.W. & Herendeen, R.A., 1975. The energy cost of goods and services.

28
Energy Policy, 3(4), pp.268–278.
Bullard, C.W., Penner, P.S. & Pilati, D. a, 1978. Net energy analysis. Handbook
for combining process and input-output analysis. Resources and Energy,
1, pp.267–313. Available at:
http://www.sciencedirect.com/science/article/pii/0165057278900087.
Carbajales-Dale, M. et al., 2014. A better currency for investing in a sustainable
future. Nature Clim. Change, 4(7), pp.524–527. Available at:
http://dx.doi.org/10.1038/nclimate2285\n10.1038/nclimate2285.
Casler, S. & Wilbur, S., 1984. Energy Input-Output Analysis. A Simple Guide.
Resources and Energy, 6, pp.187–201.
Cleveland, C.J., 1987. Biophysical Economics: Historical Perspective and
Current Research Trends. Ecological Modelling, 38(1-2), pp.47–73.
Cleveland, C.J. et al., 1984. Energy and the U.S. Economy: A Biophysical
Perspective. Science, 225(4665), pp.890–897.
Cleveland, C.J., 2005. Net energy from the extraction of oil and gas in the
United States. Energy, 30, pp.769–782.
Cleveland, C.J., Kaufmann, R.K. & Stern, D.I., 2000. Aggregation and the role
of energy in the economy. Ecological Economics, 32(2), pp.301–317.
Available at:
http://linkinghub.elsevier.com/retrieve/pii/S0921800999001135.
Dale, M., 2012. The Energy Balance of the Photovoltaic (PV) Industry: Is the
PV industry a net electricity producer? Available at:
http://gcep.stanford.edu/pdfs/symposium2012/MikDale_Symp2012_web.
pdf.
Dale, M. & Benson, S.M., 2013. Energy Balance of the Global Photovoltaic (PV)
Industry - Is the PV Industry a Net Electricity Producer? Environmental
Science & Technology, 47, pp.3482–3489.
Dale, M., Krumdieck, S. & Bodger, P., 2012. Global energy modelling — A
biophysical approach (GEMBA) Part 1: An overview of biophysical
economics. Ecological Economics, 73, pp.152–157. Available at:
http://linkinghub.elsevier.com/retrieve/pii/S092180091100440X [Accessed
January 13, 2015].
Dale, M., Krumdieck, S. & Bodger, P., 2011. Net energy yield from production
of conventional oil. Energy Policy, 39(11), pp.7095–7102. Available at:
http://dx.doi.org/10.1016/j.enpol.2011.08.021.
Dincer, I., 2002. The role of exergy in energy policy making. Energy Policy,

29
30(2), pp.137–149.
Fizaine, F. & Court, V., 2016. Energy expenditure, economic growth, and the
minimum EROI of society. Energy Policy, 95, pp.172–186. Available at:
http://dx.doi.org/10.1016/j.enpol.2016.04.039.
Gaggioli, R.A. & Wepfer, W.J., 1980. Exergy economics. Energy, 5(3), pp.823–
837.
Gagnon, N., Hall, C. a S. & Brinker, L., 2009. A preliminary investigation of
energy return on energy investment for global oil and gas production.
Energies, 2(3), pp.490–503.
Guevara, Z.H.Z., 2014. Three-level energy decoupling: Energy decoupling at
the primary, final and useful levels of energy use. Universidade de Lisboa.
Hall, C.A.S., 1972. Migration and metabolism in a temperate stream
ecosystem. Ecology, 53(4), pp.585–604.
Hall, C.A.S., Balogh, S.B. & Murphy, D.J., 2009. What is the Minimum EROI
that a Sustainable Society Must Have? Energies, 2(1), pp.25–47. Available
at: http://www.mdpi.com/1996-1073/2/1/25/ [Accessed December 24,
2014].
Hall, C.A.S. & Kiltgaard, K.A., 2012. Energy and the Wealth of Nations.
Understanding the biophysical economy, New York: Springer.
Hall, C.A.S., Lambert, J.G. & Balogh, S.B., 2014. EROI of different fuels and
the implications for society. Energy Policy, 64, pp.141–152. Available at:
http://dx.doi.org/10.1016/j.enpol.2013.05.049.
Hall, C.A.S., Lavine, M. & Sloane, J., 1979. Efficiency of energy delivery
systems: I. An economic and energy analysis. Environmental
Management, 3, pp.493–504.
Harmsen, J.H.M., Roes, a. L. & Patel, M.K., 2013. The impact of copper
scarcity on the efficiency of 2050 global renewable energy scenarios.
Energy, 50(1), pp.62–73. Available at:
http://dx.doi.org/10.1016/j.energy.2012.12.006.
Herendeen, R.A., 2015. Connecting net energy with the price of energy and
other goods and services. Ecological Economics, 109, pp.142–149.
Available at:
http://linkinghub.elsevier.com/retrieve/pii/S0921800914003218.
Herendeen, R.A., 2004. Net Energy Analysis: Concepts and Methods.
Encyclopedia of Energy, pp.283–289.
IEA, 2015. Extended Energy Balances - OECD countries.
30
IEA, 2016. IEA Statistics: Frequently Asked Questions. Available at:
http://www.iea.org/statistics/resources/questionnaires/faq/#one.
IEA & Eurostat, 2005. Energy Statistics Manual, Paris. Available at:
http://scholar.google.com/scholar?hl=en&btnG=Search&q=intitle:Energy+
Statistics+Manual#6.
Kanoglu, M., Cengel, Y.A. & Dincer, I., 2012. Efficiency Evaluation of Energy
Systems, London: Springer.
King, C.W., 2015. Comparing World Economic and Net Energy Metrics, Part 3:
Macroeconomic Historical and Future Perspectives. Energies, 8(11),
pp.12997–13020.
King, C.W., Maxwell, J.P. & Donovan, A., 2015. ComparingWorld Economic
and Net Energy Metrics, Part 1: Single Technology and Commodity
Perspective. Energies, 8(11), pp.12949–12974.
King, C.W., Maxwell, J.P. & Donovan, A., 2015. ComparingWorld Economic
and Net Energy Metrics, Part 2: Total Economy Expenditure Perspective.
Energies, 8(11), pp.12975–12996.
Kostic, M.M., 2012. Energy: Physics. Encyclopedia of Energy Engineering and
Technology, 2, pp.808–823.
Kubiszewski, I., Cleveland, C.J. & Endres, P.K., 2010. Meta-analysis of net
energy return for wind power systems. Renewable Energy, 35(1), pp.218–
225. Available at: http://dx.doi.org/10.1016/j.renene.2009.01.012.
Kümmel, R., 2013. Why energy’s economic weight is much larger than its cost
share. Environmental Innovation and Societal Transitions, 9, pp.33–37.
Available at: http://dx.doi.org/10.1016/j.eist.2013.09.003.
Lambert, J.G. et al., 2014. Energy, EROI and quality of life. Energy Policy, 64,
pp.153–167. Available at:
http://linkinghub.elsevier.com/retrieve/pii/S0301421513006447 [Accessed
May 27, 2014].
Lambert, J.G., Hall, C.A.S. & Balogh, S.B., 2013. EROI of Global Energy
Resources. Status, Trends and Social Implications,
Leach, G., 1975. Net energy analysis - is it any use? Energy Policy, 3(4),
pp.332–344.
Lenzen, M. et al., 2013. Building Eora: A Global Multi-Region Input-Output
Database At High Country And Sector Resolution. Economic Systems
Research, 25(1), pp.20–49. Available at:
http://dx.doi.org/10.1080/09535314.2013.769938.

31
Murphy, D.J. et al., 2011. Order from Chaos: A Preliminary Protocol for
Determining the EROI of Fuels. Sustainability, 3(12), pp.1888–1907.
Available at: http://www.mdpi.com/2071-1050/3/10/1888/ [Accessed
February 5, 2015].
Murphy, D.J. & Hall, C.A.S., 2011. Energy return on investment, peak oil, and
the end of economic growth. Annals of the New York Academy of
Sciences, 1219, pp.52–72. Available at:
http://www.ncbi.nlm.nih.gov/pubmed/21332492 [Accessed December 16,
2014].
Murphy, D.J. & Hall, C.A.S., 2010. Year in review--EROI or energy return on
(energy) invested. Annals of the New York Academy of Sciences, 1185,
pp.102–18. Available at: http://www.ncbi.nlm.nih.gov/pubmed/20146764.
ONS, 2014. Supply and Use Tables. Available at:
http://www.ons.gov.uk/ons/taxonomy/index.html?nscl=Supply+and+Use+
Tables.
Peet, N.J. et al., 1987. Energy supply and net energy in New Zealand. Energy
Policy, 15(3), pp.239–248.
Raugei, M., Fullana-i-Palmer, P. & Fthenakis, V., 2012. The energy return on
energy investment (EROI) of photovoltaics: Methodology and comparisons
with fossil fuel life cycles. Energy Policy, 45, pp.576–582. Available at:
http://dx.doi.org/10.1016/j.enpol.2012.03.008.
Raugei, M. & Leccisi, E., 2016. A comprehensive assessment of the energy
performance of the full range of electricity generation technologies
deployed in the United Kingdom. Energy Policy, 90, pp.46–59. Available
at: http://linkinghub.elsevier.com/retrieve/pii/S0301421515302226.
Roberts, F., 1978. The aims, methods and uses of energy accounting. Applied
Energy, 4(3), pp.199–217.
Rosen, M.A., 2006. Benefits of exergy and needs for increased education and
public understanding and applications in industry and policy - Part I:
Benefits. International Journal of Exergy, 3(2), pp.202–218. Available at:
http://www.inderscience.com/link.php?id=9047.
Rosen, M.A., 2002. Energy crisis or exergy crisis? Exergy, An International
Journal, 2(3), pp.125–127. Available at:
http://linkinghub.elsevier.com/retrieve/pii/S1164023502000560.
Sciubba, E. & Wall, G., 2007. A brief Commented History of Exergy From the
Beginnings to 2004. International Journal of Thermodynamics, 10(1),
pp.1–26.

32
Smith, D.M., 1960. The yield and energy content of milk and the energetic
efficiency of sows on different levels of nutrition during gestation and
lactation. New Zealand Journal of Agricultural Research, 3(July 2015),
pp.745–763.
Wall, G., 1986. Exergy – a useful concept. Chalmers University of Technology,
Göteborg, Sweden. Available at: http://www.exergy.se/ftp/introduction.pdf.
Wall, G., 1977. Exergy - a useful concept within resource accounting, Göteborg,
Sweden. Available at: http://www.exergy.se/ftp/paper1.pdf.
Wall, G., 2003. Exergy tools. Proceedings of the Institution of Mechanical
Engineers, Part A: Journal of Power and Energy, 217(2), pp.125–136.
Available at:
http://pia.sagepub.com/lookup/doi/10.1243/09576500360611399
[Accessed March 21, 2014].
Warr, B. et al., 2010. Energy use and economic development: A comparative
analysis of useful work supply in Austria, Japan, the United Kingdom and
the US during 100years of economic growth. Ecological Economics,
69(10), pp.1904–1917. Available at:
http://linkinghub.elsevier.com/retrieve/pii/S0921800910001175 [Accessed
June 26, 2014].
Williams, E., Warr, B. & Ayres, R.U., 2008. Efficiency dilution: long-term exergy
conversion trends in Japan. Environmental science & technology, 42(13),
pp.4964–70.
Wright, D.J., 1974. Goods and services: an input-output analysis. Energy
Policy, (December), pp.307–315.