Developing an In-season Predictor of Commercial Landings ...
104
University of South Florida Scholar Commons Graduate eses and Dissertations Graduate School 5-1-2014 Developing an In-season Predictor of Commercial Landings for Quota Monitoring in the U.S. Virgin Islands Mary Janine Vara University of South Florida, [email protected] Follow this and additional works at: hps://scholarcommons.usf.edu/etd Part of the Aquaculture and Fisheries Commons , and the Other Languages, Societies, and Cultures Commons is esis is brought to you for free and open access by the Graduate School at Scholar Commons. It has been accepted for inclusion in Graduate eses and Dissertations by an authorized administrator of Scholar Commons. For more information, please contact [email protected]. Scholar Commons Citation Vara, Mary Janine, "Developing an In-season Predictor of Commercial Landings for Quota Monitoring in the U.S. Virgin Islands" (2014). Graduate eses and Dissertations. hps://scholarcommons.usf.edu/etd/5142
Transcript of Developing an In-season Predictor of Commercial Landings ...

University of South FloridaScholar Commons
Graduate Theses and Dissertations Graduate School
5-1-2014
Developing an In-season Predictor of CommercialLandings for Quota Monitoring in the U.S. VirginIslandsMary Janine VaraUniversity of South Florida, [email protected]
Follow this and additional works at: https://scholarcommons.usf.edu/etd
Part of the Aquaculture and Fisheries Commons, and the Other Languages, Societies, andCultures Commons
This Thesis is brought to you for free and open access by the Graduate School at Scholar Commons. It has been accepted for inclusion in GraduateTheses and Dissertations by an authorized administrator of Scholar Commons. For more information, please contact [email protected].
Scholar Commons CitationVara, Mary Janine, "Developing an In-season Predictor of Commercial Landings for Quota Monitoring in the U.S. Virgin Islands"(2014). Graduate Theses and Dissertations.https://scholarcommons.usf.edu/etd/5142

Developing an In-season Predictor of Commercial Landings for Quota Monitoring
in the U.S. Virgin Islands
by
Mary Janine Vara
A thesis submitted in partial fulfillment of the requirements for the degree of
Master of Science with a concentration in Marine Resource Assessment
Department of Marine Science College of Marine Science
University of South Florida
Major Professor: Mark E. Luther, Ph.D. William S. Arnold, Ph.D.
Steven A. Murawski, Ph.D.
Date of Approval: March 28, 2014
Keywords: Commercial Catch Reports, Annual Catch Limit, Accountability Measures, Small-scale Fisheries
Copyright © 2014, Mary Janine Vara

Acknowledgments I would first like to thank my committee for their time and support: Dr. Mark Luther (USF CMS), Dr. Steve Murawski (USF CMS), and Dr. William S. Arnold (NMFS SERO Caribbean Branch Chief); Phil Steele (NMFS SERO ARA for Sustainable Fisheries), who presented this amazing opportunity to me at NOAA Fisheries; Andy Strelcheck, Dr. Jessica Stephen and Dr. Nicholas Farmer (NMFS SERO LAPP/DA branch), whose input from many discussions eventually led to the methods we used for this model. They also taught me some of the intricacies of data entry and analysis and all of the software I used for this project. Their time and patience is much appreciated; Juan Cruz (USVI DPNR) spent many long hours with me over the phone discussing the 2010-2011 data during the data entry process, and I would like to thank him for his time; And I would also like to mention Todd Gedamke and Josh Bennett (NOAA SEFSC), both of whom discussed this project with me during the beginning stages of this project.

i
Table of Contents
List of Tables ...................................................................................................................... iii List of Figures ...................................................................................................................... v Abstract.............................................................................................................................. vii Chapter One: Introduction .................................................................................................. 1
Federal Fisheries Management and Policy .............................................................. 1 History and Management of Fisheries in the United States Virgin Islands ........... 2 Limitations, Recent Approaches and Dependence on Fishermen’s Reports .......... 8 Value and Application of an In-season Predictive Model ..................................... 12 Tables and Figures ................................................................................................. 14
Chapter Two: Data Collection and Methods ...................................................................... 17
2010-2011 Commercial Catch Reports ................................................................... 17 1998-2012 Historical Commercial Landings Data ................................................ 18 Species Groups Used in the Predictive Model ....................................................... 19 Summary of Predictive Model................................................................................ 20 Step 1: Accounting for Late Reporting ................................................................... 21 Step 2: Retrospective Test of Model Performance Using Expansion Factors ....... 22 Step 3: In-season Projections................................................................................. 28 Tables and Figures ................................................................................................. 32
Chapter Three: Results ...................................................................................................... 35
Accounting for Late-Reporting .............................................................................. 35 Retrospective Test of Model Performance Using Expansion Factors ................... 38 In-Season Projections ............................................................................................ 42 St. Thomas/St .John Snapper Predictions ............................................................ 43 St. Thomas/St. John Lobster Predictions .............................................................. 44 St. Croix Parrotfish Predictions ............................................................................. 45 St. Croix Lobster Predictions ................................................................................. 46 Tables and Figures ................................................................................................. 47
Chapter Four: Summary and Discussion .......................................................................... 76
Accounting for Late-Reporting .............................................................................. 76 Retrospective Test of Model Performance Using Expansion Factors ................... 77 In-season Projections and Predictive Capability ................................................... 79

ii
Variability among Fishing Years ............................................................................ 81 References ......................................................................................................................... 88 Appendix A: Acronyms...................................................................................................... 93 Appendix B: Model Flow Chart ......................................................................................... 94

iii
List of Tables
Table 1. Annual Catch Limits (ACL) for the USVI in pounds, whole weight ................................ 14
Table 2. Date variable definition table and describes the important variables used and created during the modeling process ........................................................................................................ 32
Table 3. The total fishermen on each island for the 2010-2011 fishing year who submitted commercial catch reports forms to the DPNR. ............................................................................. 34
Table 4: Data subsets used in the predictive model ..................................................................... 34 Table 5. Total landings (lb) for 18 species groups in St. Thomas/St. John and St. Croix during the 2010-2011 fishing year. ........................................................................................................... 47 Table 6. Total trips, landings (lb), and fishermen by fishing month in the 2010-2011 fishing year for snapper in St. Thomas/St. John. ............................................................................................. 48 Table 7. Total trips, landings (lb), and fishermen by fishing month in the 2010-2011 fishing year for lobster in St. Thomas/St. John. .............................................................................................. 48 Table 8. Total trips, landings (lb), and fishermen by fishing month in the 2010-2011 fishing year for parrotfish in St. Croix. ............................................................................................................. 49 Table 9. Total trips, landings (lb), and fishermen by fishing month in the 2010-2011 fishing year for lobster in St. Croix ................................................................................................................... 49 Table 10. Percent of fishing trips submitted to the DPNR (Received%) for each fishing month by the cut-off date for St. Thomas/St. John snapper ........................................................................ 50 Table 11. Percent of fishing trips submitted to the DPNR (Received%) for each fishing month by the cut-off date for St. Croix parrotfish. ....................................................................................... 50 Table 12. Percent of fishing trips submitted to the DPNR (Received%) for each fishing month by the cut-off date for St. Croix lobster. ............................................................................................. 51 Table 13. Percent of fishing trips submitted to the DPNR (Received%) for each fishing month by the cut-off date for St. Thomas/St. John lobster. .......................................................................... 51 Table 14. Adjustment percentages (Adjustment%) by cut-off date and fishing month for St. Thomas/St. John snapper. ........................................................................................................... 52

iv
Table 15. Adjustment percentages (Adjustment%) by cut-off date and fishing month for St. Croix parrotfish. ..................................................................................................................................... 52 Table 16. Adjustment percentages (Adjustment%) by cut-off date and fishing month for St. Croix lobster. .......................................................................................................................................... 53 Table 17. Adjustment percentages (Adjustment%) by cut-off date and fishing month for St. Thomas/St. John lobster. ............................................................................................................. 53 Table 18. The total number of fishermen who reported landings, and the total fishing trips, and the total commercial landings, for all fishing years in the USVI. ................................................. 54 Table 19. For each island group, the total landings (lb) and total fishing trips by fishing year and Species Group. .............................................................................................................................. 55 Table 20. Example of summary statistics, providing the mean value of landings for each fishing month of the total bootstrap sequence. ........................................................................................ 56 Table 21. Example of summary statistics for the total pounds landed by fishing month for a specified fishing year. ................................................................................................................... 56 Table 22. Example of summary statistics generated for the average historical cumulative percent of landings by fishing month for a fishing year, including the mean, standard deviation, upper and lower confidence 95% interval and ranges. ............................................................................ 57

v
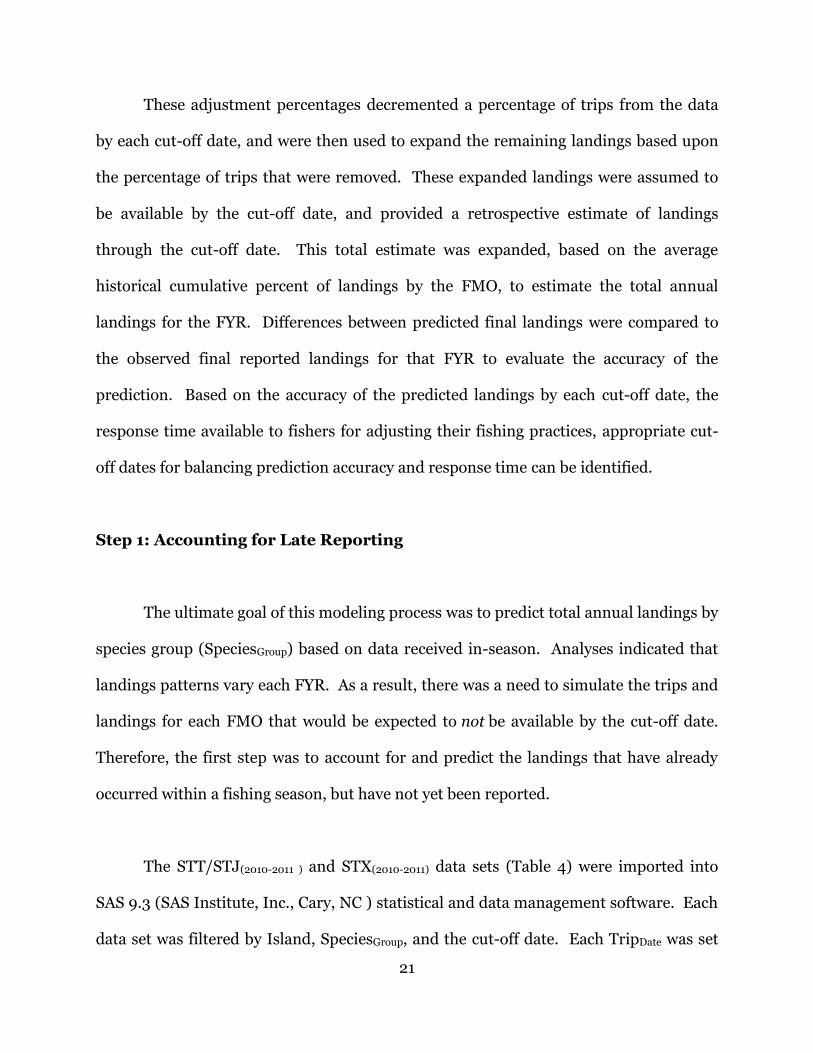
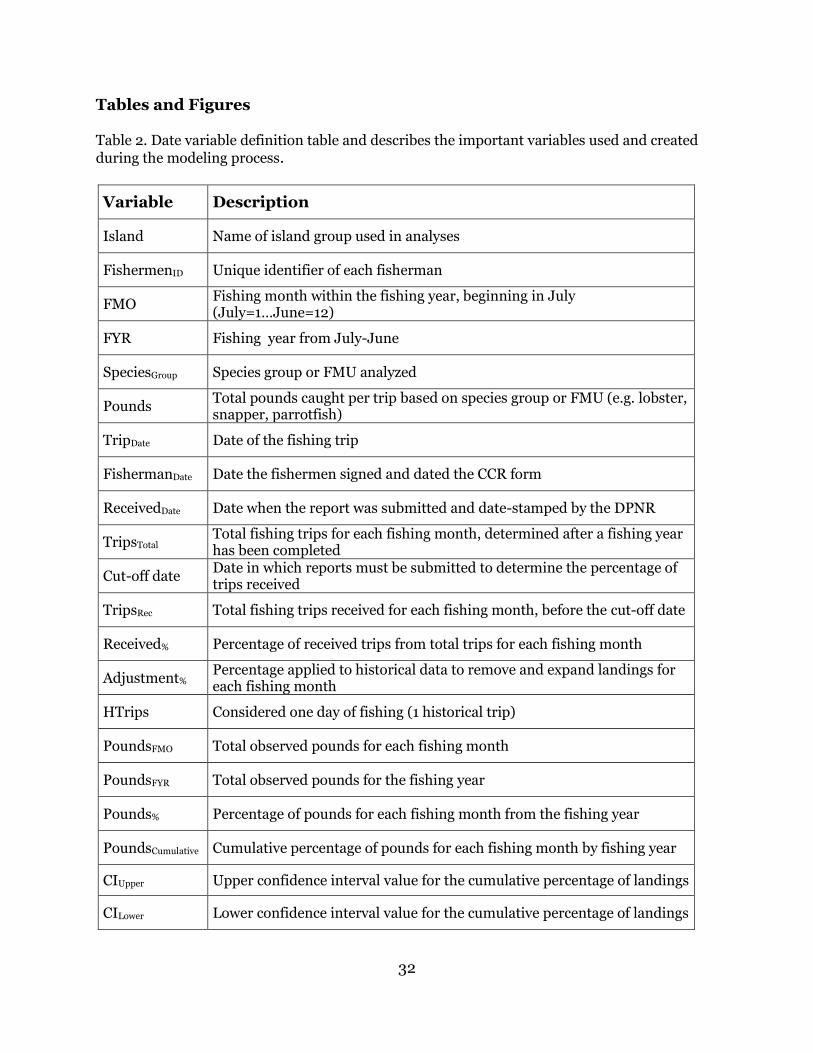
List of Figures Figure 1. Map showing the islands of St.Thomas, St.John, and St. Croix, in the U.S. Virgin Islands. Basemap courtesy ESRI Ocean Basemap. ....................................................................... 15 Figure 2. The commercial catch report form required by the USVI Department of Planning and Natural Resources. ......................................................................................................................... 16 Figure 3. Total historical fishing trips by fishing year for St. Croix parrotfish and lobster. ........ 58 Figure 4. Total historical landings (1x10³ lb) by fishing year for St. Croix parrotfish and lobster........................................................................................................................................................ 59 Figure 5. Total historical fishing trips by fishing year for St. Thomas/St. John snapper and lobster. .......................................................................................................................................... 60 Figure 6. Total historical landings (1x10³ lb) by fishing year for St. Thomas/St. John snapper and lobster. ........................................................................................................................................... 61 Figure 7. Confidence interval range of predicted landings (lb) to determine the ideal number of bootstrap sample runs for St. Croix parrotfish. ............................................................................ 62 Figure 8. Confidence interval range of predicted landings (lb) to determine the ideal number of bootstrap sample runs for St. Thomas/St. John snapper............................................................. 62 Figure 9. Confidence interval range of predicted landings (lb) to determine the ideal number of bootstrap sample runs for St. Croix lobster. ................................................................................. 63 Figure 10. Confidence interval range of predicted landings (lb) to determine the ideal number of bootstrap sample runs for St. Thomas/St. John lobster. ............................................................. 63 Figure 11. Cumulative historical percent of landings (%), averaged by fishing month over 12 fishing years, for St. Thomas/St. John Snapper. .......................................................................... 64
Figure 12. Absolute Percent Error of the mean predictions for all five of the cut-off dates, averaged across each fishing year, and expressed as a percentage for St. Thomas/St. John snapper. Error bars represent 95% confidence intervals. ........................................................... 65 Figure 13. Absolute Percent Error of the mean predictions for all five of the cut-off dates, averaged across each fishing year, and expressed in pounds for St. Thomas/St. John snapper. Error bars represent 95% confidence intervals. ........................................................................... 66

vi
Figure 14. Cumulative Historical Percent of Landings (%) averaged over 12 fishing years by fishing month, for St. Thomas/St. John Lobster. ......................................................................... 67 Figure 15. Absolute Percent Error of the mean predictions for all five of the cut-off dates, averaged across each fishing year, and expressed as a percentage for St. Thomas/St. John lobster. Error bars represent 95% confidence intervals. ............................................................. 68 Figure 16. Absolute Percent Error of the mean predictions for all five of the cut-off dates, averaged across each fishing year, and expressed in pounds for St. Thomas/St. John lobster. Error bars represent 95% confidence intervals. ........................................................................... 69 Figure 17. Cumulative Historical Percent of Landings (%), averaged over 14 fishing years by fishing month, for St. Croix Parrotfish. ........................................................................................ 70 Figure 18. Absolute Percent Error of the mean predictions for all five of the cut-off dates, averaged across each fishing year, and expressed as a percentage for St. Croix parrotfish. Error bars represent 95% confidence intervals. ...................................................................................... 71
Figure 19. Absolute Percent Error of the mean predictions for all five of the cut-off dates, averaged across each fishing year, and expressed in pounds for St. Croix parrotfish. Error bars represent 95% confidence intervals. ............................................................................................. 72
Figure 20. Cumulative Historical Percent of Landings (%) averaged over 14 fishing years by fishing month, for St. Croix Lobster. ............................................................................................ 73
Figure 21. Absolute Percent Error of the mean predictions for all five of the cut-off dates, averaged across each fishing year, and expressed as a percentage for St. Croix lobster. Error bars represent 95% confidence intervals. ..................................................................................... 74
Figure 22. Absolute Percent Error of the mean predictions for all five of the cut-off dates, averaged across each fishing year, and expressed in pounds for St. Croix lobster. Error bars represent 95% confidence intervals. .............................................................................................. 75

vii
Abstract
The lack of timely reporting of commercial fisheries landings interferes with
effective management of fisheries in United States Virgin Islands (USVI). Federal law
requires that landings be limited to prevent annual catch limits (ACLs) from being
exceeded. Previous attempts to predict total landings have used historic data from prior
fishing seasons to predict future landings rather than leveraging available in-season
data to provide a more real-time prediction of landings. This study presents an in-
season model that predicts total landings using partial reports from the current fishing
year. This estimate of total landings, including error bounds around that estimate, can
then be compared to the ACL established for the species to estimate potential deviations
from the allowable landings and adjust effort accordingly. The performance of the
model was tested in a retrospective analysis on historical commercial landings data.
Differences between predicted and observed fishing year landings by defined cut-off
dates were used to identify reasonable deadlines for fishery managers to begin making
reliable predictions on total annual landings. On average, predictions can be made with
less than 9% error with at least four months of partial data, and with less than 5% error
with at least seven months of partial data. This model’s in-season predictions should be
useful to managers to prevent ACL overages, and to guide fishers in their application of
effort within and among components of the fishery, for example, to shift effort from one
fishery management unit to another in response to excessive landings.

1
Chapter One: Introduction
Federal Fisheries Management and Policy
The Magnuson Fishery Conservation and Management Act (FCMA) was enacted
in 1976 to improve management and conservation of marine fisheries. As a component
of the Act, the U.S. Exclusive Economic Zone (EEZ) was extended to a 200-mile-
jurisdiction with the intention of regulating foreign fishing fleets off our nation’s coasts
(NMFS, 2007), consequently aiding access by and growth of the domestic fishing
industry. Eight Regional Fishery Management Councils (RFMCs) were established to
address regionally specific management needs by developing Fishery Management
Plans (FMPs) and management measures for each federally managed species or species
complex within their jurisdiction. Through the Secretary of Commerce, the National
Marine Fisheries Service (NMFS), the lead federal agency that regulates marine fisheries
in waters bordering the United States, implements those management measures
(NMFS, 2007).
After the most recent amendment occurred in 2006, the FCMA is currently
known as the Magnuson-Stevens Fishery Conservation and Management
Reauthorization Act (MSRA). The MSRA established new requirements to end or
prevent overfishing with the addition of management measures such as Annual Catch
Limits (ACLs) and Accountability Measures (AMs). An ACL is the level of annual catch

2
of a species or species complex allowed in a given year. Determining an overfishing
limit (OFL) is the first of a multi-step process in determining ACLs for each FMP.
Overfishing occurs when a stock is being depleted too quickly, and an overfished
condition occurs when the stock falls below a specific threshold so that it cannot
maintain maximum sustainable yield (NMFS, 2009). Fishery managers are responsible
for monitoring the fishery, and when either problem occurs, they must put measures
into place to adjust the imbalance of fishing, while accounting for the needs of the
economy (Cooper, 2006). When an ACL is exceeded, AMs are triggered to account for
any overage of fishing. Preventative in-season AMs may include closing a fishery early,
or imposing gear restrictions or trip limits. Corrective post-season AMs may include
shortening the harvest season to ensure the ACL is not exceeded, repeatedly1. New
requirements of the MSRA specified that for every FMP, regardless of the type or quality
of data used to calibrate these management measures, ACLs and AMs must be
established by 2010 for fish stocks undergoing overfishing, and by 2011 for all others
(NMFS, 2009).
History and Management of Fisheries in the United States Virgin Islands
The U.S. Caribbean includes the Commonwealth of Puerto Rico (PR), and the
territory of the U.S. Virgin Islands (USVI) (comprised of the three main islands- St.
Thomas, St. John, and St. Croix, and a number of smaller islands), which were acquired
1 Due to the time lag between harvest and AM application, the SEFSC and Caribbean Council’s Scientific and Statistical Committee review the data and determines whether AMs should be implemented, based on the improvement in data collection or an increase in landings.

3
by the Unites States in 19172. Collectively with the NMFS, the Caribbean Fishery
Management Council (CFMC), located in San Juan, PR, regulates fisheries through
FMPs for the federal waters surrounding the U.S. Caribbean. These waters extend from
the nine-mile seaward boundary of PR and the three-mile seaward boundary of the
territory of the USVI, to 200 nautical miles (nm) offshore (Figure 1). The USVI fisheries
follow separate territorial regulations for territorial waters from 0-3 nm offshore, with
the responsibility of regulation and enforcement vested in the Department of Planning
and Natural Resources (DPNR) (DPNR, 2012). Hence, effective management and data
collection of the USVI fisheries is a shared effort between NMFS and the DPNR.
Management of the USVI must consider the requirements of the MSRA to ensure
sustainable fisheries and the requirements to maintain healthy fishing communities,
many of which are dependent on fish for subsistence. Hence, there is significant
socioeconomic and ecological importance to maintaining sustainable fisheries (Adams,
1996; MRAG, 2004; Salas et al., 2007; Valdés-Pizzini et al., 2010; Heyman and
Granados-Dieseldorff, 2012). However, many political issues complicate and hinder
successful data collection and fisheries management efforts in the USVI. The limited
funding and personnel, technology, and appreciation for the necessity of management,
all inhibit the fisher’s tendency to comply with regulations and report in a timely
manner.
2 In the USVI, St. Thomas (STT) and St. John (STJ) are grouped together (STT/STJ) for management purposes, and the islands of St. Croix (STX) and PR are managed separately. There are many other small islands in the USVI archipelago, but for the purposes of this study, only the main islands of the USVI are considered.

4
The USVI fisheries are small-scale (i.e., ‘artisinal’), and fishers include
participants from a diversity of cultural and economic backgrounds (Beets, 1997; Salas
et al., 2007; Grace-Mccaskey, 2012; Heyman and Granados-Dieseldorff, 2012;). A
demographic review of fishers (Kojis, 2004) was conducted of over 200 licensed
commercial fishermen in the USVI between 2003 and 2004. The results provide
important information that can be used to analyze the characteristics of USVI
commercial fisher’s activity, and the socioeconomic impacts from any implemented
management measures (Impact Assessment, Inc., 2007). Fishers target a wide variety
of species including shellfish (e.g. Panulirus argus and Strombus gigas) and reef and
pelagic species groups (e.g. Serranidae, Lutjanidae, Scaridae, Haemulidae,
Acanthuridae, Balistidae, Sparidae, Carangidae, Pomacanthidae, and Ostraciidae).
Fishers also utilize vessels typically ranging from 16-20 feet in length or up to 35 feet for
off-shore pelagic fishing. This multi-species, multi-gear (i.e., traps, line, nets, spear)
approach responds to seasonal variability and fluctuating abundances of target species,
and creates difficulties in evaluating the condition of the resources and the total fishing
effort exerted by each fleet (Kojis, 2004; Heyman and Granados-Dieseldorff, 2012).
Fishing primarily takes place during the day, and most fishers make two to four fishing
trips per week, each of which can last more than 9 hours when the time necessary to sell
their catch is included. For the island group STT/STJ, fishing supplies more than half of
the total (from all sources) income for 75% of its fishermen, compared to 50% of
fishermen in STX. The majority (74%) of fishermen in STT/STJ expected to remain in
their trade for the rest of their lives, in comparison to 41% for STX.

5
In the USVI, fishery-dependent data are obtained through records (logbooks)
submitted by the fishers. Since 1972, commercial fishermen are required to keep
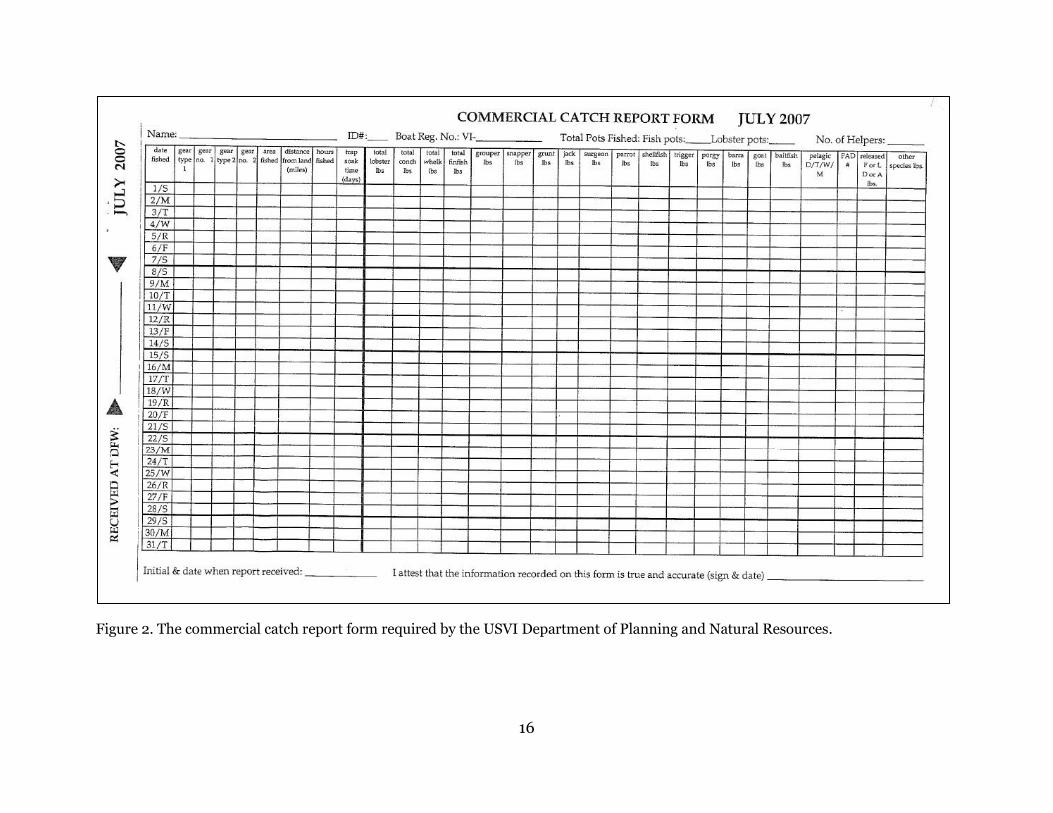
records of data, recorded on Commercial Catch Report (CCR) forms (Figure 2) (Valle-
Esquivel and Diaz, 2004). Each USVI fishing year begins in July, and ends in June of
the following year3. A separate CCR form is completed and submitted for each month of
the fishing year. Each form includes information about the fisherman and vessel (name,
DPNR fishing license, vessel registration), date and location of each fishing trip (day of
month, fishing zone, distance from land), and fishing effort (number of crew, hours
fished, soak time, species caught, species discarded, and the type of gear(s) used). The
main types of gear utilized in the USVI to harvest reef and pelagic fish, and shellfish,
include traps (or fish pots), nets (seine nets and cast nets), spear gun, and traditional
hook-and-line.
Commercial fishers are required to submit a full complement of monthly CCR
forms for the 12-month fishing year before they are allowed to renew their annual
fishing permit. By statute, forms are required to be submitted within 15 days after the
end of each month, regardless of fishing activity (e.g. no fishing for that month). Forms
must be dated and signed by the fisherman and are date-stamped by the receiving
DPNR agent (DPNR, 2012; CFMC, 2011a). The fisherman may only receive a fishing
license for the new (July-June) fishing year if all of the reports have been submitted,
even if they were submitted late. The fishing permit costs $5.00/year for pot, trap, or
net gears. If the fishermen is selling or trading catch, they must also purchase a
3 Analysis is based on the July-June fishing year, although the Calendar/Management year is January-
December (Holt and Uwate, 2004).

6
$1.00/year business license. (Valle-Esquivel and Diaz, 2004; DPNR, 2012).
Commercial permits are not required in USVI federal waters.
DPNR staff enter the data from the CCR forms into a Microsoft Access®
database, and provide this information to the Southeast Fisheries Science Center
(SEFSC) for data quality assurance and statistical analysis. The Southeast Data,
Assessment and Review (SEDAR) panel includes this data for fishery stock assessments
and to estimate annual catch in the fishery. Historic data from commercial landings
reports were used by the CFMC and NMFS to formulate ACLs. Annual landings data are
monitored to ensure compliance with ACL restrictions and to guide development of AMs
as necessary.
Since the 1974 inception of fisher reporting in the USVI, in a continuing effort to
improve the accuracy and utility of the reported data, many changes have been
incorporated into the CCR forms (Messineo, 2004; McCarthy and Gedamke, 2008;
SEDAR, 2009; CFMC, 2011a). Most noteworthy was the development, beginning in
1994, of new USVI reporting forms that met requirements to report landings by species
or group (i.e., fishery management unit (FMU4)), to estimate fishing effort by gear type,
and to report the time (in hours) fished during each fishing trip. However, it was not
until 1998 (STX) and 2000 (STT/STJ) that use of these new data forms was fully
4 Species/Species group, complex or FMU. Species-specific landings data are not available for
commercial catch data in the USVI. Species groups or complexes are determined by gear, method of capture and depth (SEDAR, 2009). ACLs can apply to a species (e.g. spiny lobster) or to a group of species (parrotfishes, snappers). ACLs are based on average landings according to a specified time sequence, and adjusted down for scientific and management uncertainty.

7
implemented and landings were reported by species or species group with sufficient
reliability (Messineo, 2004; SEDAR 2009, Grace-Mccaskey, 2012).
In 2001, a moratorium on issuance of new commercial fishing permits was
implemented in the USVI by the DPNR. This was found to be generally favored among
full-time commercial fishers (MRAG, 2004). In 2005, the Comprehensive Amendment
to the Fishery Management Plans of the U.S. Caribbean redefined the FMUs for the
FMPs, established seasonal closures, and imposed gear restrictions and requirements
(CFMC, 2005). The 2010 Caribbean Annual Catch Limit Amendment, applied to all
federal waters in the U.S. Caribbean, established ACLs and AMs for species or species
groups that were undergoing overfishing, (e.g. snapper, grouper, queen conch, and
parrotfish) (76 FR 82404;Valle-Esquivel and Diaz, 2004; CFMC, 2011a). The 2011
Caribbean ACL Amendment established ACLs and AMs for a number of species that
were unassessed. For both the 2010 and 2011 groups, the various ACLs for each FMP in
the U.S. Caribbean are established separately for each of the three island groups. The
four FMPs in the USVI include 1) Spiny Lobster, 2) Reef fish, 3) Coral and Reef
Associated Plants and Invertebrates, and 4) Queen Conch (CFMC, 2011b, Heyman and
Granados-Dieseldorff, 2012). Each island has an ACL assigned (with a few exceptions)
for each FMU (Table 1). If the ACL is exceeded based on combined state and federal
landings, AMs are applied, but only in federal waters under the jurisdiction of the
CFMC. If it is determined by the Council’s Scientific and Statistical Committee, in
consultation with the SEFSC, that the overage is due to enhanced reporting rather than
to an actual increase in landings, then AMs are not applied. Because recreational
landings data are not presently available in the USVI, ACLs for that sector are not set.

8
Instead, if the commercial ACL for that species or group is exceeded, the AM is applied
to both the commercial and recreational sectors (76 FR 82414; McCarthy and Gedamke,
2008; CFMC, 2011b).
Limitations, Recent Approaches and Dependence on Fishermen’s Reports
Although there have been many changes made to CCR forms to improve the
information obtained, there are still persistent challenges that limit the process of data
collection and analysis. Martens (2004) outlined the distinguishing influences on the
limitations of fisheries management in the USVI: 1) The ‘Western-style’ approach, which
is analogous to United States federal fisheries management and policy, and applied to
small-scale fisheries; 2) Limited funding and personnel to maintain and enforce this
approach, creating issues with subsequent implementation of management measures;
and 3) Due to the repetitive adjustment in regulations, the behavior and participation of
the fishermen ultimately results in a lack of useful and reliable data.
In the continental U.S., observers are employed aboard fishing vessels to verify
catch, and portside sampling is conducted by enforcement agents or government
scientists to provide a complementary census of catch, to verify regulatory compliance,
to verify catch estimates obtained from fisher logs, and also to take biological samples to
evaluate size, age and maturity of the catch. Additionally, seafood dealers are an
additional conduit through which commercial catch is routed and to collect required
catch data.

9
Dockside sampling to validate reported catch in the USVI is inconsistent and
commonly inadequate (McCarthy and Gedamke, 2008). There is no dealer sector in the
USVI. Processing and distribution points are diffuse and, thus, harvest data are not
recorded as the fish are landed or being sold. Additionally, there are numerous remote
landing sites on each island, and fishers often sell their catch wherever they have the
opportunity to do so (Kojis, 2004; Salas et al., 2007). Some fishers are meticulous in
recording their catch, grouping by species or species group and accurately determining
the total weight of each group. Other fishers provide only a rough estimate of their
catch and fishing activity, commonly estimating catch while fishing or while sorting
their catch for customers, in either case with variable levels of accuracy among fishers.
A smaller group of fishers apparently report with a minimal level of veracity, if they
report at all (Salas et al, 2007). Currently, the only accessible data from CCR forms are
the fisherman’s total reported weight and basic information on the type of fish caught,
fishing effort (# of trips and trip duration), and a general location of fishing. These data
are poorly validated.
Since the mandatory catch reporting system was initiated nearly 40 years ago, it
has evolved from an annual report to the current detailed monthly reports (figure 2).
Due to the lack of consistent monitoring programs, personnel, and enforcement to
ensure precise and accurate historical information and CCR formats, data used to
develop FMP regulations depends largely on voluntary compliance by the fishermen
themselves. Some USVI fishers that have been interviewed have admitted that they fill
out the CCR forms just before renewing their license in July, based on estimation of
10
their catch throughout the year, rather than completing the reports following each
fishing event (Grace-Mccaskey, 2012). Two factors contribute to time lags in the
reported data: 1) the amount of time that elapses between when the fisher returns from
a fishing trip, sells his (or her) catch, records the data on the CCR forms, and submits
the form to the DPNR, and 2) the time lag between when the DPNR receives each
monthly report from each fisher and when the DPNR staff are able to digitally enter the
data and deliver the resultant files to the SEFSC for analysis and application.
Historically, the total time lag from when the fish are landed to the availability of the
data has been approximately 1-2 years5. Consequently, an ACL overage may occur
during the time lag between harvest and application of post-season AMs (Ralston et al.,
2011).
There have been a number of efforts to extrapolate total catches from available
data, but these efforts have used historic data to predict future landings rather than
using in-season data to predict the total for that year; therefore, these efforts have not
successfully provided the means to make in-season predictions necessary to assure ACLs
are not exceeded. Hypothetically, if all of the reports were submitted on-time, and
landings were relatively consistent from month to month among years, a simple linear
regression could be used at a specified time of year (observed events) to predict the total
annual landings (unobserved events) for a fishing year (Hinton, 2003); however, all of
the reports for each fishing month are not submitted by the required deadline
throughout the fishing year, and therefore, all observed events are not available.
5 The time lag of submitting reports can reach many months after the end of the actual fishing year. The total time-lag/turnaround was less than one year for landings data acquired during the 2011-2012 fishing year.

11
Esquivel and Díaz (2004) developed two expansion factors to estimate total
landings from reported landings by island or island group. The first expansion factor
was derived from the ratio of the number of licensed fishermen to the number of
reporting fishermen. The second expansion factor was based on the ratio of the number
of reports received to the possible number of reports (equal to 12 months times the
number of reporting fishers). Using these expansion factors, total landings could be
adjusted to account for reporting failures. However, data to calculate these ratios were
limited, and the assumption that every fisherman consistently fish and catch the same
amount every month may increase uncertainty and overestimate landings.
McCarthy and Gedamke (2008) summarized available data in the USVI, and
assessed and evaluated which methods and approaches might be most appropriate
within the context of the available data. The summary showed that data from USVI
commercial landings trip tickets dating back to 1974 has changed many times and is
often defined by a mix of gear type and/or species group. This brief analysis on USVI
fisheries data showed that minimal surveys have been implemented in the past, and the
information that can be attained from the data differs from year to year.
Kaiser (2010) used data compiled from CCR forms in the USVI to estimate total
catch by species for a population (where ‘population’ is defined as a fishery by island
group). Using a sample of trips with known catch of a species with an observed gear
type, a set of trips were sampled for estimation of gear use, and subsampled for the
probability of non-zero catch. The estimator was applied to the observed total catch of a
species, and then its performance was assessed based on a more basic, ‘survey sampling’

12
estimator. Both estimators came within 5% of the true value, although in one example,
both estimators underestimated the total catch. The implications showed that historical
data could be used to estimate the total catch of a species in future fishing years, as well
as estimating catch based on gear type; however, uncertainty must be considered when
estimating population size and the resulting catch. Kaiser pointed out that the known
population size and total number of trips, based on gear types, was necessary for the
application of this model. Kaiser recommended that future sampling designs utilize
bootstrapping methods to produce an estimate of total catch, and variance around the
estimate.
Value and Application of an In-season Predictive Model
The USVI data contains incomplete (late or not reported) and inadequate (under
or mis-reported) data records that are not available until well past the end of the fishing
season (Rogers and Beets, 2001). The former necessitates the development of an in-
season predictive model that effectively forecasts annual landings for a species or group
prior to the end of the fishing season. An in-season predictive model will allow fishers
to reallocate effort to ensure all components of their fisheries are fully (but not overly)
exploited. The latter requires that adjustments be incorporated to account for flawed
reporting by fishers. This strategy may help to avoid or minimize ACL overruns and
avoid suffering consequential post-season AMs.
13
In this study, the ultimate goal was to create an in-season predictor of
commercial landings. Available landings data that are available are used to seed an in-
season estimator of annual landings. In step one, I evaluated an in-season estimator of
annual catch information based on one year of data when catch and submittal dates are
known, developing expansion factors to quantify patterns in late reporting of CCR
forms. Step two tested the utility of the expansion approach by applying the expansion
factors to historic fishing years. The expansion factors are applied to historical landings
data to account for trips and landings that have already occurred within a fishing season
but have not yet been submitted, expanding the available reports to estimate the total
landings at selected points in the fishing year (i.e., ‘cut-off dates’). This approach
quantified the error associated with projections of total annual landings at each cut-off
date considered. In step three, estimated landings through the cut-off date were applied
to make an in-season prediction for total annual landings. The predicted annual
landings were then compared to the observed annual landings to evaluate model
performance.

14
Tables and Figures
Table 1. Annual Catch Limits (ACL) for the USVI in pounds, whole weight6, for the species groups used in this study. Accountability Measures are applied in federal waters if the ACL is exceeded.
Species Group St. Thomas/St. John St. Croix
Parrotfish 42,500 240,000
Snapper 133,775 102,946
Spiny Lobster 104,199 107,307
Source:(http://sero.nmfs.noaa.gov/sustainable_fisheries/caribbean/documents/pdfs/caribbean_acl_table.pdf).
6 Annual Catch Limits in the USVI are regulated in pounds of whole fish; therefore English measurements will be used throughout the modeling process.

15
Figure 1. Map showing the islands of St.Thomas, St.John, and St. Croix, in the U.S. Virgin Islands. Basemap courtesy ESRI Ocean Basemap.
16
Figure 2. The commercial catch report form required by the USVI Department of Planning and Natural Resources.

17
Chapter Two: Data Collection and Methods
2010-2011 Commercial Catch Reports
Each year, fishers receive a fisherman’s booklet that contain the USVI
regulations, a packet of 12 CCR forms for each fishing month from July to the following
June, instructions on how to fill out the forms, and a map of each region’s fishing zones
to identify their approximate fishing location (CFMC, 2011a, DPNR, 2012, Messineo,
2004). Each monthly report form provides space for the fisherman’s name and fishing
license number, boat registration number, the number of helpers utilized, the number of
fish and lobster pots utilized, the day of the month, the zone of the area fished, the
distance from land (in miles), the number of hours fished, gear type and/or soak time
(i.e., for fish pots), the amount (in pounds) of each species group or shellfish caught, the
amount (in pounds) of discarded fish or shellfish (dead or alive), extra space for notes
and/or other species not listed on the form.
Monthly commercial landings (USVI CCR forms) for the 2010-2011 fishing year
were entered into a Microsoft Access® database, initially designed by DPNR staff.
Fishing years begin in July and proceed through June of the following year (e.g. 2010-
2011 fishing year = July 2010 – June 2011). In addition to the usual data recorded, the
following data were verified and added to the electronic database: date that each
fisherman signed the CCR form (FishermanDate), and the date when the CCR form was

18
received and date-stamped by DPNR staff (ReceivedDate). Missing dates were left blank.
Each fisherman was randomly assigned a fisherman ID number for unbiased
identification. Table 2 provides variable definitions and describes fields of interest on
CCR forms.
The total number of fishermen reporting and numbers of CCR forms by island for
the 2010-2011 fishing year are summarized in Table 3. There were 3,174 submitted CCR
forms from 290 fishermen. Data were subdivided by island, with STX having 171
fishermen who submitted 1,915 reports, and STT/STJ having 119 fishermen who
submitted 1,259 reports.
After completion of data entry and Quality Assurance, Quality Control (QAQC) of the
database, exploratory data analyses were conducted to identify fishing patterns within
each island. Landings were explored by island, fisherman, species group, gear type, and
fishing month. Fishermen reporting behavior was investigated by summing the number
of missing reports and fishermen reporting lag time. The trip date is the date the fishing
trips actually occurred and fish were landed (TripDate). Lag time is considered the
difference between the TripDate and the ReceivedDate.
1998-2012 Historical Commercial Landings Data
Historical monthly commercial landings from the 1998 through 2012 fishing seasons
were obtained through the SEFSC. Landings were recorded by trip level for the months
of January 2000 through September 2012 for STT/STJ, and for the months of January

19
1998 through November 2012 for STX. The incomplete fishing years for each island
were not used in the analysis and were removed from the data set; therefore, 1999-2000
and 2012-2013 fishing years were incomplete and removed from the STT/STJ data sets,
and 1997-1998/2012-2013 fishing years were incomplete and removed from the STX
data sets. Historical commercial landings data did not contain FishermanDate or
ReceivedDate.
Species Groups Used in the Predictive Model
Snapper and Lobster on STT/STJ, and Parrotfish and Lobster on STX were
chosen as the species groups used in the model. Snapper on STT/STJ and parrotfish on
STX are important local commercial fisheries, and their species groups represent the
highest level of reef fish landings on those islands. Fishers landings these species at a
reasonably steady rate, and seasonality and tourism have minimal impact on the total
landings. Lobster is commonly targeted on both islands, and the ACLs for STT/STJ and
STX are similar. Landings of lobster tend to be higher during the fall and winter months
due to the influence of the tourism industry. All of the species groups selected approach
or exceed their ACL on an annual basis.
20
Summary of Predictive Model78
Monthly landings data from the 2010-2011 fishing season (Data sets:
STT/STJ(2010-2011) and STX(2010-2011) Table 4) were used to develop the predictive annual
landings model. For a selected species, and using a sequence of specified cut-off dates,
the percentages of the total fishing trips for each fishing month (FMO) were calculated
from reports which have been submitted and date-stamped by the DPNR by that cut-off
date, relative to the total number of reports eventually submitted for that month. The
five cut-off dates used in this analysis were November 30, 2010, December 31, 2010,
January 31, 2011, February 28, 2011, and March 31, 2011. These percentages of trips
submitted by the cut-off dates were calculated for each FMO, and were then used to
calculate adjustment percentages. Because the historical data lacked a received date for
each report, adjustment percentages were applied to the historical data sets
(STT/STJ(2000-2012) and STX(1998-2012)) in a retrospective analysis. This allowed a virtual
estimation of the number of reports that would have been available, for each historical
data year, based on the assumption that submission patterns for those historical years
emulated the submission pattern observed for the 2010-2011 fishing year (FYR). The
purpose was to test the performance of the model on the historical FYRs to determine
model performance in predicting final landings by each cut-off date for each historical
data year.
7 SAS code is available upon request. 8 A model flow chart can be found in Appendix B describing the three primary steps of the model.
21
These adjustment percentages decremented a percentage of trips from the data
by each cut-off date, and were then used to expand the remaining landings based upon
the percentage of trips that were removed. These expanded landings were assumed to
be available by the cut-off date, and provided a retrospective estimate of landings
through the cut-off date. This total estimate was expanded, based on the average
historical cumulative percent of landings by the FMO, to estimate the total annual
landings for the FYR. Differences between predicted final landings were compared to
the observed final reported landings for that FYR to evaluate the accuracy of the
prediction. Based on the accuracy of the predicted landings by each cut-off date, the
response time available to fishers for adjusting their fishing practices, appropriate cut-
off dates for balancing prediction accuracy and response time can be identified.
Step 1: Accounting for Late Reporting
The ultimate goal of this modeling process was to predict total annual landings by
species group (SpeciesGroup) based on data received in-season. Analyses indicated that
landings patterns vary each FYR. As a result, there was a need to simulate the trips and
landings for each FMO that would be expected to not be available by the cut-off date.
Therefore, the first step was to account for and predict the landings that have already
occurred within a fishing season, but have not yet been reported.
The STT/STJ(2010-2011 ) and STX(2010-2011) data sets (Table 4) were imported into
SAS 9.3 (SAS Institute, Inc., Cary, NC ) statistical and data management software. Each
data set was filtered by Island, SpeciesGroup, and the cut-off date. Each TripDate was set

22
equal to one Trip (Trip) if the landings for the SpeciesGroup were greater than zero. Each
Trip was flagged if the ReceivedDate was less than, or equal to, the cut-off date. The
percentage of submitted trips for each FMO by the cut-off date (Received%) was
calculated as total Trips for each FMO that were submitted prior to the cut-off date
(TripsRec), divided by the total observed fishing Trips for that FMO (TripsTotal):
(1)
The adjustment percentages (Adjustment%) for each FMO was equal to one
minus the Received% for that FMO, and was applied to the historical datasets in the next
step:
(2)
Step 2: Retrospective Test of Model Performance Using Expansion Factors
Step 2 applies the Adjustment% to historical data sets from STT/STJ and STX,
separately for each FYR, simulating the adjustment of received landings upwards to
account for unreported landings.
Kaiser (2010) recommended using bootstrapping simulation to estimate the
variance of total catch estimates. Assuming that the 2010-2011 reporting patterns are

23
representative of the historic fishing years, each bootstrapped sample run randomly
removes, with replacement, a percentage of trips based on the Adjustment%, and then
expands the remaining landings based on the percentage of trips that have been
removed. Because it cannot be known which fishers would have reported by that cut-off
date (i.e., which subset of trips would be included in the available data set), the
bootstrap procedure randomly selects the trips that would have been submitted, with
each run selecting a different suite of submitted trips. The more distant from the
reporting month the cut-off date was scheduled, the more trip reports available, the
tradeoff being that less time will remain in the FYR to adjust fishing activity in response
to any projected overages or shortfalls relative to the ACL. Thus, a balance must be
struck between maximizing the percentage of total landings data available for
estimation, while maximizing the amount of time available for fishers to respond to the
predicted outcome.
Each bootstrap sample run generates a single prediction of what the submitted
landings would be for that month. The compilation of those predictions produces an
output of mean values for that FMO. The sum of those mean values for each FMO
through the cut-off date produced a mean prediction through the cut-off date. The
range of error estimates derived from comparing the bootstrapped values to the
observed values was used to calculate an upper and a lower range of predictions around
the mean.
The stability of the variances was tested by varying the number of realizations
from 50 to 100, 200, 250, 500, 750, and 1000 runs. The point at which the error was

24
stabilized, as reflected by a leveling of the error curve, was used to identify the number
of bootstrap loops required and provides a defensible quantitative number of
simulations to use. Depending on the SpeciesGroup, the variability was minimal beyond
200-250 model runs (Figures 7-10), thus 200-250 runs were used as the basis of all
further calculations.
The STT/STJ(2000-2012) and STX(1998-2012) were imported into SAS 9.3 software.
Each data set was filtered by Island and SpeciesGroup. Each TripDate was set equal to one
historical trip (HTrip) if the landings for the SpeciesGroup were greater than zero. The
FYRs with incomplete data were omitted from each data set. For each FMO, each HTrip
was assigned 1) the Adjustment% that was determined for the specified cut-off date, and
2) a uniform random number generator (U= 0-1) to select trips for each bootstrap
realization. When U was less than the Adjustment%, the HTrip was removed from the
data set. The removal of these trips simulated the trips that would have been
unreported as of the cut-off date, with the remaining HTrips and associated landings
(Pounds) simulating data that would have been received by the cut-off date. The
prediction for the landings that would be received once all trips from the period prior to
the cut-off date have reported (PoundsExp) was computed by dividing the Pounds by the
Received%, (which is also equal to one minus the Adjustment%). The removed trips were
then replaced in the data set and the process repeated until the suite of bootstrap runs
was completed.

25
(3)
( )
The remaining landings from the trips that were not removed from the data sets
during each bootstrap sample run simulated the received pounds by the cut-off date,
and they will consequently be referred to as the received pounds (PoundsRec). The
PoundsRec were subtracted from the PoundsExp to calculate the amount that was actually
expanded (ExpandedDiff):
(4)
The prediction error (ErrorPred) was calculated by subtracting the total PoundsExp,
from the observed historical Pounds. The absolute prediction error (ErrorAbs) was the
absolute value of the ErrorPred.
(5)
| |
Descriptive statistics were generated at the conclusion of the bootstrapping
sequence. For each FMO, the summary statistics include the number of

26
simulations/bootstrap sample runs equal to N, the mean, minimum and maximum
values across all simulations, and the standard deviation. However, since the
bootstrapping sequence ran through the data for every FYR and FMO, the data must be
filtered for the specific FYR being analyzed. A summary table was then produced by
FYR and FMO for each of the values for PoundsRec, ExpandedDiff, and ErrorAbs (e.g. Table
20).
All data from the 2010-2011 FYR are used to calculate the Received% and the
Adjustment%, which were applied to the historical data. However, the summary values
derived from the historical data sets that were used to calculate the final predictions
only include the FMOs of July to the cut-off date, minus one month (CoD-1). For
example, a cut-off date of February 28th calculates Adjustment% for each FMO from July
1st through February 28th, but only the summary values from July 1st through January
31st of the same FYR are used in the calculations. The error rate for the final FMO would
be too high because there are few (if any) reports submitted that month (as seen in
Tables 10-17 in the results section, showing the Received% and Adjustment% by fishing
month and cut-off date). To calculate a prediction for the end of year landings:
The mean of the Pounds Rec for each FMO were summed through the cut-off date
(minus one month):
(6)
∑

27
The mean of the ExpandedDiff for each FMO were summed through the cut-off
date (minus one month):
(7)
∑
Combining the sums from (6) and (7) provided the total mean predicted pounds
that would be expected to be received through the cut-off date if all CCR reports were
submitted on time (CutoffPred)9. This mean prediction was subtracted from the observed
landings for that FYR, by the same date as the cut-off date, to estimate the error.
Next, the mean of the ErrorAbs for each FMO were summed through the cut-off
date (minus one month). This total was added and subtracted from the CutoffPred for an
upper and lower range of predictions by the cut-off date.
(8)
∑
The sum from (8) was applied to the CutoffPred to generate an upper (RangeUpper) and
lower range (RangeLower) of predictions by the cut-off date.
9 This sum is also equal to the total PoundsExp, if summed through the cut-off date (minus one month).

28
These steps account for missing reports by the cut-off date, providing an
estimated total range of error around the mean predicted landings through the cut-off
date.
Step 3: In-season Projections
In Step 3, the estimated sum of landings by the cut-off date was expanded to the
end of the FYR to predict the total annual landings for a specified SpeciesGroup.
Assuming historical fishing patterns are predictive of future fishing patterns, the
predicted landings by the cut-off date (PoundsExp) represented a percentage of the
cumulative landings to be attained by the end of the FYR that was best predicted by the
average historical cumulative percentage of landings at that cut-off date. For example, if
900 pounds were reported by March 31 (e.g. the cut-off date) and were expanded to
1000 pounds to account for late reporting by that cut-off date (i.e., PoundsExp = 1000
pounds), and the average cumulative percent of landings was 65% by March 31, the
1000 pounds would be expanded by 35% to predict the total landings by the end of the
FYR (i.e. 1000/.65 = 1538 pounds by June 30). To evaluate the accuracy of this
expansion, the total predicted annual landings were compared to the observed annual
landings.
The percentage of the landings for each FMO (Pounds%) was calculated as the
total observed landings for each FMO (PoundsFMO) divided by the total observed
landings for the FYR (PoundsFYR)(e.g. Table 21).

29
(9)
The cumulative percentage of landings for each FMO through a specified FYR
(PoundsCumulative) was equal to the cumulative sum of the Pounds% by each FMO.
Summary statistics were generated for PoundsCumulative by FMO (e.g Table 22),
deleting the FYR being analyzed to remove bias (i.e, N = number of FYRs – 1).
Continuing the example above, if a simulation of the FYR 2002-2003 data indicated
that 1000 pounds (i.e., PoundsExp = 1000 pounds), were received by the cut-off date of
March 31, the average cumulative percent of landings historically achieved by that cut-
off date would be determined based on historical data from the FYR 2001-2002, 2003-
2004, 2004-2005, etc. season, omitting the 2002-2003 season. Mean, minimum and
maximum values for PoundsCumulative were derived from the summary table, and the 95%
upper and lower confidence intervals (CI) were calculated using the equations:
(10)
( ) (
√ )
(11)
( ) (
√ )

30
The PoundsCumulative for each FMO were used as an expansion factor on the
CutoffPred to predict the total annual landings for the FYR. The CutoffPred, RangeUpper,
and RangeLower were used as the numerators. The PoundsCumulative summary values and
the values calculated in (10) and (11), for the same FMO as the cut-off date, were used as
the denominators. Mean final prediction, lower and upper confidence limits and range,
were computed as follows:
(12)
(13)
(14)

31
(15)
(16)
To calculate the error for each of the five prediction values calculated, the
predicted landings (e.g. PredictionMean) were subtracted from the observed value
(PoundsFYR). The Absolute Prediction Error and the Absolute Percent Error for each
prediction were calculated by:
(17)
| |
(18)
(
)
32
Tables and Figures Table 2. Date variable definition table and describes the important variables used and created during the modeling process.
Variable Description
Island Name of island group used in analyses
FishermenID Unique identifier of each fisherman
FMO Fishing month within the fishing year, beginning in July (July=1…June=12)
FYR Fishing year from July-June
SpeciesGroup Species group or FMU analyzed
Pounds Total pounds caught per trip based on species group or FMU (e.g. lobster, snapper, parrotfish)
TripDate Date of the fishing trip
FishermanDate Date the fishermen signed and dated the CCR form
ReceivedDate Date when the report was submitted and date-stamped by the DPNR
TripsTotal Total fishing trips for each fishing month, determined after a fishing year has been completed
Cut-off date Date in which reports must be submitted to determine the percentage of trips received
TripsRec Total fishing trips received for each fishing month, before the cut-off date
Received% Percentage of received trips from total trips for each fishing month
Adjustment% Percentage applied to historical data to remove and expand landings for each fishing month
HTrips Considered one day of fishing (1 historical trip)
PoundsFMO Total observed pounds for each fishing month
PoundsFYR Total observed pounds for the fishing year
Pounds% Percentage of pounds for each fishing month from the fishing year
PoundsCumulative Cumulative percentage of pounds for each fishing month by fishing year
CIUpper Upper confidence interval value for the cumulative percentage of landings
CILower Lower confidence interval value for the cumulative percentage of landings

33
Table 2. Continued:
Variable Description
PoundsRec Simulated received pounds by the cut-off date
PoundsExp Simulated expanded pounds by the cut-off date
ExpandedDiff Difference of the expanded pounds and the received pounds through the cut-off date
ErrorPred Prediction error of the observed pounds minus the expanded pounds
ErrorAbs Absolute value of the prediction error
TotalRec Total received pounds through the cut-off date
TotalDiff Total difference of the expanded and received pounds through the cut-off date
CutoffPred Total mean predicted pounds through the cut-off date
CutoffError Total absolute prediction error used to calculate an upper and lower range around the predicted pounds through the cut-off date
RangeUpper Absolute prediction error added to the mean prediction by the cut-off date for an upper range
RangeLower Absolute prediction error subtracted from the mean prediction by the cut-off date for a lower range
PredictionMin Minimum value for the final prediction
PredictionLowerCI Lower bound around the final prediction
PredictionMean Mean value for the final prediction
PredictionUpperCI Upper bound around the final prediction
PredictionMax Maximum value for the final prediction
AbsolutePred Absolute prediction error from the fishing year landings minus the prediction
Absolute%Error Absolute percent error from the prediction error over the observed fishing year landings

34
Table 3. The total fishermen on each island for the 2010-2011 fishing year who submitted commercial catch reports forms to the DPNR. The total number of reports that were submitted are divided among the total reports for which fishing or no-fishing was reported each month. The number of missing or non-reported reports are calculated by: the total number of fishermen * 12, minus the total reports submitted for 2010-2011. The total fishing trips were the number of individual days (or nights) on which the fishermen landed fish.
Data Set
Total Number
of Fishermen
Total Reports
Reports with
No Fishing (% of Total)
Reports with Fishing (% of Total)
Missing or Non-
Reported Reports
Total Fishing
Trips
STT/STJ 2010-2011
119 1,257 619 (49%) 638 (51%) 171 3,581
STX 2010-2011
171 1,915 1,160 (61%)
755 (39%) 137 7,944
Table 4: Data subsets used in the predictive model.
Dataset Description Fishing Year
STX(2010-2011) St. Croix data from July 2010-June 2011
2010-2011
STT/STJ(2010-2011) St. Thomas/St. John data from July 2010-June 2011
2010-2011
STX(1998-2012)** St. Croix data from July 1998-June 2012
1998-1999…2011-2012
STT/STJ(2000-2012)** St. Thomas/St. John data from July 2000-June 2012
2000-2001…2011-2012
**The incomplete fishing years for each island were used in the analysis and were omitted from the data set. Landings were recorded by trip level for the months of January 2000 through September 2012 for STT/STJ and for the months of January 1998 through November 2012 for STX). Therefore, 1999-2000 and 2012-2013 fishing years were incomplete and removed from the STT/STJ data sets, and 1997-1998 and 2012-2013 fishing years were incomplete and removed from the STX data sets.

35
Chapter Three: Results Accounting for Late-Reporting
Table 5 lists the total landings for 18 species groups reported on the CCR forms
for the 2010-2011 fishing year in STX and STT/STJ. In STT/STJ, the most important
fisheries, defined by the largest amount of landings, were lobster (99,761 lb), snappers
(99,076 lb), and groupers (52,720 lb). Grouper, triggerfishes, grunts, and jacks were
also among the top fisheries, with over 30,000 lb landed in 2010-2011. In STX, the
most important fisheries were parrotfishes (193,483 lb), lobster (155,908 lb), snappers
(114,943 lb), and conch (71,183 lb). Grunts, surgeonfishes, triggerfishes, and groupers
all had over 30,000 lb landed in 2010-2011.
There were a total of 71 fishermen out of 119 fishermen who reported landings in
STT/STJ in 2010-2011 that fished for snapper (Table 6). For any given fishing month,
there were 35 (June) to 47 (January) fishermen fishing for snapper. In 2010-2011, there
were 2,263 fishing trips in which snapper was landed, with June having the least
amount of trips (145), and July having the most amount of fishing trips (218) and
highest landings (9,936 lb). There was a steady catch from July through October, with a
drop in November and December, and a steady increase in catch from January to April.
The least amount of monthly landings was in May, with 6,322 lb of snapper landed.

36
There were a total of 34 fishermen out of 119 fishermen who reported landings in
2010-2011 in STT/STJ that fished for lobsters (Table 7). For any given fishing month,
there were 17 (June) to 24 (August and January) fishermen fishing for lobster. In 2010-
2011, there were 1,169 fishing trips in which lobster was landed, with February having
the least amount of trips (73), and January having the most amount of trips (118). The
months with the most landings occurred from September through January, with highest
landings occurring in December with 10,839 lb. February and June had the least
amount of monthly landings with 6,086 and 5,820 lb of lobster landed, respectively.
There were a total of 47 fishermen out of 171 fishermen in STX that fished for
parrotfish in 2010-2011 (Table 8). For any given fishing month, there were 23 (March)
to 32 (July) fishermen fishing for parrotfish. In 2010-2011, there were 3,425 fishing
trips in which parrotfish was landed. July had the highest landings (20,586 lb) and
fishing trips (376). September, May and June all had the lowest fishing trips, with 260
trips each month. There was a fairly steady catch from October through June. The least
amount of monthly landings was in September, with 11,401 lb of parrotfish landed.
There were a total of 51 fishermen out of 171 fishermen who reported landings in
2010-2011 in STX that fished for lobster in 2010-2011 (Table 9). For any given fishing
month, there were 19 (June) to 33 (July) fishermen fishing for lobster. In 2010-2011,
there were 3,677 fishing trips in which lobster was landed, with February and June
having the least amount of trips (221 and 224 trips, respectively). The fishing month of
July had the most amount of fishing trips (405) and highest landings (16,885 lb). There
was a steady catch from October through January, with a drop in February and increase

37
in March. The least amount of monthly landings was in May, with 9,441 lb of lobster
landed.
Percent Trips Received and Adjustment Percentages
Table 10-13 explains the percentage of fishing trips for each fishing month that
were submitted to the DPNR by the cut-off date, based on the 2010-2011 reports
(Received%). The increase in percentages across all cut-off dates by the fishing month
explains that the later the cut-off date is in the fishing year, the higher percentage of
trips received for prior fishing months. For example, in Table 10, with a cut-off date of
November 30, 2010 and a fishing month of October (FMO=4), 65% of the October trips
will have been received by the end of November. With a cut-off date of March 31, 2011,
82% of the October trips will have been received by the end of March.
The decrease in percentages across all fishing months by each cut-off date
explains that the closer the fishing month is to the cut-off date, the lower percentage of
trips received for that month. For example, in Table 10, with a cut-off date of December
31, 2010, and a fishing month of July (FMO=1), 75% of the July trips will have been
received by the end of December. However, with the same cut-off date, only 44% of the
November trips will have been received by the end of December.
For each of the four species that were analyzed, if the fishing month is equal to
the month of the cut-off date, typically the percentage of trips that are received for that
month are less than 5%, or sometimes as low as 0% (labeled with an N/A).

38
The adjustment percentages (Adjustment%) for each fishing month used in the
bootstrapping sequence to remove the historical trips and expand the landings for
remaining trips, simulating expansion for late reporting are presented in Tables 14-17.
Each percentage is equal to 1 minus the percent trips received (Received%). Therefore,
adjustment percentages decrease as cut-off dates get closer to the end of the fishing
season. For example, in Table 14, historical trips in the fishing month of October
(FMO=4), and a cut-off date of November 30, 2010, have an expansion factor of 35%,
whereas the expansion is approximately 18% with a cut-off date of March 31st, 2011.
This is due to more data being available for each fishing month as the fishing year
progresses.
The adjustment percentages presented in Table 14-17 illustrate why the final
predictions were calculated from the values of the cut-off date, minus one month (CoD-
1). For example, in Table 14, for the cut-off date of December 31, 2010, trips with a
fishing month of August (FMO=2), will have an adjustment percentage of about 25%.
Trips in the fishing month of December (FMO=6) with the same cut-off date would be
expanded by about 98%.
Retrospective Test of Model Performance Using Expansion Factors
Table 18 lists the total commercial landings (lb), the total number of fishermen
who reported landings, and the total fishing trips, for the historical fishing years of
2000-2001 through 2011-2012 for STT/STJ, and 1998-1999 through 2011-2012 for STX.

39
In STT/STJ, the total number of fishermen who reported landings between 2000 and
2012, fluctuated from 82 to 122. The lowest recorded landings were in 2011-2012 with
412,826 lb, and the highest recorded landings were in 2002-2003 with 834,836 lb. The
amount of fishing trips ranged from 16,123 to 24,927. In STX, the total number of
fishermen who reported landings between 1998 and 2012, fluctuated from 91 to 160.
The highest recorded landings were in 2005-2006 with almost 1.36 million lb, and
dropped to the lowest recorded landings in 2011-2012 with 509,013 lb. The number of
fishing trips ranged from 21,180 to 35,435.
Total Landings (lb) and Total Fishing Trips by Species Group and Fishing Year
Table 19 lists the total landings (lb) and total fishing trips by fishing year and
species groups for the four modeled species used in this analysis. Figures 3-6 compares
the trips and landings for each species group, categorized by island.
The total fishing trips for each fishing year for STX parrotfish and lobster are very
similar, with a few distinct characteristics (Figure 3). For both species, there is a steady
increase from the 1998-1999 fishing year to the 2000-2001 fishing year, followed by a
sharp decrease for the next three fishing years, through 2004-2005. Again, the trips
steadily increase until 2005-2006, and begin to level off for the next 2-3 fishing years.
Beginning in 2007-2008 for lobster, and 2008-2009 for parrotfishes, fishing trips
decrease through the 2010-2011 fishing year. Then, in 2011-2012, there is a distinct
pattern in which parrotfish trips increase, while lobster trips decrease.

40
The total landings for parrotfish and lobster follow a similar pattern (Figure 4).
The first three fishing years show a steady increase until 2001-2002, when there is a
sharp increase in landings and decrease the following two fishing years. Landings begin
to steadily increase again through 2006-2007, again followed with a decrease for the
remaining fishing years.
The general trend between the fishing trips and landings for parrotfish and
lobster in STX, shows that besides a sharp increase in 2001-2002, followed by a
decrease the next year, landings and trips are steadily increasing from 1998-1999
through 2005-2006, and begin to decrease thereafter, with the exception in 2011-2012,
when the total number of parrotfish trips reaches its maximum.
The total fishing trips for snapper and lobster in STT/STJ also share similar,
general trends (Figure 5). Snapper total trips increase from 2000-2001 to 2001-2002,
and begin a generally declining trend for the next ten fishing years, through 2011-2012,
except for a slight increase in trips in 2006-2007. Lobster trips have a steady increase
from 2000-2001 to 2004-2005, and also begin a general decline in fishing trips through
2011-2012.
Lobster and Snapper landings follow very similar patterns, except for the 2003-
2004 fishing year, where there is a distinct inverse in landings (Figure 6). There is a
steady increase in landings during the fishing years of 2000-2001 to 2002-2003;
however, snapper landings decrease, while lobster landings continue to increase in

41
2003-2004. The following fishing years are intermittent, but with a general overall
declining trend in landings from 2005-2006 through 2011-2012.
Lobster and snapper trips and landings follow very similar patterns throughout
the data records, showing a general trend of a steady decline beginning in 2006-2007,
and with the lowest records of landings and fishing trips for both in the 2011-2012
fishing year. Historically, annual snapper landings fluctuated from 160-170 thousand lb
from 2000-2003 and 2005-2007 fishing years, to 130-140 thousand lb during the 2003-
2005 and the 2007-2010 fishing years. Snapper trips continuously declined, from over
3,000 trips during each fishing year in 2000-2007, to below 3,000 trips beginning in
the 2007-2008 fishing year. The fishing year 2010-2011, landings dropped to 99
thousand lb with only 2,2,72 trips, and down to 55 thousand lb with 1,925 trips in 2011-
2012.
Determining the Number of Bootstrap Runs for Model Species
The range of predicted landings for each of the four species group as a function of
the number of bootstrap realization sample runs is given in Figures 7-10. The CI range
around the mean prediction for STX Parrotfish and STT/STJ Snapper increased from 10
through 100 bootstrap runs, and decreased at 200 bootstrap runs (Figure 7). The range
leveled off at 250 bootstrap runs for STX Parrotfish, and 200 bootstrap runs for
STT/STJ Snapper (Figure 8). The CI range around the mean prediction for STX Lobster
decreased sharply from 10 to 50 bootstrap runs, followed by a sharp increase at 100
bootstrap runs, and began to level off around 200 bootstrap runs (Figure 9). The range

42
for STT/STJ lobster was very sporadic from 10 to 1000 bootstrap runs. However, the CI
range for 250 bootstrap runs had a similar CI range as 10 and bootstrap 1000 runs
(Figure10 ).
Therefore, 250 bootstrap sample runs were determined to be the best number for
STX parrotfish and 200 runs for STT/STJ snapper and lobster. Due to the fluctuating
range of values for STX lobster, and to maintain consistency for comparison reasons
among species, 200 sample runs were also chosen as the best number of bootstrap
sample runs.
In-Season Projections
The average cumulative historical percent of landings by fishing month (Figures
11, 14, 17, and 20) were used to expand the estimated sum of landings by the specified
cut-off date to predict the annual landings for the fishing year. To evaluate the accuracy
of this expansion, the total predicted annual landings are compared to the observed
historical annual landings. The overall final results for the years 1998-2012 (STX) and
2000-2012 (STT/SSTJ) are presented as the Absolute Percent Error of the mean annual
predictions, among the cut-off date for each of the fishing years, and expressed as a
percentage (Figures 12, 15, 18, and 21), and in pounds (Figures 13, 16, 19, and 22).

43
St. Thomas/St .John Snapper Predictions
Absolute Percent Error by Fishing Year
The 2004-2005 fishing year had the smallest range of percent error among all
cut-off dates (0.1% to 0.5%, or 204 lb to 683 lb). The 95% confidence interval was ±
0.11%. The observed historical landings were 145,498 lb. The 2011-2012 fishing year
had the largest range of percent error among all cut-off dates (12.6% for the November
30th cut-off date, to 0.3% for the March 31st cut-off date, or 7,007 lb to 161 lb). The
observed historical landings were 55,474 lb.
Absolute Percent Error by Cut-off Date (% and lb)
Figures 12-13 show that the average percent errors of the mean predictions
among fishing years, within each cut-off date of November 30th to March 31st declined
over the time series. The average error decreased from 6.0% or 7865 lb for the
November 30th cut-off date, to 2.2% or 3,301 lb by March 31st. The 95% confidence
interval decreased from ± 1.85% to 0.99%. The November 30th cut-off date had the
largest range of percent error for all fishing years, (0.3% to 12.6%, equal to 397 lb in
2004-2005 and 7,007 lb in 2011-2012). The March 31st cut-off date had the smallest
range of percent error for all fishing years (0.03% to 6.5%, equal to 43 lb in 2001-2002
and 10,582 lb in 2000-2001).

44
St. Thomas/St. John Lobster Predictions
Absolute Percent Error by Fishing Year
The 2011-2012 fishing year had the smallest range of percent error among all cut-
off dates (0.8% to 2.8%, equal to 641 lb to 2,288 lb, respectively). The observed
historical landings were 82,747 lb. The 2000-2001 and 2010-2011 fishing years had the
largest range of percent errors among all cut-off dates (18.3% to 6.3% and 17.6% to
6.3%, equal to 14,516 lb and 5,040 lb, and 17,572 lb and 6,272 lb respectively). The
observed historical landings were 79,445 lb and 99,713 lb, respectively.
Absolute Percent Error by Cut-off Date (% and lb)
Figures 15-16 show that the average percent errors of the mean predictions among
fishing years, within each cut-off date of November 30th to March 31st declined over the
time series. The average percent error decreased from 7.8% or 8,320 lb for the
November 30th cut-off date, to 3.1% or 3,243 lb by March 31st. The 95% confidence
intervals also decreased from ± 3.37% to 1.12%. The November 30th cut-off date had the
largest range of percent error for all fishing years from 0.8% to 18.3% (equal to 641 lb in
2011-2012 and 14,517 lb in 2000-2001). The March 31st cut-off date had the smallest
range of percent error for all fishing years, from 0.5% to 6.3% (equal to 577 lb in 2002-
2003 and 5,040 lb in 2000-2001).

45
St. Croix Parrotfish Predictions
Absolute Percent Error by Fishing Year
The 1999-2000 fishing year had the smallest range of percent error among all cut-off
dates (0.3 % to 3.7 %, or 641 lb to 8,871 lb, respectively). The observed historical
landings were 241,980 lb. The 95% confidence interval was ± 1.38%. The 2009-2010
fishing year had the largest range of percent error for all cut-off dates (14.0% to 26.5%,
or 27,283 lb to 51,561 lb, respectively). The 95% confidence interval was ± 5.51%. The
observed historical landings were 194,684 lb.
Absolute Percent Error by Cut-off Date (% and lb)
Figures 18-19 show that the average percent errors of the mean predictions
among fishing years, within each cut-off date of November 30th to March 31st declined
over the time series. The average percent error decreased from 8.7% or 22,466 lb for the
November 30th cut-off date, to 3.8% or 9,522 lb by March 31st. The November 30th cut-
off date had the largest range of percent error for all fishing years (0.4% to 25.1%, equal
to 861 lb in 1999-2000 and 48,870 lb in 2009-2010). The March 31st cut-off date had
the smallest range of percent error for all fishing years (0.1% in 2002-2003 to 14.0% in
2009-2010, equal to 352 lb and 27,283 lb, respectively). The 95% confidence interval
was ± 2.07%.

46
St. Croix Lobster Predictions
Absolute Percent Error by Fishing Year
The 2005-2006 fishing year had the smallest range of percent error among all
cut-off dates (1.1% to 3.5%, or 1,496 lb to 4,823 lb, respectively). The observed historical
landings were 139,105 lb. The 1999-2000 fishing year had the largest range of percent
error among all cut-off dates (0.6% to 11.7%, or 368 lb to 7,470 lb, respectively). The
observed historical landings were 64,116 lb. The 2011-2012 fishing year had the largest
average percent error for all cut-off dates (15.2% to 18.8%, or 12,861 lb and 15,852 lb,
respectively). The observed historical landings were 84,704 lb.
Absolute Percent Error by Cut-off Date (% and lb)
Figures 21-22 show that the average percent errors of the mean predictions
among fishing years, within each cut-off date of November 30th to March 31st declined
over the time series. The average percent error decreased from 6.8% or 7,800 lb, to
4.6%, or 5,389 lb by March 31st. The February 28th cut-off date had the largest range of
percent error among fishing years (0.5% to 18.7%, equal to 524 lb in 2000-2001 and
15,852 lb in 2011-2012). The November 30th cut-off date had the smallest range of
percent error for among all fishing years (1.1% to 15.2%, equal to 1,373 lb in 2003-2004
and 12,861 lb in 2011-2012).

47
Tables and Figures
Table 5. Total landings (lb) for 18 species groups in St. Thomas/St. John and St. Croix during the 2010-2011 fishing year.
List of Species Species Group STT/STJ
(lb) STX (lb)
1 Parrotfish 27,425 193,483 2 Snapper 99,076 114,943 3 Lobster 99,761 155,908 4 Grouper 52,720 30,496 5 Conch 1,628 71,183 6 Triggerfish 66,694 35,294 7 Grunt 33,661 37,409 8 Surgeonfish 26,399 35,531 9 Jack 32,225 6,865
10 Shellfish 19,500 4,388 11 Porgy 18,138 4,605 12 Angelfish 10,331 1,226 13 Tuna 3,657 19,277 14 Wahoo 8,146 9,648 15 Barracuda 1,607 4,730 16 Mackerel 849 - 17 Goatfish 19 692 18 Squirrelfish 160 7

48
Table 6. Total trips, landings (lb), and fishermen by fishing month in the 2010-2011 fishing year for snapper in St. Thomas/St. John.
Fishing Month Trips Landings (lb) Total Fishermen 1 218 9,936 41 2 190 9,798 42 3 190 8,880 37 4 203 9,823 42 5 196 7,257 41 6 197 6,837 40 7 208 7,420 47 8 174 7,822 42 9 193 8,273 43
10 185 8,902 45 11 164 6,322 42 12 145 7,808 35
TOTAL 2,263 99,076 71* *The total fishermen for each fishing month was equal to the number of fishermen who had submitted at least one report with at least one trip in which the species was landed. The total fishermen out of the 2010-2011 fishing year was the population of fishermen who fished for the species group.
Table 7. Total trips, landings (lb), and fishermen by fishing month in the 2010-2011 fishing year for lobster in St. Thomas/St. John.
Fishing Month Trips Landings (lb) Total Fishermen
1 110 7,544 22 2 98 7,175 24 3 96 10,117 20 4 99 9,565 21 5 101 9,295 20 6 99 10,839 18 7 118 10,163 24 8 73 6,086 18 9 111 8,041 20
10 97 7,717 18 11 92 7,401 20 12 75 5,820 17
TOTAL 1,169 99,760.5 34*

49
Table 8. Total trips, landings (lb), and fishermen by fishing month in the 2010-2011 fishing year for parrotfish in St. Croix.
Fishing Month Trips Landings (lb) Total Fishermen
1 376 20,586 32 2 269 12,529 28 3 260 11,401 28 4 262 16,418 28 5 283 15,846 31 6 309 18,571 28 7 299 17,921 27 8 287 15,666 31 9 266 18,220 23
10 294 16,006 29 11 260 15,088 24 12 260 15,234 26
TOTAL 3,425 193,483 47*
Table 9. Total trips, landings (lb), and fishermen by fishing month in the 2010-2011 fishing year for lobster in St. Croix.
Fishing Month Trips Landings (lb) Total Fishermen 1 405 16,885 33 2 307 11,216 27 3 331 11,366 30 4 354 14,766 29 5 362 14,995 32 6 322 14,676 29 7 324 14,912 31 8 221 10,179 24 9 272 13,704 27
10 324 13,439 27 11 231 9,441 23 12 224 10,330 19
TOTAL 3,677 155,908 51*

50
Table 10. Percent of fishing trips submitted to the DPNR (Received%) for each fishing month by the cut-off date for St. Thomas/St. John snapper.
Fishing Month
November 30, 2010
December 31, 2010
January 31, 2011
February 28, 2011
March 31, 2011
1 72.9% 75.2% 75.2% 80.7% 83.0% 2 72.6% 75.3% 75.3% 81.1% 83.7% 3 72.6% 75.3% 75.3% 82.1% 83.7% 4 65.0% 73.9% 73.9% 80.3% 82.3% 5 1.0% 43.9% 45.9% 54.1% 57.1% 6 1.5% 44.2% 50.3% 61.9% 7 1.0% 35.6% 54.8%
8 1.1% 56.9%
9 0.5%
Table 11. Percent of fishing trips submitted to the DPNR (Received%) for each fishing month by the cut-off date for St. Croix parrotfish.
Fishing Month
November 30, 2010
December 31, 2010
January 31, 2011
February 28, 2011
March 31, 2011
1 83.0% 83.0% 89.4% 89.4% 89.4% 2 81.4% 81.4% 90.3% 90.3% 90.3% 3 72.7% 76.2% 86.2% 86.2% 86.2% 4 39.7% 58.8% 72.1% 72.1% 72.1% 5 N/A 43.1% 71.4% 71.4% 75.6% 6 1.0% 58.6% 61.8% 73.5% 7 3.0% 45.8% 68.6% 8 0.3% 62.4%
9 4.1%

51
Table 12. Percent of fishing trips submitted to the DPNR (Received%) for each fishing month by the cut-off date for St. Croix lobster.
Fishing Month
November 30, 2010
December 31, 2010
January 31, 2011
February 28, 2011
March 31, 2011
1 84.4% 84.4% 90.4% 90.4% 90.6% 2 79.8% 79.8% 87.6% 87.6% 87.6% 3 84.3% 86.4% 93.1% 93.1% 93.1% 4 43.5% 63.6% 70.9% 70.9% 70.9% 5 N/A 47.5% 73.5% 73.5% 77.3% 6 N/A 57.8% 60.2% 75.5% 7 2.5% 51.5% 81.5% 8 0.5% 60.2%
9 0.7%
Table 13. Percent of fishing trips submitted to the DPNR (Received%) for each fishing month by the cut-off date for St. Thomas/St. John lobster.
Fishing Month
November 30, 2010
December 31, 2010
January 31, 2011
February 28, 2011
March 31, 2011
1 50.9% 55.5% 55.5% 62.7% 62.7% 2 59.2% 64.3% 64.3% 70.4% 73.5% 3 66.7% 66.7% 66.7% 74.0% 76.0% 4 58.6% 68.7% 68.7% 74.7% 75.8% 5 N/A 47.5% 47.5% 52.5% 54.5% 6 N/A 55.6% 61.6% 69.7% 7 N/A 38.1% 61.9% 8 N/A 67.1%
9 N/A

52
Table 14. Adjustment percentages (Adjustment%) by cut-off date and fishing month for St. Thomas/St. John snapper. Each Adjustment Percentage is equal to 1 minus the percent trips received for that fishing month and Cut-off date.
Fishing Month
November 30, 2010
December 31, 2010
January 31, 2011
February 28, 2011
March 31, 2011
1 27.1% 24.8% 24.8% 19.3% 17.0% 2 27.4% 24.7% 24.7% 18.9% 16.3% 3 27.4% 24.7% 24.7% 17.9% 16.3% 4 35.0% 26.1% 26.1% 19.7% 17.7% 5 99.0% 56.1% 54.1% 45.9% 42.9% 6 98.5% 55.8% 49.7% 38.1% 7 99.0% 64.4% 45.2% 8 98.9% 43.1%
9 99.5%
Table 15. Adjustment percentages (Adjustment%) by cut-off date and fishing month for St. Croix parrotfish.
Fishing Month
November 30, 2010
December 31, 2010
January 31, 2011
February 28, 2011
March 31, 2011
1 17.0% 17.0% 10.6% 10.6% 10.6% 2 18.6% 18.6% 9.7% 9.7% 9.7% 3 27.3% 23.8% 13.8% 13.8% 13.8% 4 60.3% 41.2% 27.9% 27.9% 27.9% 5 N/A 56.9% 28.6% 28.6% 24.4% 6 99.0% 41.4% 38.2% 26.5% 7 97.0% 54.2% 31.4% 8 99.7% 37.6%
9 95.9%

53
Table 16. Adjustment percentages (Adjustment%) by cut-off date and fishing month for St. Croix lobster.
Fishing Month
November 30, 2010
December 31, 2010
January 31, 2011
February 28, 2011
March 31, 2011
1 15.6% 15.6% 9.6% 9.6% 9.4% 2 20.2% 20.2% 12.4% 12.4% 12.4% 3 15.7% 13.6% 6.9% 6.9% 6.9% 4 56.5% 36.4% 29.1% 29.1% 29.1% 5 N/A 52.5% 26.5% 26.5% 22.7% 6 N/A 42.2% 39.8% 24.5% 7 97.5% 48.5% 18.5% 8 99.5% 39.8%
9 99.3%
Table 17. Adjustment percentages (Adjustment%) by cut-off date and fishing month for St. Thomas/St. John lobster.
Fishing Month
November 30, 2010
December 31, 2010
January 31, 2011
February 28, 2011
March 31, 2011
1 49.1% 44.5% 44.5% 37.3% 37.3% 2 40.8% 35.7% 35.7% 29.6% 26.5% 3 33.3% 33.3% 33.3% 26.0% 24.0% 4 41.4% 31.3% 31.3% 25.3% 24.2% 5 N/A 52.5% 52.5% 47.5% 45.5% 6 N/A 44.4% 38.4% 30.3% 7 N/A 61.9% 38.1% 8 N/A 32.9%
9 N/A

54
Table 18. The total number of fishermen who reported landings, and the total fishing trips, and the total commercial landings, for all fishing years in the USVI. Data provides insight to annual variability and is available for the fishing year ranges of 1998-2012 for St. Croix and 2000-2012 for St. Thomas/St. John.
STT/STJ
STX
Fishing
Year
Total Number of Fishermen
Total Trips
Total Landings
(lb)
STX Total Number of Fishermen
STX Total Trips
Total Landings
(lb)
1998-1999 N/A N/A N/A 156 21,180 611,214
1999-2000 N/A N/A N/A 141 22,689 722,369
2000-2001 119 22,393 676,946 150 27,072 857,944
2001-2002 122 24,927 797,470 160 35,153 1,163,231
2002-2003 122 24,169 834,806 158 34,672 1,064,433
2003-2004 108 22,397 781,444 156 31,641 997,950
2004-2005 100 23,432 785,788 137 31,212 1,022,807
2005-2006 101 20,954 739,385 134 35,435 1,355,234
2006-2007 96 21,516 767,267 130 32,721 1,314,495
2007-2008 96 19,882 699,753 129 28,933 1,036,647
2008-2009 95 19,974 704,592 118 30,396 1,079,068
2009-2010 96 19,700 702,021 114 25,875 740,162
2010-2011 82 16,123 540,708 104 25,431 782,577
2011-2012 108 16,499 412,826 91 24,211 509,013

55
Table 19. For each island group, the total landings (lb) and total fishing trips by fishing year and Species Group. These final landings are the observed landings for each fishing year used in each retrospective species model.
STT/STJ Snapper
STT/STJ Lobster
STX Parrotfish
STX Lobster
Fishing Year
Total Trips
Total Landings
Total Trips
Total Landings
Total Trips
Total Landings
Total Trips
Total Landings
1998-1999 N/A N/A N/A N/A 3,403 224,259 1,432 44,686
1999-2000 N/A N/A N/A N/A 3,547 241,980 1,980 64,116
2000-2001 3,562 163,942 1,234 79,445 3,854 252,472 2,842 101,793
2001-2002 3,894 170,816 1,519 100,537 4,686 346,019 3,648 126,800
2002-2003 3,769 169,701 1,643 126,528 4,357 264,247 3,363 108,266
2003-2004 3,286 141,291 1,717 140,221 4,001 286,521 3,512 122,061
2004-2005 3,256 145,408 1,715 121,534 4,233 326,411 3,276 107,663
2005-2006 3,160 164,923 1,474 136,698 5,004 412,241 4,066 139,105
2006-2007 3,259 168,838 1,445 127,622 4,789 469,610 4,172 157,022
2007-2008 2,915 149,036 1,475 110,690 4,774 338,088 4,152 156,955
2008-2009 2,941 148,607 1,428 118,266 4,817 395,352 3,874 157,839
2009-2010 2,914 137,355 1,355 113,574 3,778 194,684 3,450 131,715
2010-2011 2,272 99,140 1,170 99,713 3,426 193,512 3,679 155,985
2011-2012 1,925 55,473 1,067 82,747 5,348 115,508 1,974 84,704

56
Examples of Summary Tables (20-22)10
Table 20. Example of summary statistics, providing the mean value of landings for each fishing month of the total bootstrap sequence. N is equal to the number of bootstrap runs; mean is the mean value of the pounds for that fishing month after N bootstrap runs. The standard deviation, minimum and maximum were not used in any calculations.
FYR FMO N Mean Std. Dev Minimum Maximum
2011-2012 1 250 9630.8 236.8 8431.0 10384.0 2011-2012 2 250 10190.9 195.5 9556.0 10716.0 2011-2012 3 250 5542.4 151.4 5024.0 5964.0 2011-2012 4 250 7896.1 263.3 7155.0 8532.0 2011-2012 5 250 6293.5 292.9 5446.0 7064.0 2011-2012 6 250 4787.9 286.0 3750.0 5409.0 2011-2012 7 250 230.1 84.0 26.0 471.0 2011-2012 8 2011-2012 9 2011-2012 10 2011-2012 11
2011-2012 12 Table 21. Example of summary statistics for the total pounds landed by fishing month for a specified fishing year. The sum (of landings) for 12 fishing month provides the value of the total observed landings (PoundsFYR) for the historical fishing year being analyzed.
FMO N Obs Sum FMO_NAME 1 1 10798 July 2 1 11283 August 3 1 6417 September 4 1 10877 October 5 1 8798 November 6 1 8167 December 7 1 7506 January 8 1 8986.5 February 9 1 11082 March 10 1 10073 April 11 1 11811 May 12 1 9709 June
10 The three tables used in tables 20-22 were summary tables generated for STX Parrotfish, with a cut-off date of January 31, 2011, in the 2011-2012 fishing year.

57
Table 22. Example of summary statistics generated for the average historical cumulative percent of landings by fishing month for a fishing year, including the mean, standard deviation, upper and lower confidence 95% interval and ranges. N is equal to the number of fishing years minus the year being analyzed. In this example, there are 14 data years in St. Croix from 1998-2012, minus the year being analyzed, therefore N=13. The columns for the Upper and Lower 95% confidence limits are calculated by equations (10) and (11). The values from the same row in which the fishing month (FMO) is equal to the cut-off date (minus one) are used to calculate the final annual predictions. FMO N Mean Std Dev Minimum Maximum Lower CI Upper CI 1 13 10.5 1.0 9.2 11.9 10.0 11.0 2 13 21.0 2.5 17.1 25.9 19.7 22.3 3 13 30.1 3.6 23.0 34.7 28.1 32.1 4 13 38.4 3.9 31.5 46.8 36.3 40.5 5 13 46.1 4.1 39.7 56.8 43.9 48.4 6 13 53.6 4.2 49.2 65.5 51.3 55.9 7 13 61.8 4.1 56.9 73.2 59.6 64.0 8 13 69.5 3.2 65.1 78.0 67.7 71.3 9 13 78.2 2.7 73.3 84.5 76.8 79.7 10 13 86.1 1.8 82.5 90.2 85.1 87.1 11 13 93.5 1.5 90.2 95.6 92.7 94.3 12 13 100.0 0.0 100.0 100.0 100.0 100.0

58
Figure 3. Total historical fishing trips by fishing year for St. Croix parrotfish and lobster.
Fishing Year
1998-1
999
1999-2
000
2000-2001
2001-2002
2002-2003
2003-2004
2004-2005
2005-2006
2006-2007
2007-2008
2008-2009
2009-2010
2010-2
011
2011-2
012
Fis
hin
g
Tr
ips
0
1000
2000
3000
4000
5000
Parrotfish Trips
Lobster Trips

59
Figure 4. Total historical landings (1x10³ lb) by fishing year for St. Croix parrotfish and lobster.
Fishing Year
1998-1
999
1999-2
000
2000-2001
2001-2002
2002-2003
2003-2004
2004-2005
2005-2006
2006-2007
2007-2008
2008-2009
2009-2010
2010-2
011
2011-2
012
La
nd
ing
s
(1x
103
lb
)
0
100
200
300
400
500
Parrotfish Landings
Lobster Landings

60
Figure 5. Total historical fishing trips by fishing year for St. Thomas/St. John snapper and lobster.
Fishing Year
2000-2
001
2001-
2002
2002-2
003
2003-2
004
2004-2
005
2005-2
006
2006-2
007
2007-2
008
2008-2
009
2009-2
010
2010
-2011
2011
-2012
Fis
hin
g
Tr
ips
0
1000
2000
3000
4000
Snapper Trips
Lobster Trips

61
Figure 6. Total historical landings (1x10³ lb) by fishing year for St. Thomas/St. John snapper and lobster.
Fishing Year
2000-2001
2001-2002
2002-2003
2003-2004
2004-2005
2005-2006
2006-2007
2007-2008
2008-2009
2009-2010
2010-2
011
2011-2
012
La
nd
ing
s
(1x
103
lb
)
0
20
40
60
80
100
120
140
160
Snapper Landings
Lobster Landings

62
Figure 7. Confidence interval range of predicted landings (lb) to determine the ideal number of bootstrap sample runs for St. Croix parrotfish.
Figure 8. Confidence interval range of predicted landings (lb) to determine the ideal number of bootstrap sample runs for St. Thomas/St. John snapper.
Number of Bootstrap Runs
0200
400600
8001000
1200
Conf
iden
ce In
terv
al R
ange
of P
redi
cted
Lan
ding
s (lb
)
38500
39000
39500
40000
40500
41000
41500
CL Range of Predicted Pounds VSNumber of Runs
Number of Bootstrap Runs
0200
400600
8001000
1200
Conf
iden
ce In
terv
al R
ange
of P
redi
cted
Lan
ding
s (l
b)
18000
18500
19000
19500
20000
20500
21000
21500
CL Range of Predicted Pounds VSNumber of Runs
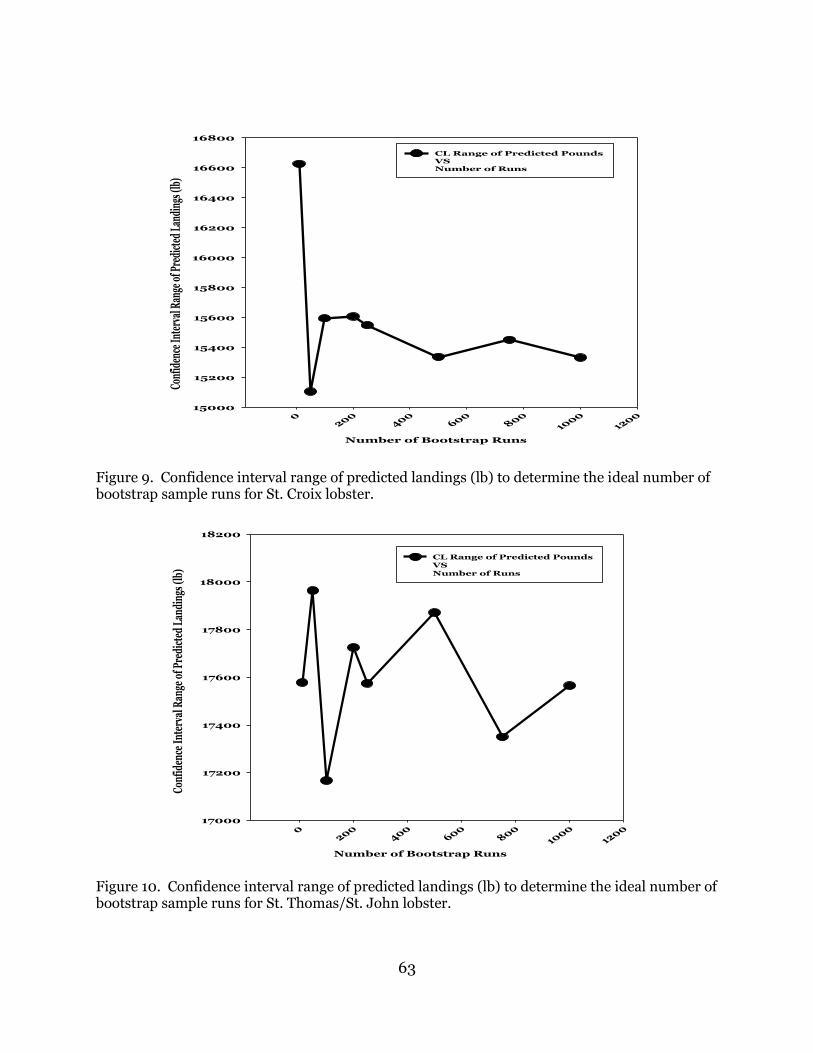
63
Figure 9. Confidence interval range of predicted landings (lb) to determine the ideal number of bootstrap sample runs for St. Croix lobster.
Figure 10. Confidence interval range of predicted landings (lb) to determine the ideal number of bootstrap sample runs for St. Thomas/St. John lobster.
Number of Bootstrap Runs
0200
400600
8001000
1200
Conf
iden
ce In
terv
al R
ange
of P
redi
cted
Lan
ding
s (lb
)
15000
15200
15400
15600
15800
16000
16200
16400
16600
16800
CL Range of Predicted Pounds VSNumber of Runs
Number of Bootstrap Runs
0200
400600
8001000
1200
Conf
iden
ce In
terv
al R
ange
of P
redi
cted
Lan
ding
s (l
b)
17000
17200
17400
17600
17800
18000
18200
CL Range of Predicted Pounds VSNumber of Runs

64
Fishing Month
1 2 3 4 5 6 7 8 9 10 11 12
Cu
mu
lati
ve
His
tor
ica
l
Pe
rc
en
t o
f L
an
din
gs
(%
)
0
10
20
30
40
50
60
70
80
90
100
Mean
Minimum
Maximum
Lower 95% CL
Upper 95% CL
Figure 11. Cumulative historical percent of landings (%), averaged by fishing month over 12 fishing years, for St. Thomas/St. John Snapper.
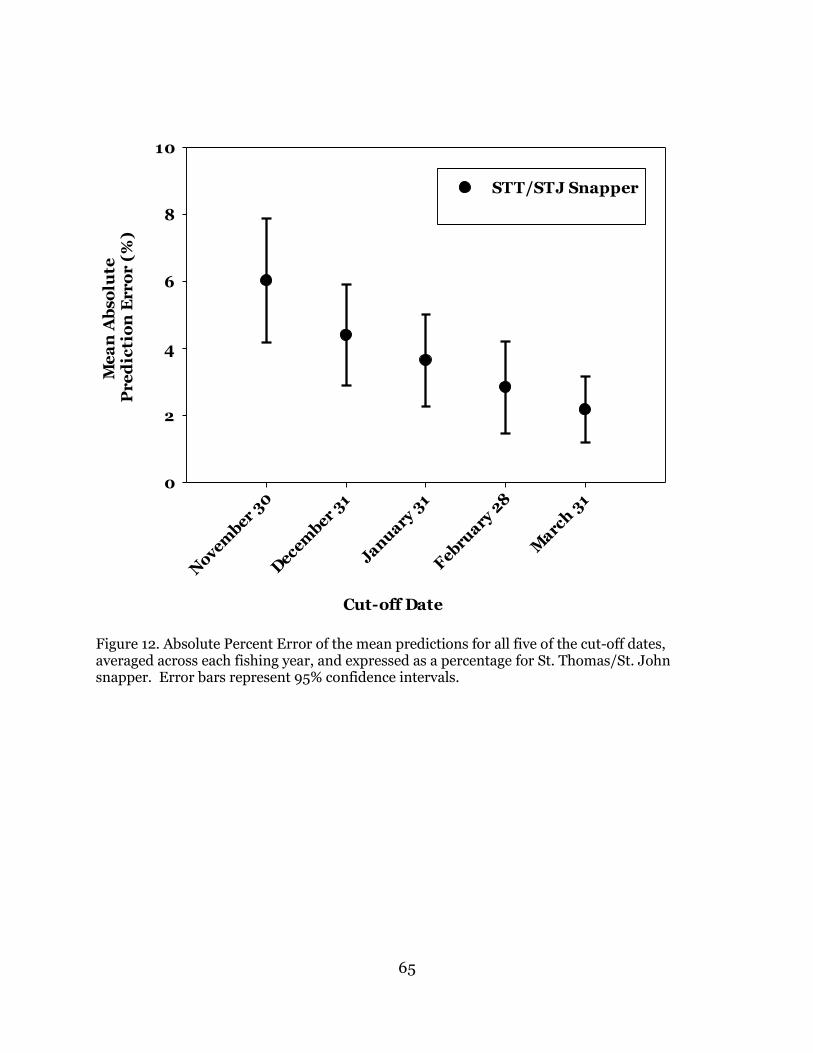
65
Cut-off Date
Novem
ber 30
Decem
ber 31
January
31
February
28
Marc
h 31
Me
an
Ab
so
lute
P
re
dic
tio
n E
rro
r (
%)
0
2
4
6
8
10
STT/STJ Snapper
Figure 12. Absolute Percent Error of the mean predictions for all five of the cut-off dates, averaged across each fishing year, and expressed as a percentage for St. Thomas/St. John snapper. Error bars represent 95% confidence intervals.

66
Cut-off Date
Novem
ber 30
Decem
ber 31
January
31
Febru
ary 2
8
Marc
h 3
1
Me
an
Ab
so
lute
P
re
dic
tio
n E
rro
r
(lb
)
0
2000
4000
6000
8000
10000
12000
STT/STJ Snapper
Figure 13. Absolute Percent Error of the mean predictions for all five of the cut-off dates, averaged across each fishing year, and expressed in pounds for St. Thomas/St. John snapper. Error bars represent 95% confidence intervals.

67
Fishing Month
1 2 3 4 5 6 7 8 9 10 11 12
Cu
mu
lati
ve
His
tor
ica
l
Pe
rc
en
t o
f L
an
din
gs
(%
)
0
10
20
30
40
50
60
70
80
90
100
Mean
Minimum
Maximum
Lower 95% CL
Upper 95% CL
Figure 14. Cumulative Historical Percent of Landings (%) averaged over 12 fishing years by fishing month, for St. Thomas/St. John Lobster.

68
Cut-off Date
Novem
ber 30
Decem
ber 31
January 3
1
February
28
Marc
h 31
Me
an
Ab
solu
te
Pre
dic
tio
n E
rro
r (%
)
0
2
4
6
8
10
12 STT/STJ Lobster
Figure 15. Absolute Percent Error of the mean predictions for all five of the cut-off dates, averaged across each fishing year, and expressed as a percentage for St. Thomas/St. John lobster. Error bars represent 95% confidence intervals.
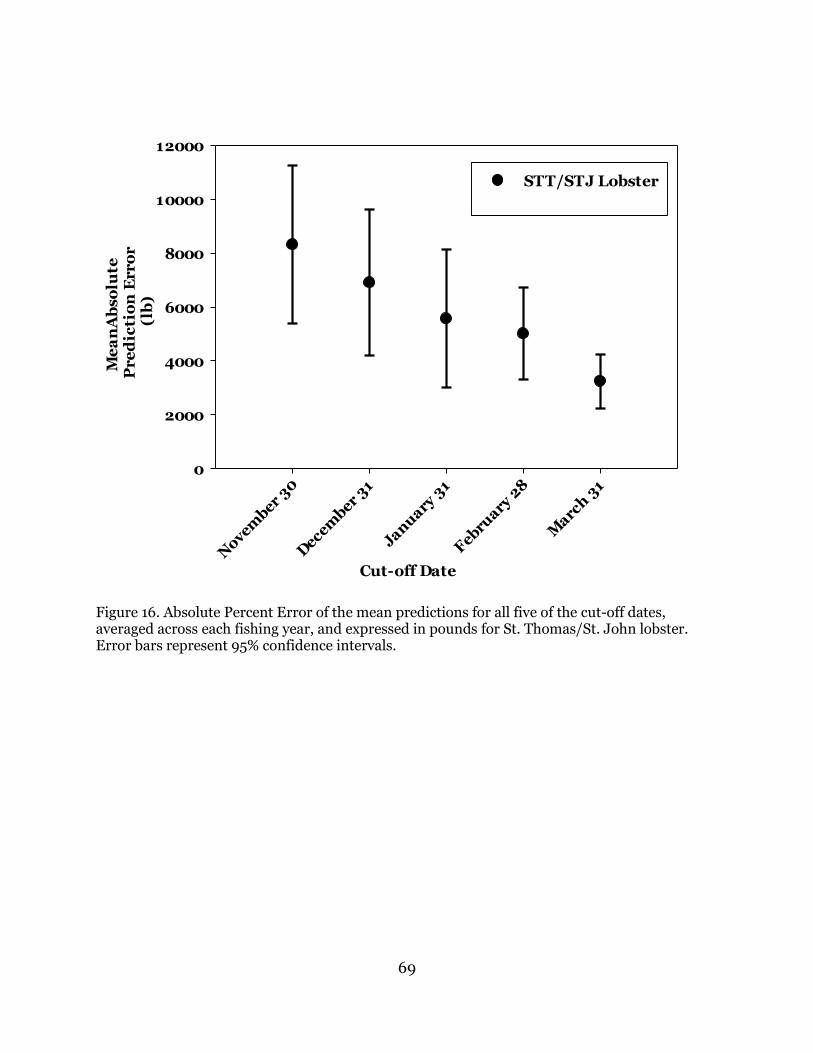
69
Cut-off DateN
ovember
30
Decem
ber 31
January 3
1
February
28
Marc
h 31
Me
an
Ab
so
lute
P
re
dic
tio
n E
rro
r
(lb
)
0
2000
4000
6000
8000
10000
12000
STT/STJ Lobster
Figure 16. Absolute Percent Error of the mean predictions for all five of the cut-off dates, averaged across each fishing year, and expressed in pounds for St. Thomas/St. John lobster. Error bars represent 95% confidence intervals.
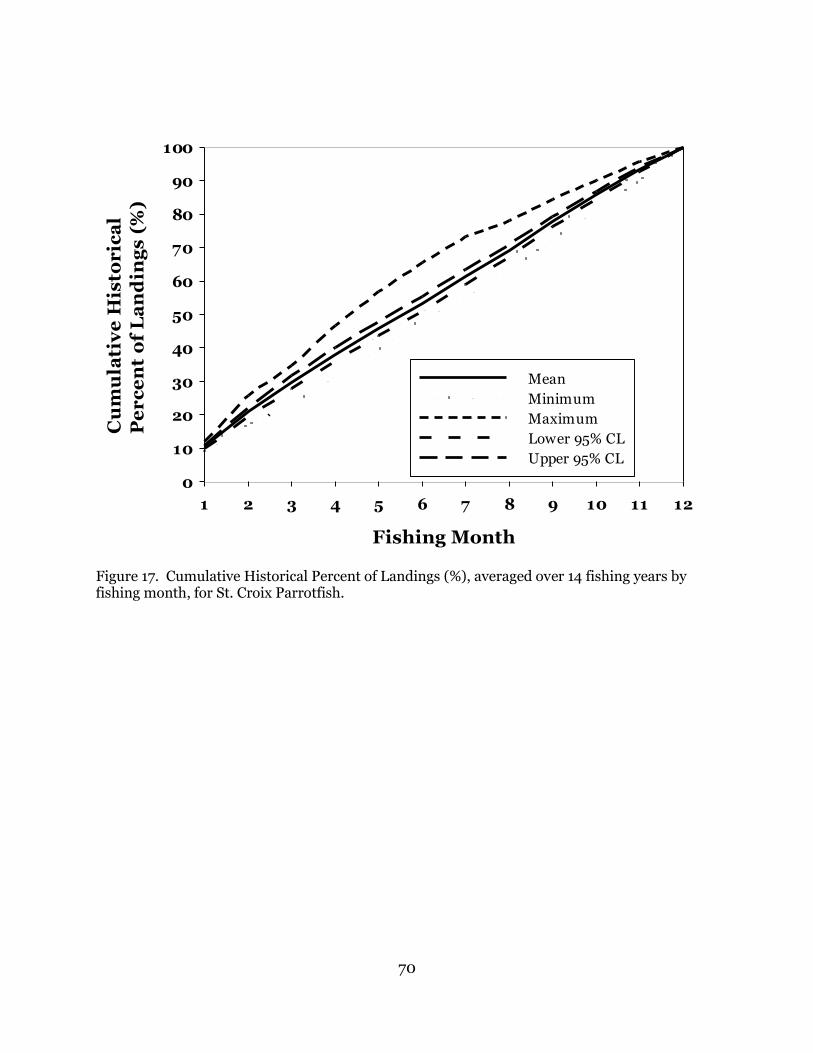
70
Fishing Month
1 2 3 4 5 6 7 8 9 10 11 12
Cu
mu
lati
ve
His
tor
ica
l
Pe
rc
en
t o
f L
an
din
gs
(%
)
0
10
20
30
40
50
60
70
80
90
100
Mean
Minimum
Maximum
Lower 95% CL
Upper 95% CL
Figure 17. Cumulative Historical Percent of Landings (%), averaged over 14 fishing years by fishing month, for St. Croix Parrotfish.

71
Cut-off Date
Novem
ber 30
Decem
ber 31
January
31
February
28
Marc
h 31
Me
an
Ab
so
lute
Pre
dic
tio
n E
rro
r (
%)
0
2
4
6
8
10
12
14
16STX Parrotfish
Figure 18. Absolute Percent Error of the mean predictions for all five of the cut-off dates, averaged across each fishing year, and expressed as a percentage for St. Croix parrotfish. Error bars represent 95% confidence intervals.

72
Cut-off Date
Novem
ber 30
Decem
ber 31
January 3
1
February
28
Marc
h 31
Me
an
Ab
so
lute
P
re
dic
tio
n E
rro
r
(lb
)
0
10000
20000
30000
40000
STX Parrotfish
Figure 19. Absolute Percent Error of the mean predictions for all five of the cut-off dates, averaged across each fishing year, and expressed in pounds for St. Croix parrotfish. Error bars represent 95% confidence intervals.

73
Fishing Month
1 2 3 4 5 6 7 8 9 10 11 12
Cu
mu
lati
ve
His
tor
ica
l
Pe
rc
en
t o
f L
an
din
gs
(%
)
0
10
20
30
40
50
60
70
80
90
100
Mean
Minimum
Maximum
Lower 95% CL
Upper 95% CL
Figure 20. Cumulative Historical Percent of Landings (%) averaged over 14 fishing years by fishing month, for St. Croix Lobster.

74
Cut-off Date
Novem
ber 30
Decem
ber 31
January
31
February
28
Marc
h 31
Me
an
Ab
so
lute
P
re
dic
tio
n E
rro
r (
%)
2
4
6
8
10
12 STX Lobster
Figure 21. Absolute Percent Error of the mean predictions for all five of the cut-off dates, averaged across each fishing year, and expressed as a percentage for St. Croix lobster. Error bars represent 95% confidence intervals.

75
Cut-off Date N
ovember
30
Decem
ber 31
January
31
Febru
ary 2
8
Marc
h 3
1
Me
an
Ab
so
lute
P
re
dic
tio
n E
rro
r
(lb
)
2000
4000
6000
8000
10000
12000
14000 STX Lobster
Figure 22. Absolute Percent Error of the mean predictions for all five of the cut-off dates, averaged across each fishing year, and expressed in pounds for St. Croix lobster. Error bars represent 95% confidence intervals.

76
Chapter Four: Summary and Discussion
Given the challenges due to late-reporting, the focus of this study was to create an
in-season modelling approach to predict the total annual catch relative to the ACL, while
also providing fishery managers with the relative accuracy of the model at different
dates (i.e., cut-off dates) within the fishing year. The predictions offer in-season
guidance to fishermen that may allow them to adjust their fishing practices and shift
their efforts to other species groups to prevent ACLs from being exceeded, while also
maintaining their commercial fishing lifestyle. There is a quantifiable error rate on each
prediction that declines as the cut-off date approaches the end of the season, however,
the ability of fishers to adjust their approach to avoid potential overruns is also reduced.
Accounting for Late-Reporting
Because CCR forms have changed numerous times throughout the managed
fishing years, except for the 2010-2011 fishing year, historical data are lacking the DPNR
date stamps. Due to the prevalence of late-reported data and variability in the number
of licensed fishermen (Holt and Uwate, 2004), the total population of fishermen and the
total number of trips is unknown at any point during the fishing year. The lack of
submission date data for any other year required the assumption that the 2010-2011
reporting trends were a reasonable representation of future trends. This assumption is
77
supported by an analysis of average historical cumulative landings by fishing month,
which shows little inter-annual or seasonal variability.
There is a moratorium on new commercial fishing in the USVI, and this has
provided some stability in the number of fishers and their landings. Kojis and Quinn
(2012) described the socioeconomic and demographics of the USVI through interviews
of over 25o licensed commercial fishers. Results had not changed notably from the
similar census which they also conducted in 2003-2004 (Kojis, 2004). Fishing still
occurred on average during the day, with similar ranges of time spent fishing, selling
their catch, or fixing their boats. The fishermen are, on average, slightly above 50, with
over 20 years of experience. The multi-species, multi-gear approach is still the
operating mode of the fishery. One major difference from the 2003 to 2010 census is
that there was a 15% increase in fishermen in STT/STJ who relied on fishing as 100% of
their income. Therefore, fishing approaches and reporting patterns are consistent from
year to year, with only minor differences occurring in the execution of each fishery other
than the actual catch, and are reflective of the historical data that was used to build the
model and make the predictions. Although the evidence indicates that fishing and
reporting patterns are similar among years, there is no practical method of verifying
without the exact submission dates of every single report.
Retrospective Test of Model Performance Using Expansion Factors
The model’s performance was tested on historical data for individual fishing
years and species groups to determine how well it predicted the observed landings at the

78
end of the fishing year. For each of the four modeled species, and for all fishing years,
the total mean predictions by the cut-off date values varied by less than one percent
error among years. This indicates that the error distribution from the bootstrap method
(with appropriate number of realizations) accounts for all possibilities of high and low
landings, due to the variability in late reporting among different species groups.
However, STT/STJ lobster showed a higher trip-level variability (as seen in Figure 10)
than the three other modeled species (Figures 7-9); therefore, predictions could be
expected to be less accurate for this species as they are more dependent upon whether
the received trips were representative of the overall trend.
The average historical cumulative sum of landings by fishing month was then
used to expand the total mean predicted landings by the cut-off date for a total annual
prediction (Figures 11, 14, 17 and 20). The historical cumulative percent of landings by
fishing month for STT/STJ snapper (Figure 11) are very linear, which suggests very little
seasonality or inter-annual variability in the percent of cumulative landings attained
each month. Lobster in STT/STJ (Figure 14) shows variability in the fishing months of
November through March, as do Parrotfish and Lobster in STX (Figures 17 and 20);
these increases in error estimates around the mean during the fall and winter months
can likely be attributed to the fluctuation of landings due to tourism, or the
implementation of regulations just prior to these harvest months. .
79
In-season Projections and Predictive Capability
The STT/STJ average snapper error rates decreased with each cut-off date of
November 30th to March 31st from 6.0% (±1.9% CI) to 2.2% (1%CI), and lobster error
rates decreased from 7.8% (±3.4% CI) to 3.1% (±1.1% CI). The results for STX
essentially mirror the results for STT/STJ; parrotfish error rates decreased with each
cut-off date of November 30th to March 31st from 8.7% to 3.8%, and lobster error rates
decreased from 6.8 % to 4.6%. The 95% confidence intervals were also considerably
successful, deviating by no more than 5%. These results showed that there was a larger
percent error for predictions made with less data available earlier in the fishing year, but
show a declining trend in error nearing the end of the fishing year.
Valuable insight arises from the anticipated future application of an in-season
predictor of total landings for a species or species group. Comparing cut-off dates
allowed evaluation of modeled results in time frames that are of practical significance to
fishery managers. This includes maximizing fishing efforts by informing the fishermen
where their landings are relative to the ACL for several species, such as if they are
predicted to exceed or fall short of ACLs, with a confidence of less than 10 percent error.
As the fishing year progresses and more data become available, subsequent predictions
can be made, with increasing confidence in the prediction. This provides in-season
guidance that if fishers continue their efforts in the same way, they could exceed the
ACL, and they will also have to contend with the post-season AMs, such as reducing the
length of the fishing season. Instead, fishermen can take advantage of this in-season
monitoring system to shift efforts to species not expected to exceed their ACLs. This

80
approach will facilitate maximizing landings for all species while avoiding post season
AMs. Effective utilization of this approach to maximize income may require fishermen
to adjust their in-season practices, including gears used and species targeted
As would be expected, the best predictions (as seen by a declining trend in error
rates) will be realized near or at the end of the year, when most or all of the actual
landings data are available and little is left for prediction. However, this approach limits
the time frame for the fishers and fishery managers to respond to the model predictions.
Thus, there is a critical trade-off realized from the predictive capability of this estimator,
between obtaining accurate predictions, and providing the outcomes to fishers and
managers in time for them to reallocate fishing effort, and is essential to the success of
this model’s application. For the purpose of this study, a cut-off date of March 31st
provides a response time of three months, and was considered to be the minimum
practical; however, comparing multiple cut-off dates allowed for a consideration of the
tradeoff between prediction accuracy and response time.
Assuming the 2010-2011 fishing year was a reasonable indicator of future trends
in timeliness of reporting, the cumulative landings distributions suggest that the area
with the largest contributor of variability produced in this study is during the middle of
the fishing year (November-March). This time period is also the period that must be
used in making in-season predictions on annual landings (Figures 11, 14, 17, 20). In
addition to providing an estimate of total annual landings in the absence of an in-season
quota closure, the cumulative landing trend can also predict the trajectory of total

81
landings, which helps managers determine when, during the fishing season, the ACL
will be met.
Variability among Fishing Years
Given that this model is based on mean predictions, it is necessary to identify the
outliers, such as what year seems to be driving the model and to explain which factors
may be causing the largest deviations. Some of these explanatory variables may have
influenced the accuracy of the model and should be considered in future forecasting,
including, but are not limited to, management measures, fishermen perception, tourism
and perhaps weather and climate.
STT/STJ and STX Lobster
A primary year for concern for STT/STJ lobster was in the 2000-2001 fishing
year, in which landings were underestimated by 18.3% with a November cut-off date.
However, the error for the March 31st cut-off date decreased to 6.3%, suggesting that
more reports were submitted later in the fishing year. In July of 2002, a 3-year
moratorium was issued to limit the number of new commercial fishing permits to be
implemented in the USVI EEZ (67 FR 43558). It became apparent during the
development of the moratorium that many fishermen did not have, and were unaware of
the requirement of, permits. After the implementation of this amendment, many of
these fishermen obtained permits. Predictions underestimated catches through the

82
2002-2003 fishing year, and resulted in overestimates in the 2003-2004 fishing year by
less than 6%, and in the 2004-2005 fishing year by less than 7%.
Spiny lobsters in the USVI are not locally recruited; their larva travel with oceanic
currents over large geographic areas, such as from the coast of Brazil (73 FR 64295;
Saul, 2004). As such, the productivity of lobster resources in the Caribbean basin can
fluctuate inter-annually, independently of local depletion. In November of 2008,
Amendment 4 to the Caribbean spiny lobster FMP was implemented to establish
minimum size restrictions for importation of spiny lobster into the U.S. to increase the
spawning biomass and increase long term yield in the fishery (73 FR 64295). For STX
lobster, the reported landings were 156,955 pounds in the 2007-2008 fishing year, and
the model overestimated landings by 6.7% to 12.8%. The landings in 2006-2007 were
157,021 pounds, with a percent error of 3.38%, and in 2008-2009, the landings were
157,839 pounds, with 2.71% error. Perhaps an influential source of error was the
implementation of this amendment, which may have resulted in a decrease in reported
landings due to either restrictions on harvest or a disincentive of timely and/or accurate
reporting, (or in this case, export to the U.S.), thus explaining why the model
overestimated landings.
In 2011, the Comprehensive ACL Amendment for the U.S. Caribbean established
ACLs and AMs for several species, including lobster (76 FR 82414; CFMC, 2011b).
Though implementation of the ACL was not in effect until January 2012, the ACL for
STT/STJ lobster was set to 104,199 lb. Landings were 113,574 lb in the 2009-2010
fishing year, and dropped to 99,712 lb in the 2010-2011 fishing year, resulting in an
83
overestimation of catch by 17.7% using a February 28th cut-off date, but with a decrease
to 6.3% using a March 31st cut-off date. The ACL for lobster in STX was set at 107,307
pounds, and was also implemented in January 2012. The total annual landings were
155,985 pounds in 2010-2011, and dropped to 84,704 pounds the following fishing year
(2011-2012), resulting in an underestimation of catch by 15-18% for all cut-off dates.
STX Parrotfish
Due to the political controversy that may influence the range of approaches to
reporting parrotfish, it can be expected that there would be more error around the
predictions (Grace-Mccaskey, 2012). Interviews were conducted on STX during the
time period of March of 2009 through December of 2010 to explore the commercial
fishers’ perceptions of the fisheries management process (Grace-Mccaskey, 2012).
There was a common view among fishers that they are held accountable for perceived
overfishing, when in fact the degeneration of the reefs and pollution from local
industries may have a greater effect on fish populations. Also, fishermen felt that there
was a need to regulate fisheries to maintain sustainable populations, but currently there
were too many regulations, creating a trade-off to earn a livable income from fishing.
The overall responses suggest that there is a disparity, similar to Marten’s (2004)
description of the “Western-Style approach,” that exists between the federal
management measures implemented in smaller, island-based communities. There is
insufficient enforcement which would be necessary to carry out these regulations in the
USVI; regardless, many fishermen explained the lack of trust in authoritative
government agencies, and their indifference is seen through resisting the regulations or

84
by not providing honest data (Adams, 1996; MRAG, 2004; Rogers and Beets, 2001;
Heyman and Granados-Dieseldorff, 2012; Grace-Mccaskey, 2012).
There was a substantial decrease in landings for parrotfish in STX since 2007,
which can likely be attributed to the Comprehensive Amendment to the FMPs in the
U.S. Caribbean (70 FR 62073; CFMC, 2005); revisions included gear restrictions and
seasonal closures (Tobias and Toller, 2007), which were implemented in November
2005 to federal waters, and in 2008 for territorial waters. In 2008-2009, the observed
historical landings were 395,352 pounds, and dropped to 194,684 pounds in 2009-
2010, resulting in an overestimation of catch by over 22%. In the 2010-2011 and the
2011-2012 fishing years, the error fluctuated between 3.5% and 18.5%, but all
predictions were underestimations. Although there was a reported decrease in landings
in 2011-2012, there was a drastic increase in reported trips. The resulting challenge is
determining whether the model is more accurate than the reported landings due to the
reluctance of the fishermen to report all of their landings, whether they overfished the
year before which may have substantially affected the parrotfish stock, or some other
unidentified influential variable.
STT/STJ Snapper
In STT/STJ, there was an underestimation of snapper landings by 3-9.5% for
both of the FYRs of 2000-2001 and 2005-2006. Due to the implementation of the 2010
ACL Amendment, the STT/STJ snapper ACL was set to 133,775 pounds. Before the
implementation of the ACL, the total annual landings were 137,354 pounds in 2009-

85
2010. In 2010-2011, landings decreased to 99,139 pounds, and in 2011-2012, the annual
landings dropped further to 55,473 pounds. The model overestimated those fishing
years by 0.3% to 12.6% through all cut-off dates.
Other Variables and Future Studies
Other than management measures, there are several other variables that may be
considered that could contribute further to the accuracy of the predictions, and the
model could potentially be rebuilt with those new input variables each year, including
tourism, and major storm events.
The tourism industry has been continuously growing in the USVI since the
1960’s, though it is more prevalent in STT/STJ than STX (Kojis and Quinn, 2012).
Cruise ship travel has doubled since the 1990’s, bringing nearly two million passengers a
year to the islands (Impact Assessment, Inc., 2007; Caribbean Tourism Organization,
2013). During the time period from January through September, there were over
500,000 visitors to the USVI in 2013, with ‘winter season’ considered to be January
through April. Parrotfish in STX and snapper in STT/STJ are local fisheries which
fishers harvest at a steady rate, and there is less seasonality and tourism affecting the
total landings for these species; however, snapper in STT/STJ are more affected by
tourism than parrotfish, since it is a more traveled island than STX, and because it is a
more well-known and consumed species by travelers (Grace-Mccaskey, 2012). In
contrast, the tourism industry on each island contributes to the increased landings

86
during the fall and winter months for lobsters. Future studies may consider looking at
the correlation of tourism trends on the islands and the impacts on these fisheries.
Historical hurricane data, such as wind speed data from weather buoys in the
USVI, could be applied to the model to use as an identifier to improve the model, and to
test for the actual veracity to the reports. For example, if reporting patterns showed that
there were a large number of landings when the wind speed was over a specified speed,
(i.e. a very windy day of over 15 knots, for example), then a subsequent assumption
would be that there is less reliability in the report. Furthermore, future studies could
include looking at the distribution of trip reporting relative to time periods when
hurricanes passed through the USVI, such as if reported trips fell below the average for a
particular date. However, it may be difficult to quantify, with a reasonable amount of
confidence, that hurricanes were the major cause of decreased landings when the
average percent error of the predictions were less than 10 percent. Additionally,
because there are only four accessible data buoy centers located in the USVI, and many
CCR forms are missing vital information, such as the exact location in which the fishing
took place, many assumptions and speculations can increase the error of the results.
The application of this model used in conjunction with current management
measures will provide fishery managers with the means necessary to make informed
decisions on the status of in-season landings, and help to sustainably manage USVI
commercial fisheries. In the future when this model is employed, the previously
mentioned factors that would allow the explanation for some additional variability

87
should be considered; incorporating these factors further enhance the accuracy of
model predictions.
The only unverifiable assumption in the model is that late-reporting proceeds in a
consistent manner each year, thus timely reporting would enhance the reliability of in-
season forecasting methods. Requiring that submission dates be added to the database
during data entry would strengthen the model because the mean adjustment
percentages could be calculated, as well as the inter-annual variability in the monthly
percentages. However, cooperation between territorial and federal management
agencies would be required for full effectiveness. The implementation of electronic
logbooks in the USVI would facilitate the reports to be landed in a timelier manner or
even ‘real-time.’ Additionally, storm events, or the implementation of management
measures may cause an overestimation of landings by affecting the average, timely,
and/or accuracy of reporting, and by incorporating those factors into the model,
additional variability could be identified, hence, improving annual predictions.

88
References Adams, T. J.H. 1996. Coastal Fisheries and Marine Development Issues for Small
Islands. Marine and Coastal Workshop, in Association with the World Conservation Congress. Montreal, October 17-18, 1996.
Beets, J. 1997. Can Coral Reef Fish Assemblages be Sustained as Fishing Intensity
Increases? Proceedings for the 8th International Coral Reef Symposium 2:2009-2004.
Caribbean Tourism Organization. 2013. Latest Statistics. November 22, 2013.
Available online at: <http://www.onecaribbean.org/wp-content/uploads/Lattab13.pdf>
Caribbean Fishery Management Council (CFMC). 2005. Comprehensive Amendment to
the Fishery Management Plans (FMPs) of the U.S. Caribbean to Address Required Provisions of the Magnuson-Stevens Fishery Conservation and Management Act: Amendment 2 to the FMP for the Spiny Lobster Fishery of Puerto Rico and the U.S. Virgin Islands; Amendment 1 to the FMP for Queen Conch Resources of Puerto Rico and the U.S. Virgin Islands; Amendment 3 to the FMP for the Reef Fish Fishery of Puerto Rico and the U.S. Virgin Islands; Amendment 2 to the FMP for the Corals and Reef Associated Invertebrates of Puerto Rico and the U.S. Virgin Islands; Including Supplemental Environmental Impact Statement, Regulatory Impact Review, and Regulatory Flexibility Act Analysis. Caribbean Fishery Management Council, San Juan, Puerto Rico. May 24, 2005. 639 p.
Caribbean Fishery Management Council (CFMC). 2011a. Amendment 2 to the Fishery Management Plan for the Queen Conch Fishery of Puerto Rico and the U.S. Virgin Islands and Amendment 5 to the Reef Fish Fishery Management Plan of Puerto Rico and the U.S. Virgin Islands; Including Final Environmental Impact Statement, Regulatory Impact Review, and Initial Regulatory Flexibility Analysis. Caribbean Fishery Management Council, San Juan, Puerto Rico. September 22, 2011. 647 p.

89
Caribbean Fishery Management Council (CFMC). 2011b. Comprehensive Annual Catch Limit (ACL) Amendment for the U.S. Caribbean, Amendment 6 to the Reef Fish Fishery Management Plan of Puerto Rico and the U.S. Virgin Islands; Amendment 5 to the Fishery Management Plan for the Spiny Lobster Fishery of Puerto Rico and the U.S. Virgin Islands; Amendment 3 to the Fishery Management Plan for the Queen Conch Resources of Puerto Rico and the U.S. Virgin Islands; and Amendment 3 to the Fishery Management Plan for Corals and Reef Associated Plants and Invertebrates of Puerto Rico and the U.S. Virgin Islands; Including Final Environmental Impact Statement, Biological Assessment, Regulatory Impact Review, Initial Regulatory Flexibility Analysis, and Social Impact Assessment. Caribbean Fishery Management Council, San Juan, Puerto Rico. October 25, 2011. 407 p.
Cooper, A. B. 2006. A Guide to Fisheries Stock Assessment, from Data to
Recommendations. National Oceanic and Atmospheric Administration. National Sea Grant College Program, Grant No. NA16RG1035. Edited by NH Sea Grant College Program. Available at: <Http://www.seagrant.unh.edu/stockassessmentguide.pdf>.
Department of Planning and Natural Resources (DPNR). 2012. United States Virgin
Islands Commercial and Recreational Fisher's Information Booklet. Department of Planning and Natural Resources, Division of Fish and Wildlife and Environmental Enforcement. St. Thomas, USVI. July 2012. Available at:
<Http://caribbeanfmc.com/pdfs/FishersBooklet%202012-JULY%20Final.pdf>. Grace-Mccaskey, C. 2012. Fishermen, Politics, and Participation: An
Ethnographic Examination of Commercial Fisheries Management in St. Croix, U.S. Virgin Islands. University of South Florida Graduate School Theses and Dissertations. Available online at: <Http://scholarcommons.usf.edu/etd/4054>.
Heyman, W. D., and Granados-Dieseldorff, P. 2012. The Voice of the Fishermen of the
Gulf of Honduras: Improving Regional Fisheries Management through Fisher Participation." Fisheries Research. 125-126:129-48.
Hinton, M. G., and Maunder, M. N. 2003. Methods for Standardizing CPUE and how
to Select Among Them. SCTB16. Inter-American Tropical Tuna Commission. La Jolla, Ca., July 2003.
Holt, M., and Uwate, K. R. 2004. Estimates of the Number of Licensed Commercial
Fishers Per Year in the U.S. Virgin Islands, 1974/75 to 2003/04. Bureaau of Fisheries, Division of Fish and Wildlife, Department of Planning and Natural Resources, U.S. Virgin Islands. July 2004.
Impact Assessment, Inc., 2007. Community Profiles and Socioeconomic Evaluations of
Marine Conservation Districts: St. Thomas and St. John, U.S. Virgin Islands. NOAA Series on U.S. Caribbean Fishing Communities. NOAA Technical Memorandum NMFS-SEFSC-557. Agar, J. J. and B. Stoffle (editors). 123 p

90
Kaiser, M. S. 2010. Development of an Estimator of Catch in the U.S. Virgin Islands and Puerto Rico. Prepared for Marine Resources Assessment Group Americas (MRAG). March 2010. 65 p.
Kojis, B. 2004. Census of the Marine Commercial Fishers of the U.S. Virgin Islands.
U.S. Virgin Islands. Caribbean Fishery Management Council, San Juan, PR. July 2004. 87 p.
Kojis, B. and Quinn, N. J. 2012. Census of the Marine Commercial Fishers of the U.S. Virgin Islands 2011. Department of Planning and Natural Resources, Division of Fish and Wildlife, U.S. Virgin Islands. March 27, 2012
Martens, O.P. 2004. The United States Caribbean: A New Approach to Shallow-Reef
Fish Management. Thesis submitted to Duke University, April 27th, 2004. Messineo, J. 2004. Compilation and Summary of Commercial Catch Report Forms
Used in the U.S. Virgin Islands. Department of Planning and Natural Resources, U.S. Virgin Islands. October 2004.
McCarthy, K, and Gedamke, T. 2008 United States Virgin Islands Fisheries Description
and Available Data. Caribbean Data Evaluation Workshop. July 18, 2008. Marine Resources Assessment Group (MRAG). 2004. Workshops to Assess Fishers’
Attitudes Toward Potential Capacity and Effort Reduction Programs in the U.S. Caribbean, Final Report Grant no. NA03NMF4540419. September 2004.
National Marine Fisheries Service (NMFS). 2002. Amendment 14 to the Fishery
Management Plan for the Coastal Migratory Pelagic Resources of the Gulf of Mexico and South Atlantic, and Amendment 20 to the Fishery Management Plan for the Reef Fish Resources of the Gulf of Mexico. U.S. Department of Commerce, Silver Spring, MD. 67 FR 43558. June 28, 2002. 43558-43565 pp.
National Marine Fisheries Service (NMFS). 2005. Comprehensive Amendment to the
Fishery Management Plans of the U.S. Caribbean. U.S. Department of Commerce, Silver Spring, MD. 70 FR 62073. October 28, 2005. 62073-62084 pp.
National Marine Fisheries Service (NMFS). 2007. Magnuson-Stevens Fishery Conservation and Management Act (MSA). 2007. U.S. Department of Commerce, Silver Spring, MD. Amended through January 12, 2007. 170 p.

91
National Marine Fisheries Service (NMFS). 2008. Amendment 4 to the Fishery Management Plan for the Spiny Lobster Fishery of Puerto Rico and the U.S. Virgin Islands as Prepared by the Caribbean Fishery Management Council, and Amendment 8 to the Fishery Management Plan for the Spiny Lobster Fishery of the Gulf of Mexico and South Atlantic, as Prepared by the Gulf of Mexico and South Atlantic Fishery Management Councils. U.S. Department of Commerce, Silver Spring, MD. 73 FR 64295. October 29, 2008. 64295-64300 pp.
National Marine Fisheries Service (NMFS). 2009. Magnuson-Stevens Fishery
Conservation and Management Reauthorization Act. U.S. Department of Commerce, Silver Spring, MD. 170 p.
National Marine Fisheries Service (NMFS). 2011. Amendments to the Queen Conch and
Reef Fish Fishery Management Plans of Puerto Rico and the U.S. Virgin Islands. U.S. Department of Commerce, Silver Spring, MD. 76 FR 82404. December 30, 2011. 82404-82412 pp.
National Marine Fisheries Service (NMFS). 2011. Amendments to the Reef Fish, Spiny
Lobster, Queen Conch and Coral and Reef Associated Plants and Invertebrates Fishery Management Plans of Puerto Rico and the U.S. Virgin Islands. U.S. Department of Commerce, Silver Spring, MD. 76 FR 82414. December 30, 2011. 82414-82419 pp.
Ralston, S, Punt, A.E., Hamel, O.S., DeVore, J.D., and Conser, R.J. 2011. A Meta-
Analytic Approach to Quantifying Scientific Uncertainty in Stock Assessments. Fishery Bulletin. 109: 217–231 pp.
Rogers, C.S., and Beets. J. 2001. Degradation of Marine Ecosystems and Decline of
Fishery Resources in Marine Protected Areas in the U.S. Virgin Islands. Environmental Conservation 28 (4): 312-322 pp.
Salas, S., Chuenpagdee, R., Seijo, J.C., and Charles, A. 2007. Challenges in the
Assessment and Management of Small-Scale Fisheries in Latin America and the Caribbean. Fisheries Research 87: 5-16 pp.
Saul, S. 2004. A Review of the Literature and Life History of the Caribbean Spiny
Lobster, Panulirus Argus. Caribbean Southeast Data Assessment and Review Workshop Report, SEDAR-DW-05, Sustainable Fisheries Division Contribution No. SFD-2004-048. SEDAR, Miami, Fl.
Southeast Data, Assessment and Review (SEDAR). 2009. Caribbean Fisheries Data
Evaluation: SEDAR Procedures Workshop Report III. San Juan, PR. January 26-29, 2009. 183 p + References.
Tobias, W., and Toller, W. 2007 Management Implications for Restrictions on the
Use of Gill and Trammel Nets in St. Croix, U.S. Virgin Islands. Gulf and Caribbean Fisheries Institute, Colombia, 2007. 105-116 pp.

92
Valdés-Pizzini, M., Agar, J. J.,Kitner, K., García-Quijano, C.,Tust, M., and Forrestal, F. 2010. Cruzan Fisheries: A Rapid Assessment of the Historical, Social, Cultural and Economic Processes that Shaped Coastal Communities’ Dependence and Engagement in Fishing in the Island of St. Croix, U.S. Virgin Islands. NOAA Series on U.S. Caribbean Fishing Communities. NOAA Technical Memorandum NMFS-SEFSC-597, 144 p.
Valle-Esquivel, M, and Diaz, G. 2004. An Update on the Reported Landings, Expansion
Factors and Expanded Landings for the Commercial Fisheries of the United States Virgin Islands (with Emphasis on Spiny Lobster and the Snapper Complex). SEDAR-8-DW-09. SEDAR, Miami, Fl.

93
Appendix A: Acronyms
ACL Annual Catch Limit AM Accountability Measure CCR Commercial Catch Report CFMC Caribbean Fishery Management Council DPNR Department of Planning and Natural Resources EEZ Exclusive Economic Zone FCMA Magnuson Fishery Conservation and Management Act (1976) FMP Fishery Management Plan FMU Fishery Management Unit MSRA Magnuson-Stevens Fishery Conservation and Management
Reauthorization Act (2006) NM (nm) Nautical Miles NMFS National Marine Fisheries Service OFL Overfishing Limit PR Commonwealth of Puerto Rico RFMC Regional Fishery Management Council SEDAR Southeast Data, Assessment and Review panel SEFSC Southeast Fisheries Science Center STT/STJ St. Thomas/St. John District STX St. Croix District USVI United States Virgin Islands

94
Appendix B: Model Flow Chart