
The Demand for Annuities with Stochastic Mortality Probabilities
Upload
nrmpolimiCategory
view
40download
0
Developing a stochastic simulation model for the generation of residential water end-use demand time series
A. Cominola1, M. Giuliani1, A. Castelletti1, A.M. Abdallah2, D.E. Rosenberg2 1 Dept. Electronics, Information, and Bioengineering - Hydroinformatics Lab, Politecnico di Milano 2 Dept. of Civil and Environmental Engineering, Utah State University
NRM
Urban population is growing
US246.2
Urban population in millions
81%Urban percentage
Mexico84.392
77%
Colombia34.373%
Brazil162.685%
Argentina35.690%
Ukraine30.968%
Russia103.673%
China559.2
Urban population in millions
42%Urban percentage
Turkey51.168%
India329.329%
Bangladesh38.226%
Philippines55.064%
Indonesia114.150%
S Korea39.081%
Japan84.766%
Egypt33.143%
S Africa28.660%
Canada26.3
Venezuela26.0
Poland23.9
Thailand21.5
Australia18.3
Netherlands13.3
Peru21.0
Saudi Arabia20.9
Iraq20.3 Vietnam
23.3
DR Congo20.2
Algeria22.0Morocco
19.4
Malaysia18.1
Burma16.5
Sudan16.3
Chile14.6
N Korea14.1
Ethiopia13.0
Uzbekistan10.1
Tanzania9.9
Romania11.6
Ghana11.3
Syria10.2
Belgium10.2
80%
94%
62%
33%
89%
81%
73%
81%
67%
27%
33%
65%60%
69%
32%
43%
88%
62%
16%
37%
25%
54%
49%
51%
97%
Nigeria68.650%
UK54.090%
France46.977%
Spain33.677%
Italy39.668%
Germany62.075%
Iran48.468%
Pakistan59.336%
Cameroon
AngolaEcuador
IvoryCoast
Kazakh-stan
Cuba
Afghan-istan
Sweden
Kenya
CzechRepublic
9.5
9.38.7
8.6
8.6
8.5
7.8
7.6
7.6
7.4
Mozam-bique
HongKong
Belarus
Tunisia
Hungary
Greece
Israel
Guate-mala
Portugal
Yemen
DominicanRepublic
Bolivia
Serbia &Mont
Switzer-land
Austria
Bulgaria
Mada-gascar
Libya
Senegal
Jordan
Zimbabwe
Nepal
Denmark
Mali
Azerbaijan
Singapore
ElSalvador
Zambia
Uganda
PuertoRico
Paraguay
UAE
Benin
Norway
NewZealand
Honduras
Haiti
Nicaragua
Guinea
Finland
Uruguay
Lebanon
Somalia
Sri Lanka
Cambodia
Slovakia
Costa Rica
Palestine
Kuwait
Togo
ChadBurkina
Ireland
Croatia
Congo
Niger
Sierra Leone
Malawi
Panama
Turkmenistan
Georgia
Lithuania
Liberia
Moldova
Rwanda
Kyrgyzstan
Oman
ArmeniaBosnia
Tajikistan
CAR
Melanesia
Latvia
Mongolia
Albania
Jamaica
Macedonia
Mauritania Laos
Gabon
Botswana
Slovenia
Eritrea
Estonia
Gambia
Burundi
Papua New Guinea
NamibiaMauritius
Guinea-Bissau
Lesotho E Timor
Bhutan
Swaziland
Trinidad & Tobago
The earth reaches a momentous milestone: by next year, for the first time in history, more than half its population will be living in cities. Those 3.3 billion people are expected to grow to 5 billion by 2030 — this unique map of the world shows where those people live now
At the beginning of the 20th century, the world's urban population was only 220 million, mainly in the west
By 2030, the towns and cities of the developing world will make up 80% of urban humanity
The new urban world
Urban growth, 2005—2010
Predominantly urban75% or over
Predominantly urban50—74%
Predominantly rural25—49% urban
Predominantly rural0—24% urban
Cities over 10 million people(greater urban area)
Key
Tokyo33.4
Osaka16.6
Seoul23.2
Manila15.4
Jakarta14.9
Dacca 13.8
Bombay21.3
Delhi21.1 Calcutta
15.5
Karachi14.8
Shanghai17.3
Canton14.5
Beijing12.7
Moscow13.4
Tehran12.1
Cairo15.9
Istanbul11.7
London12.0
Lagos10.0
MexicoCity22.1
New York21.8
Sao Paulo20.4
LA17.9
Rio deJaneiro
12.2
BuenosAires13.5 3,307,950,000
The world’s urban population — from a total of 6,615.9 million SOURCE: UNFPA GRAPHIC: PAUL SCRUTONAfrica Asia Oceania Europe0.1%
Eastern Europe-0.4%
Arab StatesLatin America& Caribbean North America
3.2%2.4%
1.3%
2.8%
1.7%1.3%

NRM
Residential water demand management
resolution depends on the installed meter, the logging time can beshortened without installation of smart meters but simplyincreasing the traditional reading frequency by the users. However,so far only ad-hoc studies systematically collected and analyzeddata at daily resolution (e.g., Olmstead et al., 2007; Wong et al.,2010) and few water companies (e.g., Water Corporation in West-ern Australia and ThamesWater in London) started increasing theirreading frequency by direct involvement of their customers, whoare invited to self-read their consumption and communicate itonline to the water company (e.g., Anda et al., 2013).
2.2. High resolution data
The advent of high resolution sensors, with their ability ofsampling water consumption on sub-daily basis, opened up a newpotential to better characterize domestic water consumption. Twodistinctive metering approaches can be distinguished: intrusivemetering, which ensures direct estimates of the residential waterend-uses by installing high resolution sensors on-device, namelyone sensor for each water consuming appliance (e.g., washingmachine, toilet flush, shower-head); non-intrusive metering, whichregisters the total water flow at the household level over one singledetection point for the whole house.
Intrusive metering (see Rowlands et al., 2014, and referencestherein) is generally considered inapplicable in real-world, large-scale analysis as the number of sensors to be installed makes thisapproach resource intensive, costly, and hardly accepted byhousehold occupants (Cordell et al., 2003; Kim et al., 2008). On thecontrary, non-intrusive metering represents a more acceptable,though less accurate, alternative (Mayer and DeOreo, 1999). How-ever, this approach requires disaggregation algorithms to break-down the total consumption data at the household level into thedifferent end-use categories (see Section 3).
Several types of sensors have been developed (Table 2) byexploiting different technologies and physical properties of thewater flow (for a review see Arregui et al., 2006, and referencestherein):
! Accelerometers (e.g., Evans et al., 2004), which analyze vibra-tions in a pipe induced by the turbulence of the water flow. Asampling frequency of 100 Hz of the pipe vibrations allows
reconstructing the average flow within the pipe with a resolu-tion of 0.015 L (Kim et al., 2008).
! Ultrasonic sensors (Mori et al., 2004), which estimate the flowvelocity, and then determine the flow rate knowing the pipesection, by measuring the difference in time between ultrasonicbeams generated by piezoelectric devices and transmittedwithin the water flow. The transducers are generally operated inthe range 0.5e2 MHz and allow attaining an average resolutionaround 0.0018 L (e.g., Sanderson and Yeung, 2002).
! Pressure sensors (Froehlich et al., 2009, 2011), which consist insteel devices, equipped with an analog-digital converter and amicro-controller, continuously sampling pressure with a theo-retical maximum resolution of 2 kHZ. Flow rate is related to thepressure change generated by the opening/close of the waterdevices valves via Poiseuille's Law.
! Flowmeters (Mayer and DeOreo, 1999), which exploit the waterflow to spin either pistons (mechanic flow meters) or magnets(magnetic meters) and correlate the number of revolutions orpulse to the water volume passing through the pipe. Sensingresolution spans between 34.2 and 72 pulses per liter (i.e., 1pulse every 0.029 and 0.014 L, respectively) associated to alogging frequency in the range of 1e10 s (Kowalski andMarshallsay, 2005; Heinrich, 2007; Willis et al., 2013).
So far, only flow meters and pressure sensors have beenemployed in smart meters applications because ultrasonic sensorsare too costly and the use of accelerometers requires an intrusivecalibration phase with the placement of multiple meters distrib-uted on the pipe network for each single device of interest (Kimet al., 2008). It is worth noting that the “smartness” of these sen-sors is related both to their high sampling resolution and to theirintegration in efficient systems combining data collection, transfer,storage, and analysis. Although sensors can be equipped with dataloggers requiring human intervention to retrieve the data directlyfrom the sensors (Mayer et al., 2004), bluetooth and wireless con-nections have been recently exploited for improving data man-agement. For example, Froehlich et al. (2009) installed a network ofpressure sensors communicating via bluetooth with a laptopdeployed at each household, which runs a custom data logger toreceive, compress, and archive data. These latter are then uploadedto a web server at 30-min intervals.
2.3. Research challenges and future directions
While smart meters are becoming easily available, we identifieda list of open research and technical challenges that need to beaddressed to promote the coherent use of this wide range oftechnologies:
1. The first open research question relates to the management ofthe metered high resolution flow data. In particular, the devel-opment of robust, automated processes to transfer the gener-ated big data requires further elaborations, both in terms ofhardware and software performance due to existing issues withrespect towireless network reliability, black spots, power sourceand battery life (Stewart et al., 2010; Little and Flynn, 2012). Allthese aspects appear key also because the possibility of inte-grating water and energy meters and using the same data log-gers and transmission systems is expected to enhance thediffusion of high resolution water sensors (Benzi et al., 2011;Froes Lima and Portillo Navas, 2012).
2. The second open challenge concerns the design of centralized ordistributed information systems to store the data collected bythe smart meters (Oracle, 2009). A centralized system wouldallow checking the accuracy of the collected data, which can
Fig. 2. Five-years count of the 134 publications reviewed in this study.
A. Cominola et al. / Environmental Modelling & Software 72 (2015) 198e214200
Benefits and challenges of using smart meters for advancingresidential water demand modeling and management: A review
A. Cominola a, M. Giuliani a, D. Piga b, A. Castelletti a, c, *, A.E. Rizzoli da Department of Electronics, Information, and Bioengineering, Politecnico di Milano, Milan, Italyb IMT Institute for Advanced Studies Lucca, Lucca, Italyc Institute of Environmental Engineering, ETH Zurich, Zurich, Switzerlandd Istituto Dalle Molle di Studi sull'Intelligenza Artificiale, SUPSI-USI, Lugano, Switzerland
a r t i c l e i n f o
Article history:Received 2 April 2015Received in revised form21 July 2015Accepted 21 July 2015Available online xxx
Keywords:Smart meterResidential water managementWater demand modelingWater conservation
a b s t r a c t
Over the last two decades, water smart metering programs have been launched in a number of mediumto large cities worldwide to nearly continuously monitor water consumption at the single householdlevel. The availability of data at such very high spatial and temporal resolution advanced the ability incharacterizing, modeling, and, ultimately, designing user-oriented residential water demand manage-ment strategies. Research to date has been focusing on one or more of these aspects but with limitedintegration between the specialized methodologies developed so far. This manuscript is the firstcomprehensive review of the literature in this quickly evolving water research domain. The papercontributes a general framework for the classification of residential water demand modeling studies,which allows revising consolidated approaches, describing emerging trends, and identifying potentialfuture developments. In particular, the future challenges posed by growing population demands, con-strained sources of water supply and climate change impacts are expected to require more and moreintegrated procedures for effectively supporting residential water demand modeling and management inseveral countries across the world.
© 2015 Elsevier Ltd. All rights reserved.
1. Introduction
World's urban population is expected to raise from current54%e66% in 2050 and to further increase as a consequence of theunlikely stabilization of human population by the end of the cen-tury (Gerland et al., 2014). By 2030 the number of mega-cities,namely cities with more than 10 million inhabitants, will growover 40 (UNDESA, 2010). This will boost residential water demand(Cosgrove and Cosgrove, 2012), which nowadays covers a largeportion of the public drinking water supply worldwide (e.g.,60e80% in Europe (Collins et al., 2009), 58% in the United States(Kenny et al., 2009)).
The concentration of the water demands of thousands or mil-lions of people into small areas will considerably raise the stress onfinite supplies of available freshwater (McDonald et al., 2011a).Besides, climate and land use change will further increase the
number of people facingwater shortage (McDonald et al., 2011b). Insuch context, water supply expansion through the construction ofnew infrastructures might be an option to escape water stress insome situations. Yet, geographical or financial limitations largelyrestrict such options in most countries (McDonald et al., 2014).Here, acting on the water demand management side through thepromotion of cost-effective water-saving technologies, revisedeconomic policies, appropriate national and local regulations, andeducation represents an alternative strategy for securing reliablewater supply and reduce water utilities' costs (Gleick et al., 2003).
In recent years, a variety of water demand management stra-tegies (WDMS) has been applied (for a review, see Inman andJeffrey, 2006, and references therein). However, the effectivenessof these WDMS is often context-specific and strongly depends onour understanding of the drivers inducing people to consume orsave water (Jorgensen et al., 2009). Models that quantitativelydescribe how water demand is influenced and varies in relation toexogenous uncontrolled drivers (e.g., seasonality, climatic condi-tions) and demand management actions (e.g., water restrictions,pricing schemes, education campaigns) are essential to explorewater users' response to alternative WDMS, ultimately supporting
* Corresponding author. Department of Electronics, Information, and Bioengi-neering, Politecnico di Milano, Milan, Italy.
E-mail address: [email protected] (A. Castelletti).
Contents lists available at ScienceDirect
Environmental Modelling & Software
journal homepage: www.elsevier .com/locate/envsoft
http://dx.doi.org/10.1016/j.envsoft.2015.07.0121364-8152/© 2015 Elsevier Ltd. All rights reserved.
Environmental Modelling & Software 72 (2015) 198e214
36%
43%
13%6%
<1%
Analysis of 134 studies over the last 25 years
first smart meters
deployment

NRM
Traditional water meters
monthly to yearly readings
Oct Nov Dec
Wat
er c
onsu
mpt
ion
m3
?
1 cubic meter

NRM
Oct Nov Dec
Wat
er c
onsu
mpt
ion
m3
?
Smart water meters
Data logging at 5-10 sec72 pulses/L
Smart meters deployment: OPPORTUNITIES
• End-use characterization
• Advanced management strategies
• Projections of water demand

Smart meters deployment: CHALLENGES
• Deployment and maintenance costs
• Big data collection, processing and analysis
• Intrusiveness and privacy
NRM
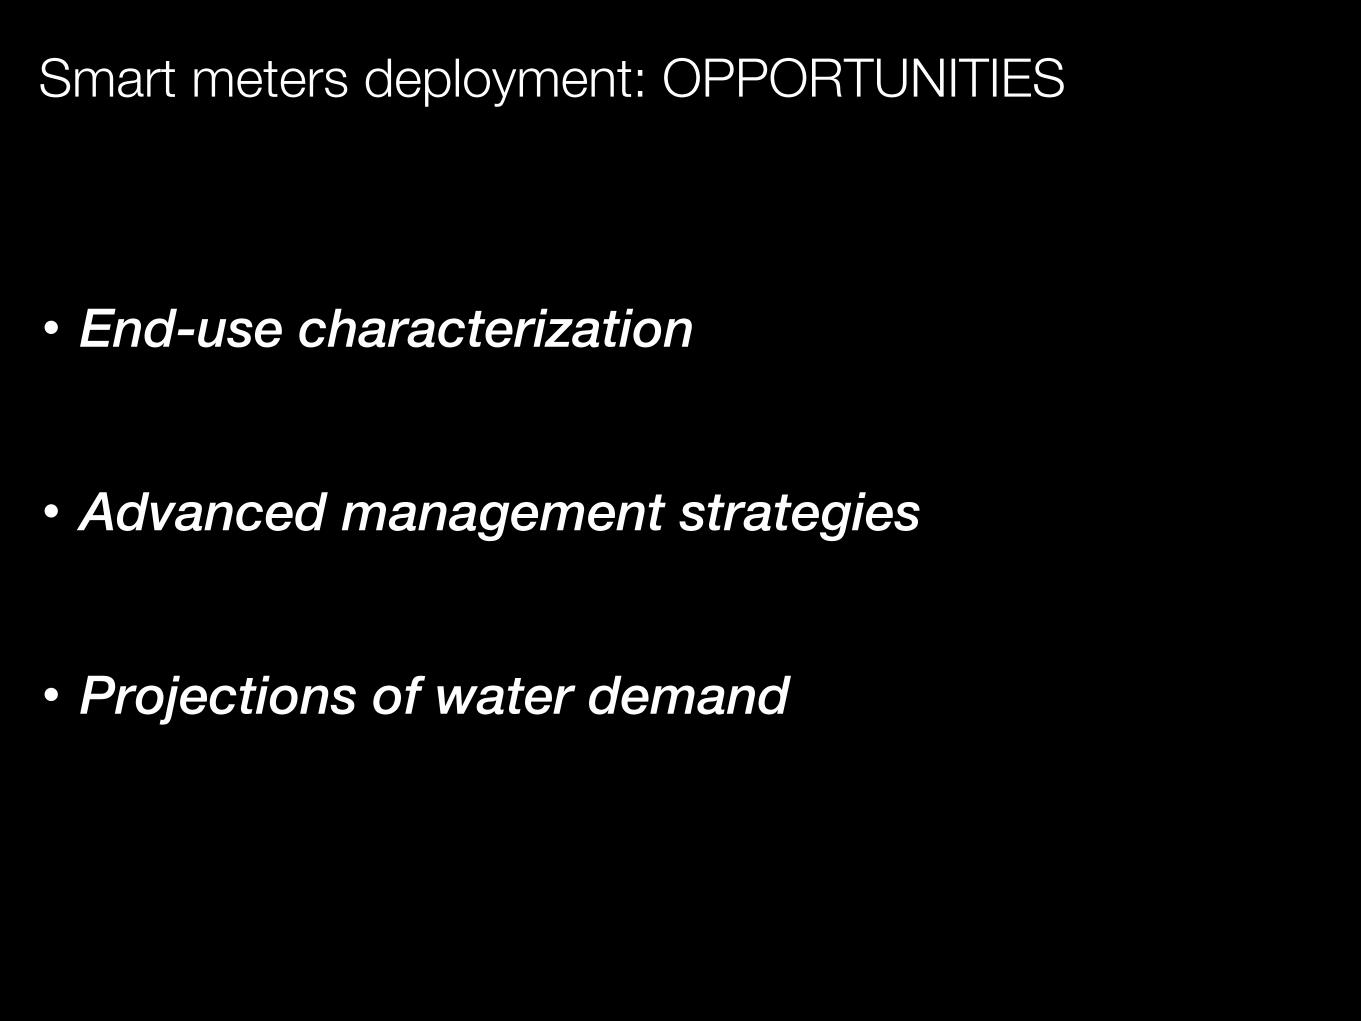
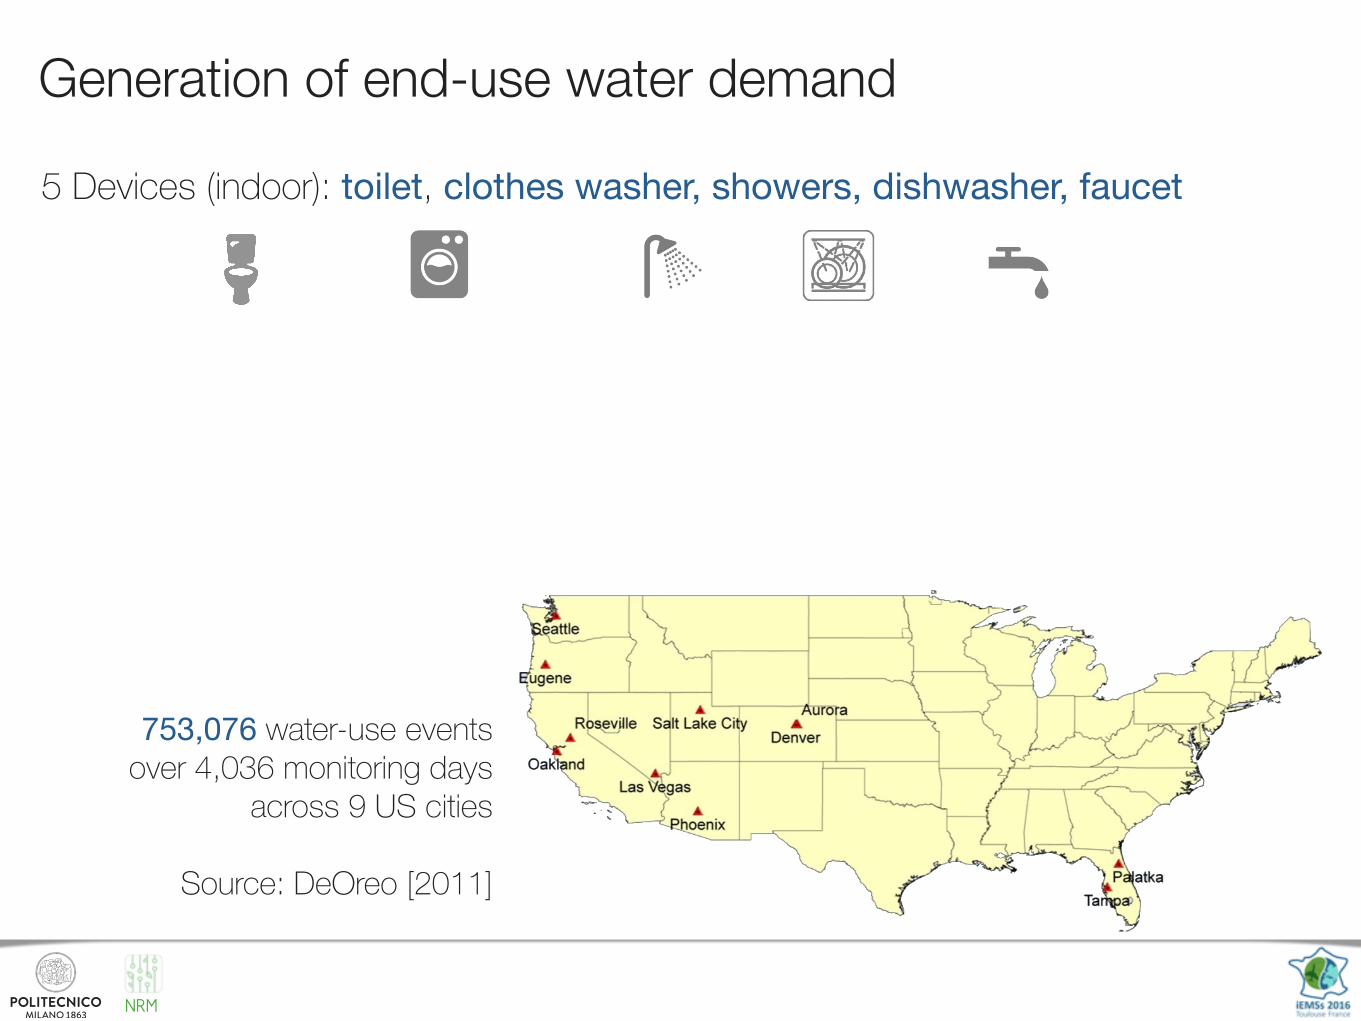
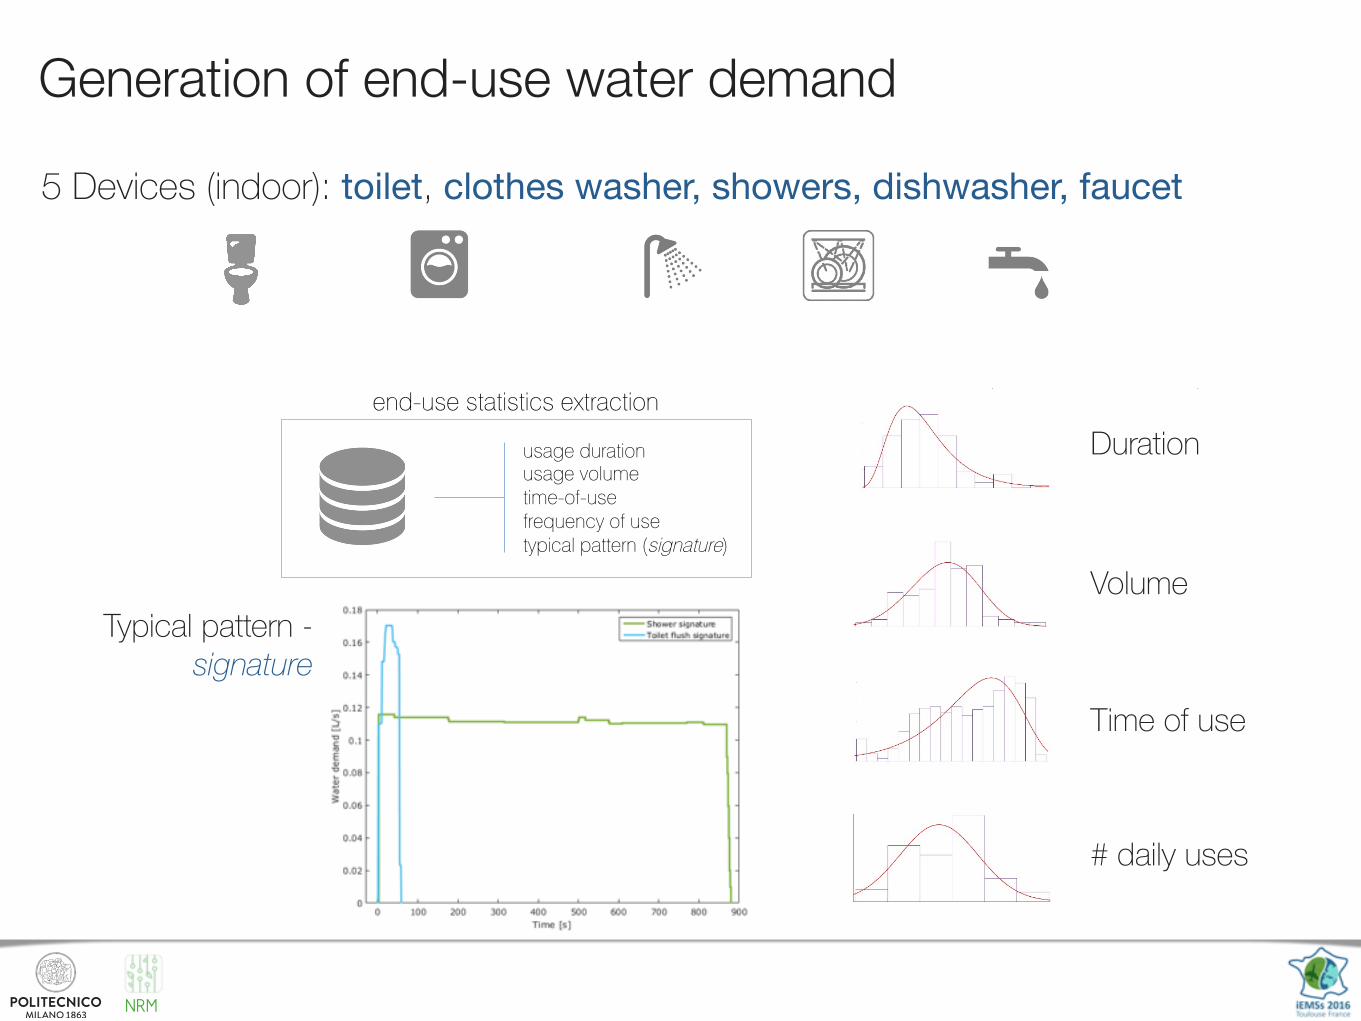
Generation of end-use water demand
5 Devices (indoor): toilet, clothes washer, showers, dishwasher, faucet
753,076 water-use events over 4,036 monitoring days
across 9 US cities
Source: DeOreo [2011]

NRM
Generation of end-use water demand
The SmartH2O platform: advancing residential water management by smart metering and data intensive modeling of consumers’ behaviours A. Cominola1, M. Giuliani1, D. Piga2, A. Castelletti1, A.E. Rizzoli3
1. Department of Electronics, Information and Bioengineering – Hydroinformatics lab |Politecnico di Milano| Milano (IT) 2. IMT Institute for Advanced Studies Lucca | Lucca (IT) 3. Dalle Molle Institute for Artificial Intelligence Research, SUPSI | Manno (CH)
THE PROJECT
THE FHMM-ISDTW END-USE DISAGGREGATION ALGORITHM
LONDON | UK Thames Water water supply utility
15 million customers served
2.6 Gl/day drinking water distributed
Development plan: 3 Million smart meters installed by 2030!
LOCARNO | CH Società Elettrica Sopracenerina
power supply utility, 80 thousand customers served
Interested in multi-utility smart metering (water, energy, gas)
Almost 400 smart water meters installed! VALENCIA | ES EMIVASA water supply utility 2 million customers served
490,000 water smart meters currently installed
Development plan: 650,000 water smart meters installed by end 015.!
MISSION The mission of the SmartH2O project is developing an ICT platform to improve the management of urban and peri-urban water demand.
CONCEPT The SmartH2O platform ICT infrastructure will enable water managers to close the loop between actual water consumption levels and desired targets, through:
_ understanding and modeling water consumers’ behaviour, based on historical and real-time water usage data
_ predicting how the consumer behaviour can be influenced by various Water Demand Management Strategies, such as customized feedbacks and different pricing schemes
_ raising users’ awareness to pursue water reduction in the residential sector
CORE ELEMENTS
high-resolution water consumption data interaction with customers for information sharing and socio-psychographic data gathering innovative water demand management strategies: dynamic pricing, customized feedbacks and rewards gamification
OUR USE CASES
The SmartH2O project receives funding from the European Union’s Seventh Framework Programme (FP7/2007-2013)!
THE ADVANCES ON END-USES CHARACTERIZATION
Simplified structure of the SmartH2O platform
smart meters and end use analysis
gamified bill online and board game
behavioral modeling
water consumption drivers identification
water consumption level forecast at the customer scale
administrator dashboard
dynamic water pricing tailored feedbacks prescriptive norms
gamified bill
Response to WDMS
DEVELOPMENT OF A SYNTHETIC WATER END-USE PATTERNS GENERATOR An algorithm to generate synthetic water end-use patterns has been developed within the SmartH2O project, with the double purpose of: • building end-use water consumption datasets to feed disaggregation algorithms and to provide benchmark datasets for community
testing; • allowing for the generation of end-use patterns under different demographic and technological scenarios.
DEVELOPMENT PLAN • User-friendly interface • Web portal to contribute with new
datasets from different case studies
CURRENT FEATURES • Trained on high-resolutions (1 second) consumption data from 9 cities across USA • Performance validated with a two-sample Kolmogorov-Smirnov test • Flexible for synthetic generation at multi-scale resolutions.
user’s input end-use statistics extraction end-use traces generation • house size • time sampling
resolution • device
presence
usage duration usage volume time-of-use frequency of use typical pattern (signature)
An new algorithm to perform household energy and water consumption trace disaggregation into end-uses (e.g., washing machine, toilet, tap, etc…) has been developed, with the purpose of profiling users’ consumption habits based on the total single-point smart metered consumption.
CHALLENGES • Accurately reproducing the consumption trajectory of different
end-uses, not only their operating system (i.e., on/off status) • Performing disaggregation for a number of appliances
simultaneously operating.
ALGORITHM TECHNOLOGIES • Factorial Hidden Markov Models • Iterative Subsequence Dynamic Time Warping
APPLICATION OUTCOMES
Experiments on POWER data (1 min resolution) show high accuracy in
reproducing the consumption trajectory of
many end-uses simultaneously working
Preliminary experiments on WATER data (1 min resolution) show suitability in reproducing the contribution of each operating appliance to the total measured household consumption.
36 %
34 %
30 % 25 %
30 % 31 %
DROP! The SmartH2O game
Andrea Cominola [email protected]
@smartH2Oproject
#SmartH2O
time
water
co
nsum
ptio
n
5 Devices (indoor): toilet, clothes washer, showers, dishwasher, faucet
Duration
Volume
Time of use
# daily uses
Typical pattern - signature

NRM
Generation of end-use water demand
The SmartH2O platform: advancing residential water management by smart metering and data intensive modeling of consumers’ behaviours A. Cominola1, M. Giuliani1, D. Piga2, A. Castelletti1, A.E. Rizzoli3
1. Department of Electronics, Information and Bioengineering – Hydroinformatics lab |Politecnico di Milano| Milano (IT) 2. IMT Institute for Advanced Studies Lucca | Lucca (IT) 3. Dalle Molle Institute for Artificial Intelligence Research, SUPSI | Manno (CH)
THE PROJECT
THE FHMM-ISDTW END-USE DISAGGREGATION ALGORITHM
LONDON | UK Thames Water water supply utility
15 million customers served
2.6 Gl/day drinking water distributed
Development plan: 3 Million smart meters installed by 2030!
LOCARNO | CH Società Elettrica Sopracenerina
power supply utility, 80 thousand customers served
Interested in multi-utility smart metering (water, energy, gas)
Almost 400 smart water meters installed! VALENCIA | ES EMIVASA water supply utility 2 million customers served
490,000 water smart meters currently installed
Development plan: 650,000 water smart meters installed by end 015.!
MISSION The mission of the SmartH2O project is developing an ICT platform to improve the management of urban and peri-urban water demand.
CONCEPT The SmartH2O platform ICT infrastructure will enable water managers to close the loop between actual water consumption levels and desired targets, through:
_ understanding and modeling water consumers’ behaviour, based on historical and real-time water usage data
_ predicting how the consumer behaviour can be influenced by various Water Demand Management Strategies, such as customized feedbacks and different pricing schemes
_ raising users’ awareness to pursue water reduction in the residential sector
CORE ELEMENTS
high-resolution water consumption data interaction with customers for information sharing and socio-psychographic data gathering innovative water demand management strategies: dynamic pricing, customized feedbacks and rewards gamification
OUR USE CASES
The SmartH2O project receives funding from the European Union’s Seventh Framework Programme (FP7/2007-2013)!
THE ADVANCES ON END-USES CHARACTERIZATION
Simplified structure of the SmartH2O platform
smart meters and end use analysis
gamified bill online and board game
behavioral modeling
water consumption drivers identification
water consumption level forecast at the customer scale
administrator dashboard
dynamic water pricing tailored feedbacks prescriptive norms
gamified bill
Response to WDMS
DEVELOPMENT OF A SYNTHETIC WATER END-USE PATTERNS GENERATOR An algorithm to generate synthetic water end-use patterns has been developed within the SmartH2O project, with the double purpose of: • building end-use water consumption datasets to feed disaggregation algorithms and to provide benchmark datasets for community
testing; • allowing for the generation of end-use patterns under different demographic and technological scenarios.
DEVELOPMENT PLAN • User-friendly interface • Web portal to contribute with new
datasets from different case studies
CURRENT FEATURES • Trained on high-resolutions (1 second) consumption data from 9 cities across USA • Performance validated with a two-sample Kolmogorov-Smirnov test • Flexible for synthetic generation at multi-scale resolutions.
user’s input end-use statistics extraction end-use traces generation • house size • time sampling
resolution • device
presence
usage duration usage volume time-of-use frequency of use typical pattern (signature)
An new algorithm to perform household energy and water consumption trace disaggregation into end-uses (e.g., washing machine, toilet, tap, etc…) has been developed, with the purpose of profiling users’ consumption habits based on the total single-point smart metered consumption.
CHALLENGES • Accurately reproducing the consumption trajectory of different
end-uses, not only their operating system (i.e., on/off status) • Performing disaggregation for a number of appliances
simultaneously operating.
ALGORITHM TECHNOLOGIES • Factorial Hidden Markov Models • Iterative Subsequence Dynamic Time Warping
APPLICATION OUTCOMES
Experiments on POWER data (1 min resolution) show high accuracy in
reproducing the consumption trajectory of
many end-uses simultaneously working
Preliminary experiments on WATER data (1 min resolution) show suitability in reproducing the contribution of each operating appliance to the total measured household consumption.
36 %
34 %
30 % 25 %
30 % 31 %
DROP! The SmartH2O game
Andrea Cominola [email protected]
@smartH2Oproject
#SmartH2O
time
water
co
nsum
ptio
n
5 Devices (indoor): toilet, clothes washer, showers, dishwasher, faucet

NRM
Generation of end-use water demand
The SmartH2O platform: advancing residential water management by smart metering and data intensive modeling of consumers’ behaviours A. Cominola1, M. Giuliani1, D. Piga2, A. Castelletti1, A.E. Rizzoli3
1. Department of Electronics, Information and Bioengineering – Hydroinformatics lab |Politecnico di Milano| Milano (IT) 2. IMT Institute for Advanced Studies Lucca | Lucca (IT) 3. Dalle Molle Institute for Artificial Intelligence Research, SUPSI | Manno (CH)
THE PROJECT
THE FHMM-ISDTW END-USE DISAGGREGATION ALGORITHM
LONDON | UK Thames Water water supply utility
15 million customers served
2.6 Gl/day drinking water distributed
Development plan: 3 Million smart meters installed by 2030!
LOCARNO | CH Società Elettrica Sopracenerina
power supply utility, 80 thousand customers served
Interested in multi-utility smart metering (water, energy, gas)
Almost 400 smart water meters installed! VALENCIA | ES EMIVASA water supply utility 2 million customers served
490,000 water smart meters currently installed
Development plan: 650,000 water smart meters installed by end 015.!
MISSION The mission of the SmartH2O project is developing an ICT platform to improve the management of urban and peri-urban water demand.
CONCEPT The SmartH2O platform ICT infrastructure will enable water managers to close the loop between actual water consumption levels and desired targets, through:
_ understanding and modeling water consumers’ behaviour, based on historical and real-time water usage data
_ predicting how the consumer behaviour can be influenced by various Water Demand Management Strategies, such as customized feedbacks and different pricing schemes
_ raising users’ awareness to pursue water reduction in the residential sector
CORE ELEMENTS
high-resolution water consumption data interaction with customers for information sharing and socio-psychographic data gathering innovative water demand management strategies: dynamic pricing, customized feedbacks and rewards gamification
OUR USE CASES
The SmartH2O project receives funding from the European Union’s Seventh Framework Programme (FP7/2007-2013)!
THE ADVANCES ON END-USES CHARACTERIZATION
Simplified structure of the SmartH2O platform
smart meters and end use analysis
gamified bill online and board game
behavioral modeling
water consumption drivers identification
water consumption level forecast at the customer scale
administrator dashboard
dynamic water pricing tailored feedbacks prescriptive norms
gamified bill
Response to WDMS
DEVELOPMENT OF A SYNTHETIC WATER END-USE PATTERNS GENERATOR An algorithm to generate synthetic water end-use patterns has been developed within the SmartH2O project, with the double purpose of: • building end-use water consumption datasets to feed disaggregation algorithms and to provide benchmark datasets for community
testing; • allowing for the generation of end-use patterns under different demographic and technological scenarios.
DEVELOPMENT PLAN • User-friendly interface • Web portal to contribute with new
datasets from different case studies
CURRENT FEATURES • Trained on high-resolutions (1 second) consumption data from 9 cities across USA • Performance validated with a two-sample Kolmogorov-Smirnov test • Flexible for synthetic generation at multi-scale resolutions.
user’s input end-use statistics extraction end-use traces generation • house size • time sampling
resolution • device
presence
usage duration usage volume time-of-use frequency of use typical pattern (signature)
An new algorithm to perform household energy and water consumption trace disaggregation into end-uses (e.g., washing machine, toilet, tap, etc…) has been developed, with the purpose of profiling users’ consumption habits based on the total single-point smart metered consumption.
CHALLENGES • Accurately reproducing the consumption trajectory of different
end-uses, not only their operating system (i.e., on/off status) • Performing disaggregation for a number of appliances
simultaneously operating.
ALGORITHM TECHNOLOGIES • Factorial Hidden Markov Models • Iterative Subsequence Dynamic Time Warping
APPLICATION OUTCOMES
Experiments on POWER data (1 min resolution) show high accuracy in
reproducing the consumption trajectory of
many end-uses simultaneously working
Preliminary experiments on WATER data (1 min resolution) show suitability in reproducing the contribution of each operating appliance to the total measured household consumption.
36 %
34 %
30 % 25 %
30 % 31 %
DROP! The SmartH2O game
Andrea Cominola [email protected]
@smartH2Oproject
#SmartH2O
time
water
co
nsum
ptio
n
5 Devices: toilet, clothes washer, showers, dishwasher, faucet

Potential applications

NRM
End use characterization

NRM
Advanced management strategies
NRM
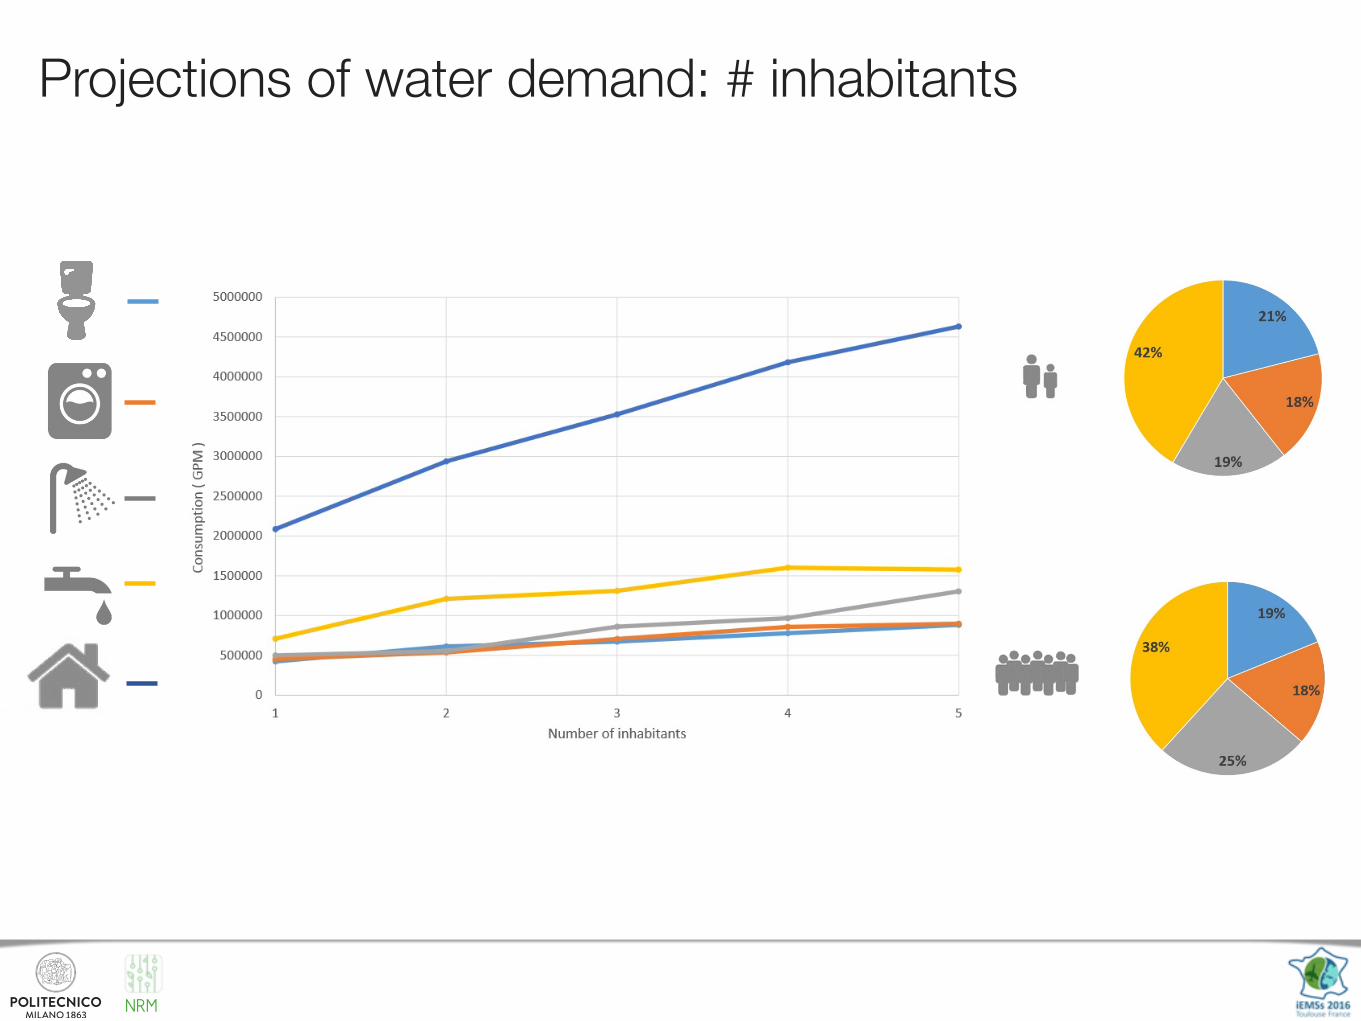
Projections of water demand: # inhabitants
NRM
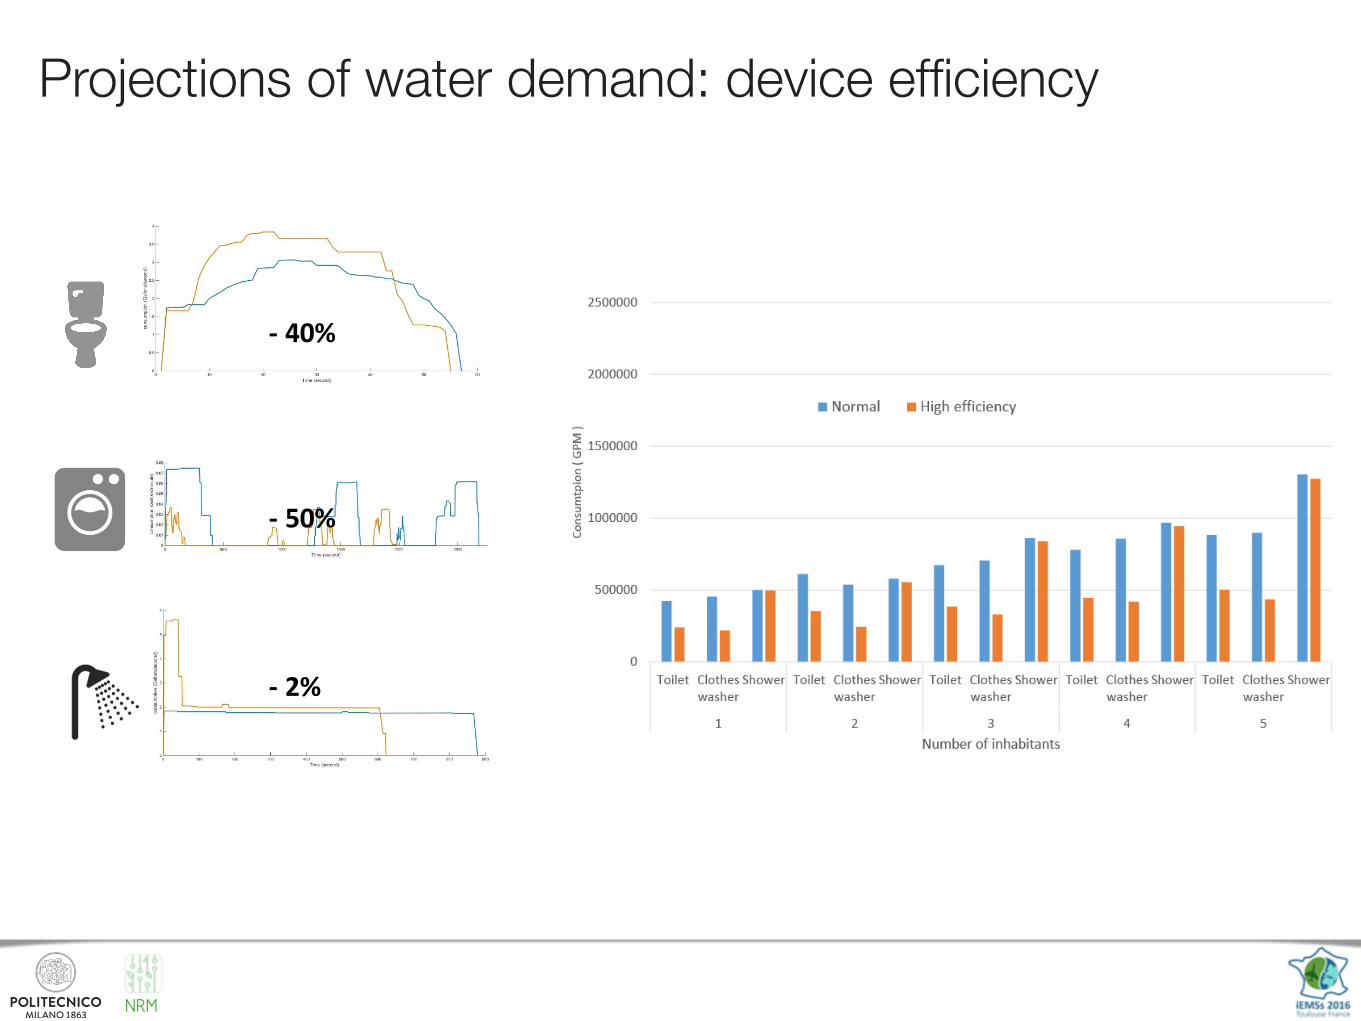
Projections of water demand: device efficiency
- 40%
- 50%
- 2%

NRM
Conclusions
This preliminary results show great potential for supporting smart meters deployments and end-use water demand analysis.
Outlook:
1. Update of the database with new report by Aquacraft Inc.
2. Web service for community development
3. Creation of open database across countries