Developing a School Finance System for K–12 Reform in Qatar
137
This document and trademark(s) contained herein are protected by law as indicated in a notice appearing later in this work. This electronic representation of RAND intellectual property is provided for non-commercial use only. Unauthorized posting of RAND PDFs to a non-RAND Web site is prohibited. RAND PDFs are protected under copyright law. Permission is required from RAND to reproduce, or reuse in another form, any of our research documents for commercial use. For information on reprint and linking permissions, please see RAND Permissions. Limited Electronic Distribution Rights Visit RAND at www.rand.org Explore the RAND-Qatar Policy Institute View document details For More Information This PDF document was made available from www.rand.org as a public service of the RAND Corporation. 6 Jump down to document THE ARTS CHILD POLICY CIVIL JUSTICE EDUCATION ENERGY AND ENVIRONMENT HEALTH AND HEALTH CARE INTERNATIONAL AFFAIRS NATIONAL SECURITY POPULATION AND AGING PUBLIC SAFETY SCIENCE AND TECHNOLOGY SUBSTANCE ABUSE TERRORISM AND HOMELAND SECURITY TRANSPORTATION AND INFRASTRUCTURE WORKFORCE AND WORKPLACE The RAND Corporation is a nonprofit research organization providing objective analysis and effective solutions that address the challenges facing the public and private sectors around the world. Purchase this document Browse Books & Publications Make a charitable contribution Support RAND
Transcript of Developing a School Finance System for K–12 Reform in Qatar

This document and trademark(s) contained herein are protected by law as indicated in a notice appearing later in this work. This electronic representation of RAND intellectual property is provided for non-commercial use only. Unauthorized posting of RAND PDFs to a non-RAND Web site is prohibited. RAND PDFs are protected under copyright law. Permission is required from RAND to reproduce, or reuse in another form, any of our research documents for commercial use. For information on reprint and linking permissions, please see RAND Permissions.
Limited Electronic Distribution Rights
Visit RAND at www.rand.org
Explore the RAND-Qatar Policy Institute
View document details
For More Information
This PDF document was made available
from www.rand.org as a public service of
the RAND Corporation.
6Jump down to document
THE ARTS
CHILD POLICY
CIVIL JUSTICE
EDUCATION
ENERGY AND ENVIRONMENT
HEALTH AND HEALTH CARE
INTERNATIONAL AFFAIRS
NATIONAL SECURITY
POPULATION AND AGING
PUBLIC SAFETY
SCIENCE AND TECHNOLOGY
SUBSTANCE ABUSE
TERRORISM AND HOMELAND SECURITY
TRANSPORTATION ANDINFRASTRUCTURE
WORKFORCE AND WORKPLACE
The RAND Corporation is a nonprofit research organization providing objective analysis and effective solutions that address the challenges facing the public and private sectors around the world.
Purchase this document
Browse Books & Publications
Make a charitable contribution
Support RAND

This product is part of the RAND Corporation monograph series.
RAND monographs present major research findings that address the
challenges facing the public and private sectors. All RAND mono-
graphs undergo rigorous peer review to ensure high standards for
research quality and objectivity.

Prepared for the Supreme Education Council
Developing a School Finance System
for K--12 Reform in Qatar
Cassandra M. Guarino Titus Galama Louay Constant
Gabriella Gonzalez Jeffery C. Tanner Charles A. Goldman

The RAND Corporation is a nonprofit research organization providing objective analysis and effective solutions that address the challenges facing the public and private sectors around the world. RAND’s publications do not necessarily reflect the opinions of its research clients and sponsors.
R® is a registered trademark.
© Copyright 2009 RAND Corporation
Permission is given to duplicate this document for personal use only, as long as it is unaltered and complete. Copies may not be duplicated for commercial purposes. Unauthorized posting of RAND documents to a non-RAND Web site is prohibited. RAND documents are protected under copyright law. For information on reprint and linking permissions, please visit the RAND permissions page (http://www.rand.org/publications/permissions.html).
Published 2009 by the RAND Corporation1776 Main Street, P.O. Box 2138, Santa Monica, CA 90407-2138
1200 South Hayes Street, Arlington, VA 22202-50504570 Fifth Avenue, Suite 600, Pittsburgh, PA 15213-2665
RAND URL: http://www.rand.orgTo order RAND documents or to obtain additional information, contact
Distribution Services: Telephone: (310) 451-7002; Fax: (310) 451-6915; Email: [email protected]
Cover design by Eileen Delson La Russo
The research described in this report was prepared for the Supreme Education Council and conducted within RAND Education and the RAND-Qatar Policy Institute, programs of the RAND Corporation.
Library of Congress Cataloging-in-Publication Data
Developing a school finance system for K–12 reform in Qatar / Cassandra M. Guarino ... [et al.]. p. cm. Includes bibliographical references. ISBN 978-0-8330-4655-0 (pbk. : alk. paper) 1. Education—Qatar—Finance. 2. Educational change—Qatar. I. Guarino, Cassandra M.
LB2826.6.Q27D48 2009 379.1'21095363—dc22
2009001425

iii
Preface
In 2001, the leaders of the Arabian Gulf nation of Qatar embarked on a process to reform its K–12 education system. A highlight of that system was the establishment of government-funded Independent schools that operate under a new governance structure and in parallel with Minis-try of Education schools. RAND Education worked with Qatar on the design and implementation of the reform, called Education for a New Era. This work is reported in a RAND monograph: Dominic Brewer et al., Education for a New Era: Design and Implementation of K–12 Edu-cation Reform in Qatar, MG-548-QATAR.
In 2004, the Supreme Education Council, in its role as overseer of the reform and of Independent schools, asked RAND to assess the progress and performance of new Independent schools and determine how well the reform is working. One aspect of the assessment was an analysis of school finance relating to the reform efforts. This mono-graph documents findings from the study and discusses funding and expenditures in the planning and start-up phases of the reform, evalu-ates the overall effectiveness of the new finance system, and provides modeling tools that can be used to determine funding levels and pro-jected costs in future years. This monograph contains information and analysis of interest not only to the nation of Qatar but also to education policymakers, scholars, and practitioners as well as the wider public elsewhere, in particular in the Gulf States, which share many of the features characteristic of Qatar.
More detailed information about the reform can be found at Qatar’s Supreme Education Council Web site: www.education.gov.qa

iv Developing a School Finance System for K–12 Reform in Qatar
(Arabic version, with a link to the English version). Further informa-tion about the RAND project supporting the reform initiative can be found at www.rand.org/education/.
This project was conducted under the auspices of the RAND Qatar Policy Institute (RQPI) and RAND Corporation’s Education unit. RQPI is a partnership of the RAND Corporation and the Qatar Foundation for Education, Science, and Community Development. The aim of RQPI is to offer the RAND style of rigorous and objec-tive analysis to clients in the greater Middle East. In serving clients in the Middle East, RQPI draws on the full professional resources of the RAND Corporation. RAND Education analyzes education policy and practice and supports implementation of improvements at all levels of the education system.
For further information on RQPI, contact the director, Dr. Rich-ard Darilek. He can be reached by email at [email protected]; by tele-phone at +974-492-7400; or by mail at P.O. Box 23644, Doha, Qatar. For more information about RAND Education, contact the associ-ate director, Dr. Charles Goldman. He can be reached by email at [email protected]; by telephone at +1-310-393-0411, extension 6748; or by mail at RAND, 1776 Main Street, Santa Monica, California 90401 USA.

v
Contents
Preface . . . . . . . . . . . . . . . . . . . . . . . . . . . . . . . . . . . . . . . . . . . . . . . . . . . . . . . . . . . . . . . . . . . . . . . . . . . . . . iiiFigures . . . . . . . . . . . . . . . . . . . . . . . . . . . . . . . . . . . . . . . . . . . . . . . . . . . . . . . . . . . . . . . . . . . . . . . . . . . . . . viiTables . . . . . . . . . . . . . . . . . . . . . . . . . . . . . . . . . . . . . . . . . . . . . . . . . . . . . . . . . . . . . . . . . . . . . . . . . . . . . . . ixSummary . . . . . . . . . . . . . . . . . . . . . . . . . . . . . . . . . . . . . . . . . . . . . . . . . . . . . . . . . . . . . . . . . . . . . . . . . . . xiAcknowledgments . . . . . . . . . . . . . . . . . . . . . . . . . . . . . . . . . . . . . . . . . . . . . . . . . . . . . . . . . . . . . . . . xxiAbbreviations . . . . . . . . . . . . . . . . . . . . . . . . . . . . . . . . . . . . . . . . . . . . . . . . . . . . . . . . . . . . . . . . . . . xxiii
CHAPTER ONE
Introduction . . . . . . . . . . . . . . . . . . . . . . . . . . . . . . . . . . . . . . . . . . . . . . . . . . . . . . . . . . . . . . . . . . . . . . . 1Qatar Context . . . . . . . . . . . . . . . . . . . . . . . . . . . . . . . . . . . . . . . . . . . . . . . . . . . . . . . . . . . . . . . . . . . . . . 3Implications of the Qatar Experience for School Finance Systems in
Other Countries . . . . . . . . . . . . . . . . . . . . . . . . . . . . . . . . . . . . . . . . . . . . . . . . . . . . . . . . . . . . . . . 5Limitations of the Study . . . . . . . . . . . . . . . . . . . . . . . . . . . . . . . . . . . . . . . . . . . . . . . . . . . . . . . . . . . 6Organization of the Monograph . . . . . . . . . . . . . . . . . . . . . . . . . . . . . . . . . . . . . . . . . . . . . . . . . 6
CHAPTER TWO
Trends in Financial Resource Allocation in the Reform . . . . . . . . . . . . . . . . . . 7Total Spending on the Reform . . . . . . . . . . . . . . . . . . . . . . . . . . . . . . . . . . . . . . . . . . . . . . . . . . . 7Spending on Independent Schools in 2004–2005 and 2005–2006 . . . . . . . . 13
Start-Up Funds . . . . . . . . . . . . . . . . . . . . . . . . . . . . . . . . . . . . . . . . . . . . . . . . . . . . . . . . . . . . . . . . . 16Per-Pupil Allotments . . . . . . . . . . . . . . . . . . . . . . . . . . . . . . . . . . . . . . . . . . . . . . . . . . . . . . . . . . . 16Grants . . . . . . . . . . . . . . . . . . . . . . . . . . . . . . . . . . . . . . . . . . . . . . . . . . . . . . . . . . . . . . . . . . . . . . . . . . . . 16Miscellaneous Income . . . . . . . . . . . . . . . . . . . . . . . . . . . . . . . . . . . . . . . . . . . . . . . . . . . . . . . . . 17
Independent School Revenues on a Per-Pupil Basis . . . . . . . . . . . . . . . . . . . . . . . . . . . 18Staff Expenditures . . . . . . . . . . . . . . . . . . . . . . . . . . . . . . . . . . . . . . . . . . . . . . . . . . . . . . . . . . . . . . . . 25Summary . . . . . . . . . . . . . . . . . . . . . . . . . . . . . . . . . . . . . . . . . . . . . . . . . . . . . . . . . . . . . . . . . . . . . . . . . . . 29

vi Developing a School Finance System for K–12 Reform in Qatar
CHAPTER THREE
Evaluation of the Reform’s School Finance System . . . . . . . . . . . . . . . . . . . . . . . 31Transparency . . . . . . . . . . . . . . . . . . . . . . . . . . . . . . . . . . . . . . . . . . . . . . . . . . . . . . . . . . . . . . . . . . . . . . 32Equity . . . . . . . . . . . . . . . . . . . . . . . . . . . . . . . . . . . . . . . . . . . . . . . . . . . . . . . . . . . . . . . . . . . . . . . . . . . . . . 35Adequacy . . . . . . . . . . . . . . . . . . . . . . . . . . . . . . . . . . . . . . . . . . . . . . . . . . . . . . . . . . . . . . . . . . . . . . . . . . . 39Efficiency . . . . . . . . . . . . . . . . . . . . . . . . . . . . . . . . . . . . . . . . . . . . . . . . . . . . . . . . . . . . . . . . . . . . . . . . . . . 47Accountability . . . . . . . . . . . . . . . . . . . . . . . . . . . . . . . . . . . . . . . . . . . . . . . . . . . . . . . . . . . . . . . . . . . . 48Stability/Responsiveness . . . . . . . . . . . . . . . . . . . . . . . . . . . . . . . . . . . . . . . . . . . . . . . . . . . . . . . . . . 52Summary/Conclusions . . . . . . . . . . . . . . . . . . . . . . . . . . . . . . . . . . . . . . . . . . . . . . . . . . . . . . . . . . 56
CHAPTER FOUR
Tool to Forecast Spending on the Reform . . . . . . . . . . . . . . . . . . . . . . . . . . . . . . . . . . 59Forecasting Tool . . . . . . . . . . . . . . . . . . . . . . . . . . . . . . . . . . . . . . . . . . . . . . . . . . . . . . . . . . . . . . . . . . . 61Model Scenarios . . . . . . . . . . . . . . . . . . . . . . . . . . . . . . . . . . . . . . . . . . . . . . . . . . . . . . . . . . . . . . . . . . . 67Per-Pupil Allocations . . . . . . . . . . . . . . . . . . . . . . . . . . . . . . . . . . . . . . . . . . . . . . . . . . . . . . . . . . . . . 73Summary/Conclusions . . . . . . . . . . . . . . . . . . . . . . . . . . . . . . . . . . . . . . . . . . . . . . . . . . . . . . . . . . 77
CHAPTER FIVE
Conclusions and Recommendations . . . . . . . . . . . . . . . . . . . . . . . . . . . . . . . . . . . . . . . . . 81
APPENDIXES
A. Description of Data Sources . . . . . . . . . . . . . . . . . . . . . . . . . . . . . . . . . . . . . . . . . . . . . . 85B. Description of Forecasting Tool Baseline Assumptions . . . . . . . . . . . 103
References . . . . . . . . . . . . . . . . . . . . . . . . . . . . . . . . . . . . . . . . . . . . . . . . . . . . . . . . . . . . . . . . . . . . . . . 109

vii
Figures
2.1. Total Spending on the Reform from April 1, 2003, Through March 31, 2006 . . . . . . . . . . . . . . . . . . . . . . . . . . . . . . . . . . . . . . . . . . . . . . . . . . . . . . 9
2.2. Resource Allocation Within and Across Institutes and SEC Offices from July 16, 2005, Through March 31, 2006 . . . 13
2.3. Breakdown of Total Funding for Generation I and Generation II Independent Schools from September 1, 2004, Through August 31, 2005, and from September 1, 2005, Through June 30, 2006 . . . . . . . . . . . . . . . . . . . . . . . . . . . . . . . . . . . . . . 17
2.4. Conceptual Representation of the Changes in Conditions Between Generation and Operational Year for Independent Schools . . . . . . . . . . . . . . . . . . . . . . . . . . . . . . . . . . . . . . . . . . . . . . . . . . . . . . . . . . . . . . . 20
2.5. Per-Pupil Resource Allocations and Other Sources of Revenue for Generation I and Generation II Independent Schools, 2004–2005 and 2005–2006 . . . . . . . . . . . . . . . . . . . . . . . . . . . . . 21
2.6. Per-Pupil Start-Up Funds, Grants, and Miscellaneous Income for Generation I and Generation II Independent Schools, 2004–2005 and 2005–2006 . . . . . . . . . . . . . . . . . . . . . . . . . . . . 22
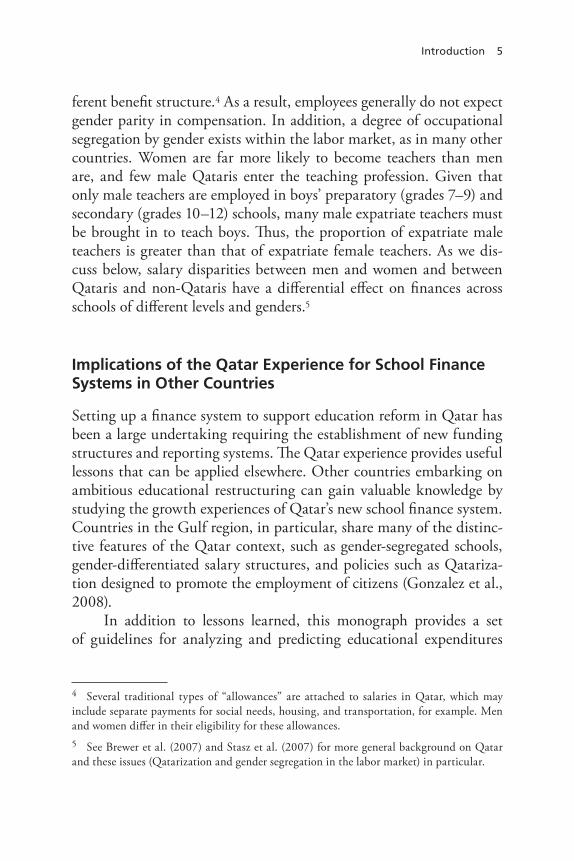
2.7. Per-Pupil Operating Revenues, Expenditures, and Surpluses for Generation I and Generation II Schools, 2004–2005 and 2005–2006 . . . . . . . . . . . . . . . . . . . . . . . . . . . . . . . . . . . . . . . . . . . . . . . . . . . . . 24
2.8. Number of Teaching and Nonteaching Staff in Independent Schools, Actual and Per Pupil, 2004–2007 . . . . . . . . . . . . . . . . . . . . . 26
2.9. Average Monthly Teacher and Nonteacher Salaries in Independent Schools, 2004–2005 and 2005–2006 . . . . . . . . . . . . 28
3.1. Per-Pupil Revenue Allocations and Other Sources of Revenue for Generation II Independent Schools on a Per-Pupil Basis from September 1, 2005, Through June 30, 2006, by School Level and School Gender . . . . . . . . . . . . . . . . . . . . . . 36

viii Developing a School Finance System for K–12 Reform in Qatar
3.2. Per-Pupil Operating Expenditures and Surpluses for Generation II Schools from September 1, 2005, Through June 30, 2006, by School Level and School Gender . . . . . . . . . . . . 37
3.3. Average Monthly Teacher Salaries in Independent Schools, by Teacher Gender and Nationality, 2004–2005 and 2005–2006 . . . . . . . . . . . . . . . . . . . . . . . . . . . . . . . . . . . . . . . . . . . . . . . . . . . . . . . . . . 38
4.1. Schematic Representation of the Four Major Components of Expenditures on Independent Schools Under the Reform . . . . . . . . . . . . . . . . . . . . . . . . . . . . . . . . . . . . . . . . . . . . . . . . . . . . . . . . . . . . . . . 63
4.2. Schematic Representation of the School Operating Revenue Forecast . . . . . . . . . . . . . . . . . . . . . . . . . . . . . . . . . . . . . . . . . . . . . . . . . . . . . 63
4.3. Schematic Representation of the Per-Pupil Allocation Forecast . . . . . . . . . . . . . . . . . . . . . . . . . . . . . . . . . . . . . . . . . . . . . . . . . . . . . . . . . . . . . . . 65
4.4. Schematic Representation of the Cost of Contracts (C), Asset Procurement (AP), or Institutes (I) Forecasts. . . . . . . . . . . . . 66
4.5. Forecast of Expenditures on the Reform, Scenario A . . . . . . . . . . . 70 4.6. Forecast of Expenditures on the Reform, Scenario B . . . . . . . . . . . 71 4.7. Forecast of Expenditures on the Reform, Scenario C . . . . . . . . . . . 72 4.8. Forecast of Expenditures on the Reform, Scenario D . . . . . . . . . . . 73 4.9. Forecast of Expenditures on the Reform, Scenario E. . . . . . . . . . . . 74 4.10. Forecast of Per-Pupil Resource Allocations Under Scenarios
A Through E, by School Type . . . . . . . . . . . . . . . . . . . . . . . . . . . . . . . . . . . . . . 75 4.11. Percentage Increase in School Expenditures Resulting from
Qatari Personnel Wage Increase, by School Type . . . . . . . . . . . . . . . 76 4.12. Percentage Increase in School Expenditures Resulting from
Qatari Staff Wage Increase and Increase in Per-Pupil Allocation, by School Type . . . . . . . . . . . . . . . . . . . . . . . . . . . . . . . . . . . . . . . . 77
4.13. Percentage Increase in School Expenditures Resulting from Qatarization, by School Type . . . . . . . . . . . . . . . . . . . . . . . . . . . . . . . . . . . . . . 78
A.1. Average Teacher Salary, by School Type, 2004–2005 and 2005–2006 . . . . . . . . . . . . . . . . . . . . . . . . . . . . . . . . . . . . . . . . . . . . . . . . . . . . . . . . . . . 95
A.2. Average Teacher Salary, by School Type and Teacher Nationality, 2004–2005 and 2005–2006 . . . . . . . . . . . . . . . . . . . . . . . 96
A.3. Average Teacher Salary, by Teacher Nationality and School Generation, 2005–2006 . . . . . . . . . . . . . . . . . . . . . . . . . . . . . . . . . . . . . . . . . . . 97

ix
Tables
2.1. Generation I and Generation II Independent Schools . . . . . . . . . . 14 2.2. Estimated Per-Pupil Allocations to Independent Schools,
by Generation, Level, and School Year . . . . . . . . . . . . . . . . . . . . . . . . . . . 22 2.3. Distribution of Independent School Employees, by Job
Category, Gender, and School Year . . . . . . . . . . . . . . . . . . . . . . . . . . . . . . . 27 2.4. Average Monthly Total Salaries, by Select Job Categories . . . . . 28 3.1. Resource Use in Independent Schools Ranked in the Top
and Bottom Halves of the School Performance Distribution, 2005–2006 . . . . . . . . . . . . . . . . . . . . . . . . . . . . . . . . . . . . . . . . . . . . . . . . . . . . . . . . . . . 45
3.2. Qatarization Requirements in Independent Schools . . . . . . . . . . . . 55 4.1. Model Scenarios . . . . . . . . . . . . . . . . . . . . . . . . . . . . . . . . . . . . . . . . . . . . . . . . . . . . 68 A.1. Summary of Data from the Office of Shared Services,
by Fiscal Year . . . . . . . . . . . . . . . . . . . . . . . . . . . . . . . . . . . . . . . . . . . . . . . . . . . . . . . 86 A.2. Summary of Variables Available, by Academic Year . . . . . . . . . . . . 92 A.3. Number of Individuals, by Job Title, 2004–2005 . . . . . . . . . . . . . . 92 A.4. Number of Individuals, by Job Title, 2005–2006 . . . . . . . . . . . . . . . 93 A.5. Number of Individuals, by Job Title, 2006–2007 . . . . . . . . . . . . . . 94 A.6. Teacher Characteristics, by Category, Boys’ Model and
Primary Schools, 2005–2006 . . . . . . . . . . . . . . . . . . . . . . . . . . . . . . . . . . . . . 94 A.7. Teacher Characteristics, by Category, Preparatory Schools,
2005–2006 . . . . . . . . . . . . . . . . . . . . . . . . . . . . . . . . . . . . . . . . . . . . . . . . . . . . . . . . . . . 95 A.8. Teacher Characteristics, by Category, Secondary Schools,
2005–2006 . . . . . . . . . . . . . . . . . . . . . . . . . . . . . . . . . . . . . . . . . . . . . . . . . . . . . . . . . . 96 A.9. Teacher Characteristics, by Category, Complexes,
2005–2006 . . . . . . . . . . . . . . . . . . . . . . . . . . . . . . . . . . . . . . . . . . . . . . . . . . . . . . . . . . 97 A.10. Nonteacher Staff Characteristics, by Category, Boys’ Model
and Primary Schools, 2005–2006 . . . . . . . . . . . . . . . . . . . . . . . . . . . . . . . . 98

x Developing a School Finance System for K–12 Reform in Qatar
A.11. Nonteacher Staff Characteristics, by Category, Preparatory Schools, 2005–2006 . . . . . . . . . . . . . . . . . . . . . . . . . . . . . . . . . . . . . . . . . . . . . . . . 98
A.12. Nonteacher Staff Characteristics, by Category, Secondary Schools, 2005–2006 . . . . . . . . . . . . . . . . . . . . . . . . . . . . . . . . . . . . . . . . . . . . . . . . 99
A.13. Nonteacher Staff Characteristics, by Category, Complexes, 2005–2006 . . . . . . . . . . . . . . . . . . . . . . . . . . . . . . . . . . . . . . . . . . . . . . . . . . . . . . . . . . 99
A.14. Lowest and Highest Possible Scale Scores on QCEA, 2005 and 2006 . . . . . . . . . . . . . . . . . . . . . . . . . . . . . . . . . . . . . . . . . . . . . . . . . . . . . 100
B.1. Number of Students in Ministry and Independent Schools, 2005–2006 . . . . . . . . . . . . . . . . . . . . . . . . . . . . . . . . . . . . . . . . . . . . . . . . . . . . . . . . . 104
B.2. Number of Ministry and Independent Schools, 2005–2006 . . . . . . . . . . . . . . . . . . . . . . . . . . . . . . . . . . . . . . . . . . . . . . . . . . . . . . . . . 104
B.3. Ministry and Independent Schools Average Students per School, 2005–2006 . . . . . . . . . . . . . . . . . . . . . . . . . . . . . . . . . . . . . . . . . . . 105
B.4. Independent Schools Costs of Operations, Institutes, Assets, and Contracts, by Fiscal Year . . . . . . . . . . . . . . . . . . . . . . . . . . . . 108

xi
Summary
In 2002, reform-minded leaders of Qatar embarked on a sweeping reform of the nation’s education system to prepare its people to par-ticipate successfully in the global economy. Termed “Education for a New Era,” the reform established a new governing body, the Supreme Education Council (SEC), which was to operate independently of the existing Ministry of Education and carry out the various reform mea-sures. The reform design called for some Ministry public schools to be converted to so-called “Independent schools” under the direction of the SEC to encourage key principles of autonomy, accountability, vari-ety, and choice. In addition to the establishment of these new schools, national curriculum standards and assessments were developed to pro-mote and monitor educational progress. After an initial planning phase, 12 Independent schools opened in the 2004–2005 academic year, and 21 more opened in 2005–2006. Growth in the number of Independent schools has continued, with 46 Independent schools serving 18 percent of Qatar’s K–12 population in 2006–2007.
RAND worked with Qatar’s leaders and the SEC to develop the reform plan and help implement it (Brewer et al., 2007). Following the initial implementation phase, the SEC asked RAND to analyze the progress made by the new school system, including an evaluation of the finance system developed to support the reform. This monograph documents RAND’s evaluation of the finance system, and a forthcom-ing companion report will address other aspects of the reform.

xii Developing a School Finance System for K–12 Reform in Qatar
Study Questions and Approach
This analysis aims to describe and evaluate the evolution of the finance system designed to support the reform in its early stages—specifically, from 2004 to 2006. We examine resource allocation patterns over this time period, develop a set of objectives and analytic tools for evaluat-ing the system, evaluate the system in its early stages of development, and offer suggestions for improving the system. Thus, the monograph addresses the following research questions:
How have financial resources in the reform been allocated over time?
in the reform as a whole –in Independent schools –
To what extent does the system of financial support for the reform meet the objectives of a strong school finance system?What analytic methods and tools will further the SEC’s ability to monitor and modify financial flows to the reform?How can the finance system be improved?
We relied on several data sources to assess financial aspects of the reform, including financial data from each Independent school, school administrative data, student-level data and test scores, and information about each student’s parents and family life. Our assessment reflects trends from the 2003–2004 planning phase, the first year of school operations in 2004–2005, and the second year of school operations in 2005–2006.
In evaluating the education finance system, we endeavored to understand how financial resources were allocated over time in the reform as a whole and in detail within the Independent school system. Likewise, we sought to ascertain the extent to which the new school finance system supported the growth of the reform and to highlight ways it could be improved.
We developed a framework for evaluating the school finance system, based on its ability to meet six main objectives: adequacy, effi-ciency, equity, accountability, transparency, and an appropriate balance

Summary xiii
between stability and responsiveness. We then assessed the system in light of these objectives, developing analytic methods where needed.
Findings
In assessing trends in resource allocation, we found that total spending on the reform rose from QR 144 million in the start-up phase to QR 523 million in the first year of school operations and to QR 841 mil-lion in the second year.1 Over that time, total spending on operating Independent schools alone more than doubled, from just under QR 200 million to just over QR 400 million as the number of Independent schools rose from 12 to 33.
We found that Independent school operators were hesitant to spend in their first year of operations and carried sizable surpluses of about 15 percent of revenues, on average. In their second year of opera-tion, they spent more but still carried surpluses of about 10 percent of revenues, on average. Some of this hesitancy in spending may have stemmed from general uncertainty regarding funding policies, lead-ing school operators to maintain financial buffers. Some may also have been due to an initial lack of experience in the management of budgets or to a lack of familiarity with the full range of resources that could be purchased by schools.
To assess financial adequacy, we investigated whether the reform supplied enough funding to support educational excellence, using a “successful schools” approach. This approach identifies high-perform-ing schools using statistical techniques and calculates average costs in these schools to determine adequate funding levels. Our application of the successful schools approach used 2006 standardized student test scores, regression adjusted for the prior performance, and demographic characteristics of students to rank schools by performance. Adjusted test scores are preferable to average test scores in determining the value a school provides to its pupils in a given year because they help distin-
1 The Qatari riyal (QR) was approximately equivalent to 0.275 U.S. dollars during the 2004–2006 period, and the exchange rate has remained relatively stable.

xiv Developing a School Finance System for K–12 Reform in Qatar
guish the school’s effect on learning from the performance that would be expected given the abilities of the students who attend the school.
Our adequacy analysis using the successful schools approach showed that higher test scores were associated with higher per-pupil spending, lower per-pupil surpluses, and lower pupil-teacher ratios in the 20 Independent schools examined at the primary school level. Dif-ferences in spending, surpluses, and pupil-teacher ratios between the top-performing (based on adjusted student test scores) and bottom 50 percent of primary schools are statistically significant. Top-perform-ing, as well as other schools, received funding adequate to cover their expenditures.
Still, it is too early to establish whether reform schools are receiv-ing adequate funding. First, it is not possible to assert that top-per-forming schools are “successful schools,” unless it is known that these schools are achieving desired levels of learning. Thus, this method ulti-mately relies on the existence of school performance standards, and these have not yet been established by the SEC. Although we can dis-tinguish better from worse performing schools, the absence of a stan-dard of excellence makes it unclear whether funding is adequate to promote excellence. Second, with so few schools in the sample, we are cautious in regarding our results as evidence of a causal link between resources and performance. The analysis did not reveal a statistically significant relationship between expenditures and student test scores for preparatory and secondary schools, but we do not know if this is due to a lack of association between test scores and financial resources for these schools or because the number of schools is too small to detect a relationship. As the reform grows and more Independent schools are established, additional data will become available for future analysis, improving inference that can be drawn.
In studying financial efficiency, we tried to establish whether the reform provides effective educational models at the most economical price. At this point in time, however, it is not yet feasible to deter-mine efficiency because, as noted above, standards for excellence have not been defined. Once they are established, it should be possible to identify which schools are successful and to compare resource use and teaching practices among them to determine which ones are most effi-

Summary xv
cient. By supplementing the quantitative analyses described above with a case study approach to examine the operations and teaching practices of successful schools, it will be possible to uncover factors that might yield high achievement at the lowest cost.
Our assessment of equity in the reform employs a comparison of resource use in boys’ and girls’ schools. We found that boys’ and girls’ schools had similar levels of resources and spending, but that this apparent similarity masked significant differences in cost struc-ture. The most salient factor in decomposing these cost structures is the gender and nationality of teachers in Independent schools. Male teach-ers earn around QR 5,585 more than females per month, and Qataris earn approximately the same monthly premium over non-Qataris. Female Qatari teachers earn approximately the same monthly salary as male non-Qataris, and male Qatari teachers earn well over twice the monthly wage of female non-Qatari teachers. By cultural convention, preparatory and secondary school students as well as primary-school girls have teachers of the same gender, whereas primary school boys can be taught by either gender. As a result, boys’ schools generally employ male teachers who cost more. However, because male Qataris gener-ally do not enter the teaching profession, the boys’ schools offset this higher cost by employing more than five times as many non-Qatari male teachers as Qatari male teachers. In contrast, girls’ schools had a nearly equal number of Qatari and non-Qatari teachers. The gender and nationality factors roughly offset each other to produce a similar overall spending pattern. Despite the apparent gender equity in school funding, the underlying differences in the gender and nationality of the teacher populations imply that the balance is tenuous and depends on maintaining a particular labor force composition. For example, increasing the share of Qataris employed in Independent schools, as desired by the government and promoted through a set of governmen-tal policies involving target quotas termed “Qatarization,” could have a differential effect on boys’ and girls’ schools.
We developed a flexible forecasting tool to investigate the poten-tial effect of various policy changes, such as Qatarization, on total reform expenditures. In one such scenario, we found that some schools stood to gain significantly but others had much to lose under enforce-

xvi Developing a School Finance System for K–12 Reform in Qatar
ment of Qatarization target quotas and compensatory adjustments to funding would alter the gender balance. As a result, the enforcement of Qatarization policies could affect funding equity across boys’ and girls’ schools as well as conflict with the goal of improving student achievement.
Two primary mechanisms are used in the finance system to pro-mote accountability to ensure that recipients of public funds produce high-quality education: fiscal oversight and school choice. The fiscal oversight mechanism involves regulating school spending and the labor market for school personnel. We found that the reform relied on this type of oversight as the primary mechanism to ensure accountabil-ity, as evidenced by several initial and added regulatory provisions. In the period covered by our analysis, the SEC reduced funding sources and froze surpluses to prevent the misuse of surplus funds. Although these restrictions appear to have achieved their desired fiscal effect, it is unclear whether they have provided incentives for schools to strive for improved performance. In addition, the second accountability mecha-nism, parental choice, is only partially effective in providing incentives for Independent schools to raise achievement, as capacity constraints make it difficult for them to accept new students. Without the incen-tive to attract students, the choice mechanism provides little incentive to raise performance.
The principle of transparency was meant to be manifest in the reform’s data systems. These systems were designed to produce needed information for monitoring and analysis, as evidenced by a compre-hensive set of financial reporting forms that schools are required to fill out and submit. However, we discovered areas of concern within the system during the time period covered by our evaluation, including nonelectronic data storage, inconsistent time periods for school state-ments reducing comparability across schools, nonstandard categoriza-tions of expenses, and a lack of unique staff identifiers. The lack of these standards made analytical work difficult in some areas. A new electronic management information system has been partially imple-mented since our analysis was conducted. It is hoped that the new system will eventually alleviate many of these problems.

Summary xvii
A final objective of a sound education finance system is striking a balance between stability and responsiveness. Stability refers to a pre-dictable operating environment that allows school operators to estab-lish both long- and short-term strategies for improving their schools; responsiveness indicates an ability of the governing body to intervene and fine-tune the reform to improve its functioning. Our findings indi-cate that the SEC emphasized responsiveness over stability in the years covered by this analysis. The SEC responded to information on school surpluses with numerous changes in financial policies. For instance, schools were changed from for-profit to nonprofit entities, surpluses were placed in holding accounts, operator salaries were capped, grant funding was discontinued, and start-up funds were capped. Still other changes in regulations stemmed from national goals, particularly goals meant to promote the employment of Qataris and increase Qatari base salaries by 40 percent. As a result of the many swift and strong policy changes over the first two years of operation of Independent schools, the system has lacked stability. This uncertainty likely made it diffi-cult for school operators to plan for the long term and make the kinds of investments in quality that would eventually use the full per-pupil allotment. Furthermore, some of the policy changes implemented ran counter to the reform principals of autonomy, accountability, variety, and choice. It is understandable, however, that a new system might undergo widespread change in its initial stages. Perhaps, moving for-ward, the system will achieve a greater degree of stability.
Conclusions and Recommendations
Qatar’s K–12 education reform has made notable progress in a few short years. It has founded a growing set of new schools and estab-lished a comprehensive infrastructure for financial support and moni-toring. With a rich array of financial reports and consecutive years of similar test-score data, it is now possible to develop new measures of financial and educational performance, analyze trends and differences across institutions and time periods, and forecast spending projections under various policy scenarios. In this monograph, we have explored

xviii Developing a School Finance System for K–12 Reform in Qatar
the wealth of data available and pointed the way to analyses that can inform the SEC in future decisionmaking. We also developed a flex-ible forecasting tool that serves both in evaluating current flows of rev-enues and expenditures and in assessing the effect of proposed policy changes.
Our assessment revealed areas for improvement in the finance system to enrich its capacity to support the reform and its overall mis-sion. We offer the following recommendations:
To determine levels of funding adequate to support educational excellence, we recommend continued analysis using a successful schools approach along the lines of the one we describe and imple-ment in our study. As the reform expands and performance tar-gets that represent excellence in achievement are established, this methodology will yield increasingly useful information.To obtain information that would lead to greater efficiency in school operations, we recommend supplementing the quantitative analyses described above with a case study approach to examine the operations and teaching practices of successful schools and uncover factors that might yield high achievement at the lowest cost. To address potential equity issues, we recommend that policies with different effects on different types of schools be investigated before implementation, using a forecasting model such as the one we have developed. To improve transparency, we recommend that the new informa-tion system include improved longitudinal tracking mechanisms as well as introduce more uniform categorization of personnel and expenditures. The current reporting system is in the process of being replaced by a management information system; its design provides an opportunity to address the data issues identified in this study. To strengthen accountability for school quality, we recommend an expansion of the choice mechanism through increases in capacity where possible to strengthen the system’s ability to hold schools accountable for providing high-quality instruction.

Summary xix
To improve stability, we recommend that, going forward, the pace of policy change be slowed to allow school operators to assess long-term prospects and plan for multiyear investments in resources that may improve educational quality.
In summary, we have evaluated the school finance system devel-oped to implement Qatar’s K–12 education reform in its early years. In so doing, we have devised a set of analytic methods and tools and suggested a number of potential improvements. It is hoped that these analyses, tools, and suggestions will be useful to the SEC as the reform expands and that they will also provide helpful information to other nations embarking on education reforms, particularly those in regions that face contextual issues similar to those in Qatar.


xxi
Acknowledgments
We thank the SEC’s Education Institute, Evaluation Institute, and Shared Services Department for their assistance in obtaining critical study data. Her Excellency Sheikha Ahmad Al Mahmoud, Ms. Sabah Al Haidoos, Mr. Adel Al Sayed, and Mr. Tariq Al Abdulla assisted us by cooperating throughout the study and by sharing their perspectives on preliminary findings. Dr. Nafez Alyan, Mr. Saleh Mohammed Al Khulaifi, Mr. Adnan Jabir, and Ms. Nadia Baker of the Education Institute’s Finance Office, and Mr. Jacob Abraham and Ms. Reem Al-Binali of the Shared Services Department assisted us by providing data and guidance in interpreting the data.
On the RAND team, we thank Abdulrazaq Al-Kurawi for valu-able input and liaison support in Doha; Rita Karam, Teresa Taningco, Reham Malik, Michelle Cho, and Anga Timilsina for assistance with research and analysis; Reham Badr El-Din Sayed and Kayla Ferguson for help with the translation of data from Arabic to English; Chris Fitzmartin for managing access to the Qatar National Educational Database System; Reham El-Din Sayed, Chris Dirks, and Lawrence Tingson for the high-quality administrative support they provided; and Cathleen Stasz, Catherine Augustine, Dominic Brewer, and Paco Martorell for their very helpful reviews.


xxiii
Abbreviations
HEI Higher Education Institute
LLC Limited Liability Corporation
LOSS lowest obtainable scale score
OPEC Organization of the Petroleum Exporting Countries
QCEA Qatar Comprehensive Educational Assessment
QCSS Qatar Comprehensive Schooling Surveys
QNEDS Qatar National Educational Database System
QR Qatari riyal
SEC Supreme Education Council
SSO School Support Organization


1
CHAPTER ONE
Introduction
Education is a critical component of any nation’s effort to prepare its youth for civic participation and a global economy. The leaders of the Arabian Gulf nation of Qatar view education as the key to Qatar’s economic and social progress. Long concerned that the country’s education system was not producing high-quality outcomes and was rigid, outdated, and resistant to reform, Qatari leaders approached the RAND Corporation in 2001, asking it to examine the kindergarten through grade 12 (K–12) education system in Qatar and to recom-mend options for building a world-class system consistent with other Qatari initiatives for social and political change. After selecting the options that seemed best suited to the Qatar context, the Emir of Qatar issued Decree No. 37 in 2002, which established a Supreme Education Council (SEC) as the highest authority in Qatar’s education sector to lead a reform entitled Education for a New Era. Much of the reform focused on K–12 education and was designed to decentralize authority and increase flexibility based on the principles of autonomy, account-ability, variety, and choice.
The K–12 reform design embodied three primary levers for change to the existing school system. First, “Independent schools” were established in the form of charter schools that were operated indepen-dently from the existing Ministry of Education (hereafter referred to as the Ministry). School operators were allowed to exercise autonomy over both academic matters—such as mission, curriculum, and ped-agogy—and financial matters—such as staffing and resource alloca-tion. This autonomy was intended to lead to variety, which in turn

2 Developing a School Finance System for K–12 Reform in Qatar
would lead to quality improvements in schooling options. Parents were permitted to exercise a limited degree of choice over their children’s enrollment. All Independent schools were converted from preexisting Ministry schools, although many were located in new facilities. Twelve Independent schools opened in the 2004–2005 academic year, 21 more in 2005–2006, and 13 in 2006–2007. Thus, in 2006–2007, 46 Inde-pendent schools were operating alongside approximately 164 Ministry schools and 292 private schools. Independent school students repre-sented approximately 18 percent of all K–12 students in Qatar, both private and public in that year. The number of Independent schools has continued to grow, with 19 more opening in 2007–2008 and 15 more opening in 2008–2009.
A second important lever for change was the development of new curriculum standards for Independent schools. These were developed with the assistance of outside contractors and covered four subjects—Arabic, English, mathematics, and science—and they were bench-marked to international standards.
Third, standardized national assessments were developed and administered in the same four subjects to students in publicly funded schools to determine how well they met the new standards. May 2007 marked the third administration of standards-based assessments to government-sponsored schools in Qatar.1
After the decree, Qatari leaders asked RAND to analyze and sup-port implementation of the reform. This monograph focuses on RAND’s evaluation of the finance system that was established to support the reform during the 2003–2004 planning phase and the first two years of operation of Independent schools—2004–2005 and 2005–2006.2 Our overall assessment of the system employs a conceptual framework based on generally recognized objectives of school finance systems:
1 Independent, Ministry, and private Arabic schools were assessed in 2005 and 2006 but only Independent schools were assessed in 2007.2 This report focuses on these two years. The earliest phases of the K–12 school reform effort—i.e., those before 2004–2005—are documented in Brewer et al. (2007). More detailed information about the reform can be found at Qatar’s Supreme Education Council Web site. Further information about the RAND project supporting the reform initiative can be found on the RAND Education Web site.

Introduction 3
transparency, equity, adequacy, efficiency, accountability, stability, and responsiveness.
Data for the study consisted of financial reports and audited state-ments furnished by the SEC’s Office of Finance and Office of Shared Services. The purpose of the RAND analysis was to describe the evo-lution of financial trends and resource allocation patterns in the early years of the reform, develop a set of objectives and analytic tools for evaluating the finance system designed to support the reform, evalu-ate the system in its early stages of development, and offer suggestions for improving the system. Thus, this report addresses the following research questions:
How have financial resources in the reform been allocated over time?
in the reform as a whole –in Independent schools –
To what extent does the system of financial support for the reform meet the objectives of a strong school finance system?What analytic methods and tools will further the SEC’s ability to monitor and modify financial flows to the reform?How can the finance system be improved?
Qatar Context
Qatar is one of the smallest Gulf states—only 11,427 sq km—but sig-nificant oil and natural gas reserves, along with its strategic location and progressive leaders, give it a unique status in today’s world. Qatar is one of the world’s wealthiest countries, and its economy has grown dramatically over the past decades. The Organization of the Petroleum Exporting Countries (OPEC), of which Qatar is a member, reports that Qatar’s gross domestic product per capita in 2007 was $75,426 (Organization of the Petroleum Exporting Countries, 2008).3
Several features of labor markets in Qatar and other Gulf nations have important implications for school finance. Qatar imports much
3 This figure would likely be much higher if it were to include only Qatari nationals.

4 Developing a School Finance System for K–12 Reform in Qatar
of the labor needed for its economy, especially in the private and semi-private sectors. In-country sources estimate the 2006 population in Qatar at 1.04 million (Qatar General Secretariat, 2008, Table 5). The nation does not publish figures for the total Qatari and non-Qatari (or expatriate) population, but using figures for the population ages 15 and above, estimates are that Qataris constitute about 18 percent of the population (Qatar General Secretariat, 2008, Table 20). The balance is composed of expatriate workers and, in some cases, their families.
Concurrent with education reform, a national policy to pro-mote the participation of Qatari citizens in the labor force— termed “Qatarization”—has been a high priority of the country’s current leaders. Qatarization is a form of affirmative action that has relied primarily on the use of quotas to induce employers to hire Qatari nationals. It aims to develop the skills of the Qatari workforce through employment, education, and training. Private and semiprivate or parastatal corporations, such as Qatar Petroleum, have been pri-mary targets of the quota system, but the school system has also been charged with promoting the employment of Qataris. Sanctions for fail-ing to meet Qatarization quotas have as yet been minimal—and often involve mandates to spend money on training Qataris—but pressures to comply continue to mount. The increased participation of Qataris in the workforce, if realized, has important implications for the school finance system, since Qataris earn higher salaries than expatriate work-ers of similar education and experience. Thus far, however, these quotas have not been rigorously enforced, and many schools fall short of tar-gets (Stasz et al., 2007).
Along with Qatarization, gender-related features of the Qatari labor market play an important role. Schools are segregated by gender. Female teachers may teach girls at all levels and boys at the primary school level (grades 1–6). Male teachers may teach only boys. In addi-tion, men and women do not generally work together in the same insti-tution, so, for example, a boys’ primary school with female teachers is likely to have an all female staff. Traditionally, in the Qatari labor force, men earn higher salaries than do women, largely because of a dif-
Introduction 5
ferent benefit structure.4 As a result, employees generally do not expect gender parity in compensation. In addition, a degree of occupational segregation by gender exists within the labor market, as in many other countries. Women are far more likely to become teachers than men are, and few male Qataris enter the teaching profession. Given that only male teachers are employed in boys’ preparatory (grades 7–9) and secondary (grades 10–12) schools, many male expatriate teachers must be brought in to teach boys. Thus, the proportion of expatriate male teachers is greater than that of expatriate female teachers. As we dis-cuss below, salary disparities between men and women and between Qataris and non-Qataris have a differential effect on finances across schools of different levels and genders.5
Implications of the Qatar Experience for School Finance Systems in Other Countries
Setting up a finance system to support education reform in Qatar has been a large undertaking requiring the establishment of new funding structures and reporting systems. The Qatar experience provides useful lessons that can be applied elsewhere. Other countries embarking on ambitious educational restructuring can gain valuable knowledge by studying the growth experiences of Qatar’s new school finance system. Countries in the Gulf region, in particular, share many of the distinc-tive features of the Qatar context, such as gender-segregated schools, gender-differentiated salary structures, and policies such as Qatariza-tion designed to promote the employment of citizens (Gonzalez et al., 2008).
In addition to lessons learned, this monograph provides a set of guidelines for analyzing and predicting educational expenditures
4 Several traditional types of “allowances” are attached to salaries in Qatar, which may include separate payments for social needs, housing, and transportation, for example. Men and women differ in their eligibility for these allowances. 5 See Brewer et al. (2007) and Stasz et al. (2007) for more general background on Qatar and these issues (Qatarization and gender segregation in the labor market) in particular.

6 Developing a School Finance System for K–12 Reform in Qatar
that can be applied to school systems in many nations. The evalua-tion framework developed in the study easily translates to other school finance contexts.
Limitations of the Study
The education reform investigated in this monograph is in its initial stages and is still evolving. Findings relating to the planning, start-up, and first and second years of operation of Independent schools may not be representative of the system in subsequent years of operation.
In addition, we have relied on data made available to us. As dis-cussed in detail in later chapters, not all data were available at a level of detail or completeness that might be most informative. Therefore, certain analyses were based on assumptions and judgments regarding the appropriate way to use the information. In these cases, we explain the assumptions and decision rules used.
We have also developed a methodology for determining adequate funding levels in Independent schools. Given that data were available for only a few schools, our findings are limited. As the reform grows, this methodology will provide more definitive information.
Organization of the Monograph
Chapter Two presents an overview and analysis of trends in expen-ditures and resource allocation in Qatar’s K–12 education reform. Chapter Three outlines and implements a framework for evaluating the reform’s finance system against a set of objectives. Chapter Four provides a forecasting tool that projects expenditures on the reform at different levels of aggregation into the future under different possible scenarios. Chapter Five summarizes findings and recommendations for improvements within the system. Data analysis methods are discussed in each chapter along with our findings. In addition, the monograph contains two appendixes: Appendix A provides detailed descriptions of the data used in the analyses and Appendix B lays out the baseline assumptions used in our forecasting model.

7
CHAPTER TWO
Trends in Financial Resource Allocation in the Reform
In this chapter, we present trends in expenditures and resource alloca-tion throughout the system to help us understand how and why spend-ing changed over time in the initial years of the reform. The first part of this chapter documents total spending on the reform, categorized as funds flowing to the various schools, institutes, offices, and con-tractors associated with the reform. The second part examines rev-enues and expenditures, including staff expenditures, across the first two cohorts of Independent schools. The information provided in this chapter serves three purposes. It addresses our first research question regarding resource allocation in the reform as a whole and in Inde-pendent schools. Second, it provides background information for our evaluation of the finance system discussed in the next chapter. Finally, it serves as the foundation for the information used to build our fore-casting model presented in Chapter Four.
Total Spending on the Reform
In documenting total spending on the reform, we present an overall picture of costs during three initial periods:1
1 Spending on the reform actually began in the 2002–2003 fiscal year but this year was excluded from the analysis because expenditures were not accurately recorded during that period and many expenditures were missing. The first year for which we examine data is the

8 Developing a School Finance System for K–12 Reform in Qatar
planning phase (April 2003–March 2004)1. start-up and first year of Independent school operation (April 2. 2004–March 2005)second year of Independent school operation (April 2005–March 3. 2006).
The information presented was derived from reports provided by the Office of Shared Services—the office charged with managing the budgets for the SEC and allocating funds to the various offices, insti-tutes, and schools involved in the reform. The data sources are described in detail in Appendix A.2 The monetary amounts reported in this study are in Qatari riyals (QR). Readers may wish to translate these into more familiar currencies, such as U.S. dollars or British pounds. Generally, over the time period covered in the study, the exchange rates were 3.64 QR per one U.S. dollar and 7.0 QR per one British pound.3
Figure 2.1 illustrates total spending on the various components of the reform—Independent schools, Institutes (the Education,4 Higher
2003–2004 fiscal year. Beginning with 2003–2004 thus allows us to examine spending for an entire fiscal year and to make more appropriate comparisons across years.2 Note that the data presented here cover the fiscal year used by the Office of Shared Ser-vices, which runs from April 1 to March 31, whereas Independent schools operate on the academic cycle from September 1 to August 31. The data presented here thus do not coincide with the exact period of the planning and operation phases of Independent schools. In some cases, the periods covered by the different sources of data varied from one year to the next and sometimes overlapped. For example, in 2004–2005, we have one spreadsheet dated April 1–July 15 and another dated April 1–March 31. We therefore made some assumptions in determining and separating the costs over the three periods. These assumptions are described in Appendix A.3 The Qatari riyal is pegged to the U.S. dollar but fluctuates significantly with respect to the British pound. As of August 6, 2007, one QR = 0.135 British pound.4 The Education Institute contracts with and overseas Independent schools and provides them with the financial, professional development, and other resources necessary to educate K–12 students successfully. It also develops curriculum standards and interfaces with the Evaluation Institute in the translation of standards into testing measures.

Trends in Financial Resource Allocation in the Reform 9
Figure 2.1Total Spending on the Reform from April 1, 2003, Through March 31, 2006
SOURCE: Office of Shared Services: total reform expenditures.RAND MG839-2.1
800
700
600
500
400
300
200
100
2003–2004 2005–20062004–2005
144
841
526
900
0
Spen
din
g (
QR
mill
ion
s)
OtherContractsAssetsInstitutesIndependentschools
Education,5 and Evaluation6 Institutes, the Office of Shared Ser-vices, and the Office of Communications), assets, contracts, and other expenses. The first bar shows the spending in the planning phase of the reform, the second bar the start-up and first year of Independent school operation, and the third bar the second year of Independent school operation.
5 The Higher Education Institute provides postsecondary career counseling, assesses and certifies the quality of postsecondary institutions, and administers new scholarship programs for students to study in postsecondary institutes worldwide. We considered removing Higher Education Institute costs from total costs, since our analysis focuses mainly on costs associ-ated with operating or overseeing Independent schools. However, for the periods April 2004 to March 2005 and April 2005 to July 2005, we are unable to distinguish spending on the Higher Education Institute from that on the other institutes and departments under the aus-pices of the Supreme Education Council. We include the Higher Education Institute in the assessment of total costs to allow comparisons across time. Costs associated with the Higher Education Institute are available for the period July 2006 to March 2006 and totaled 16 per-cent of total costs of all institutes and departments. These data are shown in Figure 2.2. 6 The Evaluation Institute is in charge of the standardized assessments that measure the performance of schools, students, and other education constituents.

10 Developing a School Finance System for K–12 Reform in Qatar
It is important to note that expenditures on the reform are accom-panied by savings within the Ministry of Education system, because all Independent schools were converted from Ministry schools. Therefore, from the point of view of the entire Qatar education system, reform expenditures may not result in added overall costs. We do not track expenditures in Ministry schools, however, and cannot offer informa-tion on overall educational “costs” in the country at the current time. Data on total expenditures in the Ministry are published annually in its Annual Statistics Report. Before the K–12 reform was announced in 2002, the Ministry reported total spending of 1.61 billion QR on K–12 education (nominal QR), which corresponds to 22,249 QR on a per-pupil basis, for the 2001–2002 school year (Ministry of Education, 2005). After the reform was established, it became difficult to rely on reports of total Ministry spending, because certain reform expendi-tures related to Independent school staffing were carried along in the reported Ministry totals. We are unable to distinguish these expendi-tures from others within the Ministry reports and thus cannot provide a side-by-side comparison of Ministry and reform-related spending.
Figure 2.1 shows that, during the planning phase, expenditures on the reform totaled around QR 144 million (nominal QR). Approxi-mately 80 percent of total spending was on external contracts. Con-tracts accounted for a large share of expenditures in this phase, as con-tractors were brought in to provide expertise not available in Qatar at the time. Contractors were initially responsible for developing the infra-structure for the reform (for example, developing curriculum standards and national assessments), hiring and training local staff to eventually manage the reform, and reporting on progress to the SEC. As the infra-structure grew and Independent schools were brought into operation, the share of the reform budget devoted to contractors diminished.7
Contracts were issued to various organizations for various pur-poses. In the planning phase, the two largest contractors were the
7 The 2003–2004 data are based on an itemized list of payments made by the Ministry of Finance on behalf of the SEC and are not readily comparable with the April 2004–March 2006 data. We identified contracts for 2003–2004 by going through each payment on the itemized list, but we were unable to map payments to the exact categories in the 2004–2005 and 2005–2006 years.

Trends in Financial Resource Allocation in the Reform 11
National Opinion Research Center—tasked with designing and imple-menting the Qatar National Education Database System (QNEDS)—and RAND Corporation—tasked with overseeing the implementa-tion of the Qatar K–12 reform design. Each contractor received more than QR 5 million between April 2003 and March 2004, although the actual amounts are difficult to specify from the documentation. As schools came into operation, contractors were brought in to help train school administrators and teachers. These organizations, referred to as School Support Organizations (SSOs),8 were Mosaica, Multiserve, and the Centre for British Teachers. In addition to these organizations, other contractors, such as the German Technical Cooperation, the Academy for Educational Development, the Queensland government, Arab Educational Services, and the College of the North Atlantic, were hired to supplement the activities of the other contractors and help with training and the development of national standards and curricula. We received records of spending on some of these contracts, but it was difficult to break these down accurately into amounts spent per type of contract per fiscal year, because information on certain contracts was missing and the information covered differing contractual periods. Our best estimate of SSO support amounted to approximately QR 44 million to the first cohort of 12 Independent schools and approxi-mately QR 54 million to the second cohort of 21 schools from Febru-ary 2004 to July 2006.
Total spending during the start-up and first year of Independent school operation amounted to around QR 526 million. During this phase, funding for the institutes that make up the administrative infra-structure of the reform represented approximately 7 percent of total spending, and assets procurement represented 4 percent. The greatest share of spending, at just over half, remained on contracts, but funding to Independent schools made up a significant portion, at 37 percent. Funding to the schools included start-up funds and funds designated
8 SSOs were hired under contract to provide a variety of services to schools, including pro-fessional development, curriculum development, and budget management. SSOs worked with a school or a group of schools for 18 months: six months before the start of the school year and then 12 months during the operation of the school. Schools were eligible for SSO support only in their first year of operation.

12 Developing a School Finance System for K–12 Reform in Qatar
for operational expenditures but not the in-kind support in the form of SSOs or other types of professional development that were instead funded through contracts.
The third phase included the second year of operation for the first group of Independent schools and the establishment of the second group. In this phase, total spending grew to approximately QR 841 million. Spending on Independent schools as a share of total spend-ing increased from about 37 to about 48 percent. Although the share of total spending devoted to asset procurement remained the same, the share devoted to institute operations increased slightly, from 7 to 9 percent. The share of spending on external contracts continued to decline, which was expected as the oversight institutions and Indepen-dent schools developed the capacity to manage their own operations. Contracts remained a significant share of the budget, however, at 39 percent.
Figure 2.2 illustrates how resources were allocated within and across the institutes and the SEC Offices of Shared Services and Com-munications from July 16, 2005, through March, 21, 2006—the most recent year for which we have such data.9 In the figure, general and administrative expenses include such items as operations and admin-istration, professional charges, and travel. Note that these figures do not include operational funding within Independent schools. Also note that allocations to the Higher Education Institute (HEI) represent approximately 16 percent of the total amount in this period. As noted above, we were unable to separate HEI expenditures from other expen-ditures across all three periods represented in Figure 2.1. We therefore included HEI expenditures in the totals reported.
The largest share of spending by the institutes was on contracts and project expenses. Spending on contracts was particularly high in the Evaluation Institute, which develops and administers both the Qatar Comprehensive Educational Assessment (QCEA) and the Qatar
9 We present this information for one year only because time periods covered in the spread-sheets differed between 2004–2005 and 2005–2006, reducing comparability over time.

Trends in Financial Resource Allocation in the Reform 13
Figure 2.2Resource Allocation Within and Across Institutes and SEC Offices from July 16, 2005, Through March 31, 2006
SOURCE: Office of Shared Services: operational expenditures on institutes.RAND MG839-2.2
160
140
120
100
80
60
40
20
EducationInstitute
HigherEducationInstitute
Office ofCommunications
Office ofSharedServices
EvaluationInstitute
94
52
615
159
180
0
Res
ou
rce
allo
cati
on
(Q
R m
illio
ns) Contracts
AssetsGeneral and administrativeexpensesStaff expenditures
Comprehensive Schooling Surveys (QCSS) and warehouses the QNEDS. The Evaluation Institute also allocates more resources to its fixed assets and loans than the other institutes do, and these are most likely associated with the infrastructure needed to develop, administer, and store the results of the assessments and surveys.
Spending on Independent Schools in 2004–2005 and 2005–2006
The first Independent schools—opened in the 2004–2005 academic year—are referred to as “Generation I” schools and those that opened in subsequent years are referred to as “Generation II,” “Generation III,” etc. A profile of the first two generations of schools, broken out by grade level, school gender, size, and year is provided in Table 2.1 using data provided by the Finance Office in the form of audited statements,

14 Develo
pin
g a Sch
oo
l Finan
ce System fo
r K–12 R
eform
in Q
atar
Table 2.1Generation I and Generation II Independent Schools
Generation I 2004–2005
Generation I 2005–2006
Generation II 2005-2006
School TypeNo. of
Schools Students
Average Students/
SchoolNo. of
Schools Students
Average Students/
SchoolNo. of
Schools Students
Average Students/
School
Primary model boys 0 0 N/A 0 0 N/A 3 1,573 524.3
Primary boys 3 1,666 555.3 3 1,866 622.0 1 625 625.0
Primary girls 4 2,691 672.8 4 2,717 679.3 7 3,971 567.3
Preparatory boys 2 1,201 600.5 2 1,271 635.5 2 1,240 620.0
Preparatory girls 0 0 N/A 0 0 N/A 4 2,232 558.0
Secondary boys 1 245 245.0 1 348 348.0 2 1,224 612.0
Secondary girls 0 0 N/A 0 0 N/A 2 948 474.0
Complexes boys 1 1,790 1,790.0 1 1,860 1,860.0 0 0 N/A
Complexes girls 1 1,524 1,524.0 1 2,163 2,163.0 0 0 N/A
Total 12 9,117 759.8 12 10,225 852.1 21 11,813 562.5
SOURCE: Finance Office.
NOTE: N/A = not applicable.

Trends in Financial Resource Allocation in the Reform 15
cash flow statements, staffing reports, and Finance Office data on stu-dent enrollment. Primary schools include regular and “model” schools. Model schools are primary schools for boys that are taught by wom-en.10 Other boys’ primary schools are taught by men. Boys who attend model schools typically have a one- or two-year transition in a male-taught primary school before they enter preparatory school. The largest Independent schools are “complexes,” which are schools that span a number of grades from kindergarten through grade 12.
Most Independent schools were primary schools and Generation I schools—with an average enrollment of 760 students in 2004–2005 and 852 students in 2005–2006—tended to be larger than those in Generation II—with an average enrollment of 563 students in 2005–2006.
Funding flows from the Education Institute11 directly to Indepen-dent schools and comprises three broad categories of support—start-up funds designed to cover preoperational expenses, per-pupil allotments based on enrollments, and grants to fund special projects or cover unusual needs. In addition, schools can earn small amounts of miscel-laneous income on their own.
10 “Model schools were developed in the 1970s to ease the transition from home to school for young boys, as well as to provide more employment opportunities for female teachers. A model school is a boys’ primary school of four grades (1–4) in which both the teaching staff and the administration are female” (Brewer et al., 2007, p. 23).11 The Finance Office collects various types of financial information. Our analyses used the following sources of data, provided to us by the Finance Office:
au• dited statements for 2004–2005 and 2005–2006cash• flow statements for 2004–2005 and 2005–2006staffing• reports for 2004–2005, 2005–2006, and 2006–2007finance• office data on student enrollment for 2004–2005 and 2005–2006 on.
These data sources are described in detail in Appendix A, including all assumptions that we made to render these data comparable over time.

16 Developing a School Finance System for K–12 Reform in Qatar
Start-Up Funds
These funds were offered only to schools that were in the first year of operation and covered expenses from the day the contract was signed to the day the school opened for the beginning of the academic year. Start-up funds have typically covered such expenditures as admin-istrative staff and teachers’ stipends, professional development and training, recruitment of teachers and students, consultation fees, and library development. Start-up funds do not cover capital expenditures or procurements provided directly by the Education Institute, such as laboratories, furniture, and computers. In 2004–2005, the amount of start-up funds differed, depending on the amounts requested by each school. In 2005–2006, however, the Education Institute capped the amount at QR 500,000.12 As of the 2006–2007 school year, the Education Institute halted the practice of offering start-up funds alto-gether. Instead, start-up funds are now provided as an advance on the per-pupil allotment (described below) given to schools, rather than as a separate source of revenue for the school.
Per-Pupil Allotments
Schools receive per-pupil funding, disbursed quarterly, designed to cover operational expenses based on enrollment levels. The amount given to schools depends on the school’s level (primary, preparatory, or secondary), with students with special needs qualifying for 20 percent augmentation of the per-pupil allotment. In 2005–2006, per-pupil allotments were QR 16,000 for primary, QR 19,400 for preparatory, and QR 21,800 for secondary schools from 2004 through 2006 (Edu-cation Institute, 2004, p. 8). The complexes received a mixture of per-pupil allotments based upon the number of students enrolled at each level.
Grants
In 2004–2005, schools were offered the opportunity to apply for grants to cover any “non-operational expense necessary to encourage creativ-
12 We found that schools were sometimes provided more and sometimes less than this amount of start-up funds in that year, however.

Trends in Financial Resource Allocation in the Reform 17
ity and innovation” in designing a school (Education Institute, 2004, p. 15). Grants typically covered major projects, such as special tech-nological equipment, computer software, language programs, text books, special needs, and other activities not included in the opera-tional budget. Grants were more or less discontinued in 2005–2006, however, and not offered in subsequent school years.
Miscellaneous Income
This represents other income schools might earn, such as special tuition, cafeteria income, and the sale of books.
Figure 2.3 shows the breakdown of total funding into its com-ponent parts. As can be seen in the figure, the vast majority of fund-ing consists of per-pupil allotments, ranging from 87 to 95 percent of the total funding, depending on the generation and year. For Generation I schools in their first year of operations, other funding
Figure 2.3Breakdown of Total Funding for Generation I and Generation II Independent Schools from September 1, 2004, Through August 31, 2005, and from September 1, 2005, Through June 30, 2006
SOURCE: Finance Office: KPMG audited statements.NOTE: Percentages may not sum to 100 percent because of rounding.RAND MG839-2.3
80
70
60
50
40
30
20
10
2004–2005Generation I
2005–2006Generation II
2005–2006Generation I
95
33
94
25100
0
Perc
enta
ge
MiscellaneousGrantsStart-upPer-pupilallocations
90
87
5
26

18 Developing a School Finance System for K–12 Reform in Qatar
consisted of grants (6 percent), start-up funds (5 percent), and miscel-laneous income (2 percent). Per-pupil allocations accounted for a much larger share of total funding for Generation I schools in 2005–2006 than in the previous year (94 percent, compared with 87 percent), as start-up funding disappeared as a source of income and the total amount of grants was cut roughly in half (from 6 to 3 percent).13 Gen-eration II schools received 94 percent of their total funding in the form of per-pupil allocations. Almost no grants were awarded (only two out of 21 Generation II schools received any grants), and about 5 percent came from start-up funds.
Independent School Revenues on a Per-Pupil Basis
Given that revenues are primarily driven by enrollment, comparing them on a per-pupil basis provides a meaningful way to measure fund-ing differences across generations and operational years. We make two comparisons. The first (across generations) is between the first year of operation of Generation I schools (2004–2005) and the first year of operation of Generation II schools (2005–2006). The second (across operational years) is between the first year of operation for Generation I schools (2004–2005) and the second year of operation for these same schools (2005–2006).
Differences across school cohorts or across time may be driven by four primary factors. First, policy changes may affect school finances. For example, changing the status of Independent schools from for-profit to nonprofit and restricting operator compensation and surpluses might have provided incentives for schools to spend more. On the other hand, the provision of start-up funding in the first year of operations but not in subsequent years likely reduced per-pupil funding in sub-sequent years. And the cap on start-up funds and discontinuation of grants may have meant that Generation II schools received less funding
13 Note that the vast majority of Generation I grants (97 percent) for the second year of operations were for a vocational school with a technology-intensive model that received a large grant. The remainder (3 percent) went to one other school and the remaining ten Gen-eration I schools did not receive any grants in 2005–2006.

Trends in Financial Resource Allocation in the Reform 19
than did Generation I schools in their respective first years of opera-tions. Second, schools and operators in the first and second generations may have been selected differently. For example, the SEC started con-verting large schools and the complexes first as part of its conversion plan. Schools in Generations I, II, and subsequent generations may use resources differently, have a different size and structure, and have stu-dents with different levels of performance and expectations. Conceiv-ably, the operations of larger schools (e.g., economies of scale) or newer schools (e.g., differences in organizational and teaching practices) may differ from those of smaller or older schools. Third, as more and more Independent schools come online, the scale of the reform increases. The system is still very much in flux, which may also affect the compari-son. Fourth, schools may have improved their operations after a year of experience in managing their finances. One might expect financial operations to be adjusted as a result of learning how to operate in the new environment. Conceptually, these two comparisons (across time and across cohort) and the factors driving change are shown in Figure 2.4. We illustrate and compare our findings, broken out across these dimensions, throughout the next section.
Figures 2.5 and 2.6 display the per-pupil revenue comparisons. Figure 2.5 shows the average per-pupil allocations14 and other sources of revenue (start-up funds, grants, and miscellaneous income) on a per-pupil basis for Generation I schools for 2004–2005 and for 2005–2006 and for Generation II schools for 2005–2006. In a similar fashion, Figure 2.6 shows a detailed breakout of the three components (start-up funds, grants, and miscellaneous income) of other revenues.
Figure 2.5 shows that Generation I Independent schools received, on average, QR 19,868 per pupil in total funding in 2004–2005 and QR 18,320 in 2005–2006.15 Generation II Independent schools received,
14 Differences between our estimates of per-pupil allocations and expected allocations are likely the result of small numbers of students registering and withdrawing from the school within the year.15 One secondary school with a vocational curriculum, accounts for a significant portion of other sources of revenue as a result of a large grant. Without that school, other sources of rev-enues per pupil would be QR 2,225 and QR 473 per pupil in 2004–2005 and 2005–2006, respectively.

20 Developing a School Finance System for K–12 Reform in Qatar
Figure 2.4Conceptual Representation of the Changes in Conditions Between Generation and Operational Year for Independent Schools
RAND MG839-2.4
II
Generation
First
Second N/A
Year ofoperation
I
Scale effectsPolicy changesSelection effects
ScaleeffectsPolicychangesLearning
on average, QR 19,011 per-pupil in total funding for the 2005–2006 operational year. Other revenues decreased from 13 percent of total revenues in the first year of operation to only 5 percent in the second year for Generation I schools.16 Other revenues represented 6 percent of the total in the first year of operations of the Generation II schools.
Average per-pupil allocations varied primarily as a result of differ-ences in school level, as shown in Table 2.2. Schools’ per-pupil alloca-tions, set by Finance Office policy, are estimated at about QR 16,000 for primary, QR 19,400 for preparatory, and QR 21,800 for secondary schools.17 Finally, the two large complexes have a mixture of student
16 Other revenues would change to 11 and 3 percent of total revenues, respectively, when we exclude from the analysis the secondary vocational school that accounts for a significant portion of other sources of revenue that resulted from a large grant.17 Differences between our estimates of per-pupil allocations and expected allocations are likely the result of small numbers of students registering and withdrawing from the school within the year.

Trends in Financial Resource Allocation in the Reform 21
Figure 2.5Per-Pupil Resource Allocations and Other Sources of Revenue for Generation I and Generation II Independent Schools, 2004–2005 and 2005–2006
SOURCE: Finance Office: KPMG audited statements.RAND MG839-2.5
20,000
15,000
10,000
5,000
2004–2005Generation I
2005–2006Generation II
2005–2006Generation I
25,000
0
Res
ou
rce
allo
cati
on
(Q
R)
Per-pupilotherrevenuePer-pupilallocation
17,275
2,593
17,347
973
17,794
1,217
19,868
18,32019,011
levels and, hence, their average per-pupil allotments fell between the primary and preparatory school levels.
Figure 2.6 breaks out the category of other revenues. Comparing the first year of operations of Generation I schools with the first year of operations of Generation II schools, we see that Generation I schools were treated more generously, receiving QR 950 per pupil in start-up funding and QR 1,150 per pupil in grants, compared with QR 850 per pupil in start-up funding and virtually zero in grants.18 Excluding miscellaneous income, which is not provided by the SEC, the addi-tional support (on top of the basic per-pupil allocation funding) that
18 Excluding one secondary school with a vocational curriculum, which received a large grant, we find that Generation I schools received QR 964 per pupil in start-up funding and QR 814 per pupil in grants, compared with QR 850 per pupil in start-up funding and virtu-ally zero in grants for Generation II schools.

22 Developing a School Finance System for K–12 Reform in Qatar
Figure 2.6Per-Pupil Start-Up Funds, Grants, and Miscellaneous Income for Generation I and Generation II Independent Schools, 2004–2005 and 2005–2006
SOURCE: Finance Office: KPMG audited statements.RAND MG839-2.6
2,500
2,000
1,500
1,000
2004–2005Generation I
2005–2006Generation II
2005–2006Generation I
3,000
0
QR
Per-pupilmiscellaneousincomePer-pupilgrantsPer-pupilstart-up
500
1,164
955
494
865
28
474
480
325
2,593
974
1,218
Table 2.2Estimated Per-Pupil Allocations to Independent Schools, by Generation, Level, and School Year
School Type Min Max Average No.
Primary Generation I, 2004–2005 15,650 17,008 16,065 7
Primary Generation I, 2005–2006 15,756 16,043 15,958 7
Preparatory Generation I, 2004–2005 18,273 19,656 18,964 2
Preparatory Generation I, 2005–2006 19,170 19,420 19,295 2
Secondary Generation I, 2004–2005 21,400 21,400 21,400 1
Secondary Generation I, 2005–2006 21,346 21,346 21,346 1
Complexes Generation I, 2004–2005 17,870 18,082 17,976 2
Complexes Generation I, 2005–2006 17,940 18,029 17,984 2
Primary Generation II, 2005–2006 13,941 16,026 15,695 11
Preparatory Generation II, 2005–2006 19,195 19,476 19,304 6
Secondary Generation II, 2005–2006 21,061 21,641 21,409 4
SOURCES: Finance Office; KPMG audited statements.

Trends in Financial Resource Allocation in the Reform 23
Generation I schools received in their first year of operations was nearly 2.3 times greater than that received by Generation II schools on a per-pupil basis. This was due to both policy changes, consisting of a reduc-tion in grant monies issued, and to selection effects, in that certain Generation I schools with specialized curricula obtained large grants to support their programs. Note that other sources of revenue account for only about 5–10 percent of total revenue—i.e., the overall differences in funding are still relatively small.
Although Generation I schools received more support in start-up funding than Generation II schools did in their first year of opera-tion because of the enforcement of the QR 500,000 cap per school in 2005–2006, the amount of start-up funding per pupil is comparable. The apparent difference disappears on a per-pupil basis as a result of the larger average school sizes of Generation I schools, including, for example, two large complexes.
In the second year of Generation I school operations, no grants were provided except for one grant of QR 4.9 million and a relatively small grant of QR 133,000. The Generation II schools typically did not receive funding through grants, with the exception of a grant of QR 126,000 and one of QR 204,000. Thus, Generation II schools received less additional funding (on top of per-pupil allocations) in their first year of operations than Generation I schools did in their first year of operations.
Figure 2.7 shows that, on average, Independent schools carried surpluses in both 2004–2005 and 2005–2006. Surpluses as a percent-age of operating revenues were, on average, 15 percent for Generation I schools in the first year of operation and 10 percent in the second year. Generation II schools had surpluses comparable with Genera-tion I (16 percent) in their first year of operation, despite less access to start-up and grant support funding. It appears from these data that Independent schools were more hesitant to spend in their first year of operations but adjusted in their second year, suggesting that some orga-nizational “learning” had occurred. Surpluses differed widely across
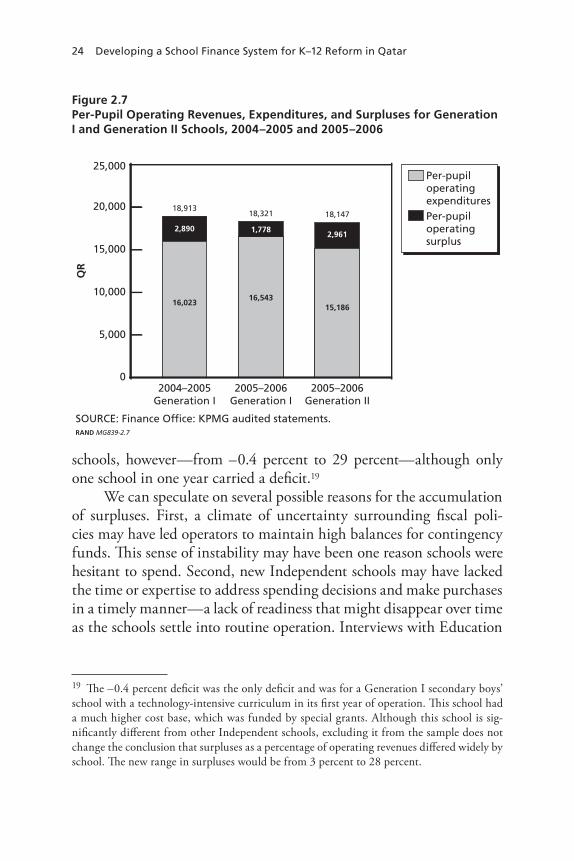
24 Developing a School Finance System for K–12 Reform in Qatar
Figure 2.7Per-Pupil Operating Revenues, Expenditures, and Surpluses for Generation I and Generation II Schools, 2004–2005 and 2005–2006
SOURCE: Finance Office: KPMG audited statements.RAND MG839-2.7
20,000
15,000
10,000
5,000
2004–2005Generation I
2005–2006Generation II
2005–2006Generation I
25,000
0
QR
Per-pupiloperatingexpendituresPer-pupiloperatingsurplus
16,023
2,890
16,543
1,778
15,186
18,91318,321 18,147
2,961
schools, however—from –0.4 percent to 29 percent—although only one school in one year carried a deficit.19
We can speculate on several possible reasons for the accumulation of surpluses. First, a climate of uncertainty surrounding fiscal poli-cies may have led operators to maintain high balances for contingency funds. This sense of instability may have been one reason schools were hesitant to spend. Second, new Independent schools may have lacked the time or expertise to address spending decisions and make purchases in a timely manner—a lack of readiness that might disappear over time as the schools settle into routine operation. Interviews with Education
19 The –0.4 percent deficit was the only deficit and was for a Generation I secondary boys’ school with a technology-intensive curriculum in its first year of operation. This school had a much higher cost base, which was funded by special grants. Although this school is sig-nificantly different from other Independent schools, excluding it from the sample does not change the conclusion that surpluses as a percentage of operating revenues differed widely by school. The new range in surpluses would be from 3 percent to 28 percent.

Trends in Financial Resource Allocation in the Reform 25
Institute officials indicated that they perceived operators as lacking in experience and encouraged operators to be less hesitant in spending the school’s budget. Third, the system provided an incentive for opera-tors to produce surpluses, as Independent schools were originally set up as for-profit entities.20 Fourth, the system lacked direct incentives to increase quality, since accountability mechanisms were not tied to academic performance. Fifth, the requirement that all expenses were to be approved by the Finance Office may have led to underspending. Last, schools may simply have been overfunded and not have needed the amount of money they were given.
Staff Expenditures
Among operating expenditure categories, staffing expenditures (defined generally in the audited statements as salaries and wages, retirement and health benefits, end of service benefits, bonuses, and rewards) rep-resented the largest share. The percentage of total expenditures devoted to staffing was 80 and 81 percent, for the first and second year of opera-tion of Generation I, respectively, and 84 percent for Generation II. Figure 2.8 displays trends in the numbers of teachers and nonteach-ers.21 The teacher category is the largest staff group at Independent schools. With the increase from 12 Independent schools in 2004–2005 to 46 in 2006–2007, the total number of staff more than tripled over the three-year period. The nonteacher group grew at a faster rate (300 percent) than the teacher group (200 percent). The figure also shows the ratio of teachers to pupils. The ratio is relatively flat, suggesting that most of the increase in the number of teachers is due to the expansion of the reform.
20 The original legal status of Independent schools and the subsequent transformation from for-profit to nonprofit entities is described in detail in Chapter Three. 21 Individuals classified as teacher aides (69 in 2004, two in 2005, and three in 2006) are grouped in the nonteacher category.

26 Developing a School Finance System for K–12 Reform in Qatar
Figure 2.8Number of Teaching and Nonteaching Staff in Independent Schools, Actual and Per Pupil, 2004–2007
SOURCE: Office of Finance Staffing Reports.RAND MG839-2.8
Nu
mb
er o
f st
aff
Rat
io o
f te
ach
ers/
no
nte
ach
ers
to s
tud
ents
2,000
1,500
1,000
2004–2005 2006–20072005–2006
2,500
0
500
0.08
0.03
0.02
0.09
0
0.01
0.07
0.06
0.05
0.04
Nonteachers
Teachers
Nonteachers
Teachers0.085
0.045
776
413
0.077
1,707
0.05
1,119
2,181
0.074
1,634
0.056
Table 2.3 estimates approximate numbers of staff in different job categories by gender.22 In 2006–2007, females represented about 70
22 The staffing reports from which we drew our data identified a large variety of nonstan-dard subject/title categories—more than 500 unique categories—and it was often difficult to tell from the names of the categories whether an individual was a teacher, a particular type of administrator, or another type of employee. Thus, our classifications may be subject to error. After isolating text strings such as “teacher,” “Teacher,” “instructor,” etc., to create our aggregate job title categories, we scanned all job titles within categories to be sure that we had classified individuals into the category that best appeared to describe their jobs. Assignments that were not clear had job titles that were either abbreviated or did not fit into one of the main categories. Job titles in later years were more precise and, thus, 2004–2005 had a higher share of job titles that could not be placed into a main category. In 2004–2005, 19 percent of the job titles did not fall into the main title categories and were classified as “other,” and less than 1 percent of cases were missing a job title. In 2005–2006, 7 percent of the job titles did not fall into the main title categories and were classified as “other,” and about 4 percent of cases were missing a job title. And in 2006–2007, 6 percent of the job titles did not fall into the main title categories and were classified as “other,” and about 3 percent of cases were missing a job title.

Trends in Financial Resource Allocation in the Reform 27
Table 2.3Distribution of Independent School Employees, by Job Category, Gender, and School Year
2004–2005 2005–2006 2006–2007
No. Percent No. Percent No. Percent
Male teachers 212 18.3 431 15.3 681 17.9
Female teachers 564 48.7 1,276 45.2 1,500 39.3
Male nonteachers 91 7.9 290 10.3 462 12.1
Female nonteachers 292 25.2 829 29.3 1,171 30.7
Total 1,159 100 2,826 100 3,814 100
SOURCE: Office of Finance Staffing Reports.NOTE: In 2004–2005, 30 noninstructional staff records did not contain gender information, and in 2006–2007, one noninstructional staff record did not contain gender information.
percent of all staff and 68 percent of all teachers in Independent schools. Female teachers constituted 50 percent of all employees in Independent schools, followed by female nonteachers (25 percent), male teachers (18 percent), and male nonteachers (8 percent).
Figure 2.9 illustrates trends in compensation using reported monthly total salaries. Our analysis of compensation is limited to the 2004–2005 and 2005–2006 years because salary data for 2006–2007 were incomplete.23 We see that the average salaries of both teachers and nonteachers grew by about 6 percent (from QR 7,788 to QR 8,291 per month) for teachers and about 8 percent (QR 7,455 to QR 8,061) for nonteachers between 2004–2005 and 2005–2006.
Table 2.4 provides information on the monthly salaries (typically paid over 12 months) of teachers and of categories of staff involved in management of the schools. Again, these categorizations are
23 The majority of 2006–2007 Staffing Reports use a “paid salary” category rather than a “total salary” category, whereas earlier reports used the latter category exclusively. The former category represents total salary after deductions for pensions, absences, and other items, whereas the latter category represents overall monthly salary as specified in the contract for each individual. Therefore salaries reported in the 2006–2007 reports are not comparable to those reported earlier.

28 Developing a School Finance System for K–12 Reform in Qatar
Figure 2.9Average Monthly Teacher and Nonteacher Salaries in Independent Schools, 2004–2005 and 2005–2006
SOURCE: Office of Finance Staffing Reports: staff salaries.NOTES: In 2004, six nonteacher and three teacher staff records were missing salarydata. In 2005, 44 nonteacher and 49 teacher staff records were missing salary data.RAND MG839-2.9
8,200
7,800
7,600
7,400
2004–2005 2005–2006
8,400
7,000
QR
NonteachersTeachers
8,000
7,200
8,061
7,788
7,455
n = 407 n = 773 n = 1,075 n = 1,658
8,291
Table 2.4Average Monthly Total Salaries, by Select Job Categories (in QR)
Job Title
2004–2005 2005–2006
No. MeanStd. Dev. Min Max No. Mean
Std. Dev. Min Max
Operator or principal
16 24,294 5,370 15,000 30,000 48 20,906 5,782 10,000 37,040
Vice principal 23 15,906 3,991 8,500 23,000 34 16,299 4,686 6,000 27,230
Subject head 37 9,803 3,358 3,000 15,360 77 9,923 3,738 1,050 20,000
Teacher 773 7,788 2,535 1,230 16,500 1,658 8,291 2,472 2,500 23,000
Total 849 1,817
SOURCE: Office of Finance Staffing Reports.

Trends in Financial Resource Allocation in the Reform 29
approximate and are based on matching words in the subject/title field with the aggregate category that seemed most appropriate.
The leaders of Independent schools consisted of operators and principals. In 2004–2005, because Independent schools had initiallybeen set up as for-profit Limited Liability Corporations (LLCs) formed by two or more partners, there were typically two operators per school and one principal, although some operators also functioned as princi-pals. Operators could receive a salary, but they expected to receive at least a portion of their compensation in the form of profits. The desig-nations of operator, operator-principal, and principal were inconsistent, sometimes overlapping, and difficult to compare over time. We there-fore combined the categories together into one: operator or principal. Their average salary was less in 2005–2006 than in 2004–2005. This appears to be the result of fewer high-paid operators in the upper end of the salary range in later years as the Education Institute, following SEC directives, began to restrict operator earnings. Vice principals earned slightly less than operators/principals, and although each Independent school may have had its own administrative structure, one vice princi-pal typically oversaw administrative affairs, whereas the other oversaw academic affairs. Subject heads earned more than regular teachers in Independent schools. They reported directly to the operator/principal or vice principal on matters related to curriculum and academic plan-ning in the subject in which they specialized and also often conducted or coordinated professional development programs for teachers. For all job categories examined, we found a considerable range of variation.
Summary
We estimated trends in expenditures and funding in the Qatar K–12 education reform between 2003–2004 and 2005–2006 as well as resource allocation within Independent schools. Our primary findings can be summarized as follows:

30 Developing a School Finance System for K–12 Reform in Qatar
Total expenditures on the reform grew from QR 144 million in 2003–2004 to QR 526 million in 2004–2005 and 841 million in 2005–2006.Independent school operating expenditures made up 37 and 48 percent of the total expenditures on the reform in 2004–2005 and 2005–2006, respectively. For Generation I Independent schools, revenues declined while expenditures increased in the second year of operation. Start-up funding disappeared and the total amount of grants was roughly cut in half.Comparing per-pupil funding for Generation I and Generation II schools in their first year of operation, we find that the former were treated more generously, receiving QR 950 per pupil in start-up funding and QR 1,150 per pupil in grants, compared with QR 850 per pupil in start-up funding and virtually zero in grants for Generation II schools.Independent schools appeared hesitant to spend in their first year of operations but adjusted their spending upward to some degree in their second year
Nearly all Independent schools carried surpluses as a percent- –age of operating revenues. Average surpluses decreased for Generation I schools in their –second year. Surpluses were, on average, 15 percent for Genera-tion I schools in the first year of operation and 10 percent in the second year. Generation II schools had surpluses comparable with Gener- –ation I surpluses (16 percent) in their first year of operation despite lower funding levels.
Staff expenditures made up the majority of the operational expen-ditures of Independent schools (about 82 percent), with instruc-tional staff accounting for approximately three-quarters of all staff expenditures. Rough estimates of the average salaries of teach-ers show that they grew by 6 percent between 2004–2005 and 2005–2006. Average salaries of nonteachers grew by 8 percent over the same period.

31
CHAPTER THREE
Evaluation of the Reform’s School Finance System
The descriptive analyses provided in Chapter Two summarize expen-diture and funding patterns in the reform throughout its first three years. We now turn to the key question of whether the reform’s school finance system is meeting the objectives of a sound system. We evaluate the system on the basis of its adherence to a set of guiding principles. A review of the literature on school finance yielded several characteristics that appeared to be related to a highly functioning school finance sys-tem.1 We synthesized these into the following six guiding principles:
Transparency1. : A school finance system should be based on a clear accounting system that tracks the use of funds. Equity2. : A school finance system should provide resources suf-ficient to meet the needs of all students equitably.Adequacy3. : A school finance system should provide funding that is adequate to support educational excellence.Efficiency4. : A school finance system will deliver effective educa-tional models at the most economical price.Accountability5. : A school finance system should ensure that recip-ients of public funds produce a quality of education commensu-rate with the funding received.Stability/responsiveness6. : A school finance system will balance the stability in funding needed to enable schools to invest in the
1 See, for example, Cheng (1993), Hanushek and Luque (2003), Hanushek (2003), Mar-zano (2000), and Scheerens and Bosker (1997).

32 Developing a School Finance System for K–12 Reform in Qatar
high-quality delivery of education with the flexibility to adjust to ongoing evidence-based needs assessments.
We evaluate the system against each of these objectives in turn. The evaluation points to recommendations to improve the school sys-tem’s performance as it evolves.
Transparency
To achieve transparency, a school finance system needs a data system that is comprehensive, accurate, and comparable across institutions and time periods. In addition, data must be easily accessed by institutional researchers and in sufficient detail to support the types of analyses that inform policymaking.
The Office of Shared Services and the Finance Office collect a rich variety of data, which are vital to tracking the progress of the reform. However, several data-related issues made it difficult to produce accu-rate and complete analyses for the period covered by this monograph, and it is useful to outline the primary obstacles to analysis. Some of these issues may have since been resolved with the introduction of a new management information system. As of fall 2008, this new system had been partially implemented in Independent schools.
First, the time periods covered by various financial documents were not standardized. Thus, data could not be compared across time periods. For example, the Office of Shared Services reported financial information for the fiscal year (April 1 through March 31) on some documents and for the periods from April 1 through July 15 and from July 16 through March 31 on others. Although the data allowed some corrections to be made to obtain financial information for each fiscal year at the aggregate level, such corrections were not possible for much of the more detailed information (such as the breakdown of institute spending or of assets procurement), as the categories for expenses had changed between the 2004–2005 and 2005–2006 reporting. As a result, we could compare total expenditures on the reform between fiscal years only at the aggregate level but not in detail.

Evaluation of the Reform’s School Finance System 33
In addition, the Finance Office provided audited statements pre-pared by auditing firms KPMG and Deloitte & Touche regarding the operation of each Independent school for the academic year (Septem-ber 1 through August 31), which could therefore not be compared with shared services data reported for the fiscal year. Furthermore, monthly cash flow statements were not available for every school over the same time period. As a result, cash flow data could not be used to analyze the financial operations of Independent schools. We examined only the ratio of total administrative to total instructional wages, judging that although actual total wages might change over time, the ratio was likely to be fairly stable. However, all other cash flow data, such as allocations across spending on supplies, professional development, maintenance, etc., could not be used in comparisons.
Second, financial categorizations were not reported in a standard format. We found that many individual schools did not use the stan-dard categories prescribed in the financial handbook (Education Insti-tute, 2004) when reporting their cash flow statements, and that data were not available for each school for the same time period. This could result either because schools did not perceive a need to report using the standard categories or they felt that the standard categories did not meet their reporting needs. The school personnel reports—called the Staffing Reports—were particularly inconsistent across schools. Job titles were inconsistently defined, and data were incomplete. Report-ing dates differed by school. The salary measure was not reported in a consistent manner across time, so we could not compare salaries in 2006–2007 with salaries in earlier years. Staff identification numbers did not appear to be consistently maintained across time. These prob-lems rendered analyses of salary trends by job category subject to a large margin of error. In some cases, important analyses were not possible, such as analyses to determine attrition rates. Tracking teacher attrition is important to policymakers in structuring pay scales and other incen-tives, such as bonuses or improvements in working conditions.
Third, the level of detail in the data was sometimes insufficient. In particular, the Staffing Reports failed to provide complete informa-tion on unique identifiers; characteristics of staff, such as the job title,

34 Developing a School Finance System for K–12 Reform in Qatar
level of education, and years of experience; and different components of salary (total salary, different types of benefits, and paid salary). For example, separating the subject taught from the job title would help determine whether shortages of particular categories of personnel, say science teachers, exist or whether salaries differ by subject. The Staffing Reports lacked information on basic job categories, and it was often difficult to determine the type of work an individual performed. Infor-mation on standardized job categories would have made the analy-ses more reliable. A recommended set of categories to be implemented going forward might include the following:
principal/operatorvice principalprofessional administrative (e.g., guidance counselors, business managers, nurses, librarians, information technology personnel)nonprofessional administrative (e.g., clerical)subject headteacherteacher aide or assistantother instructional staff (e.g., special education resource special-ists, sports coaches)facilities staff (e.g., janitorial staff, guards, bus drivers, cafeteria workers).
To be available for research and truly inform policymaking, data need to be accessible for analytic and monitoring purposes to policy-makers and decisionmakers, institutional researchers, analysts, educa-tors, and families (with levels of access differing among these stake-holder groups). In many cases, schools sent hard copies of data, rather than electronic copies, to the Finance Office, necessitating manual input before analyses could be performed. Thus, although such data were accessible, there were significant barriers to their use.

Evaluation of the Reform’s School Finance System 35
Equity
Equity concerns arise when disadvantaged groups are shortchanged in the allocation of resources within a system. Equity is therefore assessed by examining differences in resource allocation across different groups of students. In the Qatar public school system, disadvantaged groups have not officially been identified by the government, so we do not discuss them here. However, given that clear differences exist in the staff characteristics of girls’ and boys’ schools, we analyzed school finances by gender to provide information regarding the financial bal-ance between the two types of schools. Gender segregation may have an effect on school finances, given that wages account for the majority of school expenditures and female teachers earn less than their male counterparts.
Since female teachers can teach boys only through the primary school level, and since primary, preparatory, and secondary schools received different amounts of funding, we investigated gender break-downs by school level. The analysis of gender by level focused only on the 21 Generation II schools in 2005–2006, because there were insuf-ficient numbers of schools in certain levels of Generation I in some cat-egories2 and because the Generation I complexes do not provide finan-cial breakdowns by level.
Inspection of 2005–2006 finance data indicates that average per-pupil allocations and other sources of revenues (start-up funding, grants, and miscellaneous income) show only slight differences for boys’ and girls’ schools at each level (see Figure 3.1).3 The slight difference in other revenues for boys’ and girls’ schools is due to start-up funds, grants,
2 In Generation I, there are only two boys’ schools and no girls’ schools at the preparatory level. There is only one secondary boys’ school, and there are no girls’ schools at the second-ary level. There is one boys’ complex and one girls’ complex.3 Per-pupil allocations are slightly below expected. Official per-pupil funding (Education Institute, 2004) is QR 16,000 for elementary schools, QR 19,400 for preparatory schools, and QR 21,800 for secondary schools, although Figure 3.2 shows QR 15,700 for elementary schools, QR 19,300 for preparatory schools, and QR 21,400 for secondary schools. Differ-ences are likely the result of small numbers of students registering and withdrawing from the school within the year.

36 Developing a School Finance System for K–12 Reform in Qatar
Figure 3.1Per-Pupil Revenue Allocations and Other Sources of Revenue for Generation II Independent Schools on a Per-Pupil Basis from September 1, 2005, Through June 30, 2006, by School Level and School Gender
SOURCE: Finance Office: KPMG audited statements.RAND MG839-3.1
20,000
15,000
10,000
5,000
Boys’secondary
(n = 2)
Girls’middle(n = 4)
Boys’middle(n = 2)
Girls’elementary
(n = 7)
Boys’elementary
(n = 4)
Girls’secondary
(n = 2)
25,000
0
QR
OtherPer-pupilallocations
1,0791,276
1,078 1,835
1,005 1,233
15,369 15,881
21,467 21,351
19,316 19,297
and miscellaneous funds. Boys’ schools received slightly less start-up funds (QR 471,658, on average, compared with QA 499,353 for girls’ schools) and these were spread across larger numbers of pupils—boys’ schools had an average of 583 pupils and girl’s schools had an average of 551 students per school. Only two Generation II schools received grants in 2005–2006, and both were girls’ preparatory schools.4 In addition, one secondary girls’ school generated miscellaneous income of QR 1,330 per pupil (compared with QR 420 per pupil, on average, for all schools).
Similarly, there appears to be little difference between boys’ and girls’ schools at each level when comparing operating revenues, expenditures, and surpluses (see Figure 3.2), except for an apparent
4 KPMG financial statements indicated that one school received a grant to acquire property and equipment. Details on the use of the grant for the other school were not provided.

Evaluation of the Reform’s School Finance System 37
Figure 3.2Per-Pupil Operating Expenditures and Surpluses for Generation II Schools from September 1, 2005, Through June 30, 2006, by School Level and School Gender
SOURCE: Finance Office: KPMG audited statements.RAND MG839-3.2
20,000
15,000
10,000
5,000
Boys’secondary
(n = 2)
Girls’middle(n = 4)
Boys’middle(n = 2)
Girls’elementary
(n = 7)
Boys’elementary
(n = 4)
Girls’secondary
(n = 2)
25,000
0
Exp
end
itu
res
and
su
rplu
ses
(QR
)
Per-pupil operating surplusPer-pupil operating expenditure
2,7152,429
2,210 3,760
3,874 3,689
12,967 13,840
19,444 18,371
15,684 15,924
difference in surpluses at the secondary school level in favor of girls’ schools (one of the two girls’ secondary schools had higher-than-aver-age miscellaneous income per pupil). Overall, the data from this small sample of schools indicate that the finance system achieved a certain amount of gender parity, as very few differences exist in funding or expenditures by a school’s gender.
However, the apparent similarities found in this sample of schools mask underlying differences in compensation. The financial balance is tenuous and depends on the offsetting effects of male/female and Qatari/non-Qatari salary differences. For example, changes in the sala-ries of Qataris relative to those of non-Qataris might shift the balance in staff spending between the boys’ and girls’ schools because girls’ schools employ higher proportions of Qataris. For the same reason, changes in or stronger enforcement of the Qatarization quotas designed

38 Developing a School Finance System for K–12 Reform in Qatar
to increase the proportion of Qataris in the workforce might upset the balance in staff spending between boys’ and girls’ schools.
Figure 3.3 shows average monthly salary differences for teachers, by gender and nationality, in all Independent schools in 2004–2005 and 2005–2006. Qatari men are by far the highest-paid staff members in Independent schools. In 2004–2005, they earned around 52 percent more (QR 4,805), on average, than the next highest-earning category, Qatari women. This difference grew even more in 2005–2006, when Qatari men earned almost 60 percent more than Qatari women (a pre-mium of QR 5,585).
Non-Qatari teachers of both genders received lower average sala-ries than Qatari teachers, although non-Qatari male teacher salaries were similar to those of Qatari female teachers in 2005–2006. Of par-ticular interest in Figure 3.3 is the 20 percent increase over the two-year period in the average monthly salaries of non-Qatari male teach-ers, to the point where they are similar to the salaries of Qatari female
Figure 3.3Average Monthly Teacher Salaries in Independent Schools, by Teacher Gender and Nationality, 2004–2005 and 2005–2006
SOURCE: Office of Finance Staffing Reports: staff salaries.RAND MG839-3.3
14,000
8,000
6,000
4,000
2004–2005 2005–2006
16,000
0
Sala
ry (
QR
)
Femalenon-QatariFemaleQatariMalenon-QatariMaleQatari
12,000
10,000
2,000
14,974
9,3249,389
6,430
14,018
7,687
9,213
5,977
n = 296 n = 213 n = 177 n = 35 n = 687 n = 585 n = 344 n = 42

Evaluation of the Reform’s School Finance System 39
teachers. It is likely, then, that the observed parity in boys’ and girls’ schools’ instructional expenses was an outcome of the salary parity between Qatari females and non-Qatari males. Although these results were based on a small sample of Independent schools, similar patterns are likely to operate in the full population of schools. The lowest earn-ing category, female non-Qataris, earned substantially less, on aver-age, than the other groups. In 2005–2006, individuals in this group earned, on average, between 45 and 46 percent less than those in the female Qatari and male non-Qatari categories, and they earned less than half of a male Qatari’s average salary.
In sum, the apparent gender equity in school finance appears to be the result of a tenuous balance between teacher gender and nation-ality wage premiums and is based on unequal staff salaries for differ-ent gender and nationality groups. Proposed Qatarization policies may upset this balance, if enforced. If salary differentials remain in place while the staffing mix changes, the funding balance between boys’ and girls’ schools might be erased.
Adequacy
Adequacy may be defined in terms of outcomes or inputs. There is no universally accepted definition of adequacy in education funding, and even when a definition is agreed on, there is debate over how to mea-sure it (Augenblick, Myers, and Anderson, 1997; Picus, 2000; Guthrie and Springer, 2007). Several strategies have been developed to deter-mine the funding levels adequate to achieve particular goals, but none has been accepted as definitive and each is subject to limitations. Nev-ertheless, at the end of the day, policymakers are left with the task of establishing funding levels for public school systems, despite the limita-tions of various approaches to doing so.
The convenience and growing availability of outcomes based on test scores has led to their popularity as a measure on which to base a determination of adequate funding. In the United States, many debates over whether a state provides enough funding for an adequate educa-tion have been decided in the courts, because state education systems

40 Developing a School Finance System for K–12 Reform in Qatar
have not been considered impartial (Picus, 2000). Recent court deci-sions in the United States have leaned toward defining adequacy in terms of a dollar amount of funding that is believed to be enough to achieve a desired level of student achievement on standardized tests.5 Performance on standardized tests provides a valuable indicator of learning; however, it is important to keep in mind that it may fail to capture aspects of learning that are not measurable through these types of tests and it is only one of several possible measures, such as gradua-tion rates and student or parent satisfaction, or delayed effects, such as college attendance or employment rates.
There are four main approaches to determining funding levels adequate to produce desired outcomes (Augenblick et al., 1997; Guthrie and Springer, 2007; and Hanushek, 2006). These are generally referred to as the historical approach, the professional judgment approach, the econometric approach, and the successful schools approach.
The historical approach merely assigns new funding levels based on past levels. It starts by setting a base-cost level using the actual expenditures of a given set of schools. Advantages include simplicity and predictability. A disadvantage appears if spending in previous years was not truly adequate or was too high. This method has no ability to distinguish between funding adequate to produce desired outcomes and funding adequate to produce past outcomes.
The professional judgment approach relies on a panel of experts to decide the resource levels needed to achieve a high-quality learning environment. Once the type and amount of resources are decided, they are assigned costs. The costs are then summed to produce a total spend-ing amount. Although sensible, the professional judgment approach has some drawbacks. First, no clear selection criteria for the expert panel exist. Second, whether the panel is composed of educators or financial officers, conflicts of interest are likely. Third, the judgments made are likely to be highly subjective and lacking any connection to efficiency.
The econometric or “cost-function” approach examines the relation-ship between costs and education outcomes using econometric model-
5 For example, the 2005 West Orange Cove ISD v. Neeley decision, in Texas, was based on analyses related to student achievement.

Evaluation of the Reform’s School Finance System 41
ing. Data on costs, achievement, and school characteristics (including the socioeconomic characteristics of their pupils) are collected. Costs are then related in a statistical model to achievement and school char-acteristics. Using the resulting statistical equation, predicted costs are calculated for a desired level of achievement.
The econometric approach is problematic for several reasons. First, the data are based on the existing use of resources, which may or may not be efficient. Second, and more important, the results are highly sensitive to the way the model is specified (Guthrie and Springer, 2007). Third, if desired achievement levels are much higher than those currently achieved in the sample of schools in the data, the equation must predict costs based on scanty evidence, which may lead to out-of- sample prediction bias. Last and most important, the model can be highly misleading if resources and achievement are only weakly related. If this relationship is not strong, then the model will produce very high and most likely inflated estimates of the amount of funding needed to produce small desired increases in student achievement (Hanushek, 2006).
The successful schools approach examines actual expenditures in schools that are viewed as successful in achieving desired outcomes, adjusting for factors that lead to bias, such as having students from high-income families. In this approach, high-performing schools are first identified, and average expenditures in these schools are then cal-culated and used as evidence of adequate spending levels.6 One advan-tage of this method is that it can examine the use of several types of resources in high-performing schools and compare it with the use of these same resources in lower-performing schools. For example, per-pupil expenditures, pupil-teacher ratios, the ratio between administra-tive and instructional expenditures, etc., can all be examined. A dis-
6 In the United States, John Augenblick and John Myers were the first to employ a success-ful schools methodology in response to the education adequacy order of the Ohio Supreme Court in DeRolph v. State (1997). They sought to identify school districts that were meeting state standards and then to use those districts’ average expenditure amount as a fair estimate of the actual cost of an adequate education. After removing “outliers,” the researchers chose a sample of successful school districts by reference to six specific measures of student achieve-ment and eight input measures, such as pupil-teacher ratio and average teacher salary.

42 Developing a School Finance System for K–12 Reform in Qatar
advantage is that it requires that the most successful schools do indeed reach desired performance levels—if they do not, there will be no truly successful schools from which to gather expenditure data.
After weighing the pros and cons of these various approaches, we deemed the successful schools approach—although subject to limitations as well—to be the most suitable methodology to apply to the Qatari context, because it relies on actual rather than hypotheti-cal spending patterns and is not subject to the issues that undermine the credibility of the econometric approach. As a first step, we cre-ated school performance measures. The process of constructing such measures is complex and subject to a number of possible limitations. The simplest measure is average school performance. This measure is likely to be biased, however, by the nonrandom sorting of students into schools. In other words, if more-able students tend to select or be selected by particular schools, then the average performance mea-sure will measure both the ability of the students and what the school itself has taught them, but it will be impossible to distinguish between the two components. Thus, it will be impossible to know whether the school—rather than its group of students—is truly “high-performing.” To correct for this, some measure of a school’s “value added” is gener-ally constructed. This is done by adjusting in some fashion for the prior achievement of students and thus requires a minimum of two years of test scores for each student.
One way to create a rough measure of the value added by the school is to simply take the difference between a recent and a prior test score for each child and average these differences by school. A more fine-grained method of creating such a measure is to adjust for prior scores and, if possible, other student characteristics in a multivariate statistical regression model. By controlling for the students’ prior year scores, we can better establish the net value added by the school in the current year and reduce the influence of performance based simply on the child’s ability level relative to others at the beginning of the year. Adjusting for child characteristics further isolates the contribution to learning offered by the school. This is the method we used.
We constructed school performance measures by calculat-ing school-level effects on 2005–2006 test scores after adjusting for

Evaluation of the Reform’s School Finance System 43
2004–2005 test performance and available child characteristics through a student-level multiple regression. The measures were constructed in separate regressions for each school level: primary, preparatory, and sec-ondary. Since the complexes had students in each of these levels, their students appear in all three separate analyses.
The data on test scores come from the QCEA, 7 and the data for the covariates come from the parent survey responses in the QNEDS. The student characteristics accounted for in our statistical model include the student’s gender, Qatari citizenship, age in months, grade level, mother’s and father’s education, parental involvement with the school and with homework, number of hours spent on homework, Arabic lan-guage primacy in the home, living in Doha, and having special needs.
After estimating this model,8 we saved the adjusted school per-formance measures. We then compared the schools ranked in the top
7 The QCEA is a paper-and-pencil assessment battery that consists of multiple-choice and constructed-response questions, based on Qatar’s curriculum standards in mathematics, sci-ence, Arabic, and English. For a more detailed description see Brewer et al. (2007).8 The statistical model can be written as follows:
y y X LOSSist it ist st ist ist= + + + +−ρ β α γ ε1
where yist is the achievement of child i in school s at time t, yit–1 is the achievement of child i in the prior period t – 1 (independent of school s, as we allow for the possibility that a pupil changed schools), and X is the vector child-level characteristics listed above. The parameter ρ represents the relationship between current and prior achievement. The vector of parameters β represents the relationships between student achievement and each of the variables con-tained in X. The parameters αst , which differ for each school, represent the deviation from average achievement for each school, after adjusting for all the other factors in the model. Thus, these estimates serve as our school performance measures. If a large and representa-tive proportion of students switched schools from the prior year, a somewhat stronger model might be one that controlled for student fixed effects in estimating the school fixed effects, but given data limitations, this is not feasible except in the few grades that represent a transi-tion, say from elementary to preparatory school. The present model was chosen in the interest of providing a uniform measure that could pool data across grades for a given school level.
In addition, we included an indicator for a student’s having the lowest obtainable scale score (LOSS), because the tests contained strong floor effects largely because a number of children appeared not to have answered any questions, thus introducing measurement error. Inclusion of the LOSS indicator variable seemed the most parsimonious correction for the measure-ment problems.

44 Developing a School Finance System for K–12 Reform in Qatar
half of the distribution of adjusted ranks to those ranked in the bottom half to see if there was a difference in per-pupil expenditures and pupil-teacher ratio. Table 3.1 shows these differences for the four types of tests and three types of levels.
From the table, we see that the primary schools scoring in the top half in Arabic, English, and mathematics spent more on these tests per pupil, on average, than those in the bottom half. The difference is sta-tistically significant, even with the small number of schools in the anal-ysis. There are some nonsignificant differences in spending at the pre-paratory and secondary levels, so these results provide little guidance in determining adequate resource use at these levels. Similar results are seen for the pupil-teacher ratios, where better test results for the Arabic and English exams in primary schools are associated with smaller class sizes. Again, the difference was statistically significant even with the small number of schools. It is worth noting that the average pupil-teacher ratio for schools in the top half is consistently better than the average parent-teacher ratio for schools in the bottom half for every test at every level but one (preparatory English), although the difference is not always statistically significant. The above analyses should be inter-preted as merely suggestive, given the limited number of schools in the system. In addition, it is important to note that the school performance measures we have created are not exact measures of “true” school qual-ity but instead are approximations. Our controls for student body char-acteristics may not adequately address possible selection bias resulting from differences in the particular types of students in different schools. Therefore, our results should be interpreted with caution.
However, our analysis suggests that spending slightly more than QR 15,000 per pupil in primary schools (at 2005–2006 prices) might produce relatively high performance levels in Arabic, English, and mathematics. Given that per-pupil revenue allocations at the primary school level are currently set at QR 16,000, they may be adequate to produce educational excellence, and it is possible that low-spending schools should be encouraged to spend more. However, this is a very preliminary observation based on fewer than 20 schools. Furthermore, determining a desired—or “excellent” level of adjusted school perfor-mance has yet to be established. This is outside the scope of our study

Evaluation of the Reform’s School Finance System 45
Table 3.1Resource Use in Independent Schools Ranked in the Top and Bottom Halves of the School Performance Distribution, 2005–2006
Test Type School Type No. of
SchoolsPer-Pupil
ExpenditurePupil-Teacher
Ratio
Arabic Top primary 8 (2) 14968.4a 11.5a
Bottom primary 10 13555.6 14.1
Top preparatory 4 (1) 16087.5 13.3
Bottom preparatory 4 (1) 16373.4 14.2
Top secondary 1 (2) 18100.3 10.2
Bottom secondary 3 25147.1b 11.5
English Top primary 8 (2) 14856.0a 11.7a
Bottom primary 10 13645.5 14.0
Top preparatory 3 (2) 16393.9 14.3
Bottom preparatory 5 16132.4 13.4
Top secondary 1 (2) 18100.3 10.2
Bottom secondary 3 25147.1b 11.5
Math Top primary 8 (2) 14999.6a 12.0
Bottom primary 10 13530.6 13.8
Top preparatory 3 (2) 17253.2 13.7
Bottom preparatory 5 15616.8 13.8
Top secondary 1 (2) 18100.3 10.2
Bottom secondary 3 25147.1b 11.5
Science Top primary 8 (2) 14174.6 13.0
Bottom primary 10 14194.5 13.2
Top preparatory 3 (2) 16548.3 13.3
Bottom preparatory 5 15700.6 14.6
Top secondary 1 (2) 18641.8 10.2
Bottom secondary 3 24918.5b 12.5
NOTES: The top/bottom rankings were created using the adjusted school performance measure including the two complexes. “No. of Schools” is the number of schools used in calculating the average per-pupil expenditure and does not include the two complexes, because their financial information was not broken out by level; the number of complexes is indicated in parentheses. a Indicates a significant difference between the top and bottom halves at the 10 percent level.b Note that the per-pupil expenditure numbers for secondary schools in the bottom half of the distribution include a vocational school with a technology-intensive curriculum, which has significantly higher per-pupil expenditure as a result of its curriculum focus. Excluding this school gives per-pupil expenditure values for these schools of QR 19,787 for the Arabic, English, and math test and QR 19,444 for the science test. Pupil-teacher ratio numbers change only slightly.

46 Developing a School Finance System for K–12 Reform in Qatar
and would require the establishment of national proficiency targets based on these particular performance measures.9
To explore the relationship between resources and achievement further, we estimated the same regression model treating school effects as random and dependent on funding and pupil-teacher ratios. As our variables of interest were at the group (school) level, a school fixed-effects specification is not helpful. We find that both higher per-pupil expenditures and lower pupil-teacher ratios are significantly related to higher achievement on test scores. This result holds for nearly all of the exams (Arabic, English, math, and science), and across all school levels (primary, preparatory, and secondary). As an example, our esti-mates indicate that for an additional $100 spent per pupil per year on primary school education, one can expect to see an increase in Arabic test scores of one point. Because the average year-to-year increase in primary school is 17 points, an additional point represents a significant increase of more than 5 percent of the average annual increase on test scores. Similarly, an increase of one pupil per teacher is associated with a reduction in average test scores by one point.
The majority of top-performing schools are Generation I schools in their second year of operation (more than two-thirds of Generation I schools are top half performers in the three tests of statistical signifi-cance [Arabic, English, and math]). Since we found that schools tend to spend more of their budget in their second year, it may be that as they become more familiar with the new environment, development over time may contribute to the positive relationship between spending and performance.
The findings regarding adequate funding levels are not definitive. Rather, we have illustrated a methodology for determining school per-formance and tracking the spending levels of high-performing schools. This methodology will yield more conclusive findings as the number of schools grows, thus increasing the power of statistical analyses to detect significant relationships. The same methodology can be used to determine target levels for the use of other resources in schools as well
9 Student-level performance standards were developed by the Evaluation Institute in Feb-ruary 2006. However, school-level performance standards have not been established.

Evaluation of the Reform’s School Finance System 47
as overall per-pupil spending. For example, pupil-teacher ratios and the percentage of teachers with different characteristics (such as par-ticular nationalities and education or experience levels) can be exam-ined in the same manner once school performance measures have been constructed. In addition, multiple regression techniques can be used to determine the relationship of particular resources to school perfor-mance after adjusting for the use of other types of resources. It may be that some resources are more effective than others in improving learning. In the future, such analyses could serve as a guide in deciding where to shift resources within schools.
Efficiency
An assessment of efficiency is based on a determination of the appropri-ate trade-off between school performance and the costs of producing it. This determination is difficult, because the number of schools that are performing at high levels is currently small. Therefore, we suggest methods to associate effectiveness with levels of spending to character-ize relative operational efficiency in the schools.
We can think of economic efficiency as a ratio of benefits to costs. In theory, a school would be deemed most efficient by finding the point at which the added benefit of spending an extra unit of fund-ing is smaller than the added cost. If adding more funding produces a marginally lower amount of gain, then it would not be efficient to spend more. However, efficiency is a difficult concept to operationalize. Often, efficiency is approached more heuristically by first establishing a desired target level of performance and then determining the mini-mum amount of funding that would produce this level. The first step is to determine school performance levels using methods that adjust for student characteristics in a way similar to that outlined in the previous section. The next step is to determine the level of school performance that is considered proficient. The third step is to select a set of schools that meet the standards for proficiency and examine their resource use. If enough schools can be identified as high-performing, it would be possible to compare expenditures across these schools and eliminate the

48 Developing a School Finance System for K–12 Reform in Qatar
high-spending schools from the calculation of average expenditures, because they are less efficient than high-performing, lower-spending schools. The resulting average expenditure estimate may then be con-sidered efficient.
These comparisons are tied into the notion of productivity. Two otherwise equivalent schools might require different levels of funding to get the same test scores if one school is more productive than the other. The more-productive school achieves the same level of perfor-mance but at a lower cost. By examining school resource use in the manner suggested, better educational technologies can be identified and promulgated throughout the system.
With so few Independent schools at each level in our data, it is difficult to implement this methodology or draw conclusions regarding efficiency. With more subsequent conversions to Independent school status and with the establishment of national norms regarding adjusted standards for school performance, it will be possible to compare resource use across a larger number of high-performing schools and determine which schools are more efficient. It is also advisable to conduct case studies and possibly surveys of staff in high-performing schools to uncover the practices that make them successful. This approach can be particularly helpful in distinguishing schools that achieve high perfor-mance efficiently from those that do so inefficiently.
Accountability
A key element of the Education for a New Era reform in Qatar is that Independent schools are held accountable to the community for fiscal responsibility and student learning. Thus far, accountability for the proper use of funds has been based primarily on these two mechanisms: fiscal monitoring and school choice. The first involves oversight by the Finance Office. The second involves parents’ selecting the schools that their children attend—essentially “voting by one’s feet” and signaling, to some degree, their satisfaction with the schools.
The Finance Office holds schools fiscally accountable through a monitoring process that tracks school expenditures and operator’s

Evaluation of the Reform’s School Finance System 49
resource allocation decisions. It does so through three methods: external audits, the set-up of an internal monitoring system at each school, and the creation of guidelines and requirements to which schools should or must adhere. External audits have been used since the beginning of the reform.10 Second, schools must devise an internal monitoring system as part of their overall management strategy. This includes devising a set of policies and procedures regarding financial matters, a budget devel-opment calendar, a computer-based accounting system, a system for payroll services, and banking arrangements. Third, the Finance Office has developed a set of mandatory budget guidelines covering surpluses, financial operations, and salary floors for Qatari staff. Schools submit a number of reports throughout the year directly to the Finance Office so that it can assess compliance with these guidelines and work with schools to ensure that they are in compliance with the above reporting requirements. 11 The guidelines in effect in 2004–2005 and 2005–2006 were as follows:
Operators should allocate about 60 percent of the overall budget 1. for instructional staff salaries and expenses.Schools are encouraged to allocate not more than 17 percent of 2. their budget to administration expenses.Schools can move up to 10 percent of the budget amount from 3. any line item to another. Any movement between line items beyond the above limits needs to be approved by the Finance Office.Operators may not charge tuition for students entitled to gov-4. ernment per-pupil funding.
10 Auditing firms KPMG and Deloitte & Touche reported on the financial operations of the Generation I and II schools in 2004–2005 and 2005–2006. 11 These reports include the following: before the school year starts (1) projected annual budget and (2) three-year budget projection; throughout the school year (1) September 1—annual projected cash flow and (2) quarterly—actual cash flow, staffing report, and enrollment report; each month, adjusted cash flow; beginning of June, projected operational budget for the next year; end of school year (1) independent fiscal audit report statement of functional expenses and (2) annual report.

50 Developing a School Finance System for K–12 Reform in Qatar
We found that the majority of schools adhered to guidelines (1) and (2), with expenditures on instructional staff at 64 percent of the overall budget and expenditures on administrative staff expenditures at 19 percent of the overall budget on average, in the 2005–2006 school year.12 We did not have information of sufficient detail to assess adher-ence to guidelines (3) and (4).
In addition to providing the above guidelines, the Finance Office has taken action with regard to budgetary surpluses and operator compensation. In 2004–2005, the Finance Office recommended that “During the initial years of opening, reinvestments into the schools is the preferred use of any surplus funds; however, operator annual benefits (including stipends and other compensation) should not exceed 10% of the revenue” (Education Institute, 2004, p. 17). Operators could no longer turn all surplus funds into personal compensation. Further restrictions on surpluses were to follow. In March 2006, the Executive Committee decided that the surpluses of schools’ budgets would be placed in a special account overseen by Shared Services. Funds were available on request from this account for school-related expenses, sub-ject to approval by the Education Institute. Thus, the SEC exercised its fiscal monitoring capacity by imposing restrictions on the use of funds and placing surpluses in a holding account. Although anectodal evidence suggested that parents and other stakeholders were concerned about profit-taking on the part of operators, we found no evidence that operators received any portion of profits in 2004–2005, however, and thus we assume that the restrictions were preemptive rather than neces-sary to curb abuses manifest at the time (Supreme Education Council, 2006a).
We found one additional fiscal guideline in the form of salary floors for Qatari staff. The Education Institute established minimum salaries for Independent school staff members on the basis of educa-tional level and prior service in the Ministry of Education. Staffing
12 Only four out of 33 Generation I and II schools allocated less than 60 percent of their overall budget to instructional staff, one of which was a vocational school with a technology-intensive curriculum. Only seven out of 33 schools allocated less than 17 percent of their overall budget to administrative staff costs.

Evaluation of the Reform’s School Finance System 51
reports provide monthly salary amounts and staff members’ nation-ality, but the reports do not note the staff members’ education level to allow for monitoring a school’s compliance with this requirement. Therefore, we were unable to check whether the prescribed minimum salary levels had been respected by the schools. It was also unclear whether the Finance Office could monitor these levels without relying on individuals to report departures from the minimum levels.
In addition to the above fiscal oversight activities, a measure of accountability was built into the system in the form of school choice, and this was intended to be a key new element of the reform. In theory, parents can contribute to holding schools accountable for meeting their children’s educational needs by choosing the schools to which they send their children. Schools that fail to attract parents and students will not survive in the educational marketplace. Schools that survive, on the other hand, will be those whose academic and extracurricular offerings have sufficiently captured the interest of parents and students. Parents can use assessment results and other information disseminated to the public to understand how well schools perform relative to each other and make informed choices regarding where their children will attend school.
Currently, the Evaluation Institute disseminates school report cards to inform parents of the academic performance and features of every Independent, Ministry, and private Arabic school in Qatar. How-ever, the choice mechanism is fairly weak. All Independent schools to date have been converted from Ministry schools. Many Indepen-dent schools are oversubscribed, and preference is given to students who attended the school before conversion and to students within the school’s catchment area (Supreme Education Council, 2007a). In addi-tion, space in the Independent schools is further constrained by limited facilities and requirements to limit class sizes to 25 students. These fac-tors may result in a lack of incentive for Independent schools to achieve higher performance levels to attract enrollments. However, the fact that many Independent schools have waiting lists may encourage Min-istry schools to raise their standards. One argument in favor of choice is that competition may result in positive spillover effects on conven-tional schools. We have no information on the incentive structures for

52 Developing a School Finance System for K–12 Reform in Qatar
Ministry schools, however, and cannot assess whether spillover effects have occurred.
It can be seen from this discussion that the finance system relied primarily on spending restrictions. These restrictions appear to have been effective in achieving desired ratios for instructional and adminis-trative expenditures. In addition, potential profit-taking among school operators appears to have been prevented. However, reducing access to surpluses may curb the flexibility of operators to make investments in high-quality education. It is unclear whether the accountability pro-visions established through the finance system have had a positive, negative, or neutral effect on school quality. In addition, the choice mechanism—one of the principles underlying the reform—has been relatively weak because of capacity constraints and is unlikely to have provided strong incentive to raise quality.
Stability/Responsiveness
Compared with the traditional Ministry system, principal-operators of Independent schools have been afforded a great deal of autonomy in staff selection, pedagogical practice, and resource allocation. To make long-term investments in high-quality staffing, curricula, and facilities, however, a reliable flow of funding is needed. Furthermore, by provid-ing sustained support to school operators, the reform’s leaders promote a sense of trust in the system among operators.
In addition to fostering a sense of predictability, however, a sound finance system must also be flexible to address changing needs or goals within the system or problems as they arise. It is therefore necessary to conduct ongoing needs assessments to ascertain whether changes in funding policies are necessary. For example, analyses can be under-taken to determine whether cost-of-living changes warrant adjustments to staff salaries or whether technology infrastructure improvements warrant adjustments to per-pupil allotments.
In short, the finance system must strike a helpful balance between stability and responsiveness. Stability refers to a predictable operating environment that allows school operators to establish both long- and

Evaluation of the Reform’s School Finance System 53
short-term strategies for improving their schools, and responsiveness indicates an ability of the governing body to intervene and fine-tune the reform.
We found that in the early years of the school finance system supporting the K–12 reform in Qatar, the balance between stability and responsiveness tilted heavily toward the latter. Changes to finance-related policies were frequently instituted as financial and administra-tive information on the Independent schools flowed in, and measures were taken to address perceived problems in the system.
The existence of substantial surpluses and the desire to promote Qatari nationals in leadership positions formed the impetus for fund-ing cutbacks and changes in regulations guiding the reform. These changes took the form of added restrictions on surplus accumulation and operator compensation (described in the previous section), the elimination of grants as an added source of funding, and a change in the legal status and leadership requirements for the schools, including requirements that operators be Qatari nationals and serve as principals of the schools.
To promote a variety of schooling options for students, the original reform design allowed any individuals or groups from the community to apply for the position of school operator, subject to the approval of the SEC. For example, a group of parents could unite to start an Indepen-dent school or Qatar Petroleum could open a school that emphasized science and mathematics to provide a potential source of future talent for the company. As mentioned above, the first Independent schools were privately incorporated as LLCs. At least two people are needed to form an LLC in Qatar, and one must be Qatari. Therefore, teams of operators formed. By virtue of their status as LLCs, schools became for-profit entities. As of March 2006, however, regulations regarding operators and legal entities changed: Independent schools must now be nonprofits and an operator must now be a Qatari national and also be the school’s principal (Supreme Education Council, 2006b).
In addition to these policy shifts, the SEC made policy decisions affecting resource use in Independent schools. In May 2005, the SEC set minimum salaries for Qatari educators (Supreme Education Coun-cil, 2005), and in October 2005, the SEC specified that the use of sur-

54 Developing a School Finance System for K–12 Reform in Qatar
plus funds be directed toward meeting Qatarization goals (Education Institute, 2005). Before this—in the first year of operation of Gen-eration I Independent schools—operators had the freedom to recruit teachers from whichever countries they wanted to fulfill teaching and staffing needs, provided they adjusted their budget accordingly and took into consideration their per-pupil-allotment funding. For exam-ple, five of the 12 Independent schools opened in 2004 used English as the language of instruction and wanted to therefore rely on teachers whose native language was English. It was expected that these teachers would be more expensive because of their language abilities.
After the first year of Independent school operation, however, the Qatarization policy described in the introduction to this mono-graph was put in place to promote the hiring of Qatari nationals in schools. The policy set quotas for the employment of Qataris within each school. The quotas differed by level and type of school in recogni-tion of the different balances of Qataris and expatriate teachers needed for boys and girls at different ages and ranged from 20 percent in boys’ secondary schools to 70 percent in girls’ secondary schools (Supreme Education Council, 2005). The Qatarization requirements are illus-trated in Table 3.2.
In addition to the establishment of Qatarization goals, a 40 per-cent increase in the base salary of Qatari nationals in the Civil Service was instituted in September 2007 in response to nationwide increases in the cost of living, driven largely by increases in the price of real estate. Many Qatari teachers in Independent schools were classified as Civil Service employees.13 To furnish the funds for the mandated salary
13 Full-time Qatari employees “seconded” (i.e., transferred) from any Ministry in Qatar remain part of the Qatar Civil Service Cadre and therefore are entitled to a basic salary not less than the basic salary they were entitled to before. In addition to the basic monthly sala-ries for Qatari employees who remain part of the Civil Service Cadre, from 2004–2006 they were entitled to the same allowances as employees holding similar posts on the Civil Service Cadre (Education Institute, 2004). As of 2006–2007, the Education Institute also listed specific amounts for allowances that schools must pay their Qatari staff, whether directly hired or seconded. This list included a social allowance for single and for married employees, a housing allowance to married employees, and a transportation allowance (Supreme Educa-tion Council, 2007c).
Evaluation of the Reform’s School Finance System 55
Table 3.2Qatarization Requirements in Independent Schools
School TypePercentage of Qatari Staff
Girls
Primary 70
Preparatory 60
Secondary 60
Boys
Primary model 70
Primary 30
Preparatory 25
Secondary 20
SOURCE: Supreme Education Council (2005).
increases, the SEC increased per-pupil allotments by QR 2,000 for all primary schools and by QR 1,000 for preparatory girls’ and secondary girls’ schools, beginning in 2007–2008 (Supreme Education Council, 2007d). These increases are meant to “encourage more Qatari involve-ment in the reform initiative” and “ensure that Qatari staff in indepen-dent schools enjoy the same living standards as their partners in other official sectors” (Supreme Education Council, 2007b). These changes, in addition to the elimination of grants in 2005–2006 and the elimi-nation of start-up funds for new schools in 2007–2008 (described above) represent important modifications to revenue policies. To ana-lyze the effect of meeting Qatarization requirements and mandated salary increases, we built a forecasting tool that modeled changes in the system and translated them into projected expenditure estimates for the reform as a whole and for specific sectors within the reform (Armstrong, 2001). The forecasting tool and the projected implications of the policy changes are discussed in detail in the next chapter.

56 Developing a School Finance System for K–12 Reform in Qatar
Most of the changes to the system that we have described above have represented early adjustments as information on school finance became available for the first time. As a result of the many changes, however, operators and principals may have lacked the stability needed to plan effectively for long-term investments in the educational pro-cess. Also, some of the policy changes implemented ran counter to the reform principals of autonomy, accountability, variety, and choice. It remains to be seen whether stability in the reform’s finance system will grow over time and allow school leaders to gain familiarity with the structure and plan effectively.
Summary/Conclusions
We evaluated the progress of the funding system as of the end of the 2005–2006 school year against six objectives that characterize a highly functioning school finance system: transparency, equity, adequacy, efficiency, accountability, and stability/responsiveness. Despite the fact that we identify several areas for improvement, the system was new at the time of our evaluation and achieved a noteworthy degree of success in supporting a growing reform through its early stages. Our evalua-tion can be summarized as follows:
Transparency. Although the finance system improved in its trans-parency over the two years under consideration in this mono-graph, a number of issues pertaining to the quality and acces-sibility of data need further attention. The data-reporting system in place during the period covered by this evaluation is currently being replaced by a new management information system, which, it is hoped, will address the following issues:
Data were often incomplete and lacking in comparability across –entities and time periods. Data were often difficult to access and did not always contain –the amount of detail necessary for a complete analysis. Many data were not available electronically and had to be manually entered into electronic spreadsheets that could then be ana-

Evaluation of the Reform’s School Finance System 57
lyzed. Some data did not contain standardized categories, which would have greatly facilitated accurate analysis.
Equity. We compared per-pupil expenditures in girls’ and boys’ schools.
Girls’ and boys’ schools did not differ substantially in per-pupil –spending in the small number of schools in the analysis sample. However, the apparent parity masked underlying differences in the salary structures in the two types of schools, which reflect inequities in the Qatari labor market. Male teachers earned more than female teachers, and Qatari teachers earned more than non-Qatari teachers. Boys’ schools employed greater pro-portions of male teachers but smaller proportions of Qatari teachers than girls’ schools did. Thus, spending on different groups of teachers in boys’ and girls’ schools tended to offset the differences, and overall parity was apparently achieved through the staffing mix.
Adequacy. We approached the question of determining adequacy in funding levels by developing a “successful schools” method and applying it to the limited data currently available in the system. We developed measures of school performance that adjusted for the prior performance and demographic characteristics of stu-dents and found the following:
Our analyses suggest that a positive relationship exists between –higher per-pupil spending and primary school performance on standardized tests in Arabic, English, and mathematics and between fewer pupils per teacher and primary school perfor-mance on standardized tests in Arabic and English. Results are preliminary, however, because of the small number of schools currently in the system and must be interpreted as merely sug-gestive. Expansion of the reform in future years will support more powerful analyses that should be able to detect relation-ships between test score outcomes and resource use and to sug-gest target levels for funding and other resources. Ultimately, the successful schools method relies on the exis- –tence of defined levels of student proficiency. Such perfor-mance standards have not yet been established in Qatar. If the

58 Developing a School Finance System for K–12 Reform in Qatar
higher-performing schools are operating at the desired level of excellence, our analysis suggests that current funding levels may be adequate at the primary school level. If they are not, then spending in these schools might be insufficient and per-pupil allocations may be inadequate. Thus, in the absence of clear performance goals, even the successful schools method is limited in its ability to capture a notion of funding adequate to support excellence in education.
Efficiency. We currently lack the data necessary to assess the effi-ciency of the system. More Independent schools are needed at each level and several must be high-performing schools before solid conclusions may be drawn.Accountability. We attempted to evaluate the finance system’s use of two types of accountability mechanisms: fiscal oversight and parental choice.
Accountability was exercised in the form of fiscal monitoring. –This was particularly evident in the number and type of restric-tions placed on the use of surpluses. Fiscal requirements were, by and large, adhered to by all schools. Parental choice was only partially operating in the 2004–2005 –and 2005-2006 years and does not appear to have provided incentive for schools to raise performance levels.
Stability/responsiveness. We evaluated the system’s responsiveness in enacting changes against whether it provided enough financial stability to allow for planning and investment.
The system introduced several changes to regulations govern- –ing the financing of the Independent schools between 2004 and 2006.It was particularly responsive to evidence that surplus funds –had accumulated by introducing funding cutbacks and restric-tions on the use of funds.However, as a result of the many changes, in our view, opera- –tors and principals may have lacked the stability needed to plan effectively for investments in the educational process.

59
CHAPTER FOUR
Tool to Forecast Spending on the Reform
To provide a useful tool to further the SEC’s ability to monitor and modify financial flows to the reform, we built a causal forecasting model to project future expenditures on Independent schools and over-all reform under different scenarios. Education planning efforts have long relied on forecasting tools, dating back to the late 18th and early 19th centuries (Coombs, 1970).
Generally, forecasting models may be categorized across three dimensions: (1) the type of process to be modeled (judgmental or sta-tistical), (2) the type of information sources available (single- or mul-tisource, uni- or multivariate), and (3) the role that theory or actors play in the forecasting model, if any (Armstrong, 2001). As such, there is a broad range of analytic techniques classified generally as forecast-ing models.1 For the phenomenon we are trying to forecast (expen-ditures on Qatar’s education reform), the modeling environment has sufficient objective data to create a mathematical model, good knowl-edge of relationships between the dependent and independent variables (how expenditures are driven ultimately by the number of pupils or the number of schools), and information on potentially large changes in portions of the current system. These conditions led us to adopt what is
1 Methods include the Delphi method or prediction markets, judgmental bootstrapping, conjoint analysis, intentions or expectations of decisionmakers, role-playing, structured analogies, quantitative analogies, expert systems, rule-based forecasting, extrapolation or data mining, and causal models. Each of these types of forecasting methods has a large, well-developed literature associated with it. See Armstrong (2001) for explanations of these types of methods.

60 Developing a School Finance System for K–12 Reform in Qatar
generally termed a “causal model” with elements of an “extrapolation model.”
Causal models relate a dependent variable to various causal vari-ables based on a specified theory, prior research, or expert domain knowledge (Armstrong, 2001). Here we use the given relationship between the amount of funding schools receive and the number of students at each level. In the previous chapters, we saw that primary, preparatory, and secondary school per-pupil allocations are specified by policy. Thus, using reasonable assumptions for growth in the number of schools and the number of students, we can forecast total expendi-tures on per-pupil allotments.
Extrapolation models assume that past behavior is a good predic-tor of future behavior (Armstrong, 2001). However, they assume that nothing is relevant other than prior values. Accordingly, we combine the projection principle in extrapolation models with the allowance for change in causal models. In our model, we know the principal expen-diture drivers (pupils) but make assumptions regarding growth rates of pupils. Although the number of pupils grows as a causal forecast, costs per pupil differ with the policy levers of Qatarization and wage increases. We decompose the model into constituent types of expendi-ture, including per-pupil allocations, start-up costs, grants, and differ-ences in Independent schools and various institutions and assets. We explicitly model fixed and variable costs. We model five alternatives to explore differences in cost for various policy choices of Qatarization and wages. As with all forecasting models, there is no way to describe future states with complete certainty. Still, this model provides policy-makers with useful insights in formulating policy around the reform.
We wish to emphasize that our aim is not to provide accurate fore-casts of expenditures on the Independent school system or the reform as a whole. Rather, we present a tool that can be used to forecast expen-ditures and model the effect of policy changes. The model provided in this chapter includes our rough understanding of proposed and already implemented policy, but clearly its assumptions need to be refined. For example, accurate forecasting must include an assessment of the effect of particular policies, including the likelihood that proposed policy will successfully be implemented. Such refined analyses can be con-

Tool to Forecast Spending on the Reform 61
ducted using the data available to decisionmakers and policymakers at the SEC, which will make it unnecessary to rely on the strong assump-tions made here.
This model is constructed for Qatar’s K–12 reform, and many ele-ments are specific to the country and to the nature of its reform. Nev-ertheless the methodology can be employed more generally in envi-ronments where objective data and good knowledge of relationships between the dependent and independent variables exists. In particular, the forecasting tool is useful in contexts where there is a rapid transfor-mation of the education system from one type of system to another.
Forecasting Tool
Our forecasting tool is composed of four parts:
The first part predicts the total expenditures on the reform, 1. based on total school operating revenues, contract costs, asset procurement costs, and institute costsThe second part predicts total costs for contracts, asset procure-2. ment, or institutes The third part predicts total school operating revenues 3. The last part predicts per-pupil allocations for each type of Inde-4. pendent school.
A set of inputs can be varied to determine the effect of various policies. The policy levers that can be manipulated at different points in time to produce different cost scenarios are the following:
number of Independent schools—i.e., the schedule for conversion from Ministry schools and any start-up Independent schoolsaverage student enrollment per school over time, by school level and school gender per-pupil allocations over time, by school level and school genderstart-up funding and grants per school over time

62 Developing a School Finance System for K–12 Reform in Qatar
growth rates in variable and fixed costs of contracts, assets, and institutesteacher-pupil ratios over time, by school level and school genderQatarization percentages over time, by teacher gender, school level, and school gender staff salaries over time, by teacher gender, teacher nationality, school level, and school gender.
In addition to these policy levers, the models incorporate assump-tions based on outside information regarding population growth rates of primary, preparatory, and secondary school populations.
The model itself consists of a set of interactive Excel spreadsheets. Once the inputs are entered, the model calculates the various types of costs. Outputs consist of both the raw numbers and charts showing the trajectory of expenditures over time. Below, we describe each part of the model and the inputs that feed into it in a series of simplified schematic diagrams. Then, we use the actual model to predict total expenditures and output charts under different scenarios.
Figure 4.1 shows a schematic representation of the major com-ponents of expenditures on the reform, as described in Chapter Two: school operating expenditures, contracts, assets, and institutes. We model each of these four components separately, given their different dynamics. We first discuss the component that models school operat-ing revenues, the largest expenditure component of the Independent school system (left-hand side of Figure 4.1).
Figure 4.2 shows in more detail the modeling of school operating revenues, consisting of per-pupil operating income, start-up funding and operating grants. The most important determinants of expendi-tures on the reform in the model are the total number of schools and the average number of students in each school, by school level and school gender. Per-pupil operating income, for example, is driven by the total number of students, by school level, multiplied by the per-pupil allot-ments (which differ by school level and school gender), whereas total start-up funding is driven by the number of schools that have recently been converted to Independent schools (number of schools added). Given that miscellaneous income is not a source of revenue provided

Tool to Forecast Spending on the Reform 63
Figure 4.1Schematic Representation of the Four Major Components of Expenditures on Independent Schools Under the Reform
RAND MG839-4.1
Expenditures on Independent schools
=
Contractcost
+ ++School operating
revenues exclusive ofmiscellaneous income
Assetprocurement
Institutes
Figure 4.2Schematic Representation of the School Operating Revenue Forecast
RAND MG839-4.2
Number of schools,by school type
Number of schools,by school type
Average number ofstudents per school,
by school type
Per-pupil allotment,by student type
Per-pupil operatingincome
Operating grants
Number of schoolsadded, by school type
Start-up funds
Average operatinggrant per school,
by school type
Average start-upcost per school,by school type
=
=
=
School operating revenues exclusiveof miscellaneous income
=
× × ×
×
by the SEC and is therefore not a cost component of the reform, it is not included in the modeling.
An added benefit to relying on the total number of schools and average number of students per school by school level and school gender as the main driver of the model is that, over time, there is a relatively high degree of certainty regarding these figures. Under the assumption that all Ministry schools will eventually convert to Independent schools over a specified time period (the anticipated date is by 2012–2013), we

64 Developing a School Finance System for K–12 Reform in Qatar
know how many schools and students likely still need to be converted. The number of conversions to be made each year remains uncertain, however, and must be assumed to predict the trajectory of expenditures over the forecast period.
An essential element of school operating revenue is the per-pupil allotment (third box in the left hand column of Figure 4.2). We fore-cast per-pupil allocations by assuming that they follow the same trend as operating expenditures per pupil.2 Figure 4.3 shows schematically how operating revenues and expenditures for each school level and school gender are modeled. The model is based primarily on staffing expenditures, the largest component of overall expenditures.
As Figure 4.3 shows, the three components of expenditures used to forecast per-pupil allocations are teacher wages, administra-tive wages, and nonwage-related expenditures. As discussed in Chapter Two, administrative and instructional wages account for about 85 per-cent of total expenditures, and administrative wages account for about 25 percent of total wage expenditures. We have used these ratios as our starting point but subsequently allow for differences in growth of each type of expenditure.
In the first year of operation of Independent schools, operators had the freedom to recruit teachers from whichever countries they wanted to fulfill their teaching and staffing needs, provided they adjusted their budget accordingly and took into consideration their per-pupil-allot-ment funding. In subsequent years, policies to promote the hiring of Qatari nationals in schools (i.e., Qatarization), and to set minimum sal-aries for Qataris, were put into place in an effort to encourage operators to hire more Qataris and to attract more Qataris to apply for teaching positions in Independent schools (Supreme Education Council, 2005). Table 3.3 shows Qatarization requirements by school level.
The potential effect of enforcing Qatarization quotas can be mod-eled by changing the mix in the nationality of teachers. The effect of wage increases, such as the impending 40 percent increase in the base
2 If they do not follow the same trend and expenditures rise faster than per-pupil alloca-tions, schools may begin to face deficits. It is likely that corrective action will be taken in such cases to ensure that per-pupil allocations track per-pupil expenditures.

Tool to Forecast Spending on the Reform 65
Figure 4.3Schematic Representation of the Per-Pupil Allocation Forecast
RAND MG839-4.3
Teachers per pupil,by school type and
school gender
Nonwage operatingexpenditures per pupil
Teacher percentages,by school type, school
gender, and nationality
Average teacher wage,by school type, school
gender, and nationality
Teacher wage operatingexpenditures per pupil
Nonwage operatingexpenditures per pupil
Administrative wageoperating expenditures
per pupil
Administrative wageoperating expenditures
per pupil
= =
Total operating expenditures per pupil
Contingency fund per pupil (surplus)
Total operating revenues per pupil
=
+
+ +
=
×
×
salaries of Qatari staff in 2006–2007, is modeled by varying teacher wages for each school type (level and gender), teacher gender, and teacher nationality.3
We sum the three components of operating expenditures and allow for a certain percentage of revenues to be set aside for contin-gency funding. We then apply the implied increase in revenues to the
3 From staffing report data on the ratio of base to total salary for Qatari teachers, we esti-mate the following increases in total salaries resulting from the 40 percent increase in base salary: boys’ model, 25.9 percent; boys’ primary, N/A; girls’ primary, 24.6 percent; boys’ preparatory, 17.6 percent; girls’ preparatory, 23.6 percent; boys’ secondary, 14.2 percent; girls’ secondary, N/A. Because salary data on both base and total salary were not available for all schools, we do not have information on the ratio of base to total salary for boys’ primary schools and for girls’ secondary schools. Using these observations, we make the simplifying assumption that female-taught schools experience a 25 percent increase in total salary costs and male-taught schools a 16 percent increase for Qatari teachers as a result of the mandated 40 percent increase in base salary.

66 Developing a School Finance System for K–12 Reform in Qatar
per-pupil allocations for each school level and school gender (boys’ versus girls’ schools) using 2005–2006 as the base year.
The output of this model—the forecast of per-pupil allocations by school level and school gender—is input to the forecasts of the aggre-gate operating income from per-pupil funding (the third box on the left hand side of Figure 4.2) and is the final piece needed to provide the forecast for school revenues (the first box on the left-hand side of Figure 4.1).
Figure 4.4 shows how the remaining three expenditure compo-nents of the reform, contracts, assets, and institutes, are modeled (the remaining three boxes to the right in Figure 4.1). As Figure 4.4 shows, costs are separated into variable costs (those costs that vary with the number of schools or the number of students) and fixed costs (those that do not). Some examples of possible fixed costs include office space rent, furniture, accounting services, and payroll services for the institutes and administrative services associated with asset procure-ment. Possible variable costs include salaries of staff at the institutes,
Figure 4.4Schematic Representation of the Cost of Contracts (C), Asset Procurement (AP), or Institutes (I) Forecasts
NOTES: The method of forecast is the same for each of these three cost components.Variable costs are costs that vary as a function of the number of schools; fixed costsdo not vary with the number of schools. Variable costs can also be expressed perstudent instead of per school.RAND MG839-4.4
Number of students
Average variable cost ofC, AP, or I per student
Total cost of C, AP, or I
Variable cost ofC, AP, or I
=
×
Fixed cost of C, AP, or I
Fixed cost of C, AP, or I
=
×
+
=

Tool to Forecast Spending on the Reform 67
equipment and material provided to Independent schools, Independent schools’ asset maintenance, and contracts for external auditing of Inde-pendent schools.
This part of the model is the least developed. Our determination of fixed and variable costs relies on very little historical information, essentially the 2004–2005 and 2005–2006 years. The model can be improved by incorporating additional data from subsequent years and carefully assessing those costs that are fixed and those that are variable. For now, the model estimates serve to illustrate the potential for fore-casting these costs, but forecasts of the costs of contracts, assets, and institutes should not be considered robust based on the information currently available.
Model Scenarios
For illustrative purposes, we use the forecasting model to predict total expenditures under five scenarios corresponding to proposed or impending policy changes. These scenarios are presented in Table 4.1. Note that scenario E represents the situation in which all policy changes that have been proposed as of the end of 2007 are implemented.
In addition to the assumptions presented for the scenarios A to E we assume the following for each of the scenarios:
population growth in line with Census forecasts of the primary, preparatory, and secondary school populationsa constant average student population per school for each school level and school gender4 discontinuation of start-up funding and grants5
no growth in the fixed and the variable costs (real QR) of con-tracts, asset procurement, and institutes
4 The assumption is that in the conversion from Ministry to Independent schools, smaller Ministry schools are merged into the larger format of Independent schools.5 We assumed that one school, a vocational school with a technology-intensive curriculum, will continue to be funded through operating grants, but that no other schools will receive operating grants in the future.

68 Develo
pin
g a Sch
oo
l Finan
ce System fo
r K–12 R
eform
in Q
atar
Table 4.1Model Scenarios
Scenario
School Conversion
by 2012–2013
40% Base Salary Increase for
Qatari Teachers in 2006–2007
Annual (Real) % Salary
Increase for Teachers
Qatarization Goals Achieved by 2015–2016 Description
A No Yes 0 NoAfter cohort IV (2007–2008) no new schools are converted.
B Yes No 0 NoPer-pupil allocations are not adjusted for the additional expenditures related to salary increases.
C Yes Yes 0 No
Per-pupil allocations are adjusted for the additional expenditures related to the 40 percent base salary increase for Qatari teachers in 2006–2007.
D Yes Yes 3 No
Per-pupil allocations are adjusted for the additional expenditures related to the 40 percent base salary increase for Qatari teachers in 2006–2007, as well as a 3 percent annual real salary increase for all teachers. Qatarization is assumed to remain constant.
E Yes Yes 3 Yes
Per-pupil allocations are adjusted for the additional expenditures related to the 40 percent base salary increase for Qatari teachers in 2006–2007, as well as a 3 percent annual real salary increase for all teachers. The Qatarization goals set are reached by 2015.
SOURCES: Finance Office; KPMG; RAND analysis.
NOTES: We do not assume that the 40 percent salary raise for Qatari staff did not occur; instead we assume here that per-pupil allocations are not adjusted to compensate schools for the additional expenses. Real wages per pupil (after correcting for an annual inflation rate of 2.4 percent reported by Qatar Central Bank) grew, on average, by 4.1 percent per year for Ministry schools between 1995 and 2005 (RAND analysis of Ministry of Education average wage information). If teachers-per-pupil ratios remained constant over the period, the 4.1 percent wages per-pupil increase is reflective of the wage increase for teachers. Conservatively, to allow for some change in the teachers-per-pupil ratio, we use 3 percent annual wage increases.

Tool to Forecast Spending on the Reform 69
constant teacher per-pupil ratios for each school level and school genderinitial total wages as 85 percent of operating expensesa ratio of administrative to instructional wages of 25 percenta constant allowance for contingency funding of 10 percentgrowth in administrative real wage expenditures of 3 percent per year growth in real nonwage operating expenditures of 3 percent per year.
All forecasts are presented in real QR based on the 2005–2006 value of the currency (i.e., we do not adjust our projections to include inflation in the value of the QR). Therefore, growth rates in the model should be interpreted as rates above inflation (real growth).
The model uses as its starting point the information reported in Chapter Two for both the 2004–2005 and 2005–2006 operating years.6 To restrict ourselves to estimating expenditures on the K–12 reform only, we excluded the Higher Education Institute by reduc-ing the 2005–2006 total amount spent on the institutes by 16 percent (this is the percentage spent on the Higher Education Institute over the period July 2005 to March 2006—the only time period for which this information was available).
Figures 4.5 through 4.9 show forecasts of expenditures on the Independent school system under the different scenarios. In any of the following forecasting scenarios, Ministry spending before the K–12 reform was announced in 2002 may serve as a useful benchmark for comparison. The Ministry reported total spending of 1.61 billion QR on K–12 education (nominal QR), which corresponds to 22,249 QR on a per-pupil basis, for the 2001–2002 school year (Ministry of Edu-cation, 2005).
6 This includes information on the costs of institutes, assets, and contracts from Finance Office data, the cost of operations of Independent schools from KPMG and Deloitte & Touche financial statements (including per-pupil funding, start-up funding and grants, but excluding miscellaneous income), and staff salaries and the number of teachers by gender and nationality for each type of school from the Finance Office (see Appendix A for more details).

70 Developing a School Finance System for K–12 Reform in Qatar
Figure 4.5Forecast of Expenditures on the Reform, Scenario A
RAND MG839-4.5
3,000
2,000
1,000
2004
–200
5
2013
–201
4
2012
–201
3
2011
–201
2
2010
–201
1
2009
–201
0
2008
–200
9
2007
–200
8
2006
–200
7
2014
–201
5
2015
–201
6
2005
–200
6
4,000
0
Exp
end
itu
res
(QR
mill
ion
s)
InstitutesAsset procurementContractsSchool operations (excludingmiscellaneous income)
Under scenario A, there is no further growth in the number of Independent schools after 2007–2008, resulting in substantially slower growth in expenditures. The increase in total expenditures after 2007–2008 is due to (i) growth of the primary, preparatory, and sec-ondary school populations in line with Census forecasts (between 0 percent and 2 percent per year), (ii) growth in administrative real wage expenditures of 3 percent per year, and (iii) growth in real nonwage operating expenditures of 3 percent per year.
Under scenario B, per-pupil allocations are not adjusted for the additional expenditures related to salary increases, i.e., they remain constant (in real QR). Growth in expenditures is primarily due to growth in the number of students and schools as the conversion of Ministry schools to Independent schools is continued. Conversion is completed by 2012–2013, after which growth is due to the same four factors as in scenario A after 2007–2008.
Under scenario C, per-pupil allocations are adjusted for the addi-tional expenditures related to the 40 percent base salary increase in

Tool to Forecast Spending on the Reform 71
Figure 4.6Forecast of Expenditures on the Reform, Scenario B
RAND MG839-4.6
3,000
2,000
1,000
2004
–200
5
2013
–201
4
2012
–201
3
2011
–201
2
2010
–201
1
2009
–201
0
2008
–200
9
2007
–200
8
2006
–200
7
2014
–201
5
2015
–201
6
2005
–200
6
4,000
0
Exp
end
itu
res
(QR
mill
ion
s)
InstitutesAsset procurementContractsSchool operations (excludingmiscellaneous income)
2006–2007 for Qatari personnel. As in scenario B, growth in expendi-tures is primarily due to growth in the number of students and schools as the conversion of Ministry schools to Independent schools is con-tinued. But, total expenditures are about 10 percent higher because of the 40 percent base salary increase in 2006–2007 for Qatari personnel. Conversion is completed by 2012–2013, after which growth is due to the same four factors as in scenario A after 2007–2008.
Under scenario D, per-pupil allocations are adjusted for the addi-tional expenditures related to the 40 percent base salary increase in 2006–2007 for Qatari personnel, as well as a 3 percent annual real salary increase7 for all personnel. As in scenarios B and C, growth in expenditures is primarily due to growth in the number of students and schools as the conversion of Ministry schools to Independent schools is continued. But, total expenditures are about 12 percent higher than
7 Real wages (corrected for inflation) grew on average by 4.1 percent for Ministry schools between 1995 and 2005.

72 Developing a School Finance System for K–12 Reform in Qatar
Figure 4.7Forecast of Expenditures on the Reform, Scenario C
RAND MG839-4.7
3,000
2,000
1,000
2004
–200
5
2013
–201
4
2012
–201
3
2011
–201
2
2010
–201
1
2009
–201
0
2008
–200
9
2007
–200
8
2006
–200
7
2014
–201
5
2015
–201
6
2005
–200
6
4,000
0
Exp
end
itu
res
(QR
mill
ion
s)
InstitutesAsset procurementContractsSchool operations (excludingmiscellaneous income)
in scenario C because of the additional 3 percent average annual salary increase for all personnel. Conversion is completed by 2012–2013, after which growth is due to the same four factors as in scenario A after 2007–2008.
Under scenario E, per-pupil allocations are adjusted for the addi-tional expenditures related to the 40 percent base salary increase in 2006–2007 for Qatari personnel, as well as a 3 percent annual real salary increase for all personnel. As in scenarios B, C, and D, growth in expenditures is primarily due to growth in the number of students and schools as the conversion of Ministry schools to Independent schools is continued. But, total expenditures are about 5 percent higher than in scenario D as the Qatarization goals are fully achieved by 2015. Con-version is completed by 2012–2013, after which growth is due to the same four factors as in scenario A after 2007–2008.

Tool to Forecast Spending on the Reform 73
Figure 4.8Forecast of Expenditures on the Reform, Scenario D
RAND MG839-4.8
3,000
2,000
1,000
2004
–200
5
2013
–201
4
2012
–201
3
2011
–201
2
2010
–201
1
2009
–201
0
2008
–200
9
2007
–200
8
2006
–200
7
2014
–201
5
2015
–201
6
2005
–200
6
4,000
0
Exp
end
itu
res
(QR
mill
ion
s)
InstitutesAsset procurementContractsSchool operations (excludingmiscellaneous income)
Per-Pupil Allocations
Figure 4.10 provides a brief summary of the forecasted per-pupil allo-cations (again in real QR) for scenarios A through E for the year 2015–2016. Scenario B functions as a reference to 2005–2006; in scenario B, per-pupil allocations remain constant (in real terms) and hence remain at their 2005–2006 level. Scenarios A and C are equiv-alent in their per-pupil allocations; the main difference between the two scenarios is the number of students and schools in the Indepen-dent schools system. Given that per-pupil allocations are on a per-pupil basis, the forecasted per-pupil allocations are exactly the same. The growth in per-pupil allocations is due to (i) the 40 percent base salary increase in 2006–2007 for Qatari personnel, (ii) growth in adminis-trative real wage expenditures of 3 percent per year, and (iii) growth in real nonwage operating expenditures of 3 percent per year. Moving

74 Developing a School Finance System for K–12 Reform in Qatar
Figure 4.9Forecast of Expenditures on the Reform, Scenario E
RAND MG839-4.9
3,000
2,000
1,000
2004
–200
5
2013
–201
4
2012
–201
3
2011
–201
2
2010
–201
1
2009
–201
0
2008
–200
9
2007
–200
8
2006
–200
7
2014
–201
5
2015
–201
6
2005
–200
6
4,000
0
Exp
end
itu
res
(QR
mill
ion
s)
InstitutesAsset procurementContractsSchool operations (excludingmiscellaneous income)
from scenario C to D to E, the per-pupil allocations increase as a result of accounting for a 3 percent real salary increase per year for all person-nel (C to D) and increases resulting from Qatarization (D to E).
Figures 4.11–4.13 show the relative effect on school expendi-tures of the 40 percent base salary increase for Qatari personnel in 2006–2007 as well as the effect of reaching the Qatarization goals.8 Female-taught schools have higher percentages of Qatari nation-als than do male-taught schools and are thus affected more by this salary increase. As Figure 4.11 shows, female-taught schools can expect between 5 percent and 8 percent increases in operating expenditures as
8 The figure is obtained by comparing the per-pupil allocations in model E and those in model D with the results of a model that does not incorporate the 40 percent salary increase for Qatari personnel in 2006–2007 and keeps the percentage of Qatari teachers fixed. Although we have used the model to obtain these figures, the results apply more generally, as we kept constant all variables other than wages and the degree of Qatarization. The results, thus, effectively assume only a 40 percent salary increase for Qatari personnel and that Qata-rization is fully achieved.

Tool to Forecast Spending on the Reform 75
Figure 4.10Forecast of Per-Pupil Allocations Under Scenarios A through E, by School Type
RAND MG839-4.10
30
25
School type
20
15
10
5
K + p
rimar
y
boys’ m
odel
K + p
rimar
y
girls
Prep
arat
ory
girls
Prep
arat
ory
boys
Seco
ndary
girls
Seco
ndary
boys
K + p
rimar
y
boys
40
0
Res
ou
rce
allo
cati
on
s (Q
R t
ho
usa
nd
s) 35 A B C D E
a result of the 40 percent base salary increase for Qatari personnel in 2006–2007. This compares with between 0 percent and 1.5 percent for male-taught schools.
The per-pupil allotments were increased in 2007–2008 to QR 18,000 (12.5 percent increase) for primary schools (all types), QR 20,400 (5.2 percent) for girls’ preparatory schools and QR 22,800 (4.6 percent) for girls’ secondary schools. Allocations will remain at QR 19,400 for boys’ preparatory schools and QR 21,800 for boys’ second-ary schools (Supreme Education Council, 2007d). Focusing on the near term, we assess the effect of the 40 percent base salary increase9 and compare this with the proposed increases in per-pupil allotments (see Figure 4.12). Our analysis suggests that the net effect represent gains (indicated by plusses in Figure 4.12) in total revenues for boys’ primary model, boys’ primary, and girls’ primary schools (of about 6, 12, and
9 Qatarization quotas have an effect on school finances over the longer term.

76 Developing a School Finance System for K–12 Reform in Qatar
Figure 4.11Percentage Increase in School Expenditures Resulting from Qatari Personnel Wage Increase, by School Type
RAND MG839-4.11
8
7
6
5
4
3
2
1
K + p
rimar
y
boys’ m
odel
K + p
rimar
y
girls
Prep
arat
ory
girls
Prep
arat
ory
boys
Seco
ndary
girls
Seco
ndary
boys
K + p
rimar
y
boys
9
0
Perc
enta
ge
School type
5 percent, respectively) and losses (indicated by minuses) for boys’ and girls’ preparatory and boys’ and girls’ secondary schools (of about 2, 3, 1, and 0.5 percent, respectively). In other words, for some schools, the slated increases in per-pupil allotments will most likely not cover the increased expenditures because of the 40 percent base salary increase for Qatari staff, whereas for others, they cover expenditures more than sufficiently.
Qatarization, on the other hand, has different gender-related effects at different levels (see Figure 4.13). Girls’ secondary schools would experience a much larger increase in expenditures than would boys’ secondary schools, but the opposite relationship is true for girls’ and boys’ preparatory schools. The increases in operating expenditures from Qatarization range widely, between less than 2 percent for girls’ preparatory schools and 14 percent for girls’ secondary schools.

Tool to Forecast Spending on the Reform 77
Figure 4.12Percentage Increase in School Expenditures Resulting from Qatari Staff Wage Increase and Increase in Per-Pupil Allocation, by School Type
RAND MG839-4.12
12
10
8
6
4
2
K + p
rimar
y
boys’ m
odel
K + p
rimar
y
girls
Prep
arat
ory
girls
Prep
arat
ory
boys
Seco
ndary
girls
Seco
ndary
boys
K + p
rimar
y
boys
14
0
Perc
enta
ge
–
–
–
+++
–
Wage increaseAllocation increase
School type
Summary/Conclusions
We developed a model to forecast spending in the Qatar K–12 reform consisting of four parts: (1) total expenditures on the reform, based on contract costs, asset procurement costs, Institute costs, and Indepen-dent school operating revenues, (2) total costs for contracts, asset pro-curement, and the institutes, (3) total school operating revenues, and (4) per-pupil allocations for each type of Independent school. At each stage of use of the model, a set of inputs can be varied to determine the effect of various policies. Some of the policy levers that can be manipu-lated at different points in time to produce different cost scenarios are the following: number of Independent schools; student enrollment per school; per-pupil allocations; start-up funding and grants per school; growth rates in the variable and fixed costs of contracts, assets, and

78 Developing a School Finance System for K–12 Reform in Qatar
Figure 4.13Percentage Increase in School Expenditures Resulting from Qatarization, by School Type
RAND MG839-4.13
14
12
10
8
6
4
2
K + p
rimar
y
boys’ m
odel
K + p
rimar
y
girls
Prep
arat
ory
girls
Prep
arat
ory
boys
Seco
ndary
girls
Seco
ndary
boys
K + p
rimar
y
boys
16
0
Perc
enta
ge
School type
institutes; teacher-pupil ratios; Qatarization percentages; and staff salaries.
It is important to note that the expenditures on the reform that we are forecasting are accompanied by savings within the Ministry education system. For example, when a school transitions from a Min-istry to an Independent school, that school’s expenditures are added to the reform but they are subtracted from Ministry expenditures, which we do not track and lack the data to do so. Therefore, from the point of view of the entire Qatar education system, reform expenditures may not result in added overall costs.
For illustrative purposes, we use the forecasting model to predict total reform expenditures under five scenarios corresponding to pro-posed or impending policy changes. Our findings were as follows:

Tool to Forecast Spending on the Reform 79
Total expenditures increase by 10 percent as a result of a newly mandated 40 percent base salary increase for Qatari personnel in 2006–2007.Total expenditures increase by about 12 percent if we assume a 3 percent average annual salary increase for all personnel (above inflation).Total expenditures increase by about 5 percent if the Qatarization goals are fully achieved.Schools with female teachers have higher percentages of Qatari nationals than schools with male teachers and are affected more by the 40 percent base salary increase. Schools with female teach-ers can thus expect increases in operating expenditures between 5 percent and 8 percent, compared with increases of between 0 percent and 1.5 percent for schools with male teachers.The gender-related effect of Qatarization goals, on the other hand, differs by school level. The increases in operating expenditures due to Qatarization range widely between less than 2 and 14 percent.The net effect of the recent 40 percent base salary increase for Qatari staff and of proposed increases in per-pupil allotments rep-resents gains in total revenues for boys’ primary schools model and boys’ and girls’ primary schools (of about 6, 12, and 5 per-cent, respectively) and losses (indicated by minuses) for boys’ and girls’ preparatory schools and boys’ and girls’ secondary schools (of about 2, 3, 1, and 0.5 percent, respectively). Thus, for some schools, the slated increases in per-pupil allotments will most likely not cover the increased expenditures that result from the 40 percent base salary increase for Qatari staff whereas for others they cover expenditures more than sufficiently.


81
CHAPTER FIVE
Conclusions and Recommendations
Qatar’s K–12 education reform has made notable progress in a few short years. It has founded a growing set of new schools and estab-lished a comprehensive infrastructure for financial support and moni-toring. In this monograph, we have explored available data to under-stand the workings of Qatar’s education finance reform. We have documented trends in expenditures and funding of the Qatar K–12 education reform, beginning with the planning phase in 2003–2004 and extending through the start-up and operation of Generations I and II Independent schools in 2005–2006. In addition, we have evalu-ated the reform’s finance system by assessing its progress with regard to six objectives: transparency, equity, adequacy, efficiency, account-ability, and stability/responsiveness. We have also provided a forecast-ing model that can be used to determine funding levels and projected expenditures in future years and under various policy scenarios.
We conclude that the finance system supporting Qatar’s K–12 school reform is on its way to becoming an effective system but would benefit from a number of improvements. It requires improved transpar-ency with regard to the quality and accessibility of data and the use of standardized categorizations and reporting periods and unique, con-sistent identifiers for personnel. The partially implemented new man-agement information system will most likely foster transparency if it includes these improvements.
We found that gender parity in school finance is achieved through a tenuous balance that depends on offsetting wage premiums for teacher

82 Developing a School Finance System for K–12 Reform in Qatar
gender and nationality. Forecasting tools aid in exploring the effects of policies that may shift this balance.
At the time of our data collection, levels of funding appeared ade-quate to maintain the performance levels of higher-achieving schools. In fact, school operators appeared hesitant to spend all of the funding provided to them and tended to accumulate budget surpluses. Until a more comprehensive determination of “successful” school outcomes can be made, judgments about the adequacy of funding levels remain uncertain. In addition, it is unclear whether the performance levels of higher-achieving schools meet performance levels that are considered “excellent,” since school performance standards have not been estab-lished. Thus, adequate funding to support educational excellence has yet to be determined. We have outlined a quantitative methodology that can be used to assess school performance as the reform grows, but we also suggest that more qualitative work be done to investigate the resources used in instruction in the more apparently successful schools. In addition, outcomes other than test scores—such as graduation rates, college attendance, or parental satisfaction—might be considered in expanding the definition of successful schools. These can be compared with the test-based measures to determine how well the various mea-sures align.
With regard to accountability, it is unclear whether the mecha-nisms relied on by the reform have had an effect on school quality. We found that the system is oriented heavily toward monitoring financial decisions made by the schools through restrictions on spending and that these restrictions appear to have had their desired fiscal effects. However, it is possible that the goal of improving school quality might be pursued by loosening rather tightening restrictions on spending, and we therefore recommend carefully monitored moves in this direc-tion. The parental choice mechanism on which the Independent school system—a charter school system—is based is relatively weak in its application because of capacity constraints. This mechanism could therefore be strengthened by increasing the system’s ability to accept new students.
In the years of the reform that we studied, the balance between stability and responsiveness in the finance system tilted heavily toward

Conclusions and Recommendations 83
the latter. Many policy changes have occurred in the direction of greater financial regulation. This may be an inevitable feature of a new reform. However, the degree of predictability that would have enabled school operators to establish both long- and short-term strategies for improv-ing their schools was lacking in the period we examined. As the reform develops, it will require greater stability to allow school operators to organize their efforts around a consistent set of policies and expected fiscal and academic outcomes.
The Qatar K–12 education reform is expanding quickly as the conversion of existing schools to Independent schools continues at a rapid pace. Over time, increased quality and efficiency within the education system can be aided through the types of improvements to the finance system that we have discussed in this monograph. As the number of schools and students affected by the reform grows, more weight can be placed on information provided by the types of analyses we have outlined. Greater transparency, combined with this growth, will permit a thorough understanding of the operations adopted in suc-cessful schools and the level of funding that would adequately support success throughout the system.
Our assessment revealed areas for improvement in the finance system to enrich its capacity to support the reform and its overall mis-sion. We offer the following recommendations:
To determine levels of funding adequate to support educational excellence, we recommend continued analysis using a successful schools approach along the lines of the one described and imple-mented in this study. As the reform expands and performance tar-gets that represent excellence in achievement are established, this methodology will yield increasingly useful information.To obtain information that would lead to greater efficiency in school operations, we recommend supplementing the quantitative analyses described in this monograph with a case study approach to examine the operations and teaching practices of successful schools and uncover factors that might yield high achievement at the lowest cost.

84 Developing a School Finance System for K–12 Reform in Qatar
To address potential equity issues, we recommend that policies with different effects on different types of schools be investigated before they are implemented by using a forecasting model such as the one we have developed. To improve transparency, we recommend that the new informa-tion system include improved longitudinal tracking mechanisms as well as introduce more uniform categorization of personnel and expenditures. To strengthen accountability for school quality, we recommend an expansion of the choice mechanism through increases in capacity where possible to strengthen the system’s ability to hold schools accountable for providing high-quality instruction. To improve stability, we recommend that in going forward, the pace of policy change be slowed to allow school operators to assess long-term prospects and plan for multiyear investments in resources that may improve educational quality. To this end, we recommend that changes in funding regulations be made less frequently and with ample forewarning. A policy of regulatory stability extending beyond one year would help accomplish this. Allowing surpluses to be carried over across years to pay for large expenses is particularly important.
This report has highlighted lessons learned with respect to resource allocation and financial support mechanisms in the first few years of K–12 education reform in Qatar. It has presented and applied a meth-odology for evaluating the school finance system developed to support the reform. The Qatar experience provides useful lessons that can be applied in other countries—particularly those embarking on ambitious educational restructuring and those in the Gulf region facing similar contextual challenges—and our analytic strategy for assessing the per-formance of a school finance system can be applied to school systems in many nations.

85
APPENDIX A
Description of Data Sources
Description of Data from the Office of Shared Services
Information from the Office of Shared Services can be grouped into the following categories:
budgeted versus spent versus in reserve (overall and by institute or department)itemized spending by institute and departmentpayments made to external contractors.1
A summary of data received from the Office of Shared Services is provided in Table A.1. The data include information on external con-tracts expenditures, asset purchases, funding allocations to schools, and operational expenses of the institutes. These categories cover the bulk of the total spending on the Qatar K–12 reform.
The Office of Shared Services data varied considerably in format, detail, and quality. We received most of the information in Microsoft Excel format, with some limited information in Microsoft Word (.doc), and received data from April 2003 up to November 2006. We based our analysis on the first three fiscal years of data—from April 1, 2003,
1 Although most of the information relates to the education system directly serving Inde-pendent schools, external contract expenditures include the national student assessment and school surveys, which pertain to all government-funded schools in Qatar as well as the pri-vate Arabic schools. Thus, some of the significant external contract costs of the reform are associated with programs that include most of the students in Qatar’s education system, in both the Ministry of Education and Independent schools.

86 Developing a School Finance System for K–12 Reform in Qatar
Table A.1Summary of Data from the Office of Shared Services, by Fiscal Year
Fiscal Year Data Description
April 2003– March 2004
Summary of payments made from Ministry itemized list of payments made by the Ministry of Finance for the Supreme Education Council
April 2004– July 2005
Budget versus actual spending for fiscal year 2004–2005 comparison of budgeted amount and spending by category for each institute and department (Education, Evaluation, Higher Education, Communications and Shared Services) Contracts name, start date, and end date of contracts and payments made to external contractors for services providedSpending during fiscal year 2004–2005 spending by the Supreme Education Council on the Higher Education Institute, Independent schools, undefined assets procurement, and unallocated projectsSpending analysis—budget 2004–2005 summary of budgeted and total spending by the Supreme Education Council on institute expenses, Independent schools, contracts, and projects within fiscal year spending is split up into April 4–March 5 and April 5–July 5Technology after editing list of requested, baseline, technology, and actual technology provided to schoolsPolicy manual Shared Services policy and procedures manual
August 2005– March 2006
SEC contracts list of completed and existing contracts by institute and department with start and end dates, value of the contract, and payments madeShared Services Revised Policy and Procedures Manual Spending versus budget fiscal year 2005–2006 sum of budgeted, spent, and in reserve by institute and department sum of budgeted, spent, and in reserve, by item category sum of budgeted, spent, and in reserve, by item category and institute and department account credit and debit activity for each Independent school
April 2006– March 2007 (up to November 2006)
Spending versus budget SEC spending by institute and department to October 2006 SEC spending by institute and department, by category of spending and line item to October 2006Report summary budget report and percentage spent, by institute, as reported on November 30, 2006 SEC receipts, payments made, and bank account balance for November

Description of Data Sources 87
Table A.1—continued
Fiscal Year Data Description
comparison of spending versus budgeted versus reserve by institute and department for 2006–2007 individual institute and department spending versus budgeted versus reserve, by general category for November summary spending versus budgeted versus reserve, by category and institute for 2006–2007 individual institute and department budgeted versus spent versus reserve, by detailed item and category for November individual institute and department monthly (April 6–November 6) spending, by detailed item and category
to March 31, 2006—and constructed three equal time periods corre-sponding to the fiscal year to allow for year-to-year comparisons (data adjustments were required, because reporting periods did not always correspond to the fiscal year).2 We were able to construct aggregate but not always detailed equal time period cost measures, because data-reporting categories changed over time.
Description of Data from the Finance Office
Data from Audited Statements, Payments Spreadsheets, and Cash Flow Statements
We received various financial statements on revenues and expenses from the Finance Office. They were as follows:
KPMG and Deloitte & Touche audited statements: These contain statements of assets, liabilities, revenues, expenditures, changes in surplus funds, and cash flows.
Deloitte & Touche audited statements (reported in October –and November 2005) cover the period from September 1,
2 Cost information is available for the following periods: April 1, 2003, to March 31, 2004; April 1, 2004, to July 15, 2005; April 1, 2005, to July 15, 2005, and July 16, 2005, to March 31, 2006. From this information, we determined expenses for the equal-length periods of April 1, 2003, to March 31, 2004; April 1, 2004, to March 31, 2005; and April 1, 2005, to March 31, 2006.

88 Developing a School Finance System for K–12 Reform in Qatar
2004–August 31, 2005 (i.e., the first year of operation for Gen-eration I schools). KPMG audited statements (reported in August–November –2006) cover the periods from September 1, 2004–August 31, 2005, and September 1, 2005–June 30, 2006, for Generation I schools (i.e., the first and second years of operation) and the period September 1, 2005–June 30, 2006, for Generation II schools (i.e., the first year of operation).
Finance Office payments data: These report expenditures on start-up funds, grants, and per-pupil allotments for each school. The period covered is not identified, but the numbers correspond to those in the audited statements for the period from September 1, 2004–August 31, 2005. Similar data were not available for the second year of operations, September 1, 2005–June 30, 2006.Cash flow statements: These are unaudited monthly and annual cash flow statements of revenues and expenditures provided in a fairly standard format by each school. The data available to us were reported in different months. For example the 2005–2006 data had ending periods of April, May, and June. In addition, not all schools reported in the same manner (some were in Arabic and some in English, some provided cash flow statements with additional categories, some kept to the same original template). Because of these differences, we used only the ratio of administra-tive to instructional wages, rather than the actual expense, in our analysis. This ratio should be relatively constant over time and thus fairly independent of the period of reporting.
The auditing firm KPMG provides the most recent and most complete reporting for both the September 1, 2004–August 31, 2005, period (or first year of operations) and the September 1, 2005–June 30, 2006 period (or second year of operations) for both the Generation I and Generation II schools. Deloitte & Touche, on the other hand, report only on the first year of operations for Generation I Independent schools. KPMG and Deloitte & Touche reporting on the first year of operation of Generation I schools is largely the same, with the excep-
Description of Data Sources 89
tion of a small number of corrections made by KPMG to the original Deloitte & Touche reporting.
For consistency in reporting on the two separate time periods and because KPMG provides the more recent reporting, we use the KPMG audited statements in our analysis. For Generation I schools, these statements cover both the first and second years of operations (2004–2006), and for the Generation II schools they cover the first year of operations (2005–2006).3
To compute a value of total revenues that best serves the needs of our analysis, we adjust the KPMG audited statements data for any deferred revenue related to capital expenditures4 in such a way that rev-enues are recognized in the fiscal year when expenditures were made rather than allowing for revenues to be recognized as equipment depre-ciates. We do this for the following reasons:
The correction for deferred revenue provides results that are more in line with actual payments made by the Finance Office and received by the schools for the given periods.All deferred revenue is recognized by KPMG at the end of 2006 for every Generation I and Generation II Independent school because of termination of the Independent School Operating Agreement (ISOA) at the end of 2006. In other words, as a result
3 We assumed that the period from September 1, 2005, to June 30, 2006, represented the full year of operations for the second year (2005–2006), i.e., the period was equivalent to the full year from September 1, 2004, to August 31, 2005, for the first year of operations (2004–2005). In addition to correcting start-up funds and grants for deferred revenue, we make two additional corrections to miscellaneous income for funds left over from previous operation (one correction of QR 147,435 for one school and QR 7,392 for another). These corrections were made because these funds are not part of the operational years under con-sideration and are thus not representative of the operation. 4 We do allow for the deferral of “miscellaneous income received from the students” for one school, in the amount of QR 163,160, and the deferral of “deferred rent” for another school, in the amount of QR 40,000, both in the September 1, 2004–August 31, 2005, operational year. These are the only two instances in which we allow an amount to be deferred because these revenue categories do not relate to income recognition from depreciation associated with a capital expenditure. Miscellaneous income received from students or from deferred rent is an example of a type of advance payment that should be deferred.

90 Developing a School Finance System for K–12 Reform in Qatar
of the termination of the ISOAs, both years are treated unevenly; we correct for this by correcting for deferred revenue.
The corrections for deferred revenues affect Generation I schools only and reduce operating revenues by less than 1 percent and oper-ating surpluses by 7.5 percent for 2004–2005 and 7.8 percent for 2005–2006.
Description of Staffing Reports
Staffing Reports are reports that Independent schools are required to submit quarterly to the Finance Office. They list the names, identifi-cation numbers, nationalities, salaries, full-time equivalence, subject/title (i.e., job title and, if applicable, subject taught), and start date of all personnel. Some schools modified or added to these categories in their reports.
The reports we received from the Finance Office covered three aca-demic years corresponding to the first three years of operations of Inde-pendent schools: 2004–2005 (Generation I), 2005–2006 (Generations I and II), and 2006–2007 (Generations I, II, and III). Reports were provided primarily in Microsoft Excel format by the Finance Office, and these were then processed before importing into STATA (a statisti-cal software package), for analysis.5 We processed the data as follows. Most of the staffing reports contained information in both English using Latin characters and Arabic using Arabic script. Because STATA does not read Arabic script, we translated the reports into English. Some information, such as the name of the individual, was not trans-lated into Arabic, since it was not used in the analysis. Then, because of the large number of job titles included in the Staffing Reports, we employed a database query method to group individuals into standard-ized job categories.
There was a considerable amount of variation across years in the availability of data. We received Staffing Reports in 2004–2005,
5 Some of the 2004–2005 Staffing Reports (Generation I) were provided in Microsoft Word (.doc) format. These reports were provided as tables and thus they were copied and pasted into excel sheets for formatting and eventual inputting into STATA.

Description of Data Sources 91
2005–2006, and 2006–2007. In some cases, the Staffing Reports were more like payroll reports, describing actual payments made to staff rather than their contracted salaries. For example, the majority of the 2006–2007 reports use a “paid salary” category rather than a “total salary” category, whereas earlier reports used the latter category exclu-sively. The former category represents total salary after deductions for pensions, absences, and other items, whereas the latter category repre-sents overall monthly salary as specified in the contract for each indi-vidual. Therefore, salaries reported in the 2006–2007 reports are not comparable to those reported earlier.
Most of the Staffing Reports were provided to us in both hard-copy and softcopy form. However, the 2005–2006 staffing reports, with the exception of those for four schools, were provided to us only in hard copy form. The 2005–2006 hard copy data were manually entered into electronic form.
A summary of the fields available across the years is provided in Table A.2. As Table A.2 shows, additional data fields were added in subsequent years, and one indicator, full-time status, was dropped. Not all schools reported all the variables listed for the corresponding aca-demic year.
Because the full-time status indicator was dropped after 2004–2005, we assumed in our analysis that all the teachers reported on in the later years are full-time status employees.
Descriptive Analysis of Staffing Reports
Tables A.3, A.4, and A.5 provide details of the distribution of staff in Independent schools. We can see the substantial increase in the number of staff from around 1,200 in 2004–2005 (Table A.3) to over 3,800 in 2006–2007 (Table A.5).
Figures A.1, A.2, and A.3 provide further information on average teacher salaries, by teacher and school characteristics. In the mono-graph, we focused on differences in average teacher salaries by gender and nationality. In Figure A.1, we show the differences by school level (primary, preparatory, secondary, and the educational complexes), and in Figure A.2, we highlight average salary differences by level and

92 Developing a School Finance System for K–12 Reform in Qatar
Table A.2Summary of Variables Available, by Academic Year
2004–2005 2005–2006 2006–2007
Personal identification √ √ √
Name √ √ √
Total salary √ √ √
Salary allowances √ √
Full-time status √
Subject/title √ √ √
Citizenship √ √ √
Job starting date √ √ √
Job ending date √
Gender √ √ √
Qualification (earned degree) √ √
Job identification √
Contract status √ √
Lessons per week √
Discrepancy comments √
Table A.3Number of Individuals, by Job Title, 2004–2005
Job Title Number PercentCum.
Percent
Administrator 39 3.28 3.28
Operator principal 7 0.59 3.87
Operator 4 0.34 4.21
Other 227 19.09 23.30
Principal 6 0.50 23.80
Subject head 37 3.11 26.91
Teacher 776 65.26 92.18
Teacher aide 69 5.80 97.98
Vice principal 24 2.02 100.00
Total 1,189 100
SOURCE: Office of Finance Staffing Reports.

Description of Data Sources 93
Table A.4 Number of Individuals, by Job Title, 2005–2006
Job Title Number PercentCum.
Percent
Administrator 165 5.84 5.84
Assistant 178 6.30 12.14
Director 10 0.35 12.49
Laborer 127 4.49 16.99
Operator principal 1 0.04 17.02
Operator 16 0.57 17.59
Other 295 10.44 28.03
Principal 31 1.10 29.12
Specialist 37 1.31 30.43
Subject head 81 2.87 33.30
Supervisor 132 4.67 37.97
Teacher 1,707 60.40 98.37
Teacher aide 2 0.07 98.44
Vice principal 44 1.56 100.00
Total 2,826 100
SOURCE: Office of Finance Staffing Reports.
nationality for school years 2004–2005 and 2005–2006. Figure A.3 shows average teacher salaries by teacher gender and nationality, and across Generations I and II Independent schools.
In Tables A.6, A.7, A.8, and A.9, we provide more detailed infor-mation on the distribution of teachers in Independent schools and average salaries by gender, nationality, and type of school (primary, model, preparatory, secondary, and the educational complexes). Tables A.10–A.13 provide the same information but for nonteaching staff.

94 Developing a School Finance System for K–12 Reform in Qatar
Table A.5Number of Individuals, by Job Title, 2006–2007
Job Title Number PercentCum.
Percent
Administrator 260 6.82 6.82
Assistant 151 3.96 10.77
Class manager 13 0.34 11.11
Director 76 1.99 13.11
Laborer 307 8.05 21.15
Other 335 8.78 29.93
Principal 47 1.23 31.17
Specialist 34 0.89 32.06
Subject head 202 5.29 37.35
Supervisor 174 4.56 41.91
Teacher 2,181 57.17 99.08
Teacher aide 3 0.08 99.16
Vice principal 32 0.84 100.00
Total 3,815 100
SOURCE: Office of Finance Staffing Reports.
Table A.6Teacher Characteristics, by Category, Boys’ Model and Primary Schools, 2005–2006
Boys’ Model Boys Girls
Category No. Percent
Mean Salary (QR) No. Percent
Mean Salary (QR) No. Percent
Mean Salary (QR)
Qatari male 1 2 11,000
Non-Qatari male 42 98 7,933
Qatari female 88 39 8,710 250 46.8 8,956
Non-Qatari female 140 61 6,134 284 53.2 6,211
Total 228 100 43 100 534 100
NOTE: 49 teacher salary observations are missing.

Description of Data Sources 95
Figure A.1Average Teacher Salary, by School Type, 2004–2005 and 2005–2006
SOURCE: Office of Finance Staffing Reports: staff salaries.NOTE: Three teacher salary observations are missing for 2004 and 49 teacher salaryobservations are missing for 2005.RAND MG839-A.1
10,000
8,000
6,000
4,000
2004–2005 2005–2006
12,000
0
Sala
ry (
QR
)
PrimaryPreparatorySecondaryComplexes
2,000
8,769
9,731
9,053
7,419
8,185
6,857
9,637
6,948
n=293 n=102 n=35 n=292 n=805 n=304 n=216 n=333
Table A.7Teacher Characteristics, by Category, Preparatory Schools, 2005–2006
Category
Boys Girls
No. PercentMean
Salary (QR) No. PercentMean
Salary (QR)
Qatari male 21 14.7 14,690
Non-Qatari male 122 85.3 9,502
Qatari female 90 55.9 9,250
Non-Qatari female 71 44.1 6,366
Total 143 100.0 161 100.0
NOTE: 49 teacher salary observations are missing.

96 Developing a School Finance System for K–12 Reform in Qatar
Figure A.2Average Teacher Salary, by School Type and Teacher Nationality, 2004–2005 and 2005–2006
SOURCE: Office of Finance Staffing Reports: staff salaries.NOTE: Three teacher salary observations are missing for 2004 and 49 teacher salaryobservations are missing for 2005.RAND MG839-A.2
12,000
10,000
8,000
6,000
4,000
2,000
16,000
0
Sala
ry (
QR
)
14,000 2004–20052005–2006
Prim
ary
non-Qat
ari
Prim
ary
Qatar
i
Prep
arat
ory
non-Qat
ari
Prep
arat
ory
Qatar
i
Seco
ndary
non-Qat
ari
Seco
ndary
Qatar
i
Complex
es
non-Qat
ari
Complex
es
Qatar
i
5,7056,343
8,4648,898
8,488 8,348
15,000
10,279
6,269
9,101
11,410
12,778
6,7767,402
10,14810,652
Table A.8Teacher Characteristics, by Category, Secondary Schools, 2005–2006
Category
Boys Girls
No. PercentMean
Salary (QR) No. PercentMean
Salary (QR)
Qatari male 10 8.0 15,602
Non-Qatari male 115 92.0 9,982
Qatari female 27 29.7 11,732
Non-Qatari female 64 70.3 7,518
Total 125 100.0 91 100.0
NOTE: 49 teacher salary observations are missing.

Description of Data Sources 97
Figure A.3Average Teacher Salary, by Teacher Gender and Nationality and School Generation, 2005–2006
SOURCE: Office of Finance Staffing Reports.NOTE: 49 teacher salary observations are missing.RAND MG839-A.3
12,000
10,000
8,000
Femalenon-Qatari(n = 296)
Malenon-Qatari(n = 181)
MaleQatari
(n = 30)
FemaleQatari
(n = 283)
Femalenon-Qatari(n = 391)
Malenon-Qatari(n = 163)
MaleQatari
(n = 12)
FemaleQatari
(n = 302)
6,000
4,000
2,000
16,000
Generation I Generation II
0
Sala
ry (
QR
)
14,000
14,947
6,589
9,503 9,097
6,310
9,283 9,576
15,042
Table A.9Teacher Characteristics, by Category, Complexes, 2005–2006
Category
Boys Girls
No. PercentMean
Salary (QR) No. PercentMean
Salary (QR)
Qatari male 10 6.3 15,338
Non-Qatari male 65 41.1 8,724
Qatari female 44 27.8 9,178 86 49.1 10,861
Non-Qatari female 39 24.7 5,717 89 50.9 7,176
Total 158 100.0 175 100.0
NOTE: 49 teacher salary observations are missing.

98 Developing a School Finance System for K–12 Reform in Qatar
Table A.10Nonteacher Staff Characteristics, by Category, Boys’ Model and Primary Schools, 2005–2006
Boys’ Model Boys Girls
No. Percent
Mean Salary (QR) No. Percent Mean No. Percent
Mean Salary (QR)
Non-Qatari female 74 47 4,367 0 125 42 5,815
Non-Qatari male 0 0 46 92 5,720 11 4 5,555
Qatari female 84 53 8,338 0 0 156 53 8,829
Qatari male 0 0 4 8 23,513 5 2 16,100
Total 158 100 50 100 297 100
NOTE: 106 observations are missing nationality information, and 44 observations are missing salary information.
Table A.11Nonteacher Staff Characteristics, by Category, Preparatory Schools, 2005–2006
Category
Boys Girls
No. PercentMean
Salary (QR) No. PercentMean
Salary (QR)
Non-Qatari female 53 40 5,117
Non-Qatari male 32 56 7,300 8 6 6,900
Qatari female 4 7 8,238 71 53 10,078
Qatari male 21 37 16,128 2 1 15,000
Total 57 100 134 100
NOTE: 106 observations are missing nationality information, and 44 observations are missing salary information.

Description of Data Sources 99
Table A.12Nonteacher Staff Characteristics, by Category, Secondary Schools, 2005–2006
Category
Boys Girls
No. PercentMean
Salary (QR) No. PercentMean
Salary (QR)
Non-Qatari female 25 44 4,610
Non-Qatari male 53 72 9,174 5 9 8,500
Qatari female 1 1 16,500 26 46 9,542
Qatari male 20 27 15,629 1 2 17,000
Total 74 100 57 100
NOTE: 106 observations are missing nationality information, and 44 observations are missing salary information.
Table A.13Nonteacher Staff Characteristics, by Category, Complexes, 2005–2006
Category
Boys Girls
No. PercentMean
Salary (QR) No. PercentMean
Salary (QR)
Non-Qatari female 12 15 2,633 20 31 6,823
Non-Qatari male 19 24 5,732 1 2 12,000
Qatari female 32 41 9,731 43 67 13,032
Qatari male 15 19 16,840 0
Total 78 100 64 100
NOTE: 106 observations are missing nationality information, and 44 observations are missing salary information.
Description of Qatar Comprehensive Educational Assessment
The QCEA is a paper-and-pencil assessment battery that consists of multiple-choice and constructed-response questions, based on Qatar’s curriculum standards in modern standard Arabic (FusHa), English as a foreign language, mathematics, and science.
The analyses in this monograph use the scale score results of stu-dents in Independent schools from the 2005 and 2006 QCEA admin-istrations. Table A.14 shows the scale score ranges for both years.

100 Developing a School Finance System for K–12 Reform in Qatar
Table A.14Lowest and Highest Possible Scale Scores on QCEA, 2005 and 2006
Math Science
G ra d e Level Lowest Highest
Grade Level Lowest Highest
4 350 700 4 350 700
5 375 725 5 350 725
6 380 750 6 350 750
7 385 775 7 350 775
8 390 800 8 350 800
9 410 825 9 350 825
10 550 850 10 525 775
11 550 875 11 525 800
Arabic English
G ra d e Level Lowest Highest
Grade Level Lowest Highest
4 190 780 4 385 655
5 195 830 5 400 670
6 275 835 6 420 675
7 277 855 7 430 690
8 280 857 8 435 695
9 295 895 9 460 700
10 330 930 10 465 710
11 335 935 11 467 715
The Arabic and English scale scores are vertically scaled from grades 4 through 11, so that a student’s score in grade 4 can be directly compared to that same student’s score in grade 11. This allows for direct grade-to-grade comparisons for these two subjects. This was possible because across the grades, the standards for the language subjects have four targeted skills: reading, writing, speaking, and listening. Math-ematics and science, however, are not vertically scaled like the language subjects, because the changing topics and subjects covered across the grades do not allow for direct comparisons.

Description of Data Sources 101
Our analyses compare 2006 student scores in grades 5 through 11 with their 2005 scores in grades 4 through 10. We limited the number of grades in our comparisons, because the two administrations cover different grade ranges. The Evaluation Institute administered the 2005 QCEA to students in grades 1–12 for Arabic, English, and mathemat-ics. Because the science standards for grades 1 through 3 are not based on specific content but instead focus on inquiry skills that are not easily tested via pencil-and-pencil measures, students in those grades were not assessed in science with QCEA tests in 2005. In 2006, students in grades 4–11 took the QCEA tests in all four subjects.
Description of Qatar National Educational Database System Data
Qatar has embarked on a multiyear effort to improve educational out-comes for all students to more effectively respond to the opportuni-ties of an increasingly competitive global community. As part of this process, Qatar developed a National Education Indicator System that stores information on various education stakeholders. This information is collected annually through enumeration and surveys on every Min-istry of Education, Independent school, and private Arabic school. The following describes the data available in QNEDS.
school administrator information: school and student character-1. istics; school resources; admission policies; staffing; and teacher, student, and parent servicesschool principal information: principal education level, skills, 2. and training; professional development experiences; school deci-sionmaking and structure; views on learning; satisfaction with school environment; and perception on education barriersteacher information: teacher education level, skills, and training; 3. instructional pedagogy used; professional development experi-ences; satisfaction with school; relationship with colleagues

102 Developing a School Finance System for K–12 Reform in Qatar
student information: student demographics, schooling experi-4. ence, attendance and discipline, attitudes about school and edu-cation, and participation in school activitiesparent and household information: parent demographics and 5. education level, home environment and whether it is conducive to learning, child’s education background, child’s attendance and discipline, parent participation in school activities, and atti-tude on educationsocial worker information: social worker demographics and edu-6. cation level, role in school, services provided to students, student attendance and discipline, school resources, and relationship with other school staffschool facility information: information on the availability of 7. school facilities and physical resources including technologyenumeration: information on number of student teachers, 8. classes, and school; track and course enrollment.

103
APPENDIX B
Description of Forecasting Tool Baseline Assumptions
The baseline model is the model in which all policy changes as cur-rently proposed are implemented.
Conversion Period
A seven-year period for complete conversion of all Ministry schools into Independent schools by 2012–2013 is assumed.
School Types
In the model, we assume a gradual transition over the conversion period during which all Ministry students are moved over to the Independent school system. The total number of students for each type of school, school level, and gender is based on Ministry of Education and Finance Office reporting of the following statistics for 2005–2006 (Tables B.1 and B.2).
Average Student Population per School, by School Type
From Tables B.1 and B.2, we derive the following average numbers of students per school, by school type for 2005–2006 (Table B.3).

104 Developing a School Finance System for K–12 Reform in Qatar
Table B.1Number of Students in Ministry and Independent Schools, 2005–2006
School Type MinistryIndependent
School Total
Primary model boys 9,412 1,573 10,985
Primary boys 4,103 2,491 6,594
Primary girls 13,040 6,688 19,728
Preparatory boys 6,610 2,511 9,121
Preparatory girls 7,668 2,232 9,900
Secondary boys 6,535 1,572 8,107
Secondary girls 8,512 948 9,460
Complexes boys 0 1,860 1,860
Complexes girls 0 2,163 2,163
Total 55,880 22,038 77,918
SOURCE: Ministry of Education Finance Office statistics on education for school year 2005–2006.
NOTE: We excluded three specialized boys’ schools with 348 students in total.
Table B.2Number of Ministry and Independent Schools, 2005–2006
School Type MinistryIndependent
School Total
Primary model boys 26 3 29
Primary boys 22 4 26
Primary girls 41 11 52
Preparatory boys 23 4 27
Preparatory girls 25 4 29
Secondary boys 16 3 19
Secondary girls 22 2 24
Complexes boys 0 1 1
Complexes girls 0 1 1
Total 175 33 208
SOURCE: Ministry of Education Finance Office statistics on education for 2005–2006.
NOTE: We excluded three specialized boys’ schools with 348 students in total.

Description of Forecasting Tool Baseline Assumptions 105
Table B.3Ministry and Independent Schools Average Students per School, 2005–2006
School Type MinistryIndependent
School Total
Primary model boys 362.0 524.3 378.8
Primary boys 186.5 622.8 253.6
Primary girls 318.0 608.0 379.4
Preparatory boys 287.4 627.8 337.8
Preparatory girls 306.7 558.0 341.4
Secondary boys 408.4 524.0 426.7
Secondary girls 386.9 474.0 394.2
Complexes boys — 1,860.0 1,860.0
Complexes girls — 2,163.0 2,163.0
Total 319.3 667.8 374.6
SOURCE: Ministry of Education Finance Office statistics on education for 2005–2006.
NOTE: We excluded three specialized boys’ schools with 348 students in total.
We model the conversion of approximately 134 Independent schools with an average school size similar to those of Generation I and II schools (numbers are shown in Table B.3). Although there are 178 Ministry and 33 Independent schools in 2005–2006, the total number of Independent schools is smaller after conversion, as the average school size is larger for Independent schools than for Ministry schools. When all Ministry schools have been converted, the total student popula-tion equals that of the population of Independent and Ministry schools combined.
Inflation Rate
The inflation rate is assumed to be 2.5 percent or close to the average inflation rate of 2.4 percent over the period 1982–2005 (according to Qatar Central Bank).

106 Developing a School Finance System for K–12 Reform in Qatar
Population Growth
Census forecasts of the Qatari population by age group1 have been used to forecast the population of kindergarten, primary, preparatory, and secondary school populations.
For comparison, historic growth of the Ministry student pop-ulation was 0.7 percent per year, on average, for 1994–1995 until 2004–2005; the population growth was 0.8 percent and 2.5 percent per year, on average, for the age categories 5–9 and 10–14 years, respec-tively, for 1995 until 2005 (according to Census statistics).
Per-Pupil Allotments
Per-pupil allotments are assumed to grow in line with the expected effect on expenditures resulting from salary increases and Qatarization.
We assumed the following wage increases:
a 40 percent wage increase for both male and female Qatari teach-ers in 2006–2007, and subsequent salary increases of 3 percent per year (above inflation) salary increases of 3 percent per annum (above inflation) for non-Qatari teachers.
We assumed that the following Qatarization goals are reached by the end of the forecasting period (ten years):
boys’ primary model schools—70 percentprimary schools—30 percent for boys’ and 70 percent for girls’ schools preparatory schools—25 percent for boys’ and 60 percent for girls’ schools secondary schools—20 percent for boys’ and 60 percent for girls’ schools.
1 U.S. Census Bureau, International Data Base (IDB), undated.

Description of Forecasting Tool Baseline Assumptions 107
The forecast of per-pupil allocations was calibrated using Staffing Report data for 2005–2006 to determine the percentage of teachers and their average salaries by nationality and gender for each school level and school gender (boys’ versus girls’ schools). These data can be found in Appendix A.
Start-Up Funds
Start-up funds are included for Generation I and Generation II schools only, as they were discontinued for Generation III and subsequent generations.
Operating Grants
Operating grants are assumed to fall in proportion to the number of schools. The rationale for this is that in 2005–2006 the majority of spending on operating grants was related to one school only, a second-ary school with a technology intensive curriculum. Further, the SEC has discontinued the use of operating grants in funding the Indepen-dent schools beginning 2005–2006. In other words, we assumed that the secondary school with a technology intensive curriculum will con-tinue to be funded through operating grants, but that no other schools will receive operating grants in the future.
Miscellaneous Income
Although this is a source of income to Independent schools, it is not a source of expenses to the SEC and is therefore not included in the model.

108 Developing a School Finance System for K–12 Reform in Qatar
Fixed and Variable Costs
Costs are separated into variable costs—those that vary with the number of schools or the number of students—and fixed costs—those that do not.
To calibrate the model, we use information on the costs of opera-tions, institutes, assets, and contracts shown in Table B.4 as our start-ing point. The costs of institutes, assets, and contracts is available for April 1, 2004, to March 31, 2005, and for April 1, 2005, to March 31, 2006,2 from Finance Office data. Information on the cost of operations of Independent schools (including per-pupil funding, start-up fund-ing, and grants, but excluding miscellaneous income), is available from KPMG and Deloitte & Touche financial statements for September 1, 2004, to August 31, 2005, and September 1, 2005, to June 30, 2006. We have not adjusted for differences in the reported time periods.
Table B.4Independent Schools Costs of Operations, Institutes, Assets, and Contracts, by Fiscal Year
2004–2005 (QR) 2005–2006 (QR)
Institutes 34,794,298 79,660,096
Assets 20,518,299 29,730,595
Contracts 273,970,344 326,089,366
Independent schools 176,843,168 404,275,528
Total 525,835,054 842,099,577
SOURCES: Finance Office; KPMG; Deloitte & Touche.
NOTES: The table presents cost for all institutes. We reduce institute costs by 16 percent in the forecasting model to remove costs associated with the Higher Education Institute.
2 Cost information is available for April 1, 2004, to July 15, 2005; April 1, 2005, to July 15, 2005; and for July 16, 2005, to March 31, 2006. From this information, we determined the expenses for the equal-length periods of April 1, 2004, to March 31, 2005; and April 1, 2005, to March 31, 2006.

109
References
Armstrong, J. Scott, ed. (2001). “Principles of Forecasting.” Springer Science+Business Media, LLC. New York, N.Y.: J. Scott Armstrong.
Augenblick, John G., John L. Myers, and Amy B. Anderson (1997). “Equity and Adequacy in School Funding.” The Future of Children–Financing Schools 7(3):63–78.
Brewer, Dominic J., Catherine H. Augustine, Gail Zellman, Gery Ryan, Charles A. Goldman, Cathleen Stasz, and Louay Constant (2007). Education for a New Era: Design and Implementation of K–12 Education Reform in Qatar. Santa Monica, Calif.: RAND Corporation, MG-548-QATAR. As of December 8, 2008: http://www.rand.org/pubs/monographs/MG548/
Cheng, Y. C. (1993). “Conceptualization and Measurement of School Effectiveness: An Organizational Perspective.” Paper presented at AERA annual meeting, Atlanta, Ga.
Coombs, P. H. (1970). What Is Education Planning? International Institute of Education Planning, Paris: UNESCO.
Education Institute (2004). Finance Handbook. Doha, Qatar. March 23, 2004. As of June 29, 2007: http://www.english.education.gov.qa
——— (2005). “Qatarization,” Memorandum to Operators. October 19.
Gonzalez, Gabriella C., Lynn A. Karoly, Louay Constant, Hanine Salem, and Charles A. Goldman (2008). Facing Human Capital Challenges of the 21st Century: Education and Labor Market Initiatives in Lebanon, Oman, Qatar, and the United Arab Emirates. Santa Monica, Calif.: RAND Corporation, MG-786-RC. As of December 8, 2008: http://www.rand.org/pubs/monographs/MG786/
Gronberg, Timothy J., Dennis W. Jansen, Lori L. Taylor, and Kevin Booker (2004). “School Outcomes and School Costs: The Cost Function Approach.” College Station, Tex.: Texas A&M University. As of December 16, 2008: http://www.schoolfunding.info/states/tx/march4%20cost%20study.pdf

110 Developing a School Finance System for K–12 Reform in Qatar
Guthrie, James W., and Matthew G. Springer (2007). “Courtroom Alchemy: Adequacy Advocates Turn Guesstimates into Gold.” Education Next, Winter.
Hanushek, Eric A. (2003). “The Failure of Input-Based Schooling Policies.” The Economic Journal. 113(485):F64–F98.
——— (2006). “Science Violated: Spending Projections and the “Costing Out” of an Adequate Education.” In Eric A. Hanushek, ed., Courting Failure: How School Finance Lawsuits Exploit Judges’ Good Intentions and Harm Our Children. Stanford, Calif.: Hoover Institution Press.
Hanushek, Eric A., and J. Luque (2003). “Efficiency and Equity in Schools Around the World.” Economics of Education Review 22(5):481–502.
Imazeki, Jennifer, and Andrew Reschovsky (2005). “Assessing the Use of Econometric Analysis in Estimating Costs of Meeting State Education Accountability Standards: Lessons from Texas.” Peabody Journal of Education 80(3):96–125.
Marzano, Robert J. (2000). “A New Era of School Reform: Going Where the Research Takes Us.” Aurora, Colo.: Mid-continent Research for Education and Learning. As of December 15, 2008: http://www.mcrel.org/PDF/SchoolImprovementReform/5002RR_NewEraSchoolReform.pdf
Ministry of Education (2005). “Annual Statistics Report 2004–2005.” Doha, Qatar.
Organization of the Petroleum Exporting Countries (OPEC) (2008). “Qatar facts and figures (ASB 2007).” As of August 25, 2008: http://www.opec.org/aboutus/member%20countries/qatar.htm
Picus, Lawrence (2000). “Courts Wrestle with a New Approach to Fair and Equitable Funding for Education.” School Spending 2000: Adequate Funding, The Business of Education. An Online Anthology from the American School Board Journal. As of December 15, 2008: http://209.190.242.72/schoolspending/picus.html
Qatar General Secretariat (2008). Annual Abstract 2008. As of August 25, 2008: http://www.qsa.gov.qa/eng/publication/Annabs2008.htm
RAND Education (undated). Web site. As of February 12, 2009: http://www.rand.org/education/
Scheerens, J., and R. Bosker (1997). The Foundations of Educational Effectiveness. New York: Elsevier Science Inc., USA.
Stasz, Cathleen, Eric Eide, Francisco Martorell, Louay Constant, Charles A. Goldman, Joy S. Moini, Vazha Nadareishvili, and Hanine Salem (2007), Post-Secondary Education in Qatar: Employer Demand, Student Choice, and Options for Policy. Santa Monica, Calif.: RAND Corporation, MG-644-QATAR. As of

References 111
December 8, 2008: http://www.rand.org/pubs/monographs/MG644/
Supreme Education Council (2005). “New Rules Ensure Rights and Benefits of Qatari Educators.” May 4. As of June 29, 2007: http://www.english.education.gov.qa/section/sec/education_institute/newrules
——— (2006a).“New Policies Correct System’s Weaknesses and Support Reform.” June 7. As of January 9, 2009: http://www.english.education.gov.qa/content/resources/detail/3569
——— (2006b).“Changes Underfoot: SEC Alters Rules for School Operators.” June 7. As of June 29, 2007: http://www.english.education.gov.qa/content/resources/detail/3568
——— (2007a). “Admissions Policy.” As of June 10, 2007: http://www.english.education.gov.qa/section/sec/education_institute/admission
———(2007b). “SEC Increases Salaries of Independent School Employees.” March 5. As of June 7, 2007: http://www.english.education.gov.qa/content/resources/detail/4538
——— (2007c). “Guiding Articles for the Personnel Bylaws.” As of June 7, 2007: http://www.english.education.gov.qa/section/sec/education_institute/newrules
——— (2007d). “Independent Schools Budget Is Increased.” May 6. As of June 7, 2007: http://www.english.education.gov.qa/content/resources/detail/4957
——— (undated). Web site (the Arabic version, with a link to the English version). As of February 12, 2009: www.education.gov.qa
U.S. Census Bureau (undated). International Data Base (IDB). As of February 12, 2009: http://www.census.gov/ipc/www.idbpyr.html