DEVELOPING A REPRESENTATIVE & INCLUSIVE VISION FOR …
35
DEVELOPING A REPRESENTATIVE & INCLUSIVE VISION FOR EDUCATION FINAL REPORT AND RECOMMENDATIONS Presented to Governor Roy Cooper January 1, 2021
Transcript of DEVELOPING A REPRESENTATIVE & INCLUSIVE VISION FOR …

DEVELOPING A REPRESENTATIVE & INCLUSIVE VISION FOR EDUCATIONF I N A L R E P O R T A N D R E C O M M E N D A T I O N SPresented to Governor Roy Cooper January 1, 2021
Letter from the Chair
Executive Summary
A Note on Language and Inclusion
Task Force Overview
The Landscape
The Imperative
The Challenge
Evaluating North Carolina’s Progress
Recommendations
Strategies
Additional Considerations
Appendix
01
02
04
05
06
09
10
12
13
15
21
22
T A B L E O F C O N T E N T S

Honorable Governor Roy Cooper:
On behalf of the 34-member DRIVE Task Force commissioned by Executive Order 113, I am honored to submit for your review the recommendations and strategies that we believe will diversify the teacher workforce in the state of North Carolina. In many ways, the work of this Task Force has been guided by the adage, “Whatever they see is what they’ll be.”
With racially and ethnically diverse students emerging as the majority population in our K-12 public schools, it is vital that our educator workforce reflect the students whom they serve. Research shows that all students, but particularly students of color, experience benefits when taught by teachers of color. Students experience not only significant academic outcomes but positive impacts relative to college aspirations and self-confidence; however, data illustrate that people of color become educators at lower rates than their white peers, and educators of color leave the teaching profession at higher rates. Through policies, practices, and procedures grounded in outdated, biased theories and philosophies, our educational system perpetuates a cycle where students of color do not see educators of color present throughout their formal schooling experience. Upon receiving an implicit message that teaching is not a suitable career option, students of color may not choose to become K-12 educators. In essence, the adage shifts to “Whatever they do not see is not what they will strive to be.”
This plan encourages individuals from different sectors in North Carolina to join a collective agenda that challenges the structural racism inherent in our educational system. The recommendations and corresponding short-, mid-, and long-term strategies require that we think differently about our existing policies, funding practices, accountability structures, standards, pedagogical strategies, educator preparatory programs, and educator support and retention models. The status quo in our educational system dates to the 1800s when formal schooling was designed for the sons of white gentry, not for people of color. To disrupt a system that has historically failed to prepare and retain a sufficient supply of educators of color, we must acknowledge its racist history and chart an ambitious new path toward educational equity.
If the people of the state of North Carolina are truly committed to diversifying the teacher workforce, we must accept that the recommendations articulated in this plan will require significant longitudinal fiscal and human investments. Additionally, we must accept that increases in our racial equity performance data will not occur overnight. We must have the courage to execute this plan with fidelity and resist the urge to abandon it if we do not see immediate results. We must also resist the urge to cast doubt on the plan before we venture into uncharted territories where replication of best practice may elicit improved outcomes and experimentation of untried efforts may uncover new knowledge. Transforming a system requires courage, imagination, and innovative thinking. The Task Force believes this plan pushes the state of North Carolina into bold terrain that will ultimately improve outcomes for all students by increasing the number of K-12 educators of color who serve in our communities for decades to come.
D R . A N T H O N Y G R A H A MChair, DRIVE Task Force

Executive SummaryThe state of North Carolina is home to a population that is increasingly racially, ethnically, and linguistically diverse, especially within its school age population. Yet, North Carolina’s educator workforce has been unable to match this rich diversity. Recognizing the positive impact of diverse educators on all students, and especially students of color, Governor Roy Cooper signed Executive Order no. 113 establishing the Developing a Representative and Inclusive Vision for Education (DRIVE) Task Force. This body is charged with assessing North Carolina’s progress on creating and sustaining a diverse educator workforce and developing a plan to strengthen and coordinate state efforts in this space.
The Task Force convened five times throughout 2020 to better understand the current and historical state of educator diversity in North Carolina, as well as issues related to the recruitment, preparation, support, and retention of racially, ethnically, and linguistically diverse educators. In addition, the Task Force held several statewide stakeholder focus groups to better understand challenges and opportunities for this work across the educator pipeline.
TASK FORCE RECOMMENDATIONSThe following recommendations and strategies were created by the Task Force based on a state and national landscape analysis of efforts in this space, presentations by resource experts shared at the five Task Force meetings, information collected in subcommittee and focus group meetings, and survey responses from Task Force members.
Offer affordable postsecondary access through scholarships, loan forgiveness, and tuition reimbursement programs to encourage diverse people to become teachers..
Expand and develop entry points into the educator pipeline that are based on models with proven success in recruiting racially, ethnically, and linguistically diverse educators.
Embed diversity goals into key performance indicators for schools and districts across the state.
Provide sustainable investments in educator preparation programs at North Carolina’s Historically Minority Serving Institutions to elevate and build capacity of these institutions to increase their impact as leaders in equity-minded educator preparation.
Adopt evidence-based elements of successful national residency models across the state’s educator preparation programs.
Revise the North Carolina Professional Teaching Standards to directly incorporate anti-racist, anti-bias, culturally responsive and sustaining pedagogy and require Educator Preparation Programs (EPPs) to report how they incorporate these proficiencies across their course offerings and programming.
Invest in state- and district-level initiatives that increase the sustainability of the profession by strengthening support networks for educators of color and providing professional development that strengthens practice and fosters inclusive school environments.
Develop and sustain pathways for advancement that are tailored to the needs of educators of color.
Release an annual statewide Educator Diversity Report that tracks North Carolina’s progress in developing and sustaining a representative educator workforce.
Establish a body to monitor North Carolina’s progress towards implementation of the Task Force’s recommendations.
Educators
Students
STUDENT AND EDUCATOR DIVERSITY IN NORTH CAROLINA PUBLIC SCHOOLS, 2018-19
Source: The Hunt Institute based on data from the Department of Public Instruction.

The accompanying report provides additional details around these recommendations, as well as 46 strategies the state can pursue to increase the racial, ethnic, and linguistic diversity of its educator workforce. Key stakeholders, funding opportunities, and state assets that can be utilized to support in these efforts are interwoven throughout the report.
SUGGESTED PERFORMANCE INDICATORS Developing a more representative educator workforce that mirrors the diversity of North Carolina’s student body will require progress over an extended period. The Task Force proposes four performance indicators to evaluate the state’s progress in increasing the diversity of its educator workforce. These indicators are aligned to four key points in the educator pipeline and allow for measured annual progress across the pipeline. Tracking these indicators will provide state and local leaders with a means to measure progress on achieving parity between the racial and ethnic makeup of North Carolina’s student and teacher populations.
A CALL TO ACTIONIt is the intention of the DRIVE Task Force that this report be viewed not simply as a suggestion for improvement and systemic change, but a call to action. Efforts to increase the diversity of the educator workforce are a critical element of North Carolina’s larger mission to improve academic outcomes for all students and embed equity in practices across the education continuum, and will require financial and human capital investment at the state, institutional, district, community, and school level. Policymakers, education leaders, and other stakeholders should be steadfast in their commitment to this vision of continual improvement and thoughtful as to how needs and assets may differ across the state. The Task Force looks forward to continuing this meaningful dialogue by merging traditional success with innovative ideas and collaborative accountability for this vital effort.
North Carolina Educator Diversity Performance Indicators
01. Increase the number of educators of color admitted in the state’s educator preparation pathways (e.g., traditional four-year preparation, residency pathways, etc.) by at least 15 percent each year.
02. Increase the cohort completion rate of preservice educators of color to at least 80 percent across all preparation programs and pathways.
03. Ensure that at least 80 percent of completers of color across educator preparation pathways pass the licensure exams required to receive a Continuing Professional License (CPL) on their first attempt.
04. Retain at least 95 percent of the state’s educators of color each year.

4
DRIVE TASK FORCE FINAL REPORT | A Note on Language and Inclusion
A Note on Language and Inclusion
The ongoing reflection and discourse around language related to concepts of diversity, equity and inclusion necessitates frequent evolution and revisions of commonly used terms. Recognizing the importance of norming terminology for the work of the DRIVE Task Force, this body has adopted the following common definitions to use as a reference, and to provide basic working definitions to help spur conversations in this space. Additional information regarding language can be found in Appendix B.
Educators - For the purposes of this report, the terms educators and teachers will be used interchangeably. In instances in which the Task Force considers other professionals in the education space, including administrators, school counselors, paraprofessionals, teacher assistants, or other support staff, they will be referred to using their appropriate roles.
Diversity - Diversity refers to the wide variety of shared and different personal and group characteristics among human beings. Diversity includes many characteristics that may be visible such as race, gender, and age, and it also includes less obvious characteristics like personality style, ethnicity, ability, education, religion, job function, life experience, lifestyle, sexual orientation, gender identity, geography, regional differences, work experience, and family situation that make us similar to, and different from, one another.1 For the purposes of this report, diversity will specifically refer to the racial and ethnic diversity of educators.
Race - A social construction invented and perpetuated by society used to sort and categorize people based on phenotype or observable characteristics or traits.2
Ethnicity - An ethnic group or ethnicity is a category of people who identify with each other based on similarities, such as common ancestral, linguistic, social, cultural, or national experiences. Examples of ethnic identities are Russian, Cambodian, Ethiopian, Finnish, Mexican, German, etc.3
For the purposes of this report, racial and ethnic diversity will refer to the following race and ethnicity groups:
g American Indian and Alaska Native
g Asian and Pacific Islander
g Black or African American (Recognizing that many Black immigrant communities do not identify as African American, the Task Force will primarily use the term “Black”)
g Hispanic or Latino/a of any race
g Two or more races
g Unknown race and ethnicity
While Executive Order 113 limits the focus of the DRIVE Task Force to racial and ethnic diversity, the DRIVE Task Force recognizes the importance of many other forms of diversity within the educator workforce including gender identity, sexual orientation, disability status, religion, and factors related to income level.
01 Adapted from the UMass Lowell Office of Multicultural Affairs’ Diversity and social justice: A glossary of working definitions.02 Adapted from the Minnesota State Colleges and Universities Office of Equity and Inclusion’s Equity and Inclusion Glossary.03 Ibid.
5
DRIVE TASK FORCE FINAL REPORT | Task Force Overview
Task Force Overview
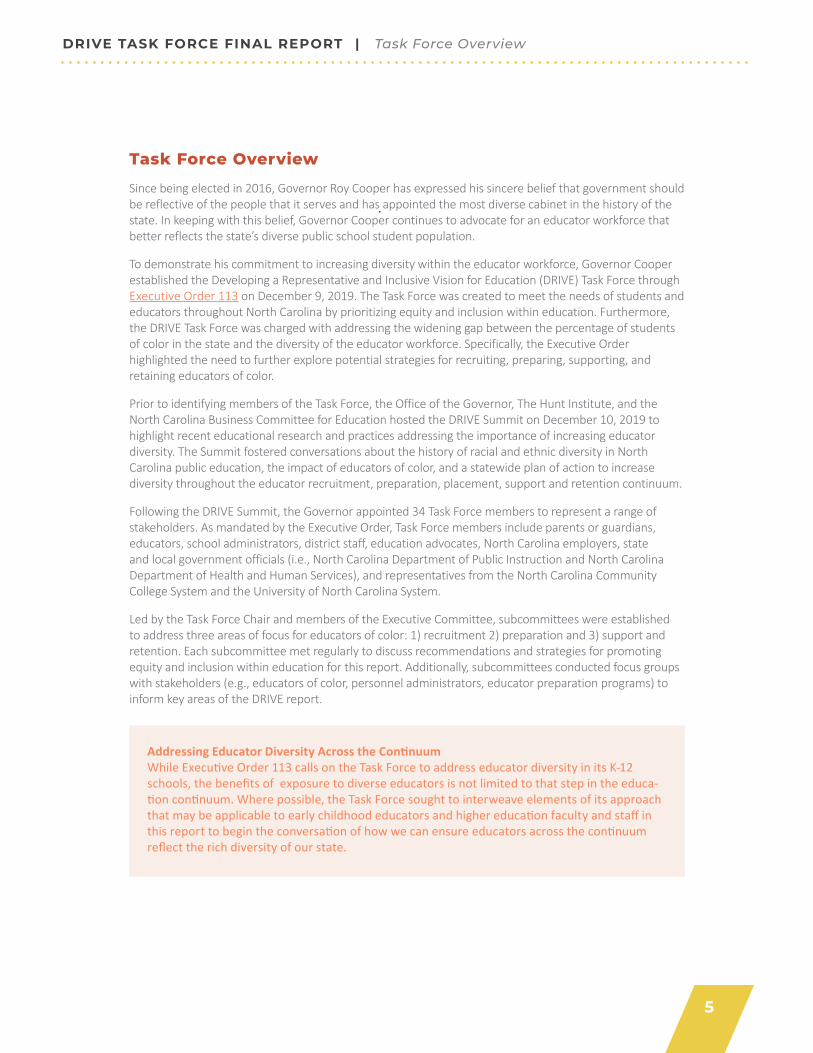
Since being elected in 2016, Governor Roy Cooper has expressed his sincere belief that government should be reflective of the people that it serves and has appointed the most diverse cabinet in the history of the state. In keeping with this belief, Governor Cooper continues to advocate for an educator workforce that better reflects the state’s diverse public school student population.
To demonstrate his commitment to increasing diversity within the educator workforce, Governor Cooper established the Developing a Representative and Inclusive Vision for Education (DRIVE) Task Force through Executive Order 113 on December 9, 2019. The Task Force was created to meet the needs of students and educators throughout North Carolina by prioritizing equity and inclusion within education. Furthermore, the DRIVE Task Force was charged with addressing the widening gap between the percentage of students of color in the state and the diversity of the educator workforce. Specifically, the Executive Order highlighted the need to further explore potential strategies for recruiting, preparing, supporting, and retaining educators of color.
Prior to identifying members of the Task Force, the Office of the Governor, The Hunt Institute, and the North Carolina Business Committee for Education hosted the DRIVE Summit on December 10, 2019 to highlight recent educational research and practices addressing the importance of increasing educator diversity. The Summit fostered conversations about the history of racial and ethnic diversity in North Carolina public education, the impact of educators of color, and a statewide plan of action to increase diversity throughout the educator recruitment, preparation, placement, support and retention continuum.
Following the DRIVE Summit, the Governor appointed 34 Task Force members to represent a range of stakeholders. As mandated by the Executive Order, Task Force members include parents or guardians, educators, school administrators, district staff, education advocates, North Carolina employers, state and local government officials (i.e., North Carolina Department of Public Instruction and North Carolina Department of Health and Human Services), and representatives from the North Carolina Community College System and the University of North Carolina System.
Led by the Task Force Chair and members of the Executive Committee, subcommittees were established to address three areas of focus for educators of color: 1) recruitment 2) preparation and 3) support and retention. Each subcommittee met regularly to discuss recommendations and strategies for promoting equity and inclusion within education for this report. Additionally, subcommittees conducted focus groups with stakeholders (e.g., educators of color, personnel administrators, educator preparation programs) to inform key areas of the DRIVE report.
Addressing Educator Diversity Across the Continuum While Executive Order 113 calls on the Task Force to address educator diversity in its K-12 schools, the benefits of exposure to diverse educators is not limited to that step in the educa-tion continuum. Where possible, the Task Force sought to interweave elements of its approach that may be applicable to early childhood educators and higher education faculty and staff in this report to begin the conversation of how we can ensure educators across the continuum reflect the rich diversity of our state.

6
DRIVE TASK FORCE FINAL REPORT | The Landscape
The Landscape: The Racial and Ethnic Diversity of North Carolina’s Educator Workforce
NORTH CAROLINA’S INCREASINGLY DIVERSE POPULATIONIn June of 2020, the U.S. Census Bureau released national and state-level projections of race-ethnic population estimates in advance of the 2020 census. These data indicate that the United States is not only growing increasingly diverse, but also that it is doing so faster than initially predicted.
Between 2010 and 2019, the white population share in North Carolina declined from 65.4 percent to 62.6 percent, while the Hispanic/Latino and Asiav/Pacific Islander populations increased, and the African American and American Indian/Alaska Native population stayed relatively constant. By 2048, experts predict that North Carolina’s population will become “majority-minority.”
North Carolina’s population under the age of 18 is even more diverse, with the white population share falling by over four percent over the last decade. The most significant gain among the under-18 population is among the Hispanic/Latino population, whose share has increased by nearly five percent. It is important to note that the increased diversity of North Carolina’s population is not evenly distributed. Counties with the highest proportion of white residents are overwhelmingly in the western part of the state, while urban centers and counties in the eastern part of the state typically see larger proportions of communities of color.
The increasing diversity of North Carolina’s population, especially among school-aged students, underscores the need for more educators of color and provides a sense of urgency to improve recruitment and preparation given that the pool of potential educators of color is increasing.
STUDENT AND TEACHER DEMOGRAPHICSIn the 2005-06 school year, 43 percent of all students enrolled in NC public schools identified as students of color, while 17 percent of educators identified as people of color.1 By the 2015-16 school year, the state's public school student population became “majority-minority” for the first time as the number of students of color exceeded the number of white students. However, this change in the makeup of the student population has not been reflected in the teaching workforce. Data from the 2018-19 school year indicate that while 53 percent of students are nonwhite, this is true of only 21 percent of educators.2
0%
10%
20%
30%
40%
50%
60%
70%
80%
90%
100%
2010 2019 2010 2019
45.1%49.4%
62.6%65.4%
16.9%
18.5%
21.4%21.3%
1.4%
1.5%
1.1%1.1%
2.6%
2%
3.2%2.3%
3.6%
3%
2%1.6%
30.4%25.6%
9.8%8.4%
Hispanic or La6no Two or More RacesAsian/Pacific Islander American Indian/Alaska Na6veBlack or African American White
Total NC PopulaMon 17 or Under
Teachers
Students
0% 10% 20% 30% 40% 50% 60% 70% 80% 90% 100%
4%47%
79%
5E-0318%
3%
25%
15%
Black or African American American Indian Asian Hispanic or LaMno NaMve Hawaiian/Pacific Islander UnreportedWhite Two or More
93%
5%
Black or African-AmericanAmerican IndianAsian/Pacific IslanderHispanic or LaMnoWhite
47%53%
People of Color White
79%21%
58%42%68%
32%68%
32%
Source
0%
10%
20%
30%
40%
50%
60%
70%
80%
90%
100%
2010 2019 2010 2019
45.1%49.4%
62.6%65.4%
16.9%
18.5%
21.4%21.3%
1.4%
1.5%
1.1%1.1%
2.6%
2%
3.2%2.3%
3.6%
3%
2%1.6%
30.4%25.6%
9.8%8.4%
Hispanic or La6no Two or More RacesAsian/Pacific Islander American Indian/Alaska Na6veBlack or African American White
Total NC PopulaMon 17 or Under
Teachers
Students
0% 10% 20% 30% 40% 50% 60% 70% 80% 90% 100%
4%47%
79%
5E-0318%
3%
25%
15%
Black or African American American Indian Asian Hispanic or LaMno NaMve Hawaiian/Pacific Islander UnreportedWhite Two or More
93%
5%
Black or African-AmericanAmerican IndianAsian/Pacific IslanderHispanic or LaMnoWhite
47%53%
People of Color White
79%21%
58%42%68%
32%68%
32%
FIGURE 1 | RACE-ETHNIC PROFILE FOR TOTAL NORTH CAROLINA POPULATION; 2010, 2019
0%
10%
20%
30%
40%
50%
60%
70%
80%
90%
100%
2010 2019 2010 2019
45.1%49.4%
62.6%65.4%
16.9%
18.5%
21.4%21.3%
1.4%
1.5%
1.1%1.1%
2.6%
2%
3.2%2.3%
3.6%
3%
2%1.6%
30.4%25.6%
9.8%8.4%
Hispanic or La6no Two or More RacesAsian/Pacific Islander American Indian/Alaska Na6veBlack or African American White
Total NC PopulaMon 17 or Under
Teachers
Students
0% 10% 20% 30% 40% 50% 60% 70% 80% 90% 100%
4%47%
79%
5E-0318%
3%
25%
15%
Black or African American American Indian Asian Hispanic or LaMno NaMve Hawaiian/Pacific Islander UnreportedWhite Two or More
93%
5%
Black or African-AmericanAmerican IndianAsian/Pacific IslanderHispanic or LaMnoWhite
47%53%
People of Color White
79%21%
58%42%68%
32%68%
32%
FIGURE 2 | STUDENT AND EDUCATOR DIVERSITY IN NORTH CAROLINA PUBLIC SCHOOLS, 2018-19
FIGURE 3 | DEMOGRAPHICS OF NORTH CAROLINA STUDENTS AND PUBLIC SCHOOL PERSONNEL, 2018-19
0%
10%
20%
30%
40%
50%
60%
70%
80%
90%
100%
2010 2019 2010 2019
45.1%49.4%
62.6%65.4%
16.9%
18.5%
21.4%21.3%
1.4%
1.5%
1.1%1.1%
2.6%
2%
3.2%2.3%
3.6%
3%
2%1.6%
30.4%25.6%
9.8%8.4%
Hispanic or La6no Two or More RacesAsian/Pacific Islander American Indian/Alaska Na6veBlack or African American White
Total NC PopulaMon 17 or Under
Teachers
Students
0% 10% 20% 30% 40% 50% 60% 70% 80% 90% 100%
4%47%
79%
5E-0318%
3%
25%
15%
Black or African American American Indian Asian Hispanic or LaMno NaMve Hawaiian/Pacific Islander UnreportedWhite Two or More
93%
5%
Black or African-AmericanAmerican IndianAsian/Pacific IslanderHispanic or LaMnoWhite
47%53%
People of Color White
79%21%
58%42%68%
32%68%
32%
STUDENTS TEACHERS SCHOOL-BASED ADMINISTRATORS
TEACHER ASSISTANTS SCHOOL COUNSELORS
Source: The Hunt Institute based on data from the Department of Public Instruction.
Source
0%
10%
20%
30%
40%
50%
60%
70%
80%
90%
100%
2010 2019 2010 2019
45.1%49.4%
62.6%65.4%
16.9%
18.5%
21.4%21.3%
1.4%
1.5%
1.1%1.1%
2.6%
2%
3.2%2.3%
3.6%
3%
2%1.6%
30.4%25.6%
9.8%8.4%
Hispanic or La6no Two or More RacesAsian/Pacific Islander American Indian/Alaska Na6veBlack or African American White
Total NC PopulaMon 17 or Under
Teachers
Students
0% 10% 20% 30% 40% 50% 60% 70% 80% 90% 100%
4%47%
79%
5E-0318%
3%
25%
15%
Black or African American American Indian Asian Hispanic or LaMno NaMve Hawaiian/Pacific Islander UnreportedWhite Two or More
93%
5%
Black or African-AmericanAmerican IndianAsian/Pacific IslanderHispanic or LaMnoWhite
47%53%
People of Color White
79%21%
58%42%68%
32%68%
32%
1% <1%
3%
1%1%1%

7
DRIVE TASK FORCE FINAL REPORT | The Landscape
In 2018-19, all of North Carolina’s 115 local education agencies (LEAs) had a greater share of students of color than educators of color, and for over three quarters of districts, this difference was greater than 20 percentage points. Two LEAs employed zero educators of color, and 23 LEAs did not employ a principal or assistant principal of color. Only eight LEAs in North Carolina had a higher percentage of principals of color than students of color.3
The Educator PipelineIn considering the diversity of North Carolina’s educator workforce, it is important to take a closer look at the traditional teacher pipeline, which produces a majority of teacher candidates in North Carolina. Beginning with teacher recruitment programs, some starting in high school, this pipeline includes enrollment at an institution of higher education (IHE), admittance and completion at an Educator Preparation Program (EPP), and placement in a teaching position. An analysis of the demographic trends across North Carolina’s educator pipeline for the graduating high school class of 2012 (Appendix F) indicates that the gap between potential teachers of color and candidates of color sees its largest increase with enrollment in educator preparation programs, a gap of 46 percent. It is important to note, however, that educators of color make up a larger share of pre-service educators enrolled in alternative certification programs than traditional IHE-based programs, which is not addressed in this analysis. Despite admitting a larger share of pre-service educators of color, North Carolina's alternative preparation programs produced 12 percent fewer graduates than the state’s traditional IHE-based programs in 2018-19.4
Recruiting a diverse pool of applicants has proven challenging for EPPs across the country. Within undergraduate IHEs nationally, colleges of education are less diverse than other departments.5 This trend holds true in North Carolina, where 81 percent of students enrolled in EPPs in 2018 were white and 86 percent of those who were licensed through an EPP that year were white.6 Further, from 2014-2018 North Carolina’s traditional IHE-based EPPs saw an 11 percent decrease in the total number of students completing their programs, marking a concerning trend in the state’s ability to produce the necessary teacher candidates to develop a representative educator workforce. Alternative certification programs, which allow professionals with degrees in non-teaching fields to become certified through a condensed, intensive training process, are more diverse, with prospective educators of color constituting 45 percent of those enrolled. However, 70 percent of all students enrolled are white across North Carolina’s various educator preparation pathways.
Teacher Preparation at North Carolina's Historically Minority Serving Institutions
North Carolina is home to 11 accredited historically minority serving institutions (HMSIs), 10 of which produce teachers through an approved EPP including Bennett College, Elizabeth City State University, Fayetteville State University, Livingstone College, NC A&T State University, NC Central University, St. Augustine’s University, Shaw University, UNC-Pembroke, and Winston-Salem State University. For decades, these institutions have been a driving force in increasing postsecondary access for students of color and preparing racially, ethnically, and linguistically diverse educators. Despite enrolling only 11.9 percent of all students enrolled in the North Carolina’s traditional IHE-based EPPs in 2017, the state’s HMSIs accounted for nearly a third of the enrollment of all pre-service educators of color. More than a quarter of students of color who graduated from this cohort in 2019 were prepared by one of these nine institutions.7 Our state’s Historically Black Colleges and Universities (HBCUs) have traditionally been the primary conduit through which North Carolina’s educators of color emerge, and throughout much of our state's history were the only institutions preparing educators of color. The institutional knowledge and resources of these colleges and universities will be instrumental in providing best practices to increase recruitment and enhance preparation across all EPPs.
North Carolina Teaching Fellows
From 1986 to 2015, the North Carolina Teaching Fellows program offered scholarships for students to attend an approved North Carolina university to pursue a degree in education in exchange for teaching in the state for four years. The program included a goal that 20 percent of scholarships would be awarded to candidates of color. However, over the near 30-year life of the program, only 17 percent of recipients were non-white. The current iteration of the Teaching Fellows program, relaunched in 2017 with a focus on recruiting teachers into STEM and special education, does not include a goal for diverse recipients and does not partner with any of the state’s ten HMSIs who offer degrees in education. Participants in the program continue to be overwhelmingly white and female.
Applicants AwardeesBlack or
African American 21 8
Hispanic or Latino 14 8
Asian/Pacific Islander 9 5
Other 8 4
White 167 108
FIGURE 5 | DEMOGRAPHIC CHARACTERISTICS OF NORTH CAROLINA TEACHING FELLOWS 2018-19
Source
Race 4-Year IHE Preparation
Alternative Preparation
White 81% 55%
Black or African American 12% 36%
Hispanic or Latino 3% 3%
Asian/ Pacific Islander 1% 1%
American Indian <1% 2%
Two or more Races 2% 2%
FIGURE 4 | DEMOGRAPHIC CHARACTERISTICS BY EDUCATOR PREPARATION PATHWAY IN NC, 2018
Source: The Hunt Institute based on data from the Department of Public Instruction.

8
DRIVE TASK FORCE FINAL REPORT | The Landscape
Teacher Mobility Both nationally and in North Carolina, school districts struggle to support and retain educators of color. From 2004 to 2014, the retention rate among Black educators in elementary and middle schools in North Carolina was nearly four percentage points lower than that of white educators.8
Overall, 17 percent of North Carolina’s educators of color were mobile (i.e., left their school, the state, or the profession) between the 2017-18 and 2018-19 school years, a rate that is nearly three percentage points higher than their white peers. Among educators of color, Black teachers were the most likely to be mobile, with nearly one-fifth of all Black teachers leaving their school in the summer of 2018. Within the total population of each demographic group, Black and Hispanic teachers were the most likely to leave North Carolina classrooms altogether, with 6.1 percent and 6.3 percent of such teachers departing to leave the profession or teach in another state, respectively. This is only slightly higher than white teachers, 6.1 of whom left the profession that year.
However, among mobile teachers, American Indian and Black teachers were the least likely of all racial and ethnic groups to leave North Carolina’s classrooms. Mobile Hispanic and Asian/Pacific Islander teachers were the most likely teachers to choose not to return to a North Carolina classroom in 2018-19.
National Board-Certified TeachersOffered by the National Board for Professional Teaching Standards, the National Board Certification is a rigorous process in which an individual’s teaching practice is evaluated through performance-based assessment. In North Carolina, interested teachers can apply for a state-subsidized loan to pay for the program application process, and upon completion of the program are eligible for an annual 12 percent pay differential. North Carolina leads the nation with 22,635 National Board-Certified teachers, which makes up nearly 18 percent of all National Board-Certified teachers nationwide. Among these certified individuals, approximately 9,300 of them are currently in North Carolina's public schools. In the spring of 2020, the Center for Educator Recruitment, Retention, and Advancement released a study analyzing the impact of National Board Certification on teacher retention in South Carolina. This study found that turnover rates among National Board-Certified teachers were nearly one-third of that of an average teacher over a five-year period.
Despite the impressive overall number of National Board-Certified teachers in North Carolina classrooms, educators of color are significantly underrepresented within this population, with educators of color making up less than seven percent of the state's National Board-Certified teachers despite constituting 21 percent of the teacher population in 2018-19.
Remained in Same School
Mobile EducatorsDifferent School,
Same LEADifferent School,
Different LEA Left Teaching or State
Black or African American 81.6% 7.6% 4.8% 6.1%
White 85.4% 5.2% 3.4% 6.0%
Hispanic or Latino 86.3% 5% 2.3% 6.3%
Asian/Pacific Islander 90.6% 4% 0.8% 4.6%
American Indian 92.8% 4.4% 0.8% 2%
Unreported 90.1% 4.8% 0% 5%
FIGURE 6 | EDUCATOR MOBILITY BY RACE AND ETHNICITY IN THE SUMMER OF 2018
Source: The Hunt Institute based on data from the Department of Public Instruction.
Educator Diversity Across the ContinuumThere is significant publicly available data about the race, ethnicity, and experience of North Carolina’s K-12 educators; however, available data around the state’s early childhood and higher education workforces are not as comprehensive or easily accessible. Assessing the diversity of the early childhood workforce will require systematic data collection to include child care providers and early childhood educators serving in home and center-based child care settings, Smart Start, Head Start, and NC Pre-K. Similarly, understanding the landscape of higher education faculty diversity will require data collection across the state's public and private two- and four-year institutions. These data should be used to inform opportunities to strengthen the recruitment, preparation, retention and support of a racially, ethnically, and linguistically diverse educators across the education continuum.
0%
10%
20%
30%
40%
50%
60%
70%
80%
90%
100%
2010 2019 2010 2019
45.1%49.4%
62.6%65.4%
16.9%
18.5%
21.4%21.3%
1.4%
1.5%
1.1%1.1%
2.6%
2%
3.2%2.3%
3.6%
3%
2%1.6%
30.4%25.6%
9.8%8.4%
Hispanic or La6no Two or More RacesAsian/Pacific Islander American Indian/Alaska Na6veBlack or African American White
Total NC PopulaMon 17 or Under
Teachers
Students
0% 10% 20% 30% 40% 50% 60% 70% 80% 90% 100%
4%47%
79%
5E-0318%
3%
25%
15%
Black or African American American Indian Asian Hispanic or LaMno NaMve Hawaiian/Pacific Islander UnreportedWhite Two or More
93%
5%
Black or African-AmericanAmerican IndianAsian/Pacific IslanderHispanic or LaMnoWhite
47%53%
People of Color White
79%21%
58%42%68%
32%68%
32%
FIGURE 7 | NATIONAL BOARD CERTIFICATION BY RACE AND ETHNICITY IN NORTH CAROLINA, 2018-19
Source: The Hunt Institute based on data from the Department of Public Instruction.
1% <1%1%
9
DRIVE TASK FORCE FINAL REPORT | The Imperative
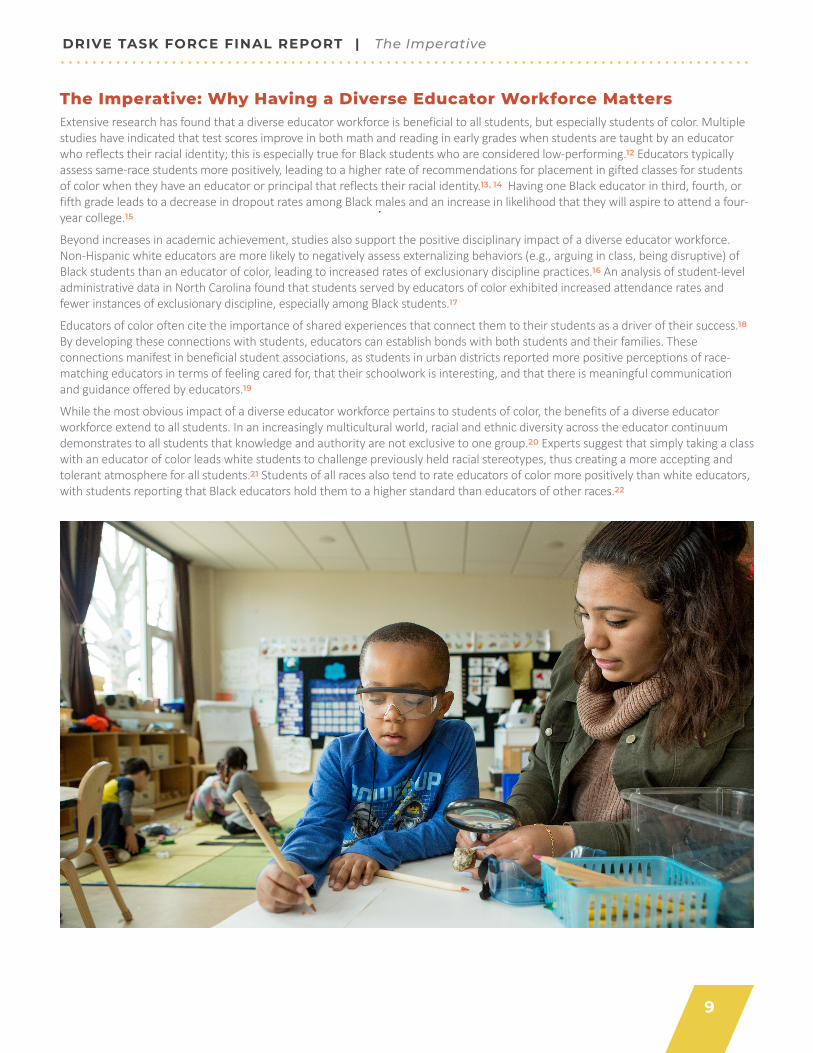
The Imperative: Why Having a Diverse Educator Workforce Matters Extensive research has found that a diverse educator workforce is beneficial to all students, but especially students of color. Multiple studies have indicated that test scores improve in both math and reading in early grades when students are taught by an educator who reflects their racial identity; this is especially true for Black students who are considered low-performing.12 Educators typically assess same-race students more positively, leading to a higher rate of recommendations for placement in gifted classes for students of color when they have an educator or principal that reflects their racial identity.13, 14 Having one Black educator in third, fourth, or fifth grade leads to a decrease in dropout rates among Black males and an increase in likelihood that they will aspire to attend a four-year college.15
Beyond increases in academic achievement, studies also support the positive disciplinary impact of a diverse educator workforce. Non-Hispanic white educators are more likely to negatively assess externalizing behaviors (e.g., arguing in class, being disruptive) of Black students than an educator of color, leading to increased rates of exclusionary discipline practices.16 An analysis of student-level administrative data in North Carolina found that students served by educators of color exhibited increased attendance rates and fewer instances of exclusionary discipline, especially among Black students.17
Educators of color often cite the importance of shared experiences that connect them to their students as a driver of their success.18 By developing these connections with students, educators can establish bonds with both students and their families. These connections manifest in beneficial student associations, as students in urban districts reported more positive perceptions of race-matching educators in terms of feeling cared for, that their schoolwork is interesting, and that there is meaningful communication and guidance offered by educators.19
While the most obvious impact of a diverse educator workforce pertains to students of color, the benefits of a diverse educator workforce extend to all students. In an increasingly multicultural world, racial and ethnic diversity across the educator continuum demonstrates to all students that knowledge and authority are not exclusive to one group.20 Experts suggest that simply taking a class with an educator of color leads white students to challenge previously held racial stereotypes, thus creating a more accepting and tolerant atmosphere for all students.21 Students of all races also tend to rate educators of color more positively than white educators, with students reporting that Black educators hold them to a higher standard than educators of other races.22

10
DRIVE TASK FORCE FINAL REPORT | The Challenge
The Challenge: Barriers to Creating and Sustaining a Diverse Educator WorkforceThe path to becoming a teacher in North Carolina is quite challenging. This is especially true for educators of color who face a number of additional barriers that make the profession inaccessible or unsustainable. Only by understanding and addressing these barriers to entry, licensure, and sustainability can North Carolina develop the high-quality, high-retention preparation pathways necessary to develop a racially, ethnically, and linguistically diverse educator workforce.
POSTSECONDARY ACCESS AND PREPAREDNESSProspective educators of color often encounter their first barrier to entering the profession before graduating from high school. Students of color are more likely to attend schools that are underfunded, low-performing, and staffed with less effective educators, resulting in a lower likelihood that students of color will matriculate into postsecondary institutions. Enrollment and graduation rates for postsecondary education are significantly higher for white students than other racial groups. Once they make it to college, low-income students and students of color are more likely to be enrolled in remedial courses, which on average increase the time it takes to earn a degree (and thus the cost of the degree) and decreases likelihood of completion.23 Placement in these courses may further feelings of isolation experienced by students of color, creating additional barriers for postsecondary completion. Additionally, students from low performing schools are more likely to adopt a negative association with education from their own K-12 experience, leading them to avoid a career in teaching.24 For many highly qualified candidates, teaching simply lacks the prestige of other career opportunities available to them.
STUDENT LOAN DEBTStudent loan debt represents a hurdle for prospective educators of color as they are more likely to take out federal student loans to finance their undergraduate and graduate education. Black students in particular are likely to owe significantly more in college debt than their peers. Educators of color often lack the generational wealth afforded to their white colleagues, and thus face an uphill battle in paying back student loan debt. This generational wealth gap exacerbates the issue for those who shoulder additional responsibility of supporting family members.
BARRIERS AT INSTITUTIONS OF HIGHER EDUCATIONAs currently designed, educator preparation programs provide one of the most significant barriers for enrolling and graduating pre-service educators of color. Much of the conversation around success in increasing educator diversity is dominated by the overall enrollment and completion data of each cohort. This approach obscures the larger issue of how these institutions are addressing the systemic and institutional inequities within them that disadvantage aspiring educators of color. This can lead to hollow recognition for institutions that are not enacting policies designed to better prepare and sustain these individuals.25 Educator preparation programs must strive to create more inclusive spaces that work to de-center whiteness by critically examining their current climate and culture and revising policies that perpetuate white supremacist culture in K-12 and higher education.26
Teacher preparation does not exist in a race-neutral context.27 Often teacher candidates of color are overburdened with the responsibility of helping their white peers confront their identities, stereotypes, and biases. This is also true for faculty of color working in programs that fail to intentionally address the issue of race.28 In addition, aspiring educators of color face recurring microaggressions from peers, faculty, and institutional policies that can instill feelings of self-doubt, isolation, and discouragement.29 EPPs must critically reflect upon ways their program may contribute to upholding structural racism and develop policies that create an anti-racist and anti-biased culture. This includes recognizing the unique value and perspectives brought by students and faculty of color, actively working to increase their presence within the program, and affirming their identity through culturally responsive curricula and pedagogical approaches.
EDUCATOR CERTIFICATION EXAMS One of the most frequently cited barriers for aspiring educators of color are educator certification exams. Due to unequal access to foundational knowledge and lack of exposure to test-taking strategies, which starts in the K-12 setting, educators of color are at a disadvantage when taking educator licensing exams.30,31 Further, some have argued that cultural biases that are embedded in the assessments, as well as the cost of the test itself, create additional challenges for aspiring educators of color.32, 33
$0
$5,000
$10,000
$15,000
$20,000
$25,000
$30,000
2008 2012
White Black or African American Hispanic or La>no
Teachers
Students 50%
79%
4%17%
2%
26%
13%
American Indian Asian Black Hispanic MultiracialOther White Unidentified
$0
$10,000
$20,000
$30,000
$40,000
White2008 2012
$13,662$16,158
Black or African American
2008 2012
$26,405$22,699
Hispanic or La>no
2008 2012
$13,119$15,932
All Graduates2008 2012
$14,221$16,298
FIGURE 8 | MEDIAN STUDENT LOAN DEBT DIFFERENCE BY RACE AMONG STUDENTS WHO TRAINED AS EDUCATORS, 2008-2012Student loan debt for white and Hispanic students who graduated with a degree in education in 2008 and applied to teach was lower four years after graduation; however, their Black peers saw an increase in loan debt over the same four year period, indicating that they were not making progress in paying off their student debt.
15.5% Decrease
16.3% Increase
17.7% Decrease
12.7% Decrease
Source
https://www.theatlantic.com/education/archive/2016/02/concentration-poverty-american-schools/471414/
https://www.theatlantic.com/education/archive/2016/02/concentration-poverty-american-schools/471414/

11
DRIVE TASK FORCE FINAL REPORT | The Challenge
In North Carolina, aspiring educators must pass (or place out of) the Praxis Core Academic Skills for Educators to enroll in an EPP and later pass the Praxis Subject Assessment to qualify for a license. Nationally, and in North Carolina, both Black and Hispanic candidates for certification lag behind their white counterparts in pass rates, effectively barring many of them from a career in teaching. For example, a national analysis found that Black candidates are approximately half as likely to pass the elementary licensing exam as their white peers, and just over half of all Hispanic educators who take the exam earn a passing score.34 For North Carolina specific testing data, please see Appendix H.
With the exception of math educators, evidence suggests that educator licensure exams are a poor predictor for educator quality among all educators.35 Yet states have sought to increase the minimum passing score for such exams with the intention of increasing the quality of the educator workforce. Students of color more consistently experience increased levels of achievement with race-matching educators, with this effect being most prominent for those who are taught by Black educators that score relatively low on the licensing exam.36
THE INVISIBLE TAX Educators of color may find themselves compelled to serve in additional support roles outside the scope of their position as educators. For some, being an educator of color means you are expected to be the expert on all things related to cultural diversity. Bilingual educators often serve as a linguistic intermediary, translating official school documents and filling in as an interpreter for interactions with parents and families with no additional compensation.37 Moreover, male educators of color often assume a disciplinarian role due to the perception that they can better connect with particular students, especially Black males.38 Known as the “invisible tax,” this is a burden borne by teachers of color that leads to burnout and an early exit from the profession. These additional responsibilities increase the demand on educators’ time and energy, a common concern among those who exit the profession.
ISOLATION In effect, the lack of diversity in the educator workforce perpetuates racial, ethnic, and linguistic homogeneity within the teaching population, as educators of color who serve in predominantly white schools are left feeling isolated in a system dominated by their white peers. Minneapolis Public Schools’ 2018 Equity and Diversity Impact Assessment found that teachers of color in racially isolated spaces felt vulnerable, excluded, and unwelcome. Without fellow staff or school leaders who share their racial and ethnic identity, these educators often lack a professional peer support network who can empathize with their experiences and share best practices in navigating these spaces. These feelings of isolation are exacerbated when educators of color are working in a toxic or unsupportive work environment. This isolation can expand beyond the school community when teachers are serving in rural areas that may be in less diverse communities and have housing shortages, transportation challenges, and limited access to amenities.
LACK OF LONG-TERM EARNING POTENTIAL Educators of color often lack the generational wealth afforded to their white colleagues, which, when coupled with a low salary compared to similarly credentialed professionals, leave educators of color to face an uphill battle in paying down student loan debt. This generational wealth gap exacerbates the issue for those who shoulder the additional responsibility of supporting family members. The limited long-term earning potential and higher chance of student debt may keep educators of color from entering and remaining in the profession.
INEFFECTIVE SCHOOL LEADERSHIP Across the United States, educators of color who exit the classroom and cite job dissatisfaction list frustration with school administration as the most frequent determinant in their departure. This is not unique to educators of color, as the lack of professional autonomy and faculty decision-making influence are cited as the most frequent motives for leaving the classroom among all educators. However, educators of color are more likely to be placed in schools that are designated as high need and may face organizational challenges like staffing limitations, insufficient funding, and increased demands for educator accountability. These additional stressors serve as drivers of dissatisfaction between educators and administrators, and lead to educator departure.39
BIAS AND DISCRIMINATION Qualitative studies examining the experiences of both Black and Hispanic educators found that educators of color reported facing discrimination and stereotyping in the workplace and felt undervalued by their white colleagues and broader school community. A May 2019 study of teacher evaluations in Michigan found that teachers of color in schools with predominantly white staff were more likely to receive lower evaluation scores than their white peers. In some cases, these challenges can preclude educators of color from opportunities for advancement when advanced teaching roles require minimum teacher evaluation scores.
Distinct Barriers for Early Childhood EducatorsIn addition to ensuring that K-12 students have access to racially, ethnically, and linguistically diverse educators, it is imperative that our youngest learners – from birth through kindergarten – also have access to diverse child care providers and early childhood educators. In 2019, 47 percent of North Carolinians age birth through age five were children of color. National estimates indicate that the early childhood workforce is more diverse than the K-12 workforce, with people of color making up 36 percent of center-based teaching staff and approximately 45 percent of home-based providers. While this is a higher percentage of providers and educators of color than we see in North Carolina’s K-12 schools, it must be acknowledged that low wages and limited access to health insurance impact the sustainability of careers for child care providers and early childhood educators.
DRIVE TASK FORCE FINAL REPORT | Performance Indicators
12
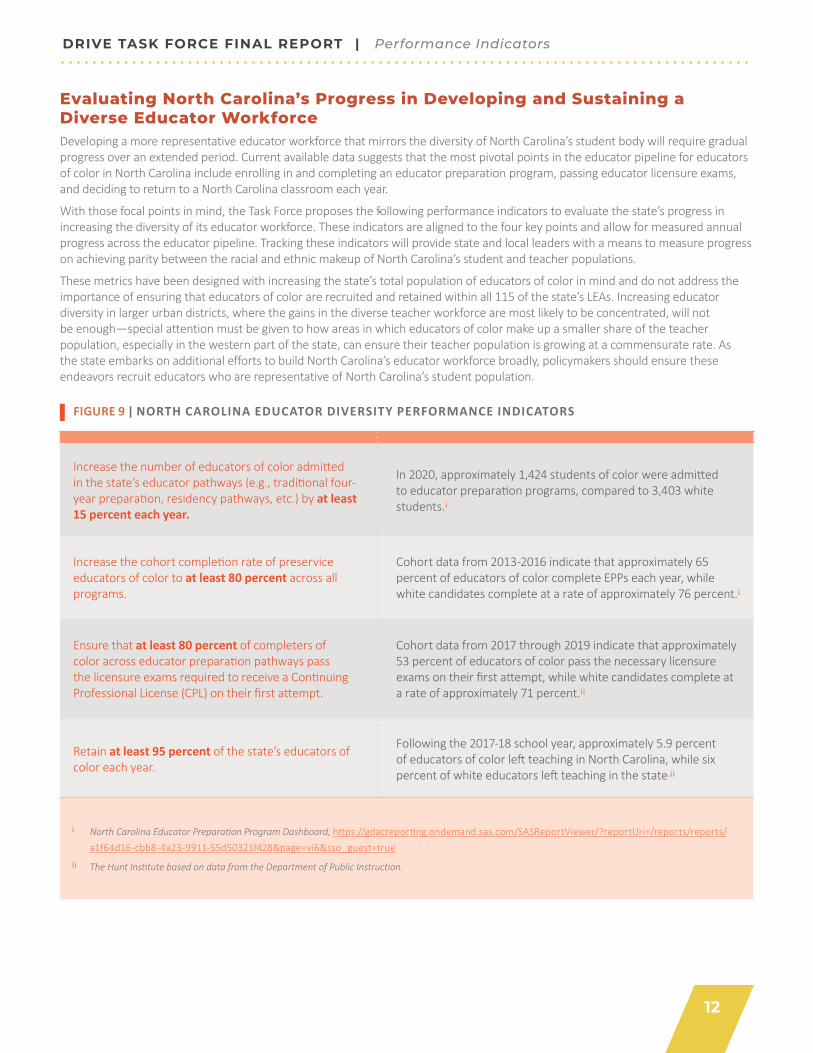
Evaluating North Carolina’s Progress in Developing and Sustaining a Diverse Educator Workforce Developing a more representative educator workforce that mirrors the diversity of North Carolina’s student body will require gradual progress over an extended period. Current available data suggests that the most pivotal points in the educator pipeline for educators of color in North Carolina include enrolling in and completing an educator preparation program, passing educator licensure exams, and deciding to return to a North Carolina classroom each year.
With those focal points in mind, the Task Force proposes the following performance indicators to evaluate the state’s progress in increasing the diversity of its educator workforce. These indicators are aligned to the four key points and allow for measured annual progress across the educator pipeline. Tracking these indicators will provide state and local leaders with a means to measure progress on achieving parity between the racial and ethnic makeup of North Carolina’s student and teacher populations.
These metrics have been designed with increasing the state’s total population of educators of color in mind and do not address the importance of ensuring that educators of color are recruited and retained within all 115 of the state’s LEAs. Increasing educator diversity in larger urban districts, where the gains in the diverse teacher workforce are most likely to be concentrated, will not be enough—special attention must be given to how areas in which educators of color make up a smaller share of the teacher population, especially in the western part of the state, can ensure their teacher population is growing at a commensurate rate. As the state embarks on additional efforts to build North Carolina’s educator workforce broadly, policymakers should ensure these endeavors recruit educators who are representative of North Carolina’s student population.
i North Carolina Educator Preparation Program Dashboard, https://gdacreporting.ondemand.sas.com/SASReportViewer/?reportUri=/reports/reports/a1f64d16-cbb8-4a23-9911-55d50321f428&page=vi6&sso_guest=true
ii The Hunt Institute based on data from the Department of Public Instruction.
Increase the number of educators of color admitted in the state’s educator pathways (e.g., traditional four-year preparation, residency pathways, etc.) by at least 15 percent each year.
In 2020, approximately 1,424 students of color were admitted to educator preparation programs, compared to 3,403 white students.i
Increase the cohort completion rate of preservice educators of color to at least 80 percent across all programs.
Cohort data from 2013-2016 indicate that approximately 65 percent of educators of color complete EPPs each year, while white candidates complete at a rate of approximately 76 percent.i
Ensure that at least 80 percent of completers of color across educator preparation pathways pass the licensure exams required to receive a Continuing Professional License (CPL) on their first attempt.
Cohort data from 2017 through 2019 indicate that approximately 53 percent of educators of color pass the necessary licensure exams on their first attempt, while white candidates complete at a rate of approximately 71 percent.ii
Retain at least 95 percent of the state’s educators of color each year.
Following the 2017-18 school year, approximately 5.9 percent of educators of color left teaching in North Carolina, while six percent of white educators left teaching in the state.ii
FIGURE 9 | NORTH CAROLINA EDUCATOR DIVERSITY PERFORMANCE INDICATORS

13
DRIVE TASK FORCE FINAL REPORT | Recommendations
DRIVE Task Force Recommendations to Increase the Racial, Ethnic, and Linguistic Diversity of North Carolina’s Educator Workforce
A Note Regarding the Development of the RecommendationsThe following recommendations and strategies were devised by the Task Force based on a state and national landscape analysis of efforts in this space, survey responses from Task Force members, information collected in subcommittee and focus group meetings, and resource expert presentations from the five Task Force meetings.
As part of the process, the Task Force sought to develop recommendations that addressed the root causes of North Carolina’s disproportionately white educator workforce while also avoiding being overly prescriptive as to afford policymakers and stakeholders the flexibility to implement the recommendations and strategies in a way that serves a diverse range of school, district, and state-level needs across capacity, funding, and investment. Throughout the recommendations and strategies, the Task Force sought to center its vision through the state’s Historically Minority Serving Institutions to capitalize on their established leadership in recruiting, preparing, and sustaining educators of color in North Carolina.
Increasing the racial, ethnic, and linguistic diversity of North Carolina's educator workforce will require significant investment on the part of the General Assembly, as well as dedicated funding at the local level. Additional funding sources, including federal funding streams, as well as opportunities for community, philanthropic, and private sector investments have been identified throughout the Task Force’s proposed recommendations and strategies. Additionally, future statewide investments in education should include specific investments in educator diversity.
04 These models will be referenced later in the strategies section of the report. 05 For decades, critics have argued that educator certification exams originated as an intentional effort to bar educators of color from the profession. These
exams continue to disproportionately limit aspiring educators of color pursuing a career in education.
Recruitment Preparation Support & Retention
01. Offer affordable postsecondary access through scholarships, loan forgiveness, and tuition reimbursement programs to address the disproportionate financial burden incurred by aspiring educators of color. Emphasis should be placed on those models that have been shown to effectively recruit, prepare, and sustain educators of color.4 (Stakeholders Responsible: Legislature, Department of Public Instruction, and District Leaders)
02. Expand and develop entry points into the educator pipeline that are based on models with proven success in recruiting racially, ethnically, and linguistically diverse educators. This can include Grow-Your-Own programs that recruit high school students, paraprofessionals, educational assistants, and other school/district staff, parents, career changers, and after-school program mentors into the educator pipeline. Such programs should:
g be designed with priority given to partnerships with the state’s HMSIs,
g hold the expressed purpose of increasing educator diversity, and
g address the systemic barriers to entry these educators face.
Development of these programs can be encouraged by offering grants for districts, or a consortium of districts, in collaboration with institutions of higher education. (Stakeholders Responsible: Legislature, Department of Public Instruction, Institutions of Higher Education, Educator Preparation Programs, and District Leaders)
03. Embed diversity goals into key performance indicators for schools and districts across the state to promote a statewide commitment to increasing the racial, ethnic, and linguistic diversity of the educator workforce. State guidance should be developed that informs district-level benchmarks to achieve those outcomes. These metrics should include efforts to increase the diversity of all educators, including administrators, counselors, and other support staff, and require annual state and district reports on their progress and action plans to drive their efforts. (Stakeholders Responsible: School, District, Department of Public Instruction, State Board of Education, and Legislative Action Item)
04. Provide sustainable investments in educator preparation programs at North Carolina’s Historically Minority Serving Institutions (HMSIs) to elevate and build capacity of these institutions to increase their impact as leaders in equity-minded educator preparation. (Stakeholders Responsible: Legislature and NC HMSIs)
These investments should be dedicated to:
g Building advancement and development infrastructure unique to Educator Preparation Programs that will generate funding streams that increase enrollment, persistence, completion, and licensure of diverse teacher candidates.
g Developing pipelines of educator preparation faculty and staff of color.
g Counteracting institutional biases and gatekeeping mechanisms, such as teacher licensure exams, that are rooted in historically exclusionary practices.5

14
DRIVE TASK FORCE FINAL REPORT | Recommendations
05. Adopt evidence-based elements of successful national residency models across the state’s educator preparation programs in order to strengthen preparation of pre-service educators of color. Examples of such models include the Boston Teacher Residency Program and the National Center for Teacher Residencies. (Stakeholders Responsible: Legislature, Department of Public Instruction, State Board of Education, and School and District Leaders)
This should include:
g Robust, year-long, paid clinical learning experiences (e.g., guided classroom observations, lesson studies, video analysis, coaching) designed to intentionally support candidate learning, practice, and reflection on culturally responsive and sustaining teaching and pedagogy before, and in addition to, student teaching.
g Tying compensation, in the form of a stipend or scholarship, with a commitment to teaching in North Carolina public schools.
g Intensive mentoring and coaching from diverse educators from varying school contexts.
g Professional learning community and supports including affinity groups.
g Comprehensive induction and supervision through the early years of teaching.
06. Revise the North Carolina Professional Teaching Standards to directly incorporate anti-racist, anti-bias, culturally responsive and sustaining pedagogy, and require EPPs to report how they incorporate these proficiencies across their course offerings and programming. This should also include community colleges with course articulation agreements that include education courses. Opportunities for reporting include incorporating questions regarding the presence and effectiveness of this coursework into the graduate satisfaction survey and addressing cultural competency in the Certification of Teaching Capacity Form. (Stakeholders Responsible: Legislature, State Board of Education, Department of Public Instruction, Institutions of Higher Education, and Educator Preparation Programs)
07. Invest in state- and district-level initiatives that increase the sustainability of the profession by strengthening support networks for educators of color and providing professional development that strengthens practice and fosters inclusive school environments. (Stakeholders Responsible: State Board of Education, Department of Public Instruction, and District Leaders)
This should include:
g Requiring induction and mentoring programs that address the needs of educators of color and pair novice educators of color with diverse mentors that are compensated for their role as mentor.
g Developing state-led opportunities for professional development around Diversity, Equity, and Inclusion (DEI)and culturally responsive practices for all North Carolina teachers and administrators, as well as opportunities tailored to the needs of educators of color.
g Establishing and sustaining networking and professional learning communities for racially, ethnically, and linguistically diverse educators (including state, district, or regional affinity groups). Additionally, provide financial support to educators of color in joining national professional organizations and attending national conferences.
08. Develop and sustain pathways for advancement that are tailored to the needs of educators of color, including providing financial and logistical support for obtaining National Board Certification, expanding career ladders to keep effective career educators of color in the classroom, encouraging educators of color to teach honors level, AP, or IB courses, and establishing dedicated pipelines for educators of color to become administrators. (Stakeholders Responsible: Legislature, State Board of Education, Department of Public Instruction, District Leaders, and Educator Preparation Programs)
09. Release an annual statewide Educator Diversity Report that tracks North Carolina’s progress in developing and sustaining a representative educator workforce. This will require that quantitative and qualitative data on educator recruitment, preparation, retention, mobility, and turnover be collected, disaggregated, and analyzed at the state, district, and EPP level. These data should also be used to identify and reform district, institutional, and state policies that disadvantage, marginalize, or disenfranchise educators of color in recruitment, preparation, evaluation, retention, or advancement, as well as include impact data for statewide efforts to increase educator diversity. (Stakeholders Responsible: State Board of Education, Department of Public Instruction, Institutions of Higher Education, Educator Preparation Programs, and School and District Leaders)
10. Establish an independent body to monitor North Carolina’s progress implementing the Task Force’s recommendations and support the equity work of the Department of Public Instruction as it relates to recruiting, preparing, supporting, and retaining racially, ethnically, and linguistically diverse educators. This body should use a continuous improvement process to evaluate the state’s efforts in this space, beginning with the performance indicators established in this report and annually revisiting and/or refining these indicators to ensure they adequately reflect North Carolina’s progress. (Stakeholders Responsible: The Office of the Governor, Legislature, State Board of Education, and Department of Public Instruction)
15
DRIVE TASK FORCE FINAL REPORT | Strategies
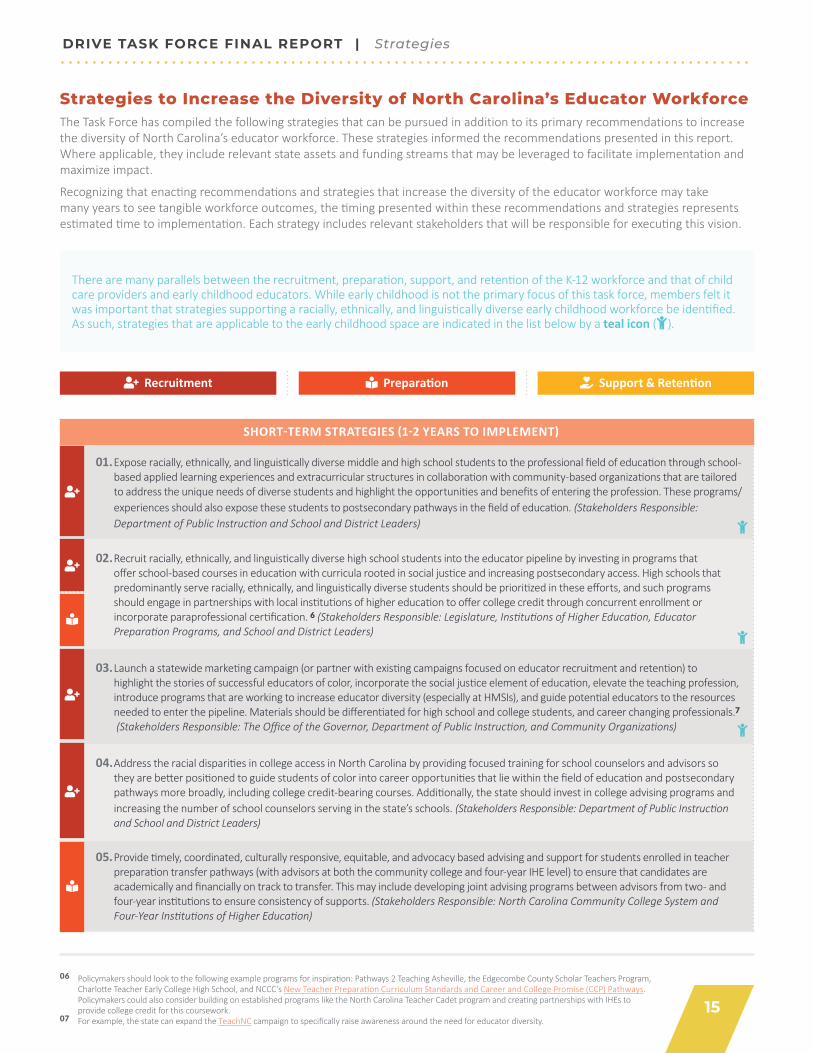
Strategies to Increase the Diversity of North Carolina’s Educator WorkforceThe Task Force has compiled the following strategies that can be pursued in addition to its primary recommendations to increase the diversity of North Carolina’s educator workforce. These strategies informed the recommendations presented in this report. Where applicable, they include relevant state assets and funding streams that may be leveraged to facilitate implementation and maximize impact.
Recognizing that enacting recommendations and strategies that increase the diversity of the educator workforce may take many years to see tangible workforce outcomes, the timing presented within these recommendations and strategies represents estimated time to implementation. Each strategy includes relevant stakeholders that will be responsible for executing this vision.
There are many parallels between the recruitment, preparation, support, and retention of the K-12 workforce and that of child care providers and early childhood educators. While early childhood is not the primary focus of this task force, members felt it was important that strategies supporting a racially, ethnically, and linguistically diverse early childhood workforce be identified. As such, strategies that are applicable to the early childhood space are indicated in the list below by a teal icon ().
SHORT-TERM STRATEGIES (1-2 YEARS TO IMPLEMENT)
01. Expose racially, ethnically, and linguistically diverse middle and high school students to the professional field of education through school-based applied learning experiences and extracurricular structures in collaboration with community-based organizations that are tailored to address the unique needs of diverse students and highlight the opportunities and benefits of entering the profession. These programs/experiences should also expose these students to postsecondary pathways in the field of education. (Stakeholders Responsible: Department of Public Instruction and School and District Leaders)
02. Recruit racially, ethnically, and linguistically diverse high school students into the educator pipeline by investing in programs that offer school-based courses in education with curricula rooted in social justice and increasing postsecondary access. High schools that predominantly serve racially, ethnically, and linguistically diverse students should be prioritized in these efforts, and such programs should engage in partnerships with local institutions of higher education to offer college credit through concurrent enrollment or incorporate paraprofessional certification. 6 (Stakeholders Responsible: Legislature, Institutions of Higher Education, Educator Preparation Programs, and School and District Leaders)
03. Launch a statewide marketing campaign (or partner with existing campaigns focused on educator recruitment and retention) to highlight the stories of successful educators of color, incorporate the social justice element of education, elevate the teaching profession, introduce programs that are working to increase educator diversity (especially at HMSIs), and guide potential educators to the resources needed to enter the pipeline. Materials should be differentiated for high school and college students, and career changing professionals.7 (Stakeholders Responsible: The Office of the Governor, Department of Public Instruction, and Community Organizations)
04. Address the racial disparities in college access in North Carolina by providing focused training for school counselors and advisors so they are better positioned to guide students of color into career opportunities that lie within the field of education and postsecondary pathways more broadly, including college credit-bearing courses. Additionally, the state should invest in college advising programs and increasing the number of school counselors serving in the state’s schools. (Stakeholders Responsible: Department of Public Instruction and School and District Leaders)
05. Provide timely, coordinated, culturally responsive, equitable, and advocacy based advising and support for students enrolled in teacher preparation transfer pathways (with advisors at both the community college and four-year IHE level) to ensure that candidates are academically and financially on track to transfer. This may include developing joint advising programs between advisors from two- and four-year institutions to ensure consistency of supports. (Stakeholders Responsible: North Carolina Community College System and Four-Year Institutions of Higher Education)
06 Policymakers should look to the following example programs for inspiration: Pathways 2 Teaching Asheville, the Edgecombe County Scholar Teachers Program, Charlotte Teacher Early College High School, and NCCC’s New Teacher Preparation Curriculum Standards and Career and College Promise (CCP) Pathways. Policymakers could also consider building on established programs like the North Carolina Teacher Cadet program and creating partnerships with IHEs to provide college credit for this coursework.
07 For example, the state can expand the TeachNC campaign to specifically raise awareness around the need for educator diversity.
Recruitment Preparation Support & Retention
16
SHORT-TERM STRATEGIES (1-2 YEARS TO IMPLEMENT)
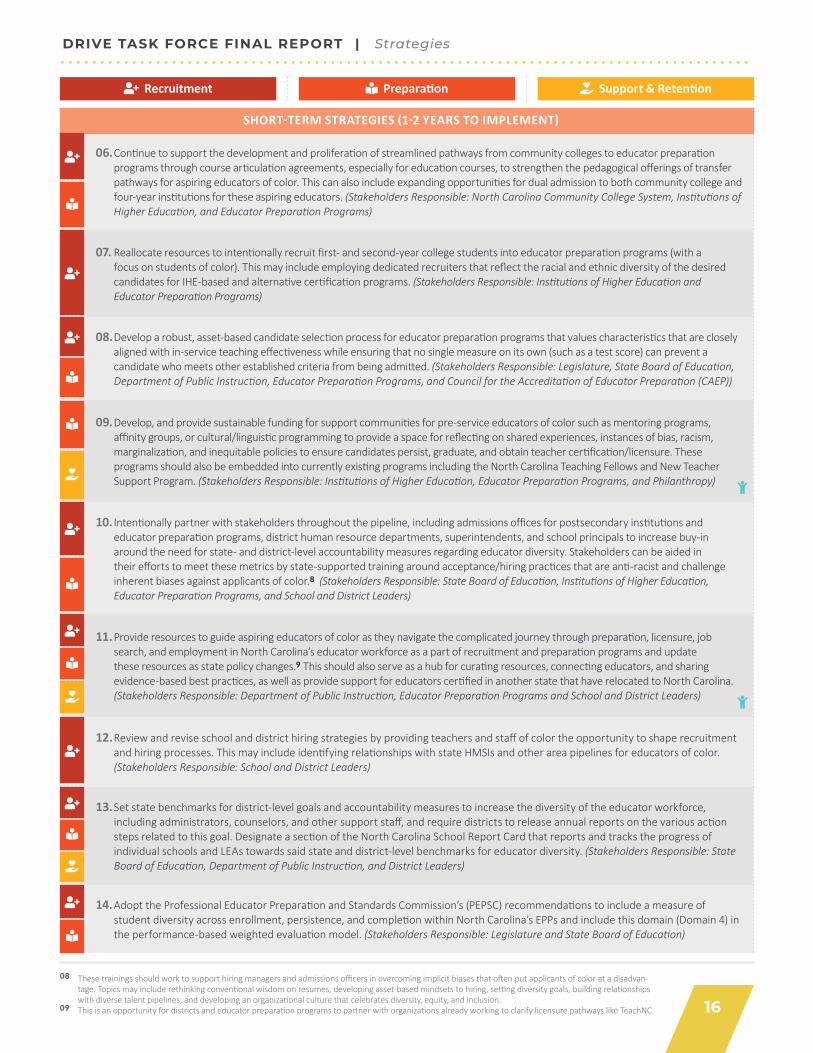
06. Continue to support the development and proliferation of streamlined pathways from community colleges to educator preparation programs through course articulation agreements, especially for education courses, to strengthen the pedagogical offerings of transfer pathways for aspiring educators of color. This can also include expanding opportunities for dual admission to both community college and four-year institutions for these aspiring educators. (Stakeholders Responsible: North Carolina Community College System, Institutions of Higher Education, and Educator Preparation Programs)
07. Reallocate resources to intentionally recruit first- and second-year college students into educator preparation programs (with a focus on students of color). This may include employing dedicated recruiters that reflect the racial and ethnic diversity of the desired candidates for IHE-based and alternative certification programs. (Stakeholders Responsible: Institutions of Higher Education and Educator Preparation Programs)
08. Develop a robust, asset-based candidate selection process for educator preparation programs that values characteristics that are closely aligned with in-service teaching effectiveness while ensuring that no single measure on its own (such as a test score) can prevent a candidate who meets other established criteria from being admitted. (Stakeholders Responsible: Legislature, State Board of Education, Department of Public Instruction, Educator Preparation Programs, and Council for the Accreditation of Educator Preparation (CAEP))
09. Develop, and provide sustainable funding for support communities for pre-service educators of color such as mentoring programs, affinity groups, or cultural/linguistic programming to provide a space for reflecting on shared experiences, instances of bias, racism, marginalization, and inequitable policies to ensure candidates persist, graduate, and obtain teacher certification/licensure. These programs should also be embedded into currently existing programs including the North Carolina Teaching Fellows and New Teacher Support Program. (Stakeholders Responsible: Institutions of Higher Education, Educator Preparation Programs, and Philanthropy)
10. Intentionally partner with stakeholders throughout the pipeline, including admissions offices for postsecondary institutions and educator preparation programs, district human resource departments, superintendents, and school principals to increase buy-in around the need for state- and district-level accountability measures regarding educator diversity. Stakeholders can be aided in their efforts to meet these metrics by state-supported training around acceptance/hiring practices that are anti-racist and challenge inherent biases against applicants of color.8 (Stakeholders Responsible: State Board of Education, Institutions of Higher Education, Educator Preparation Programs, and School and District Leaders)
11. Provide resources to guide aspiring educators of color as they navigate the complicated journey through preparation, licensure, job search, and employment in North Carolina’s educator workforce as a part of recruitment and preparation programs and update these resources as state policy changes.9 This should also serve as a hub for curating resources, connecting educators, and sharing evidence-based best practices, as well as provide support for educators certified in another state that have relocated to North Carolina. (Stakeholders Responsible: Department of Public Instruction, Educator Preparation Programs and School and District Leaders)
12. Review and revise school and district hiring strategies by providing teachers and staff of color the opportunity to shape recruitment and hiring processes. This may include identifying relationships with state HMSIs and other area pipelines for educators of color. (Stakeholders Responsible: School and District Leaders)
13. Set state benchmarks for district-level goals and accountability measures to increase the diversity of the educator workforce, including administrators, counselors, and other support staff, and require districts to release annual reports on the various action steps related to this goal. Designate a section of the North Carolina School Report Card that reports and tracks the progress of individual schools and LEAs towards said state and district-level benchmarks for educator diversity. (Stakeholders Responsible: State Board of Education, Department of Public Instruction, and District Leaders)
14. Adopt the Professional Educator Preparation and Standards Commission’s (PEPSC) recommendations to include a measure of student diversity across enrollment, persistence, and completion within North Carolina’s EPPs and include this domain (Domain 4) in the performance-based weighted evaluation model. (Stakeholders Responsible: Legislature and State Board of Education)
DRIVE TASK FORCE FINAL REPORT | Strategies
08 These trainings should work to support hiring managers and admissions officers in overcoming implicit biases that often put applicants of color at a disadvan-tage. Topics may include rethinking conventional wisdom on resumes, developing asset-based mindsets to hiring, setting diversity goals, building relationships with diverse talent pipelines, and developing an organizational culture that celebrates diversity, equity, and inclusion.
09 This is an opportunity for districts and educator preparation programs to partner with organizations already working to clarify licensure pathways like TeachNC.
Recruitment Preparation Support & Retention

17
SHORT-TERM STRATEGIES (1-2 YEARS TO IMPLEMENT)
15. Provide ongoing professional learning opportunities for school and district leaders to develop and refine the skills necessary to create and sustain a workplace climate and culture that is collaborative, supportive, and culturally responsive for all teachers, but especially educators of color. This should include specific state-developed professional learning and development on diversity, equity, and inclusion to address unconscious personal and institutional biases and the sharing of research-based, data driven resources to provide effective strategies for school and district leaders. (Stakeholders Responsible: Department of Public Instruction and School and District Leaders)
16. Establish and sustain affinity groups or other professional community-based networking organizations for racially, ethnically, and linguistically diverse educators at the state, regional, and district levels.10 Provide state guidance and support to districts interested in developing such groups. Additionally, provide financial support to educators of color in joining national professional organizations, such as the National Association of Black School Educators, and attending national conferences. (Stakeholders Responsible: State Board of Education, Department of Public Instruction, and School and District Leaders)
17. Revise the North Carolina Standards for all other educators, (e.g. superintendents, school leaders, counselors, social workers, etc.) to explicitly incorporate anti-racist, anti-bias, culturally responsive and sustaining pedagogy and practices. (Stakeholders Responsible: Legislature, State Board of Education, and Department of Public Instruction)
18. Implement high-quality opportunities for in-classroom11 training and professional development that are designed with the needs of educators of color in mind. These opportunities could be facilitated in partnership with the state’s HMSIs and should directly address challenges that are unique to educators of color, provide opportunities for networking, and facilitate the development of professional learning communities for racially, ethnically, and linguistically diverse educators. (Stakeholders Responsible: Department of Public Instruction, Educator Preparation Programs, and District Leaders)
DRIVE TASK FORCE FINAL REPORT | Strategies
10 Promising district level models exist in Durham Public Schools and Chapel-Hill Carrboro Public Schools. Additionally, models like Profound Gentlemen, Profound Ladies, and North Carolina Association of Educators' Educators of Color Academy can provide an effective model for non-district-based opportunities.
11 This may include research-based co-instructor training models, peer observation and feedback cycles, and tailored coaching and support around implementing evidence-based strategies to improve teacher effectiveness.
12 Tennessee’s Diversity Innovation Grant Model is an example of state level efforts to encourage the development of Grow-Your-Own programs.13 Scholarships can be created at both the IHE level, as with UNC-Pembroke’s First Americans’ Teacher Education Program, and at the district level, like the
Duplin County Schools Minority Teachers Scholarship-Loan.
MID-RANGE STRATEGIES (2-5 YEARS TO IMPLEMENT)
01. Incentivize partnerships between institutions of higher education and school districts to create programs that offer college credit for education courses, taught in high schools, including specific investments in infrastructure and personnel within HMSIs and schools that primarily serve racially, ethnically, and linguistically diverse students to ensure they have the capacity to engage in these partnerships. (Stakeholders Responsible: School and District Leaders and Institutions of Higher Education)
02. Offer grant programs for districts, or a consortium of districts, to develop Grow Your Own Programs, especially teacher residency models and teacher mentorship and retention programs, dedicated to increasing the diversity of the educator workforce.12 (Stakeholders Responsible: Legislature, Office of the Governor, Philanthropy, Institutions of Higher Education, and Department of Public Instruction)
03. Reduce the financial burden of postsecondary access by offering scholarships13, loan forgiveness, or tuition reimbursement programs that demonstrate they effectively prepare and place educators of color. (Stakeholders Responsible: Legislature, Department of Public Instruction, and District Leaders)
This may include:
g Revising the North Carolina Teaching Fellows program to incorporate benchmarks for the recruitment and selection of diverse candidates and expand the number of campuses that offer the program to include HBCUs and other HMSIs by actively working to remove programmatic barriers to their participation including an overreliance on standardized test scores and dedicated staff member requirements. (Stakeholders Responsible: Legislature)
g Increasing awareness of education preparation course offerings through North Carolina’s Career & College Promise program, especially in communities of color. (Stakeholders Responsible: Department of Public Instruction, UNC System, and North Carolina Community College System)
g Growing the UNC System’s North Carolina Promise program to include other colleges and universities, especially HMSIs. (Stakeholders Responsible: Legislature, Department of Public Instruction, UNC System, and North Carolina Community College System)
04. Work to develop a state fund for school districts to offer a stipend for pre-service educators of color participating in experiential learning opportunities, allowing future teachers to earn a livable wage while they are enrolled in teacher preparation programs. These funds can be matched by local businesses and philanthropic groups and can help cover living costs for career changers while they are studying to become teachers. (Stakeholders Responsible: Legislature, Office of the Governor and Department of Public Instruction)
Recruitment Preparation Support & Retention
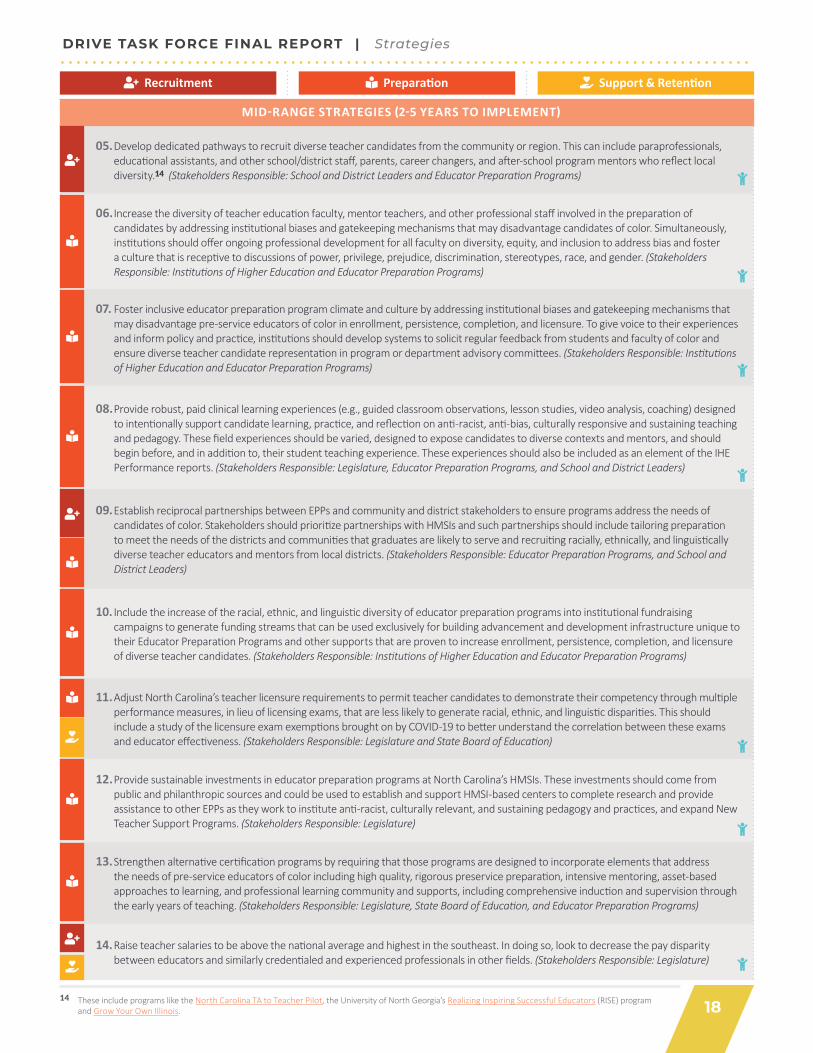
18
MID-RANGE STRATEGIES (2-5 YEARS TO IMPLEMENT)
05. Develop dedicated pathways to recruit diverse teacher candidates from the community or region. This can include paraprofessionals, educational assistants, and other school/district staff, parents, career changers, and after-school program mentors who reflect local diversity.14 (Stakeholders Responsible: School and District Leaders and Educator Preparation Programs)
06. Increase the diversity of teacher education faculty, mentor teachers, and other professional staff involved in the preparation of candidates by addressing institutional biases and gatekeeping mechanisms that may disadvantage candidates of color. Simultaneously, institutions should offer ongoing professional development for all faculty on diversity, equity, and inclusion to address bias and foster a culture that is receptive to discussions of power, privilege, prejudice, discrimination, stereotypes, race, and gender. (Stakeholders Responsible: Institutions of Higher Education and Educator Preparation Programs)
07. Foster inclusive educator preparation program climate and culture by addressing institutional biases and gatekeeping mechanisms that may disadvantage pre-service educators of color in enrollment, persistence, completion, and licensure. To give voice to their experiences and inform policy and practice, institutions should develop systems to solicit regular feedback from students and faculty of color and ensure diverse teacher candidate representation in program or department advisory committees. (Stakeholders Responsible: Institutions of Higher Education and Educator Preparation Programs)
08. Provide robust, paid clinical learning experiences (e.g., guided classroom observations, lesson studies, video analysis, coaching) designed to intentionally support candidate learning, practice, and reflection on anti-racist, anti-bias, culturally responsive and sustaining teaching and pedagogy. These field experiences should be varied, designed to expose candidates to diverse contexts and mentors, and should begin before, and in addition to, their student teaching experience. These experiences should also be included as an element of the IHE Performance reports. (Stakeholders Responsible: Legislature, Educator Preparation Programs, and School and District Leaders)
09. Establish reciprocal partnerships between EPPs and community and district stakeholders to ensure programs address the needs of candidates of color. Stakeholders should prioritize partnerships with HMSIs and such partnerships should include tailoring preparation to meet the needs of the districts and communities that graduates are likely to serve and recruiting racially, ethnically, and linguistically diverse teacher educators and mentors from local districts. (Stakeholders Responsible: Educator Preparation Programs, and School and District Leaders)
10. Include the increase of the racial, ethnic, and linguistic diversity of educator preparation programs into institutional fundraising campaigns to generate funding streams that can be used exclusively for building advancement and development infrastructure unique to their Educator Preparation Programs and other supports that are proven to increase enrollment, persistence, completion, and licensure of diverse teacher candidates. (Stakeholders Responsible: Institutions of Higher Education and Educator Preparation Programs)
11. Adjust North Carolina’s teacher licensure requirements to permit teacher candidates to demonstrate their competency through multiple performance measures, in lieu of licensing exams, that are less likely to generate racial, ethnic, and linguistic disparities. This should include a study of the licensure exam exemptions brought on by COVID-19 to better understand the correlation between these exams and educator effectiveness. (Stakeholders Responsible: Legislature and State Board of Education)
12. Provide sustainable investments in educator preparation programs at North Carolina’s HMSIs. These investments should come from public and philanthropic sources and could be used to establish and support HMSI-based centers to complete research and provide assistance to other EPPs as they work to institute anti-racist, culturally relevant, and sustaining pedagogy and practices, and expand New Teacher Support Programs. (Stakeholders Responsible: Legislature)
13. Strengthen alternative certification programs by requiring that those programs are designed to incorporate elements that address the needs of pre-service educators of color including high quality, rigorous preservice preparation, intensive mentoring, asset-based approaches to learning, and professional learning community and supports, including comprehensive induction and supervision through the early years of teaching. (Stakeholders Responsible: Legislature, State Board of Education, and Educator Preparation Programs)
14. Raise teacher salaries to be above the national average and highest in the southeast. In doing so, look to decrease the pay disparity between educators and similarly credentialed and experienced professionals in other fields. (Stakeholders Responsible: Legislature)
DRIVE TASK FORCE FINAL REPORT | Strategies
14 These include programs like the North Carolina TA to Teacher Pilot, the University of North Georgia’s Realizing Inspiring Successful Educators (RISE) program and Grow Your Own Illinois.
Recruitment Preparation Support & Retention

19
DRIVE TASK FORCE FINAL REPORT | Strategies
MID-RANGE STRATEGIES (2-5 YEARS TO IMPLEMENT)
15. Significantly increase the number of educators of color who possess National Board Certification by providing financial and logistical support. This includes establishing partnerships that provide financial and logistical support for educators of color seeking to complete their National Board certification. This may include establishing partnerships with IHEs, and especially HMSIs, to provide free regional professional development and application support for North Carolina’s educators of color prior to and during their application process. (Stakeholders Responsible: Legislature, State Board of Education, Department of Public Instruction, District Leaders, and Educator Preparation Programs)
16. Require comprehensive district-based induction and mentoring for educators of color in their first years of teaching. These programs should ensure novice educators of color are paired with racially, ethnically, and linguistically diverse mentors and provide compensation for school-based mentor teachers. Where diverse mentor teachers are not available, schools and districts can look to larger networks outside of their communities (or in some cases outside of the teaching profession) to find the requisite mentors. Mentors and other professional staff supporting in-service teachers should be provided with training on how to provide effective coaching, and programs should report annually on the participation in such programs at the district level.16 (Stakeholders Responsible: (State Board of Education, Department of Public Instruction, Educator Preparation Programs, and District Leaders)
17. Implement strategies to increase the attractiveness of teaching in communities that struggle to recruit and retain diverse educators by providing access to affordable or subsidized housing17, loan forgiveness programs, loan repayment incentives, and relocation incentives. (Stakeholders Responsible: District Leaders, Community Leaders/Organizations, and Philanthropy)
18. Continue to collect, disaggregate, and report on state- and district-level (where feasible) data on educator retention, mobility, and turnover. This can include publicly reporting disaggregated reason codes for teacher attrition responses on district teacher workforce reports. In addition, state, and district surveys, including the North Carolina Teacher Working Conditions Survey, should ask teachers to report on their experiences as it relates to race, diversity, and inclusion. (Stakeholders Responsible: Department of Public Instruction and District Leaders)
19. Provide resources and training to support school districts and local school boards in action planning around school-level educator retention data to improve teacher retention, especially among educators of color. (Stakeholders Responsible: Department of Public Instruction)
20. Commit resources to develop and facilitate professional learning opportunities across the state to ensure that all teachers are equipped to implement, and be evaluated on their use of, anti-racist, anti-bias, culturally responsive and sustaining pedagogy. These opportunities should provide research-based, content specific, and grade level appropriate strategies for teachers and staff. (Stakeholders Responsible: State Board of Education and Department of Public Instruction)
21. Make the teaching profession more financially sustainable by fairly compensating teachers of color for the additional support roles they fulfill as a result of the “invisible tax” (e.g., translation services,18 social/emotional support to students from similar backgrounds, etc.). (Stakeholders Responsible: State Board of Education, Department of Public instruction, School and District Leaders, Philanthropy, and Community Leaders/Organizations)
22. Develop dedicated pipelines to school leadership roles for educators of color and provide financial support for graduate coursework for those seeking to acquire administrative credentials. To do so, prioritize the optional Title II, three percent leadership set-aside funds to strengthen principal recruitment, preparation, induction, and development with a focus on clinical experiences in diverse contexts and fostering supportive and equity-driven school leadership. (Stakeholders Responsible: State Board of Education, Department of Public Instruction, and Philanthropy)
15 Policymakers may consider models like Wake County Public School System's Beginner to Board-Certified program. This program, in partnership with the National Board for Professional Teaching Standards, supports third year teachers in pursuing National Board Certification.
16 This should include working through currently existing programs like the North Carolina New Teacher Support Program and the Beginning Teacher Support program to ensure that novice educators of color receive mentoring, coaching, and professional development designed to address their needs. To best serve first-year educators of color, the North Carolina New Teacher support program should also be expanded to more of North Carolina’s HMSIs.
17 The Connecticut Housing Finance Authority’s teacher mortgage assistance program provides additional incentives for teachers who graduated from a high school in an educational reform district or who graduated from a Historically Black College or Hispanic-serving institution.
18 This can include offering a district-subsidized translation credential, either through the district or through a local postsecondary institution, that can position bilingual educators to earn a pay differential for interpreting during and/or after work hours.
Recruitment Preparation Support & Retention
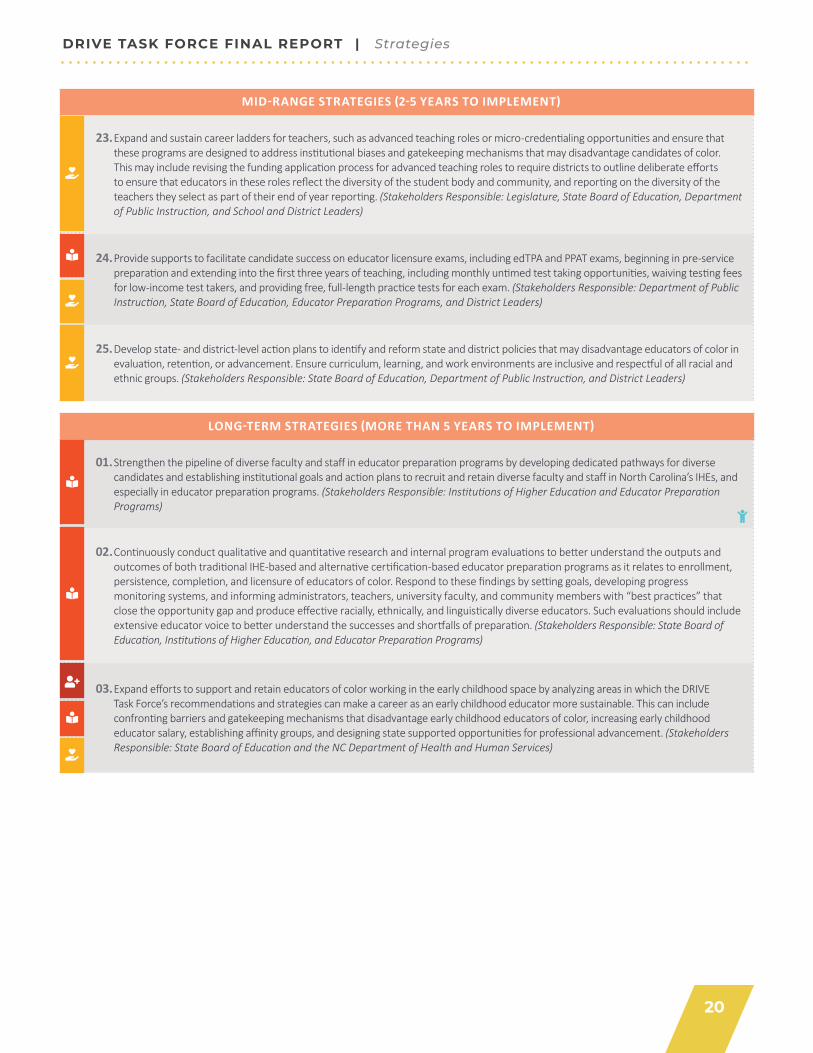
20
DRIVE TASK FORCE FINAL REPORT | Strategies
MID-RANGE STRATEGIES (2-5 YEARS TO IMPLEMENT)
23. Expand and sustain career ladders for teachers, such as advanced teaching roles or micro-credentialing opportunities and ensure that these programs are designed to address institutional biases and gatekeeping mechanisms that may disadvantage candidates of color. This may include revising the funding application process for advanced teaching roles to require districts to outline deliberate efforts to ensure that educators in these roles reflect the diversity of the student body and community, and reporting on the diversity of the teachers they select as part of their end of year reporting. (Stakeholders Responsible: Legislature, State Board of Education, Department of Public Instruction, and School and District Leaders)
24. Provide supports to facilitate candidate success on educator licensure exams, including edTPA and PPAT exams, beginning in pre-service preparation and extending into the first three years of teaching, including monthly untimed test taking opportunities, waiving testing fees for low-income test takers, and providing free, full-length practice tests for each exam. (Stakeholders Responsible: Department of Public Instruction, State Board of Education, Educator Preparation Programs, and District Leaders)
25. Develop state- and district-level action plans to identify and reform state and district policies that may disadvantage educators of color in evaluation, retention, or advancement. Ensure curriculum, learning, and work environments are inclusive and respectful of all racial and ethnic groups. (Stakeholders Responsible: State Board of Education, Department of Public Instruction, and District Leaders)
LONG-TERM STRATEGIES (MORE THAN 5 YEARS TO IMPLEMENT)
01. Strengthen the pipeline of diverse faculty and staff in educator preparation programs by developing dedicated pathways for diverse candidates and establishing institutional goals and action plans to recruit and retain diverse faculty and staff in North Carolina’s IHEs, and especially in educator preparation programs. (Stakeholders Responsible: Institutions of Higher Education and Educator Preparation Programs)
02. Continuously conduct qualitative and quantitative research and internal program evaluations to better understand the outputs and outcomes of both traditional IHE-based and alternative certification-based educator preparation programs as it relates to enrollment, persistence, completion, and licensure of educators of color. Respond to these findings by setting goals, developing progress monitoring systems, and informing administrators, teachers, university faculty, and community members with “best practices” that close the opportunity gap and produce effective racially, ethnically, and linguistically diverse educators. Such evaluations should include extensive educator voice to better understand the successes and shortfalls of preparation. (Stakeholders Responsible: State Board of Education, Institutions of Higher Education, and Educator Preparation Programs)
03. Expand efforts to support and retain educators of color working in the early childhood space by analyzing areas in which the DRIVE Task Force’s recommendations and strategies can make a career as an early childhood educator more sustainable. This can include confronting barriers and gatekeeping mechanisms that disadvantage early childhood educators of color, increasing early childhood educator salary, establishing affinity groups, and designing state supported opportunities for professional advancement. (Stakeholders Responsible: State Board of Education and the NC Department of Health and Human Services)
21
DRIVE TASK FORCE FINAL REPORT | Additional Considerations
Additional ConsiderationsNorth Carolina’s efforts to diversify its educator workforce do not occur in a vacuum. There are a number of policy levers that can draw high-quality candidates to the profession regardless of race and ethnicity. In addition to the DRIVE Task Force’s Recommendations and Strategies to increase the diversity of the educator workforce, this body puts forth the following additional considerations to strengthen the educator pipeline.
g Allocate the Necessary Funding to Ensure a Sound Basic Education for All Students | Increasing the diversity of the educator workforce is only one facet of a broader array of policy levers that are necessary to fulfill the state’s constitutional obligation to provide a sound basic education for all students. The DRIVE Task Force is informed by the findings of the court in Leandro v. State of North Carolina and the need to address the longstanding funding and achievement inequities that for too long have disadvantaged communities of color and rural communities across North Carolina.
g Address Salary | For teaching to be an attractive life-long career option that can bring passionate, high-quality candidates into the profession, teachers must be well compensated. With that in mind, North Carolina should work diligently to raise teacher salary above the national average and to be highest in the southeast. In doing so, policymakers should look to decrease the pay disparity between educators and similarly credentialed and experienced professionals in other fields.
g Professionalize Teaching | In addition to raising teacher salary, efforts should be made to professionalize teaching and empower teachers to be experts in their field. This includes actively seeking out feedback from educators in the school and district decision making process and increasing educator autonomy within their curriculum.
g Diversify the Early Childhood and Higher Education Workforce | Closing opportunity gaps across the education continuum requires increasing the racial, ethnic, and linguistic diversity of early childhood educators and higher education faculty and staff, in addition to the K-12 educator workforce. Policymakers and education stakeholders should work to better understand the diversity gaps within these groups and expand efforts to develop high-quality, high-retention pathways to these positions for educators of color.
Ĥ In Early Childhood Education (ECE), policymakers should pursue levers that can strengthen the pipeline of diverse educators and further professionalize early childhood education, including increasing salary and providing benefits, examining opportunities to develop a licensure pathway that overlaps with early elementary grades, and supporting alignment efforts between ECE and K-12 curriculum and preparation, such as incorporating anti-racist, anti-bias, culturally responsive and sustaining pedagogy.
Ĥ Within higher education, policymakers must address the programmatic, institutional, and systemic barriers and gatekeeping mechanisms that disadvantage candidates of color.
g Identify Opportunities to Celebrate and Promote Other Forms of Educator Diversity | By design, the DRIVE Task Force is myopically focused on increasing the racial, ethnic, and linguistic diversity of the educator workforce. However, there are additional forms of diversity, including, but not limited to, gender identity, sexual orientation, disability status, religion, and factors related to income level, that should also be considered within efforts to diversify the teacher workforce.
g The Ongoing COVID-19 Pandemic | The impact of the COVID-19 pandemic on North Carolina’s educator workforce is yet to be seen. There is concern nationwide that school reopening may lead to a rash of early retirements among educators who are most at risk. Reopening plans vary across districts in North Carolina, and it will take time to determine how the educator workforce, and educators of color, will be impacted. However, the pandemic has disproportionately impacted communities of color, and given that educators of color are more likely to be employed in schools that primarily serve a diverse student population, they may also be impacted disproportionately.
Educators leaving the classroom under their own volition is not the only concern. In some states where efforts to increase the diversity of the educator workforce were already underway, the pandemic has washed away gains associated with those initiatives as states and districts have faced budget cuts and subsequent teacher layoffs, which have disproportionately impacted teachers of color. As policymakers contend with the ongoing pandemic, they must consider how their policies, from school reopening plans to budget-induced staffing decisions, may disproportionately impact communities, and educators, of color.

22
DRIVE TASK FORCE FINAL REPORT | Appendix
Chair
Dr. Anthony Graham Greensboro UNC System Representative
Executive Committee
Dr. Bryan Abernathy Brevard Education Leadership Representative
Dr. Anita Alpenfels Pinehurst Education Leadership Representative
Dr. Van Dempsey III Wilmington UNC System Representative
Dr. Cherrel Miller Dyce Elon NCICU Representative
Dr. Lisa Mabe Eads King NCCC System Representative
Guy Hill Coats Educator Representative
Dr. Leslie Locklear Red Springs UNC System Representative
Sabrina Peacock Greensboro Educator Representative
Eric E. Sanchez Youngsville Education Leadership Representative
Task Force Members
Aliyah Abdur-Rahman Durham Parent Representative
Creighton P. Blackwell Morrisville NC Community Leader Representative
Dr. Eric Bracy Dunn Superintendent Representative
Princess Brown Raleigh Education Advocacy Representative
Matthew Ellinwood Chapel Hill Education Advocacy Representative
Dr. Kimberly Evans Raleigh Department of Public Instruction Representative
Representative James D. Gailliard Rocky Mount Legislative Representative
Lorena R. Gonzalez Durham Health and Human Services Representative
J. Wendell Hall Ahoskie State Board of Education Representative
Representative Zack Hawkins Durham Legislative Representative
Ricky Hurtado Mebane Education Leadership Representative
Senator Todd Johnson Wadesboro Legislative Representative
Ashley Kazouh Raleigh Education Advocacy Representative
Dr. Chance W. Lewis Concord UNC System Representative
Dr. Danielle Madrazo Rocky Mount NCICU Representative
Alfred Mays Apex Education Leadership Representative
Kristy Moore Durham Education Advocacy Representative
Rebecca A. Planchard Durham Health and Human Services Representative
N. King Prather Cary NC Community Leader Representative
Dr. Claudia Sandoval Waxhaw Parent Representative
Dr. Deanna Townsend-Smith Raleigh State Board of Education Representative
Dr. Debra Stewart Raleigh NC Community Leader Representative
Dr. Leroy L. Wray, Jr. Charlotte UNC System Representative
Alexandra-Emmanuelle Zagbayou Durham Education Advocacy Representative
AppendixA. TASK FORCE MEMBERS
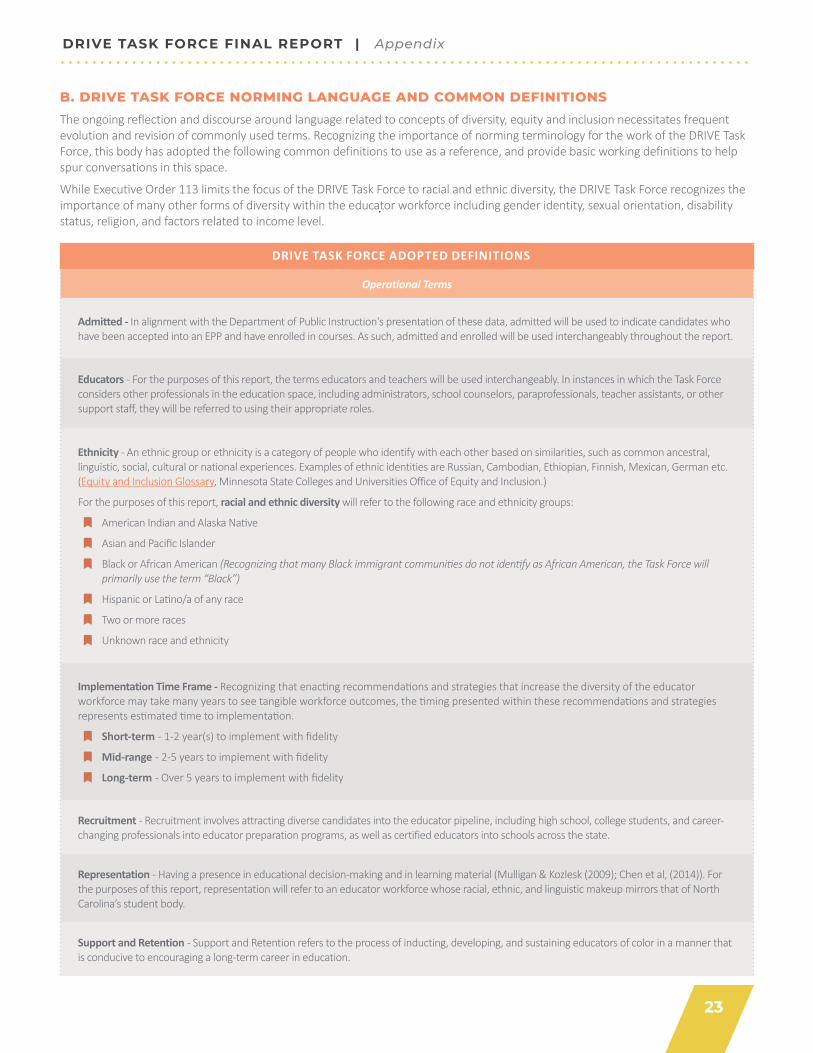
23
DRIVE TASK FORCE FINAL REPORT | Appendix
B. DRIVE TASK FORCE NORMING LANGUAGE AND COMMON DEFINITIONSThe ongoing reflection and discourse around language related to concepts of diversity, equity and inclusion necessitates frequent evolution and revision of commonly used terms. Recognizing the importance of norming terminology for the work of the DRIVE Task Force, this body has adopted the following common definitions to use as a reference, and provide basic working definitions to help spur conversations in this space.
While Executive Order 113 limits the focus of the DRIVE Task Force to racial and ethnic diversity, the DRIVE Task Force recognizes the importance of many other forms of diversity within the educator workforce including gender identity, sexual orientation, disability status, religion, and factors related to income level.
DRIVE TASK FORCE ADOPTED DEFINITIONS
Operational Terms
Admitted - In alignment with the Department of Public Instruction's presentation of these data, admitted will be used to indicate candidates who have been accepted into an EPP and have enrolled in courses. As such, admitted and enrolled will be used interchangeably throughout the report.
Educators - For the purposes of this report, the terms educators and teachers will be used interchangeably. In instances in which the Task Force considers other professionals in the education space, including administrators, school counselors, paraprofessionals, teacher assistants, or other support staff, they will be referred to using their appropriate roles.
Ethnicity - An ethnic group or ethnicity is a category of people who identify with each other based on similarities, such as common ancestral, linguistic, social, cultural or national experiences. Examples of ethnic identities are Russian, Cambodian, Ethiopian, Finnish, Mexican, German etc. (Equity and Inclusion Glossary, Minnesota State Colleges and Universities Office of Equity and Inclusion.)
For the purposes of this report, racial and ethnic diversity will refer to the following race and ethnicity groups:
g American Indian and Alaska Native
g Asian and Pacific Islander
g Black or African American (Recognizing that many Black immigrant communities do not identify as African American, the Task Force will primarily use the term “Black”)
g Hispanic or Latino/a of any race
g Two or more races
g Unknown race and ethnicity
Implementation Time Frame - Recognizing that enacting recommendations and strategies that increase the diversity of the educator workforce may take many years to see tangible workforce outcomes, the timing presented within these recommendations and strategies represents estimated time to implementation.
g Short-term - 1-2 year(s) to implement with fidelity
g Mid-range - 2-5 years to implement with fidelity
g Long-term - Over 5 years to implement with fidelity
Recruitment - Recruitment involves attracting diverse candidates into the educator pipeline, including high school, college students, and career-changing professionals into educator preparation programs, as well as certified educators into schools across the state.
Representation - Having a presence in educational decision-making and in learning material (Mulligan & Kozlesk (2009); Chen et al, (2014)). For the purposes of this report, representation will refer to an educator workforce whose racial, ethnic, and linguistic makeup mirrors that of North Carolina’s student body.
Support and Retention - Support and Retention refers to the process of inducting, developing, and sustaining educators of color in a manner that is conducive to encouraging a long-term career in education.

24
DRIVE TASK FORCE FINAL REPORT | Appendix
Additional Terms
Access - All members of the school community have entrance into, involvement with, and full participation of resources, conversations, initiative, and choices which are attentive to heritage and community practices (Paris, D. (2012). Culturally Sustaining Pedagogy: A Needed Change in Stance, Terminology, and Practice. Educational Researcher, 41(3), 93–97.)
Anti-bias Education - An approach to teaching and learning designed to increase understanding of differences and their value to a respectful and civil society, and to actively challenge bias, stereotyping and all forms of discrimination in schools and communities. It incorporates inclusive curriculum that reflects diverse experiences and perspectives, instructional methods that advance all students’ learning, and strategies to create and sustain safe, inclusive and respectful learning communities. (Anti-Bias Education Glossary, Anti-Defamation League. https://www.adl.org/education/resources/glossary-terms/what-is-anti-bias-education)
Anti-Racist - An anti-racist is someone who is supporting an anti-racist policy through their actions or expressing anti-racist ideas. This includes the expression or ideas that racial groups are equals and do not need developing, and supporting policies that reduce racial inequity (Kendi, I. X., (2019). How to be an Anti-Racist. Random House.)
Culturally Relevant/Responsible - Recognizing, understanding, and applying attitudes and practices that are sensitive to and appropriate for people with diverse backgrounds, experiences, and perspectives (Equity and Inclusion Glossary, Minnesota State Colleges and Universities Office of Equity and Inclusion.)
Culturally Sustaining - Practices that seek to perpetuate and foster—to sustain—linguistic, literate, and cultural pluralism as part of the democratic project of schooling. (Paris, D. (2012). Culturally Sustaining Pedagogy: A Needed Change in Stance, Terminology, and Practice. Educational Researcher, 41(3), 93–97.)
Discrimination - Action based on prejudice toward social others (Sensoy, O., DiAngelo, R. (2017) Is Everyone Really Equal? An Introduction to Key Concepts in Social Justice Education. Teachers College Press. p.78.)
Diversity - Diversity refers to the wide variety of shared and different personal and group characteristics among human beings. Diversity includes many characteristics that may be visible such as race, gender, and age, and it also includes less obvious characteristics like personality style, ethnicity, ability, education, religion, job function, life experience, life style, sexual orientation, gender identity, geography, regional differences, work experience, and family situation that make us similar to, and different from, one another. (Adapted from UMass Lowell, Office of Multicultural Affairs. Diversity and social justice: A glossary of working definitions) For the purposes of this report, diversity will specifically refer to the racial and ethnic diversity of educators.
Equity - Equity is the proportional distribution of desirable outcomes (e.g., educational, economic, social, or political opportunities) across groups (e.g., race, gender, socio-economic status, sexual orientation, etc.). Sometimes confused with equality, equity refers to outcomes while equality connotes equal treatment. Where individuals or groups are dissimilarly situated, equal treatment may be insufficient for, or even detrimental to, equitable outcomes. (Equity and Inclusion Glossary, Minnesota State Colleges and Universities Office of Equity and Inclusion.)
Inclusion - Authentically bringing traditionally excluded individuals and/or groups into processes, activities, and decision/policy making in a way that shares power. (Equity and Inclusion Glossary, Minnesota State Colleges and Universities Office of Equity and Inclusion.)
Institutional Racism - Institutional racism refers specifically to the ways in which institutional policies and practices create different outcomes for different racial groups. The institutional policies may never mention any racial group, but their effect is to create advantages for whites and oppression and disadvantage for people from groups classified as people of color. (Potapchuk, M., Leiderman, S., Bivens, D., and Major, B. (2005) Flipping the Script: White Privilege and Community Building.)

25
DRIVE TASK FORCE FINAL REPORT | Appendix
People of Color - Used primarily in the United States to describe any person who is not white; the term is meant to be inclusive among non-white groups, emphasizing common experiences of racism. (Washington University in Saint Louis Glossary of Bias Terms.)
Prejudice - A learned prejudgment toward social others and refers to internal thoughts, feelings, attitudes, and assumptions based on the groups to which they belong. (Sensoy, O., DiAngelo, R. (2017) Is Everyone Really Equal? An Introduction to Key Concepts in Social Justice Education. Teachers College Press. p.75.)
Privilege - Systematically conferred dominance and the institutional processes by which the beliefs and values of the dominant group are made “normal.” (Sensoy, O., DiAngelo, R. (2017) Is Everyone Really Equal? An Introduction to Key Concepts in Social Justice Education. Teachers College Press. p.103.)
Racial Identity - Commonly defined as the significance and meaning of race and ethnicity to one’s self-concept. An individual’s racial identity is a sense of belonging to a community of people who share a similar, specific heritage. (Equity and Inclusion Glossary, Minnesota State Colleges and Universities Office of Equity and Inclusion.)
Racism - Racism is a system of advantage based on race and supported by institutions, policies and practices that benefit dominant groups and disadvantage subdominant groups. Racism is a social expression of power and privilege. (NEA Diversity Toolkit)
Social Justice - A vision of society in which the distribution of resources is equitable, and all members are physically and psychologically safe and secure. Social justice involves social actors who have a sense of their own agency as well as a sense of social responsibility toward and with others and the society. (Adams, M., Bell, L. A., & Griffin, P. (1997). Teaching for diversity and social justice: A sourcebook. New York, NY: Routledge.)
Structural Racism - The normalization and legitimization of an array of dynamics – historical, cultural, institutional and interpersonal – that routinely advantage whites while producing cumulative and chronic adverse outcomes for people of color. Structural racism encompasses the entire system of white domination, diffused and infused in all aspects of society including its history, culture, politics, economics and entire social fabric. Structural racism is more difficult to locate in a particular institution because it involves the reinforcing effects of multiple institutions and cultural norms, past and present, continually reproducing old and producing new forms of racism. Structural racism is the most profound and pervasive form of racism – all other forms of racism emerge from structural racism. (Racial Justice Action Education Manual. (2003) Applied Research Center. Retrieved from: https://www.racialequitytools.org/images/uploads/RET_Glossary913L.pdf)

26
DRIVE TASK FORCE FINAL REPORT | Appendix
C. DATA SOURCES AND LIMITATIONS
This report uses demographic data of North Carolina’s students, teachers and leaders that is collected and published by the North Carolina Department of Public Instruction (DPI). All data are collected to meet state and federal reporting requirements and are published in the aggregate, without personally identifiable information such as names, identification numbers, or birthdates, to safeguard the privacy of students and personnel. DPI releases student and teacher information through its statistical profile and the North Carolina Educator Preparation Program Dashboard.
Public school full-time personnel and students in North Carolina self-report their race/ethnicity in the Department’s data collection. DPI collects demographic data for students and personnel that identify as African American, American Indian/Alaska Native, Asian, Hispanic, Pacific Islander/Native Hawaiian, and white, but publicly releases full-time personnel data (including teachers, administrators, and other district employees) disaggregated as Black, white, and other.
Educators have the right to decline to identify their race, ethnicity, and/or gender in data collection. DPI does not collect demographic data on student teaching placements, postsecondary faculty, or racial and ethnic data on teacher exit surveys. Further, the data presented in DPI's dashboards only show relationships between two different variables at a time and are not designed to support more rigorous analysis. As such, some limitations exist in making causal statements related to the behavior and some characteristics of educators of color.
Students Teachers
Count Percent Count Percent
Black or African American 381,729 25.0% 16,041 15.3%
American Indian/ Alaska Native 17,624 1.2% 795 0.8%
Asian 52,873 3.5% 898 0.9%
Hispanic or Latino 273,269 17.9% 2,799 2.7%
Native Hawaiian/ Pacific Islander 2,150 0.1% 74 0.1%
Unreported 68,079 4.5% 1,028 1.0%
White 729,183 47.8% 82,949 79.3%
Total 1,524,907 104,584
Source: The Hunt Institute based on data from the Department of Public Instruction.
D. 2018-19 NC STUDENT AND TEACHER DEMOGRAPHICS BY RACE

27
Clay County 12Graham County 22
Ashe County 14Yancey County 16
Avery County 15Alleghany County 26
Madison County 6Jackson County 27
Transylvania County 19Mitchell County 13
Cherokee County 13Yadkin County 30Wilkes County 23
Haywood County 12Davidson County 16
Surry County 28Caldwell County 20
Macon County 21Watauga County 13
Alexander County 17Stokes County 9
Lincoln County 20Davie County 23
McDowell County 18Randolph County 25
Burke County 28Polk County 19
Carteret County 18Mount Airy City 32
Henderson County 30Buncombe County 25Rutherford County 23
Catawba County 29Newton-Conover City 48
Stanly County 26Dare County 18
Swain County 28Hyde County 38
Mooresville City 28Pender County 26
Camden County 13Asheville City 29
Currituck County 12New Hanover County 31
Cleveland County 32Elkin City 22
Moore County 27Roanoke Rapids City 31
Iredell-Statesville 25Rockingham County 28
Orange County 34Brunswick County 24
Gaston County 32Asheboro City 58
Johnston County 34Beaufort County 42
Columbus County 36Edenton-Chowan County 44
12%22%
15%17%15%
27%7%
28%20%
15%15%
32%24%
14%18%
30%22%23%
15%20%
12%23%27%
22%29%32%
24%23%
37%35%
31%28%
35%54%
32%25%
34%45%
36%34%
21%37%
20%39%40%
31%37%40%
35%39%
46%35%
43%70%
46%54%
49%57%
0%0%0%1%1%1%1%1%1%1%2%2%2%2%2%2%2%2%3%3%3%3%4%4%4%4%5%5%5%5%5%5%5%6%6%6%7%7%7%8%8%8%8%8%8%9%9%10%10%11%11%11%12%12%12%12%12%13%
LEAApprox. Percentage
Point Difference% Teachers of Color % Students of Color
Tyrrell County 49Kannapolis City 55Whiteville City 47
Cabarrus County 35Onslow County 30Pamlico County 24
Rowan-Salisbury County 28Hickory City 45
Union County 24Lee County 47
Craven County 35Montgomery County 44
Chatham County 32Greene County 54
Gates County 21MarYn County 45
Richmond County 38Sampson County 43
Person County 31Alamance-Burlington 37
Wake County 34PiZ County 42
HarneZ County 32Caswell County 28
Perquimans County 9Duplin County 43
Franklin County 32Lenoir County 40
Chapel-Hill/Carrboro City 23Forsyth County 36
Clinton City 48Wilson County 42Bladen County 34Wayne County 35Anson County 37
Nash-Rocky Mount 39Thomasville City 47
Jones County 19Lexington City 44
CharloZe-Mecklenburg 37Cumberland County 34
Guilford County 31Edgecombe County 31Pasquotank County 19
Scotland County 29Durham County 38
Granville County 13Hoke County 21
Vance County 25Robeson County 24
Northampton County 26Her_ord County 20
Warren County 18Washington County 20
BerYe County 16Halifax County 10
Weldon City 6
62%68%
61%49%
44%37%42%
59%39%
63%50%
61%49%
71%38%
63%57%63%
50%57%
54%64%
54%50%
34%67%
56%65%
49%63%
76%70%
63%64%68%70%
79%53%
78%72%71%
68%71%
60%71%
81%58%
75%84%87%90%87%86%88%87%
96%97%
13%13%13%13%13%14%14%14%15%15%16%16%17%17%18%18%19%19%19%19%20%22%22%22%24%24%24%25%26%27%28%28%29%30%31%31%32%33%34%36%37%38%40%41%42%43%45%
54%60%64%64%67%68%68%71%
86%91%
LEAApprox. Percentage
Point Difference% Teachers of Color % Students of Color
DRIVE TASK FORCE FINAL REPORT | Appendix
FIGURE 10 | PERCENTAGE OF STUDENTS AND TEACHERS OF COLOR BY LEA, 2018-19
In all 115 of North Carolina’s LEAs, the share of students of color exceeds the share of teachers of color. The percentage point difference between student and teacher diversity in these LEAs ranges from 6 to 58 percentage points.
E. STUDENT AND TEACHER DEMOGRAPHIC COMPARISONS BY LEA
Clay County 12Graham County 22
Ashe County 14Yancey County 16
Avery County 15Alleghany County 26
Madison County 6Jackson County 27
Transylvania County 19Mitchell County 13
Cherokee County 13Yadkin County 30Wilkes County 23
Haywood County 12Davidson County 16
Surry County 28Caldwell County 20
Macon County 21Watauga County 13
Alexander County 17Stokes County 9
Lincoln County 20Davie County 23
McDowell County 18Randolph County 25
Burke County 28Polk County 19
Carteret County 18Mount Airy City 32
Henderson County 30Buncombe County 25Rutherford County 23
Catawba County 29Newton-Conover City 48
Stanly County 26Dare County 18
Swain County 28Hyde County 38
Mooresville City 28Pender County 26
Camden County 13Asheville City 29
Currituck County 12New Hanover County 31
Cleveland County 32Elkin City 22
Moore County 27Roanoke Rapids City 31
Iredell-Statesville 25Rockingham County 28
Orange County 34Brunswick County 24
Gaston County 32Asheboro City 58
Johnston County 34Beaufort County 42
Columbus County 36Edenton-Chowan County 44
12%22%
15%17%15%
27%7%
28%20%
15%15%
32%24%
14%18%
30%22%23%
15%20%
12%23%27%
22%29%32%
24%23%
37%35%
31%28%
35%54%
32%25%
34%45%
36%34%
21%37%
20%39%40%
31%37%40%
35%39%
46%35%
43%70%
46%54%
49%57%
0%0%0%1%1%1%1%1%1%1%2%2%2%2%2%2%2%2%3%3%3%3%4%4%4%4%5%5%5%5%5%5%5%6%6%6%7%7%7%8%8%8%8%8%8%9%9%10%10%11%11%11%12%12%12%12%12%13%
LEAApprox. Percentage
Point Difference% Teachers of Color % Students of Color
Tyrrell County 49Kannapolis City 55Whiteville City 47
Cabarrus County 35Onslow County 30Pamlico County 24
Rowan-Salisbury County 28Hickory City 45
Union County 24Lee County 47
Craven County 35Montgomery County 44
Chatham County 32Greene County 54
Gates County 21MarYn County 45
Richmond County 38Sampson County 43
Person County 31Alamance-Burlington 37
Wake County 34PiZ County 42
HarneZ County 32Caswell County 28
Perquimans County 9Duplin County 43
Franklin County 32Lenoir County 40
Chapel-Hill/Carrboro City 23Forsyth County 36
Clinton City 48Wilson County 42Bladen County 34Wayne County 35Anson County 37
Nash-Rocky Mount 39Thomasville City 47
Jones County 19Lexington City 44
CharloZe-Mecklenburg 37Cumberland County 34
Guilford County 31Edgecombe County 31Pasquotank County 19
Scotland County 29Durham County 38
Granville County 13Hoke County 21
Vance County 25Robeson County 24
Northampton County 26Her_ord County 20
Warren County 18Washington County 20
BerYe County 16Halifax County 10
Weldon City 6
62%68%
61%49%
44%37%42%
59%39%
63%50%
61%49%
71%38%
63%57%63%
50%57%
54%64%
54%50%
34%67%
56%65%
49%63%
76%70%
63%64%68%70%
79%53%
78%72%71%
68%71%
60%71%
81%58%
75%84%87%90%87%86%88%87%
96%97%
13%13%13%13%13%14%14%14%15%15%16%16%17%17%18%18%19%19%19%19%20%22%22%22%24%24%24%25%26%27%28%28%29%30%31%31%32%33%34%36%37%38%40%41%42%43%45%
54%60%64%64%67%68%68%71%
86%91%
LEAApprox. Percentage
Point Difference% Teachers of Color % Students of Color
Source

28
DRIVE TASK FORCE FINAL REPORT | Appendix
High School Cohort, Class of
20121
High School Graduate, 20121
Postsecondary Enrollment in NC four-year
Institution, Fall 20121
EPP Enrollment, 20142
EPP Completion, 20162
Placement within three years of EPP Completion2
Still Teaching after two years 2
Count Percent Count Percent Count Percent Count Percent Count Percent Count Percent Count Percent
American Indian/ Alaska Native 1,713 1.5% 1,263 1.4% 425 1.1% 61 1.3% 46 1.2% 41 1.4% 39 1.5%
Asian/Pacific Islander 2609 2.4% 2282 2.6% 1375 3.7% 80 1.7% 66 1.7% 32 1.1% 29 1.1%
Black or African American 32557 29.4% 24316 27.3% 10747 28.8% 612 12.7% 426 11.0% 370 12.7% 343 12.9%
Hispanic or Latino 10225 9.2% 7463 8.4% 1978 5.3% 141 2.9% 103 2.7% 64 2.2% 54 2.0%
Two or More Races 3275 3.0% 2639 3.0% 1116 3.0% 19 0.4% 18 0.5% 8 0.3% 7 0.3%
Total Educators of Color 50,379 45.4% 37,963 42.57% 15,641 41.88% 913 18.93% 659 16.96% 515 17.63% 472 17.74%
Unreported 0 0.0% 0 0.0% 0 0.0% 0 0.0% 0 0.0% 55 1.9% 50 1.9%
Total 110,886 89,187 37,346 4,823 3,886 2,921 2,661
Note: The above table shows the traditional pipeline associated with educator preparation, including students receiving their preservice training through a traditional, full-time IHE-based undergraduate educator preparation program to which they are admitted in their sophomore year and then complete within four semesters. While alternative educator preparation programs typically produce a higher share of educators of color, the varying pathways individuals take to these programs makes defining set parameters for the pipeline a challenge.
F. DIVERSITY AT EACH STAGE OF THE PIPELINE: IHE-BASED EDUCATOR PREPARATION
Source 1 Source 2
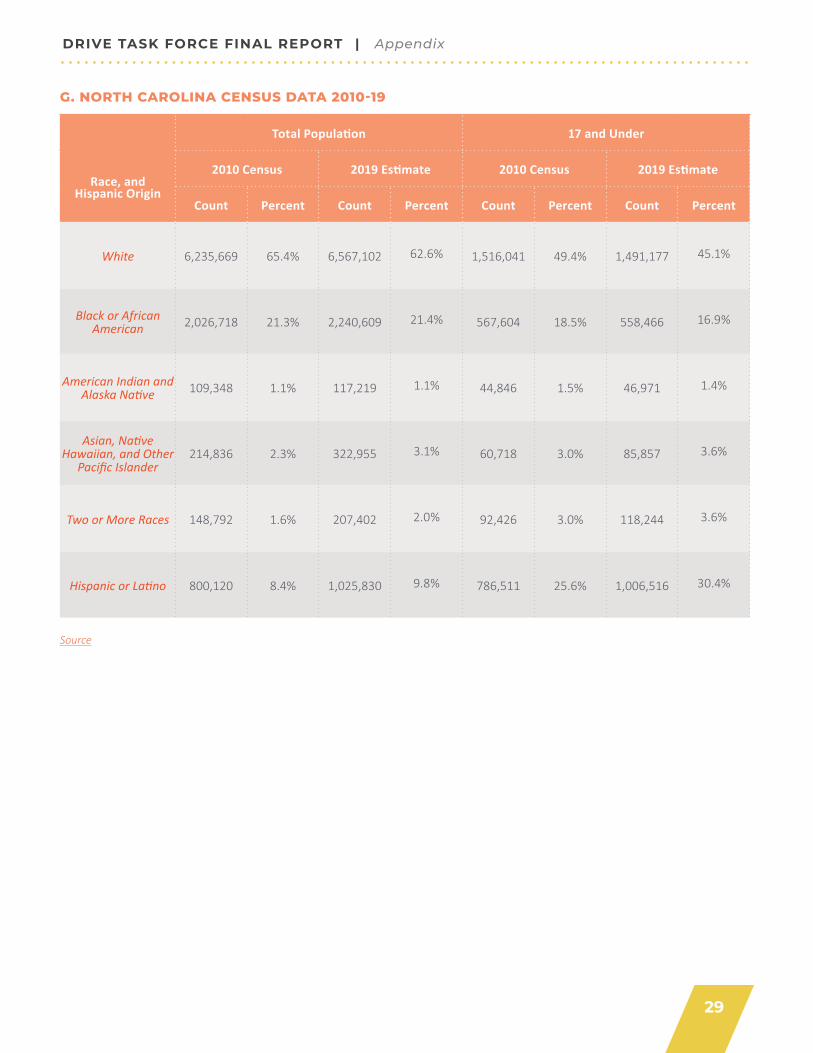
29
DRIVE TASK FORCE FINAL REPORT | Appendix
G. NORTH CAROLINA CENSUS DATA 2010-19
Total Population 17 and Under
Race, and Hispanic Origin
2010 Census 2019 Estimate 2010 Census 2019 Estimate
Count Percent Count Percent Count Percent Count Percent
White 6,235,669 65.4% 6,567,102 62.6% 1,516,041 49.4% 1,491,177 45.1%
Black or African American 2,026,718 21.3% 2,240,609 21.4% 567,604 18.5% 558,466 16.9%
American Indian and Alaska Native 109,348 1.1% 117,219 1.1% 44,846 1.5% 46,971 1.4%
Asian, Native Hawaiian, and Other
Pacific Islander214,836 2.3% 322,955 3.1% 60,718 3.0% 85,857 3.6%
Two or More Races 148,792 1.6% 207,402 2.0% 92,426 3.0% 118,244 3.6%
Hispanic or Latino 800,120 8.4% 1,025,830 9.8% 786,511 25.6% 1,006,516 30.4%
Source
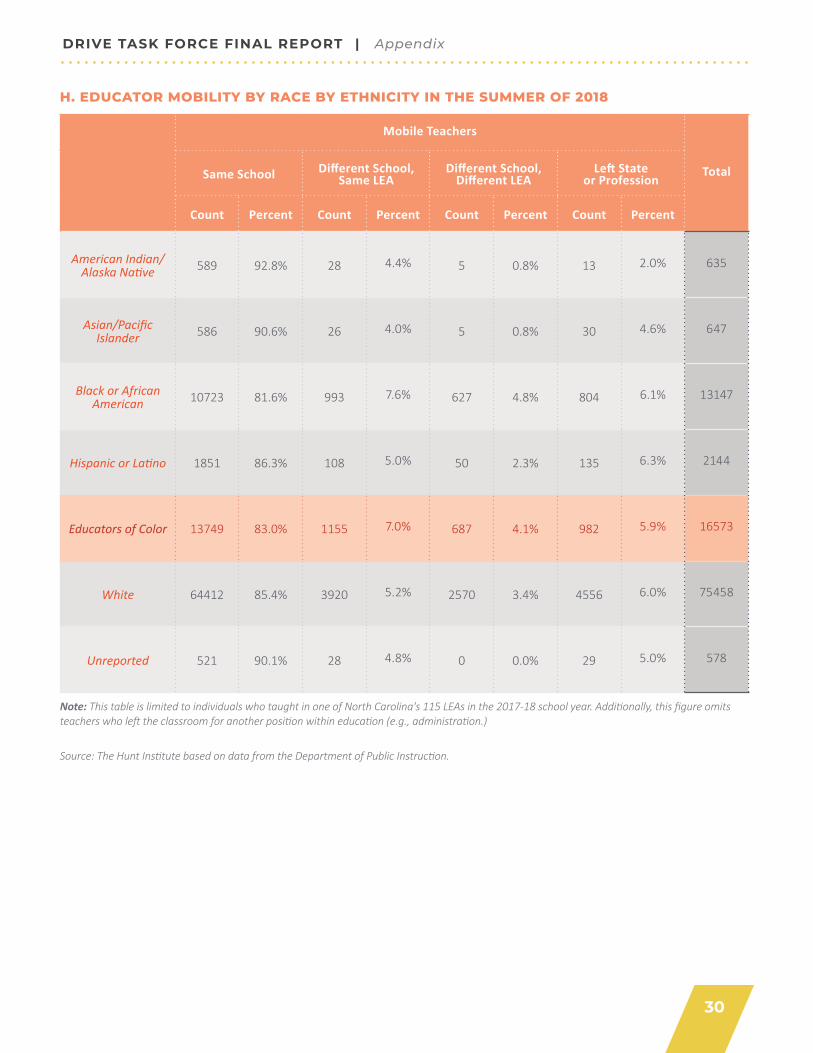
30
DRIVE TASK FORCE FINAL REPORT | Appendix
H. EDUCATOR MOBILITY BY RACE BY ETHNICITY IN THE SUMMER OF 2018
Mobile Teachers
TotalSame School Different School, Same LEA
Different School, Different LEA
Left State or Profession
Count Percent Count Percent Count Percent Count Percent
American Indian/Alaska Native 589 92.8% 28 4.4% 5 0.8% 13 2.0% 635
Asian/Pacific Islander 586 90.6% 26 4.0% 5 0.8% 30 4.6% 647
Black or African American 10723 81.6% 993 7.6% 627 4.8% 804 6.1% 13147
Hispanic or Latino 1851 86.3% 108 5.0% 50 2.3% 135 6.3% 2144
Educators of Color 13749 83.0% 1155 7.0% 687 4.1% 982 5.9% 16573
White 64412 85.4% 3920 5.2% 2570 3.4% 4556 6.0% 75458
Unreported 521 90.1% 28 4.8% 0 0.0% 29 5.0% 578
Note: This table is limited to individuals who taught in one of North Carolina's 115 LEAs in the 2017-18 school year. Additionally, this figure omits teachers who left the classroom for another position within education (e.g., administration.)
Source: The Hunt Institute based on data from the Department of Public Instruction.
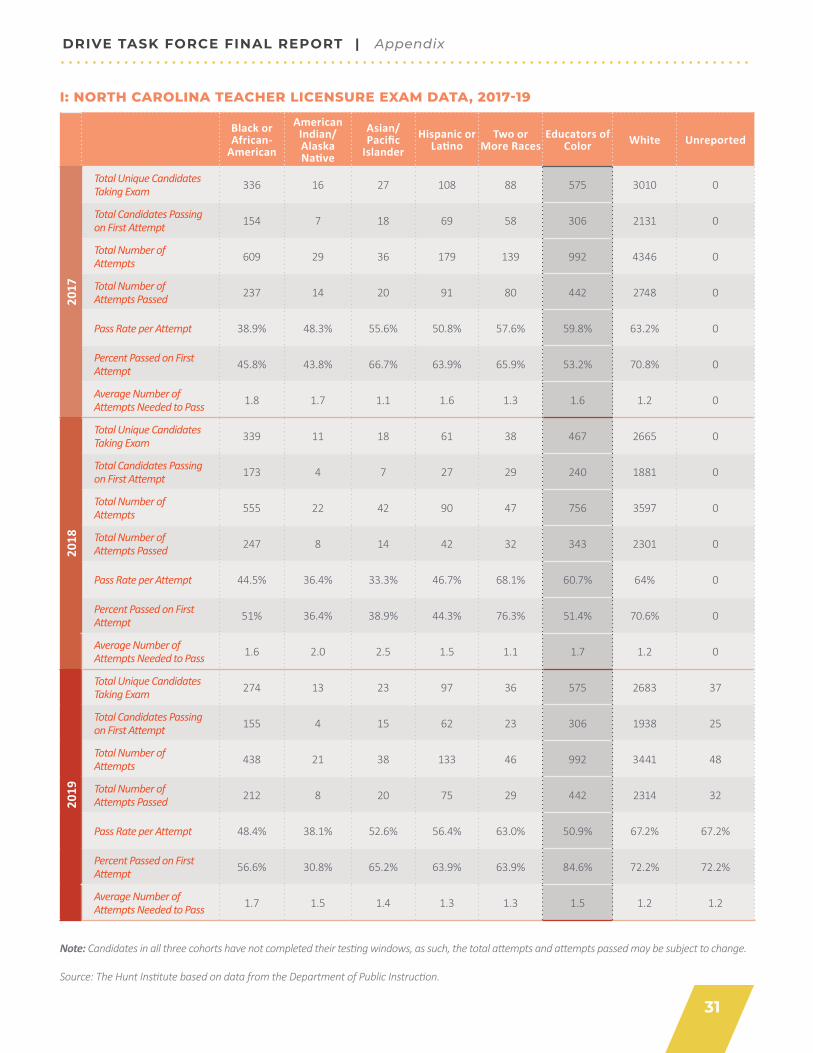
31
DRIVE TASK FORCE FINAL REPORT | Appendix
Black or African-
American
American Indian/Alaska Native
Asian/Pacific
IslanderHispanic or
LatinoTwo or
More RacesEducators of
Color White Unreported
2017
Total Unique Candidates Taking Exam 336 16 27 108 88 575 3010 0
Total Candidates Passing on First Attempt 154 7 18 69 58 306 2131 0
Total Number of Attempts 609 29 36 179 139 992 4346 0
Total Number of Attempts Passed 237 14 20 91 80 442 2748 0
Pass Rate per Attempt 38.9% 48.3% 55.6% 50.8% 57.6% 59.8% 63.2% 0
Percent Passed on First Attempt 45.8% 43.8% 66.7% 63.9% 65.9% 53.2% 70.8% 0
Average Number of Attempts Needed to Pass 1.8 1.7 1.1 1.6 1.3 1.6 1.2 0
2018
Total Unique Candidates Taking Exam 339 11 18 61 38 467 2665 0
Total Candidates Passing on First Attempt 173 4 7 27 29 240 1881 0
Total Number of Attempts 555 22 42 90 47 756 3597 0
Total Number of Attempts Passed 247 8 14 42 32 343 2301 0
Pass Rate per Attempt 44.5% 36.4% 33.3% 46.7% 68.1% 60.7% 64% 0
Percent Passed on First Attempt 51% 36.4% 38.9% 44.3% 76.3% 51.4% 70.6% 0
Average Number of Attempts Needed to Pass 1.6 2.0 2.5 1.5 1.1 1.7 1.2 0
2019
Total Unique Candidates Taking Exam 274 13 23 97 36 575 2683 37
Total Candidates Passing on First Attempt 155 4 15 62 23 306 1938 25
Total Number of Attempts 438 21 38 133 46 992 3441 48
Total Number of Attempts Passed 212 8 20 75 29 442 2314 32
Pass Rate per Attempt 48.4% 38.1% 52.6% 56.4% 63.0% 50.9% 67.2% 67.2%
Percent Passed on First Attempt 56.6% 30.8% 65.2% 63.9% 63.9% 84.6% 72.2% 72.2%
Average Number of Attempts Needed to Pass 1.7 1.5 1.4 1.3 1.3 1.5 1.2 1.2
Note: Candidates in all three cohorts have not completed their testing windows, as such, the total attempts and attempts passed may be subject to change.
I: NORTH CAROLINA TEACHER LICENSURE EXAM DATA, 2017-19
Source: The Hunt Institute based on data from the Department of Public Instruction.
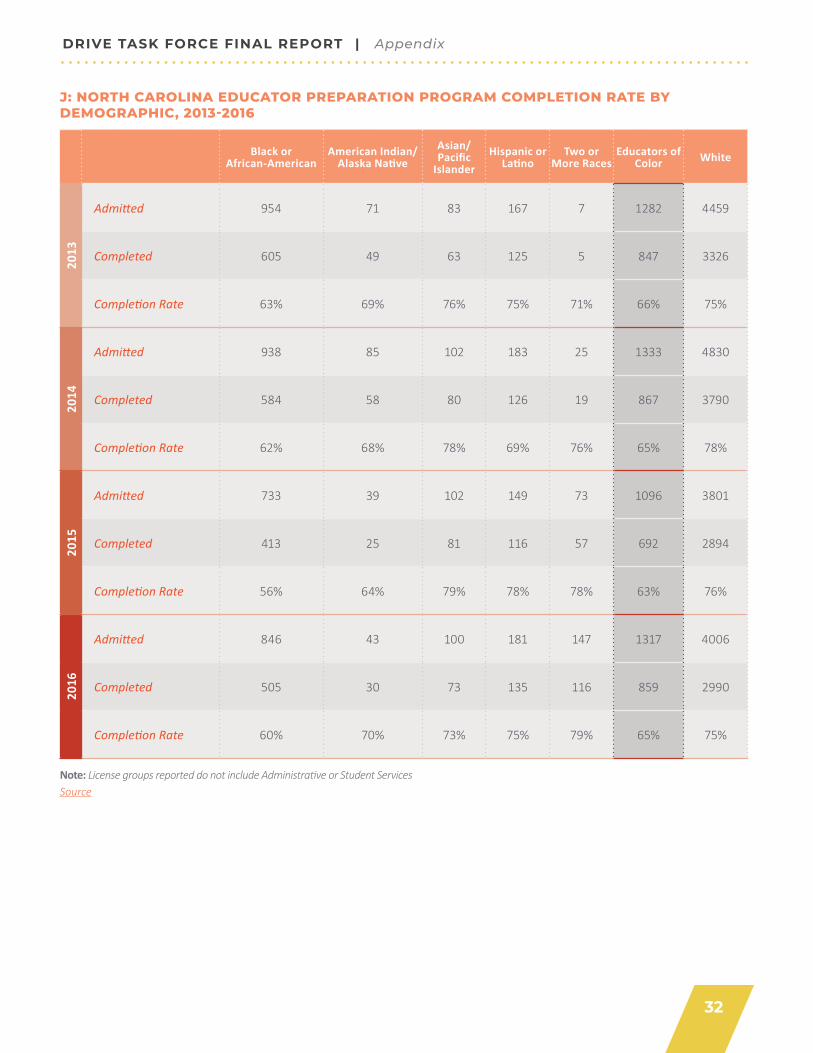
32
DRIVE TASK FORCE FINAL REPORT | Appendix
J: NORTH CAROLINA EDUCATOR PREPARATION PROGRAM COMPLETION RATE BY DEMOGRAPHIC, 2013-2016
Note: License groups reported do not include Administrative or Student ServicesSource
Black or African-American
American Indian/Alaska Native
Asian/Pacific
IslanderHispanic or
LatinoTwo or
More RacesEducators of
Color White
2013
Admitted 954 71 83 167 7 1282 4459
Completed 605 49 63 125 5 847 3326
Completion Rate 63% 69% 76% 75% 71% 66% 75%
2014
Admitted 938 85 102 183 25 1333 4830
Completed 584 58 80 126 19 867 3790
Completion Rate 62% 68% 78% 69% 76% 65% 78%
2015
Admitted 733 39 102 149 73 1096 3801
Completed 413 25 81 116 57 692 2894
Completion Rate 56% 64% 79% 78% 78% 63% 76%
2016
Admitted 846 43 100 181 147 1317 4006
Completed 505 30 73 135 116 859 2990
Completion Rate 60% 70% 73% 75% 79% 65% 75%

33
DRIVE TASK FORCE FINAL REPORT | Appendix
Citations01 North Carolina Department of Public Instruction’s Statistical Profile. Retrieved from http://apps.schools.nc.gov/ords/f?p=145:21:::NO02 Ibid.03 Ibid.04 The Hunt Institute based on data from the Department of Public Instruction.05 King, J. (2018). Colleges of Education: A National Portrait, Executive Summary. American Association for Colleges of Educator Education. Retrieved from https://secure.
aacte.org/apps/rl/res_get.php?fid=4178&ref=rl 06 Title II Report on National Educator Preparation Data (2018) Retrieved from: https://title2.ed.gov/Public/Home.aspx07 North Carolina Educator Preparation Program Dashboard. https://gdacreporting.ondemand.sas.com/SASReportViewer/?reportUri=/reports/reports/a1f64d16-
cbb8-4a23-9911-55d50321f428&page=vi6&sso_guest=true 08 Sun, M. (2018). Black Educators’ Retention and Transfer Patterns in North Carolina: How Do Patterns Vary by Educator Effectiveness, Subject, and School Conditions?
AERA Open.09 Ibid.10 Ibid.11 Hanushek, E. A., Kain, J. F., & Rivkin, S. G. (2004). Why public schools lose educators? Journal of Human Resources, 39(2), 237–354.12 Dee, T. (2004). Educators, Race, and Student Achievement in a Randomized Experiment. The Review of Economics and Statistics 86, no. 1: 195-210. http://www.jstor.
org/stable/3211667 13 Ouazad, A. (2014, July 17). Assessed by an Educator Like Me: Race and Educator Assessments. Education Finance and Policy 9, no. 3: 334-72.14 Grissom, J., Rodriquez, L., and Kern, E. (2017, February 10). Educator and Principal Diversity and the Representation of Students of Color in Gifted Programs: Evidence
from National Data. The Elementary School Journal 117, no. 3: 396-422.15 Gershenson, S., Hart, C., Hyman, J., Lindsay, C. and Papageorge, N. (2017, March). The Long-Run Impacts of Same-Race Educators. Institute of Labor Economics.16 Bates, L. A., and Glick, J.E. (2013, September). Does It Matter if Educators and Schools Match the Student? Racial and Ethnic Disparities in Problem Behaviors. Social
Science Research 42, no. 5: 1180-190.17 Lindsay, C., and Hart, C. (2017, September). Exposure to Same-Race Educators and Student Disciplinary Outcomes for Black Students in North Carolina. Educational
Evaluation and Policy Analysis 39, no. 3: 485–510.18 Achinstein, B., Ogawa, R. T., Sexton, D., & Freitas, C. (2009, April). The socialization and retention of new educators of color: Promises and challenges. Paper presented at
the annual meeting of the American Educational Research Association, San Diego, CA.19 Egalite, A., and Kisida, B. (2018, March). The Effects of Educator Match on Students’ Academic Perceptions and Attitudes. Educational Evaluation and Policy Analysis 40,
no. 1: 59–81.20 Zumwalt, K., and Craig, K. (2008). Who Is Teaching? Does It Matter? In Handbook of Research on Educator Education: Enduring Questions in Changing Contexts, edited
by Marilyn Cochran-Smith, Sharon Feiman-Nemser, and D. John. McIntyre, 404-19. 3rd ed. New York: Routledge.21 Frankenberg, E. (2009). The Segregation of American Educators. Education Policy Analysis Archives, 17, 1.22 Cherng, H.S., and Halpin, P. (2016, October 1). The Importance of Minority Educators. Educational Researcher 45, no. 7: 407-20.23 Flores, B.B., Clark, E.R., Claeys, L., & Villarreal, A. (2007). Academy for Educator Excellence: Recruiting, Preparing, and Retaining Latino Educators through Learning Com-
munities. Educator Education Quarterly. Retrieved from https://files.eric.ed.gov/fulltext/ EJ795187.pdf 24 Ocasio, K. M. (2014). Nuestro Camino: A Review of Literature Surrounding the Latino Teacher Pipeline. Journal of Latinos & Education, 13(4), 244–261. https://doi-org.
proxy.lib.duke.edu/10.10 80/15348431.2014.88746725 Brown, K.D. (2014). Teaching in color: A critical race theory in education analysis of the literature on preservice teachers of color and teacher education in the U.S. Race
Ethn. Educ. 2014,17, 326–345.26 Plachowski, Tara. (2019). Reflections of Preservice Teachers of Color: Implications for the Teacher Demographic Diversity Gap. Education Sciences. 9. 144.27 Brown, K.D. (2014). Teaching in color: A critical race theory in education analysis of the literature on preservice teachers of color and teacher education in the U.S. Race
Ethn. Educ. 2014,17, 326–345.28 Smith, W.A. (2004). Black faculty coping with racial battle fatigue: The campus racial climate in a post-Civil Rights era. In A Long Way to Go: Conversations about Race by
African American Faculty and Graduate Students at Predominantly White Institutions; Cleveland, D., Ed.; Peter Lang: New York, NY, USA, 2004; pp. 171-190.29 Yosso, T., Smith, W., Ceja, M., Solorzano, D. (2015). Critical Race Theory, Racial Microaggressions, and Campus Racial Climate for Latina/o Undergraduates. Harv. Educ.
2009,79, 659–691.30 Wexler, N. (2019, May). Why so many aspiring educators can’t pass a licensing test—and why it matters. Forbes. Retrieved from https://www.forbes.com/sites/na-
taliewexler/2019/03/13/why-so-many-aspiring-teachers-cant-pass-a-licensing-test--and-why-it-matters/?sh=65dba893321a31 National Center for Educator Quality. (2019, February). A Fair Chance: Simple Steps to Strengthen and Diversify the Educator Workforce. Retrieved from https://www.
nctq.org/dmsView/A_Fair_Chance32 Bennett, C., Lynn M. McWhorter, & John A. Kuykendall. (2006). Will I Ever Teach? Latino and African American Students' Perspectives on PRAXIS I. American Educational
Research Journal, 43(3), 531-575. Retrieved December 3, 2020, from http://www.jstor.org/stable/412176833 Petchauer, E., Bowe, A.G. & Wilson, J. (2018). Winter is Coming: Forecasting the Impact of edTPA on Black Teachers and Teachers of Color. Urban Rev 50, 323–343.34 National Center for Educator Quality. (2019, February). A Fair Chance: Simple Steps to Strengthen and Diversify the Educator Workforce. Retrieved from https://www.
nctq.org/dmsView/A_Fair_Chance 35 Goldhaber, D., and Hansen, M. (2010). Race, Gender, and Educator Testing: How Informative a Tool Is Educator Licensure Testing? American Educational Research Jour-
nal, 47(1), 218–251.36 Ibid.37 Griffin, A. (2018, February). Our Stories, Our Struggles, Our Strengths. The Education Trust. Retrieved from https://edtrust.org/wp-content/uploads/2018/02/Our-
Stories-Our-Struggles-Our-Strengths-FINAL.pdf38 Bristol, T.J. & Mentor, M. (2018, June). Policing and Teaching: The Positioning of Black Male Educators as Agents in the Universal Carceral Appa-
ratus. Urban Review. 50: 218. 39 Ingersoll, R. & May, H. (2011). Recruitment, retention, and the minority educator shortage. Consortium for Policy Research in Education, Univer-
sity of Pennsylvania and Center for Educational Research in the Interest of Underserved Students, University of California, Santa Cruz.