Developing a Prototype ALHAT Human System Interface for ...
14
1 Developing a Prototype ALHAT Human System Interface for Landing Robert L. Hirsh NASA/JSC 2010 NASA Pkwy Houston, TX, 77058 robert.l.hirsh@nasa.gov Zarrin K. Chua Georgia Institute of Technology 270 Ferst Drive Atlanta, GA 30332 zarrin@gatech.edu Todd A. Heino NASA/JSC 2010 NASA Pkwy Houston, TX, 77058 todd.heino@nasa.gov Al Strahan NASA/JSC 2010 NASA Pkwy Houston, TX, 77058 alan.l.strahan@nasa.gov Laura Major The Charles Stark Draper Laboratory, Inc 555 Technology Square, MS15 Cambridge, MA 02139 lmajor@draper.com Kevin Duda The Charles Stark Draper Laboratory, Inc 555 Technology Square, MS15 Cambridge, MA 02139 kduda@draper.com Abstract— NASA’s Autonomous Landing and Hazard Avoidance Technology (ALHAT) project is developing technologies for safe landing anytime/anywhere on planetary surfaces. Minimizing time, thus minimizing fuel consumption, is critical during landing, so ALHAT displays must convey information efficiently to operators. The ALHAT Human System Interface (HSI) team developed prototype displays, explored methods of providing situation awareness, and modeled the cognitive task and information requirement for landing site selection. Input from NASA astronauts and mission controllers was solicited to refine ALHAT display concepts in a series of evaluations. This paper discusses the evolution of ALHAT displays and future plans for ALHAT HSI. 1,2 TABLE OF CONTENTS 1. INTRODUCTION.................................................................1 1.1 ALHAT BACKGROUND..................................................2 1.2 ALHAT TRAJECTORY ...................................................2 1.3 DEMMAKER BACKGROUND..........................................3 2 METHODOLOGY ................................................................5 2.1 COGNITIVE MODELING..................................................5 2.2 DISPLAY DEVELOPMENT................................................7 2.3 PROTOTYPE EVALUATION .............................................9 2.4 FIELD TESTING...............................................................9 3. CONCLUSION ..................................................................10 3.1 FUTURE WORK.............................................................10 4. ACKNOWLEDGEMENTS ..................................................11 REFERENCES ......................................................................12 BIOGRAPHY ........................................................................13 1. INTRODUCTION The Autonomous Landing and Hazard Avoidance Technology (ALHAT) project is developing technologies to facilitate safe and precise landing anytime and anywhere on the Moon or other planetary surfaces. Additionally, the landing system must be capable of operating in any lighting 1 978-1-4244-7351-9/11/$26.00 ©2011 IEEE 2 IEEEAC paper#1443, Version 3, Updated January 11, 2011 condition, in the presence of any “thruster generated” regolith clouds, without the help of pre-deployed navigational aids, and without a prepared landing pad at the target site. These challenging capabilities necessitate the development of new sensor technology and computer algorithms. The current standard of landing systems is progressing from a reliance on human perception-based sensing to a collaborative effort of human and system. This new standard, implemented by ALHAT, provides two distinct advantages over the previous Apollo missions for lunar- based applications. By introducing augmented sensing technologies (thereby reducing the impact of the physical limitations in human vision [1] [2]), the ALHAT system retains human operator input during critical mission phases and extends the range of lighting, topography, and orbital conditions of lander operation. The latter advantage translates to a potential increased frequency of flights to the Moon, significantly beyond the few monthly flights available to the Apollo missions [3]. However, minimizing fuel consumption during the landing sequence is still of key importance in vehicle and trajectory design. Much of this fuel can be conserved by reducing the crew workload during landing point designation (LPD), or the landing site selection process. This critical decision- making period and the following implementation can be costly, as noted in the Apollo 11 landing. An extra 180kg (400 lbs) of fuel was consumed by the pilot’s manual hover and landing site designation activities [4]. This fuel reserve was particularly generous given the strict vehicle mass budget; the lander mass was reduced via chemical milling so aggressively that structural fatigue failures occurred [5][6]. In general, each second of hovering consumed ~5kg of fuel and oxidizer [4]. Preliminary studies [7] have estimated 12-28s as the required time to complete LPD – this estimation does not include the time to command the lander to the ground.
Transcript of Developing a Prototype ALHAT Human System Interface for ...

1
Developing a Prototype ALHAT Human System Interface for Landing
Robert L. Hirsh
NASA/JSC 2010 NASA Pkwy
Houston, TX, 77058 [email protected]
Zarrin K. ChuaGeorgia Institute of Technology
270 Ferst Drive Atlanta, GA 30332 [email protected]
Todd A. HeinoNASA/JSC
2010 NASA Pkwy Houston, TX, 77058 [email protected]
Al Strahan NASA/JSC
2010 NASA Pkwy Houston, TX, 77058
Laura Major The Charles Stark Draper Laboratory, Inc
555 Technology Square, MS15 Cambridge, MA 02139
Kevin Duda
The Charles Stark Draper Laboratory, Inc 555 Technology Square, MS15
Cambridge, MA 02139 [email protected]
Abstract— NASA’s Autonomous Landing and Hazard Avoidance Technology (ALHAT) project is developing technologies for safe landing anytime/anywhere on planetary surfaces. Minimizing time, thus minimizing fuel consumption, is critical during landing, so ALHAT displays must convey information efficiently to operators. The ALHAT Human System Interface (HSI) team developed prototype displays, explored methods of providing situation awareness, and modeled the cognitive task and information requirement for landing site selection. Input from NASA astronauts and mission controllers was solicited to refine ALHAT display concepts in a series of evaluations. This paper discusses the evolution of ALHAT displays and future plans for ALHAT HSI.1,2
TABLE OF CONTENTS
1. INTRODUCTION .................................................................1 1.1 ALHAT BACKGROUND ..................................................2 1.2 ALHAT TRAJECTORY ...................................................2 1.3 DEMMAKER BACKGROUND ..........................................3 2 METHODOLOGY ................................................................5 2.1 COGNITIVE MODELING ..................................................5 2.2 DISPLAY DEVELOPMENT ................................................7 2.3 PROTOTYPE EVALUATION .............................................9 2.4 FIELD TESTING ...............................................................9 3. CONCLUSION ..................................................................10 3.1 FUTURE WORK .............................................................10 4. ACKNOWLEDGEMENTS ..................................................11 REFERENCES ......................................................................12 BIOGRAPHY ........................................................................13
1. INTRODUCTION
The Autonomous Landing and Hazard Avoidance Technology (ALHAT) project is developing technologies to facilitate safe and precise landing anytime and anywhere on the Moon or other planetary surfaces. Additionally, the landing system must be capable of operating in any lighting 1 978-1-4244-7351-9/11/$26.00 ©2011 IEEE 2 IEEEAC paper#1443, Version 3, Updated January 11, 2011
condition, in the presence of any “thruster generated” regolith clouds, without the help of pre-deployed navigational aids, and without a prepared landing pad at the target site. These challenging capabilities necessitate the development of new sensor technology and computer algorithms.
The current standard of landing systems is progressing from a reliance on human perception-based sensing to a collaborative effort of human and system. This new standard, implemented by ALHAT, provides two distinct advantages over the previous Apollo missions for lunar-based applications. By introducing augmented sensing technologies (thereby reducing the impact of the physical limitations in human vision [1] [2]), the ALHAT system retains human operator input during critical mission phases and extends the range of lighting, topography, and orbital conditions of lander operation. The latter advantage translates to a potential increased frequency of flights to the Moon, significantly beyond the few monthly flights available to the Apollo missions [3].
However, minimizing fuel consumption during the landing sequence is still of key importance in vehicle and trajectory design. Much of this fuel can be conserved by reducing the crew workload during landing point designation (LPD), or the landing site selection process. This critical decision-making period and the following implementation can be costly, as noted in the Apollo 11 landing. An extra 180kg (400 lbs) of fuel was consumed by the pilot’s manual hover and landing site designation activities [4]. This fuel reserve was particularly generous given the strict vehicle mass budget; the lander mass was reduced via chemical milling so aggressively that structural fatigue failures occurred [5][6]. In general, each second of hovering consumed ~5kg of fuel and oxidizer [4]. Preliminary studies [7] have estimated 12-28s as the required time to complete LPD – this estimation does not include the time to command the lander to the ground.
2
In order to facilitate crew workload and to assist in information presentation, the ALHAT Human Systems Interface (HSI) team is studying methods for effective crew-automation interaction during landing scenarios, LPD in particular, and is developing appropriate descent and landing displays to facilitate this activity. The designed displays are representative prototypes which are continuously refined through multiple feedback sessions with the Astronaut Office at NASA Johnson Space Center (JSC) [8].
Although the ALHAT System is applicable to any celestial body, the majority of the work has been focused on lunar landing. This paper begins by presenting background information on the ALHAT project, the expected lighting conditions at the Moon, and the challenges these conditions pose to human vision. The paper presents cognitive models used to inform and to assist in display design and the development of several prototype displays: the TPD (Trajectory Profile Display), LPD (Landing Point Designation) display, and PFD (Primary Flight Display). The authors conclude with a summary of results and future work for the HSI team.
1.1 ALHAT SYSTEM
The ALHAT [11] System is a revolutionary new method to address the challenges of safely landing a crewed or robotic lander on the Moon or other planetary surfaces. ALHAT is a joint effort between NASA JSC, NASA Jet Propulsion Laboratory, NASA Langley Research Center, Charles Stark Draper Laboratory, and Johns Hopkins University Applied Physics Laboratory (JHUAPL). ALHAT uses cutting edge
advancements in Light Detection and Ranging (LIDAR) technology to accurately capture 3-D surface topography (at ~10cm resolution) at long ranges (~1km) under any lighting conditions (even complete darkness). ALHAT's software algorithms use the LIDAR scans, along with other sensor data, to detect landing hazards and to autonomously guide the spacecraft to a safe landing site. However, NASA's commitment to safety (and flexibility) will almost certainly require astronaut crews to be able to monitor the vehicle (and ALHAT data) and exert manual control, even if the vehicle is highly automated.
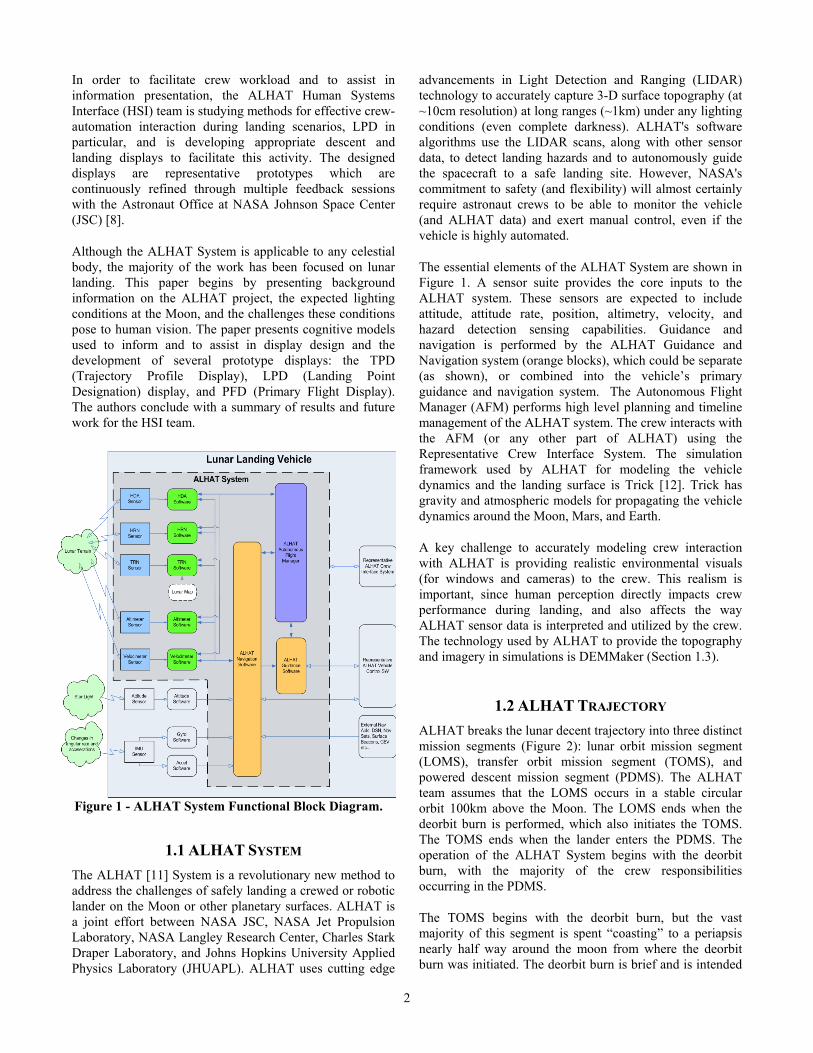
The essential elements of the ALHAT System are shown in Figure 1. A sensor suite provides the core inputs to the ALHAT system. These sensors are expected to include attitude, attitude rate, position, altimetry, velocity, and hazard detection sensing capabilities. Guidance and navigation is performed by the ALHAT Guidance and Navigation system (orange blocks), which could be separate (as shown), or combined into the vehicle’s primary guidance and navigation system. The Autonomous Flight Manager (AFM) performs high level planning and timeline management of the ALHAT system. The crew interacts with the AFM (or any other part of ALHAT) using the Representative Crew Interface System. The simulation framework used by ALHAT for modeling the vehicle dynamics and the landing surface is Trick [12]. Trick has gravity and atmospheric models for propagating the vehicle dynamics around the Moon, Mars, and Earth.
A key challenge to accurately modeling crew interaction with ALHAT is providing realistic environmental visuals (for windows and cameras) to the crew. This realism is important, since human perception directly impacts crew performance during landing, and also affects the way ALHAT sensor data is interpreted and utilized by the crew. The technology used by ALHAT to provide the topography and imagery in simulations is DEMMaker (Section 1.3).
1.2 ALHAT TRAJECTORY
ALHAT breaks the lunar decent trajectory into three distinct mission segments (Figure 2): lunar orbit mission segment (LOMS), transfer orbit mission segment (TOMS), and powered descent mission segment (PDMS). The ALHAT team assumes that the LOMS occurs in a stable circular orbit 100km above the Moon. The LOMS ends when the deorbit burn is performed, which also initiates the TOMS. The TOMS ends when the lander enters the PDMS. The operation of the ALHAT System begins with the deorbit burn, with the majority of the crew responsibilities occurring in the PDMS.
The TOMS begins with the deorbit burn, but the vast majority of this segment is spent “coasting” to a periapsis nearly half way around the moon from where the deorbit burn was initiated. The deorbit burn is brief and is intended
Figure 1 - ALHAT System Functional Block Diagram.

3
to adjust the orbit around the moon. At this periapsis, the vehicle is in an elliptical orbit of 15 × 100km on the other side of the Moon. On planetary bodies with an atmosphere, such as Mars, this may not be a stable elliptical orbit due to atmospheric drag. However, on bodies where atmospheric effects are not significant, the lander could potentially wait multiple orbits before transitioning to the PDMS.
The PDMS is the most intensive and demanding segment (with respect to workload [3]) of the landing sequence. During this time-limited segment, the vehicle must negate the majority of the orbital velocity, maneuver to a desired general landing area, scan the landing area for hazards, and then precisely navigate to the selected landing site. Because of the dynamic and time sensitive nature of the activities in this phase, the PDMS is the focal point of HSI development activities. Presenting pertinent information to the crew in a format that facilitates quick decisions is key to safe landing with minimum fuel costs.
1.3 DEMMAKER BACKGROUND
The HSI team relies on crew evaluations to periodically refine and update the landing displays. As such, high-fidelity simulated environments are necessary to accurately represent visuals (from a window or a camera) that the crew would experience in an actual landing. This accuracy is critical as crew performance and the use of sensor data and AFM outputs is sensitive to the crew’s perception of the terrain. DEMMaker [13] is a product developed by the JHUAPL. DEMMaker is a full featured terrain generation and shading tool suite that can make a Digital Elevation
Map (DEM) for a specified area, as well as a Surface Reflectivity Map (SRM) for a set time and date (Figure 4). Although the DEM would not change based on time, the SRM would vary because the length and direction of shadows would change, thereby affecting the perceived image.
Changes in lighting angle, surface albedo, and terrain features (rocks, craters, slopes) all impact the way the surface appears to the human eye. The Apollo 12 astronauts specifically mentioned the optical illusions produced by lighting on the Moon, and the difficulty they had ascertaining slopes due to deep shadows and the visual effects of the lunar environment [14]. Accurately modeling surface topography and imagery is critical to determining the effect of terrain and lighting on the human pilot.
DEMMaker starts with an input base map from an existing lunar database (e.g., Clementine imagery), and then adds synthetic rocks and craters onto the base map. The specific frequency and size distribution of the rocks and craters are added onto the base map according to specified mathematical models, which can be tailored to the lunar surface. Using this process, DEMMaker can generate a realistic representation of the terrain to any desired resolution that fundamentally, is consistent to an existing
database of real values. DEMMaker cannot produce the actual surface terrain, but produces data statistically similar to true terrain.
There is no existing lunar terrain data with sufficient precision to support the ALHAT sensor scan resolution (~10cm). Providing realistic sensor data for the sensor algorithms (and sensor simulators) is critical to validating the ALHAT system. In addition to providing terrain data to
Figure 3: Out the window view. Terrain and shading
information generated by DEMMaker used to generate a view on the Moon. The green Outline is the approximate
area of the DEM from Figure 4 (b).
Figure 2: ALHAT Trajectory Overview. Mission segments
are shown in upper left, rough timeline in upper right. Powered Decent Mission Segment (PDMS) shown along bottom.

4
test the ALHAT sensors, the DEMMaker suite is also able to supply a corresponding rendered image view of the same terrain as it would appear to the human eye. The limit of human vision (“20/20”) is approximately 1 arc minute, which equates to about ~0.5m (or 1.6 ft) at a range of 1.6km (1 mi). Even the highest resolution Lunar Reconnaissance Orbiter (LRO) imagery data will therefore be insufficient detail for landing operations at ranges below 1.6km, which is exactly when visuals are most important for landing.
Analyzing the performance of the ALHAT sensors and human operators does not require obtaining the actual lunar terrain to the level of resolution needed by the sensors. All that is required is that the generated surfaces being used are “representative” of the lunar surface to that level of detail. DEMMaker data has provided both of these critical capabilities to ALHAT: simulated LIDAR scans (Figure 4(d)) and out-the-window visualization (Figure 3).
(a) Shaded terrain from DEM in (b). Sun is at an elevation of 15 degrees, and is shining in a roughly
left-to-right direction.
(b) Digital Elevation Map. Shading indicates elevation. White is highest, black is lowest elevation. Small lighter
patches are rocks, small darker regions are craters.
(c) Shaded terrain from DEM in (b). Sun is at an elevation of 1 degree, and is shining in a roughly
left-to-right direction. Note the very long shadows cast by rocks, and that only the lips of the far rims
of craters are lit.
(d) Hazardous areas. Red is added to the image from (c) to represent areas where ALHAT algorithms detect
slope or roughness beyond specified limits for the DEM in (b), and highlights hazardous regions otherwise
invisible in (c)
Figure 4: Various images of a 180x180m region near the rim of Shackleton Crater (near lunar South Pole).

5
2 METHODOLOGY
This section provides an overview of the work that has been performed as part of ALHAT HSI over the past two years. This includes a description of the human cognitive modeling that has been completed, a description of the evolution of the display/graphical interfaces over this time, and a description of display development that was performed in support of ALHAT field testing.
2.1 COGNITIVE MODELING
Developing flight displays and determining the appropriate human interaction with automation requires a thorough understanding of the astronaut’s cognitive states, sources of information, and task requirements, particularly for dynamic scenarios such as LPD. To help visualize these elements, three models were created: an automation assessment, an information flow diagram and a cognitive task analysis.
Automation Assessment
Initially, the LPD task appears straightforward – select a landing site. However, this main task is multi-dimensional, breaking into smaller subtasks that involve data collection and analysis, solution generation, solution selection, and task execution. Each of these subtasks can be distributed to various operators such as an automated system, the on-board crew, or ground control. In the case of ALHAT, the possible parties consisted of the first two options, as ground control was not considered as a feasible option to perform this task. To better understand the roles of the AFM and the on-board crew, the ALHAT task was defined under the taxonomy described by Endsley and Kaber [15] with the appropriate operators assigned.
This taxonomy was chosen over other architectures such as those proposed by Sheridan [16], Parasuraman et al. [17], and Proud and Hart [18]. Sheridan’s model, while also ten points, does not decompose the task into multi-dimensions and focuses more on operator authority. Parasuraman et al. and Proud and Hart were architectures more appropriate for
the design of automated systems rather than the definition of a system post hoc.
Endsley and Kaber proposed ten levels of automation, each level defined by the assignment of four fundamental responsibilities: monitoring, generating, selecting, and implementing. LPD can be decomposed into these four responsibilities: the operator monitored the LPD task and the mission status by scanning displays or evaluating terrain (with a digital or biological sensor); the operator generated possible landing sites for touchdown; the operator selected a landing site; and the operator implemented the task by commanding the vehicle to this final touchdown point. The allocation of responsibilities for LPD is listed in Table 1.
As illustrated in Table 1, the LPD task can be completed by large number of AFM/Crew combinations, several of which are not included in the Endsley and Kaber’s ten-point scale. The lack of linearity in this taxonomy makes ranking these combinations difficult. For example, the ALHAT approach to LPD does not fall cleanly into one level, but rather, elements match that of levels 6 and 7. As none of these levels could be considered as part of an absolute scale, a better approach to classifying the amount of automation on the ALHAT system is relative comparisons to other
Figure 5: Information Flow Diagram for Landing Point Designation. Boxes in gray designate information not provided
explicitly by the AFM. Dashed lines indicate the information comes from multiple sources.
Table 1. Levels of Automation as they relate to roles of the AFM and the Crew.
Lvl Role (H = Human, A = AFM) System 1 H mon. terrain; H gen. landing options; H sel. site; H diverts to site. Manual 2 H/A mon. terrain/display; H gen. landing options; H sel. sites; H/A diverts to site. Apollo 3 H/A mon. terrain/display; H gen. landing options; H sel. sites; A diverts to site. 4 H/A mon. terrain/display; H gen. landing options/A gen. options; H sel. sites; H/A diverts to
site.
5 H/A mon. terrain/display; H gen. landing options/A gen. options; H sel. sites; A diverts to site. 6 H/A mon. terrain/display; H gen. landing options/A gen. options; H sel. sites within time or A
selects; A diverts to site. ALHAT
7 H/A mon. terrain/display; A gen. landing options; H sel. sites; A diverts to site. 8 H/A mon. terrain/display; H sets landing site preferences/A gen. landing options; A sel. sites; A
diverts to site.
9 H/A mon. terrain/display; A gen. landing options; A sel. sites; A diverts to site. 10 A mon. terrain/display; A gen. landing options; A sel. sites; A diverts to site. Robotic

6
systems. Under this taxonomy, a fully manual approach is assigned to level 1, the Apollo landings are defined as level 2, and robotic landings are characterized by level 10. Although this taxonomy provides a more detailed definition of where Apollo and ALHAT automation roles differ, to state that ALHAT is “three times the amount of automation” would be inappropriate. Overall, this automation assessment provides a breakdown of the responsibilities of the AFM and the crew and illustrates how the ALHAT allocation differs from the two extremes (manual, robotic) and Apollo.
Information Flow Diagram
An information flow diagram was created to better understand the type of information needed and to assist in the design of the appropriate display. This diagram is modified from the work of Beyer and Holtzblatt [19], who proposed using flow diagrams to capture communication between team members. This graphical representation enables one to quickly assess critical communication breakdowns and capture specific roles of organization members. The LPD information flow diagram tracks each chunk of information and its origin(s), thus permitting a check of information redundancy. This diagram is illustrated in Figure 5.
Figure 5 highlights the diversity of information presented to the crew. Some information chunks, such as mission goals, knowledge of the cargo, crew, and vehicle, are not explicitly presented by the AFM or present in the cockpit, but may shape the behavior of the LPD decision-making process. Several pieces of information emanate from different sources, improving system redundancy but (possibly) adding more clutter to the displays.
Cognitive Task Analysis
The automation assessment decomposed the LPD task into four smaller subtasks. But this initial breakdown does not describe in detail the tasks themselves, the cognitive process, or the task sequence. Previous studies [20] [21] have performed cognitive task analyses (CTA) on LPD, but these studies assume task linearity and do not convey
information regarding the knowledge state. Smith et al. [22] presented a CTA on LPD that includes sources of information, but still proposes a predominantly linear task. However, their use of Rasmussen’s decision ladder [23] provides an effective means of describing and analyzing the LPD task.
A new cognitive task analysis was proposed, using elements from Rasmussen’s decision ladder [23]. Rasmussen proposes a linear task diagram that captures instances of skipping steps or an extension of existing knowledge. These occurrences are defined as shunts (when a subtask leads the operator to a defined knowledge state) and leaps (when an existing knowledge state is closely associated with another knowledge state). The introduction of these two elements is critical for LPD as the dynamic nature of the task cannot be accurately captured by a linear sequence.
Several major differences exist between this analysis and previous designs. In an attempt to incorporate results from the automation assessment and the information task diagram, the diagram in Figure 6 notes the information sources (dashed boxes) and role/state of the automation (in dark blue). Shunts and leaps are represented by curved thick and thin lines, respectively. This task diagram also notes the effect of the environment, particularly the sun angle and terrain characteristics.
As illustrated in Figure 6, the LPD task is composed of several smaller steps. Immediately after pitch-up, the crew is expected to perceive the terrain through the vehicle window (or a synthetic view). If the terrain visibility is poor or distorted by the window, they may need to reorient to better observe the terrain. As seen in the Apollo landings [24], the crew is expected to search for a previously identified hazard pattern, allowing them to gain awareness over the situation. This procedure of orienting to the terrain grants the crew knowledge regarding the general terrain, the location of the lander, and expectancies on the task and AFM outputs. New information such as the ranked alternative sites, the intensity of hazards, and mission status is presented to the crew after receiving the AFM results. Previous studies [7] have shown that the crew partitions the map into zones, or areas under consideration for further inspection. These zones are generally composed of “good” terrain or “bad” terrain – the crew focuses on the former and neglects the later. Within these zones, the crew evaluates the site(s) based on terrain metrics, selects an appropriate site, and the vehicle diverts to the site. If the appropriated LPD phase time runs out, the AFM automatically diverts to the top ranking site.
Although the main thread of this task appears linear, there are several shunts and leaps that introduce places where the crew may draw faster conclusions and/or do not require additional steps to gain the necessary information. For example, based on mission training, the crew may have already divided the lunar area into zones and know what
Figure 6: Information Sources for Cognitive Modeling.
7
they want to focus on, therefore opting not to participate in extensive orientation to the terrain. Similarly, the crew may have a certain site in mind before the AFM results are presented and may not require any other procedures before selecting a site. In these two instances, the LPD task is completed in half the number of steps.
2.2 DISPLAY DEVELOPMENT
HSI development for ALHAT has focused on displays and controls that are appropriate for PDMS (Figure 2) [25]. Based on the desired capabilities and interface requirements for the HSI system, the landing trajectory displays and controls were developed using the Dynamic Onboard Ubiquitous Graphics (DOUG) and Engineering DOUG Graphics for Exploration (EDGE) packages [26]. This software provided the platform to develop both the 3-D out-the-window environment and the crew displays.
The ALHAT HSI team designed a Representative Crew Interface (RCI) (see Figure 1), which currently consists of three flight displays: the primary flight display (PFD), the trajectory profile display (TPD), and the LPD display (LPDD). Each of these displays presents information specific to a particular mission phase, or represents critical information to the crew in different formats. With the aid of astronaut feedback, the RCI has undergone multiple revisions and updates, most recently resulting in the facility depicted in Figure 15.
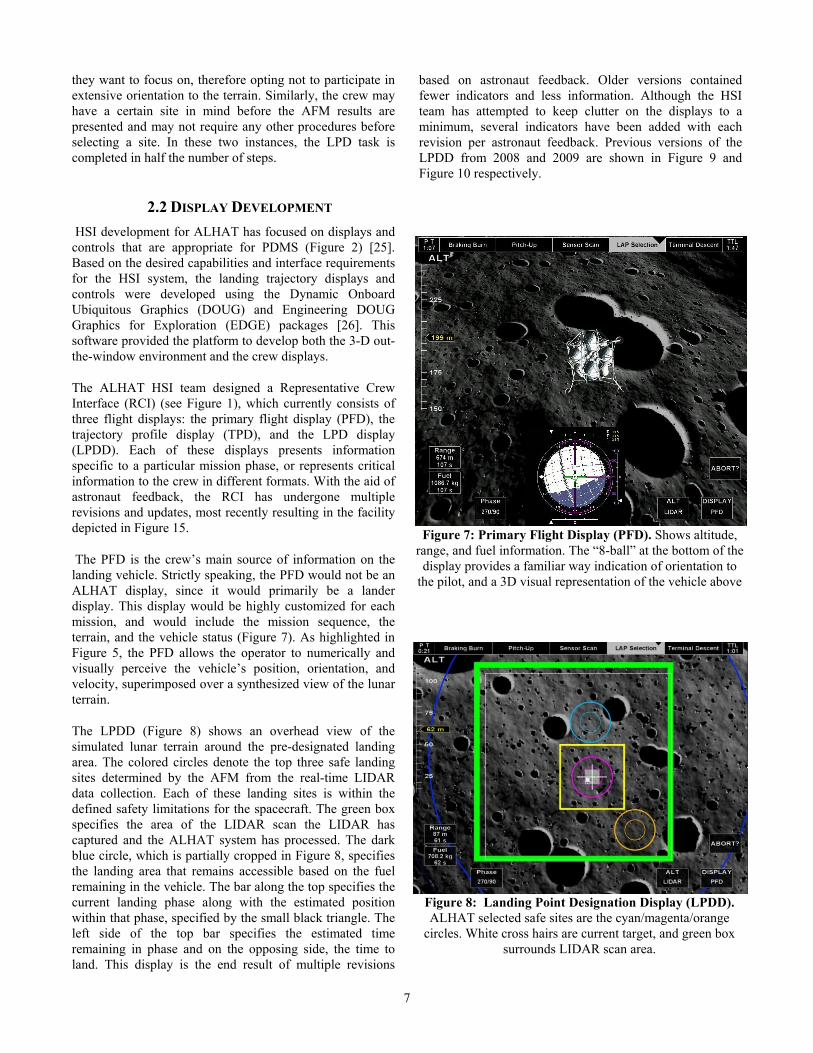
The PFD is the crew’s main source of information on the landing vehicle. Strictly speaking, the PFD would not be an ALHAT display, since it would primarily be a lander display. This display would be highly customized for each mission, and would include the mission sequence, the terrain, and the vehicle status (Figure 7). As highlighted in Figure 5, the PFD allows the operator to numerically and visually perceive the vehicle’s position, orientation, and velocity, superimposed over a synthesized view of the lunar terrain.
The LPDD (Figure 8) shows an overhead view of the simulated lunar terrain around the pre-designated landing area. The colored circles denote the top three safe landing sites determined by the AFM from the real-time LIDAR data collection. Each of these landing sites is within the defined safety limitations for the spacecraft. The green box specifies the area of the LIDAR scan the LIDAR has captured and the ALHAT system has processed. The dark blue circle, which is partially cropped in Figure 8, specifies the landing area that remains accessible based on the fuel remaining in the vehicle. The bar along the top specifies the current landing phase along with the estimated position within that phase, specified by the small black triangle. The left side of the top bar specifies the estimated time remaining in phase and on the opposing side, the time to land. This display is the end result of multiple revisions
based on astronaut feedback. Older versions contained fewer indicators and less information. Although the HSI team has attempted to keep clutter on the displays to a minimum, several indicators have been added with each revision per astronaut feedback. Previous versions of the LPDD from 2008 and 2009 are shown in Figure 9 and Figure 10 respectively.
Figure 7: Primary Flight Display (PFD). Shows altitude,
range, and fuel information. The “8-ball” at the bottom of the display provides a familiar way indication of orientation to
the pilot, and a 3D visual representation of the vehicle above
Figure 8: Landing Point Designation Display (LPDD). ALHAT selected safe sites are the cyan/magenta/orange
circles. White cross hairs are current target, and green box surrounds LIDAR scan area.

8
Several additional cockpit displays were developed for the vehicle mockup and demonstrations. Figure 12 is a screenshot of the Trajectory Profile Display (TPD). The TPD is designed to provide astronauts an overall mission awareness during the entire landing sequence and is the result of multiple crew requests. The vehicle icon does not move and sits at a position 20% from the left and 40% from the top of the main box of the display. The background of the display includes a nominal trajectory line, as well as an upper and lower bounding line. Further, the system generates both history dots and predictor dots based on the current and past path taken by the vehicle. Units for the altitude and ground range tape are given in feet and nautical miles as preferred by the astronauts. The tapes along with the background elements are constantly moving to coincide
with actual vehicle position. The HDOT bar on the left shows elevation velocity specified by the white bar and elevation acceleration specified by the black diamond. The HDOT bar in the image is showing that the vehicle is decelerating and is at a current velocity down of 48fps. There are additional text readouts in the upper right hand corner of the display. As the vehicle comes closer to landing the display zooms-in automatically at a priori points. Like the PFD, this display has a history of multiple revisions as well. The TPD display originated from a suggestion in a 2009 astronaut evaluation. The first version of this display was developed for the May 2010 evaluation (shown in Figure 11), and the current version is shown in Figure 12.
Figure 9: An Early Design of the Landing PointDesignation Display (LPDD). The hazardous areas areall “hand drawn” onto the low resolution display. (2008)
Figure 10: Intermediate Design of the Landing Point Designation Display (LPDD). This version of the LPDD
includes high resolution terrain, and a hazard indication based on local slope. (2009)
Figure 11: Initial Trajectory Flight Display (TFD). Shows altitude, range to landing site, and vehicle pitch
relative to the gravity vector (May 2010).
Figure 12: Trajectory Profile Display (TPD). Indicates the current vehicle position, along with predictor and history dots. The line above and below the trajectory indicates the
“recommended corridor” for reaching the target landing site.

9
The displays were developed with the foresight of change and customization which has been invaluable while interfacing with the Astronaut Office. This modularity has allowed for rapid development of new displays and customization of existing displays as required by the astronauts.
2.3 PROTOTYPE EVALUATION
This capabilities included in the HSI displays were driven by the astronaut evaluation. Several intermediate iterations of the displays are included in this paper (Figures 11, 12, 13). Each version of the display included additional information and capabilities, and more specifics from the evaluations are detailed in the paper by Major [8].
The HSI displays were initially tested using standard PC flatscreen displays in an office workstation. However, this arrangement could not provide the sufficient resources to present all of the information. As such, the HSI team is testing in the System Engineering Simulation (SES) [9][10] dome at JSC using an existing mock cockpit (Figure 13). Three monitors were used to represent a variety of out-the-window views or unique flight displays. Each monitor is a
15in widescreen and operates at a resolution of 1440 × 1050px. Each screen can run separate top and bottom displays, allowing for the possibility of simultaneously operating up to six individual displays. This configuration was selected to accurately simulate a notional external and internal vehicle environment and to provide basis for accurate assessment of the ALHAT system effectiveness.
The SES utilizes multiple networked computers and projectors to render a panoramic image on the interior of a large domed enclosure. A mockup of the lander cockpit, complete with windows, is then placed inside this enclosure to give the operator an immersive “virtual window” that more accurately simulates the view of the terrain during landing. Additionally, the curvature of this panoramic screen adds a perception of depth to the imagery, as moving closer to the window will increase the subject’s field of view (see Figure 15). Because of the added visual realism, the SES dome provides a more accurate assessment of the astronauts’ display design preferences.
2.4 FIELD TESTING
In addition to working to develop displays for simulations of lunar landings, the ALHAT HSI team has also worked to support Earth-based field testing, evaluating potential interface concepts. The Advance Situational Awareness Tool (ASAT) designed by Rapid Imaging Software [27] was tested during ALHAT Field Test 4 (FT4) in July 2010. ASAT provides a real-time situation awareness display showing terrain, ortho-imagery, waypoints, target points, vehicle heading, vehicle course, sensor foot print, LIDAR target area, and LIDAR mosaic footprints.
Using ASAT was not a core requirement to performing FT4, but was designed to investigate the suitability of this type of interface. ASAT was designed to enhance the operator’s situational awareness during the flight by providing a 3-D representation of the vehicle data in real time. During this test, however, the onboard human operator
Figure 13: Cockpit mockup. Shows three 15-inch display panels and hand controllers inside the cockpit mockup.
Figure 14: Advanced Situational Awareness Technology (ASAT) Display. Showing technologies produced for ALHAT Field Test 4 (July 2010).
10
was overworked by the primary tests. Therefore, the situational awareness capabilities provided by ASAT were not explored in-flight as thoroughly as originally planned. Nevertheless, the recorded telemetry stream provided a reproduction of the in-flight sequence. In Figure 14, the ALHAT target field is marked by the red box, along with blue waypoints (labeled as “WA-#”) that were used to align the approach on the target field. The square in the far left is the overhead map display, which is similar to an in-car Global Position System, where the Z information is removed and only the X-Y location is shown, with the vehicle always in the center of the map. The ASAT displays are still under development and future ALHAT field tests are expected to perform more in-depth analysis of the tool’s situational awareness capabilities.
3. CONCLUSION
In order to take advantage of more landing opportunities and venture to more challenging landing locations, future landers need to utilize sensors besides human eyes for scanning the surface. The ALHAT HSI system must effectively convey AFM information to the operator so that landings can occur during less “optimal” conditions (lighting, surface terrain, slopes, etc) than was possible during Apollo missions. By proving this capability, ALHAT will simultaneously provide more flexible access to the moon, and greater safety margins for future landers.
A Representative Crew Interface (RCI) has been developed by ALHAT as a platform for prototype visualization and interaction concepts [28]. The RCI facilitates analysis of the crew interaction with the ALHAT sensors, AFM, Guidance, and Navigation systems. The current analysis focuses on determining the best level of crew involvement during lunar landing, as well as exploring crew tasking and display information requirements. In order to effectively determine the appropriate crew role and information needs, the ALHAT team is collaborating with representatives from the Astronaut Office and Mission Operations Directorate (MOD)[8]. Periodic evaluations are conducted to refine the design of the prototype Crew Interface System concepts and the development of the ALHAT system. The results from these evaluations have shaped the prototype displays for use during the PDMS.
The HSI development process has leveraged DEMMaker to generate high resolution terrain models (and shading). The realistic lunar terrain and shading is used for window and camera views, and is also used by the simulated ALHAT sensors. These sensors provide data for the ALHAT flight software to process while attempting to find safe landing locations. The resulting data congruency is required to provide ALHAT data to the operator that is consistent with what is seen out the window view. This consistency is in turn key to producing/validating an accurate model of how operators will react during landing operations.
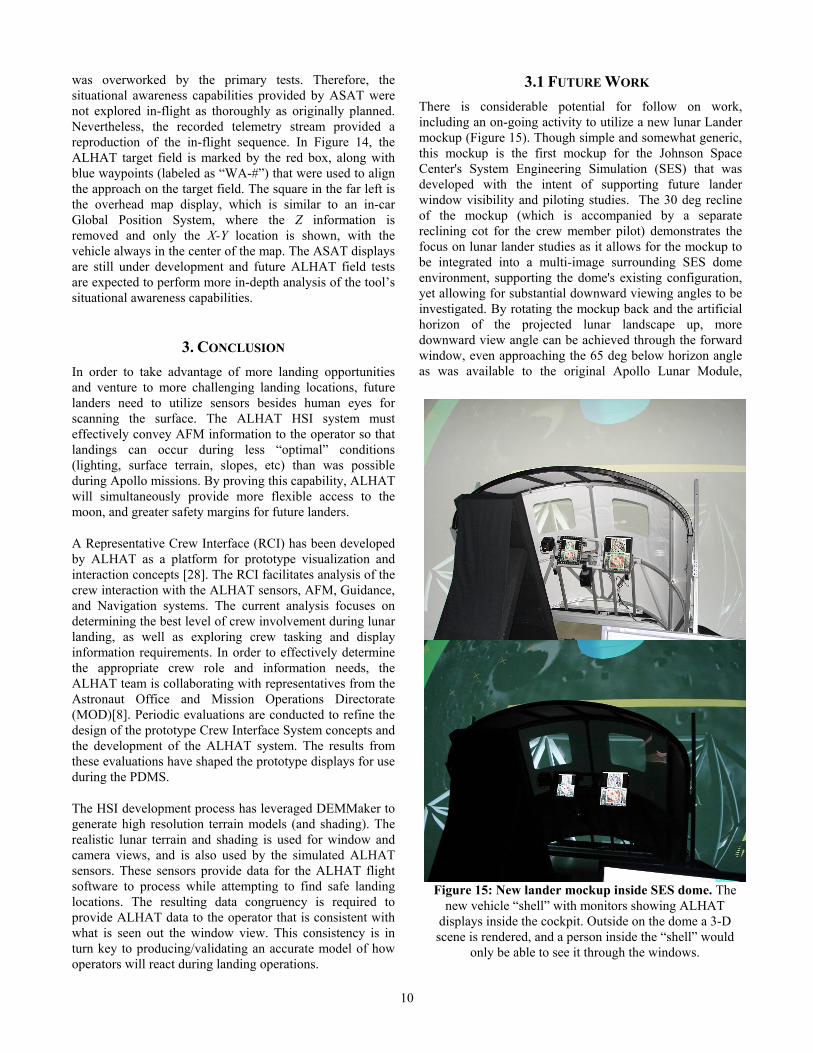
3.1 FUTURE WORK
There is considerable potential for follow on work, including an on-going activity to utilize a new lunar Lander mockup (Figure 15). Though simple and somewhat generic, this mockup is the first mockup for the Johnson Space Center's System Engineering Simulation (SES) that was developed with the intent of supporting future lander window visibility and piloting studies. The 30 deg recline of the mockup (which is accompanied by a separate reclining cot for the crew member pilot) demonstrates the focus on lunar lander studies as it allows for the mockup to be integrated into a multi-image surrounding SES dome environment, supporting the dome's existing configuration, yet allowing for substantial downward viewing angles to be investigated. By rotating the mockup back and the artificial horizon of the projected lunar landscape up, more downward view angle can be achieved through the forward window, even approaching the 65 deg below horizon angle as was available to the original Apollo Lunar Module,
Figure 15: New lander mockup inside SES dome. The new vehicle “shell” with monitors showing ALHAT
displays inside the cockpit. Outside on the dome a 3-D scene is rendered, and a person inside the “shell” would
only be able to see it through the windows.

11
providing target visibility late in the approach trajectory.
The ALHAT Project will use the new lander mock-up for future evaluation studies because it has larger out-the-window view angles, and is more consistent with reference designs for future lunar landers. Further research is also being planned utilizing the mockup and SES dome, to fundamentally explore the limitations of the human operator to identify hazards and assess landing sites using out-the-window views of the surface during landing. Understanding the limitations of human visual identification capabilities will then influence how sensor technology will be used to most effectively assist humans during landing. The human operator’s already difficult task will be complicated by the very limited flight time expected for the Approach Trajectory Activities (Figure 2), and the time the target area is visible can be further constrained by vehicle trajectory and configuration. Fuel optimal trajectories are not the same as “optimal viewing” trajectories, so the results of these studies will help guide mission designers as they make those tradeoffs in future vehicles. Sensitivities of lunar surface perception as effected by environmental factors, such as surface roughness and local lighting, may also be explored and used to inform vehicle trajectory and configuration design.
Additional work will be done to follow up this crew out-the-window visibility study by investigating the same sensitivities, though with the provision of additional landing site information to the crew by means of vehicle mounted cameras and, potentially, even synthetically generated topographical information as would be available from the ALHAT hazard detection system. Though much investigative work relating to out-the-window visibility remains, it is believed such augmentation as camera and synthetically generated views will ultimately be preferred by the crew as they add to situational awareness and potential vehicle autonomy.
The HSI team is working in conjunction with other NASA projects to develop ALHAT displays. By sharing experiences with other activities, ALHAT is able to, exchanging lessons learned, reduce unnecessary rework, and limit duplication of effort. Supporting future ALHAT (and related project) field tests is also part of the HSI vision for ALHAT. As these field tests are performed, lessons that can affect the final configuration of operator displays for ALHAT will be learned by participating in hands on testing. In addition, the HSI displays will help operators to successfully complete test operations.
Continued evaluations with astronauts as well as ground controllers will help ensure ALHAT’s HSI work continues to explore the most important aspects of display development, and produces quantitative measurements of the affects of various conditions/displays. Because ALHAT can also support vehicles that have no humans onboard, there will be additional work to “translate” HSI display into
a form that is best suited for remotely interacting with the vehicle.
4. ACKNOWLEDGEMENTS
It should also be noted, this new mockup development described in Section 3.1 was a cooperative effort between the ALHAT Project and the Spacecraft Conceptual Design Office (which was formerly known as the Altair Lunar Lander Project). Special thanks to Jacobs Engineering team for their work building the new lander mockup.
The authors thank Chirold Epp and Ed Robertson for providing support and encouragement for the ALHAT development.
The authors also thank the Astronaut Office for their time and support of the Astronaut Evaluations of the ALHAT HSI systems, especially to Andrew Thomas who has acted as the Astronaut Office representative to ALHAT.
Lastly, the authors thank the NASA Undergraduate Students Researchers Program (USRP) students who worked many long hours to help develop HSI for ALHAT: Michael Baldwin, Nikolas Fernald, Victoria Kaiser, and Matthew Noyes.

12
REFERENCES
[1] Cornsweet, T. M. (1970) Visual Perception. Academic Press, New York.
[2] Richard W. Orloff; David Michael Harland (2006). Apollo: the definitive sourcebook. Springer Science & Business, page 285.
[3] David A. Mindell, Digital Apollo: Human and Machine in Spaceflight, The MIT Press, Cambridge, MA, 2008.
[4] Mission Evaluation Team, “APOLLO 11 MISSION REPORT”, November 1969, page 9-27. Available: http://www.hq.nasa.gov/alsj/a11/A11_MissionReport.pdf [Accessed Oct 26, 2010]
[5] Stanley Weiss, “APOLLO EXPERIENCE REPORT-LUNAR MODULE STRUCTURAL SUBSYSTEM”, March 1973. [Accessed: Oct 26, 2010] http://ntrs.nasa.gov/archive/nasa/casi.ntrs.nasa.gov/19730010174_1973010174.pdf
[6] Kelly, Thomas. Moon Lander: How We Developed the Apollo Lunar Module. Washington, DC: Smithsonian Institution Press, 2001.
[7] Z. Chua, R. Braun, K. Feigh. Analysis of Human-System Interaction for Landing Point Redesignation. Technical Report. May 2009. Available online. http://hdl.handle.net/1853/29921
[8] Major, L.M. and R.L. Hirsh, “Results from the Second Crew Evaluation”, NASA Tech. Rep. ALHAT 11.0-003, National Aeronautics and Space Administration, 2009.
[9] R.H. St. John, G.J. Moorman, B.W. Brown, "Real-time simulation for space station," Proceedings of the IEEE , vol.75, no.3, pp. 383- 398, March 1987.
[10] NASA, “Systems Engineering Simulator”, Software, Robotics and Simulation Division – NASA JSC, June 1, 2008. Available: https://ses.jsc.nasa.gov. [Accessed: Oct 26, 2010].
[11] Epp, C.D., Robertson, E.A., and T. Brady, Autonomous Landing and Hazard Avoidance Technology (ALHAT), in Aerospace Conference, 2008 IEEE, 2008, pp. 1-7.
[12] Paddock, E.J., Lin, A., Vetter, K., Crues, E.Z., “Trick - A Simulation Development Toolkit”, AIAA Modeling and Simulation Technologies Conference and Exhibit, Austin, Texas, Aug. 11-14, 2003.
[13] Shankar, U.J., Criss, T.B., Shyong, W., and Adams, D., “Lunar Terrain Surface Modeling for the ALHAT Program,” in Aerospace Conference, 2008 IEEE, 2008, pp. 1-10.
[14] Mission Operations Branch Flight Crew Support Division, “Apollo 12 Technical Crew Debrief(U)”, Dec 1, 1969. Available: http://history.nasa.gov/alsj/a12/a12-techdebrief.pdf [Accessed: Oct 26, 2010].
[15] Endsley, M.R., Kaber, D. B. Level of Automation Effects on Performance, Situation Awarenes and Workload in a Dynamic Control Task. Ergonomics, vol. 42, No. 3, 1999. 462-492.
[16] T. Sheridan, Telerobotics, Automation, and Human Supervisory Control. 1992. Massachusetts Institute of Technology.
[17] Parasuraman, R., Sheridan, T.B., Wickens, C.D. A Model for Types and Levels of Human Interaction with Automation. IEEE Transactions on Systems, Man, and Cybernetics – Part A: Systems and Humans. Vol. 30, No. 3, May 2000. 286-296.
[18] R. W. Proud, J. J. Hart, R. B. Mrozinski, Methods for Determining the Level of Autonomy to Design into a Human Spaceflight Vehicle: A Function Specific Approach, Performance Metrics for Intelligent Systems Workshop. 2003.
[19] H. Beyer and K. Holtzblatt, Contextual Design. Academic Press. San Diego, CA. 1998.
[20] Z. K. Chua, L. M. Major, and K. M. Feigh, “Modeling cockpit interface usage during lunar landing redesignation,” in International Symposium of Aviation Psychology, 2009.
[21] Z. Chua, L. Major. Task Modeling for Lunar Landing Redesignation. AIAA InfoTech@Aerospace Conference, 2009.
[22] C. Smith, M. Cummings, L. Forest, and L. Kessler. Utilizing Ecological Perception to Support Precision Lunar Landing. Proceedings of HFES 2006. San Francisco, CA, October 2006.
[23] J. Rasmussen, Outlines of a Hybrid Model of the Process Plant Operator. In T. B. Sheridan and G. Johannsen, Monitoring behavior and supervisory control. Pp. 371-383. Plenum. New York.
[24] Marshall Space Center. Apollo 12 Mission Report. National Aeronautics and Space Administration. 1970.

13
[25] R.L. Hirsh, M. Abernathy, V. Kaiser, “Human System Interface Development for ALHAT”, AIAA SPACE 2009 Conference & Exposition, Pasadena, CA, 2009.
[26] Wayne Hale, Wings in Orbit: Scientific and Engineering Legacies of the Space Shuttle. Government Printing Office, (to be published) Feb 2011.
[27] Calhoun, G.L., Draper, M.H., Abernathy, M.F., Delgado, F., & Patzek, M. (2005). “Synthetic vision system for improving unmanned aerial vehicle operator situation awareness”. In Proceedings of SPIE, Enhanced and Synthetic Vision 2005, Vol. 5802, 219-230.
[28] Brady, T., Schwartz, J., and Straube, T., “Operational Concept Description for the Autonomous Landing and Hazard Avoidance Technology (ALHAT),” Tech. Rep. ALHAT 2.0-002, National Aeronautics and Space Administration, 2006.
[29] G. Klein, Sources of Power: How People Make Decisions. MIT: MIT Press, 1998.
BIOGRAPHY
Robert Hirsh is an Aerospace Engineer in the Spacecraft Software Engineering Branch of the Software, Robotics, and Simulation Division at the Johnson Space Center. Robert received a B.S. in Electrical (1997) and a M.S. in Computer Engineering (1999) from Purdue University. He first joined NASA during college as a Co-Op student in 1995, and has been working full time at
JSC since 2001. During his 15 years at JSC he has worked in the design and development of multiple NASA research and development robots. Robert has participated in 10 analog field tests at various locations around the United States. His research interests include computer vision, image processing, computer optimization, and human-computer interaction. Robert is currently acting as the Human-System Interface (HSI) lead for ALHAT project. He is also the ground software lead for Morpheus (a free flying vertical testbed technology development effort), and acting as NASA’s Flight Software Architect for Orion/CEV Primary Flight Software (PFS).
Zarrin K. Chua is a student member of both IEEE and AIAA. She holds a B.S. degree from the Virginia Tech and a M.S. degree from the Georgia Institute of Technology, both in aerospace engineering. She is currently a Ph.D student in the Space Systems Design Laboratory and the Cognitive
Engineering Center at the Georgia Institute of Technology in Atlanta, Georgia. She has previously worked as a Student Intern at the NASA Johnson Space Center, the NASA Langley Research Center, and the Charles Stark Draper Laboratory. Additionally, she has worked internationally as a guest researcher at the Technische Universität München in Munich, Germany. Her research interests include entry, descent and landing and human performance modeling. Ms. Chua is currently a NASA Graduate Student Researchers Program (GSRP) fellow. Ms. Chua is also a student member of the Human Factors and Ergonomics Society.
Todd A. Heino is a Student Engineer through the cooperative education program in the Spacecraft Software Engineering Branch of the Software, Robotics, and Simulation Division at the Johnson Space Center. During his time in the Co-Op program he has also supported the design and development of Robonaut 2, a humanoid robot developed out of JSC. Todd is also
currently developing the on-board data storage and retrieval system for Morpheus (a free flying vertical testbed technology development effort). He is currently attending University of the Pacific and intends to graduate in 2011 with a triple major in Computer Science, Computer Engineering and Electrical Engineering. After graduation he will begin working full time at JSC in the Spacecraft Software Engineering Branch. His research interests include human computer interaction and virtual reality
Al Strahan is an engineer in the Aeroscience and Flight Mechanics Division at the Johnson Space Center. Al received a B.S. in Aerospace Engineering from Texas A&M University in 1988. He joined NASA as a Co-op student in the mid 1980's and has worked much of his career in Guidance Navigation and Control,
atmospheric entry, and simulation. He has supported Shuttle entry GNC in various capacities for 18 years. He supported GNC design and flight test for the parafoil flight phase of the X-38 Program. He coordinated entry flight control design and analysis for the Orion command module including pilot-in-the-loop handling qualities assessment, which he also supported periodically for shuttle entry performance and proposed change investigations. Most recently he supported the Altair Lunar Lander Program, with a focus on powered descent and landing including GNC hazard detection and human pilot interaction.

14
Laura Major is the Group Leader for Human-System Collaboration at Draper Laboratory. Recently she was the Technical Director for the Air Force Battlefield Airmen Next Generation BAO Kit Study. She has worked on many programs related to cockpit design, small unmanned aerial
vehicle autonomy, and the design of handheld devices for tactical operations. In addition she has served as the Program Manager and Principal Investigator for several classified human-systems programs. Her expertise is in aerospace engineering, human-interactive automation, cognitive engineering, and the design of information visualization. She holds an MS in Aeronautics and Astronautics from MIT and a BS from Georgia Tech.
Kevin R. Duda is a Senior Member of the Technical Staff in the Human-Systems Collaboration Group at The Charles Stark Draper Laboratory, Inc. He has worked a variety of programs related to the design and analysis of spacecraft automation, decision support systems, mission planning,
and close-in ISR. He currently is the Principal Investigator on a project modeling and analyzing lunar lander supervisory control performance, and is a co-Investigator on a project designing and analyzing lunar lander manual control performance; both projects are funded by the National Space Biomedical Research Institute. He is an instrument and seaplane rated private pilot and holds a B.S. in Aerospace Engineering from Embry-Riddle Aeronautical University and a M.S. and Ph.D. in Aeronautics and Astronautics from MIT.


![Demonstration of Software Agents Prototype System: AIMM] … · 2018. 8. 1. · design of that building. Figure 2.1 shows the interface of the software prototype system (AIMM, Agents](https://static.fdocuments.in/doc/165x107/60944968e415517a7924cc00/demonstration-of-software-agents-prototype-system-aimm-2018-8-1-design-of.jpg)