
Developing a Game Plan to Meet the CCRPI Challenge a Game Plan to Meet the CCRPI Challenge. ... for...
40
-
Upload
nguyennguyet -
Category
Documents
-
view
228 -
download
0
Transcript of Developing a Game Plan to Meet the CCRPI Challenge a Game Plan to Meet the CCRPI Challenge. ... for...

Winning
the CCRPI War
One Battle
at a Time
Bobby Smith
229-221-7164

Bobby Smith [email protected]
229-221-7164
Using the CCRPI to Drive Communication,
Collaboration, and Change
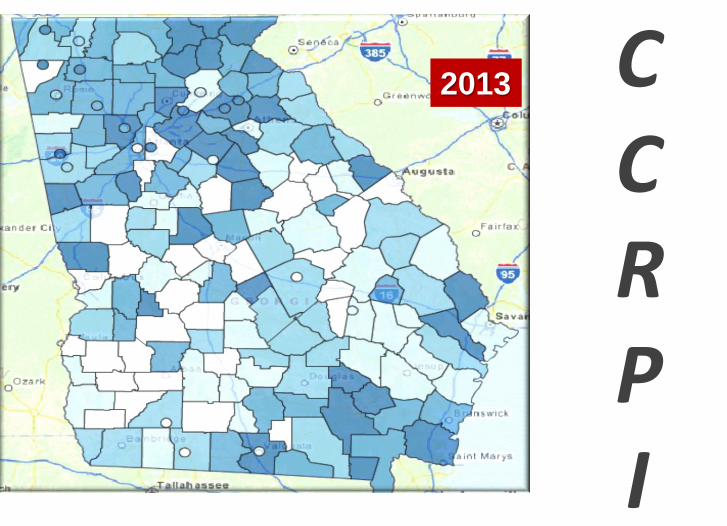
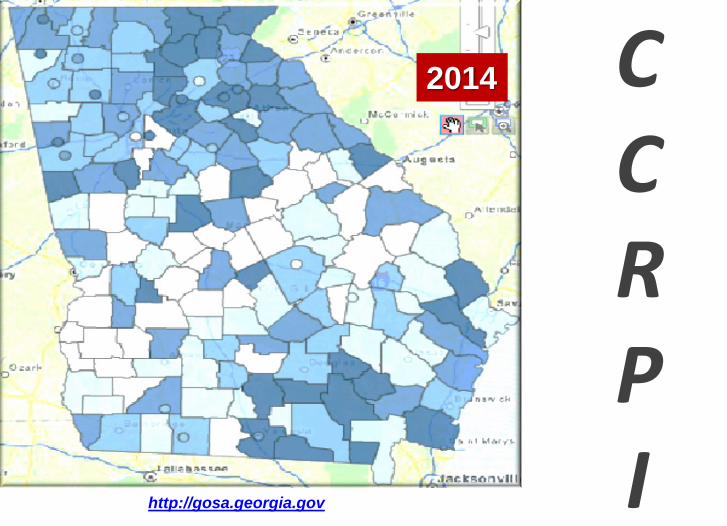
CCRPI
2013
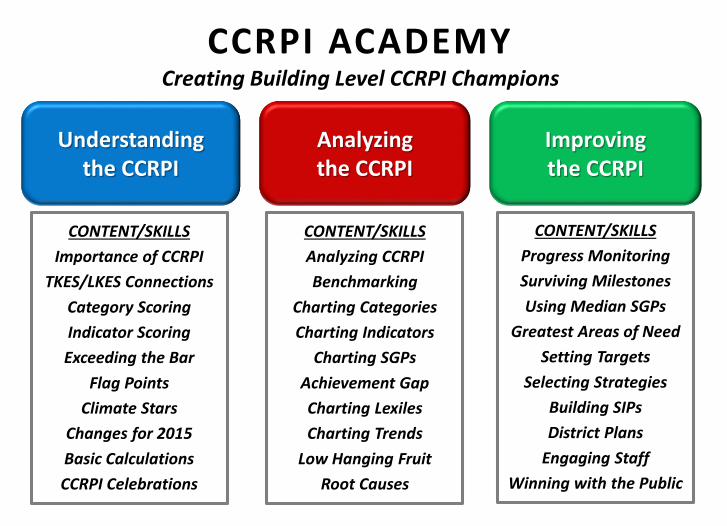
CCRPI ACADEMYCreating Building Level CCRPI Champions
Understanding the CCRPI
CONTENT/SKILLS
Importance of CCRPI
TKES/LKES Connections
Category Scoring
Indicator Scoring
Exceeding the Bar
Flag Points
Climate Stars
Changes for 2015
Basic Calculations
CCRPI Celebrations
Improving the CCRPI
CONTENT/SKILLS
Progress Monitoring
Surviving Milestones
Using Median SGPs
Greatest Areas of Need
Setting Targets
Selecting Strategies
Building SIPs
District Plans
Engaging Staff
Winning with the Public
CONTENT/SKILLS
Analyzing CCRPI
Benchmarking
Charting Categories
Charting Indicators
Charting SGPs
Achievement Gap
Charting Lexiles
Charting Trends
Low Hanging Fruit
Root Causes
Analyzing the CCRPI
Data Analysis:A fact finding event
Not a fault finding event

CPRESA.ORG Or
http://www.ciclt.net/sn/clt/cpresa/default.aspx?Cli
entCode=cpresa
http://www.ciclt.net/sn/clt/cpresa/default.aspx?ClientCode=cpresa

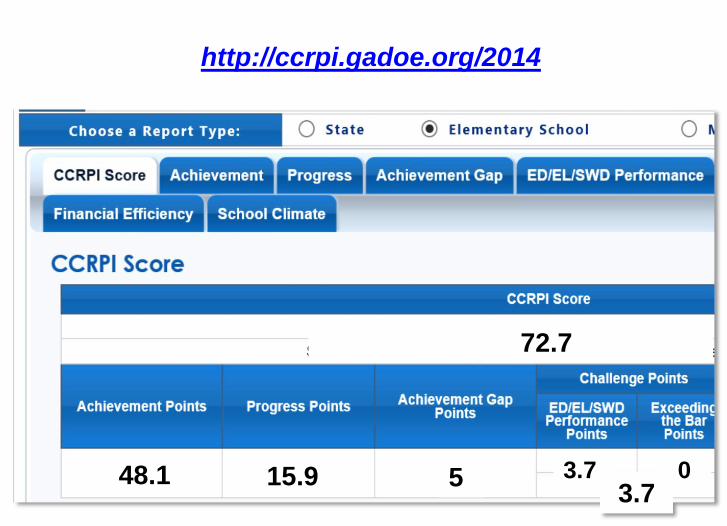
Achievement Points (60 pts) Progress
Points(SGPs)
(25 pts)
Achievement
Gap(15 pts)
Challenge Points (10 pts)
ContentMastery(Tests)
(24 pts)
Readiness(18 pts)
Graduation(18 pts)
ED/EL/SWDPerformance
(Flags)
Exceeding the Bar
Indicators
2014 CCRPI Performance Categories
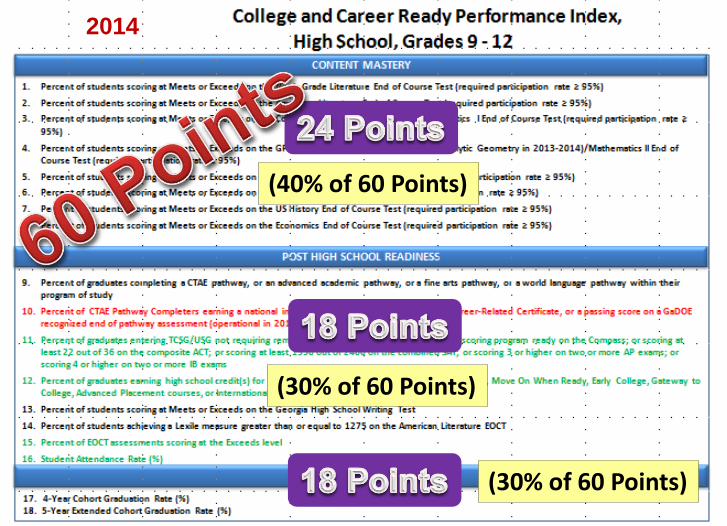
(40% of 60 Points)
(30% of 60 Points)
(30% of 60 Points)
20142014
Achievement Points (60 pts) Progress
Points(SGPs)(25 pts)
AchievementGap
(15 pts)
Challenge Points (10 pts)
ContentMastery(Tests)(24 pts)
Post School
Readiness(18 pts)
GraduationPredictor
(18 pts)
ED/EL/SWDPerformance
(Flags)
Exceeding the Bar
Indicators
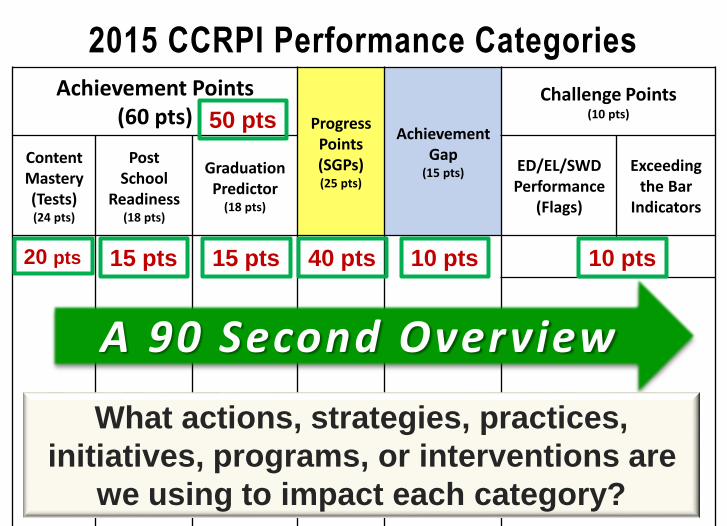
2015 CCRPI Performance Categories
20 pts 15 pts 15 pts 40 pts 10 pts 10 pts
50 pts
A 90 Second Overview
What actions, strategies, practices,
initiatives, programs, or interventions are
we using to impact each category?

Milestones
TKES &
TEM
LKES
& LEM
IE2 &
Charter
New
Curriculum
SchoolAccountability
CHANGE

The Old Accountability World Order
Only Reading, ELA and Math mattered.
We also tracked Grad Rate and Student Attendance.
Sub-groups ruled and 40 students equaled a subgroup.
We could identify “bubble students” and apply more time, resources, and staff and win the Accountability War.
No Child Left Behind became “No Bubble Child Left Behind.”

The New Accountability World Order
Science and Social Studies now count.
Schools have dozens of indicators.
Sub-groups have shrunk to 15 students
and may earn you some bonus flag points.
The Climate Stars now shine brightly.
SGPs now rule schools, teachers, and
leaders.
Quartile positions now have
a special importance.
Accountability Metrics have become:
More complicated
Less transparent
More changeable
Less explainable
More mathematical
Less “game-able”

Connecting Teacher, Leader, and School Accountability
IE2
Charter
Priority
Focus
Reward
Certification?
18
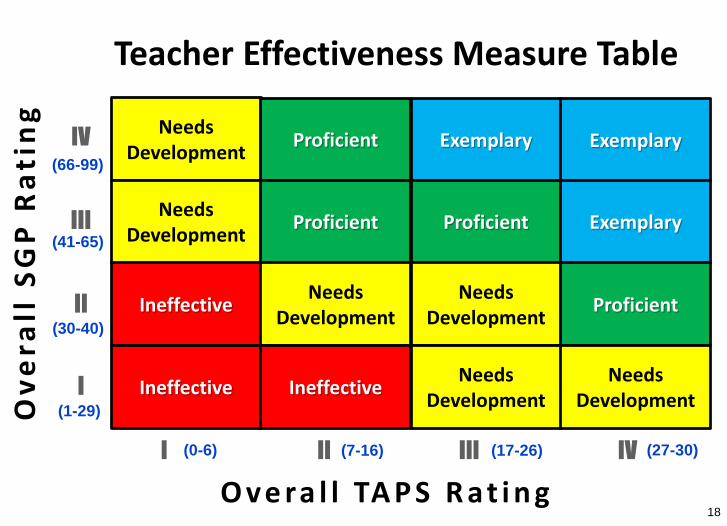
Needs Development
Proficient Exemplary Exemplary
Needs Development
Proficient Proficient Exemplary
IneffectiveNeeds
DevelopmentNeeds
DevelopmentProficient
Ineffective IneffectiveNeeds
DevelopmentNeeds
Development
O v e ra l l TA P S R a t i n g
Ov
era
ll S
GP
Ra
tin
g
I
II
III
IV
I II III IV
Teacher Effectiveness Measure Table
(0-6) (7-16) (17-26)
(1-29)
(30-40)
(41-65)
(66-99)
(27-30)
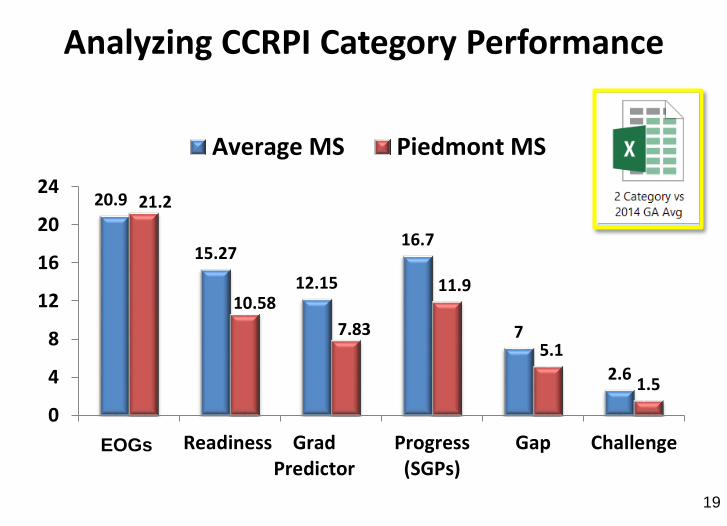
Analyzing CCRPI Category Performance
19
20.9
15.27
12.15
16.7
7
2.6
21.2
10.58
7.83
11.9
5.1
1.5
0
4
8
12
16
20
24
CRCTs Readiness GradPredictor
Progress(SGPs)
Gap Challenge
Average MS Piedmont MS
EOGs

Drilling into the CCRPI Indicators
9.1 9.48.5
8.1 8.38.9 9.2
7.4
6.1
5.1
0
2
4
6
8
10
1 ELA 2 Reading 3 Math 4 Science 5 Soc. Studies
GA ES AVG. Piedmont ES

Analyzing Lexile Performance


Drilling for the WHO and the WHAT
24
WHO? WHAT?Student
Groups
Content
Domains

Domains % of Test
History 50%
Geography 15%
Government/Civics 20%
Economics 15%
Domain Performance
Fourth Grade Social Studies

Domains % of Test
Colonization through the Constitution 20%
New Republic through Reconstruction 20%
Industrialization, Reform, and Imperialism 15%
Establishment as a World Power 20%
Modern Era 25%
U. S. History
Domain Performance
Background on
Student Growth Percentiles
Students obtain growth percentiles,
ranging from 1 to 99, which indicate
how their current achievement compares
with that of their statewide academic
peers who had similar score histories.

http://www.youtube.com/watch?v=dyArv7184ZY&feature=player_embedded
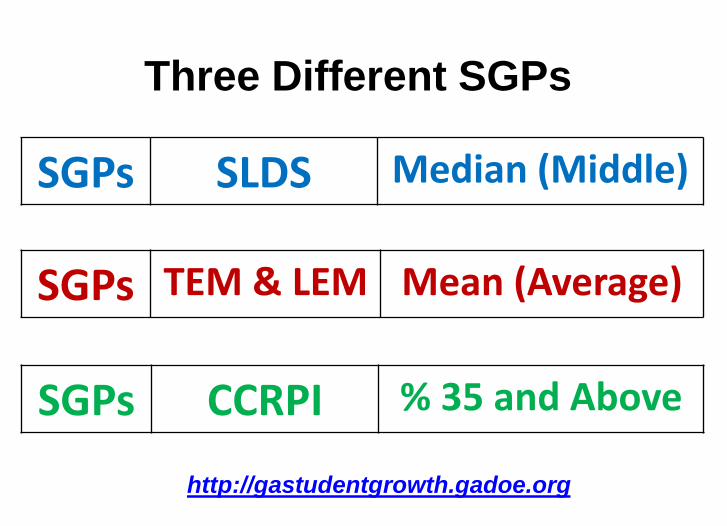
SGPs SLDS Median (Middle)
SGPs CCRPI % 35 and Above
SGPs TEM & LEM Mean (Average)
http://gastudentgrowth.gadoe.org
Three Different SGPs
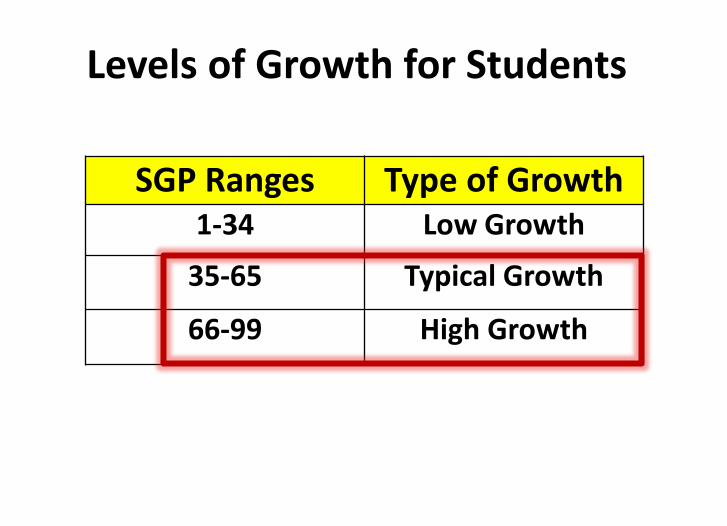
Levels of Growth for Students
SGP Ranges Type of Growth1-34 Low Growth
35-65 Typical Growth
66-99 High Growth

SGPs 35 or Higher By Content Area
56%62%
49%
38%
49%
20%
30%
40%
50%
60%
70%
80%
90%
100%
ELA Reading Math Science Soc. Studies

CCRPI Reports in Portal

Achievement GAP
Two ways to earn points on a 0-1-2-3 rubric:
Size of the Gap between lowest quartile and
the state average.
Change in the Achievement Gap from the
previous year.
Schools receive the higher of the two scores.
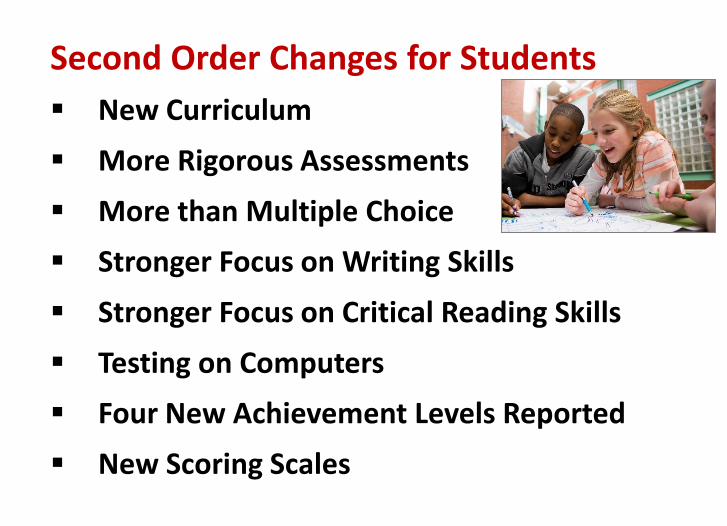
Second Order Changes for Students
New Curriculum
More Rigorous Assessments
More than Multiple Choice
Stronger Focus on Writing Skills
Stronger Focus on Critical Reading Skills
Testing on Computers
Four New Achievement Levels Reported
New Scoring Scales

Power Strategies
Attack weak domains in Science/SS.
Use pacing guides.
Improve instructional resources.
Analyze local assessments.
Familiarize students with the format.
Use GaDOE/RESA Resources.
Encourage healthy competition.
Be positive with students.
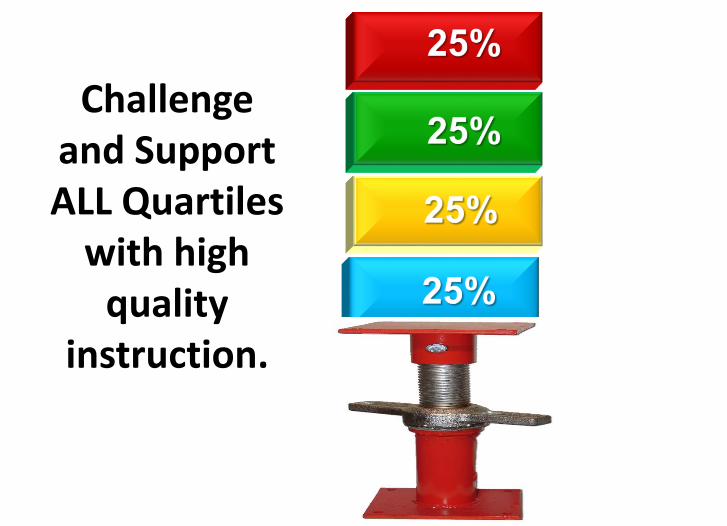
Challenge and Support ALL Quartiles
with high quality
instruction.

Tests
(All Students)
2015
Baseline
Target
2016
Target
2017
Target
2018
Target
2019
Target
2020
Language Arts 20% 22% 27% 32% 38% 45%
Actual Scores --- % % % % %
Mathematics 20% 22% 27% 32% 38% 45%
Actual Scores --- % % % % %
Science 15% 17% 23% 33% 39% 46%
Actual Scores --- % % % % %
Social Studies 12% 14% 20% 27% 33% 42%
Actual Scores --- % % % % %
SIP Goal 3: Increase the % of Grade 5 Students scoring Proficient or
Higher on the GA Milestones
Building CCRPI Metrics
into School and District Plans

The Impact of a Single Teacher
Student
Growth
Percentiles
Achievement
GAP
Lexile
Levels
Content
Mastery
Proficient
Distinguished
Percentages

http://www.gadoe.org/Curriculum-Instruction-and-
Assessment/Accountability/Pages/default.aspx
Responsibilities of CCRPI Academy Attendees

Pass Rates
on State Tests
Miscellaneous
Indicators
Grad Rates or Readiness
for Next School
Student
Growth
Year to Year
Scores of
Weakest Students
College and Career Readiness Performance Index
2015 C C R P I
Climate Stars 1 to 5 Stars based on:
Surveys of Students, Staff, Parents
Discipline Data
School-Wide Attendance
Safe and Substance Free School
Challenge PointsUp to 10 additional points added for: Flags for Performance of SWD, EL,
or Econ. Disadvantage Students Exceeding the Bar Indicators for
staff/student/school performance
3-Year Average
for Focus Schools
3-Year Average
for Priority Schools
Coastal Plains
RESA
2015