DEVELOPING A CULTURE GR OF OWH T - …annualreports.com/HostedData/AnnualReportArchive/m/... ·...
112
2010 ANNUAL REPORT DEVELOPING A CULTURE OF GROWTH
Transcript of DEVELOPING A CULTURE GR OF OWH T - …annualreports.com/HostedData/AnnualReportArchive/m/... ·...

2010 ANNUAL REPORT
DEVELOPING A CULTURE OF GROWTH
macysannual2010_08.indd 3 3/22/11 12:06 AM

Macy’s Macy’s, established in 1858, is the Great American Department Store – an iconic retailing brand with nearly 810 stores operating coast-to-coast and online at macys.com. Macy’s offers powerful assortments and the best brands, tailored to each and every customer with obvious value, engaging service and unforgettable moments.
Celebrating the MagiC of MaCy’s
Clearly, Macy’s is distinctly different from other major retailers. Macy’s embraces customers and strives to provide an experience that transcends ordinary shopping. Our DNA includes special events that are magical – the Macy’s Thanksgiving Day Parade, Fourth of July Fireworks, flower shows, fashion extravaganzas, celebrity appearances, cooking demonstrations and holiday traditions ranging from the arrival of Santa Claus to tree lightings and animated window displays.
Beyond fantastic events, Macy’s is delivering magical moments every day. We surprise and delight customers with unique and interesting fashion merchandise – including exclusive brands that our customers won’t find elsewhere. We engage customers in stores, online and via mobile devices by offering advice and options that bring fashion ideas to life. Our looks set the tone in style magazines, videos, TV shows, movies, blogs and websites. Our associates take the extra step to help a customer in need. Every year, we receive tens of thousands of messages complimenting our people and saluting the shopping experience at Macy’s. It’s all part of the excitement that we’ve been creating for 152 years.
growing through loCalization
Localization is a key component of Macy’s strategic formula for continued growth and success. Through My Macy’s, we have invested in talent, technology and marketing that allow us to ensure that each and every Macy’s store is “just right” for the customer who shops in that location. We have provided for more local decision-making in every Macy’s community. We are tailoring our merchandise assortments, space allocations, service levels, visual merchandising and special events store-by-store.
BlooMingdale’s Bloomingdale’s, America’s only nationwide, full-line, upscale department store, is recognized for its originality, innovation and fashion leadership. It truly is “Like no other store in the world.” In fact, Bloomingdale’s is a leading attraction for visitors and tourists coming to the United States from around the globe. This brand includes 41 stores, bloomingdales.com and four Bloomingdale’s Outlet locations. Bloomingdale’s opened in Dubai, United Arab Emirates, in February 2010 under a license agreement with Al Tayer Insignia, a company of Al Tayer Group LLC.
foCusing on an upsCale niChe
Bloomingdale’s is separating itself from the mainstream and reinforcing its position as an authority for upscale, contemporary fashion. Customers are attracted by the latest styles from the hottest brands, such as Armani, Burberry, Chanel, Christian Dior, David Yurman, Jimmy Choo, Louis Vuitton, Miu Miu, Prada, Ralph Lauren Black Label,Theory and Tory Burch. Bloomingdale’s shoppers have come to expect and savor variety – the newest looks from established brands, as well as unique products from rising young designers.
Supporting these fashion brands are exceptional customer amenities – international visitors centers, personal shoppers, outstanding fitting rooms and lounges – elegant events and personalized, attentive service that strengthen customer relationships and build loyalty.
MACY’S, INC. IS ONE OF ThE NATION’S PREMIER RETAILERS, WITh FISCAL 2010 SALES OF $25.0 BILLION. ThE COMPANY OPERATES ThE MACY’S AND BLOOMINGDALE’S BRANDS WITh ABOUT 850 DEPARTMENT STORES IN 45 STATES, ThE DISTRICT OF COLUMBIA, GUAM AND PUERTO RICO, AND ThE MACYS.COM AND BLOOMINGDALES.COM WEBSITES. ThE COMPANY ALSO OPERATES FOUR BLOOMINGDALE’S OUTLET STORES.
macysannual2010_08.indd 3 3/22/11 4:04 AM

Terry j. Lundgren Chairman, President and Chief Executive Officer
TO OUR SHAREHOLDERSOver the past five years, we have taken extraordinary steps to reinvent our business and organizational structure at Macy’s, Inc. Between 2005 and 2009, we nearly doubled our size through the May Company acquisition, transformed Macy’s into a nationwide brand by converting nearly 600 stores from regional nameplates, centralized our organization for clarity and speed in decision-making, adopted a breakthrough localization strategy called My Macy’s, and significantly expanded our capabilities in e-commerce and digital marketing.
The impact of all of these fundamental changes began coming to fruition in 2010. Simply put, it was a terrific year.
•Same-storesaleswereup4.6percent.
•Operatingincomeroseby78percentto$1.894billionin2010from$1.063billionin2009.Theincreaseinoperatingincomewas32percent,excludingassetimpairment,storeclosinganddivisionconsolidationcostsandexpensesof$25millionin2010and$391millionin2009.
•Weendedtheyearwith$1.5billionofcashafterpayingdownmorethan$1.2billionofdebtandcontributing$825milliontoourpensionplanduringfiscal2010.
•Returnoninvestedcapital–akeymeasureoffinancialproductivity–rosesignificantlyin2010from 2009.
Bestofall,wearedevelopingacultureofgrowthatMacy’s,Inc.Webelievethestrategiesthatledto our success in 2010 are still in the early phases of implementation, with plenty of runway ahead to produce further improvements in sales, earnings and cash flow as our execution sharpens.
driving SaLeS growTh in 2011 and Beyond
In particular as we enter fiscal 2011, four primary strategies are positioning us to continue to drive sales growth. All are rooted in our overriding philosophy for putting the customer at the center of all decisions.
My Macy’s Localization –2010wasthefirstfullyearofimplementationofMyMacy’s,havingbeenpilotedin2008androlledoutnationallyinmid-2009.Already,wehaveseensignificantprogressin tailoring the merchandise assortment and shopping experience in each Macy’s location to the customer who shops there. In fact, some of our most successful geographic markets in 2010 salesgrowthweretheoriginalMyMacy’spilotdistrictsfrom2008–indicatingthatourexecutioncontinues to improve with experience. The more we learn about the customer and her preferences, the better we are able to respond store-by-store. Clearly, My Macy’s is a long-term approach that will allow us to continue to adapt to local customers and communities. As each of our 69 My Macy’s districts discovers new avenues for success, we are able to share and leverage best practices across the country. My Macy’s has been a game-changer for our company and continues to represent a sustainable competitive advantage.
PAGE 1
macysannual2010_08.indd 1 3/25/11 10:27 AM

Distinctive and Exclusive Merchandise – Customers expect newness and unique ideas from us in the form of interesting products they don’t see in other places. In 2010, we launched a number of exciting market brands exclusively at Macy’s, including Kenneth Cole Reaction, Sean John men’s sportswear and Material Girl, a juniors collection from Madonna and her daughter Lourdes. That momentum will continue in 2011, particularly as we fill gaps in our assortment (we call this “white space”) where we are underserving customer needs. A good example of this approach is the spring 2011 launch of our capsule collections that will feature rotating merchandise lines throughout the year from leading designers in Impulse, Macy’s contemporary fashion department. Also in Impulse, we launched in early 2011 a new private brand called Bar III for women and men. In 2010, approximately 43 percent of Macy’s sales were in exclusive or limited distribution brands and labels. Included in this total is Macy’s lineup of very successful private brands, which represented approximately 20 percent of sales in 2010.
MAGIC Selling – We launched this energized new approach to customer engagement at Macy’s by training more than 130,000 store associates in 2010, reinforced with a refresher course in early 2011 and ongoing coaching of associates on the sales floor. An initiative unprecedented in its size and scope, MAGIC Selling helps us to better understand the needs of our customers, as well as to provide options and advice. It is, in effect, our in-store growth strategy.
Omnichannel Integration – Online sales at Macy’s and Bloomingdale’s have risen by 20 percent or more in each of the past three years (including by 29 percent in 2010). But we believe that the ongoing key to success is the integration across channels – blurring the line between our stores, the Internet and mobile technology to the point that we surround the customer and can respond to her needs no matter which way she prefers to shop and buy. We have taken action to drive our store customers online while driving our online customers into the stores, and using mobile engagement to drive business both online and in the stores. This omnichannel integration is helping Macy’s and Bloomingdale’s to develop deeper relationships with loyal customers who appreciate the convenience and flexibility we bring to the shopping experience.
STRENGTH AT BlOOMINGDAlE’S
Bloomingdale’s performance was strong in 2010 with sales growth that compared favorably to its upscale competitors. Meanwhile, the Bloomingdale’s brand continued to expand.
Bloomingdale’s opened its 41st store in 2010 with an exciting new location in Santa Monica that is smaller and focused on the more relaxed fast-fashion customer in that market. In the fall season, a Bloomingdale’s Outlet concept was launched with four stores in Miami and Sunrise, FL; Paramus, NJ; and Woodbridge, VA. Additional Bloomingdale’s Outlet stores are expected to open in 2011 and beyond.
In February 2010, Bloomingdale’s opened in Dubai under a license agreement with Al Tayer Insignia, a company of Al Tayer Group LLC. This is the first international location for either Bloomingdale’s or Macy’s.
INSpIRING OuR ORGANIzATION
An essential ingredient in the culture of growth we are building at Macy’s, Inc. is the talent, experience, energy and diversity of our people at all levels. I have said repeatedly that I believe we have the best and most resourceful organization in the retailing business. And we have continued to improve over time in recruiting, retaining and developing the best person for each position.
More than ever before, we are encouraging teamwork across functions among individuals with different perspectives and points of view. We are collaborating closely with our vendors and other outside partners. Working together, we are formulating new ideas in every function so they can be evaluated, tested and rolled out quickly if successful. And we are encouraging a higher level of risk-taking with the understanding that growth requires new and often untested approaches to the business.
The initial success of our newly unified operating structure in 2010 – including the local focus of My Macy’s – has instilled a renewed sense of momentum in our company. Progress that once was thought to be beyond reach has become reality. We are developing the confidence to stretch ever-higher in the quest to attain and exceed our goals.
Clearly, shareholders benefit when we succeed at motivating our associates and delighting our customers. Macy’s, Inc. is committed to maximizing shareholder value as we continue to evolve as a growth company dedicated to customer centricity.
The Macy’s, Inc. management team and organization appreciates your support of our company. We look forward to continued progress in building a dynamic growth company capable of accomplishing great things.
Terry J. lundgren Chairman, President and Chief Executive Officer
PAGE 2
macysannual2010_08.indd 2 3/22/11 12:07 AM

UNITED STATESSECURITIES AND EXCHANGE COMMISSION
WASHINGTON, D.C. 20549
FORM 10-KAnnual Report Pursuant to Section 13 or 15(d)
of the Securities Exchange Act of 1934For the Fiscal Year Ended Commission File Number:
January 29, 2011 1-13536
7 West Seventh StreetCincinnati, Ohio 45202
(513) 579-7000and
151 West 34th StreetNew York, New York 10001
(212) 494-1602Incorporated in Delaware I.R.S. No. 13-3324058
Securities Registered Pursuant to Section 12(b) of the Act:Title of Each Class Name of Each Exchange on Which Registered
Common Stock, par value $.01 per share New York Stock Exchange7.45% Senior Debentures due 2017 New York Stock Exchange6.79% Senior Debentures due 2027 New York Stock Exchange
7% Senior Debentures due 2028 New York Stock ExchangeSecurities registered pursuant to Section 12(g) of the Act:
NoneIndicate by check mark if the registrant is a well-known seasoned issuer, as defined in Rule 405 of the Securities
Act. Yes È No ‘
Indicate by check mark if the registrant is not required to file reports pursuant to Section 13 or Section 15(d) of theExchange Act. Yes ‘ No È
Indicate by check mark whether the registrant (1) has filed all reports required to be filed by Section 13 or 15(d) of theSecurities Exchange Act of 1934 during the preceding 12 months (or for such shorter period that the registrant was requiredto file such reports), and (2) has been subject to such filing requirements for the past 90 days. Yes È No ‘
Indicate by check mark whether the registrant has submitted electronically and posted on its corporate Web site, if any,every Interactive Data File required to be submitted and posted pursuant to Rule 405 of Regulation S-T during the preceding12 months (or for such shorter period that the registrant was required to submit and post such files). Yes È No ‘
Indicate by check mark if disclosure of delinquent filers pursuant to Item 405 of Regulation S-K is not contained herein,and will not be contained, to the best of registrant’s knowledge, in definitive proxy or information statements incorporated byreference in Part III of this Form 10-K or any amendment to this Form 10-K. ‘
Indicate by check mark whether the registrant is a large accelerated filer, an accelerated filer, a non-accelerated filer, or asmaller reporting company. See the definitions of “large accelerated filer,” “accelerated filer” and “smaller reportingcompany” in Rule 12b-2 of the Exchange Act.Large accelerated filer È Accelerated filer ‘ Non-accelerated filer ‘ Smaller reporting company ‘
(Do not check if a smaller reporting company)Indicate by check mark whether the registrant is a shell company (as defined in Rule 12b-2 of the Exchange
Act). Yes ‘ No È
The aggregate market value of the registrant’s common stock held by non-affiliates of the registrant as of the lastbusiness day of the registrant’s most recently completed second fiscal quarter (July 31, 2010) was approximately$7,873,300,000.
Indicate the number of shares outstanding of each of the issuer’s classes of common stock, as of the latest practicabledate.
Class Outstanding at February 25, 2011
Common Stock, $0.01 par value per share 423,747,325 sharesDOCUMENTS INCORPORATED BY REFERENCE
DocumentParts Into
Which Incorporated
Proxy Statement for the Annual Meeting of Stockholders to be held May 20, 2011 (Proxy Statement) Part III


Explanatory Note
On August 30, 2005, the Company completed the acquisition of The May Department Stores Company(“May”) by means of a merger of May with and into a wholly-owned subsidiary of the Company (the “Merger”).As a result of the Merger, May’s separate corporate existence terminated. Upon the completion of the Merger,the subsidiary was merged with and into the Company and its separate corporate existence terminated. On June 1,2007, the Company changed its name from Federated Department Stores, Inc. to Macy’s, Inc. (“Macy’s”).
Unless the context requires otherwise, references to “Macy’s” or the “Company” are references to Macy’sand its subsidiaries and references to “2010,” “2009,” “2008,” “2007” and “2006” are references to theCompany’s fiscal years ended January 29, 2011, January 30, 2010, January 31, 2009, February 2, 2008and February 3, 2007, respectively.
Forward-Looking Statements
This report and other reports, statements and information previously or subsequently filed by the Companywith the Securities and Exchange Commission (the “SEC”) contain or may contain forward-looking statements.Such statements are based upon the beliefs and assumptions of, and on information available to, the managementof the Company at the time such statements are made. The following are or may constitute forward-lookingstatements within the meaning of the Private Securities Litigation Reform Act of 1995: (i) statements precededby, followed by or that include the words “may,” “will,” “could,” “should,” “believe,” “expect,” “future,”“potential,” “anticipate,” “intend,” “plan,” “think,” “estimate” or “continue” or the negative or othervariations thereof, and (ii) statements regarding matters that are not historical facts. Such forward-lookingstatements are subject to various risks and uncertainties, including:
• risks and uncertainties relating to the possible invalidity of the underlying beliefs and assumptions;
• competitive pressures from department and specialty stores, general merchandise stores,manufacturers’ outlets, off-price and discount stores, and all other retail channels, including theInternet, mail-order catalogs and television;
• general consumer-spending levels, including the impact of general economic conditions, consumerdisposable income levels, consumer confidence levels, the availability, cost and level of consumer debt,the costs of basic necessities and other goods and the effects of the weather or natural disasters;
• conditions to, or changes in the timing of, proposed transactions and changes in expected synergies,cost savings and non-recurring charges;
• possible changes or developments in social, economic, business, industry, market, legal and regulatorycircumstances and conditions;
• actions taken or omitted to be taken by third parties, including customers, suppliers, business partners,competitors and legislative, regulatory, judicial and other governmental authorities and officials;
• adverse changes in relationships with vendors and other product and service providers;
• risks related to currency, interest and exchange rates and other capital market, economic andgeo-political conditions;
• risks associated with severe weather, natural disasters and changes in weather patterns;
• risks associated with an outbreak of an epidemic or pandemic disease;
• the potential impact of national and international security concerns on the retail environment,including any possible military action, terrorist attacks or other hostilities;

• risks associated with the possible inability of the Company’s manufacturers to deliver products in atimely manner or meet the Company’s quality standards;
• risks associated with the Company’s reliance on foreign sources of production, including risks relatedto the disruption of imports by labor disputes, regional health pandemics, and regional political andeconomic conditions;
• risks related to duties, taxes, other charges and quotas on imports; and
• risks associated with possible systems failures and/or security breaches, including, any security breachthat results in the theft, transfer or unauthorized disclosure of customer, employee or companyinformation, or the failure to comply with various laws applicable to the Company in the event of sucha breach.
In addition to any risks and uncertainties specifically identified in the text surrounding such forward-looking statements, the statements in the immediately preceding sentence and the statements under captions suchas “Risk Factors” and “Special Considerations” in reports, statements and information filed by the Companywith the SEC from time to time constitute cautionary statements identifying important factors that could causeactual amounts, results, events and circumstances to differ materially from those expressed in or implied by suchforward-looking statements.
Item 1. Business.
General. The Company is a corporation organized under the laws of the State of Delaware in 1985. TheCompany and its predecessors have been operating department stores since 1830. On June 1, 2007, the Companychanged its corporate name from Federated Department Stores, Inc. to Macy’s, Inc. and the Company’s sharesbegan trading under the ticker symbol “M” on the New York Stock Exchange (“NYSE”). As of January 29,2011, the operations of the Company included approximately 850 stores in 45 states, the District of Columbia,Guam and Puerto Rico under the names “Macy’s” and “Bloomingdale’s” as well as macys.com andbloomingdales.com. The Company also operates four Bloomingdale’s Outlet stores.
On June 1, 2005, the Company and certain of its subsidiaries entered into a Purchase, Sale and ServicingTransfer Agreement (the “Purchase Agreement”) with Citibank, N.A. (together with its subsidiaries, asapplicable, “Citibank”). The Purchase Agreement provided for, among other things, the purchase by Citibank ofsubstantially all of (i) the credit card accounts and related receivables owned by FDS Bank, (ii) the “Macy’s”credit card accounts and related receivables owned by GE Money Bank, immediately upon the purchase by theCompany of such accounts from GE Money Bank, and (iii) the proprietary credit card accounts and relatedreceivables owned by May (collectively, the “Credit Assets”). In connection with the sale of these assets, theCompany and Citibank entered into a long-term marketing and servicing alliance pursuant to the terms of aCredit Card Program Agreement (the “Program Agreement”) with an initial term of ten years expiring onJuly 17, 2016 and, unless terminated by either party as of the expiration of the initial term, an additional renewalterm of three years. The Program Agreement provides for, among other things, (i) the ownership by Citibank ofthe accounts purchased by Citibank pursuant to the Purchase Agreement, (ii) the ownership by Citibank of newaccounts opened by the Company’s customers, (iii) the provision of credit by Citibank to the holders of the creditcards associated with the foregoing accounts, (iv) the servicing of the foregoing accounts, and (v) the allocationbetween Citibank and the Company of the economic benefits and burdens associated with the foregoing andother aspects of the alliance.
On August 30, 2005, upon the completion of the Merger, the Company acquired May’s approximately 500department stores and approximately 800 bridal and formalwear stores. Most of the acquired May departmentstores were converted to the Macy’s nameplate in September 2006, resulting in a national retailer with stores inalmost all major markets. The operations of the acquired Lord & Taylor division and the bridal group (consistingof David’s Bridal, After Hours Formalwear and Priscilla of Boston) have been divested and are presented asdiscontinued operations.
2

In 2008, the Company announced the “My Macy’s” localization initiative which was developed with thegoal of accelerating sales growth in existing locations by ensuring that core customers surrounding each Macy’sstore find merchandise assortments, size ranges, marketing programs and shopping experiences that are custom-tailored to their needs. My Macy’s has concentrated more management talent in local markets, effectivelyreducing the “span of control” over local stores; created new positions in the field to work with district planningand buying executives in helping to understand and act on the merchandise needs of local customers; andempowered locally based executives to make more and better decisions. Also as part of My Macy’s, theCompany’s Macy’s branded stores are organized in a unified operating structure and division central officeorganizations were eliminated. This has reduced central office and administrative expense, eliminatedduplication, sharpened execution, and helped the Company to partner more effectively with its suppliers andbusiness partners.
During January 2010, the Company announced plans to launch a new Bloomingdale’s Outlet store conceptin 2010, to initially consist of four Bloomingdale’s Outlet stores, each with approximately 25,000 square feet. Allfour Bloomingdale’s Outlet stores opened during 2010. Additional Bloomingdale’s Outlet stores are expected toroll out to selected locations across the country in 2011 and beyond. Additionally, in February 2010,Bloomingdale’s opened in Dubai, United Arab Emirates under a license agreement with Al Tayer Insignia, acompany of Al Tayer Group, LLC, under which the Company is entitled to a license fee in accordance with theterms of the underlying agreement, generally based upon the greater of the contractually earned or guaranteedminimum amounts.
The Company’s retail stores and Internet websites sell a wide range of merchandise, including men’s,women’s and children’s apparel and accessories, cosmetics, home furnishings and other consumer goods. Thespecific assortments vary by size of store, merchandising character and character of customers in the trade areas.Most stores are located at urban or suburban sites, principally in densely populated areas across the UnitedStates.
For 2010, 2009 and 2008, the following merchandise constituted the following percentages of sales:
2010 2009 2008
Feminine Accessories, Intimate Apparel, Shoes and Cosmetics . . . . . . . . . . . . . . . . . . . . . . . . . 36% 36% 36%Feminine Apparel . . . . . . . . . . . . . . . . . . . . . . . . . . . . . . . . . . . . . . . . . . . . . . . . . . . . . . . . . . . . . 26 26 27Men’s and Children’s . . . . . . . . . . . . . . . . . . . . . . . . . . . . . . . . . . . . . . . . . . . . . . . . . . . . . . . . . . 23 22 22Home/Miscellaneous . . . . . . . . . . . . . . . . . . . . . . . . . . . . . . . . . . . . . . . . . . . . . . . . . . . . . . . . . . 15 16 15
100% 100% 100%
In 2010, the Company’s subsidiaries provided various support functions to the Company’s retail operationson an integrated, company-wide basis.
• The Company’s bank subsidiary, FDS Bank, and its financial, administrative and credit servicessubsidiary, Macy’s Credit and Customer Service, Inc. (“MCCS”), provide credit processing, certaincollections, customer service and credit marketing services in respect of all proprietary andnon-proprietary credit card accounts that are owned either by Department Stores National Bank(“DSNB”), a subsidiary of Citibank, N.A., or FDS Bank and that constitute a part of the creditprograms of the Company’s retail operations.
• Macy’s Systems and Technology, Inc. (“MST”), a wholly-owned indirect subsidiary of the Company,provides operational electronic data processing and management information services to all of theCompany’s operations.
• Macy’s Merchandising Group, Inc. (“MMG”), a wholly-owned direct subsidiary of the Company, isresponsible for the design, development and marketing of Macy’s private label brands and certain
3

licensed brands. Bloomingdale’s uses MMG for only a very small portion of its private labelmerchandise. The Company believes that its private label merchandise further differentiates itsmerchandise assortments from those of its competitors and delivers exceptional value to its customers.The principal private label brands currently offered by Macy’s include Alfani, American Rag, Bar III,Charter Club, Club Room, Epic Threads, first impressions, Giani Bernini, greendog, Holiday Lane,Hotel Collection, I-N-C, jenni by jennifer moore, John Ashford, JM Collection, Karen Scott, MarthaStewart Collection, Morgan Taylor, Style & Co., Tasso Elba, the cellar, Tools of the Trade, and ViaEuropa. The principal licensed brands managed by MMG are American Rag and Martha StewartCollection. The trademarks associated with all of the foregoing brands, other than American Rag andMartha Stewart Collection, are owned by Macy’s. The American Rag and Martha Stewart Collectionbrands are owned by third parties, which license the trademarks associated with such brands to Macy’spursuant to agreements which are presently scheduled to expire in 2050 and 2027, respectively.
• Macy’s Logistics and Operations (“Macy’s Logistics”), a division of a wholly-owned indirectsubsidiary of the Company, provides warehousing and merchandise distribution services for theCompany’s operations.
MMG also offers their services, either directly or indirectly, to unrelated third parties.
The Company’s executive offices are located at 7 West Seventh Street, Cincinnati, Ohio 45202, telephonenumber: (513) 579-7000 and 151 West 34th Street, New York, New York 10001, telephone number:(212) 494-1602.
Employees. As of January 29, 2011, the Company had approximately 166,000 regular full-time and part-time employees. Because of the seasonal nature of the retail business, the number of employees peaks in theholiday season. Approximately 10% of the Company’s employees as of January 29, 2011 were represented byunions. Management considers its relations with its employees to be satisfactory.
Seasonality. The retail business is seasonal in nature with a high proportion of sales and operating incomegenerated in the months of November and December. Working capital requirements fluctuate during the year,increasing in mid-summer in anticipation of the fall merchandising season and increasing substantially prior tothe holiday season when the Company must carry significantly higher inventory levels.
Purchasing. The Company purchases merchandise from many suppliers, no one of which accounted formore than 5% of the Company’s net purchases during 2010. The Company has no material long-term purchasecommitments with any of its suppliers, and believes that it is not dependent on any one supplier. The Companyconsiders its relations with its suppliers to be satisfactory.
Competition. The retailing industry is intensely competitive. The Company’s stores and direct-to-customerbusiness operations compete with many retailing formats in the geographic areas in which they operate, includingdepartment stores, specialty stores, general merchandise stores, off-price and discount stores, new andestablished forms of home shopping (including the Internet, mail order catalogs and television) andmanufacturers’ outlets, among others. The retailers with which the Company competes include Bed Bath &Beyond, Belk, Bon Ton, Burlington Coat Factory, Dillard’s, Gap, J.C. Penney, Kohl’s, Limited, Lord & Taylor,Neiman Marcus, Nordstrom, Saks, Sears, Target, TJ Maxx and Wal-Mart. The Company seeks to attractcustomers by offering superior selections, obvious value, and distinctive marketing in stores that are located inpremier locations, and by providing an exciting shopping environment and superior service through anomnichannel experience. Other retailers may compete for customers on some or all of these bases, or on otherbases, and may be perceived by some potential customers as being better aligned with their particularpreferences.
4

Available Information. The Company makes its annual reports on Form 10-K, quarterly reports onForm 10-Q, current reports on Form 8-K and amendments to those reports filed or furnished pursuant toSection 13(a) or 15(d) of the Exchange Act available free of charge through its internet website athttp://www.macysinc.com as soon as reasonably practicable after it electronically files such material with, orfurnishes it to, the SEC. The public also may read and copy any of these filings at the SEC’s Public ReferenceRoom, 100 F Street, NE, Washington, D.C. 20549. Information on the operation of the Public Reference Roommay be obtained by calling the SEC at 1-800-732-0330. The SEC also maintains an Internet site that contains theCompany’s filings; the address of that site is http://www.sec.gov. In addition, the Company has made thefollowing available free of charge through its website at http://www.macysinc.com:
• Audit Committee Charter,
• Compensation and Management Development Committee Charter,
• Finance Committee Charter,
• Nominating and Corporate Governance Committee Charter,
• Corporate Governance Principles,
• Non-Employee Director Code of Business Conduct and Ethics, and
• Code of Conduct.
Any of these items are also available in print to any shareholder who requests them. Requests should be sentto the Corporate Secretary of Macy’s, Inc. at 7 West 7th Street, Cincinnati, OH 45202.
Executive Officers of the Registrant.
The following table sets forth certain information as of March 25, 2011 regarding the executive officers ofthe Company:
Name Age Position with the Company
Terry J. Lundgren . . . . . . . . . . . . . . . . . . . 59 Chairman of the Board; President and Chief Executive Officer;Director
Janet E. Grove . . . . . . . . . . . . . . . . . . . . . 60 Vice ChairTimothy M. Adams . . . . . . . . . . . . . . . . . 57 Chief Private Brand OfficerThomas L. Cole . . . . . . . . . . . . . . . . . . . . 62 Chief Administrative OfficerJeffrey Gennette . . . . . . . . . . . . . . . . . . . . 49 Chief Merchandising OfficerJulie Greiner . . . . . . . . . . . . . . . . . . . . . . . 57 Chief Merchandise Planning OfficerKaren M. Hoguet . . . . . . . . . . . . . . . . . . . 54 Chief Financial OfficerRonald Klein . . . . . . . . . . . . . . . . . . . . . . 61 Chief Stores OfficerPeter Sachse . . . . . . . . . . . . . . . . . . . . . . . 53 Chief Marketing OfficerMark S. Cosby . . . . . . . . . . . . . . . . . . . . . 52 President - StoresJoel A. Belsky . . . . . . . . . . . . . . . . . . . . . 57 Executive Vice President and ControllerDennis J. Broderick . . . . . . . . . . . . . . . . . 62 Executive Vice President, General Counsel and Secretary
Terry J. Lundgren has been Chairman of the Board since January 2004 and President and Chief ExecutiveOfficer of the Company since February 2003; prior thereto he served as the President/Chief Operating Officerand Chief Merchandising Officer of the Company from April 2002 to February 2003. Mr. Lundgren served as thePresident and Chief Merchandising Officer of the Company from May 1997 to April 2002.
Janet E. Grove has been Vice Chair of the Company since February 2009 responsible for facilitating thetransition of merchandising, planning and private brand development functions under the new Macy’sorganization structure and International Retail Store Development initiatives; prior thereto she served as Vice
5

Chair, Merchandising, Private Brand and Product Development of the Company from February 2003 to February2009. Ms. Grove also served as Chairman of MMG from 1998 to 2009 and Chief Executive Officer of MMGfrom 1999 to 2009.
Timothy M. Adams has been the Chief Private Brand Officer of the Company since February 2009; priorthereto he served as Chairman and CEO of Macy’s Home Store from July 2005 to February 2009 and asChairman of Macy’s Florida from April 2001 to July 2005.
Thomas L. Cole has been Chief Administrative Officer of the Company since February 2009; prior theretohe served as Vice Chair, Support Operations of the Company from February 2003 to February 2009. UntilFebruary 2009, he also was responsible for the operations of Macy’s Logistics since 1995, of MST since 2001,and of MCCS since 2002.
Jeffrey Gennette has been Chief Merchandising Officer of the Company since February 2009; prior theretohe served as Chairman and CEO of Macy’s West from February 2008 to February 2009, as Chairman of Macy’sNorthwest from December 2005 to February 2008 and as Executive Vice President and Director of Stores ofMacy’s Central from March 2004 to December 2005. Mr. Gennette served as Senior Vice President/GeneralMerchandise Manager of Macy’s West from May 2001 to March 2004.
Julie Greiner has been Chief Merchandise Planning Officer of the Company since February 2009; priorthereto she served as Chairman and CEO of Macy’s Florida from July 2005 to February 2009 and as SeniorExecutive Vice President and Director of Stores of Bloomingdale’s from April 1998 to July 2005.
Karen M. Hoguet has been Chief Financial Officer of the Company since February 2009; prior thereto sheserved as Executive Vice President and Chief Financial Officer of the Company from June 2005 to February2009. Mrs. Hoguet served as Senior Vice President and Chief Financial Officer of the Company from October1997 to June 2005.
Ronald Klein has been Chief Stores Officer of the Company since February 2009; prior thereto he served asChairman and CEO of Macy’s East from February 2004 to February 2009.
Peter Sachse has been Chief Marketing Officer of the Company since February 2009 and Chairman ofmacys.com since April 2006; prior thereto he served as President of Macy’s Corporate Marketing from May2007 to February 2009 and as Chief Marketing Officer of the Company from June 2003 to May 2007.
Mark S. Cosby has been President – Stores of the Company since February 2009; prior thereto he served asPresident and Chief Operating Officer of Macy’s East from May 2007 to February 2009 and as Senior VicePresident – Property Development of the Company from July 2006 to May 2007.
Joel A. Belsky has been Executive Vice President and Controller of the Company since May 2009; priorthereto he served as Vice President and Controller of the Company from October 1996 through April 2009.
Dennis J. Broderick has been Secretary of the Company since July 1993 and Executive Vice President andGeneral Counsel of the Company since May 2009; prior thereto he served as Senior Vice President and GeneralCounsel of the Company from January 1990 to April 2009.
Item 1A. Risk Factors.
In evaluating the Company, the risks described below and the matters described in “Forward-LookingStatements” should be considered carefully. Such risks and matters could significantly and adversely affect theCompany’s business, prospects, financial condition, results of operations and cash flows.
6

The Company faces significant competition in the retail industry.
The Company conducts its retail merchandising business under highly competitive conditions. Although theCompany is one of the nation’s largest retailers, it has numerous and varied competitors at the national and locallevels, including conventional and specialty department stores, other specialty stores, category killers, massmerchants, value retailers, discounters, and Internet and mail-order retailers. Competition may intensify as theCompany’s competitors enter into business combinations or alliances. Competition is characterized by manyfactors, including assortment, advertising, price, quality, service, location, reputation and credit availability. Ifthe Company does not compete effectively with regard to these factors, its results of operations could bematerially and adversely affected.
The Company’s sales and operating results depend on consumer preferences and consumer spending.
The fashion and retail industries are subject to sudden shifts in consumer trends and consumer spending.The Company’s sales and operating results depend in part on its ability to predict or respond to changes infashion trends and consumer preferences in a timely manner. The Company develops new retail concepts andcontinuously adjusts its industry position in certain major and private-label brands and product categories in aneffort to satisfy customers. Any sustained failure to anticipate, identify and respond to emerging trends inlifestyle and consumer preferences could have a material adverse effect on the Company’s business. TheCompany’s sales are impacted by discretionary spending by consumers. Consumer spending may be affected bymany factors outside of the Company’s control, including general economic conditions, consumer disposableincome levels, consumer confidence levels, the availability, cost and level of consumer debt and customerbehaviors towards incurring and paying debt, the costs of basic necessities and other goods and the effects of theweather or natural disasters.
The Company’s business is subject to unfavorable economic and political conditions and other developments andrisks.
Unfavorable global, domestic or regional economic or political conditions and other developments and riskscould negatively affect the Company’s business. For example, unfavorable changes related to interest rates, ratesof economic growth, fiscal and monetary policies of governments, inflation, deflation, consumer creditavailability, consumer debt levels, consumer debt payment behaviors, tax rates and policy, unemployment trends,oil prices, and other matters that influence the availability and cost of merchandise, consumer confidence,spending and tourism could adversely impact the Company’s business and results of operations. In addition,unstable political conditions or civil unrest, including terrorist activities and worldwide military and domesticdisturbances and conflicts, may disrupt commerce and could have a material adverse effect on the Company’sbusiness and results of operations.
The Company’s revenues and cash requirements are affected by the seasonal nature of its business.
The Company’s business is seasonal, with a high proportion of revenues and operating cash flows generatedduring the second half of the fiscal year, which includes the fall and holiday selling seasons. A disproportionateamount of revenues fall in the fourth fiscal quarter, which coincides with the holiday season. In addition, theCompany incurs significant additional expenses in the period leading up to the months of November andDecember in anticipation of higher sales volume in those periods, including for additional inventory, advertisingand employees.
The Company’s business could be affected by extreme weather conditions or natural disasters.
Extreme weather conditions in the areas in which the Company’s stores are located could adversely affectthe Company’s business. For example, frequent or unusually heavy snowfall, ice storms, rainstorms or otherextreme weather conditions over a prolonged period could make it difficult for the Company’s customers to
7

travel to its stores and thereby reduce the Company’s sales and profitability. The Company’s business is alsosusceptible to unseasonable weather conditions. For example, extended periods of unseasonably warmtemperatures during the winter season or cool weather during the summer season could render a portion of theCompany’s inventory incompatible with those unseasonable conditions. Reduced sales from extreme orprolonged unseasonable weather conditions could adversely affect the Company’s business.
In addition, natural disasters such as hurricanes, tornadoes and earthquakes, or a combination of these orother factors, could severely damage or destroy one or more of the Company’s stores or warehouses located inthe affected areas, thereby disrupting the Company’s business operations.
The Company’s pension costs could increase at a higher than anticipated rate.
Significant changes in interest rates, decreases in the fair value of plan assets and investment losses on planassets could affect the funded status of the Company’s plans and could increase future funding requirements ofthe pension plans. A significant increase in future funding requirements could have a negative impact on theCompany’s cash flows, financial condition or results of operations.
Increases in the cost of employee benefits could impact the Company’s financial results and cash flow.
The Company’s expenses relating to employee health benefits are significant. Unfavorable changes in thecost of such benefits could impact the Company’s financial results and cash flow. Healthcare costs have risensignificantly in recent years, and recent legislative and private sector initiatives regarding healthcare reformcould result in significant changes to the U.S. healthcare system. The Company is not able at this time todetermine the impact that healthcare reform could have on the Company-sponsored medical plans.
Inability to access capital markets could adversely affect the Company’s business or financial condition.
Changes in the credit and capital markets, including market disruptions, limited liquidity and interest ratefluctuations, may increase the cost of financing or restrict the Company’s access to this potential source of futureliquidity. A decrease in the ratings that rating agencies assign to the Company’s short and long-term debt maynegatively impact the Company’s access to the debt capital markets and increase the Company’s cost ofborrowing. In addition, the Company’s bank credit agreements require the Company to maintain specifiedinterest coverage and leverage ratios. The Company’s ability to comply with the ratios may be affected by eventsbeyond its control, including prevailing economic, financial and industry conditions. If the Company’s results ofoperations or operating ratios deteriorate to a point where the Company is not in compliance with its debtcovenants, and the Company is unable to obtain a waiver, much of the Company’s debt would be in default andcould become due and payable immediately. The Company’s assets may not be sufficient to repay in full thisindebtedness, resulting in a need for an alternate source of funding. The Company cannot make any assurancesthat it would be able to obtain such an alternate source of funding on satisfactory terms, if at all, and its inabilityto do so could cause the holders of its securities to experience a partial or total loss of their investments in theCompany.
The Company periodically reviews the carrying value of its goodwill for possible impairment; if futurecircumstances indicate that goodwill is impaired, the Company could be required to write down amounts ofgoodwill and record impairment charges.
In the fourth quarter of fiscal 2008, the Company reduced the carrying value of its goodwill from $9,125million to $3,743 million and recorded a related non-cash impairment charge of $5,382 million. The Companycontinues to monitor relevant circumstances, including consumer spending levels, general economic conditionsand the market prices for the Company’s common stock, and the potential impact that such circumstances mighthave on the valuation of the Company’s goodwill. It is possible that changes in such circumstances, or in thenumerous variables associated with the judgments, assumptions and estimates made by the Company in assessing
8
the appropriate valuation of its goodwill, could in the future require the Company to further reduce its goodwilland record related non-cash impairment charges. If the Company were required to further reduce its goodwill andrecord related non-cash impairment charges, the Company’s financial position and results of operations would beadversely affected.
The Company depends on its ability to attract and retain quality employees.
The Company’s business is dependent upon attracting and retaining a large number of quality employees.Many of these employees are in entry level or part-time positions with historically high rates of turnover. TheCompany’s ability to meet its labor needs while controlling the costs associated with hiring and training newemployees is subject to external factors such as unemployment levels, prevailing wage rates, minimum wagelegislation and changing demographics. Changes that adversely impact the Company’s ability to attract andretain quality employees could adversely affect the Company’s business.
The Company depends upon designers, vendors and other sources of merchandise, goods and services.
The Company’s relationships with established and emerging designers have been a significant contributor tothe Company’s past success. The Company’s ability to find qualified vendors and access products in a timely andefficient manner is often challenging, particularly with respect to goods sourced outside the United States. TheCompany’s procurement of goods and services from outside the United States is subject to risks associated withpolitical or financial instability, trade restrictions, tariffs, currency exchange rates, transport capacity and costsand other factors relating to foreign trade. In addition, the Company’s procurement of all its goods and services issubject to the effects of price increases which the Company may or may not be able to pass through to itscustomers. All of these factors may affect the Company’s ability to access suitable merchandise on acceptableterms, are beyond the Company’s control and could adversely impact the Company’s performance.
The Company depends upon the success of its advertising and marketing programs.
The Company’s advertising and promotional costs, net of cooperative advertising allowances, amounted to$1,072 million for 2010. The Company’s business depends on high customer traffic in its stores and effectivemarketing. The Company has many initiatives in this area, and often changes its advertising and marketingprograms. There can be no assurance as to the Company’s continued ability to effectively execute its advertisingand marketing programs, and any failure to do so could have a material adverse effect on the Company’sbusiness and results of operations.
The benefits expected to be realized from the expansion of the Company’s market localization initiatives and thechanges to its operating structure are subject to various risks.
The Company’s success in fully realizing the anticipated benefits from the expansion of its marketlocalization initiatives and the changes to its operating structure will depend in large part on achievinganticipated cost savings, business opportunities and growth prospects. The Company’s ability to benefit fromexpanded market localization initiatives and the changes to its operating structure is subject to both the risksaffecting the Company’s business generally and the inherent difficulties associated with implementing theseinitiatives. The failure of the Company to fully realize the benefits expected to result from these initiatives couldhave a material adverse effect on the Company’s business and results of operations.
Parties with whom the Company does business may be subject to insolvency risks or may otherwise becomeunable or unwilling to perform their obligations to the Company.
The Company is a party to contracts, transactions and business relationships with various third parties,including vendors, suppliers, service providers, lenders and participants in joint ventures, strategic alliances andother joint commercial relationships, pursuant to which such third parties have performance, payment and other
9

obligations to the Company. In some cases, the Company depends upon such third parties to provide essentialleaseholds, products, services or other benefits, including with respect to store and distribution center locations,merchandise, advertising, software development and support, logistics, other agreements for goods and servicesin order to operate the Company’s business in the ordinary course, extensions of credit, credit card accounts andrelated receivables, and other vital matters. Current economic, industry and market conditions could result inincreased risks to the Company associated with the potential financial distress or insolvency of such third parties.If any of these third parties were to become subject to bankruptcy, receivership or similar proceedings, the rightsand benefits of the Company in relation to its contracts, transactions and business relationships with such thirdparties could be terminated, modified in a manner adverse to the Company, or otherwise impaired. The Companycannot make any assurances that it would be able to arrange for alternate or replacement contracts, transactionsor business relationships on terms as favorable as the Company’s existing contracts, transactions or businessrelationships, if at all. Any inability on the part of the Company to do so could negatively affect the Company’scash flows, financial condition and results of operations.
A material disruption in the Company’s computer systems could adversely affect the Company’s business orresults of operations.
The Company relies extensively on its computer systems to process transactions, summarize results andmanage its business. The Company’s computer systems are subject to damage or interruption from poweroutages, computer and telecommunications failures, computer viruses, security breaches, catastrophic eventssuch as fires, floods, earthquakes, tornadoes, hurricanes, acts of war or terrorism, and usage errors by theCompany’s employees. If the Company’s computer systems are damaged or cease to function properly, theCompany may have to make a significant investment to fix or replace them, and the Company may suffer loss ofcritical data and interruptions or delays in its operations in the interim. Any material interruption in theCompany’s computer systems could adversely affect its business or results of operations.
A privacy breach could result in negative publicity and adversely affect the Company’s business.
The protection of customer, employee, and company data is critical to the Company. The regulatoryenvironment surrounding information security and privacy is increasingly demanding, with the frequentimposition of new and constantly changing requirements across business units. In addition, customers have ahigh expectation that the Company will adequately protect their personal information. A significant breach ofcustomer, employee, or company data could attract a substantial amount of media attention, damage theCompany’s customer relationships and reputation and result in lost sales, fines, or lawsuits.
A regional or global health pandemic could severely affect the Company’s business.
A health pandemic is a disease that spreads rapidly and widely by infection and affects many individuals inan area or population at the same time. If a regional or global health pandemic were to occur, depending upon itslocation, duration and severity, the Company’s business could be severely affected. Customers might avoidpublic places in the event of a health pandemic, and local, regional or national governments might limit or banpublic gatherings to halt or delay the spread of disease. A regional or global health pandemic might alsoadversely impact the Company’s business by disrupting or delaying production and delivery of materials andproducts in its supply chain and by causing staffing shortages in its stores.
The Company is subject to numerous regulations that could adversely affect its business.
The Company is subject to customs, child labor, truth-in-advertising and other laws, including consumerprotection regulations and zoning and occupancy ordinances that regulate retailers generally and/or govern theimportation, promotion and sale of merchandise and the operation of retail stores and warehouse facilities.Although the Company undertakes to monitor changes in these laws, if these laws change without the Company’sknowledge, or are violated by importers, designers, manufacturers or distributors, the Company could experience
10

delays in shipments and receipt of goods or be subject to fines or other penalties under the controllingregulations, any of which could adversely affect the Company’s business.
Litigation or regulatory developments could adversely affect the Company’s business or financial condition.
The Company is subject to various federal, state and local laws, rules, regulations and initiatives, includinglaws and regulations with respect to the credit card industry including the Credit Card Act of 2009 and the Dodd-Frank Wall Street Reform and Consumer Protection Act of 2010 (the “Dodd-Frank Act”), which may changefrom time to time. In addition, the Company is regularly involved in various litigation matters that arise in theordinary course of its business. Litigation or regulatory developments could adversely affect the Company’sbusiness and financial condition.
Factors beyond the Company’s control could affect the Company’s stock price.
The Company’s stock price, like that of other retail companies, is subject to significant volatility because ofmany factors, including factors beyond the control of the Company. These factors may include:
• general economic and stock and credit market conditions;
• risks relating to the Company’s business and its industry, including those discussed above;
• strategic actions by the Company or its competitors;
• variations in the Company’s quarterly results of operations;
• future sales or purchases of the Company’s common stock; and
• investor perceptions of the investment opportunity associated with the Company’s common stockrelative to other investment alternatives.
In addition, the Company may fail to meet the expectations of its stockholders or of analysts at some time inthe future. If the analysts that regularly follow the Company’s stock lower their rating or lower their projectionsfor future growth and financial performance, the Company’s stock price could decline. Also, sales of asubstantial number of shares of the Company’s common stock in the public market or the appearance that theseshares are available for sale could adversely affect the market price of the Company’s common stock.
Item 1B. Unresolved Staff Comments.
None.
Item 2. Properties.
The properties of the Company consist primarily of stores and related facilities, including warehouses anddistribution and fulfillment centers. The Company also owns or leases other properties, including corporate officespace in Cincinnati and New York and other facilities at which centralized operational support functions areconducted. As of January 29, 2011, the operations of the Company included 850 retail stores in 45 states, theDistrict of Columbia, Puerto Rico and Guam, comprising a total of approximately 154,200,000 square feet. Ofsuch stores, 467 were owned, 268 were leased and 115 stores were operated under arrangements where theCompany owned the building and leased the land. Substantially all owned properties are held free and clear ofmortgages. Pursuant to various shopping center agreements, the Company is obligated to operate certain storesfor periods of up to 20 years. Some of these agreements require that the stores be operated under a particularname. Most leases require the Company to pay real estate taxes, maintenance and other costs; some also requireadditional payments based on percentages of sales and some contain purchase options. Certain of the Company’sreal estate leases have terms that extend for a significant number of years and provide for rental rates thatincrease or decrease over time.
11

Additional information about the Company’s stores and warehouses, distribution and fulfillment centers(“DC’s”) as of January 29, 2011 is as follows:
Geographic RegionTotalStores
OwnedStores
LeasedStores
StoresSubject toa Ground
LeaseTotalDC’s
OwnedDC’s
Mid-Atlantic . . . . . . . . . . . . . . . . . . . . . . . . . . . . . . . . . . . . . . 107 55 33 19 3 2North . . . . . . . . . . . . . . . . . . . . . . . . . . . . . . . . . . . . . . . . . . . . 84 65 15 4 2 2Northeast . . . . . . . . . . . . . . . . . . . . . . . . . . . . . . . . . . . . . . . . . 104 54 41 9 2 2Northwest . . . . . . . . . . . . . . . . . . . . . . . . . . . . . . . . . . . . . . . . 126 39 69 18 3 1Southeast . . . . . . . . . . . . . . . . . . . . . . . . . . . . . . . . . . . . . . . . . 110 72 17 21 3 2Southwest . . . . . . . . . . . . . . . . . . . . . . . . . . . . . . . . . . . . . . . . 117 45 48 24 3 3Midwest . . . . . . . . . . . . . . . . . . . . . . . . . . . . . . . . . . . . . . . . . 96 58 27 11 2 2South Central . . . . . . . . . . . . . . . . . . . . . . . . . . . . . . . . . . . . . 106 79 18 9 3 2
850 467 268 115 21 16
The eight geographic regions detailed in the foregoing table are based on the Company’s Macy’s brandedoperational structure.
The Company’s retail stores are located at urban or suburban sites, principally in densely populated areasacross the United States. Store count activity was as follows:
2010 2009 2008
Store count at beginning of fiscal year . . . . . . . . . . . . . . . . . . . . . . . . . . . . . . . . . . . . . . . . . . . . 850 847 853New stores opened and other expansions . . . . . . . . . . . . . . . . . . . . . . . . . . . . . . . . . . . . . . . . . . 7 9 11Stores closed . . . . . . . . . . . . . . . . . . . . . . . . . . . . . . . . . . . . . . . . . . . . . . . . . . . . . . . . . . . . . . . . (7) (6) (17)
Store count at end of fiscal year . . . . . . . . . . . . . . . . . . . . . . . . . . . . . . . . . . . . . . . . . . . . . . . . . . 850 850 847
Item 3. Legal Proceedings.
On October 3, 2007, Ebrahim Shanehchian, an alleged participant in the Macy’s, Inc. Profit Sharing 401(k)Investment Plan (the “401(k) Plan”), filed a lawsuit in the United States District Court for the Southern Districtof Ohio on behalf of persons who participated in the 401(k) Plan and The May Department Stores CompanyProfit Sharing Plan (the “May Plan”) between February 27, 2005 and the present. The lawsuit has beenconditionally certified as a class action. The complaint alleges that the Company, as well as members of theCompany’s board of directors and certain members of senior management, breached various fiduciary dutiesowed under the Employee Retirement Income Security Act (“ERISA”) to participants in the 401(k) Plan and theMay Plan, by making false and misleading statements regarding the Company’s business, operations andprospects in relation to the integration of the acquired May operations, resulting in supposed “artificial inflation”of the Company’s stock price and “imprudent investment” by the 401(k) Plan and the May Plan in Macy’s stock.The plaintiff seeks an unspecified amount of compensatory damages and costs. The Company believes thelawsuit is without merit and intends to contest it vigorously.
The Company and its subsidiaries are also involved in various proceedings that are incidental to the normalcourse of their businesses. As of the date of this report, the Company does not expect that any of suchproceedings will have a material adverse effect on the Company’s financial position or results of operations.
Item 4. Reserved.
12

PART II
Item 5. Market for Registrant’s Common Equity, Related Stockholder Matters and Issuer Purchases ofEquity Securities.
The Common Stock is listed on the NYSE under the trading symbol “M.” As of January 29, 2011, theCompany had approximately 23,000 stockholders of record. The following table sets forth for each fiscal quarterduring 2010 and 2009 the high and low sales prices per share of Common Stock as reported on the NYSEComposite Tape and the dividend declared with respect to each fiscal quarter on each share of Common Stock.
2010 2009
Low High Dividend Low High Dividend
1st Quarter . . . . . . . . . . . . . . . . . . . . . . . . . . . . . . . . . . . . . . . 15.34 25.25 0.0500 6.27 14.09 0.05002nd Quarter . . . . . . . . . . . . . . . . . . . . . . . . . . . . . . . . . . . . . . . 16.93 24.84 0.0500 10.27 15.29 0.05003rd Quarter . . . . . . . . . . . . . . . . . . . . . . . . . . . . . . . . . . . . . . . 18.70 25.26 0.0500 13.58 20.84 0.05004th Quarter . . . . . . . . . . . . . . . . . . . . . . . . . . . . . . . . . . . . . . . 22.78 26.32 0.0500 15.39 19.77 0.0500
The declaration and payment of future dividends will be at the discretion of the Company’s Board ofDirectors, are subject to restrictions under the Company’s credit facility and may be affected by various otherfactors, including the Company’s earnings, financial condition and legal or contractual restrictions.
The following table provides information regarding the Company’s purchases of Common Stock during thefourth quarter of 2010.
TotalNumberof Shares
Purchased
AveragePrice perShare ($)
Number of SharesPurchased under
Program (1)
OpenAuthorization
Remaining (1)($)
(thousands) (thousands) (millions)
October 31, 2010 – November 27, 2010 . . . . . . . . . . . . – – – 852November 28, 2010 – January 1, 2011 . . . . . . . . . . . . . – – – 852January 2, 2011 – January 29, 2011 . . . . . . . . . . . . . . . – – – 852
– – –
(1) Commencing in January 2000, the Company’s board of directors has from time to time approvedauthorizations to purchase, in the aggregate, up to $9,500 million of Common Stock. All authorizations arecumulative and do not have an expiration date. As of January 29, 2011, $852 million of authorizationremained unused. Although the Company has not made any purchases of Common Stock since February 1,2008 and currently does not intend to make any such purchases in 2011, it may resume purchases ofCommon Stock under these or possible future authorizations in the open market, in privately negotiatedtransactions or otherwise at any time and from time to time without prior notice.
13

The following graph compares the cumulative total stockholder return on the Common Stock with theStandard & Poor’s 500 Composite Index and the Standard & Poor’s Retail Department Store Index for the periodfrom January 27, 2006 through January 28, 2011, assuming an initial investment of $100 and the reinvestment ofall dividends, if any.
$0
$40
$20
$60
$100
$80
$120
$160
$140
201120102009200820072006
M
S&P 500 Retail Department Stores
S&P 500
The companies included in the S&P Retail Department Store Index are Dillard’s, Macy’s, J.C. Penney,Kohl’s, Nordstrom and Sears.
14

Item 6. Selected Financial Data.
The selected financial data set forth below should be read in conjunction with the Consolidated FinancialStatements and the notes thereto and the other information contained elsewhere in this report.
2010 2009** 2008** 2007 2006*
(millions, except per share data)Consolidated Statement of Operations Data:
Net sales . . . . . . . . . . . . . . . . . . . . . . . . . . . . . . . . . . . . . . . . . . . . . . . . . . . . . . $ 25,003 $ 23,489 $ 24,892 $ 26,313 $ 26,970Cost of sales . . . . . . . . . . . . . . . . . . . . . . . . . . . . . . . . . . . . . . . . . . . . . . . . . . . (14,824) (13,973) (15,009) (15,677) (16,019)Inventory valuation adjustments – May integration . . . . . . . . . . . . . . . . . . . . . – – – – (178)
Gross margin . . . . . . . . . . . . . . . . . . . . . . . . . . . . . . . . . . . . . . . . . . . . . . . . . . 10,179 9,516 9,883 10,636 10,773Selling, general and administrative expenses . . . . . . . . . . . . . . . . . . . . . . . . . . (8,260) (8,062) (8,481) (8,554) (8,678)Impairments, store closing costs and division consolidation costs . . . . . . . . . (25) (391) (398) – –Goodwill impairment charges . . . . . . . . . . . . . . . . . . . . . . . . . . . . . . . . . . . . . – – (5,382) – –May integration costs . . . . . . . . . . . . . . . . . . . . . . . . . . . . . . . . . . . . . . . . . . . . – – – (219) (450)Gains on sale of accounts receivable . . . . . . . . . . . . . . . . . . . . . . . . . . . . . . . . – – – – 191
Operating income (loss) . . . . . . . . . . . . . . . . . . . . . . . . . . . . . . . . . . . . . . . . . . 1,894 1,063 (4,378) 1,863 1,836Interest expense (a) . . . . . . . . . . . . . . . . . . . . . . . . . . . . . . . . . . . . . . . . . . . . . . (579) (562) (588) (579) (451)Interest income . . . . . . . . . . . . . . . . . . . . . . . . . . . . . . . . . . . . . . . . . . . . . . . . . 5 6 28 36 61
Income (loss) from continuing operations before income taxes . . . . . . . . . . . 1,320 507 (4,938) 1,320 1,446Federal, state and local income tax benefit (expense) . . . . . . . . . . . . . . . . . . . (473) (178) 163 (411) (458)
Income (loss) from continuing operations . . . . . . . . . . . . . . . . . . . . . . . . . . . . 847 329 (4,775) 909 988Discontinued operations, net of income taxes (b) . . . . . . . . . . . . . . . . . . . . . . – – – (16) 7
Net income (loss) . . . . . . . . . . . . . . . . . . . . . . . . . . . . . . . . . . . . . . . . . . . . . . . $ 847 $ 329 $ (4,775) $ 893 $ 995
Basic earnings (loss) per share:Income (loss) from continuing operations . . . . . . . . . . . . . . . . . . . . . . . . . . . . $ 2.00 $ .78 $ (11.34) $ 2.04 $ 1.83Net income (loss) . . . . . . . . . . . . . . . . . . . . . . . . . . . . . . . . . . . . . . . . . . . . . . . 2.00 .78 (11.34) 2.00 1.84
Diluted earnings (loss) per share:Income (loss) from continuing operations . . . . . . . . . . . . . . . . . . . . . . . . . . . . $ 1.98 $ .78 $ (11.34) $ 2.01 $ 1.80Net income (loss) . . . . . . . . . . . . . . . . . . . . . . . . . . . . . . . . . . . . . . . . . . . . . . . 1.98 .78 (11.34) 1.97 1.81
Average number of shares outstanding . . . . . . . . . . . . . . . . . . . . . . . . . . . . . . . . . . 422.2 420.4 420.0 445.6 539.0Cash dividends paid per share (c) . . . . . . . . . . . . . . . . . . . . . . . . . . . . . . . . . . . . . . . $ .2000 $ .2000 $ .5275 $ .5175 $ .5075Depreciation and amortization . . . . . . . . . . . . . . . . . . . . . . . . . . . . . . . . . . . . . . . . . $ 1,150 $ 1,210 $ 1,278 $ 1,304 $ 1,265Capital expenditures . . . . . . . . . . . . . . . . . . . . . . . . . . . . . . . . . . . . . . . . . . . . . . . . . $ 505 $ 460 $ 897 $ 1,105 $ 1,392Balance Sheet Data (at year end):
Cash and cash equivalents . . . . . . . . . . . . . . . . . . . . . . . . . . . . . . . . . . . . . . . . $ 1,464 $ 1,686 $ 1,385 $ 676 $ 1,294Total assets . . . . . . . . . . . . . . . . . . . . . . . . . . . . . . . . . . . . . . . . . . . . . . . . . . . . 20,631 21,300 22,145 27,789 29,550Short-term debt . . . . . . . . . . . . . . . . . . . . . . . . . . . . . . . . . . . . . . . . . . . . . . . . . 454 242 966 666 650Long-term debt . . . . . . . . . . . . . . . . . . . . . . . . . . . . . . . . . . . . . . . . . . . . . . . . . 6,971 8,456 8,733 9,087 7,847Shareholders’ equity . . . . . . . . . . . . . . . . . . . . . . . . . . . . . . . . . . . . . . . . . . . . . 5,530 4,653 4,620 9,907 12,254
* 53 weeks** The Company changed its methodology for recording deferred state income taxes from a blended rate basis to a separate entity basis, and
has reflected the effects of such change retroactively to fiscal 2008. Even though the Company considers the change to have had only animmaterial impact on its financial condition, results of operations and cash flows, the financial condition, results of operations and cashflows for the prior periods as previously reported have been adjusted to reflect the change.
(a) Interest expense in 2010 includes approximately $66 million of expenses associated with the early retirement of approximately $1,000million of outstanding debt. Interest expense includes a gain of approximately $54 million in 2006 related to the completion of a debttender offer.
(b) Discontinued operations include (1) for 2007, the after-tax results of the After Hours Formalwear business, including an after-tax loss of$7 million on the disposal of After Hours Formalwear, and (2) for 2006, the after-tax results of operations of the Lord & Taylor divisionand the Bridal Group division (including David’s Bridal, After Hours Formalwear, and Priscilla of Boston), including after-tax losses of$38 million and $18 million on the disposals of the Lord & Taylor division and the David’s Bridal and Priscilla of Boston businesses,respectively.
(c) Cash dividends paid for 2006 have been adjusted to reflect the two-for-one stock-split effected in the form of a stock dividend distributedon June 9, 2006.
15

Item 7. Management’s Discussion and Analysis of Financial Condition and Results of Operations.
The Company is a retail organization operating retail stores and Internet websites under two brands (Macy’sand Bloomingdale’s) that sell a wide range of merchandise, including men’s, women’s and children’s apparel andaccessories, cosmetics, home furnishings and other consumer goods in 45 states, the District of Columbia, Guamand Puerto Rico. As of January 29, 2011, the Company’s operations were conducted through Macy’s,macys.com, Bloomingdale’s, bloomingdales.com and Bloomingdale’s Outlet which are aggregated into onereporting segment in accordance with the Financial Accounting Standards Board (“FASB”) AccountingStandards Codification (“ASC”) Topic 280, “Segment Reporting.”
The Company is focused on four key strategies for continued growth in sales, earnings and cash flow in theyears ahead: (i) maximizing the My Macy’s localization initiative; (ii) developing private and exclusive brands;(iii) embracing customer centricity, including engaging customers on the selling floor; and (iv) driving theomnichannel business.
The My Macy’s localization initiative was developed with the goal of accelerating sales growth in existinglocations by ensuring that core customers surrounding each Macy’s store find merchandise assortments, sizeranges, marketing programs and shopping experiences that are custom-tailored to their needs. My Macy’s hasconcentrated more management talent in local markets, effectively reducing the “span of control” over localstores; created new positions in the field to work with district planning and buying executives in helping tounderstand and act on the merchandise needs of local customers; and empowered locally based executives tomake more and better decisions. Also as part of My Macy’s, the Company’s Macy’s branded stores are organizedin a unified operating structure and division central office organizations were eliminated. This has reducedcentral office and administrative expense, eliminated duplication, sharpened execution, and helped the Companyto partner more effectively with its suppliers and business partners.
The Company’s omnichannel strategy allows customers to shop seamlessly in stores, online and via mobiledevices. As part of the comprehensive focus on its omnichannel business, the Company is building an efficientand resourceful organization that thrives on unrelenting creativity and innovation. Current and future expansionsto the macys.com and bloomingdales.com online businesses represent investments in merchandising, marketingand site development, all of which complement ongoing improvements in systems infrastructure, fulfillmentcapacity and customer service.
During 2010, the Company launched a new Bloomingdale’s Outlet store concept, which initially consists offour Bloomingdale’s Outlet stores, each with approximately 25,000 square feet. Additional Bloomingdale’sOutlet stores are expected to roll out to selected locations across the country in 2011 and beyond. Bloomingdale’sOutlet stores offer a range of apparel and accessories, including women’s ready-to-wear, men’s, children’s,women’s shoes, fashion accessories, jewelry, handbags and intimate apparel.
Additionally, in February 2010, Bloomingdale’s opened in Dubai, United Arab Emirates under a licenseagreement with Al Tayer Insignia, a company of Al Tayer Group, LLC, under which the Company is entitled to alicense fee in accordance with the terms of the underlying agreement, generally based upon the greater of thecontractually earned or guaranteed minimum amounts.
During 2010, the Company opened two new Macy’s stores, one new Bloomingdale’s store, and fourBloomingdale’s Outlet stores. During 2009, the Company opened five new Macy’s department stores, re-openedtwo Macy’s department stores that had been damaged in 2008 by Hurricane Ike, opened one replacement Macy’sdepartment store, and also expanded into an additional Macy’s location in an existing mall. In 2011, theCompany intends to open three Bloomingdale’s Outlet stores and re-open a Macy’s department store that hadbeen closed in 2010 due to flood damage.
16

The Company’s operations are impacted by competitive pressures from department stores, specialty stores,mass merchandisers and all other retail channels. The Company’s operations are also impacted by generalconsumer spending levels, including the impact of general economic conditions, consumer disposable incomelevels, consumer confidence levels, the availability, cost and level of consumer debt, the costs of basic necessitiesand other goods and the effects of weather or natural disasters and other factors over which the Company haslittle or no control.
Throughout 2008 and into 2009, consumer spending levels were adversely affected by a number of factors,including substantial declines in the level of general economic activity and real estate and investment values,substantial increases in consumer pessimism, unemployment and the costs of basic necessities, and a significanttightening of consumer credit. These conditions adversely affected, and to varying degrees continue to adverselyaffect, the amount of funds that consumers are willing and able to spend for discretionary purchases, includingpurchases of some of the merchandise offered by the Company. These conditions also adversely affected theprojected future cash flows attributable to the Company’s operations, including the projected future cash flowsassumed in connection with the acquisition of The May Department Stores Company (“May”), resulting in theCompany recording in the fourth quarter of 2008 a reduction in the carrying value of its goodwill, and a relatednon-cash impairment charge, in the amount of $5,382 million. The Company experienced significantly highersales growth and steady gross margin and cash flow in 2010, and therefore is optimistic about the improvementin current and future economic conditions.
The effects of economic conditions have been, and may continue to be, experienced differently, or atdifferent times, in the various geographic regions in which the Company operates, in relation to the differenttypes of merchandise that the Company offers for sale, or in relation to the Company’s Macy’s-branded andBloomingdale’s-branded operations. All economic conditions, however, ultimately affect the Company’s overalloperations. Based on its assessment of current and anticipated market conditions and its recent performance, theCompany is assuming that its comparable store sales in 2011 will increase approximately 3% from 2010 levels.
The discussion in this Item 7 should be read in conjunction with our Consolidated Financial Statements andthe related notes included elsewhere in this report. The discussion in this Item 7 contains forward-lookingstatements that reflect the Company’s plans, estimates and beliefs. The Company’s actual results could materiallydiffer from those discussed in these forward-looking statements. Factors that could cause or contribute to thosedifferences include, but are not limited to, those discussed below and elsewhere in this report, particularly in“Risk Factors” and “Forward-Looking Statements.”
Results of Operations
Net sales include merchandise sales, leased department income, shipping and handling fees and sales tothird party retailers. In 2010, the Company began including sales of private brand goods directly to third partyretailers and sales of excess inventory to third parties in net sales. These items were previously reported, net ofthe related cost of sales, in selling, general and administrative expenses (“SG&A”) expenses. This change inpresentation had an immaterial impact on reported net sales, does not impact comparable store sales, net income(loss) or diluted earnings (loss) per share, and was not applied retroactively to annual periods prior to fiscal 2010.
The Company changed its methodology for recording deferred state income taxes from a blended rate basisto a separate entity basis, and has reflected the effects of such change to 2010 and all prior periods. Even thoughthe Company considers the change to have had only an immaterial impact on its financial condition, results ofoperations and cash flows for the periods presented, the financial condition, results of operations and cash flowsfor the prior periods as previously reported have been adjusted to reflect the change.
Comparison of the 52 Weeks Ended January 29, 2011 and January 30, 2010. Net income for 2010 was $847million, compared to net income of $329 million for 2009, reflecting the benefits of the strategic initiatives at
17

Macy’s and the continued strong performance at Bloomingdale’s. The net income for 2010 includes the impact of$25 million of impairments and store closing costs. The net income for 2009 included the impact of $391 millionof impairments, store closing costs and division consolidation costs.
Net sales for 2010 totaled $25,003 million, compared to net sales of $23,489 million for 2009, an increase of$1,514 million or 6.4%. On a comparable store basis, net sales for 2010 were up 4.6% compared to 2009. Salesfrom the Company’s Internet businesses in 2010 increased 28.7% compared to 2009 and positively affected theCompany’s 2010 comparable store sales by 0.9%. The Company has realized continued success in the MyMacy’s localization strategy. Geographically, sales in 2010 were strongest in Florida and the upper Midwest. Byfamily of business, sales in 2010 were strongest in updated women’s apparel, particularly the Company’s I-N-Cbrand, jewelry and watches, men’s apparel and accessories, luggage, furniture and mattresses. Sales of theCompany’s private label brands continued to be strong and represented approximately 20% of net sales in theMacy’s-branded stores in 2010. Sales in 2010 were less strong in traditional women’s sportswear. The Companycalculates comparable store sales as sales from stores in operation throughout 2009 and 2010 and all net Internetsales. Stores undergoing remodeling, expansion or relocation remain in the comparable store sales calculationunless the store is closed for a significant period of time. Definitions and calculations of comparable store salesdiffer among companies in the retail industry.
Cost of sales was $14,824 million or 59.3% of net sales for 2010, compared to $13,973 million or 59.5% ofnet sales for 2009, an increase of $851 million. The improved cost of sales rate reflects the benefit of goodinventory management throughout 2010. The valuation of merchandise inventories on the last-in, first-out basisdid not impact cost of sales in either period.
SG&A expenses were $8,260 million or 33.0% of net sales for 2010, compared to $8,062 million or 34.3%of net sales for 2009, an increase of $198 million. The SG&A rate as a percent of net sales was lower in 2010, ascompared to 2009, reflecting an increase in net sales. SG&A expenses in 2010 increased due to higher sellingcosts as a result of stronger sales, higher workers’ compensation and general liability insurance costs, higherpension and supplementary retirement plan expense, and higher costs in support of the Company’s omnichanneloperations, partially offset by lower depreciation and amortization expense, lower stock-based compensationexpense, higher income from credit operations and lower advertising expense. Workers’ compensation andgeneral liability insurance costs were $148 million for 2010, compared to $124 million for 2009. Pension andsupplementary retirement plan expense amounted to $144 million for 2010, compared to $110 million for 2009.Depreciation and amortization expense was $1,150 million for 2010, compared to $1,210 million for 2009.Stock-based compensation expense was $66 million for 2010, compared to $76 million for 2009. Income fromcredit operations was $332 million in 2010 as compared to $323 million in 2009. Advertising expense, net ofcooperative advertising allowances, was $1,072 million for 2010 compared to $1,087 million for 2009.
Impairments, store closing costs and division consolidation costs for 2010 amounted to $25 million andincluded $18 million of asset impairment charges and $7 million of other costs and expenses related to the storeclosings announced in January 2011.
Impairments, store closing costs and division consolidation costs for 2009 amounted to $391 million andincluded $115 million of asset impairment charges, $6 million of other costs and expenses related to the storeclosings announced in January 2010, and $270 million of restructuring-related costs and expenses associated withthe division consolidation and localization initiatives, primarily severance and other human resource-relatedcosts.
Net interest expense was $574 million for 2010, compared to $556 million for 2009, an increase of $18million. The increase in net interest expense is primarily due to approximately $66 million of expenses associatedwith the early retirement of approximately $1,000 million of outstanding debt during 2010, partially offset bylower levels of borrowings due primarily to such early retirement of outstanding debt.
18

The Company’s effective tax rate of 35.8% for 2010 and 35.2% for 2009 differ from the federal income taxstatutory rate of 35%, and on a comparative basis, principally because of the effect of state and local incometaxes and the settlement of various tax issues and tax examinations. Federal, state and local income tax expensefor 2009 included a benefit of approximately $21 million related to the settlement of federal income taxexaminations, primarily attributable to the disposition of former subsidiaries.
Comparison of the 52 Weeks Ended January 30, 2010 and January 31, 2009. Net income for 2009 was $329million, compared to the net loss of $4,775 million for 2008. The net income for 2009 included the impact of$391 million of impairments, store closing costs and division consolidation costs. The net loss for 2008 includedthe impact of $5,382 million of goodwill impairment charges and $398 million of impairments, store closingcosts and division consolidation costs.
Net sales for 2009 totaled $23,489 million, compared to net sales of $24,892 million for 2008, a decrease of$1,403 million or 5.6%. On a comparable store basis, net sales for 2009 were down 5.3% compared to 2008.Sales from the Company’s Internet businesses in 2009 increased 19.6% compared to 2008 and positively affectedthe Company’s 2009 comparable store sales by 0.6%. Geographically, sales in 2009 were strong in the Midwestand weaker in Florida and California. By family of business, sales in 2009 were strongest in moderate apparel,updated better women’s sportswear, women’s shoes, outerwear, jewelry and watches, housewares, home textilesand mattresses. Sales of the Company’s private label brands continued to be strong and representedapproximately 19% of net sales in the Macy’s-branded stores in 2009. The weaker businesses during 2009included traditional better women’s sportswear, men’s suits, handbags, fragrances, fine china and crystal andfurniture. The Company calculates comparable store sales as net sales from stores in operation throughout 2008and 2009 and all net Internet sales. Stores undergoing remodeling, expansion or relocation remain in thecomparable store sales calculation unless the store is closed for a significant period of time. Definitions andcalculations of comparable store sales differ among companies in the retail industry.
Cost of sales was $13,973 million or 59.5% of net sales for 2009, compared to $15,009 million or 60.3% ofnet sales for 2008, a decrease of $1,036 million. The improved cost of sales rate reflected the benefit of goodinventory management throughout 2009. The valuation of merchandise inventories on the last-in, first-out basisdid not impact cost of sales in either period.
SG&A expenses were $8,062 million or 34.3% of net sales for 2009, compared to $8,481 million or 34.1%of net sales for 2008, a decrease of $419 million. The SG&A rate as a percent of net sales was higher in 2009, ascompared to 2008, primarily because of weaker sales. SG&A expenses in 2009 benefited from consolidation-related expense savings, lower depreciation and amortization expenses, lower workers’ compensation andgeneral liability insurance costs and lower advertising expense, partially offset by higher stock-basedcompensation expense, higher performance based incentive compensation expense, lower income from creditoperations and higher costs in support of the Company’s omnichannel operations. Depreciation and amortizationexpense was $1,210 million for 2009, compared to $1,278 million for 2008. Workers’ compensation and generalliability insurance costs were $124 million for 2009, compared to $164 million for 2008. Advertising expense,net of cooperative advertising allowances, was $1,087 million for 2009 compared to $1,239 million for 2008.Stock-based compensation expense was $76 million for 2009, compared to $43 million for 2008. Income fromcredit operations was $323 million in 2009 as compared to $372 million in 2008. Pension and supplementaryretirement plan expense amounted to $110 million for 2009, compared to $114 million for 2008.
Impairments, store closing costs and division consolidation costs for 2009 amounted to $391 million andincluded $115 million of asset impairment charges, $6 million of other costs and expenses related to the storeclosings announced in January 2010, and $270 million of restructuring-related costs and expenses associated withthe division consolidation and localization initiatives, primarily severance and other human resource-relatedcosts.
19

Impairments, store closing costs and division consolidation costs for 2008 amounted to $398 million andincluded $211 million of asset impairment charges, $11 million of other costs and expenses related to the storeclosings announced in January 2009, and $176 million of restructuring-related costs and expenses associated withthe division consolidation and localization initiatives, primarily severance and other human resource-relatedcosts.
Goodwill impairment charges for 2008 amounted to $5,382 million, which represented a write down ofgoodwill in the amount of the excess of the previous carrying value of goodwill over the implied fair value ofgoodwill, as calculated under the two-step goodwill impairment process in accordance with ASC Subtopic350-20, “Goodwill.”
Net interest expense was $556 million for 2009, compared to $560 million for 2008, a decrease of $4million. The decrease in net interest expense for 2009, as compared to 2008, resulted primarily from a lowerlevel of borrowings due to retirement of debt at maturity and the debt tender offer completed during 2009, andwas partially offset by a decrease in interest income due to lower rates on invested cash.
The Company’s effective income tax rate of 35.2% for 2009 differed from the federal income tax statutoryrate of 35.0% principally because of the effect of state and local income taxes and the settlement of various taxissues and tax examinations. Federal, state and local income tax expense for 2009 included a benefit ofapproximately $21 million related to the settlement of federal income tax examinations, primarily attributable tothe disposition of former subsidiaries. The Company’s effective income tax rate for 2008 differed from thefederal income tax statutory rate of 35.0%, principally because of the impact of non-deductible goodwillimpairment charges, the effect of state and local income taxes and the settlement of various tax issues and taxexaminations.
Liquidity and Capital Resources
The Company’s principal sources of liquidity are cash from operations, cash on hand and the credit facilitydescribed below.
Net cash provided by operating activities in 2010 was $1,506 million, compared to $1,750 million providedin 2009. The decrease in cash provided by operating activities in 2010 compared to 2009 includes a greaterdecrease in other liabilities not separately identified, primarily accelerated pension contributions. During 2010,the Company made pension funding contributions totaling approximately $825 million, compared to pensionfunding contributions made during 2009 of approximately $370 million.
Net cash used by investing activities was $465 million for 2010, compared to net cash used by investingactivities of $377 million for 2009. Investing activities for 2010 include purchases of property and equipmenttotaling $339 million and capitalized software of $166 million, compared to purchases of property and equipmenttotaling $355 million and capitalized software of $105 million for 2009. Cash flows from investing activitiesincluded $74 million and $60 million from the disposition of property and equipment for 2010 and 2009,respectively.
The Company’s budgeted capital expenditures are approximately $800 million for 2011, primarily related tostore remodels, maintenance, technology and omnichannel investments, and distribution network improvements,including construction of a new fulfillment center. Management presently anticipates funding such expenditureswith cash on hand and cash from operations.
Net cash used by the Company for all financing activities was $1,263 million for 2010, including therepayment of $1,245 million of debt and the payment of $84 million of cash dividends, partially offset by anincrease in outstanding checks of $24 million and the issuance of $43 million of common stock, primarily related
20

to the exercise of stock options. The debt repaid during 2010 includes the early retirement of approximately$1,000 million of outstanding debt with various stated maturities, and payment at maturity of $76 million of8.5% senior notes due June 1, 2010 and $150 million of 10.625% senior debentures due November 1, 2010.
Net cash used by the Company for all financing activities was $1,072 million for 2009, including therepayment of $966 million of debt, a decrease in outstanding checks of $29 million, and the payment of $84million of cash dividends. The debt repaid during 2009 included $350 million of 6.30% senior notes due April 1,2009 and $600 million of 4.80% senior notes due July 15, 2009.
The Company is a party to a credit agreement with certain financial institutions providing for revolvingcredit borrowings and letters of credit in an aggregate amount not to exceed $2,000 million (which amount maybe increased to $2,500 million at the option of the Company, subject to the willingness of existing or new lendersto provide commitments for such additional financing) outstanding at any particular time. This agreement is setto expire August 30, 2012. As of January 29, 2011 and throughout all of 2010, the Company had no borrowingsoutstanding under this agreement.
The credit agreement requires the Company to maintain a specified interest coverage ratio for the latest fourquarters of no less than 3.25 and a specified leverage ratio as of and for the latest four quarters of no more than4.50. The Company’s interest coverage ratio for 2010 was 5.64 and its leverage ratio at January 29, 2011 was2.34, in each case as calculated in accordance with the credit agreement. The interest coverage ratio is defined asEBITDA (earnings before interest, taxes, depreciation and amortization) over net interest expense and theleverage ratio is defined as debt over EBITDA. For purposes of these calculations EBITDA is calculated as netincome plus interest expense, taxes, depreciation, amortization, non-cash impairment of goodwill, intangiblesand real estate, non-recurring cash charges not to exceed in the aggregate $500 million from the date of theagreement and extraordinary losses less interest income and non-recurring or extraordinary gains. Debt and netinterest are adjusted to exclude the premium on acquired debt and the resulting amortization, respectively.
A breach of a restrictive covenant in the Company’s credit agreement or the inability of the Company tomaintain the financial ratios described above could result in an event of default under the credit agreement. Inaddition, an event of default would occur under the credit agreement if any indebtedness of the Company inexcess of an aggregate principal amount of $150 million becomes due prior to its stated maturity or the holders ofsuch indebtedness become able to cause it to become due prior to its stated maturity. Upon the occurrence of anevent of default, the lenders could, subject to the terms and conditions of the credit agreement, elect to declarethe outstanding principal, together with accrued interest, to be immediately due and payable.
Moreover, most of the Company’s senior notes and debentures contain cross-default provisions based on thenon-payment at maturity, or other default after an applicable grace period, of any other debt, the unpaid principalamount of which is not less than $100 million, that could be triggered by an event of default under the creditagreement. In such an event, the Company’s senior notes and debentures that contain cross-default provisionswould also be subject to acceleration.
At January 29, 2011, no notes or debentures contain provisions requiring acceleration of payment upon adebt rating downgrade. However, the terms of approximately $3,000 million in aggregate principal amount of theCompany’s senior notes outstanding at that date require the Company to offer to purchase such notes at a priceequal to 101% of their principal amount plus accrued and unpaid interest in specified circumstances involvingboth a change of control (as defined in the applicable indenture) of the Company and the rating of the notes byspecified rating agencies at a level below investment grade.
The rate of interest payable in respect of $612 million in aggregate principal amount of the Company’ssenior notes outstanding at January 29, 2011 decreased by .50 percent per annum to 8.375% effective in May2010 as a result of an upgrade of the notes by specified rating agencies. The rate of interest payable in respect of
21

these senior notes outstanding at January 29, 2011 could increase by up to 1.50 percent per annum or decrease byup to .50 percent per annum from its current level in the event of one or more downgrades or upgrades of thenotes by specified rating agencies.
During 2010, the Company repurchased no shares of its common stock under its share repurchase program.The Company’s share repurchase program is currently suspended. As of January 29, 2011, the Company hadapproximately $850 million of authorization remaining under its share repurchase program. The Company maycontinue or, from time to time, suspend repurchases of shares under its share repurchase program, depending onprevailing market conditions, alternate uses of capital and other factors.
On February 25, 2011, the Company’s board of directors declared a quarterly dividend of 5 cents per shareon its common stock, payable April 1, 2011 to Macy’s shareholders of record at the close of business onMarch 15, 2011.
At January 29, 2011, the Company had contractual obligations (within the scope of Item 303(a)(5) ofRegulation S-K) as follows:
Obligations Due, by Period
TotalLess than
1 Year1 – 3Years
3 – 5Years
More than5 Years
(millions)
Short-term debt . . . . . . . . . . . . . . . . . . . . . . . . . . . . . . . . . . . . . $ 451 $ 451 $ – $ – $ –Long-term debt . . . . . . . . . . . . . . . . . . . . . . . . . . . . . . . . . . . . . 6,702 – 1,219 1,179 4,304Interest on debt . . . . . . . . . . . . . . . . . . . . . . . . . . . . . . . . . . . . . 5,082 472 814 685 3,111Capital lease obligations . . . . . . . . . . . . . . . . . . . . . . . . . . . . . . 58 6 10 7 35Other long-term liabilities . . . . . . . . . . . . . . . . . . . . . . . . . . . . 1,354 26 375 245 708Operating leases . . . . . . . . . . . . . . . . . . . . . . . . . . . . . . . . . . . . 2,612 245 446 340 1,581Letters of credit . . . . . . . . . . . . . . . . . . . . . . . . . . . . . . . . . . . . . 38 38 – – –Other obligations . . . . . . . . . . . . . . . . . . . . . . . . . . . . . . . . . . . 2,320 1,988 265 61 6
$18,617 $3,226 $3,129 $2,517 $9,745
“Other obligations” in the foregoing table consist primarily of merchandise purchase obligations andobligations under outsourcing arrangements, construction contracts, employment contracts, group medical/dental/life insurance programs, energy and other supply agreements identified by the Company and liabilities forunrecognized tax benefits that the Company expects to settle in cash in the next year. The Company’smerchandise purchase obligations fluctuate on a seasonal basis, typically being higher in the summer and earlyfall and being lower in the late winter and early spring. The Company purchases a substantial portion of itsmerchandise inventories and other goods and services otherwise than through binding contracts. Consequently,the amounts shown as “Other obligations” in the foregoing table do not reflect the total amounts that theCompany would need to spend on goods and services in order to operate its businesses in the ordinary course.
The Company has not included in the contractual obligations table approximately $170 million of long-termliabilities for unrecognized tax benefits for various tax positions taken or approximately $76 million of relatedaccrued federal, state and local interest and penalties. These liabilities may increase or decrease over time as aresult of tax examinations, and given the status of examinations, the Company cannot reliably estimate the periodof any cash settlement with the respective taxing authorities. The Company has included in the contractualobligations table $11 million of liabilities for unrecognized tax benefits that the Company expects to settle incash in the next year. The Company has not included in the contractual obligation table the $220 million PensionPlan liability. The Company’s funding policy is to contribute amounts necessary to satisfy pension fundingrequirements, including requirements of the Pension Protection Act of 2006, plus such additional amounts fromtime to time as are determined to be appropriate to improve the Pension Plan’s funded status. The Pension Plan’s
22

funded status is affected by many factors including discount rates and the performance of Pension Plan assets. OnMarch 28, 2011, the Company made a voluntary funding contribution to the Pension Plan of $225 million. TheCompany does not presently anticipate making any additional funding contributions to the Pension Plan during2011, but may choose to do so in its discretion.
Management believes that, with respect to the Company’s current operations, cash on hand and funds fromoperations, together with its credit facility and other capital resources, will be sufficient to cover the Company’sreasonably foreseeable working capital, capital expenditure and debt service requirements and other cashrequirements in both the near term and over the longer term. The Company’s ability to generate funds fromoperations may be affected by numerous factors, including general economic conditions and levels of consumerconfidence and demand; however, the Company expects to be able to manage its working capital levels andcapital expenditure amounts so as to maintain sufficient levels of liquidity. To the extent that the Company’s cashbalances from time to time exceed amounts that are needed to fund its immediate liquidity requirements, theCompany will consider alternative uses of some or all of such excess cash. Depending upon its actual andanticipated sources and uses of liquidity, conditions in the capital markets and other factors, the Company willfrom time to time consider the issuance of debt or other securities, or other possible capital markets transactions,for the purpose of raising capital which could be used to refinance current indebtedness or for other corporatepurposes, and the redemption or repurchase of debt or other securities through open market purchases, privatelynegotiated transactions or otherwise.
Management believes the department store business and other retail businesses will continue to consolidate.The Company intends from time to time to consider additional acquisitions of, and investments in, departmentstores and other complementary assets and companies. Acquisition transactions, if any, are expected to befinanced from one or more of the following sources: cash on hand, cash from operations, borrowings underexisting or new credit facilities and the issuance of long-term debt or other securities, including common stock.
Critical Accounting Policies
Merchandise Inventories
Merchandise inventories are valued at the lower of cost or market using the last-in, first-out (LIFO) retailinventory method. Under the retail inventory method, inventory is segregated into departments of merchandisehaving similar characteristics, and is stated at its current retail selling value. Inventory retail values are convertedto a cost basis by applying specific average cost factors for each merchandise department. Cost factors representthe average cost-to-retail ratio for each merchandise department based on beginning inventory and the fiscal yearpurchase activity. The retail inventory method inherently requires management judgments and containsestimates, such as the amount and timing of permanent markdowns to clear unproductive or slow-movinginventory, which may impact the ending inventory valuation as well as gross margins.
Permanent markdowns designated for clearance activity are recorded when the utility of the inventory hasdiminished. Factors considered in the determination of permanent markdowns include current and anticipateddemand, customer preferences, age of the merchandise and fashion trends. When a decision is made topermanently mark down merchandise, the resulting gross profit reduction is recognized in the period themarkdown is recorded.
The Company receives certain allowances from various vendors in support of the merchandise it purchasesfor resale. The Company receives certain allowances as reimbursement for markdowns taken and/or to supportthe gross margins earned in connection with the sales of merchandise. These allowances are generally credited tocost of sales at the time the merchandise is sold in accordance with ASC Subtopic 605-50, “Customer Paymentsand Incentives.” The Company also receives advertising allowances from more than 1,000 of its merchandisevendors pursuant to cooperative advertising programs, with some vendors participating in multiple programs.These allowances represent reimbursements by vendors of costs incurred by the Company to promote the
23
vendors’ merchandise and are netted against advertising and promotional costs when the related costs areincurred in accordance with ASC Subtopic 605-50. Advertising allowances in excess of costs incurred arerecorded as a reduction of merchandise costs. The arrangements pursuant to which the Company’s vendorsprovide allowances, while binding, are generally informal in nature and one year or less in duration. The termsand conditions of these arrangements vary significantly from vendor to vendor and are influenced by, amongother things, the type of merchandise to be supported. Although it is highly unlikely that there will be anysignificant reduction in historical levels of vendor support, if such a reduction were to occur, the Company couldexperience higher costs of sales and higher advertising expense, or reduce the amount of advertising that it uses,depending on the specific vendors involved and market conditions existing at the time.
Physical inventories are generally taken within each merchandise department annually, and inventoryrecords are adjusted accordingly, resulting in the recording of actual shrinkage. While it is not possible toquantify the impact from each cause of shrinkage, the Company has loss prevention programs and policies thatare intended to minimize shrinkage. Physical inventories are taken at all store locations for substantially allmerchandise categories approximately three weeks before the end of the fiscal year. Shrinkage is estimated as apercentage of sales at interim periods and for this approximate three-week period, based on historical shrinkagerates.
Long-Lived Asset Impairment and Restructuring Charges
The carrying values of long-lived assets are periodically reviewed by the Company whenever events orchanges in circumstances indicate that a potential impairment has occurred. For long-lived assets held for use, apotential impairment has occurred if projected future undiscounted cash flows are less than the carrying value ofthe assets. The estimate of cash flows includes management’s assumptions of cash inflows and outflows directlyresulting from the use of those assets in operations. When a potential impairment has occurred, an impairmentwrite-down is recorded if the carrying value of the long-lived asset exceeds its fair value. The Company believesits estimated cash flows are sufficient to support the carrying value of its long-lived assets. If estimated cashflows significantly differ in the future, the Company may be required to record asset impairment write-downs.
If the Company commits to a plan to dispose of a long-lived asset before the end of its previously estimateduseful life, estimated cash flows are revised accordingly, and the Company may be required to record an assetimpairment write-down. Additionally, related liabilities arise such as severance, contractual obligations and otheraccruals associated with store closings from decisions to dispose of assets. The Company estimates theseliabilities based on the facts and circumstances in existence for each restructuring decision. The amounts theCompany will ultimately realize or disburse could differ from the amounts assumed in arriving at the assetimpairment and restructuring charge recorded.
The Company classifies certain long-lived assets as held for disposal by sale and ceases depreciation whenthe particular criteria for such classification are met, including the probable sale within one year. For long-livedassets to be disposed of by sale, an impairment charge is recorded if the carrying amount of the asset exceeds itsfair value less costs to sell. Such valuations include estimations of fair values and incremental direct costs totransact a sale.
Goodwill and Intangible Assets
The Company reviews the carrying value of its goodwill and other intangible assets with indefinite lives atleast annually for possible impairment in accordance with ASC Topic 350, “Intangibles – Goodwill and Other.”Goodwill and other intangible assets with indefinite lives have been assigned to reporting units for purposes ofimpairment testing. The reporting units are the Company’s retail operating divisions. Goodwill and otherintangible assets with indefinite lives are tested for impairment annually at the end of the fiscal month of May.The goodwill impairment test involves a two-step process. The first step involves estimating the fair value of
24

each reporting unit based on its estimated discounted cash flows and comparing the estimated fair value of eachreporting unit to its carrying value. If this comparison indicates that a reporting unit’s estimated fair value is lessthan its carrying value, a second step is required. If applicable, the second step requires the Company to allocatethe fair value of the reporting unit to the estimated fair value of the reporting unit’s net assets, with any fair valuein excess of amounts allocated to such net assets representing the implied fair value of goodwill for that reportingunit. If the carrying value of an individual indefinite-lived intangible asset exceeds its fair value, such individualindefinite-lived intangible asset is written down by an amount equal to such excess.
The Company uses judgment in assessing whether assets may have become impaired between annualimpairment tests. The occurrence of a change in circumstances, such as continued adverse business conditions orother economic factors, would determine the need for impairment testing between annual impairment tests. Dueto deterioration in the general economic environment during 2008 (and the impact thereof on the Company’sthen-most recently completed annual business plan) and the resultant decline in the Company’s marketcapitalization, the Company believed that an additional goodwill impairment test was required as of January 31,2009. In performing the first step of this impairment test, the Company estimated the fair value of its reportingunits by discounting their projected future cash flows to present value, and reconciling the aggregate estimatedfair value of the Company’s reporting units to the trading value of the Company’s common stock (together withan implied control premium). The Company believes that this reconciliation process represents a marketparticipant approach to valuation. Based on this analysis, the Company determined that the carrying value ofeach of the Company’s reporting units exceeded its fair value at January 31, 2009, which resulted in all of theCompany’s reporting units failing the first step of the goodwill impairment test. The Company then undertookthe second step of the goodwill impairment test, which involved, among other things, obtaining third-partyappraisals of substantially all of the Company’s tangible and intangible assets. Based on the results of itsgoodwill impairment testing as of January 31, 2009, the Company recorded a pre-tax goodwill impairmentcharge of $5,382 million ($5,083 million after income taxes) in the fourth quarter of 2008. As a result of the 2008goodwill impairment charge, the Macy’s retail operating division is the only reporting unit with goodwill.
Based on the results of the most recent annual impairment test of goodwill and indefinite-lived intangibleassets completed during the second quarter of 2010, the Company determined that goodwill and indefinite-livedintangible assets were not impaired as of May 29, 2010 and the estimated fair value of the Macy’s retailoperating division substantially exceeded its carrying value.
The goodwill impairment testing process involves the use of significant assumptions, estimates andjudgments by management, and is subject to inherent uncertainties and subjectivity. Estimating a reporting unit’sdiscounted cash flows involves the use of significant assumptions, estimates and judgments with respect to avariety of factors, including sales, gross margin and SG&A rates, capital expenditures, cash flows and theselection and use of an appropriate discount rate. Projected sales, gross margin and SG&A expense rateassumptions and capital expenditures are based on the Company’s annual business plan or other forecastedresults. Discount rates reflect market-based estimates of the risks associated with the projected cash flows of thereporting unit directly resulting from the use of its assets in its operations. The allocation of the estimated fairvalue of the Company’s reporting units to the estimated fair value of their net assets also involves the use ofsignificant assumptions, estimates and judgments. Both the estimates of the fair value of the Company’sreporting units and the allocation of the estimated fair value of the reporting units to their net assets are based onthe best information available to the Company’s management as of the date of the assessment.
The use of different assumptions, estimates or judgments in either step of the goodwill impairment testingprocess, including with respect to the estimated future cash flows of the Company’s reporting units, the discountrate used to discount such estimated cash flows to their net present value, the reasonableness of the resultantimplied control premium relative to the Company’s market capitalization, and the appraised fair value of thereporting units’ tangible and intangible assets and liabilities, could materially increase or decrease the fair valueof the reporting unit and/or its net assets and, accordingly, could materially increase or decrease any relatedimpairment charge.
25

Income Taxes
Income taxes are estimated based on the tax statutes, regulations and case law of the various jurisdictions inwhich the Company operates. Deferred income tax assets and liabilities are recognized for the future taxconsequences attributable to differences between the financial statement carrying amounts of existing assets andliabilities and their respective tax bases, and net operating loss and tax credit carryforwards. Deferred income taxassets and liabilities are measured using enacted tax rates expected to apply to taxable income in the years inwhich those temporary differences are expected to be recovered or settled. Deferred income tax assets areevaluated for recoverability based on all available evidence, including past operating results, estimates of futuretaxable income, and the feasibility of tax planning strategies. Deferred income tax assets are reduced by avaluation allowance when it is more likely than not that some portion of the deferred income tax assets will notbe realized.
The Company changed its methodology for recording deferred state income taxes from a blended rate basisto a separate entity basis, and has reflected the effects of such change to 2010 and all prior periods. Even thoughthe Company considers the change to have had only an immaterial impact on its financial condition, results ofoperations and cash flows for the periods presented, the financial condition, results of operations and cash flowsfor the prior periods as previously reported have been adjusted to reflect the change.
Uncertain tax positions are recognized if the weight of available evidence indicates that it is more likelythan not that the tax position will be sustained on examination, including resolution of any related appeals orlitigation processes, based on the technical merits of the position. Uncertain tax positions meeting the more-likely-than-not recognition threshold are then measured to determine the amount of benefit eligible forrecognition in the financial statements. Each uncertain tax position is measured at the largest amount of benefitthat is more likely than not to be realized upon ultimate settlement. Uncertain tax positions are evaluated andadjusted as appropriate, while taking into account the progress of audits of various taxing jurisdictions. TheCompany does not anticipate that resolution of these matters will have a material impact on the Company’sconsolidated financial position, results of operations or cash flows.
Significant judgment is required in evaluating the Company’s uncertain tax positions, provision for incometaxes, and any valuation allowance recorded against deferred tax assets. Although the Company believes that itsjudgments are reasonable, no assurance can be given that the final tax outcome of these matters will not bedifferent from that which is reflected in the Company’s historical income provisions and accruals.
Self-Insurance Reserves
The Company, through its insurance subsidiaries, is self-insured for workers’ compensation and generalliability claims up to certain maximum liability amounts. Although the amounts accrued are actuariallydetermined by third parties based on analysis of historical trends of losses, settlements, litigation costs and otherfactors, the amounts the Company will ultimately disburse could differ from such accrued amounts.
Pension and Supplementary Retirement Plans
The Company has a funded defined benefit pension plan (the “Pension Plan”) and an unfunded definedbenefit supplementary retirement plan (the “SERP”). The Company accounts for these plans in accordance withASC Topic 715, “Compensation – Retirement Benefits.” Under ASC Topic 715, an employer recognizes thefunded status of a defined benefit postretirement plan as an asset or liability on the balance sheet and recognizeschanges in that funded status in the year in which the changes occur through comprehensive income.Additionally, pension expense is recognized on an accrual basis over employees’ approximate service periods.The pension expense calculation is generally independent of funding decisions or requirements. The Companyanticipates that Pension and SERP expense, which was approximately $144 million in 2010, will remaincomparable in 2011.
26

The Pension Protection Act of 2006 provides the funding requirements for the Pension Plan which aredifferent from the employer’s accounting for the plan as outlined in ASC Topic 715. During 2010, the Companymade funding contributions to the Pension Plan totaling approximately $825 million. On March 28, 2011, theCompany made a voluntary funding contribution to the Pension Plan of $225 million. The Company does notpresently anticipate making any additional funding contributions to the Pension Plan during 2011, but maychoose to do so in its discretion. Management believes that, with respect to the Company’s current operations,cash on hand and funds from operations, together with available borrowing under its credit facility and othercapital resources, will be sufficient to cover the Company’s Pension Plan cash requirements in both the near termand also over the longer term.
At January 29, 2011, the Company had unrecognized actuarial losses of $1,116 million for the Pension Planand $113 million for the SERP. The unrecognized losses for the Pension Plan and the SERP will be recognizedas a component of pension expense in future years in accordance with ASC Topic 715, and is expected to impact2011 Pension and SERP expense by approximately $90 million.
The calculation of pension expense and pension liabilities requires the use of a number of assumptions.Changes in these assumptions can result in different expense and liability amounts, and future actual experiencemay differ significantly from current expectations. The Company believes that the most critical assumptionsrelate to the long-term rate of return on plan assets (in the case of the Pension Plan), the discount rate used todetermine the present value of projected benefit obligations and the weighted average rate of increase of futurecompensation levels.
As of January 29, 2011, the Company lowered the assumed annual long-term rate of return for the PensionPlan’s assets from 8.75% to 8.00% based on expected future returns on the portfolio. The Company develops itsexpected long-term rate of return assumption by evaluating input from several professional advisors taking intoaccount the asset allocation of the portfolio and long-term asset class return expectations, as well as long-terminflation assumptions. Pension expense increases or decreases as the expected rate of return on the assets of thePension Plan decreases or increases, respectively. Lowering the expected long-term rate of return on the PensionPlan’s assets by 0.25% (from 8.00% to 7.75%) would increase the estimated 2011 pension expense byapproximately $8 million and raising the expected long-term rate of return on the Pension Plan’s assets by 0.25%(from 8.00% to 8.25%) would decrease the estimated 2011 pension expense by approximately $8 million.
The Company discounted its future pension obligations using a rate of 5.40% at January 29, 2011, comparedto 5.65% at January 30, 2010. The discount rate used to determine the present value of the Company’s PensionPlan and SERP obligations is based on a yield curve constructed from a portfolio of high quality corporate debtsecurities with various maturities. Each year’s expected future benefit payments are discounted to their presentvalue at the appropriate yield curve rate, thereby generating the overall discount rate for Pension Plan and SERPobligations. Pension liability and future pension expense both increase or decrease as the discount rate is reducedor increased, respectively. Lowering the discount rate by 0.25% (from 5.40% to 5.15%) would increase theprojected benefit obligation at January 29, 2011 by approximately $98 million and would increase estimated2011 pension expense by approximately $11 million. Increasing the discount rate by 0.25% (from 5.40% to5.65%) would decrease the projected benefit obligation at January 29, 2011 by approximately $89 million andwould decrease estimated 2011 pension expense by approximately $10 million.
The assumed weighted average age-graded rate of increase in future compensation levels was 4.5% atJanuary 29, 2011 and January 30, 2010 for the Pension Plan, and 4.9% at January 29, 2011 and January 30, 2010for the SERP. The Company develops its rate of compensation increase assumption on an age-graded basis basedon recent experience and reflects an estimate of future compensation levels taking into account general increaselevels, seniority, promotions and other factors. This assumption was revised during 2009 based on the completionof a third-party assumption study reflecting more recent experience. Pension liabilities and future pensionexpense both increase or decrease as the weighted average rate of increase of future compensation levels is
27

increased or decreased, respectively. Increasing or decreasing the assumed weighted average rate of increase offuture compensation levels by 0.25% would increase or decrease the projected benefit obligation at January 29,2011 by approximately $16 million and change estimated 2011 pension expense by approximately $4 million.
New Pronouncements
In January 2010, the FASB issued Accounting Standards Update No. 2010-06, which provides amendmentsand requires new disclosures relating to ASC Topic 820, “Fair Value Measurements and Disclosures,” and alsoconforming amendments to guidance relating to ASC Topic 715, “Compensation – Retirement Benefits.” TheCompany adopted this guidance on January 31, 2010, except for the disclosure requirement regarding purchases,sales, issuances and settlements in the rollforward of activity in Level 3 fair value measurements, which theCompany adopted on January 30, 2011. This guidance is limited to the form and content of disclosures, and theportion thereof that has been adopted did not have a material impact on the Company’s consolidated financialposition, results of operations or cash flows. The Company does not anticipate that the full adoption of thisguidance will have a material impact on the Company’s consolidated financial position, results of operations orcash flows.
In July 2010, the FASB issued Accounting Standard Update No. 2010-20, which amends various sections ofASC Topic 310, “Receivables,” relating to a company’s allowance for credit losses and the credit quality of itsfinancing receivables. The amendment requires companies to provide disaggregated levels of disclosure byportfolio segment and class of financing receivable to enable users of the financial statements to understand thenature of credit risk, how the risk is analyzed in determining the related allowance for credit losses and changesto the allowance during the reporting period. The Company adopted this guidance as of January 29, 2011, exceptas it relates to disclosures regarding activities during a reporting period, which is effective for interim and annualperiods beginning on or after December 31, 2010. This guidance is limited to the form and content of disclosures.The initial adoption did not have, and the full adoption is not expected to have, an impact on the Company’sconsolidated financial position, results of operations or cash flows.
In December 2010, the FASB issued Accounting Standard Update No. 2010-28, which amends ASC Topic350, “Goodwill and Other,” relating to the goodwill impairment test of a reporting unit with zero or negativecarrying amounts. This guidance is effective for interim and annual periods beginning after December 15, 2010.The Company does not anticipate that the adoption of this guidance will have a material impact on theCompany’s consolidated financial position, results of operations or cash flows.
Item 7A. Quantitative and Qualitative Disclosures About Market Risk.
The Company is exposed to market risk from changes in interest rates that may adversely affect its financialposition, results of operations and cash flows. In seeking to minimize the risks from interest rate fluctuations, theCompany manages exposures through its regular operating and financing activities and, when deemedappropriate, through the use of derivative financial instruments. The Company does not use financial instrumentsfor trading or other speculative purposes and is not a party to any leveraged financial instruments.
The Company is exposed to interest rate risk through its borrowing activities, which are described in Note 8to the Consolidated Financial Statements. The majority of the Company’s borrowings are under fixed rateinstruments. However, the Company, from time to time, may use interest rate swap and interest rate capagreements to help manage its exposure to interest rate movements and reduce borrowing costs. At January 29,2011, the Company was not a party to any derivative financial instruments and based on the Company’s lack ofmarket risk sensitive instruments outstanding at January 29, 2011, the Company has determined that there was nomaterial market risk exposure to the Company’s consolidated financial position, results of operations or cashflows as of such date.
28

Item 8. Consolidated Financial Statements and Supplementary Data.
Information called for by this item is set forth in the Company’s Consolidated Financial Statements andsupplementary data contained in this report and is incorporated herein by this reference. Specific financialstatements and supplementary data can be found at the pages listed in the following index:
INDEX
Page
Report of Management . . . . . . . . . . . . . . . . . . . . . . . . . . . . . . . . . . . . . . . . . . . . . . . . . . . . . . . . . . . . . . . . . . . F-2Report of Independent Registered Public Accounting Firm . . . . . . . . . . . . . . . . . . . . . . . . . . . . . . . . . . . . . . F-3Consolidated Statements of Operations for the fiscal years ended
January 29, 2011, January 30, 2010 and January 31, 2009 . . . . . . . . . . . . . . . . . . . . . . . . . . . . . . . . . . . . . F-4Consolidated Balance Sheets at January 29, 2011 and January 30, 2010 . . . . . . . . . . . . . . . . . . . . . . . . . . . . F-5Consolidated Statements of Changes in Shareholders’ Equity for the fiscal years ended
January 29, 2011, January 30, 2010 and January 31, 2009 . . . . . . . . . . . . . . . . . . . . . . . . . . . . . . . . . . . . . F-6Consolidated Statements of Cash Flows for the fiscal years ended
January 29, 2011, January 30, 2010 and January 31, 2009 . . . . . . . . . . . . . . . . . . . . . . . . . . . . . . . . . . . . . F-7Notes to Consolidated Financial Statements . . . . . . . . . . . . . . . . . . . . . . . . . . . . . . . . . . . . . . . . . . . . . . . . . . F-8
29

Item 9. Changes in and Disagreements with Accountants on Accounting and Financial Disclosure.
None.
Item 9A. Controls and Procedures.
a. Disclosure Controls and Procedures
The Company’s Chief Executive Officer and Chief Financial Officer have carried out, as of January 29,2011, with the participation of the Company’s management, an evaluation of the effectiveness of the Company’sdisclosure controls and procedures, as defined in Rule 13a-15(e) under the Exchange Act. Based upon thisevaluation, the Chief Executive Officer and Chief Financial Officer have concluded that the Company’sdisclosure controls and procedures are effective to provide reasonable assurance that information required to bedisclosed by the Company in reports the Company files under the Exchange Act is recorded, processed,summarized and reported, within the time periods specified in the SEC rules and forms, and that informationrequired to be disclosed by the Company in the reports the Company files or submits under the Exchange Act isaccumulated and communicated to the Company’s management, including its Chief Executive Officer and ChiefFinancial Officer, as appropriate to allow timely decisions regarding required disclosure.
b. Management’s Report on Internal Control over Financial Reporting
The Company’s management is responsible for establishing and maintaining adequate internal control overfinancial reporting, as defined in Exchange Act Rule 13a-15(f). The Company’s management conducted anassessment of the Company’s internal control over financial reporting based on the framework established by theCommittee of Sponsoring Organizations of the Treadway Commission in Internal Control – IntegratedFramework. Based on this assessment, the Company’s management has concluded that, as of January 29, 2011,the Company’s internal control over financial reporting is effective.
The Company’s independent registered public accounting firm, KPMG LLP, has audited the effectivenessof the Company’s internal control over financial reporting as of January 29, 2011 and has issued an attestationreport expressing an unqualified opinion on the effectiveness of the Company’s internal control over financialreporting, as stated in their report located on page F-3.
c. Changes in Internal Control over Financial Reporting
There were no changes in the Company’s internal controls over financial reporting that occurred during theCompany’s most recently completed fiscal quarter that materially affected, or are reasonably likely to materiallyaffect, the Company’s internal control over financial reporting.
d. Certifications
The certifications of the Company’s Chief Executive Officer and Chief Financial Officer required underSection 302 of the Sarbanes-Oxley Act are filed as Exhibits 31.1 and 31.2 to this report. Additionally, in 2010 theCompany’s Chief Executive Officer certified to the NYSE that he was not aware of any violation by theCompany of the NYSE corporate governance listing standards.
30

Item 9B. Other Information.
In January 2011, the Company determined that the performance restricted stock unit agreements issued toparticipants in the Company’s long-term incentive program (including the Company’s principal executiveofficer, principal financial officer and other named executive officers) on March 19, 2010 contained an erroneousdefinition of “Net Sales” in the definition of the EBITDA Margin performance goal. On February 25, 2011, theCompensation and Management Development Committee of the Board of Directors authorized the Company toinclude language in the form of the performance restricted stock unit agreement to be used for 2011 grants,which is filed as Exhibit 10.23 to this report, correcting the definition of Net Sales in the 2010 agreement.Additional information regarding the performance restricted stock units granted to the Company’s namedexecutive officers in fiscal 2010 is set forth under “Compensation Discussion & Analysis” and “Compensation ofthe Named Executives for 2010” in the Proxy Statement to be delivered to shareholders in connection with our2011 Annual Meeting of Shareholders and incorporated herein by reference.
31
PART III
Item 10. Directors and Executive Officers of the Registrant.
Information called for by this item is set forth under “Item 1 – Election of Directors” and “FurtherInformation Concerning the Board of Directors – Committees of the Board” and “Section 16(a) BeneficialOwnership Reporting Compliance” in the Proxy Statement to be delivered to stockholders in connection with our2011 Annual Meeting of Shareholders (the “Proxy Statement”), and “Item 1. Business – Executive Officers ofthe Registrant” in this report and incorporated herein by reference.
Item 11. Executive Compensation.
Information called for by this item is set forth under “Compensation Discussion & Analysis,”“Compensation of the Named Executives for 2010,” “Compensation Committee Report” and “CompensationCommittee Interlocks and Insider Participation” in the Proxy Statement and incorporated herein by reference.
Item 12. Security Ownership of Certain Beneficial Owners and Management and Related StockholderMatters.
Information called for by this item is set forth under “Stock Ownership – Certain Beneficial Owners” and“Stock Ownership – Stock Ownership of Directors and Executive Officers” in the Proxy Statement andincorporated herein by reference.
Item 13. Certain Relationships and Related Transactions.
Information called for by this item is set forth under “Further Information Concerning the Board ofDirectors – Director Independence” and “Policy on Related Person Transactions” in the Proxy Statement andincorporated herein by reference.
Item 14. Principal Accountant Fees and Services.
Information called for by this item is set forth under “Item 2 – Appointment of Independent RegisteredPublic Accounting Firm” in the Proxy Statement and incorporated herein by reference.
32

PART IV
Item 15. Exhibits and Financial Statement Schedules.
(a) The following documents are filed as part of this report:
1. Financial Statements:
The list of financial statements required by this item is set forth in Item 8 “Consolidated FinancialStatements and Supplementary Data” and is incorporated herein by reference.
2. Financial Statement Schedules:
All schedules are omitted because they are inapplicable, not required, or the information is includedelsewhere in the Consolidated Financial Statements or the notes thereto.
3. Exhibits:
ExhibitNumber Description Document if Incorporated by Reference
3.1 Amended and Restated Certificate ofIncorporation
Exhibit 3.1 to the Company’s Current Report onForm 8-K dated May 18, 2010 (the “May 18,2010 Form 8-K”)
3.1.1 Certificate of Designations of Series A JuniorParticipating Preferred Stock
Exhibit 3.1.1 to the Company’s Annual Reporton Form 10-K for the fiscal year endedJanuary 28, 1995
3.2 Amended and Restated By-Laws Exhibit 3.2 to the May 18, 2010 Form 8-K
4.1 Amended and Restated Certificate ofIncorporation
See Exhibits 3.1 and 3.1.1
4.2 Amended and Restated By-Laws See Exhibit 3.2
4.3 Indenture, dated as of January 15, 1991, amongthe Company (as successor to The MayDepartment Stores Company (“MayDelaware”)), Macy’s Retail Holdings, Inc.(“Macy’s Retail”) (f/k/a The May DepartmentStores Company (NY) or “May New York”) andThe Bank of New York Mellon Trust Company,N.A. (“BNY Mellon”, successor to J.P. MorganTrust Company and as successor to The FirstNational Bank of Chicago), as Trustee (the“1991 Indenture”)
Exhibit 4(2) to May New York’s Current Reporton Form 8-K filed on January 15, 1991
4.3.1 Guarantee of Securities, dated as of August 30,2005, by the Company relating to the 1991Indenture
Exhibit 10.13 to the Company’s Current Reporton Form 8-K filed on August 30, 2005 (the“August 30, 2005 Form 8-K”)
4.4 Indenture, dated as of December 15, 1994,between the Company and U.S. Bank NationalAssociation (successor to State Street Bank andTrust Company and The First National Bank ofBoston), as Trustee (the “1994 Indenture”)
Exhibit 4.1 to the Company’s RegistrationStatement on Form S-3 (RegistrationNo. 33-88328) filed on January 9, 1995
33

ExhibitNumber Description Document if Incorporated by Reference
4.4.1 Eighth Supplemental Indenture to the 1994Indenture, dated as of July 14, 1997, between theCompany and U.S. Bank National Association(successor to State Street Bank and TrustCompany and The First National Bank ofBoston), as Trustee
Exhibit 2 to the Company’s Current Report onForm 8-K filed on July 15, 1997 (the “July 1997Form 8-K”)
4.4.2 Ninth Supplemental Indenture to the 1994Indenture, dated as of July 14, 1997, between theCompany and U.S. Bank National Association(successor to State Street Bank and TrustCompany and The First National Bank ofBoston), as Trustee
Exhibit 3 to the July 1997 Form 8-K
4.4.3 Tenth Supplemental Indenture to the 1994Indenture, dated as of August 30, 2005, amongthe Company, Macy’s Retail and U.S. BankNational Association (as successor to State StreetBank and Trust Company and as successor toThe First National Bank of Boston), as Trustee
Exhibit 10.14 to the August 30, 2005 Form 8-K
4.4.4 Guarantee of Securities, dated as of August 30,2005, by the Company relating to the 1994Indenture
Exhibit 10.16 to the August 30, 2005 Form 8-K
4.5 Indenture, dated as of September 10, 1997,between the Company and U.S. Bank NationalAssociation (successor to Citibank, N.A.), asTrustee (the “1997 Indenture”)
Exhibit 4.4 to the Company’s Amendment No. 1to Form S-3 (Registration No. 333-34321) filedon September 11, 1997
4.5.1 First Supplemental Indenture to the 1997Indenture, dated as of February 6, 1998, betweenthe Company and U.S. Bank NationalAssociation (successor to Citibank, N.A.), asTrustee
Exhibit 2 to the Company’s Current Report onForm 8-K filed on February 6, 1998
4.5.2 Third Supplemental Indenture to the 1997Indenture, dated as of March 24, 1999, betweenthe Company and U.S. Bank NationalAssociation (successor to Citibank, N.A.), asTrustee
Exhibit 4.2 to the Company’s RegistrationStatement on Form S-4 (RegistrationNo. 333-76795) filed on April 22, 1999
4.5.3 Fifth Supplemental Trust Indenture dated as ofMarch 27, 2001, between the Company and U.S.Bank National Association (successor toCitibank, N.A.), as Trustee
Exhibit 4 to the Company’s Current Report onForm 8-K filed on March 26, 2001
4.5.4 Seventh Supplemental Indenture to the 1997Indenture, dated as of August 30, 2005 amongthe Company, Macy’s Retail and U.S. BankNational Association (successor to Citibank,N.A.), as Trustee
Exhibit 10.15 to the August 30, 2005 Form 8-K
34

ExhibitNumber Description Document if Incorporated by Reference
4.5.5 Guarantee of Securities, dated as of August 30,2005, by the Company relating to the 1997Indenture
Exhibit 10.17 to the August 30, 2005 Form 8-K
4.6 Indenture, dated as of June 17, 1996, among theCompany (as successor to May Delaware),Macy’s Retail (f/k/a May New York) and TheBank of New York Mellon Trust Company, N.A.(“BNY Mellon”, successor to J.P. Morgan TrustCompany), as Trustee (the “1996 Indenture”)
Exhibit 4.1 to the Registration Statement onForm S-3 (Registration No. 333-06171) filed onJune 18, 1996 by May Delaware
4.6.1 First Supplemental Indenture to the 1996Indenture, dated as of August 30, 2005, by andamong the Company (as successor to MayDelaware), Macy’s Retail (f/k/a May New York)and BNY Mellon, as Trustee
Exhibit 10.9 to the August 30, 2005 Form 8-K
4.7 Indenture, dated as of July 20, 2004, among theCompany (as successor to May Delaware),Macy’s Retail (f/k/a May New York) and BNYMellon, as Trustee (the “2004 Indenture”)
Exhibit 4.1 to the Current Report on Form 8-K(File No. 001-00079) filed July 21, 2004 by MayDelaware
4.7.1 First Supplemental Indenture to the 2004Indenture, dated as of August 30, 2005 amongthe Company (as successor to May Delaware),Macy’s Retail and BNY Mellon, as Trustee
Exhibit 10.10 to the August 30, 2005 Form 8-K
4.8 Indenture, dated as of November 2, 2006, by andamong Macy’s Retail, the Company and U.S.Bank National Association, as Trustee (the“2006 Indenture”)
Exhibit 4.6 to the Company’s RegistrationStatement on Form S-3ASR (RegistrationNo. 333-138376) filed on November 2, 2006
4.8.1 First Supplemental Indenture to the 2006Indenture, dated November 29, 2006, amongMacy’s Retail, the Company and U.S. BankNational Association, as Trustee
Exhibit 4.1 to the Company’s Current Report onForm 8-K filed on November 29, 2006
4.8.2 Second Supplemental Indenture to the 2006Indenture, dated March 12, 2007, among Macy’sRetail, the Company and U.S. Bank NationalAssociation, as Trustee
Exhibit 4.1 to the Company’s Current Report onForm 8-K filed on March 12, 2007 (the“March 12, 2007 Form 8-K”)
4.8.3 Third Supplemental Indenture to the 2006Indenture, dated March 12, 2007, among Macy’sRetail, the Company and U.S. Bank NationalAssociation, as Trustee
Exhibit 4.2 to the March 12, 2007 Form 8-K
4.8.4 Fourth Supplemental Indenture to the 2006Indenture, dated as of August 31, 2007, amongMacy’s Retail, as issuer, the Company, asguarantor, and U.S. Bank National Association,as trustee
Exhibit 4.1 to the Company’s Current Report onForm 8-K filed on August 31, 2007
35

ExhibitNumber Description Document if Incorporated by Reference
4.8.5 Fifth Supplemental Trust Indenture to the 2006Indenture, dated as of June 26, 2008, amongMacy’s Retail, as issuer, Macy’s, Inc., asguarantor, and U.S. Bank National Association,as trustee
Exhibit 4.1 to the Company’s Current Report onForm 8-K filed on June 26, 2008
10.1+ Amendment and Restatement Agreement datedas of dated as of December 18, 2008, amongMacy’s, Inc., Macy’s Retail, the lenders partythereto and JPMorgan Chase Bank, N.A., asadministrative agent and paying agent, and Bankof America, N.A., as administrative agent, whichincludes as an exhibit the Amended and RestatedCredit Agreement dated as of January 5, 2009,among Macy’s, Inc., Macy’s Retail, the lendersfrom time to time parties thereto, JPMorganChase Bank, N.A. and Bank of America, N.A., asadministrative agents, JPMorgan Chase Bank,N.A., as paying agent, and J.P. MorganSecurities Inc. and Banc of America SecuritiesLLC, as joint bookrunners and joint leadarrangers
Exhibit 10.1 to the Company’s Quarterly Reporton Form 10-Q filed on September 8, 2009 (the“September 8, 2009 Form 10-Q”)
10.2 Amended and Restated Guarantee Agreement,dated as of January 5, 2009, among theCompany, Macy’s Retail, certain subsidiaryguarantors and JPMorgan Chase Bank, N.A., aspaying agent
Exhibit 10.2 to the September 8, 2009Form 10-Q
10.3 Commercial Paper Dealer Agreement, dated asof August 30, 2005, among the Company,Macy’s Retail and Banc of America SecuritiesLLC
Exhibit 10.6 to the August 30, 2005 Form 8-K
10.4 Commercial Paper Dealer Agreement, dated asof August 30, 2005, among the Company,Macy’s Retail and Goldman, Sachs & Co.
Exhibit 10.7 to the August 30, 2005 Form 8-K
10.5 Commercial Paper Dealer Agreement, dated asof August 30, 2005, among the Company,Macy’s Retail and J.P. Morgan Securities Inc.
Exhibit 10.8 to the August 30, 2005 Form 8-K
10.6 Commercial Paper Dealer Agreement, dated asof October 4, 2006, among the Company andLoop Capital Markets, LLC
Exhibit 10.6 to the 2006 Form 10-K
10.7 Tax Sharing Agreement Exhibit 10.10 to the Company’s RegistrationStatement on Form 10, filed on November 27,1991, as amended (the “Form 10”)
36

ExhibitNumber Description Document if Incorporated by Reference
10.8+ Purchase, Sale and Servicing TransferAgreement, effective as of June 1, 2005, amongthe Company, FDS Bank, Prime II ReceivablesCorporation (“Prime II”) and Citibank, N.A.(“Citibank”)
Exhibit 10.3 to the September 8, 2009Form 10-Q
10.8.1 Letter Agreement, dated August 22, 2005,among the Company, FDS Bank, Prime II andCitibank
Exhibit 10.17.1 to the Company’s Annual Reporton Form 10-K (File No. 1-13536) for the fiscalyear ended January 28, 2006 (the “2005Form 10-K”)
10.8.2+ Second Amendment to Purchase, Sale andServicing Transfer Agreement, datedOctober 24, 2005, between the Company andCitibank
Exhibit 10.4 to the September 8, 2009Form 10-Q
10.8.3 Third Amendment to Purchase, Sale andServicing Transfer Agreement, dated May 1,2006, between the Company and Citibank
Exhibit 10.1 to the Company’s Current Reporton Form 8-K filed on May 3, 2006
10.8.4+ Fourth Amendment to Purchase, Sale andServicing Transfer Agreement, dated May 22,2006, between the Company and Citibank
Exhibit 10.5 to the September 8, 2009Form 10-Q
10.9+ Credit Card Program Agreement, effective as ofJune 1, 2005, among the Company, FDS Bank,Macy’s Credit and Customer Services, Inc.(“MCCS”) (f/k/a FACS Group, Inc.) andCitibank
Exhibit 10.6 to the September 8, 2009Form 10-Q
10.9.1+ First Amendment to Credit Card ProgramAgreement, dated October 24, 2005, between theCompany and Citibank
Exhibit 10.7 to the September 8, 2009Form 10-Q
10.9.2+ Second Amendment to Credit Card ProgramAgreement, dated May 22, 2006, between theCompany, FDS Bank, MCCS, Macy’s WestStores, Inc. (f/k/a Macy’s Department Stores,Inc,) (“MWSI”), Bloomingdale’s, Inc.(“Bloomingdale’s”) and Department StoresNational Bank (“DSNB”) and Citibank
Exhibit 10.8 to the September 8, 2009Form 10-Q
10.9.3 Restated Letter Agreement, dated May 30, 2008and effective as of December 18, 2006, amongthe Company, FDS Bank, MCCS, MWSI,Bloomingdale’s, Inc. (“Bloomingdale’s), andDSNB (as assignee of Citibank, N.A.)
Exhibit 10.6 to the Company’s Quarterly Reporton Form 10-Q for the quarterly period endedMay 3, 2008 (the “May 3, 2008 Form 10-Q”)
10.9.4 Restated Letter Agreement, dated May 30, 2008and effective as of March 22, 2007, among theCompany, FDS Bank, MCCS, MWSI,Bloomingdale’s and DSNB
Exhibit 10.7 to the May 3, 2008 Form 10-Q
37

ExhibitNumber Description Document if Incorporated by Reference
10.9.5 Restated Letter Agreement, dated May 30, 2008and effective as of April 6, 2007, among theCompany, FDS Bank, MCCS, MWSI,Bloomingdale’s and DSNB
Exhibit 10.8 to the May 3, 2008 Form 10-Q
10.9.6 Restated Letter Agreement, dated May 30, 2008and effective as of June 1, 2007, among theCompany, FDS Bank, MCCS, MWSI,Bloomingdale’s and DSNB
Exhibit 10.9 to the May 3, 2008 Form 10-Q
10.9.7 Restated Third Amendment to Credit CardProgram Agreement, dated May 31, 2008 andeffective as of February 3, 2008, among theCompany, FDS Bank, MCCS, MWSI,Bloomingdale’s and DSNB
Exhibit 10.10 to the May 3, 2008 Form 10-Q
10.9.8+ Fourth Amendment to Credit Card ProgramAgreement, effective as of August 1, 2008,among the Company, FDS Bank, MCCS,MWSI, Bloomingdale’s and DSNB.
Exhibit 10.9 to the September 8, 2009Form 10-Q
10.9.9+ Fifth Amendment to Credit Card ProgramAgreement, effective as of January 1, 2009,among the Company, FDS Bank, MCCS,MWSI, Bloomingdale’s and DSNB
Exhibit 10.10 to the September 8, 2009Form 10-Q
10.9.10+ Sixth Amendment to Credit Card ProgramAgreement, effective as of June 1, 2009, amongthe Company, FDS Bank, MCCS, MWSI,Bloomingdale’s and DSNB
Exhibit 10.11 to the September 8, 2009Form 10-Q
10.9.11+ Seventh Amendment to Credit Card ProgramAgreement, effective as of February 26, 2010,among the Company, FDS Bank, MCCS,MWSI, Bloomingdale’s and DSNB
Exhibit 10.9.11 to the Company’s AnnualReport on Form 10-K (File No. 1-13536) for thefiscal year ended January 30, 2010
10.10 1995 Executive Equity Incentive Plan, asamended and restated as of June 1, 2007 (the“1995 Plan”) *
Exhibit 10.11 to the Company’s Annual Reporton Form 10-K for the fiscal year endedJanuary 31, 2009 (the “2008 Form 10-K”)
10.11 1992 Incentive Bonus Plan, as amended andrestated as of February 3, 2007 *
Appendix B to the Company’s Proxy Statementdated April 4, 2007
10.12 1994 Stock Incentive Plan, as amended andrestated as of June 1, 2007 *
Exhibit 10.13 to the 2008 Form 10-K
10.13 Form of Indemnification Agreement * Exhibit 10.14 to the Form 10
10.14 Employment Agreement, dated as of March 8,2007, between Terry J. Lundgren and theCompany (the “Lundgren EmploymentAgreement”) *
Exhibit 10.1 to the Company’s Current Reporton Form 8-K filed on March 9, 2007
10.14.1 Amendment to Employment Agreement, datedMarch 19, 2010, between Terry J. Lundgren andthe Company
Exhibit 10.5 to the March 25, 2010 Form 8-K(the “March 25, 2010 Form 8-K”) *
38

ExhibitNumber Description Document if Incorporated by Reference
10.15 Employment Agreement, dated as of April 21,2008, between Thomas L. Cole and Macy’sCorporate Services, Inc. *
Exhibit 10.1 to the Company’s Current Reporton Form 8-K filed on April 22, 2008 (the“April 22, 2008 Form 8-K”)
10.16 Employment Agreement, dated as of April 21,2008, between Janet Grove and Macy’sMerchandising Group, Inc. *
Exhibit 10.2 to the April 22, 2008 Form 8-K
10.17 Employment Agreement, dated as of April 21,2008, between Karen M. Hoguet and Macy’sCorporate Services, Inc. *
Exhibit 10.3 to the April 22, 2008 Form 8-K
10. 18 Form of Employment Agreement for Executivesand Key Employees *
Exhibit 10.31 the Company’s Annual Report onForm 10-K (File No. 001-10951) for fiscal yearended January 29, 1994
10.19 Executive Severance Plan, effectiveNovember 1, 2009 *
Exhibit 10.1 to the Company’s Quarterly Reporton Form 10-Q filed on December 7, 2009 (the“December 7, 2009 Form 10-Q”)
10.20 Form of Non-Qualified Stock Option Agreementfor the 1995 Plan (for Executives and KeyEmployees) *
Exhibit 10.2 to the Company’s Current Reporton Form 8-K dated March 25, 2005
10.20.1 Form of Non-Qualified Stock Option Agreementfor the 1995 Plan (for Executives and KeyEmployees), as amended *
Exhibit 10.33.1 to the 2005 Form 10-K
10.20.2 Form of Non-Qualified Stock Option Agreementfor the 1994 Stock Incentive Plan *
Exhibit 10.7 to the Current Report on From 8-K(File No. 001-00079) filed on March 23, 2005 byMay Delaware (the “March 23, 2005 Form 8-K”)
10.20.3 Form of Nonqualified Stock Option Agreementunder the 2009 Omnibus IncentiveCompensation Plan (for Executives and KeyEmployees) *
10.21 Nonqualified Stock Option Agreement, dated asof October 26, 2007, by and between theCompany and Terry Lundgren *
Exhibit 10.1 to the Company’s Current Reporton Form 8-K filed on November 1, 2007
10.22 Form of Restricted Stock Agreement for the1994 Stock Incentive Plan *
Exhibit 10.4 to the March 23, 2005 Form 8-K
10.22.1 Form of Time-Based Restricted StockAgreement under the 2009 Omnibus IncentiveCompensation Plan *
Exhibit 10.3 to the March 25, 2010 Form 8-K
10.23 Form of Performance-Based Restricted StockUnit Agreement under the 2009 OmnibusIncentive Compensation Plan *
10.24 Form of Performance-Based Restricted StockUnit Agreement under the 2009 OmnibusIncentive Compensation Plan (FoundersAward) *
Exhibit 10.1 to the Company’s Quarterly Reporton Form 8-K dated March 24, 2009
10.25 Form of Time-Based Restricted Stock UnitAgreement under the 2009 Omnibus IncentiveCompensation Plan *
Exhibit 10.4 to the March 25, 2010 Form 8-K
10.26 Supplementary Executive Retirement Plan * Exhibit 10.29 to the 2008 Form 10-K
39

ExhibitNumber Description Document if Incorporated by Reference
10.27 Executive Deferred Compensation Plan * Exhibit 10.30 to the 2008 Form 10-K
10.28 Macy’s, Inc. Profit Sharing 401(k) InvestmentPlan (the “Plan”) (amending and restating theMacy’s, Inc. Profit Sharing 401(k) InvestmentPlan and The May Department Stores CompanyProfit Sharing Plan), effective as of September 1,2008 *
Exhibit 10.31 to the 2008 Form 10-K
10.28.1 First Amendment to the Plan regarding matchingrate with respect to the Plan’s 2009 plan year,effective as of January 1, 2009 *
10.28.2 Second Amendment to the Plan regarding certainrollover requirements added by the PensionProtection Act of 2006, restated effective as ofJanuary 1, 2008 *
10.28.3 Third Amendment to the Plan regardingmatching rate with respect to the Plan’s 2010plan year, effective January 1, 2010 *
10.28.4 Fourth Amendment to the Plan regardingdeferral percentage and average actualcontribution limits, effective January 1, 2010 *
10.28.5 Fifth Amendment to the Plan regarding theHeroes Earnings Assistance and Relief Tax Actof 2008, effective as of January 1, 2008 *
10.28.6 Sixth Amendment to the Plan regardingmatching rate with respect to the Plan’s planyear on or after January 1, 2011, effective as ofJanuary 1, 2011 *
10.28.7 Seventh Amendment to the Plan regarding namechange of the Plan effective as of April 1, 2011 *
10.29 Director Deferred Compensation Plan * Exhibit 10.33 to the 2008 Form 10-K
10.30 Stock Credit Plan for 2006 – 2007 of FederatedDepartment Stores, Inc. *
Exhibit 10.43 to the 2005 Form 10-K
10.30.1 Stock Credit Plan for 2008 – 2009 of Macy’s,Inc. (as amended as of August 22, 2008) *
Exhibit 10.1 to the August 2, 2008 Form 10-Q
10.31 Macy’s, Inc. 2009 Omnibus IncentiveCompensation Plan *
Appendix B to the Company’s Proxy Statementdated April 1, 2009
10.32 Change in Control Plan, effective November 1,2009 *
Exhibit 10.2 to the December 7, 2009 Form 10-Q
10.33 Time Sharing Agreement between Macy’s, Inc.and Terry J. Lundgren, dated March 25, 2011 *
21 Subsidiaries
23 Consent of KPMG LLP
24 Powers of Attorney
31.1 Certification of Chief Executive Officer pursuantto Rule 13a-14(a)
40
ExhibitNumber Description Document if Incorporated by Reference
31.2 Certification of Chief Financial Officer pursuantto Rule 13a-14(a)
32.1 Certifications by Chief Executive Officer underSection 906 of the Sarbanes-Oxley Act
32.2 Certifications by Chief Financial Officer underSection 906 of the Sarbanes-Oxley Act
101** The following financial statements from Macy’s,Inc.’s Annual Report on Form 10-K for the yearended January 29, 2011, filed on March 30,2011, formatted in XBRL: (i) ConsolidatedStatements of Operations, (ii) ConsolidatedBalance Sheets, (iii) Consolidated Statements ofChanges in Shareholders’ Equity, (iv)Consolidated Statements of Cash Flows, and (v)the Notes to Consolidated Financial Statements,tagged as blocks of text and in detail.
+ Portions of the exhibit have been omitted pursuant to a request for confidential treatment. The confidentialportions have been provided to the SEC.
* Constitutes a compensatory plan or arrangement.** As provided in Rule 406T of Regulation S-T, this information is furnished and not filed for purposes of
Sections 11 and 12 of the Securities Act of 1933 and Section 18 of the Securities Exchange Act of 1934.
41
SIGNATURES
Pursuant to the requirements of Section 13 or 15(d) of the Securities Exchange Act of 1934, the Registranthas duly caused this report to be signed on its behalf by the undersigned, thereunto duly authorized.
MACY’S, INC.
By: /s/ DENNIS J. BRODERICK
Dennis J. BroderickExecutive Vice President, General Counsel and
Secretary
Date: March 30, 2011
Pursuant to the requirements of the Securities Exchange Act of 1934, this report has been signedbelow by the following persons on behalf of the Registrant and in the capacities indicated on March 30,2011.
Signature Title
*Terry J. Lundgren
Chairman of the Board, President and Chief ExecutiveOfficer (principal executive officer) and Director
*Karen M. Hoguet
Chief Financial Officer (principal financial officer)
*Joel A. Belsky
Executive Vice President and Controller (principalaccounting officer)
*Stephen F. Bollenbach
Director
*Deirdre Connelly
Director
*Meyer Feldberg
Director
*Sara Levinson
Director
*Joseph Neubauer
Director
*Joseph A. Pichler
Director
*Joyce M. Roché
Director
*Craig E. Weatherup
Director
*Marna C. Whittington
Director
* The undersigned, by signing his name hereto, does sign and execute this Annual Report on Form 10-Kpursuant to the Powers of Attorney executed by the above-named officers and directors and filed herewith.
By: /s/ DENNIS J. BRODERICK
Dennis J. BroderickAttorney-in-Fact
42

INDEX TO CONSOLIDATED FINANCIAL STATEMENTS
Page
Report of Management . . . . . . . . . . . . . . . . . . . . . . . . . . . . . . . . . . . . . . . . . . . . . . . . . . . . . . . . . . . . . . . . . . . F-2Report of Independent Registered Public Accounting Firm . . . . . . . . . . . . . . . . . . . . . . . . . . . . . . . . . . . . . . F-3Consolidated Statements of Operations for the fiscal years ended
January 29, 2011, January 30, 2010, and January 31, 2009 . . . . . . . . . . . . . . . . . . . . . . . . . . . . . . . . . . . . . F-4Consolidated Balance Sheets at January 29, 2011 and January 30, 2010 . . . . . . . . . . . . . . . . . . . . . . . . . . . . F-5Consolidated Statements of Changes in Shareholders’ Equity for the fiscal years ended
January 29, 2011, January 30, 2010, and January 31, 2009 . . . . . . . . . . . . . . . . . . . . . . . . . . . . . . . . . . . . . F-6Consolidated Statements of Cash Flows for the fiscal years ended
January 29, 2011, January 30, 2010, and January 31, 2009 . . . . . . . . . . . . . . . . . . . . . . . . . . . . . . . . . . . . . F-7Notes to Consolidated Financial Statements . . . . . . . . . . . . . . . . . . . . . . . . . . . . . . . . . . . . . . . . . . . . . . . . . . F-8
F-1

REPORT OF MANAGEMENT
To the Shareholders ofMacy’s, Inc.:
The integrity and consistency of the Consolidated Financial Statements of Macy’s, Inc. and subsidiaries,which were prepared in accordance with accounting principles generally accepted in the United States ofAmerica, are the responsibility of management and properly include some amounts that are based upon estimatesand judgments.
The Company maintains a system of internal accounting controls, which is supported by a program ofinternal audits with appropriate management follow-up action, to provide reasonable assurance, at appropriatecost, that the Company’s assets are protected and transactions are properly recorded. Additionally, the integrityof the financial accounting system is based on careful selection and training of qualified personnel,organizational arrangements which provide for appropriate division of responsibilities and communication ofestablished written policies and procedures.
The Company’s management is responsible for establishing and maintaining adequate internal control overfinancial reporting, as defined in Exchange Act Rule 13a-15(f) and has issued Management’s Report on InternalControl over Financial Reporting.
The Consolidated Financial Statements of the Company have been audited by KPMG LLP. Their reportexpresses their opinion as to the fair presentation, in all material respects, of the financial statements and is basedupon their independent audits.
The Audit Committee, composed solely of outside directors, meets periodically with KPMG LLP, theinternal auditors and representatives of management to discuss auditing and financial reporting matters. Inaddition, KPMG LLP and the Company’s internal auditors meet periodically with the Audit Committee withoutmanagement representatives present and have free access to the Audit Committee at any time. The AuditCommittee is responsible for recommending to the Board of Directors the engagement of the independentregistered public accounting firm, which is subject to shareholder approval, and the general oversight review ofmanagement’s discharge of its responsibilities with respect to the matters referred to above.
Terry J. LundgrenChairman, President and Chief Executive Officer
Karen M. HoguetChief Financial Officer
Joel A. BelskyExecutive Vice President and Controller
F-2

REPORT OF INDEPENDENT REGISTERED PUBLIC ACCOUNTING FIRM
The Board of Directors and ShareholdersMacy’s, Inc.:
We have audited the accompanying consolidated balance sheets of Macy’s, Inc. and subsidiaries as ofJanuary 29, 2011 and January 30, 2010, and the related consolidated statements of operations, changes inshareholders’ equity, and cash flows for each of the years in the three-year period ended January 29, 2011. Wealso have audited Macy’s, Inc.’s internal control over financial reporting as of January 29, 2011, based on criteriaestablished in Internal Control – Integrated Framework issued by the Committee of Sponsoring Organizations ofthe Treadway Commission (COSO). Macy’s, Inc.’s management is responsible for these consolidated financialstatements, for maintaining effective internal control over financial reporting, and for its assessment of theeffectiveness of internal control over financial reporting, included in the accompanying Item 9A(b),“Management’s Report on Internal Control over Financial Reporting.” Our responsibility is to express an opinionon these consolidated financial statements and an opinion on the Company’s internal control over financialreporting based on our audits.
We conducted our audits in accordance with the standards of the Public Company Accounting OversightBoard (United States). Those standards require that we plan and perform the audits to obtain reasonableassurance about whether the financial statements are free of material misstatement and whether effective internalcontrol over financial reporting was maintained in all material respects. Our audits of the consolidated financialstatements included examining, on a test basis, evidence supporting the amounts and disclosures in the financialstatements, assessing the accounting principles used and significant estimates made by management, andevaluating the overall financial statement presentation. Our audit of internal control over financial reportingincluded obtaining an understanding of internal control over financial reporting, assessing the risk that a materialweakness exists, and testing and evaluating the design and operating effectiveness of internal control based onthe assessed risk. Our audits also included performing such other procedures as we considered necessary in thecircumstances. We believe that our audits provide a reasonable basis for our opinions.
A company’s internal control over financial reporting is a process designed to provide reasonable assuranceregarding the reliability of financial reporting and the preparation of financial statements for external purposes inaccordance with generally accepted accounting principles. A company’s internal control over financial reportingincludes those policies and procedures that (1) pertain to the maintenance of records that, in reasonable detail,accurately and fairly reflect the transactions and dispositions of the assets of the company; (2) provide reasonableassurance that transactions are recorded as necessary to permit preparation of financial statements in accordancewith generally accepted accounting principles, and that receipts and expenditures of the company are being madeonly in accordance with authorizations of management and directors of the company; and (3) provide reasonableassurance regarding prevention or timely detection of unauthorized acquisition, use, or disposition of thecompany’s assets that could have a material effect on the financial statements.
Because of its inherent limitations, internal control over financial reporting may not prevent or detectmisstatements. Also, projections of any evaluation of effectiveness to future periods are subject to the risk thatcontrols may become inadequate because of changes in conditions, or that the degree of compliance with thepolicies or procedures may deteriorate.
In our opinion, the consolidated financial statements referred to above present fairly, in all material respects,the financial position of Macy’s, Inc. and subsidiaries as of January 29, 2011 and January 30, 2010, and theresults of its operations and its cash flows for each of the years in the three-year period ended January 29, 2011,in conformity with U.S. generally accepted accounting principles. Also in our opinion, Macy’s, Inc. maintained,in all material respects, effective internal control over financial reporting as of January 29, 2011, based on criteriaestablished in Internal Control – Integrated Framework issued by the Committee of Sponsoring Organizations ofthe Treadway Commission.
/s/ KPMG LLP
Cincinnati, OhioMarch 30, 2011
F-3

MACY’S, INC.
CONSOLIDATED STATEMENTS OF OPERATIONS(millions, except per share data)
2010 2009 2008
Net sales . . . . . . . . . . . . . . . . . . . . . . . . . . . . . . . . . . . . . . . . . . . . . . . . . . . . . . . . $ 25,003 $ 23,489 $ 24,892Cost of sales . . . . . . . . . . . . . . . . . . . . . . . . . . . . . . . . . . . . . . . . . . . . . . . . . . . . . (14,824) (13,973) (15,009)
Gross margin . . . . . . . . . . . . . . . . . . . . . . . . . . . . . . . . . . . . . . . . . . . . . . . . . . . . 10,179 9,516 9,883Selling, general and administrative expenses . . . . . . . . . . . . . . . . . . . . . . . . . . . . (8,260) (8,062) (8,481)Impairments, store closing costs and division consolidation costs . . . . . . . . . . . (25) (391) (398)Goodwill impairment charges . . . . . . . . . . . . . . . . . . . . . . . . . . . . . . . . . . . . . . . – – (5,382)
Operating income (loss) . . . . . . . . . . . . . . . . . . . . . . . . . . . . . . . . . . . . . . . . . . . . 1,894 1,063 (4,378)Interest expense . . . . . . . . . . . . . . . . . . . . . . . . . . . . . . . . . . . . . . . . . . . . . . . . . . (579) (562) (588)Interest income . . . . . . . . . . . . . . . . . . . . . . . . . . . . . . . . . . . . . . . . . . . . . . . . . . . 5 6 28
Income (loss) before income taxes . . . . . . . . . . . . . . . . . . . . . . . . . . . . . . . . . . . . 1,320 507 (4,938)Federal, state and local income tax benefit (expense) . . . . . . . . . . . . . . . . . . . . . (473) (178) 163
Net income (loss) . . . . . . . . . . . . . . . . . . . . . . . . . . . . . . . . . . . . . . . . . . . . . . . . . $ 847 $ 329 $ (4,775)
Basic earnings (loss) per share . . . . . . . . . . . . . . . . . . . . . . . . . . . . . . . . . . . . . . . $ 2.00 $ .78 $ (11.34)
Diluted earnings (loss) per share . . . . . . . . . . . . . . . . . . . . . . . . . . . . . . . . . . . . . $ 1.98 $ .78 $ (11.34)
The accompanying notes are an integral part of these Consolidated Financial Statements.
F-4

MACY’S, INC.
CONSOLIDATED BALANCE SHEETS(millions)
January 29, 2011 January 30, 2010
ASSETSCurrent Assets:
Cash and cash equivalents . . . . . . . . . . . . . . . . . . . . . . . . . . . . . . . . . . . . . . $ 1,464 $ 1,686Receivables . . . . . . . . . . . . . . . . . . . . . . . . . . . . . . . . . . . . . . . . . . . . . . . . . . 392 358Merchandise inventories . . . . . . . . . . . . . . . . . . . . . . . . . . . . . . . . . . . . . . . . 4,758 4,615Prepaid expenses and other current assets . . . . . . . . . . . . . . . . . . . . . . . . . . 285 223
Total Current Assets . . . . . . . . . . . . . . . . . . . . . . . . . . . . . . . . . . . . . . . 6,899 6,882
Property and Equipment – net . . . . . . . . . . . . . . . . . . . . . . . . . . . . . . . . . . . . . . . 8,813 9,507
Goodwill . . . . . . . . . . . . . . . . . . . . . . . . . . . . . . . . . . . . . . . . . . . . . . . . . . . . . . . . 3,743 3,743
Other Intangible Assets – net . . . . . . . . . . . . . . . . . . . . . . . . . . . . . . . . . . . . . . . . 637 678
Other Assets . . . . . . . . . . . . . . . . . . . . . . . . . . . . . . . . . . . . . . . . . . . . . . . . . . . . . 539 490
Total Assets . . . . . . . . . . . . . . . . . . . . . . . . . . . . . . . . . . . . . . . . . . . . . $20,631 $21,300
LIABILITIES AND SHAREHOLDERS’ EQUITYCurrent Liabilities:
Short-term debt . . . . . . . . . . . . . . . . . . . . . . . . . . . . . . . . . . . . . . . . . . . . . . . $ 454 $ 242Merchandise accounts payable . . . . . . . . . . . . . . . . . . . . . . . . . . . . . . . . . . . 1,421 1,312Accounts payable and accrued liabilities . . . . . . . . . . . . . . . . . . . . . . . . . . . 2,644 2,626Income taxes . . . . . . . . . . . . . . . . . . . . . . . . . . . . . . . . . . . . . . . . . . . . . . . . . 182 68Deferred income taxes . . . . . . . . . . . . . . . . . . . . . . . . . . . . . . . . . . . . . . . . . 364 214
Total Current Liabilities . . . . . . . . . . . . . . . . . . . . . . . . . . . . . . . . . . . . 5,065 4,462
Long-Term Debt . . . . . . . . . . . . . . . . . . . . . . . . . . . . . . . . . . . . . . . . . . . . . . . . . . 6,971 8,456
Deferred Income Taxes . . . . . . . . . . . . . . . . . . . . . . . . . . . . . . . . . . . . . . . . . . . . 1,245 1,132
Other Liabilities . . . . . . . . . . . . . . . . . . . . . . . . . . . . . . . . . . . . . . . . . . . . . . . . . . 1,820 2,597
Shareholders’ Equity:Common stock (423.3 and 420.8 shares outstanding) . . . . . . . . . . . . . . . . . 5 5Additional paid-in capital . . . . . . . . . . . . . . . . . . . . . . . . . . . . . . . . . . . . . . . 5,696 5,689Accumulated equity . . . . . . . . . . . . . . . . . . . . . . . . . . . . . . . . . . . . . . . . . . . 2,990 2,227Treasury stock . . . . . . . . . . . . . . . . . . . . . . . . . . . . . . . . . . . . . . . . . . . . . . . (2,431) (2,515)Accumulated other comprehensive loss . . . . . . . . . . . . . . . . . . . . . . . . . . . . (730) (753)
Total Shareholders’ Equity . . . . . . . . . . . . . . . . . . . . . . . . . . . . . . . . . . 5,530 4,653
Total Liabilities and Shareholders’ Equity . . . . . . . . . . . . . . . . . . . . . . $20,631 $21,300
The accompanying notes are an integral part of these Consolidated Financial Statements.
F-5

MACY’S, INC.
CONSOLIDATED STATEMENTS OF CHANGES IN SHAREHOLDERS’ EQUITY(millions)
CommonStock
AdditionalPaid-InCapital
AccumulatedEquity
TreasuryStock
AccumulatedOther
ComprehensiveIncome (Loss)
TotalShareholders’
Equity
Balance at February 2, 2008 . . . . . . . . . . . . . . . . . . . . . . . . . . . $5 $5,609 $ 7,032 $(2,557) $(182) $ 9,907Cumulative effect of change in methodology of deferred
state income taxes . . . . . . . . . . . . . . . . . . . . . . . . . . . . . . . (54) (54)
Balance at February 2, 2008, as revised . . . . . . . . . . . . . . . . . . 5 5,609 6,978 (2,557) (182) 9,853Net loss . . . . . . . . . . . . . . . . . . . . . . . . . . . . . . . . . . . . . . . . . . . (4,775) (4,775)Actuarial loss on post employment and postretirement
benefit plans, net of income tax effect of $183 million . . . . . (294) (294)Unrealized loss on marketable securities, net of income
tax effect of $11 million . . . . . . . . . . . . . . . . . . . . . . . . . . . . (17) (17)Reclassifications to net loss:
Realized loss on marketable securities, net of incometax effect of $5 million . . . . . . . . . . . . . . . . . . . . . . . . . 7 7Net actuarial loss on post employment and
postretirement benefit plans, net of income taxeffect of $1 million . . . . . . . . . . . . . . . . . . . . . . . . . . 1 1
Prior service credit on post employment andpostretirement benefit plans, net of income taxeffect of $1 million . . . . . . . . . . . . . . . . . . . . . . . . . . . . (1) (1)
Total comprehensive loss . . . . . . . . . . . . . . . . . . . . . . . . . . . . . (5,079)Common stock dividends ($.5275 per share) . . . . . . . . . . . . . . (221) (221)Stock repurchases . . . . . . . . . . . . . . . . . . . . . . . . . . . . . . . . . . . (1) (1)Stock-based compensation expense . . . . . . . . . . . . . . . . . . . . . 61 61Stock issued under stock plans . . . . . . . . . . . . . . . . . . . . . . . . . (7) 13 6Deferred compensation plan distributions . . . . . . . . . . . . . . . . . 1 1
Balance at January 31, 2009 . . . . . . . . . . . . . . . . . . . . . . . . . . . 5 5,663 1,982 (2,544) (486) 4,620Net income . . . . . . . . . . . . . . . . . . . . . . . . . . . . . . . . . . . . . . . . 329 329Actuarial loss on post employment and postretirement
benefit plans, net of income tax effect of $166 million . . . . . (266) (266)Unrealized gain on marketable securities, net of income
tax effect of $3 million . . . . . . . . . . . . . . . . . . . . . . . . . . . . . 5 5Reclassifications to net income:
Net actuarial gain on postretirement benefit plans,net of income tax effect of $3 million . . . . . . . . . . . . . . (4) (4)
Prior service credit on post employment benefit plans,net of income tax effect of $1 million . . . . . . . . . . . . . . (2) (2)
Total comprehensive income . . . . . . . . . . . . . . . . . . . . . . . . . 62Common stock dividends ($.20 per share) . . . . . . . . . . . . . . . . (84) (84)Stock repurchases . . . . . . . . . . . . . . . . . . . . . . . . . . . . . . . . . . . (1) (1)Stock-based compensation expense . . . . . . . . . . . . . . . . . . . . . 50 50Stock issued under stock plans . . . . . . . . . . . . . . . . . . . . . . . . . (24) 29 5Deferred compensation plan distributions . . . . . . . . . . . . . . . . . 1 1
Balance at January 30, 2010 . . . . . . . . . . . . . . . . . . . . . . . . . . . 5 5,689 2,227 (2,515) (753) 4,653Net income . . . . . . . . . . . . . . . . . . . . . . . . . . . . . . . . . . . . . . . . 847 847Actuarial loss on post employment and postretirement
benefit plans, net of income tax effect of $4 million . . . . . . . (17) (17)Unrealized gain on marketable securities, net of income
tax effect of $3 million . . . . . . . . . . . . . . . . . . . . . . . . . . . 5 5Reclassifications to net income:
Net actuarial loss on postretirement benefit plans,net of income tax effect of $23 million . . . . . . . . . . . . . 36 36
Prior service credit on post employment benefit plans,net of income tax effect of $1 million . . . . . . . . . . . . . . (1) (1)
Total comprehensive income . . . . . . . . . . . . . . . . . . . . . . . . . . . 870Common stock dividends ($.20 per share) . . . . . . . . . . . . . . . . (84) (84)Stock repurchases . . . . . . . . . . . . . . . . . . . . . . . . . . . . . . . . . . . (1) (1)Stock-based compensation expense . . . . . . . . . . . . . . . . . . . . . 47 47Stock issued under stock plans . . . . . . . . . . . . . . . . . . . . . . . . . (40) 82 42Deferred compensation plan distributions . . . . . . . . . . . . . . . . . 3 3
Balance at January 29, 2011 . . . . . . . . . . . . . . . . . . . . . . . . . . . $5 $5,696 $ 2,990 $(2,431) $(730) $ 5,530
The accompanying notes are an integral part of these Consolidated Financial Statements.
F-6

MACY’S, INC.
CONSOLIDATED STATEMENTS OF CASH FLOWS(millions)
2010 2009 2008
Cash flows from operating activities:Net income (loss) . . . . . . . . . . . . . . . . . . . . . . . . . . . . . . . . . . . . . . . . . . . . . . . . . . . . . . . . . $ 847 $ 329 $(4,775)Adjustments to reconcile net income (loss) to net cash provided by operating activities:
Impairments, store closing costs and division consolidation costs . . . . . . . . . . . . . . . . 25 391 398Goodwill impairment charges . . . . . . . . . . . . . . . . . . . . . . . . . . . . . . . . . . . . . . . . . . . . – – 5,382Depreciation and amortization . . . . . . . . . . . . . . . . . . . . . . . . . . . . . . . . . . . . . . . . . . . 1,150 1,210 1,278Stock-based compensation expense . . . . . . . . . . . . . . . . . . . . . . . . . . . . . . . . . . . . . . . 66 76 43Amortization of financing costs and premium on acquired debt . . . . . . . . . . . . . . . . . (25) (23) (27)Changes in assets and liabilities:
(Increase) decrease in receivables . . . . . . . . . . . . . . . . . . . . . . . . . . . . . . . . . . . . . (51) 7 (1)(Increase) decrease in merchandise inventories . . . . . . . . . . . . . . . . . . . . . . . . . . (143) 154 291(Increase) decrease in supplies and prepaid expenses . . . . . . . . . . . . . . . . . . . . . . (10) 3 (7)(Increase) decrease in other assets not separately identified . . . . . . . . . . . . . . . . . 2 (16) 1Increase (decrease) in merchandise accounts payable . . . . . . . . . . . . . . . . . . . . . 91 29 (90)Decrease in accounts payable and accrued liabilities not separately identified . . (45) (201) (228)Increase (decrease) in current income taxes . . . . . . . . . . . . . . . . . . . . . . . . . . . . . 115 40 (146)Increase (decrease) in deferred income taxes . . . . . . . . . . . . . . . . . . . . . . . . . . . . 241 123 (315)Increase (decrease) in other liabilities not separately identified . . . . . . . . . . . . . . (757) (372) 62
Net cash provided by operating activities . . . . . . . . . . . . . . . . . . . . . . . . . . . 1,506 1,750 1,866
Cash flows from investing activities:Purchase of property and equipment . . . . . . . . . . . . . . . . . . . . . . . . . . . . . . . . . . . . . . . . . . . (339) (355) (761)Capitalized software . . . . . . . . . . . . . . . . . . . . . . . . . . . . . . . . . . . . . . . . . . . . . . . . . . . . . . . (166) (105) (136)Proceeds from property insurance claims . . . . . . . . . . . . . . . . . . . . . . . . . . . . . . . . . . . . . . . 6 26 68Disposition of property and equipment . . . . . . . . . . . . . . . . . . . . . . . . . . . . . . . . . . . . . . . . . 74 60 38Other, net . . . . . . . . . . . . . . . . . . . . . . . . . . . . . . . . . . . . . . . . . . . . . . . . . . . . . . . . . . . . . . . . (40) (3) (1)
Net cash used by investing activities . . . . . . . . . . . . . . . . . . . . . . . . . . . . . . . (465) (377) (792)
Cash flows from financing activities:Debt issued . . . . . . . . . . . . . . . . . . . . . . . . . . . . . . . . . . . . . . . . . . . . . . . . . . . . . . . . . . . . . . – – 650Financing costs . . . . . . . . . . . . . . . . . . . . . . . . . . . . . . . . . . . . . . . . . . . . . . . . . . . . . . . . . . . – – (18)Debt repaid . . . . . . . . . . . . . . . . . . . . . . . . . . . . . . . . . . . . . . . . . . . . . . . . . . . . . . . . . . . . . . (1,245) (966) (666)Dividends paid . . . . . . . . . . . . . . . . . . . . . . . . . . . . . . . . . . . . . . . . . . . . . . . . . . . . . . . . . . . . (84) (84) (221)Increase (decrease) in outstanding checks . . . . . . . . . . . . . . . . . . . . . . . . . . . . . . . . . . . . . . 24 (29) (116)Acquisition of treasury stock . . . . . . . . . . . . . . . . . . . . . . . . . . . . . . . . . . . . . . . . . . . . . . . . . (1) (1) (1)Issuance of common stock . . . . . . . . . . . . . . . . . . . . . . . . . . . . . . . . . . . . . . . . . . . . . . . . . . 43 8 7
Net cash used by financing activities . . . . . . . . . . . . . . . . . . . . . . . . . . . . . . (1,263) (1,072) (365)
Net increase (decrease) in cash and cash equivalents . . . . . . . . . . . . . . . . . . . . . . . . . . . . . . . . . . (222) 301 709Cash and cash equivalents beginning of period . . . . . . . . . . . . . . . . . . . . . . . . . . . . . . . . . . . . . . 1,686 1,385 676
Cash and cash equivalents end of period . . . . . . . . . . . . . . . . . . . . . . . . . . . . . . . . . . . . . . . . . . . $ 1,464 $ 1,686 $ 1,385
Supplemental cash flow information:Interest paid . . . . . . . . . . . . . . . . . . . . . . . . . . . . . . . . . . . . . . . . . . . . . . . . . . . . . . . . . . . . . . $ 627 $ 601 $ 642Interest received . . . . . . . . . . . . . . . . . . . . . . . . . . . . . . . . . . . . . . . . . . . . . . . . . . . . . . . . . . 5 9 26Income taxes paid (net of refunds received) . . . . . . . . . . . . . . . . . . . . . . . . . . . . . . . . . . . . . 108 35 323
The accompanying notes are an integral part of these Consolidated Financial Statements.
F-7

MACY’S, INC.
NOTES TO CONSOLIDATED FINANCIAL STATEMENTS
1. Organization and Summary of Significant Accounting Policies
Macy’s, Inc. and subsidiaries (the “Company”) is a retail organization operating retail stores and Internetwebsites under two brands (Macy’s and Bloomingdale’s) that sell a wide range of merchandise, including men’s,women’s and children’s apparel and accessories, cosmetics, home furnishings and other consumer goods in 45states, the District of Columbia, Guam and Puerto Rico. As of January 29, 2011, the Company’s operations wereconducted through Macy’s, macys.com, Bloomingdale’s, bloomingdales.com and Bloomingdale’s Outlet, whichare aggregated into one reporting segment in accordance with the Financial Accounting Standards Board(“FASB”) Accounting Standards Codification (“ASC”) Topic 280, “Segment Reporting.” The metrics used bymanagement to assess the performance of the Company’s operating divisions include sales trends, gross marginrates, expense rates, and rates of earnings before interest and taxes (“EBIT”) and earnings before interest, taxes,depreciation and amortization (“EBITDA”). The Company’s operating divisions have historically had similareconomic characteristics and are expected to have similar economic characteristics and long-term financialperformance in future periods.
For 2010, 2009 and 2008, the following merchandise constituted the following percentages of sales:
2010 2009 2008
Feminine Accessories, Intimate Apparel, Shoes and Cosmetics . . . . . . . . . . . . . . . . . . . . . . . . . 36% 36% 36%Feminine Apparel . . . . . . . . . . . . . . . . . . . . . . . . . . . . . . . . . . . . . . . . . . . . . . . . . . . . . . . . . . . . . 26 26 27Men’s and Children’s . . . . . . . . . . . . . . . . . . . . . . . . . . . . . . . . . . . . . . . . . . . . . . . . . . . . . . . . . . 23 22 22Home/Miscellaneous . . . . . . . . . . . . . . . . . . . . . . . . . . . . . . . . . . . . . . . . . . . . . . . . . . . . . . . . . . 15 16 15
100% 100% 100%
The Company’s fiscal year ends on the Saturday closest to January 31. Fiscal years 2010, 2009 and 2008ended on January 29, 2011, January 30, 2010 and January 31, 2009, respectively. References to years in theConsolidated Financial Statements relate to fiscal years rather than calendar years.
The Consolidated Financial Statements include the accounts of the Company and its wholly-ownedsubsidiaries. The Company from time to time invests in companies engaged in complementary businesses.Investments in companies in which the Company has the ability to exercise significant influence, but not control,are accounted for by the equity method. All marketable equity and debt securities held by the Company areaccounted for under ASC Topic 320, “Investments – Debt and Equity Securities,” with unrealized gains andlosses on available-for-sale securities being included as a separate component of accumulated othercomprehensive income, net of income tax effect. All other investments are carried at cost. All significantintercompany transactions have been eliminated.
The preparation of financial statements in conformity with accounting principles generally accepted in theUnited States of America requires management to make estimates and assumptions that affect the reportedamounts of assets and liabilities and disclosure of contingent assets and liabilities at the date of the financialstatements and the reported amounts of revenues and expenses during the reporting period. Such estimates andassumptions are subject to inherent uncertainties, which may result in actual amounts differing from reportedamounts.
Certain reclassifications were made to prior years’ amounts to conform with the classifications of suchamounts for the most recent year.
F-8

NOTES TO CONSOLIDATED FINANCIAL STATEMENTS — (Continued)
Net sales include merchandise sales, leased department income and shipping and handling fees. In 2010, theCompany began including sales of private brand goods directly to third party retailers and sales of excessinventory to third parties in net sales. These items were previously reported, net of the related cost of sales, inselling, general and administrative expenses (“SG&A”). This change in presentation had an immaterial impact onreported net sales, does not impact comparable store sales, net income (loss) or diluted earnings (loss) per share,and was not applied retroactively to annual periods prior to fiscal 2010. The Company licenses third parties tooperate certain departments in its stores. The Company receives commissions from these licensed departmentsbased on a percentage of net sales. Commissions are recognized as income at the time merchandise is sold tocustomers. Sales taxes collected from customers are not considered revenue and are included in accounts payableand accrued liabilities until remitted to the taxing authorities. Cost of sales consists of the cost of merchandise,including inbound freight, and shipping and handling costs. Sales of merchandise are recorded at the time ofdelivery and reported net of merchandise returns. An estimated allowance for future sales returns is recorded andcost of sales is adjusted accordingly.
Cash and cash equivalents include cash and liquid investments with original maturities of three months orless. Cash and cash equivalents also includes credit card sales transactions that are settled early in the followingperiod and amounted to $104 million at January 29, 2011 and $98 million at January 30, 2010.
In connection with the sale of the Company’s credit assets, the Company and Citibank, N.A. entered into along-term marketing and servicing alliance pursuant to the terms of a Credit Card Program Agreement (the“Program Agreement”) (see Note 4, “Receivables”). Income earned under the Program Agreement is treated as areduction of SG&A expenses on the Consolidated Statements of Operations. Under the Program Agreement,Citibank offers proprietary and non-proprietary credit to the Company’s customers through previously existingand newly opened accounts.
The Company maintains customer loyalty programs in which customers are awarded certificates based ontheir spending. Upon reaching certain levels of qualified spending, customers automatically receive certificates toapply toward future purchases. The Company recognizes the estimated net amount of the certificates that will beearned and redeemed as a reduction to net sales.
Merchandise inventories are valued at lower of cost or market using the last-in, first-out (LIFO) retailinventory method. Under the retail inventory method, inventory is segregated into departments of merchandisehaving similar characteristics, and is stated at its current retail selling value. Inventory retail values are convertedto a cost basis by applying specific average cost factors for each merchandise department. Cost factors representthe average cost-to-retail ratio for each merchandise department based on beginning inventory and the fiscal yearpurchase activity. The retail inventory method inherently requires management judgments and estimates, such asthe amount and timing of permanent markdowns to clear unproductive or slow-moving inventory, which mayimpact the ending inventory valuation as well as gross margins.
Permanent markdowns designated for clearance activity are recorded when the utility of the inventory hasdiminished. Factors considered in the determination of permanent markdowns include current and anticipateddemand, customer preferences, age of the merchandise and fashion trends. When a decision is made topermanently mark down merchandise, the resulting gross margin reduction is recognized in the period themarkdown is recorded.
Physical inventories are generally taken within each merchandise department annually, and inventoryrecords are adjusted accordingly, resulting in the recording of actual shrinkage. While it is not possible toquantify the impact from each cause of shrinkage, the Company has loss prevention programs and policies that
F-9

NOTES TO CONSOLIDATED FINANCIAL STATEMENTS — (Continued)
are intended to minimize shrinkage. Physical inventories are taken at all store locations for substantially allmerchandise categories approximately three weeks before the end of the fiscal year. Shrinkage is estimated as apercentage of sales at interim periods and for this approximate three-week period, based on historical shrinkagerates.
The Company receives certain allowances from various vendors in support of the merchandise it purchasesfor resale. The Company receives certain allowances as reimbursement for markdowns taken and/or to supportthe gross margins earned in connection with the sales of merchandise. These allowances are generally credited tocost of sales at the time the merchandise is sold in accordance with ASC Subtopic 605-50, “Customer Paymentsand Incentives.” The Company also receives advertising allowances from more than 1,000 of its merchandisevendors pursuant to cooperative advertising programs, with some vendors participating in multiple programs.These allowances represent reimbursements by vendors of costs incurred by the Company to promote thevendors’ merchandise and are netted against advertising and promotional costs when the related costs areincurred in accordance with ASC Subtopic 605-50. Advertising allowances in excess of costs incurred arerecorded as a reduction of merchandise costs and, ultimately, through cost of sales when the merchandise is sold.
Advertising and promotional costs, net of cooperative advertising allowances, amounted to $1,072 millionfor 2010, $1,087 million for 2009 and $1,239 million for 2008. Cooperative advertising allowances that offsetadvertising and promotional costs were approximately $345 million for 2010, $298 million for 2009 and $372million for 2008. Department store non-direct response advertising and promotional costs are expensed either asincurred or the first time the advertising occurs. Direct response advertising and promotional costs are deferredand expensed over the period during which the sales are expected to occur, generally one to four months.
The arrangements pursuant to which the Company’s vendors provide allowances, while binding, aregenerally informal in nature and one year or less in duration. The terms and conditions of these arrangementsvary significantly from vendor to vendor and are influenced by, among other things, the type of merchandise tobe supported.
Depreciation of owned properties is provided primarily on a straight-line basis over the estimated assetlives, which range from fifteen to fifty years for buildings and building equipment and three to fifteen years forfixtures and equipment. Real estate taxes and interest on construction in progress and land under development arecapitalized. Amounts capitalized are amortized over the estimated lives of the related depreciable assets. TheCompany receives contributions from developers and merchandise vendors to fund building improvement andthe construction of vendor shops. Such contributions are netted against the capital expenditures.
Buildings on leased land and leasehold improvements are amortized over the shorter of their economic livesor the lease term, beginning on the date the asset is put into use. The Company receives contributions fromlandlords to fund buildings and leasehold improvements. Such contributions are recorded as deferred rent andamortized as reductions to lease expense over the lease term.
The Company recognizes operating lease minimum rentals on a straight-line basis over the lease term.Executory costs such as real estate taxes and maintenance, and contingent rentals such as those based on apercentage of sales are recognized as incurred.
The lease term, which includes all renewal periods that are considered to be reasonably assured, begins onthe date the Company has access to the leased property.
F-10
NOTES TO CONSOLIDATED FINANCIAL STATEMENTS — (Continued)
The carrying value of long-lived assets is periodically reviewed by the Company whenever events orchanges in circumstances indicate that a potential impairment has occurred. For long-lived assets held for use, apotential impairment has occurred if projected future undiscounted cash flows are less than the carrying value ofthe assets. The estimate of cash flows includes management’s assumptions of cash inflows and outflows directlyresulting from the use of those assets in operations. When a potential impairment has occurred, an impairmentwrite-down is recorded if the carrying value of the long-lived asset exceeds its fair value. The Company believesits estimated cash flows are sufficient to support the carrying value of its long-lived assets. If estimated cashflows significantly differ in the future, the Company may be required to record asset impairment write-downs.
If the Company commits to a plan to dispose of a long-lived asset before the end of its previously estimateduseful life, estimated cash flows are revised accordingly, and the Company may be required to record an assetimpairment write-down. Additionally, related liabilities arise such as severance, contractual obligations and otheraccruals associated with store closings from decisions to dispose of assets. The Company estimates theseliabilities based on the facts and circumstances in existence for each restructuring decision. The amounts theCompany will ultimately realize or disburse could differ from the amounts assumed in arriving at the assetimpairment and restructuring charge recorded.
The Company classifies certain long-lived assets as held for disposal by sale and ceases depreciation whenthe particular criteria for such classification are met, including the probable sale within one year. For long-livedassets to be disposed of by sale, an impairment charge is recorded if the carrying amount of the asset exceeds itsfair value less costs to sell. Such valuations include estimations of fair values and incremental direct costs totransact a sale.
The carrying value of goodwill and other intangible assets with indefinite lives are reviewed at leastannually for possible impairment in accordance with ASC Subtopic 350-20 “Goodwill.” Goodwill and otherintangible assets with indefinite lives have been assigned to reporting units for purposes of impairment testing.The reporting units are the Company’s retail operating divisions. Goodwill and other intangible assets withindefinite lives are tested for impairment annually at the end of the fiscal month of May. The Company estimatesfair value based on discounted cash flows. The goodwill impairment test involves a two-step process. The firststep is a comparison of each reporting unit’s fair value to its carrying value. The reporting unit’s discounted cashflows require significant management judgment with respect to sales, gross margin and SG&A rates, capitalexpenditures and the selection and use of an appropriate discount rate. The projected sales, gross margin andSG&A expense rate assumptions and capital expenditures are based on the Company’s annual business plan orother forecasted results. Discount rates reflect market-based estimates of the risks associated with the projectedcash flows directly resulting from the use of those assets in operations. The estimates of fair value of reportingunits are based on the best information available as of the date of the assessment. If the carrying value of areporting unit exceeds its estimated fair value in the first step, a second step is performed, in which the reportingunit’s goodwill is written down to its implied fair value. The second step requires the Company to allocate thefair value of the reporting unit derived in the first step to the fair value of the reporting unit’s net assets, with anyfair value in excess of amounts allocated to such net assets representing the implied fair value of goodwill forthat reporting unit. If the carrying value of an individual indefinite-lived intangible asset exceeds its fair value,such individual indefinite-lived intangible asset is written down by an amount equal to such excess.
The Company capitalizes purchased and internally developed software and amortizes such costs to expenseon a straight-line basis over two to five years. Capitalized software is included in other assets on theConsolidated Balance Sheets.
F-11

NOTES TO CONSOLIDATED FINANCIAL STATEMENTS — (Continued)
Historically, the Company offered both expiring and non-expiring gift cards to its customers. At the timegift cards are sold, no revenue is recognized; rather, the Company records an accrued liability to customers. Theliability is relieved and revenue is recognized equal to the amount redeemed at the time gift cards are redeemedfor merchandise. The Company records income from unredeemed gift cards (breakage) as a reduction of SG&Aexpenses. For expiring gift cards, income is recorded at the end of two years (expiration date) when there is nolonger a legal obligation. For non-expiring gift cards, income is recorded in proportion and over the time periodgift cards are actually redeemed. At least three years of historical data, updated annually, is used to determineactual redemption patterns. Since February 2, 2008, the Company sells only non-expiring gift cards.
The Company, through its insurance subsidiaries, is self-insured for workers compensation and generalliability claims up to certain maximum liability amounts. Although the amounts accrued are actuariallydetermined based on analysis of historical trends of losses, settlements, litigation costs and other factors, theamounts the Company will ultimately disburse could differ from such accrued amounts.
The Company, through its actuaries, utilizes assumptions when estimating the liabilities for pension andother employee benefit plans. These assumptions, where applicable, include the discount rates used to determinethe actuarial present value of projected benefit obligations, the rate of increase in future compensation levels, thelong-term rate of return on assets and the growth in health care costs. The cost of these benefits is recognized inthe Consolidated Financial Statements over an employee’s term of service with the Company, and the accruedbenefits are reported in accounts payable and accrued liabilities and other liabilities on the Consolidated BalanceSheets, as appropriate.
Financing costs are amortized using the effective interest method over the life of the related debt.
Income taxes are accounted for under the asset and liability method. Deferred income tax assets andliabilities are recognized for the future tax consequences attributable to differences between the financialstatement carrying amounts of existing assets and liabilities and their respective tax bases, and net operating lossand tax credit carryforwards. Deferred income tax assets and liabilities are measured using enacted tax ratesexpected to apply to taxable income in the years in which those temporary differences are expected to berecovered or settled. The effect on deferred income tax assets and liabilities of a change in tax rates is recognizedin the Consolidated Statements of Operations in the period that includes the enactment date. Deferred income taxassets are reduced by a valuation allowance when it is more likely than not that some portion of the deferredincome tax assets will not be realized.
The Company changed its methodology for recording deferred state income taxes from a blended rate basisto a separate entity basis, and has reflected the effects of such change to 2010 and all prior periods. Even thoughthe Company considers the change to have had only an immaterial impact on its financial condition, results ofoperations and cash flows for the periods presented, the financial condition, results of operations and cash flowsfor the prior periods as previously reported have been adjusted to reflect the change.
The Company records derivative transactions according to the provisions of ASC Topic 815 “Derivativesand Hedging,” which establishes accounting and reporting standards for derivative instruments and hedgingactivities and requires recognition of all derivatives as either assets or liabilities and measurement of thoseinstruments at fair value. The Company makes limited use of derivative financial instruments. The Companydoes not use financial instruments for trading or other speculative purposes and is not a party to any leveragedfinancial instruments. On the date that the Company enters into a derivative contract, the Company designates thederivative instrument as either a fair value hedge, a cash flow hedge or as a free-standing derivative instrument,each of which would receive different accounting treatment. Prior to entering into a hedge transaction, the
F-12

NOTES TO CONSOLIDATED FINANCIAL STATEMENTS — (Continued)
Company formally documents the relationship between hedging instruments and hedged items, as well as the riskmanagement objective and strategy for undertaking various hedge transactions. Derivative instruments that theCompany may use as part of its interest rate risk management strategy include interest rate swap and interest ratecap agreements and Treasury lock agreements. At January 29, 2011, the Company was not a party to anyderivative financial instruments.
The Company records stock-based compensation expense according to the provisions of ASC Topic 718,“Compensation – Stock Compensation.” ASC Topic 718 requires all share-based payments to employees,including grants of employee stock options, to be recognized in the financial statements based on their fairvalues. Under the provisions of ASC Topic 718, the Company must determine the appropriate fair value model tobe used for valuing share-based payments and the amortization method for compensation cost. See Note 13,“Stock Based Compensation,” for further information.
In January 2010, the FASB issued Accounting Standards Update No. 2010-06, which provides amendmentsand requires new disclosures relating to ASC Topic 820, “Fair Value Measurements and Disclosures,” and alsoconforming amendments to guidance relating to ASC Topic 715, “Compensation – Retirement Benefits.” TheCompany adopted this guidance on January 31, 2010, except for the disclosure requirement regarding purchases,sales, issuances and settlements in the rollforward of activity in Level 3 fair value measurements, which theCompany adopted on January 30, 2011. This guidance is limited to the form and content of disclosures, and theportion thereof that has been adopted did not have a material impact on the Company’s consolidated financialposition, results of operations or cash flows. The Company does not anticipate that the full adoption of thisguidance will have a material impact on the Company’s consolidated financial position, results of operations orcash flows.
In July 2010, the FASB issued Accounting Standard Update No. 2010-20, which amends various sections ofASC Topic 310, “Receivables,” relating to a company’s allowance for credit losses and the credit quality of itsfinancing receivables. The amendment requires companies to provide disaggregated levels of disclosure byportfolio segment and class of financing receivable to enable users of the financial statements to understand thenature of credit risk, how the risk is analyzed in determining the related allowance for credit losses and changesto the allowance during the reporting period. The Company adopted this guidance as of January 29, 2011, exceptas it relates to disclosures regarding activities during a reporting period, which is effective for interim and annualperiods beginning on or after December 31, 2010. This guidance is limited to the form and content of disclosures.The initial adoption did not have, and the full adoption is not expected to have, an impact on the Company’sconsolidated financial position, results of operations or cash flows.
In December 2010, the FASB issued Accounting Standard Update No. 2010-28, which amends ASC Topic350, “Goodwill and Other,” relating to the goodwill impairment test of a reporting unit with zero or negativecarrying amounts. This guidance is effective for interim and annual periods beginning after December 15, 2010.The Company does not anticipate that the adoption of this guidance will have a material impact on theCompany’s consolidated financial position, results of operations or cash flows.
F-13

NOTES TO CONSOLIDATED FINANCIAL STATEMENTS — (Continued)
2. Impairments, Store Closing Costs and Division Consolidation Costs
Impairments, store closing costs, and division consolidation costs consist of the following:
2010 2009 2008
(millions)
Impairments:Properties held and used . . . . . . . . . . . . . . . . . . . . . . . . . . . . . . . . . . . . . . . . . . . . . . . . . . $18 $115 $136Acquired indefinite-lived private brand tradenames . . . . . . . . . . . . . . . . . . . . . . . . . . . . – – 63Marketable securities . . . . . . . . . . . . . . . . . . . . . . . . . . . . . . . . . . . . . . . . . . . . . . . . . . . . – – 12
Store closing costs:Severance . . . . . . . . . . . . . . . . . . . . . . . . . . . . . . . . . . . . . . . . . . . . . . . . . . . . . . . . . . . . . 1 2 4Other . . . . . . . . . . . . . . . . . . . . . . . . . . . . . . . . . . . . . . . . . . . . . . . . . . . . . . . . . . . . . . . . . 6 4 7
Division consolidation costs . . . . . . . . . . . . . . . . . . . . . . . . . . . . . . . . . . . . . . . . . . . . . . . . . . . – 270 176
$25 $391 $398
Long-lived assets held for use are reviewed for impairment whenever events or changes in circumstancesindicate that the carrying amount of such assets may not be recoverable. Determination of recoverability of long-lived assets is based on an estimate of undiscounted future cash flows resulting from the use of those assets inoperation. Measurement of an impairment loss for long-lived assets that management expects to hold and use isbased on the fair value of the asset. When an impairment loss is recognized, the carrying amount of the asset isreduced to its estimated fair value. As a result of the Company’s projected undiscounted future cash flows relatedto certain store locations being less than the carrying value of those assets, the Company recorded the impairmentcharges reflected in the table above relating to properties held and used, including properties that were the subjectof announced store closings. The fair values of these locations were calculated based on the projected cash flowsand an estimated risk-adjusted rate of return that would be used by market participants in valuing these assets orbased on prices of similar assets.
During January 2011, the Company announced the closure of three underperforming Macy’s stores; duringJanuary 2010, the Company announced the closure of five underperforming Macy’s stores; and during January2009, the Company announced the closure of eleven underperforming Macy’s stores. In connection with theseannouncements and the plans to dispose of these locations, the Company incurred severance costs and other costsrelated to lease obligations and other store liabilities. For 2010, these costs also included a loss on the sale of oneproperty to be disposed.
The following table shows for 2010, 2009 and 2008, the beginning and ending balance of, and the activityassociated with, the severance accruals established in connection with announced store closings:
2010 2009 2008
(millions)
Balance, beginning of year . . . . . . . . . . . . . . . . . . . . . . . . . . . . . . . . . . . . . . . . . . . . . . . . . . . . . . $ 2 $ 4 $ –Charged to store closing costs . . . . . . . . . . . . . . . . . . . . . . . . . . . . . . . . . . . . . . . . . . . . . . . . . . . 1 2 4Payments . . . . . . . . . . . . . . . . . . . . . . . . . . . . . . . . . . . . . . . . . . . . . . . . . . . . . . . . . . . . . . . . . . . (2) (4) –
Balance, end of year . . . . . . . . . . . . . . . . . . . . . . . . . . . . . . . . . . . . . . . . . . . . . . . . . . . . . . . . . . . $ 1 $ 2 $ 4
The Company expects to pay out the 2010 accrued severance costs, which are included in accounts payableand accrued liabilities on the Consolidated Balance Sheets, prior to April 30, 2011.
F-14

NOTES TO CONSOLIDATED FINANCIAL STATEMENTS — (Continued)
In February 2008, the Company began a localization initiative called “My Macy’s.” This initiative wasintended to strengthen local market focus and enhance selling service in an effort to both accelerate same-storesales growth and reduce expenses. To maximize the results from My Macy’s, the Company took action, initiallyin selected markets, that: concentrated more management talent in local markets, effectively reducing the “spanof control” over local stores; created new positions in the field to work with planning and buying executives inhelping to understand and act on the merchandise needs of local customers; and empowered locally basedexecutives to make more and better decisions. In combination with the localization initiative, the Companyconsolidated the Minneapolis-based Macy’s North organization into New York-based Macy’s East, the St. Louis-based Macy’s Midwest organization into Atlanta-based Macy’s South and the Seattle-based Macy’s Northwestorganization into San Francisco based Macy’s West. The Atlanta-based division was renamed Macy’s Central.
In February 2009, the Company announced the expansion of the My Macy’s localization initiative acrossthe country. As My Macy’s was rolled out nationally to new local markets in 2009, the Company’s Macy’sbranded stores were reorganized into a unified operating structure, through division consolidations, to support theMacy’s business. Division central office organizations were eliminated in New York-based Macy’s East, SanFrancisco-based Macy’s West, Atlanta-based Macy’s Central and Miami-based Macy’s Florida. The New York-based Macy’s Home Store and Macy’s Corporate Marketing divisions no longer exist as separate entities. HomeStore functions were integrated into the Macy’s national merchandising, merchandise planning, stores andmarketing organizations. Macy’s Corporate Marketing was integrated into the new unified marketingorganization. The New York-based Macy’s Merchandising Group was refocused solely on the design,development and marketing of the Macy’s family of private brands.
The costs and expenses associated with the division consolidations and localization initiatives consistedprimarily of severance costs and other human resource-related costs.
The following table shows for 2010, 2009 and 2008, the beginning and ending balance of, and the activityassociated with, the severance accruals established in connection with the division consolidations andlocalization initiatives:
2010 2009 2008
(millions)
Balance, beginning of year . . . . . . . . . . . . . . . . . . . . . . . . . . . . . . . . . . . . . . . . . . . . . . . . . . . $ 69 $ 30 $ –Charged to division consolidation costs . . . . . . . . . . . . . . . . . . . . . . . . . . . . . . . . . . . . . . . . . – 166 99Payments . . . . . . . . . . . . . . . . . . . . . . . . . . . . . . . . . . . . . . . . . . . . . . . . . . . . . . . . . . . . . . . . . (69) (127) (69)
Balance, end of year . . . . . . . . . . . . . . . . . . . . . . . . . . . . . . . . . . . . . . . . . . . . . . . . . . . . . . . . $ – $ 69 $ 30
The Company performed both an annual and an interim impairment test of goodwill and indefinite-livedintangible assets during 2008 (see Note 3, “Goodwill Impairment Charges”). As a result of the then-currenteconomic environment and expectations regarding future operating performance of the Karen Scott, JohnAshford and Frango private brand tradenames, it was determined that the carrying values exceeded the estimatedfair values, which were based on discounted cash flows, and management concluded that asset impairmentcharges were required.
The Company accounts for its investment in available-for-sale marketable equity securities with unrealizedgains and losses being included as a separate component of accumulated other comprehensive income. During2008, based on the then-current economic environment, it was determined that the carrying value of certainmarketable equity securities exceeded the current fair value on an “other-than-temporary” basis, and thepreviously unrecognized losses in accumulated other comprehensive income were reclassified into theConsolidated Statements of Operations.
F-15

NOTES TO CONSOLIDATED FINANCIAL STATEMENTS — (Continued)
3. Goodwill Impairment Charges
The Company reviews the carrying value of its goodwill and other intangible assets with indefinite lives atleast annually for possible impairment in accordance with ASC Topic 350, “Intangibles – Goodwill and Other.”Goodwill and other intangible assets with indefinite lives have been assigned to reporting units for purposes ofimpairment testing. The reporting units are the Company’s retail operating divisions. Goodwill and otherintangible assets with indefinite lives are tested for impairment annually at the end of the fiscal month of May.The goodwill impairment test involves a two-step process. The first step involves estimating the fair value ofeach reporting unit based on its estimated discounted cash flows and comparing the estimated fair value of eachreporting unit to its carrying value. If this comparison indicates that a reporting unit’s estimated fair value is lessthan its carrying value, a second step is required. If applicable, the second step requires the Company to allocatethe fair value of the reporting unit to the estimated fair value of the reporting unit’s net assets, with any fair valuein excess of amounts allocated to such net assets representing the implied fair value of goodwill for that reportingunit. If the carrying value of an individual indefinite-lived intangible asset exceeds its fair value, such individualindefinite-lived intangible asset is written down by an amount equal to such excess.
The Company uses judgment in assessing whether assets may have become impaired between annualimpairment tests. The occurrence of a change in circumstances, such as continued adverse business conditions orother economic factors, would determine the need for impairment testing between annual impairment tests. Dueto deterioration in the general economic environment in 2008 (and the impact thereof on the Company’s then-most recently completed annual business plan) and the resultant decline in the Company’s market capitalization,the Company believed that an additional goodwill impairment test was required as of January 31, 2009. Inperforming the first step of this impairment test, the Company estimated the fair value of its reporting units bydiscounting their projected future cash flows to present value, and reconciling the aggregate estimated fair valueof the Company’s reporting units to the trading value of the Company’s common stock (together with an impliedcontrol premium). The Company believes that this reconciliation process represents a market participantapproach to valuation. Based on this analysis, the Company determined that the carrying value of each of theCompany’s reporting units exceeded its fair value at January 31, 2009, which resulted in all of the Company’sreporting units failing the first step of the goodwill impairment test. The Company then undertook the secondstep of the goodwill impairment test, which involved, among other things, obtaining third-party appraisals ofsubstantially all of the Company’s tangible and intangible assets. Based on the results of its goodwill impairmenttesting as of January 31, 2009, the Company recorded a pre-tax goodwill impairment charge of $5,382 million($5,083 million after income taxes) in the fourth quarter of 2008. As a result of the 2008 goodwill impairmentcharge, Macy’s is the only retail operating division with goodwill.
Based on the results of the most recent annual impairment test of goodwill and indefinite-lived intangibleassets completed during the second quarter of 2010, the Company determined that goodwill and indefinite-livedintangible assets were not impaired as of May 29, 2010 and the estimated fair value of the Macy’s reporting unitsubstantially exceeded its carrying value.
The goodwill impairment testing process involves the use of significant assumptions, estimates andjudgments by management, and is subject to inherent uncertainties and subjectivity. Estimating a reporting unit’sdiscounted cash flows involves the use of significant assumptions, estimates and judgments with respect to avariety of factors, including sales, gross margin and SG&A rates, capital expenditures, cash flows and theselection and use of an appropriate discount rate. Projected sales, gross margin and expense rate assumptions andcapital expenditures are based on the Company’s business plan or other forecasted results. Discount rates reflectmarket-based estimates of the risks associated with the projected cash flows of the reporting unit directlyresulting from the use of its assets in its operations. The allocation of the estimated fair value of the Company’sreporting units to the estimated fair value of their net assets also involves the use of significant assumptions,
F-16

NOTES TO CONSOLIDATED FINANCIAL STATEMENTS — (Continued)
estimates and judgments. Both the estimates of the fair value of the Company’s reporting units and the allocationof the estimated fair value of the reporting units to their net assets are based on the best information available tothe Company’s management as of the date of the assessment.
The use of different assumptions, estimates or judgments in either step of the goodwill impairment testingprocess, including with respect to the estimated future cash flows of the Company’s reporting units, the discountrate used to discount such estimated cash flows to their net present value, the reasonableness of the resultantimplied control premium relative to the Company’s market capitalization, and the appraised fair value of thereporting units’ tangible and intangible assets and liabilities, could materially increase or decrease the fair valueof the reporting unit and/or its net assets and, accordingly, could materially increase or decrease any relatedimpairment charge.
4. Receivables
Receivables were $392 million at January 29, 2011, compared to $358 million at January 30, 2010.
In connection with the sales of credit card accounts and related receivable balances, the Company andCitibank entered into a long-term marketing and servicing alliance pursuant to the terms of a Credit CardProgram Agreement (the “Program Agreement”) with an initial term of 10 years expiring on July 17, 2016 and,unless terminated by either party as of the expiration of the initial term, an additional renewal term of threeyears. The Program Agreement provides for, among other things, (i) the ownership by Citibank of the accountspurchased by Citibank, (ii) the ownership by Citibank of new accounts opened by the Company’s customers,(iii) the provision of credit by Citibank to the holders of the credit cards associated with the foregoing accounts,(iv) the servicing of the foregoing accounts, and (v) the allocation between Citibank and the Company of theeconomic benefits and burdens associated with the foregoing and other aspects of the alliance.
Pursuant to the Program Agreement, the Company continues to provide certain servicing functions related tothe accounts and related receivables owned by Citibank and receives compensation from Citibank for theseservices. The amounts earned under the Program Agreement related to the servicing functions are deemedadequate compensation and, accordingly, no servicing asset or liability has been recorded on the ConsolidatedBalance Sheets.
Amounts received under the Program Agreement were $528 million for 2010, $525 million for 2009 and$594 million for 2008, and are treated as reductions of SG&A expenses on the Consolidated Statements ofOperations. The Company’s earnings from credit operations, net of servicing expenses, were $332 million for2010, $323 million for 2009, and $372 million for 2008.
5. Inventories
Merchandise inventories were $4,758 million at January 29, 2011, compared to $4,615 million atJanuary 30, 2010. At these dates, the cost of inventories using the LIFO method approximated the cost of suchinventories using the FIFO method. The application of the LIFO method did not impact cost of sales for 2010,2009 or 2008.
F-17

NOTES TO CONSOLIDATED FINANCIAL STATEMENTS — (Continued)
6. Properties and Leases
January 29,2011
January 30,2010
(millions)
Land . . . . . . . . . . . . . . . . . . . . . . . . . . . . . . . . . . . . . . . . . . . . . . . . . . . . . . . . $ 1,702 $ 1,719Buildings on owned land . . . . . . . . . . . . . . . . . . . . . . . . . . . . . . . . . . . . . . . . 5,148 5,160Buildings on leased land and leasehold improvements . . . . . . . . . . . . . . . . . 2,227 2,232Fixtures and equipment . . . . . . . . . . . . . . . . . . . . . . . . . . . . . . . . . . . . . . . . . . 5,752 6,129Leased properties under capitalized leases . . . . . . . . . . . . . . . . . . . . . . . . . . . 33 49
14,862 15,289Less accumulated depreciation and amortization . . . . . . . . . . . . . . . . . . 6,049 5,782
$ 8,813 $ 9,507
In connection with various shopping center agreements, the Company is obligated to operate certain storeswithin the centers for periods of up to twenty years. Some of these agreements require that the stores be operatedunder a particular name.
The Company leases a portion of the real estate and personal property used in its operations. Most leasesrequire the Company to pay real estate taxes, maintenance and other executory costs; some also requireadditional payments based on percentages of sales and some contain purchase options. Certain of the Company’sreal estate leases have terms that extend for significant numbers of years and provide for rental rates that increaseor decrease over time. In addition, certain of these leases contain covenants that restrict the ability of the tenant(typically a subsidiary of the Company) to take specified actions (including the payment of dividends or otheramounts on account of its capital stock) unless the tenant satisfies certain financial tests.
Minimum rental commitments (excluding executory costs) at January 29, 2011, for noncancellable leasesare:
CapitalizedLeases
OperatingLeases Total
(millions)
Fiscal year:2011 . . . . . . . . . . . . . . . . . . . . . . . . . . . . . . . . . . . . . . . . . . . . . . . . . . . . . . . . . . . . $ 6 $ 245 $ 2512012 . . . . . . . . . . . . . . . . . . . . . . . . . . . . . . . . . . . . . . . . . . . . . . . . . . . . . . . . . . . . 6 233 2392013 . . . . . . . . . . . . . . . . . . . . . . . . . . . . . . . . . . . . . . . . . . . . . . . . . . . . . . . . . . . . 4 213 2172014 . . . . . . . . . . . . . . . . . . . . . . . . . . . . . . . . . . . . . . . . . . . . . . . . . . . . . . . . . . . . 4 190 1942015 . . . . . . . . . . . . . . . . . . . . . . . . . . . . . . . . . . . . . . . . . . . . . . . . . . . . . . . . . . . . 3 150 153After 2015 . . . . . . . . . . . . . . . . . . . . . . . . . . . . . . . . . . . . . . . . . . . . . . . . . . . . . . . . 35 1,581 1,616
Total minimum lease payments . . . . . . . . . . . . . . . . . . . . . . . . . . . . . . . . . . . . . . . 58 $2,612 $2,670
Less amount representing interest . . . . . . . . . . . . . . . . . . . . . . . . . . . . . . . . . . . . . 25
Present value of net minimum capitalized lease payments . . . . . . . . . . . . . . . . . . $33
Capitalized leases are included in the Consolidated Balance Sheets as property and equipment while the relatedobligation is included in short-term ($3 million) and long-term ($30 million) debt. Amortization of assets subject tocapitalized leases is included in depreciation and amortization expense. Total minimum lease payments shownabove have not been reduced by minimum sublease rentals of approximately $80 million on operating leases.
F-18

NOTES TO CONSOLIDATED FINANCIAL STATEMENTS — (Continued)
The Company is a guarantor with respect to certain lease obligations associated with The May DepartmentStores Company and previously disposed subsidiaries or businesses. The leases, one of which includes potentialextensions to 2070, have future minimum lease payments aggregating approximately $389 million and are offsetby payments from existing tenants and subtenants. In addition, the Company is liable for other expenses relatedto the above leases, such as property taxes and common area maintenance, which are also payable by existingtenants and subtenants. Potential liabilities related to these guarantees are subject to certain defenses by theCompany. The Company believes that the risk of significant loss from the guarantees of these lease obligations isremote.
Rental expense consists of:
2010 2009 2008
(millions)
Real estate (excluding executory costs)Capitalized leases –
Contingent rentals . . . . . . . . . . . . . . . . . . . . . . . . . . . . . . . . . . . . . . . . . . . . . . . . . . $ – $ – $ 1Operating leases –
Minimum rentals . . . . . . . . . . . . . . . . . . . . . . . . . . . . . . . . . . . . . . . . . . . . . . . . . . . 234 230 230Contingent rentals . . . . . . . . . . . . . . . . . . . . . . . . . . . . . . . . . . . . . . . . . . . . . . . . . . 16 15 16
250 245 247
Less income from subleases –Operating leases . . . . . . . . . . . . . . . . . . . . . . . . . . . . . . . . . . . . . . . . . . . . . . . . . . . (15) (16) (15)
$235 $229 $232
Personal property – Operating leases . . . . . . . . . . . . . . . . . . . . . . . . . . . . . . . . . . . . . . . . . . . $ 10 $ 12 $ 19
Included as a reduction to the expense above is deferred rent amortization of $7 million, $7 million and $6million for 2010, 2009 and 2008, respectively, related to contributions received from landlords.
F-19

NOTES TO CONSOLIDATED FINANCIAL STATEMENTS — (Continued)
7. Goodwill and Other Intangible Assets
The following summarizes the Company’s goodwill and other intangible assets:
January 29,2011
January 30,2010
(millions)
Non-amortizing intangible assetsGoodwill . . . . . . . . . . . . . . . . . . . . . . . . . . . . . . . . . . . . . . . . . . . . . . . . . $ 9,125 $ 9,125Accumulated impairment losses . . . . . . . . . . . . . . . . . . . . . . . . . . . . . . . (5,382) (5,382)
3,743 3,743Tradenames . . . . . . . . . . . . . . . . . . . . . . . . . . . . . . . . . . . . . . . . . . . . . . . 414 414
$ 4,157 $ 4,157
Amortizing intangible assetsFavorable leases . . . . . . . . . . . . . . . . . . . . . . . . . . . . . . . . . . . . . . . . . . . $ 250 $ 256Customer relationships . . . . . . . . . . . . . . . . . . . . . . . . . . . . . . . . . . . . . . 188 188
438 444
Accumulated amortizationFavorable leases . . . . . . . . . . . . . . . . . . . . . . . . . . . . . . . . . . . . . . . . . . . (113) (97)Customer relationships . . . . . . . . . . . . . . . . . . . . . . . . . . . . . . . . . . . . . . (102) (83)
(215) (180)
$ 223 $ 264
During 2008, the Company recorded a goodwill impairment charge based on the results of goodwillimpairment testing as of January 31, 2009. See Note 3, “Goodwill Impairment Charges,” for further information.Also during 2008, the Company recorded an impairment charge associated with acquired indefinite-lived privatebrand tradenames. See Note 2, “Impairments, Store Closing Costs and Division Consolidation Costs,” for furtherinformation.
Intangible amortization expense amounted to $41 million for 2010, $41 million for 2009 and $42 million for2008.
Future estimated intangible amortization expense is shown below:
(millions)
Fiscal year:2011 . . . . . . . . . . . . . . . . . . . . . . . . . . . . . . . . . . . . . . . . . . . . . . . . . . . . . . . . . $392012 . . . . . . . . . . . . . . . . . . . . . . . . . . . . . . . . . . . . . . . . . . . . . . . . . . . . . . . . . 372013 . . . . . . . . . . . . . . . . . . . . . . . . . . . . . . . . . . . . . . . . . . . . . . . . . . . . . . . . . 342014 . . . . . . . . . . . . . . . . . . . . . . . . . . . . . . . . . . . . . . . . . . . . . . . . . . . . . . . . . 312015 . . . . . . . . . . . . . . . . . . . . . . . . . . . . . . . . . . . . . . . . . . . . . . . . . . . . . . . . . 21
Favorable lease intangible assets are being amortized over their respective lease terms (weighted averagelife of approximately twelve years) and customer relationship intangible assets are being amortized over theirestimated useful lives of ten years.
F-20

NOTES TO CONSOLIDATED FINANCIAL STATEMENTS — (Continued)
8. Financing
The Company’s debt is as follows:
January 29,2011
January 30,2010
(millions)Short-term debt:
6.625% Senior notes due 2011 . . . . . . . . . . . . . . . . . . . . . . . . . . . . . . . . . . . . . . . . . . . . . . . $ 330 $ –7.45% Senior debentures due 2011 . . . . . . . . . . . . . . . . . . . . . . . . . . . . . . . . . . . . . . . . . . . . 109 –10.625% Senior debentures due 2010 . . . . . . . . . . . . . . . . . . . . . . . . . . . . . . . . . . . . . . . . . . – 1508.5% Senior notes due 2010 . . . . . . . . . . . . . . . . . . . . . . . . . . . . . . . . . . . . . . . . . . . . . . . . . – 76Capital lease and current portion of other long-term obligations . . . . . . . . . . . . . . . . . . . . . 15 16
$ 454 $ 242
Long-term debt:5.9% Senior notes due 2016 . . . . . . . . . . . . . . . . . . . . . . . . . . . . . . . . . . . . . . . . . . . . . . . . . $ 977 $1,1005.35% Senior notes due 2012 . . . . . . . . . . . . . . . . . . . . . . . . . . . . . . . . . . . . . . . . . . . . . . . . 616 1,1007.875% Senior notes due 2015 * . . . . . . . . . . . . . . . . . . . . . . . . . . . . . . . . . . . . . . . . . . . . . . 612 6506.375% Senior notes due 2037 . . . . . . . . . . . . . . . . . . . . . . . . . . . . . . . . . . . . . . . . . . . . . . . 500 5005.75% Senior notes due 2014 . . . . . . . . . . . . . . . . . . . . . . . . . . . . . . . . . . . . . . . . . . . . . . . . 453 5006.9% Senior debentures due 2029 . . . . . . . . . . . . . . . . . . . . . . . . . . . . . . . . . . . . . . . . . . . . . 400 4006.7% Senior debentures due 2034 . . . . . . . . . . . . . . . . . . . . . . . . . . . . . . . . . . . . . . . . . . . . . 400 4007.45% Senior debentures due 2017 . . . . . . . . . . . . . . . . . . . . . . . . . . . . . . . . . . . . . . . . . . . . 300 3006.65% Senior debentures due 2024 . . . . . . . . . . . . . . . . . . . . . . . . . . . . . . . . . . . . . . . . . . . . 300 3007.0% Senior debentures due 2028 . . . . . . . . . . . . . . . . . . . . . . . . . . . . . . . . . . . . . . . . . . . . . 300 3005.875% Senior notes due 2013 . . . . . . . . . . . . . . . . . . . . . . . . . . . . . . . . . . . . . . . . . . . . . . . 298 3506.9% Senior debentures due 2032 . . . . . . . . . . . . . . . . . . . . . . . . . . . . . . . . . . . . . . . . . . . . . 250 2506.7% Senior debentures due 2028 . . . . . . . . . . . . . . . . . . . . . . . . . . . . . . . . . . . . . . . . . . . . . 200 2008.0% Senior debentures due 2012 . . . . . . . . . . . . . . . . . . . . . . . . . . . . . . . . . . . . . . . . . . . . . 173 2006.79% Senior debentures due 2027 . . . . . . . . . . . . . . . . . . . . . . . . . . . . . . . . . . . . . . . . . . . . 165 1657.45% Senior debentures due 2016 . . . . . . . . . . . . . . . . . . . . . . . . . . . . . . . . . . . . . . . . . . . . 123 1257.625% Senior debentures due 2013 . . . . . . . . . . . . . . . . . . . . . . . . . . . . . . . . . . . . . . . . . . . 109 1257.875% Senior debentures due 2036 . . . . . . . . . . . . . . . . . . . . . . . . . . . . . . . . . . . . . . . . . . . 108 1087.5% Senior debentures due 2015 . . . . . . . . . . . . . . . . . . . . . . . . . . . . . . . . . . . . . . . . . . . . . 100 1008.125% Senior debentures due 2035 . . . . . . . . . . . . . . . . . . . . . . . . . . . . . . . . . . . . . . . . . . . 76 768.75% Senior debentures due 2029 . . . . . . . . . . . . . . . . . . . . . . . . . . . . . . . . . . . . . . . . . . . . 61 619.5% amortizing debentures due 2021 . . . . . . . . . . . . . . . . . . . . . . . . . . . . . . . . . . . . . . . . . 37 418.5% Senior debentures due 2019 . . . . . . . . . . . . . . . . . . . . . . . . . . . . . . . . . . . . . . . . . . . . . 36 3610.25% Senior debentures due 2021 . . . . . . . . . . . . . . . . . . . . . . . . . . . . . . . . . . . . . . . . . . . 33 337.6% Senior debentures due 2025 . . . . . . . . . . . . . . . . . . . . . . . . . . . . . . . . . . . . . . . . . . . . . 24 249.75% amortizing debentures due 2021 . . . . . . . . . . . . . . . . . . . . . . . . . . . . . . . . . . . . . . . . 20 227.875% Senior debentures due 2030 . . . . . . . . . . . . . . . . . . . . . . . . . . . . . . . . . . . . . . . . . . . 18 186.625% Senior notes due 2011 . . . . . . . . . . . . . . . . . . . . . . . . . . . . . . . . . . . . . . . . . . . . . . . – 5007.45% Senior debentures due 2011 . . . . . . . . . . . . . . . . . . . . . . . . . . . . . . . . . . . . . . . . . . . . – 150Premium on acquired debt, using an effective
interest yield of 4.854% to 6.165% . . . . . . . . . . . . . . . . . . . . . . . . . . . . . . . . . . . . . . . . . . 239 275Capital lease and other long-term obligations . . . . . . . . . . . . . . . . . . . . . . . . . . . . . . . . . . . . 43 47
$6,971 $8,456
* The rate of interest payable in respect of these senior notes was increased by one percent per annum to 8.875% in April 2009 as a result of adowngrade of the notes by specified rating agencies and was decreased by 0.50 percent per annum to 8.375% effective in May 2010 as aresult of an upgrade of the notes by specified rating agencies. The rate of interest payable in respect of these senior notes could increase byup to 1.50 percent per annum or decrease by up to 0.50 percent per annum from its current level in the event of one or more downgrades orupgrades of the notes by specified rating agencies.
F-21

NOTES TO CONSOLIDATED FINANCIAL STATEMENTS — (Continued)
Interest expense is as follows:
2010 2009 2008
(millions)
Interest on debt . . . . . . . . . . . . . . . . . . . . . . . . . . . . . . . . . . . . . . . . . . . . . . . . . . . . . . . . . . . . $535 $587 $621Premium on early retirement of long-term debt . . . . . . . . . . . . . . . . . . . . . . . . . . . . . . . . . . . 66 – –Amortization of debt premium . . . . . . . . . . . . . . . . . . . . . . . . . . . . . . . . . . . . . . . . . . . . . . . . (31) (33) (34)Amortization of financing costs . . . . . . . . . . . . . . . . . . . . . . . . . . . . . . . . . . . . . . . . . . . . . . . 11 10 7Interest on capitalized leases . . . . . . . . . . . . . . . . . . . . . . . . . . . . . . . . . . . . . . . . . . . . . . . . . . 3 3 5
584 567 599Less interest capitalized on construction . . . . . . . . . . . . . . . . . . . . . . . . . . . . . . . . . . . . . . . . . 5 5 11
$579 $562 $588
Future maturities of long-term debt, other than capitalized leases and premium on acquired debt, are shownbelow:
(millions)
Fiscal year:2012 . . . . . . . . . . . . . . . . . . . . . . . . . . . . . . . . . . . . . . . . . . . . . . . . . . . . . . . . . $1,0982013 . . . . . . . . . . . . . . . . . . . . . . . . . . . . . . . . . . . . . . . . . . . . . . . . . . . . . . . . . 1212014 . . . . . . . . . . . . . . . . . . . . . . . . . . . . . . . . . . . . . . . . . . . . . . . . . . . . . . . . . 4612015 . . . . . . . . . . . . . . . . . . . . . . . . . . . . . . . . . . . . . . . . . . . . . . . . . . . . . . . . . 7182016 . . . . . . . . . . . . . . . . . . . . . . . . . . . . . . . . . . . . . . . . . . . . . . . . . . . . . . . . . 1,105After 2016 . . . . . . . . . . . . . . . . . . . . . . . . . . . . . . . . . . . . . . . . . . . . . . . . . . . . . 3,199
During 2010, consistent with its strategy to reduce indebtedness, the Company used approximately $1,067million of cash to repurchase approximately $1,000 million of indebtedness prior to maturity. In connection withthese repurchases, the Company recognized additional interest expense of approximately $66 million in 2010 dueto the expenses associated with the early retirement of this debt.
In 2009, the Company completed a cash tender offer pursuant to which it purchased approximately $680million of its outstanding debt for aggregate consideration, including accrued and unpaid interest, ofapproximately $686 million.
On June 23, 2008, the Company issued $650 million aggregate principal amount of 7.875% senior notes due2015. The net proceeds of the debt issuance were used for the repayment of amounts due on debt maturing in2008.
F-22

NOTES TO CONSOLIDATED FINANCIAL STATEMENTS — (Continued)
The following table shows the detail of debt repayments:
2010 2009 2008
(millions)
10.625% Senior debentures due 2010 . . . . . . . . . . . . . . . . . . . . . . . . . . . . . . . . . . . . . . . . . $ 150 $ – $ –8.5% Senior notes due 2010 . . . . . . . . . . . . . . . . . . . . . . . . . . . . . . . . . . . . . . . . . . . . . . . . . 76 – –6.625% Senior notes due 2011 . . . . . . . . . . . . . . . . . . . . . . . . . . . . . . . . . . . . . . . . . . . . . . . 170 – –7.45% Senior debentures due 2011 . . . . . . . . . . . . . . . . . . . . . . . . . . . . . . . . . . . . . . . . . . . 41 – –5.35% Senior notes due 2012 . . . . . . . . . . . . . . . . . . . . . . . . . . . . . . . . . . . . . . . . . . . . . . . . 484 – –8.0% Senior debentures due 2012 . . . . . . . . . . . . . . . . . . . . . . . . . . . . . . . . . . . . . . . . . . . . 27 – –5.875% Senior notes due 2013 . . . . . . . . . . . . . . . . . . . . . . . . . . . . . . . . . . . . . . . . . . . . . . . 52 – –7.625% Senior debentures due 2013 . . . . . . . . . . . . . . . . . . . . . . . . . . . . . . . . . . . . . . . . . . 16 – –5.75% Senior notes due 2014 . . . . . . . . . . . . . . . . . . . . . . . . . . . . . . . . . . . . . . . . . . . . . . . . 47 – –7.875% Senior notes due 2015 . . . . . . . . . . . . . . . . . . . . . . . . . . . . . . . . . . . . . . . . . . . . . . . 38 – –5.90% Senior notes due 2016 . . . . . . . . . . . . . . . . . . . . . . . . . . . . . . . . . . . . . . . . . . . . . . . . 123 – –7.45% Senior debentures due 2016 . . . . . . . . . . . . . . . . . . . . . . . . . . . . . . . . . . . . . . . . . . . 2 – –4.8% Senior notes due 2009 . . . . . . . . . . . . . . . . . . . . . . . . . . . . . . . . . . . . . . . . . . . . . . . . . – 600 –6.3% Senior notes due 2009 . . . . . . . . . . . . . . . . . . . . . . . . . . . . . . . . . . . . . . . . . . . . . . . . . – 350 –6.625% Senior notes due 2008 . . . . . . . . . . . . . . . . . . . . . . . . . . . . . . . . . . . . . . . . . . . . . . . – – 5005.95% Senior notes due 2008 . . . . . . . . . . . . . . . . . . . . . . . . . . . . . . . . . . . . . . . . . . . . . . . . – – 1509.5% amortizing debentures due 2021 . . . . . . . . . . . . . . . . . . . . . . . . . . . . . . . . . . . . . . . . . 4 4 49.75% amortizing debentures due 2021 . . . . . . . . . . . . . . . . . . . . . . . . . . . . . . . . . . . . . . . . 2 2 2Capital leases and other obligations . . . . . . . . . . . . . . . . . . . . . . . . . . . . . . . . . . . . . . . . . . . 13 10 10
$1,245 $966 $666
The following summarizes certain components of the Company’s debt:
Bank Credit Agreement
The Company is a party to a credit agreement with certain financial institutions providing for revolvingcredit borrowings and letters of credit in an aggregate amount not to exceed $2,000 million (which amount maybe increased to $2,500 million at the option of the Company, subject to the willingness of existing or new lendersto provide commitments for such additional financing) outstanding at any particular time. This credit agreementis set to expire August 30, 2012.
As of January 29, 2011, and January 30, 2010, there were no revolving credit loans outstanding under thecredit agreement. However, there were less than $1 million and approximately $52 million, respectively, ofstandby letters of credit outstanding at January 29, 2011 and January 30, 2010. There were no borrowings underthis agreement throughout all of 2010 and 2009. Revolving loans under the credit agreement bear interest basedon various published rates.
This agreement, which is an obligation of a wholly-owned subsidiary of Macy’s, Inc. (“Parent”), is notsecured. However, Parent and each direct and indirect subsidiary of such wholly owned subsidiary of Macy’s,Inc. have fully and unconditionally guaranteed this obligation, subject to specified limitations.
The Company’s interest coverage ratio for 2010 was 5.64 and its leverage ratio at January 29, 2011 was2.34, in each case as calculated in accordance with the credit agreement. The credit agreement requires the
F-23

NOTES TO CONSOLIDATED FINANCIAL STATEMENTS — (Continued)
Company to maintain a specified interest coverage ratio for the latest four quarters of no less than 3.25 and aspecified leverage ratio as of and for the latest four quarters of no more than 4.50. The interest coverage ratio isdefined as EBITDA (earnings before interest, taxes, depreciation and amortization) over net interest expense andthe leverage ratio is defined as debt over EBITDA. For purposes of these calculations EBITDA is calculated asnet income plus interest expense, taxes, depreciation, amortization, non-cash impairment of goodwill, intangiblesand real estate, non-recurring cash charges not to exceed in the aggregate $500 million from the date of theamended agreement and extraordinary losses less interest income and non-recurring or extraordinary gains. Debtand net interest are adjusted to exclude the premium on acquired debt and the resulting amortization,respectively.
A breach of a restrictive covenant in the Company’s credit agreement or the inability of the Company tomaintain the financial ratios described above could result in an event of default under the credit agreement. Inaddition, an event of default would occur under the credit agreement if any indebtedness of the Company inexcess of an aggregate principal amount of $150 million becomes due prior to its stated maturity or the holders ofsuch indebtedness become able to cause it to become due prior to its stated maturity. Upon the occurrence of anevent of default, the lenders could, subject to the terms and conditions of the credit agreement, elect to declarethe outstanding principal, together with accrued interest, to be immediately due and payable. Moreover, most ofthe Company’s senior notes and debentures contain cross-default provisions based on the non-payment atmaturity, or other default after an applicable grace period, of any other debt, the unpaid principal amount ofwhich is not less than $100 million that could be triggered by an event of default under the credit agreement. Insuch an event, the Company’s senior notes and debentures that contain cross-default provisions would also besubject to acceleration.
Commercial Paper
The Company is a party to a $2,000 million unsecured commercial paper program. The Company may issueand sell commercial paper in an aggregate amount outstanding at any particular time not to exceed its then-current combined borrowing availability under the bank credit agreement described above. The issuance ofcommercial paper will have the effect, while such commercial paper is outstanding, of reducing the Company’sborrowing capacity under the bank credit agreement by an amount equal to the principal amount of suchcommercial paper. The Company had no commercial paper outstanding under its commercial paper programthroughout all of 2010 and 2009.
This program, which is an obligation of a wholly-owned subsidiary of Macy’s, Inc., is not secured.However, Parent has fully and unconditionally guaranteed the obligations.
Senior Notes and Debentures
The senior notes and the senior debentures are unsecured obligations of a wholly-owned subsidiary ofMacy’s, Inc. and Parent has fully and unconditionally guaranteed these obligations (see Note 18, “CondensedConsolidating Financial Information”).
Other Financing Arrangements
At January 29, 2011, the Company had dedicated approximately $52 million of cash, included in prepaidexpenses and other current assets, which is used to collateralize the Company’s issuances of standby letters ofcredit. There were approximately $38 million of other standby letters of credit outstanding at January 29, 2011and none outstanding at January 30, 2010.
F-24

NOTES TO CONSOLIDATED FINANCIAL STATEMENTS — (Continued)
9. Accounts Payable and Accrued Liabilities
January 29,2011
January 30,2010
(millions)
Accounts payable . . . . . . . . . . . . . . . . . . . . . . . . . . . . . . . . . . . . . . . . . . . . . . $ 559 $ 484Gift cards and customer award certificates . . . . . . . . . . . . . . . . . . . . . . . . . . . 654 594Accrued wages and vacation . . . . . . . . . . . . . . . . . . . . . . . . . . . . . . . . . . . . . . 311 307Lease related liabilities . . . . . . . . . . . . . . . . . . . . . . . . . . . . . . . . . . . . . . . . . . 271 265Taxes other than income taxes . . . . . . . . . . . . . . . . . . . . . . . . . . . . . . . . . . . . 186 199Current portion of workers’ compensation and general liability reserves . . . 144 141Accrued interest . . . . . . . . . . . . . . . . . . . . . . . . . . . . . . . . . . . . . . . . . . . . . . . 98 122Current portion of post employment and postretirement benefits . . . . . . . . . 88 94Allowance for future sales returns . . . . . . . . . . . . . . . . . . . . . . . . . . . . . . . . . 67 65Severance and relocation . . . . . . . . . . . . . . . . . . . . . . . . . . . . . . . . . . . . . . . . 1 71Other . . . . . . . . . . . . . . . . . . . . . . . . . . . . . . . . . . . . . . . . . . . . . . . . . . . . . . . . 265 284
$2,644 $2,626
Adjustments to the allowance for future sales returns, which amounted to a charge of $2 million for 2010, acharge of $6 million for 2009, and a credit of $14 million for 2008 are reflected in cost of sales.
Changes in workers’ compensation and general liability reserves, including the current portion, are asfollows:
2010 2009 2008
(millions)
Balance, beginning of year . . . . . . . . . . . . . . . . . . . . . . . . . . . . . . . . . . . . . . . . . . . . . . . . . $ 478 $ 495 $ 471Charged to costs and expenses . . . . . . . . . . . . . . . . . . . . . . . . . . . . . . . . . . . . . . . . . . . . . . 148 124 164Payments, net of recoveries . . . . . . . . . . . . . . . . . . . . . . . . . . . . . . . . . . . . . . . . . . . . . . . . . (138) (141) (140)
Balance, end of year . . . . . . . . . . . . . . . . . . . . . . . . . . . . . . . . . . . . . . . . . . . . . . . . . . . . . . $ 488 $ 478 $ 495
The non-current portion of workers’ compensation and general liability reserves is included in otherliabilities on the Consolidated Balance Sheets. At January 29, 2011 and January 30, 2010, workers’compensation and general liability reserves included $93 million and $90 million, respectively, of liabilitieswhich are covered by deposits and receivables included in current assets on the Consolidated Balance Sheets.
10. Taxes
The Company changed its methodology for recording deferred state income taxes from a blended rate basisto a separate entity basis, and has reflected the effects of such change to 2010 and all prior periods. Even thoughthe Company considers the change to have had only an immaterial impact on its financial condition, results ofoperations and cash flows for the periods presented, the financial condition, results of operations and cash flowsfor the prior periods as previously reported have been adjusted to reflect the change.
F-25

NOTES TO CONSOLIDATED FINANCIAL STATEMENTS — (Continued)
Income tax expense (benefit) is as follows:
2010 2009 2008
Current Deferred Total Current Deferred Total Current Deferred Total
(millions)
Federal . . . . . . . . . . . . . . . . . . . $217 $234 $451 $48 $ 84 $132 $ 6 $(109) $(103)State and local . . . . . . . . . . . . . 12 10 22 9 37 46 8 (68) (60)
$229 $244 $473 $57 $121 $178 $14 $(177) $(163)
The income tax expense (benefit) reported differs from the expected tax computed by applying the federalincome tax statutory rate of 35% for 2010, 2009 and 2008 to income (loss) before income taxes. The reasons forthis difference and their tax effects are as follows:
2010 2009 2008
(millions)
Expected tax . . . . . . . . . . . . . . . . . . . . . . . . . . . . . . . . . . . . . . . . . . . . . . . . . . . . . . . . . . . . $462 $177 $(1,728)State and local income taxes, net of federal income tax benefit . . . . . . . . . . . . . . . . . . . . . 14 30 (40)Settlement of federal tax examinations . . . . . . . . . . . . . . . . . . . . . . . . . . . . . . . . . . . . . . . . – (21) –Non-deductibility of goodwill impairment charges . . . . . . . . . . . . . . . . . . . . . . . . . . . . . . – – 1,611Other . . . . . . . . . . . . . . . . . . . . . . . . . . . . . . . . . . . . . . . . . . . . . . . . . . . . . . . . . . . . . . . . . . (3) (8) (6)
$473 $178 $ (163)
During the fourth quarter of 2009, the Company settled Internal Revenue Service (“IRS”) examinations forfiscal years 2008, 2007 and 2006. As a result of the settlement, the Company recognized previously unrecognizedtax benefits and related accrued interest, primarily attributable to the disposition of former subsidiaries.
F-26

NOTES TO CONSOLIDATED FINANCIAL STATEMENTS — (Continued)
The tax effects of temporary differences that give rise to significant portions of the deferred tax assets anddeferred tax liabilities are as follows:
January 29,2011
January 30,2010
(millions)
Deferred tax assets:Post employment and postretirement benefits . . . . . . . . . . . . . . . . . . . . $ 473 $ 667Accrued liabilities accounted for on a cash basis for tax purposes . . . . 195 316Long-term debt . . . . . . . . . . . . . . . . . . . . . . . . . . . . . . . . . . . . . . . . . . . . 117 132Unrecognized state tax benefits and accrued interest . . . . . . . . . . . . . . . 91 91State operating loss carryforwards . . . . . . . . . . . . . . . . . . . . . . . . . . . . . 61 55Other . . . . . . . . . . . . . . . . . . . . . . . . . . . . . . . . . . . . . . . . . . . . . . . . . . . . 144 114Valuation allowance . . . . . . . . . . . . . . . . . . . . . . . . . . . . . . . . . . . . . . . . (35) (33)
Total deferred tax assets . . . . . . . . . . . . . . . . . . . . . . . . . . . . . . . . . 1,046 1,342
Deferred tax liabilities:Excess of book basis over tax basis of property and equipment . . . . . . (1,793) (1,919)Merchandise inventories . . . . . . . . . . . . . . . . . . . . . . . . . . . . . . . . . . . . . (483) (456)Intangible assets . . . . . . . . . . . . . . . . . . . . . . . . . . . . . . . . . . . . . . . . . . . (162) (129)Other . . . . . . . . . . . . . . . . . . . . . . . . . . . . . . . . . . . . . . . . . . . . . . . . . . . . (217) (184)
Total deferred tax liabilities . . . . . . . . . . . . . . . . . . . . . . . . . . . . . . (2,655) (2,688)
Net deferred tax liability . . . . . . . . . . . . . . . . . . . . . . . . . . . . . . . . . $(1,609) $(1,346)
The valuation allowance at January 29, 2011 and January 30, 2010 relates to net deferred tax assets for statenet operating loss carryforwards. The net change in the valuation allowance amounted to an increase of $2million for 2010 and no change for 2009.
As of January 29, 2011, the Company had no federal net operating loss carryforwards and state netoperating loss carryforwards of approximately $1,301 million, which will expire between 2011 and 2031.
F-27

NOTES TO CONSOLIDATED FINANCIAL STATEMENTS — (Continued)
A reconciliation of the beginning and ending amount of unrecognized tax benefits is as follows:
January 29,2011
January 30,2010
(millions)
Balance, beginning of period . . . . . . . . . . . . . . . . . . . . . . . . . . . . . . . . . . . . . $207 $237Additions based on tax positions related to the current year . . . . . . . . . . . . . 19 23Additions for tax positions of prior years . . . . . . . . . . . . . . . . . . . . . . . . . . . . – –Reductions for tax positions of prior years . . . . . . . . . . . . . . . . . . . . . . . . . . . (8) (34)Settlements . . . . . . . . . . . . . . . . . . . . . . . . . . . . . . . . . . . . . . . . . . . . . . . . . . . (4) (8)Statute expirations . . . . . . . . . . . . . . . . . . . . . . . . . . . . . . . . . . . . . . . . . . . . . . (9) (11)
Balance, end of period . . . . . . . . . . . . . . . . . . . . . . . . . . . . . . . . . . . . . . . . . . $205 $207
Amounts recognized in the Consolidated Balance Sheets atJanuary 29, 2011 and January 30, 2010
Other liabilities . . . . . . . . . . . . . . . . . . . . . . . . . . . . . . . . . . . . . . . . . . . . $170 $169Long-term deferred income taxes . . . . . . . . . . . . . . . . . . . . . . . . . . . . . . 24 24Current income taxes . . . . . . . . . . . . . . . . . . . . . . . . . . . . . . . . . . . . . . . 11 14
$205 $207
As of January 29, 2011 and January 30, 2010, the amount of unrecognized tax benefits, net of deferred taxassets, that, if recognized would affect the effective income tax rate, was $133 million and $135 million,respectively.
The Company classifies unrecognized tax benefits not expected to be settled within one year as otherliabilities on the Consolidated Balance Sheets.
The Company classifies federal, state and local interest and penalties not expected to be settled within oneyear as other liabilities on the Consolidated Balance Sheets and follows a policy of recognizing all interest andpenalties related to unrecognized tax benefits in income tax expense. During 2010, 2009 and 2008, the Companyrecognized charges of $5 million, $4 million and $16 million, respectively, in income tax expense for federal,state and local interest and penalties.
The Company had approximately $80 million and $78 million accrued for the payment of federal, state andlocal interest and penalties at January 29, 2011 and January 30, 2010, respectively. The accrued federal, state andlocal interest and penalties primarily relates to state tax issues and the amount of penalties paid in prior periods,and the amount of penalties accrued at January 29, 2011 and January 30, 2010 are insignificant. At January 29,2011, approximately $76 million of federal, state and local interest and penalties is included in other liabilitiesand $4 million is included in current income taxes on the Consolidated Balance Sheets.
The Company or one of its subsidiaries files income tax returns in the U.S. federal jurisdiction and variousstate and local jurisdictions. The Company is no longer subject to U.S. federal income tax examinations by taxauthorities for years before 2007. With respect to state and local jurisdictions, with limited exceptions, theCompany and its subsidiaries are no longer subject to income tax audits for years before 2000. Although theoutcome of tax audits is always uncertain, the Company believes that adequate amounts of tax, interest andpenalties have been accrued for any adjustments that are expected to result from the years still subject toexamination.
F-28
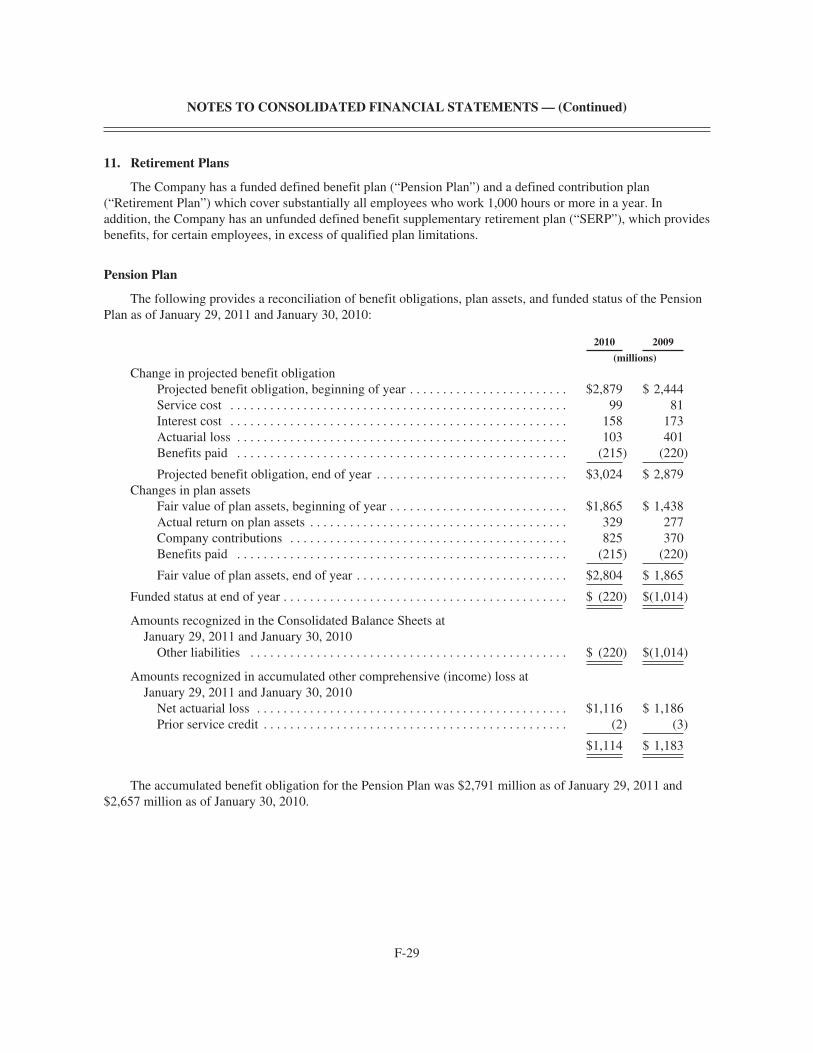
NOTES TO CONSOLIDATED FINANCIAL STATEMENTS — (Continued)
11. Retirement Plans
The Company has a funded defined benefit plan (“Pension Plan”) and a defined contribution plan(“Retirement Plan”) which cover substantially all employees who work 1,000 hours or more in a year. Inaddition, the Company has an unfunded defined benefit supplementary retirement plan (“SERP”), which providesbenefits, for certain employees, in excess of qualified plan limitations.
Pension Plan
The following provides a reconciliation of benefit obligations, plan assets, and funded status of the PensionPlan as of January 29, 2011 and January 30, 2010:
2010 2009
(millions)
Change in projected benefit obligationProjected benefit obligation, beginning of year . . . . . . . . . . . . . . . . . . . . . . . . $2,879 $ 2,444Service cost . . . . . . . . . . . . . . . . . . . . . . . . . . . . . . . . . . . . . . . . . . . . . . . . . . . 99 81Interest cost . . . . . . . . . . . . . . . . . . . . . . . . . . . . . . . . . . . . . . . . . . . . . . . . . . . 158 173Actuarial loss . . . . . . . . . . . . . . . . . . . . . . . . . . . . . . . . . . . . . . . . . . . . . . . . . . 103 401Benefits paid . . . . . . . . . . . . . . . . . . . . . . . . . . . . . . . . . . . . . . . . . . . . . . . . . . (215) (220)
Projected benefit obligation, end of year . . . . . . . . . . . . . . . . . . . . . . . . . . . . . $3,024 $ 2,879Changes in plan assets
Fair value of plan assets, beginning of year . . . . . . . . . . . . . . . . . . . . . . . . . . . $1,865 $ 1,438Actual return on plan assets . . . . . . . . . . . . . . . . . . . . . . . . . . . . . . . . . . . . . . . 329 277Company contributions . . . . . . . . . . . . . . . . . . . . . . . . . . . . . . . . . . . . . . . . . . 825 370Benefits paid . . . . . . . . . . . . . . . . . . . . . . . . . . . . . . . . . . . . . . . . . . . . . . . . . . (215) (220)
Fair value of plan assets, end of year . . . . . . . . . . . . . . . . . . . . . . . . . . . . . . . . $2,804 $ 1,865
Funded status at end of year . . . . . . . . . . . . . . . . . . . . . . . . . . . . . . . . . . . . . . . . . . . $ (220) $(1,014)
Amounts recognized in the Consolidated Balance Sheets atJanuary 29, 2011 and January 30, 2010
Other liabilities . . . . . . . . . . . . . . . . . . . . . . . . . . . . . . . . . . . . . . . . . . . . . . . . $ (220) $(1,014)
Amounts recognized in accumulated other comprehensive (income) loss atJanuary 29, 2011 and January 30, 2010
Net actuarial loss . . . . . . . . . . . . . . . . . . . . . . . . . . . . . . . . . . . . . . . . . . . . . . . $1,116 $ 1,186Prior service credit . . . . . . . . . . . . . . . . . . . . . . . . . . . . . . . . . . . . . . . . . . . . . . (2) (3)
$1,114 $ 1,183
The accumulated benefit obligation for the Pension Plan was $2,791 million as of January 29, 2011 and$2,657 million as of January 30, 2010.
F-29

NOTES TO CONSOLIDATED FINANCIAL STATEMENTS — (Continued)
Net pension costs and other amounts recognized in other comprehensive income for the Pension Planincluded the following actuarially determined components:
2010 2009 2008
(millions)
Net Periodic Pension CostService cost . . . . . . . . . . . . . . . . . . . . . . . . . . . . . . . . . . . . . . . . . . . . . . . . . . . . . . . . . $ 99 $ 81 $ 97Interest cost . . . . . . . . . . . . . . . . . . . . . . . . . . . . . . . . . . . . . . . . . . . . . . . . . . . . . . . . . 158 173 159Expected return on assets . . . . . . . . . . . . . . . . . . . . . . . . . . . . . . . . . . . . . . . . . . . . . . (218) (187) (192)Amortization of net actuarial loss . . . . . . . . . . . . . . . . . . . . . . . . . . . . . . . . . . . . . . . . 61 – 5Amortization of prior service credit . . . . . . . . . . . . . . . . . . . . . . . . . . . . . . . . . . . . . . (1) (1) –
99 66 69Other Changes in Plan Assets and Projected Benefit Obligation
Recognized in Other Comprehensive IncomeNet actuarial (gain) loss . . . . . . . . . . . . . . . . . . . . . . . . . . . . . . . . . . . . . . . . . . . . . . . (9) 311 604Amortization of net actuarial loss . . . . . . . . . . . . . . . . . . . . . . . . . . . . . . . . . . . . . . . . (61) – (5)Amortization of prior service credit . . . . . . . . . . . . . . . . . . . . . . . . . . . . . . . . . . . . . . 1 1 –
(69) 312 599
Total recognized in net periodic pension cost and other comprehensive income . . . . . . . . $ 30 $ 378 $ 668
The estimated net actuarial loss and prior service credit for the Pension Plan that will be amortized fromaccumulated other comprehensive (income) loss into net periodic benefit cost during 2011 are $84 million and$(1) million, respectively.
As permitted under ASC Subtopic 715-30, “Defined Benefit Plans – Pension,” the amortization of any priorservice cost is determined using a straight-line amortization of the cost over the average remaining service periodof employees expected to receive the benefits under the Pension Plan.
The following weighted average assumptions were used to determine the projected benefit obligations forthe Pension Plan at January 29, 2011 and January 30, 2010:
2010 2009
Discount rate . . . . . . . . . . . . . . . . . . . . . . . . . . . . . . . . . . . . . . . . . . . . . . . . . . . . . . . . . . . 5.40% 5.65%Rate of compensation increases . . . . . . . . . . . . . . . . . . . . . . . . . . . . . . . . . . . . . . . . . . . . 4.50% 4.50%
The following weighted average assumptions were used to determine the net periodic pension cost for thePension Plan:
2010 2009 2008
Discount rate . . . . . . . . . . . . . . . . . . . . . . . . . . . . . . . . . . . . . . . . . . . . . . . . . . . . . . . . . . . . . 5.65% 7.45% 6.25%Expected long-term return on plan assets . . . . . . . . . . . . . . . . . . . . . . . . . . . . . . . . . . . . . . . 8.75% 8.75% 8.75%Rate of compensation increases . . . . . . . . . . . . . . . . . . . . . . . . . . . . . . . . . . . . . . . . . . . . . . . 4.50% 5.40% 5.40%
The Pension Plan’s assumptions are evaluated annually and updated as necessary.
The discount rate used to determine the present value of the projected benefit obligation for the PensionPlan is based on a yield curve constructed from a portfolio of high quality corporate debt securities with various
F-30

NOTES TO CONSOLIDATED FINANCIAL STATEMENTS — (Continued)
maturities. Each year’s expected future benefit payments are discounted to their present value at the appropriateyield curve rate, thereby generating the overall discount rate for the projected benefit obligation.
The Company develops its expected long-term rate of return on plan asset assumption by evaluating inputfrom several professional advisors taking into account the asset allocation of the portfolio and long-term assetclass return expectations, as well as long-term inflation assumptions. Expected returns for each major asset classare considered along with their volatility and the expected correlations among them. These expectations arebased upon historical relationships as well as forecasts of how future returns may vary from historical returns.Returns by asset class and correlations among asset classes are combined using the target asset allocation toderive an expected return for the portfolio as a whole. Long-term historical returns of the portfolio are alsoconsidered. Portfolio returns are calculated net of all expenses, therefore, the Company also analyzes expectedcosts and expenses, including investment management fees, administrative expenses, Pension Benefit GuarantyCorporation premiums and other costs and expenses.
The Company develops its rate of compensation increase assumption on an age-graded basis based on recentexperience and reflects an estimate of future compensation levels taking into account general increase levels,seniority, promotions and other factors. The salary increase assumption is used to project employees’ pay infuture years and its impact on the projected benefit obligation for the Pension Plan. This assumption was revisedduring 2009 based on the completion of a third-party assumption study reflecting more recent experience.
The assets of the Pension Plan are managed by investment specialists with the primary objectives ofpayment of benefit obligations to Plan participants and an ultimate realization of investment returns over longerperiods in excess of inflation. The Company employs a total return investment approach whereby a mix ofdomestic and foreign equity securities, fixed income securities and other investments is used to maximize thelong-term return on the assets of the Pension Plan for a prudent level of risk. Risks are mitigated through theasset diversification and the use of multiple investment managers. The target allocation for plan assets iscurrently 60% equity securities, 25% debt securities, 10% real estate and 5% private equities.
The Company generally employs investment managers to specialize in a specific asset class. Thesemanagers are chosen and monitored with the assistance of professional advisors, using criteria that includeorganizational structure, investment philosophy, investment process, performance compared to marketbenchmarks and peer groups.
The Company periodically conducts an analysis of the behavior of the Pension Plan’s assets and liabilitiesunder various economic and interest rate scenarios to ensure that the long-term target asset allocation isappropriate given the liabilities.
F-31

NOTES TO CONSOLIDATED FINANCIAL STATEMENTS — (Continued)
The fair values of the Pension Plan assets as of January 29, 2011, excluding interest and dividendreceivables and pending investment purchases and sales, by asset category are as follows:
Fair Value Measurements
Total
Quoted Prices inActive Markets for
Identical Assets(Level 1)
SignificantObservable
Inputs(Level 2)
SignificantUnobservable
Inputs(Level 3)
(millions)
Cash and cash equivalents . . . . . . . . . . . . . . . . . . . . . . . . . $ 381 $ – $ 381 $ –Equity securities:
U.S. . . . . . . . . . . . . . . . . . . . . . . . . . . . . . . . . . . . . . . 814 238 576 –International . . . . . . . . . . . . . . . . . . . . . . . . . . . . . . . . 517 – 517 –
Fixed income securities:U. S. Treasury bonds . . . . . . . . . . . . . . . . . . . . . . . . . 54 – 54 –Other Government bonds . . . . . . . . . . . . . . . . . . . . . 28 – 28 –Agency backed bonds . . . . . . . . . . . . . . . . . . . . . . . . 11 – 11 –Corporate bonds . . . . . . . . . . . . . . . . . . . . . . . . . . . . . 267 – 267 –Mortgage-backed securities and forwards . . . . . . . . . 107 – 107 –Asset-backed securities . . . . . . . . . . . . . . . . . . . . . . . 19 – 19 –Pooled funds . . . . . . . . . . . . . . . . . . . . . . . . . . . . . . . 180 – 180 –
Other types of investments:Real estate . . . . . . . . . . . . . . . . . . . . . . . . . . . . . . . . . 201 – – 201Hedge funds . . . . . . . . . . . . . . . . . . . . . . . . . . . . . . . . 143 – – 143Private equity . . . . . . . . . . . . . . . . . . . . . . . . . . . . . . . 144 – – 144
Total . . . . . . . . . . . . . . . . . . . . . . . . . . . . . . . . . . . . . . . . . . $2,866 $238 $2,140 $488
F-32

NOTES TO CONSOLIDATED FINANCIAL STATEMENTS — (Continued)
The fair values of the Pension Plan assets as of January 30, 2010, excluding interest and dividendreceivables and pending investment purchases and sales, by asset category are as follows:
Fair Value Measurements
Total
Quoted Prices inActive Markets for
Identical Assets(Level 1)
SignificantObservable
Inputs(Level 2)
SignificantUnobservable
Inputs(Level 3)
(millions)
Cash and cash equivalents . . . . . . . . . . . . . . . . . . . . . . . . . $ 184 $ – $ 184 $ –Equity securities:
U.S. . . . . . . . . . . . . . . . . . . . . . . . . . . . . . . . . . . . . . . 613 163 450 –International . . . . . . . . . . . . . . . . . . . . . . . . . . . . . . . . 262 – 262 –
Fixed income securities:U. S. Treasury bonds . . . . . . . . . . . . . . . . . . . . . . . . . 41 – 41 –Other Government bonds . . . . . . . . . . . . . . . . . . . . . 11 – 11 –Agency backed bonds . . . . . . . . . . . . . . . . . . . . . . . . 15 – 15 –Corporate bonds . . . . . . . . . . . . . . . . . . . . . . . . . . . . . 91 – 91 –Mortgage-backed securities and forwards . . . . . . . . . 91 – 91 –Asset-backed securities . . . . . . . . . . . . . . . . . . . . . . . 20 – 20 –Pooled funds . . . . . . . . . . . . . . . . . . . . . . . . . . . . . . . 164 – 164 –
Other types of investments:Real estate . . . . . . . . . . . . . . . . . . . . . . . . . . . . . . . . . 156 – – 156Hedge funds . . . . . . . . . . . . . . . . . . . . . . . . . . . . . . . . 133 – – 133Private equity . . . . . . . . . . . . . . . . . . . . . . . . . . . . . . . 124 – – 124
Total . . . . . . . . . . . . . . . . . . . . . . . . . . . . . . . . . . . . . . . . . . $1,905 $163 $1,329 $413
Corporate bonds consist primarily of investment grade bonds of U.S. issuers from diverse industries.
The fair value of the real estate, hedge funds and private equity investments represents the reported net assetvalue of shares or underlying assets of the investment. Private equity and real estate investments are valued usingfair values per the most recent financial reports provided by the investment sponsor, adjusted as appropriate forany lag between the date of the financial reports and the Company’s reporting date. The real estate investmentsare diversified across property types and geographical areas primarily in the United States of America. Privateequity investments generally invest in limited partnerships in the United States of America and Europe. Thehedge fund investments are through a fund of funds approach.
Due to the nature of the underlying assets of the real estate, hedge funds and private equity investments,changes in market conditions and the economic environment may significantly impact the net asset value of theseinvestments and, consequently, the fair value of the Pension Plan’s investments. These investments areredeemable at net asset value to the extent provided in the documentation governing the investments. However,these redemption rights may be restricted in accordance with the governing documents. Redemption of theseinvestments is subject to restrictions including lock-up periods where no redemptions are allowed, restrictions onredemption frequency and advance notice periods for redemptions. As of January 29, 2011 and January 30, 2010,certain of these investments are generally subject to lock-up periods, ranging from three to fifteen years, certainof these investments are subject to restrictions on redemption frequency, ranging from daily to twice per year,and certain of these investments are subject to advance notice requirements, ranging from sixty-day notificationto ninety-day notification. As of January 29, 2011 and January 30, 2010, the Pension Plan had unfunded
F-33

NOTES TO CONSOLIDATED FINANCIAL STATEMENTS — (Continued)
commitments related to certain of these investments totaling approximately $133 million and $78 million,respectively.
The following table sets forth a summary of changes in fair value of the Pension Plan’s level 3 assets for2010 and 2009:
2010 2009
(millions)
Balance, beginning of year . . . . . . . . . . . . . . . . . . . . . . . . . . . . . . . . . . . . . . . . . . . . . . . $413 $419Actual gain (loss) on plan assets:
Relating to assets still held at the reporting date . . . . . . . . . . . . . . . . . . . . . . . . . . . 28 (13)Relating to assets sold during the period . . . . . . . . . . . . . . . . . . . . . . . . . . . . . . . . . 18 (21)
Purchases, sales, issuances and settlements, net . . . . . . . . . . . . . . . . . . . . . . . . . . . . . . . 29 28
Balance, end of year . . . . . . . . . . . . . . . . . . . . . . . . . . . . . . . . . . . . . . . . . . . . . . . . . . . . $488 $413
During 2010 and 2009, the Company made funding contributions to the Pension Plan totaling approximately$825 million and $370 million, respectively. On March 28, 2011, the Company made a voluntary fundingcontribution to the Pension Plan of $225 million. The Company does not presently anticipate making anyadditional funding contributions to the Pension Plan during 2011, but may choose to do so in its discretion.
The following benefit payments are estimated to be paid from the Pension Plan:
(millions)
Fiscal year:2011 . . . . . . . . . . . . . . . . . . . . . . . . . . . . . . . . . . . . . . . . . . . . . . . . . . . . . . . . . $ 2332012 . . . . . . . . . . . . . . . . . . . . . . . . . . . . . . . . . . . . . . . . . . . . . . . . . . . . . . . . . 2302013 . . . . . . . . . . . . . . . . . . . . . . . . . . . . . . . . . . . . . . . . . . . . . . . . . . . . . . . . . 2302014 . . . . . . . . . . . . . . . . . . . . . . . . . . . . . . . . . . . . . . . . . . . . . . . . . . . . . . . . . 2342015 . . . . . . . . . . . . . . . . . . . . . . . . . . . . . . . . . . . . . . . . . . . . . . . . . . . . . . . . . 2392016-2020 . . . . . . . . . . . . . . . . . . . . . . . . . . . . . . . . . . . . . . . . . . . . . . . . . . . . . 1,234
F-34

NOTES TO CONSOLIDATED FINANCIAL STATEMENTS — (Continued)
Supplementary Retirement Plan
The following provides a reconciliation of benefit obligations, plan assets and funded status of thesupplementary retirement plan as of January 29, 2011 and January 30, 2010:
2010 2009
(millions)
Change in projected benefit obligationProjected benefit obligation, beginning of year . . . . . . . . . . . . . . . . . . . . . . . . . . $ 680 $ 599Service cost . . . . . . . . . . . . . . . . . . . . . . . . . . . . . . . . . . . . . . . . . . . . . . . . . . . . . . 6 4Interest cost . . . . . . . . . . . . . . . . . . . . . . . . . . . . . . . . . . . . . . . . . . . . . . . . . . . . . . 37 42Actuarial loss . . . . . . . . . . . . . . . . . . . . . . . . . . . . . . . . . . . . . . . . . . . . . . . . . . . . 22 113Benefits paid . . . . . . . . . . . . . . . . . . . . . . . . . . . . . . . . . . . . . . . . . . . . . . . . . . . . . (57) (78)
Projected benefit obligation, end of year . . . . . . . . . . . . . . . . . . . . . . . . . . . . . . . $ 688 $ 680
Change in plan assetsFair value of plan assets, beginning of year . . . . . . . . . . . . . . . . . . . . . . . . . . . . . $ – $ –Company contributions . . . . . . . . . . . . . . . . . . . . . . . . . . . . . . . . . . . . . . . . . . . . . 57 78Benefits paid . . . . . . . . . . . . . . . . . . . . . . . . . . . . . . . . . . . . . . . . . . . . . . . . . . . . . (57) (78)
Fair value of plan assets, end of year . . . . . . . . . . . . . . . . . . . . . . . . . . . . . . . . . . $ – $ –
Funded status at end of year . . . . . . . . . . . . . . . . . . . . . . . . . . . . . . . . . . . . . . . . . . . . . $(688) $(680)
Amounts recognized in the Consolidated Balance Sheets atJanuary 29, 2011 and January 30, 2010
Accounts payable and accrued liabilities . . . . . . . . . . . . . . . . . . . . . . . . . . . . . . . $ (52) $ (54)Other liabilities . . . . . . . . . . . . . . . . . . . . . . . . . . . . . . . . . . . . . . . . . . . . . . . . . . . (636) (626)
$(688) $(680)
Amounts recognized in accumulated other comprehensive (income) loss atJanuary 29, 2011 and January 30, 2010
Net actuarial loss . . . . . . . . . . . . . . . . . . . . . . . . . . . . . . . . . . . . . . . . . . . . . . . . . $ 113 $ 94Prior service credit . . . . . . . . . . . . . . . . . . . . . . . . . . . . . . . . . . . . . . . . . . . . . . . . (2) (3)
$ 111 $ 91
The accumulated benefit obligation for the supplementary retirement plan was $645 million as ofJanuary 29, 2011 and $643 million as of January 30, 2010.
F-35

NOTES TO CONSOLIDATED FINANCIAL STATEMENTS — (Continued)
Net pension costs and other amounts recognized in other comprehensive income for the supplementaryretirement plan included the following actuarially determined components:
2010 2009 2008
(millions)
Net Periodic Pension CostService cost . . . . . . . . . . . . . . . . . . . . . . . . . . . . . . . . . . . . . . . . . . . . . . . . . . . . . . . . . . . . $ 6 $ 4 $ 8Interest cost . . . . . . . . . . . . . . . . . . . . . . . . . . . . . . . . . . . . . . . . . . . . . . . . . . . . . . . . . . . . 37 42 39Amortization of net actuarial loss . . . . . . . . . . . . . . . . . . . . . . . . . . . . . . . . . . . . . . . . . . . 3 – –Amortization of prior service credit . . . . . . . . . . . . . . . . . . . . . . . . . . . . . . . . . . . . . . . . . (1) (2) (2)
45 44 45Other Changes in Plan Assets and Projected Benefit Obligation
Recognized in Other Comprehensive IncomeNet actuarial (gain) loss . . . . . . . . . . . . . . . . . . . . . . . . . . . . . . . . . . . . . . . . . . . . . . . . . . . 22 113 (57)Amortization of net actuarial loss . . . . . . . . . . . . . . . . . . . . . . . . . . . . . . . . . . . . . . . . . . . (3) – –Amortization of prior service credit . . . . . . . . . . . . . . . . . . . . . . . . . . . . . . . . . . . . . . . . . 1 2 2
20 115 (55)
Total recognized in net periodic pension cost and other comprehensive income . . . . . . . . . . . $65 $159 $(10)
The estimated net actuarial loss and prior service credit for the supplementary retirement plan that will beamortized from accumulated other comprehensive (income) loss into net periodic benefit cost during 2011 are$7 million and $(1) million, respectively.
As permitted under ASC Subtopic 715-30, “Defined Benefit Plans – Pension,” the amortization of any priorservice cost is determined using a straight-line amortization of the cost over the average remaining service periodof employees expected to receive the benefits under the plans.
The following weighted average assumptions were used to determine the projected benefit obligations forthe supplementary retirement plan at January 29, 2011 and January 30, 2010:
2010 2009
Discount rate . . . . . . . . . . . . . . . . . . . . . . . . . . . . . . . . . . . . . . . . . . . . . . . . . . . . . . . . . . . 5.40% 5.65%Rate of compensation increases . . . . . . . . . . . . . . . . . . . . . . . . . . . . . . . . . . . . . . . . . . . . 4.90% 4.90%
The following weighted average assumptions were used to determine net pension costs for thesupplementary retirement plan:
2010 2009 2008
Discount rate . . . . . . . . . . . . . . . . . . . . . . . . . . . . . . . . . . . . . . . . . . . . . . . . . . . . . . . . . . . . . 5.65% 7.45% 6.25%Rate of compensation increases . . . . . . . . . . . . . . . . . . . . . . . . . . . . . . . . . . . . . . . . . . . . . . . 4.90% 7.20% 7.20%
The supplementary retirement plan’s assumptions are evaluated annually and updated as necessary.
The discount rate used to determine the present value of the projected benefit obligation for the supplementaryretirement plan is based on a yield curve constructed from a portfolio of high quality corporate debt securities withvarious maturities. Each year’s expected future benefit payments are discounted to their present value at theappropriate yield curve rate, thereby generating the overall discount rate for the projected benefit obligation.
F-36

NOTES TO CONSOLIDATED FINANCIAL STATEMENTS — (Continued)
The Company develops its rate of compensation increase assumption on an age-graded basis based on recentexperience and reflects an estimate of future compensation levels taking into account general increase levels,seniority, promotions and other factors. The salary increase assumption is used to project employees’ pay infuture years and its impact on the projected benefit obligation for the supplementary retirement plan. Thisassumption was revised during 2009 based on the completion of a third-party assumption study reflecting morerecent experience.
The following benefit payments are estimated to be funded by the Company and paid from thesupplementary retirement plan:
(millions)
Fiscal year:2011 . . . . . . . . . . . . . . . . . . . . . . . . . . . . . . . . . . . . . . . . . . . . . . . . . . . . . . . . . $ 522012 . . . . . . . . . . . . . . . . . . . . . . . . . . . . . . . . . . . . . . . . . . . . . . . . . . . . . . . . . 502013 . . . . . . . . . . . . . . . . . . . . . . . . . . . . . . . . . . . . . . . . . . . . . . . . . . . . . . . . . 502014 . . . . . . . . . . . . . . . . . . . . . . . . . . . . . . . . . . . . . . . . . . . . . . . . . . . . . . . . . 542015 . . . . . . . . . . . . . . . . . . . . . . . . . . . . . . . . . . . . . . . . . . . . . . . . . . . . . . . . . 542016-2020 . . . . . . . . . . . . . . . . . . . . . . . . . . . . . . . . . . . . . . . . . . . . . . . . . . . . . 264
Retirement Plan
The Retirement Plan includes a voluntary savings feature for eligible employees. The Company’scontribution was historically based on the Company’s annual earnings including a minimum contribution ratebased on an employee’s eligible savings and more recently based on a stated matching contribution rate based onan employee’s eligible savings. Expense for the Retirement Plan amounted to $9 million for 2010, $9 million for2009 and $37 million for 2008.
Deferred Compensation Plan
The Company has a deferred compensation plan wherein eligible executives may elect to defer a portion oftheir compensation each year as either stock credits or cash credits. The Company transfers shares to a trust tocover the number management estimates will be needed for distribution on account of stock credits currentlyoutstanding. At January 29, 2011 and January 30, 2010, the liability under the plan, which is reflected in otherliabilities on the Consolidated Balance Sheets, was $46 million and $51 million, respectively. Expense for 2010,2009 and 2008 was immaterial.
F-37

NOTES TO CONSOLIDATED FINANCIAL STATEMENTS — (Continued)
12. Postretirement Health Care and Life Insurance Benefits
In addition to pension and other supplemental benefits, certain retired employees currently are providedwith specified health care and life insurance benefits. Eligibility requirements for such benefits vary by divisionand subsidiary, but generally state that benefits are available to eligible employees who were hired prior to acertain date and retire after a certain age with specified years of service. Certain employees are subject to havingsuch benefits modified or terminated.
The following provides a reconciliation of benefit obligations, plan assets, and funded status of thepostretirement obligations as of January 29, 2011 and January 30, 2010:
2010 2009
(millions)
Change in accumulated postretirement benefit obligationAccumulated postretirement benefit obligation, beginning of year . . . . . . . . . . . $ 278 $ 277Service cost . . . . . . . . . . . . . . . . . . . . . . . . . . . . . . . . . . . . . . . . . . . . . . . . . . . . . . – –Interest cost . . . . . . . . . . . . . . . . . . . . . . . . . . . . . . . . . . . . . . . . . . . . . . . . . . . . . . 15 19Actuarial loss . . . . . . . . . . . . . . . . . . . . . . . . . . . . . . . . . . . . . . . . . . . . . . . . . . . . 8 8Medicare Part D subsidy . . . . . . . . . . . . . . . . . . . . . . . . . . . . . . . . . . . . . . . . . . . . 2 2Benefits paid . . . . . . . . . . . . . . . . . . . . . . . . . . . . . . . . . . . . . . . . . . . . . . . . . . . . . (25) (28)
Accumulated postretirement benefit obligation, end of year . . . . . . . . . . . . . . . . $ 278 $ 278Change in plan assets
Fair value of plan assets, beginning of year . . . . . . . . . . . . . . . . . . . . . . . . . . . . . $ – $ –Company contributions . . . . . . . . . . . . . . . . . . . . . . . . . . . . . . . . . . . . . . . . . . . . . 25 28Benefits paid . . . . . . . . . . . . . . . . . . . . . . . . . . . . . . . . . . . . . . . . . . . . . . . . . . . . . (25) (28)
Fair value of plan assets, end of year . . . . . . . . . . . . . . . . . . . . . . . . . . . . . . . . . . $ – $ –
Funded status at end of year . . . . . . . . . . . . . . . . . . . . . . . . . . . . . . . . . . . . . . . . . . . . . $(278) $(278)
Amounts recognized in the Consolidated Balance Sheets atJanuary 29, 2011 and January 30, 2010
Accounts payable and accrued liabilities . . . . . . . . . . . . . . . . . . . . . . . . . . . . . . . $ (30) $ (31)Other liabilities . . . . . . . . . . . . . . . . . . . . . . . . . . . . . . . . . . . . . . . . . . . . . . . . . . . (248) (247)
$(278) $(278)
Amounts recognized in accumulated other comprehensive (income) loss atJanuary 29, 2011 and January 30, 2010
Net actuarial gain . . . . . . . . . . . . . . . . . . . . . . . . . . . . . . . . . . . . . . . . . . . . . . . . . $ (25) $ (38)
F-38

NOTES TO CONSOLIDATED FINANCIAL STATEMENTS — (Continued)
Net postretirement benefit costs and other amounts recognized in other comprehensive income included thefollowing actuarially determined components:
2010 2009 2008
(millions)
Net Periodic Postretirement Benefit CostService cost . . . . . . . . . . . . . . . . . . . . . . . . . . . . . . . . . . . . . . . . . . . . . . . . . . . . . . . . . . . . . $ – $ – $ –Interest cost . . . . . . . . . . . . . . . . . . . . . . . . . . . . . . . . . . . . . . . . . . . . . . . . . . . . . . . . . . . . . 15 19 19Amortization of net actuarial gain . . . . . . . . . . . . . . . . . . . . . . . . . . . . . . . . . . . . . . . . . . . (5) (7) (3)Amortization of prior service credit . . . . . . . . . . . . . . . . . . . . . . . . . . . . . . . . . . . . . . . . . . – – –
10 12 16Other Changes in Plan Assets and Projected Benefit Obligation
Recognized in Other Comprehensive IncomeNet actuarial (gain) loss . . . . . . . . . . . . . . . . . . . . . . . . . . . . . . . . . . . . . . . . . . . . . . . . . . . 8 8 (70)Amortization of net actuarial gain . . . . . . . . . . . . . . . . . . . . . . . . . . . . . . . . . . . . . . . . . . . 5 7 3Amortization of prior service credit . . . . . . . . . . . . . . . . . . . . . . . . . . . . . . . . . . . . . . . . . . – – –
13 15 (67)
Total recognized in net periodic postretirement benefit cost and othercomprehensive income . . . . . . . . . . . . . . . . . . . . . . . . . . . . . . . . . . . . . . . . . . . . . . . . . . . . . . $23 $27 $(51)
The estimated net actuarial gain of the postretirement obligations that will be amortized from accumulatedother comprehensive (income) loss into net postretirement benefit cost during 2011 is $(3) million.
As permitted under ASC Subtopic 715-60, “Defined Benefit Plans – Other Postretirement,” the amortizationof any prior service cost is determined using a straight-line amortization of the cost over the average remainingservice period of employees expected to receive the benefits under the plans.
The following weighted average assumptions were used to determine the accumulated postretirementbenefit obligations at January 29, 2011 and January 30, 2010:
2010 2009
Discount rate . . . . . . . . . . . . . . . . . . . . . . . . . . . . . . . . . . . . . . . . . . . . . . . . . . . . . . . . . . . 5.40% 5.65%
The following weighted average assumptions were used to determine the net postretirement benefit costs forthe postretirement obligations:
2010 2009 2008
Discount rate . . . . . . . . . . . . . . . . . . . . . . . . . . . . . . . . . . . . . . . . . . . . . . . . . . . . 5.65% 7.45% 6.25%
The postretirement benefit obligation assumptions are evaluated annually and updated as necessary.
The discount rate used to determine the present value of the Company’s accumulated postretirement benefitobligations is based on a yield curve constructed from a portfolio of high quality corporate debt securities withvarious maturities. Each year’s expected future benefit payments are discounted to their present value at theappropriate yield curve rate, thereby generating the overall discount rate for the accumulated postretirementbenefit obligations.
F-39

NOTES TO CONSOLIDATED FINANCIAL STATEMENTS — (Continued)
The future medical benefits provided by the Company for certain employees are based on a fixed amountper year of service, and the accumulated postretirement benefit obligation is not affected by increases in healthcare costs. However, the future medical benefits provided by the Company for certain other employees areaffected by increases in health care costs.
In March 2010, President Obama signed into law the “Patient Protection and Affordable Care Act” and the“Health Care and Education Affordability Reconciliation Act of 2010” (the “2010 Acts”). Included among themajor provisions of these laws is a change in the tax treatment related to the Medicare Part D subsidy. TheCompany’s postretirement obligations reflect estimated federal subsidies expected to be received under theMedicare Prescription Drug, Improvement and Modernization Act of 2003. Under the 2010 Acts, the Company’sdeductions for retiree prescription drug benefits will be reduced by the amount of Medicare Part D subsidiesreceived beginning February 3, 2013. During 2010, the Company recorded a $4 million deferred tax expense toreduce its deferred tax asset as a result of the elimination of the deductibility of retiree health care payments tothe extent of tax-free Medicare Part D subsidies that are received.
Based on data currently available, the Company is not able at this time to determine the ongoing impact thatthe other provisions of the 2010 Acts will have on the Company-sponsored medical plans. As a result of thislegislation, the Company is evaluating the impact of the 2010 Acts on the active and retiree benefit plans offeredby the Company. The provisions of the 2010 Act did not require a re-measurement of the Company’spostretirement obligations and did not impact the postretirement net periodic benefit costs for 2010.
The following provides the assumed health care cost trend rates related to the Company’s accumulatedpostretirement benefit obligations at January 29, 2011 and January 30, 2010:
2010 2009
Health care cost trend rates assumed for next year . . . . . . . . . . 8.38% – 10.08% 8.69% – 10.54%Rates to which the cost trend rate is assumed to decline
(the ultimate trend rate) . . . . . . . . . . . . . . . . . . . . . . . . . . . . . 5.0% 5.0%Year that the rate reaches the ultimate trend rate . . . . . . . . . . . 2022 2022
The assumed health care cost trend rates have a significant effect on the amounts reported for theaccumulated postretirement benefit obligations. A one-percentage-point change in the assumed health care costtrend rates would have the following effects:
1 – PercentagePoint Increase
1 – PercentagePoint Decrease
(millions)
Effect on total of service and interest cost . . . . . . . . . . . . . . . . . . . . . . . $ 1 $ (1)Effect on accumulated postretirement benefit obligations . . . . . . . . . . . $15 $(14)
F-40
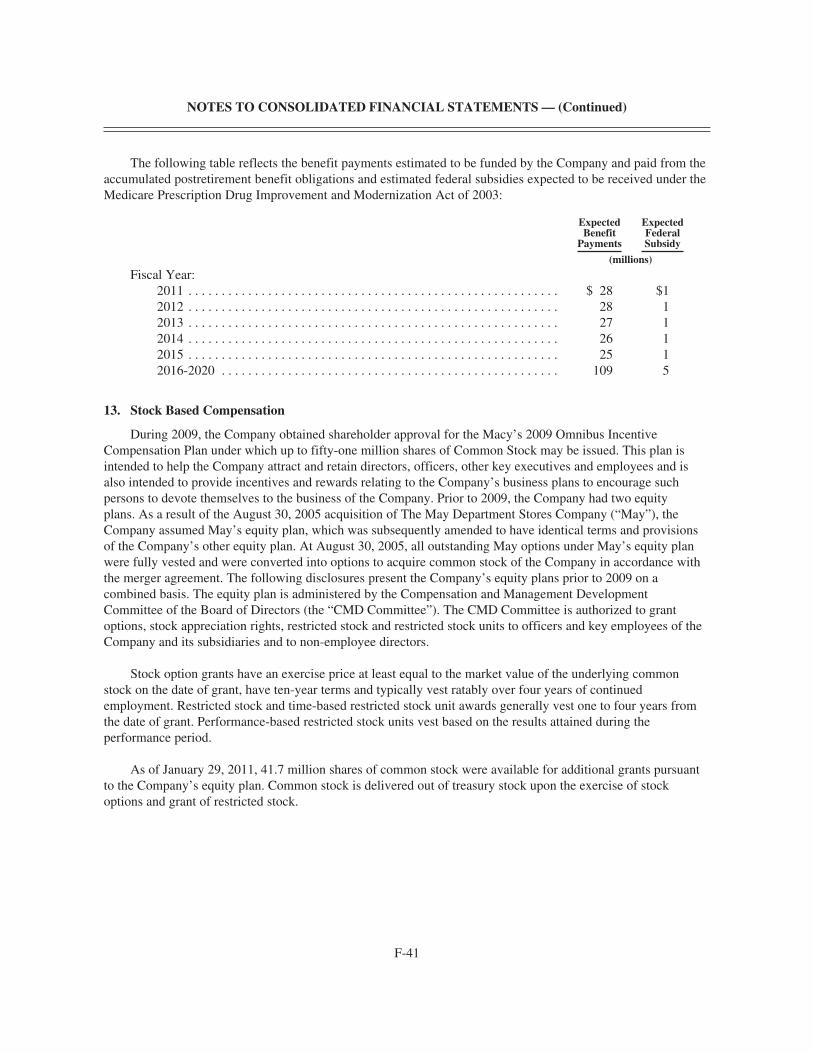
NOTES TO CONSOLIDATED FINANCIAL STATEMENTS — (Continued)
The following table reflects the benefit payments estimated to be funded by the Company and paid from theaccumulated postretirement benefit obligations and estimated federal subsidies expected to be received under theMedicare Prescription Drug Improvement and Modernization Act of 2003:
ExpectedBenefit
Payments
ExpectedFederalSubsidy
(millions)
Fiscal Year:2011 . . . . . . . . . . . . . . . . . . . . . . . . . . . . . . . . . . . . . . . . . . . . . . . . . . . . . . . . $ 28 $12012 . . . . . . . . . . . . . . . . . . . . . . . . . . . . . . . . . . . . . . . . . . . . . . . . . . . . . . . . 28 12013 . . . . . . . . . . . . . . . . . . . . . . . . . . . . . . . . . . . . . . . . . . . . . . . . . . . . . . . . 27 12014 . . . . . . . . . . . . . . . . . . . . . . . . . . . . . . . . . . . . . . . . . . . . . . . . . . . . . . . . 26 12015 . . . . . . . . . . . . . . . . . . . . . . . . . . . . . . . . . . . . . . . . . . . . . . . . . . . . . . . . 25 12016-2020 . . . . . . . . . . . . . . . . . . . . . . . . . . . . . . . . . . . . . . . . . . . . . . . . . . . 109 5
13. Stock Based Compensation
During 2009, the Company obtained shareholder approval for the Macy’s 2009 Omnibus IncentiveCompensation Plan under which up to fifty-one million shares of Common Stock may be issued. This plan isintended to help the Company attract and retain directors, officers, other key executives and employees and isalso intended to provide incentives and rewards relating to the Company’s business plans to encourage suchpersons to devote themselves to the business of the Company. Prior to 2009, the Company had two equityplans. As a result of the August 30, 2005 acquisition of The May Department Stores Company (“May”), theCompany assumed May’s equity plan, which was subsequently amended to have identical terms and provisionsof the Company’s other equity plan. At August 30, 2005, all outstanding May options under May’s equity planwere fully vested and were converted into options to acquire common stock of the Company in accordance withthe merger agreement. The following disclosures present the Company’s equity plans prior to 2009 on acombined basis. The equity plan is administered by the Compensation and Management DevelopmentCommittee of the Board of Directors (the “CMD Committee”). The CMD Committee is authorized to grantoptions, stock appreciation rights, restricted stock and restricted stock units to officers and key employees of theCompany and its subsidiaries and to non-employee directors.
Stock option grants have an exercise price at least equal to the market value of the underlying commonstock on the date of grant, have ten-year terms and typically vest ratably over four years of continuedemployment. Restricted stock and time-based restricted stock unit awards generally vest one to four years fromthe date of grant. Performance-based restricted stock units vest based on the results attained during theperformance period.
As of January 29, 2011, 41.7 million shares of common stock were available for additional grants pursuantto the Company’s equity plan. Common stock is delivered out of treasury stock upon the exercise of stockoptions and grant of restricted stock.
F-41

NOTES TO CONSOLIDATED FINANCIAL STATEMENTS — (Continued)
Stock-based compensation expense included the following components:
2010 2009 2008
(millions)
Stock options . . . . . . . . . . . . . . . . . . . . . . . . . . . . . . . . . . . . . . . . . . . . . . . . . . . . . $34 $43 $ 55Stock credits . . . . . . . . . . . . . . . . . . . . . . . . . . . . . . . . . . . . . . . . . . . . . . . . . . . . . 19 26 (18)Restricted stock . . . . . . . . . . . . . . . . . . . . . . . . . . . . . . . . . . . . . . . . . . . . . . . . . . . 2 3 6Restricted stock units . . . . . . . . . . . . . . . . . . . . . . . . . . . . . . . . . . . . . . . . . . . . . . 11 4 –
$66 $76 $ 43
All stock-based compensation expense is recorded in SG&A expense in the Consolidated Statements ofOperations. Stock-based compensation expense for 2008 included a credit, reflecting a decrease in the stock priceused to calculate the settlement amount of stock credits. The income tax benefit recognized in the ConsolidatedStatements of Operations related to stock-based compensation was approximately $24 million, approximately$28 million, and approximately $16 million, for 2010, 2009 and 2008, respectively.
During 2010, the CMD Committee approved awards of performance-based restricted stock units to certainsenior executives of the Company. Each award reflects a target number of shares (“Target Shares”) that may beissued to the award recipient. These awards may be earned upon the completion of a three-year performanceperiod ending February 2, 2013. Whether units are earned at the end of the performance period will bedetermined based on the achievement of certain performance objectives set by the CMD Committee inconnection with the issuance of the units. The performance objectives are based on the Company’s business plancovering the performance period and include an EBITDA as a percent to sales ratio and a return on investedcapital ratio. Depending on the results achieved during the three-year performance period, the actual number ofshares that a grant recipient receives at the end of the period may range from 0% to 150% of the Target Sharesgranted.
Also during 2010, the CMD Committee approved awards of time-based restricted stock to certain seniorexecutives of the Company and awards of time-based restricted stock units to the non-employee members of theCompany’s board of directors.
During 2009, the CMD Committee approved awards of performance-based restricted stock units to certainsenior executives of the Company (the “Founders Awards”). The Founders Awards may be earned upon thecompletion of a three-year performance period ending January 28, 2012. Whether units are earned at the end ofthe performance period will be determined based on the achievement of relative total shareholder return (“TSR”)performance objectives set by the CMD Committee in connection with the issuance of the units. Relative TSRreflects the change in the value of the Company’s common stock over the performance period in relation to thechange in the value of the common stock of a ten-company executive compensation peer group over theperformance period, assuming the reinvestment of dividends. If the Company’s TSR for the performance periodis equal to or less than the median TSR for the peer group, the entire Founders Award opportunity will beforfeited. If the Company’s TSR for the performance period is above the median but equal to or below the 66th
percentile for the peer group, 75% of the award opportunity will vest. If the Company’s TSR for the performanceperiod is above the 66th percentile for the peer group, 100% of the award opportunity will vest.
F-42

NOTES TO CONSOLIDATED FINANCIAL STATEMENTS — (Continued)
The fair value of stock-options granted during 2010, 2009 and 2008 and the weighted average assumptionsused to estimate the fair value are as follows:
2010 2009 2008
Weighted average grant date fair value of stock options grantedduring the period . . . . . . . . . . . . . . . . . . . . . . . . . . . . . . . . . . . . . . . . . . . $ 7.34 $ 2.51 $ 7.42
Dividend yield . . . . . . . . . . . . . . . . . . . . . . . . . . . . . . . . . . . . . . . . . . . . . . . 1.0% 2.3% 2.2%Expected volatility . . . . . . . . . . . . . . . . . . . . . . . . . . . . . . . . . . . . . . . . . . . . 37.6% 36.4% 36.2%Risk-free interest rate . . . . . . . . . . . . . . . . . . . . . . . . . . . . . . . . . . . . . . . . . 2.7% 1.9% 2.7%Expected life . . . . . . . . . . . . . . . . . . . . . . . . . . . . . . . . . . . . . . . . . . . . . . . . 5.5 years 5.4 years 5.3 years
The fair value of each stock option grant is estimated on the date of grant using the Black-Scholes option-pricing model. The Company estimates the expected volatility and expected option life assumption consistentwith ASC Topic 718, “Compensation – Stock Compensation.” The expected volatility of the Company’scommon stock at the date of grant is estimated based on a historic volatility rate and the expected option life iscalculated based on historical stock option experience as the best estimate of future exercise patterns. Thedividend yield assumption is based on historical and anticipated dividend payouts. The risk-free interest rateassumption is based on observed interest rates consistent with the expected life of each stock option grant. TheCompany uses historical data to estimate pre-vesting option forfeitures and records stock-based compensationexpense only for those awards that are expected to vest. Compensation expense is recorded for all stock optionsexpected to vest based on the amortization of the fair value at the date of grant on a straight-line basis primarilyover the vesting period of the options.
Stock option activity for 2010 is as follows:
Shares
WeightedAverageExercise
Price
WeightedAverage
RemainingContractual
Life
AggregateIntrinsic
Value
(thousands) (years) (millions)
Outstanding, beginning of period . . . . . . . . . . . . . . . . . . . . . . . . . . 38,804.9 $25.47Granted . . . . . . . . . . . . . . . . . . . . . . . . . . . . . . . . . . . . . . . . . . . . . . 3,908.6 $20.88Canceled or forfeited . . . . . . . . . . . . . . . . . . . . . . . . . . . . . . . . . . . (2,285.2) $24.46Exercised . . . . . . . . . . . . . . . . . . . . . . . . . . . . . . . . . . . . . . . . . . . . . (2,327.0) $16.70
Outstanding, end of period . . . . . . . . . . . . . . . . . . . . . . . . . . . . . . . 38,101.3 $25.59
Exercisable, end of period . . . . . . . . . . . . . . . . . . . . . . . . . . . . . . . 26,404.5 $27.92 4.0 $(130)
Options expected to vest . . . . . . . . . . . . . . . . . . . . . . . . . . . . . . . . . 10,293.1 $20.35 8.0 $ 27
Additional information relating to stock options is as follows:
2010 2009 2008
(millions)
Intrinsic value of options exercised . . . . . . . . . . . . . . . . . . . . . . . . . . . . . . . . . . . . . . . . . . . . . . . $13 $ 2 $ 1Grant date fair value of stock options that vested during the year . . . . . . . . . . . . . . . . . . . . . . . . 55 71 65Cash received from stock options exercised . . . . . . . . . . . . . . . . . . . . . . . . . . . . . . . . . . . . . . . . 39 8 6Tax benefits realized from exercised stock options and vested restricted stock . . . . . . . . . . . . . 4 – –
F-43

NOTES TO CONSOLIDATED FINANCIAL STATEMENTS — (Continued)
The Company also has a stock credit plan. In 2006, key management personnel became eligible to earn astock credit grant over a two-year performance period ending February 2, 2008. There were a total of 727,629stock credit awards outstanding as of January 29, 2011, including reinvested dividend equivalents earned duringthe holding period, relating to the 2006 grant. In general, with respect to the stock credits awarded to participantsin 2006, the value of one-half of the stock credits earned plus reinvested dividend equivalents was paid in cash inearly 2010 and the value of the other half of such earned stock credits plus reinvested dividend equivalents waspaid in cash in early 2011. In 2008, key management personnel became eligible to earn a stock credit grant over atwo-year performance period ending January 30, 2010. There were a total of 1,690,716 stock credit awardsoutstanding as of January 29, 2011, relating to the 2008 grant. In general, with respect to the stock creditsawarded to participants in 2008, the value of one-half of the stock credits earned plus reinvested dividendequivalents will be paid in cash in early 2012 and the value of the other half of such earned stock credits plusreinvested dividend equivalents will be paid in cash in early 2013. Compensation expense for stock credit awardsis recorded on a straight-line basis primarily over the vesting period and is calculated based on the ending stockprice for each reporting period. At January 29, 2011 and January 30, 2010, the liability under the stock creditplans, which is reflected in other liabilities on the Consolidated Balance Sheets, was $52 million and $45 million,respectively.
Activity related to stock credits for 2010 is as follows:
Shares
Stock credits, beginning of period . . . . . . . . . . . . . . . . . . . . . . . . . . . . . . . . . . . . . . . . . . . . 3,267,355Additional dividend equivalents earned . . . . . . . . . . . . . . . . . . . . . . . . . . . . . . . . . . . . . . . . 22,339Stock credits forfeited . . . . . . . . . . . . . . . . . . . . . . . . . . . . . . . . . . . . . . . . . . . . . . . . . . . . . . (145,404)Stock credits distributed . . . . . . . . . . . . . . . . . . . . . . . . . . . . . . . . . . . . . . . . . . . . . . . . . . . . (725,945)
Stock credits, end of period . . . . . . . . . . . . . . . . . . . . . . . . . . . . . . . . . . . . . . . . . . . . . . . . . . 2,418,345
The weighted average grant date fair value of restricted stock and restricted stock units granted during 2010,2009 and 2008 are as follows:
2010 2009 2008
Restricted stock . . . . . . . . . . . . . . . . . . . . . . . . . . . . . . . . . . . . . . . . . . . . . . . . . . . . . . . . $20.89 $ – $24.85Restricted stock units . . . . . . . . . . . . . . . . . . . . . . . . . . . . . . . . . . . . . . . . . . . . . . . . . . . . $20.95 $3.59 $ –
The fair value of the Target Shares and restricted stock awards are based on the fair value of the underlyingshares on the date of grant. The fair value of the Founders Award was determined using a Monte Carlosimulation analysis to estimate the total shareholder return ranking of the Company among a ten-companyexecutive compensation peer group over the remaining performance period. The expected volatility of theCompany’s common stock at the date of grant was estimated based on a historical average volatility rate for theapproximate three-year performance period. The dividend yield assumption was based on historical andanticipated dividend payouts. The risk-free interest rate assumption was based on observed interest ratesconsistent with the approximate three-year performance measurement period.
Compensation expense is recorded for all restricted stock and restricted stock unit awards based on theamortization of the fair market value at the date of grant over the period the restrictions lapse or over theperformance period of the performance-based restricted stock units.
F-44

NOTES TO CONSOLIDATED FINANCIAL STATEMENTS — (Continued)
Restricted stock award activity for 2010 is as follows:
Shares
WeightedAverage
Grant DateFair Value
Nonvested, beginning of period . . . . . . . . . . . . . . . . . . . . . . . . . . . . . . . . . . . . . 179,056 $33.66Granted . . . . . . . . . . . . . . . . . . . . . . . . . . . . . . . . . . . . . . . . . . . . . . . . . . . . . . . . 148,366 20.89Forfeited . . . . . . . . . . . . . . . . . . . . . . . . . . . . . . . . . . . . . . . . . . . . . . . . . . . . . . . (17,782) 23.78Vested . . . . . . . . . . . . . . . . . . . . . . . . . . . . . . . . . . . . . . . . . . . . . . . . . . . . . . . . (59,594) 26.55
Nonvested, end of period . . . . . . . . . . . . . . . . . . . . . . . . . . . . . . . . . . . . . . . . . . 250,046 $28.48
Activity related to restricted stock units for 2010 is as follows:
Shares
WeightedAverage
Grant DateFair Value
Nonvested, beginning of period . . . . . . . . . . . . . . . . . . . . . . . . . . . . . . . . . . . 2,886,975 $ 3.59Granted – performance-based . . . . . . . . . . . . . . . . . . . . . . . . . . . . . . . . . . . . . 1,046,602 20.89Granted – time-based . . . . . . . . . . . . . . . . . . . . . . . . . . . . . . . . . . . . . . . . . . . 39,924 22.54Forfeited . . . . . . . . . . . . . . . . . . . . . . . . . . . . . . . . . . . . . . . . . . . . . . . . . . . . . (184,867) 3.59Vested . . . . . . . . . . . . . . . . . . . . . . . . . . . . . . . . . . . . . . . . . . . . . . . . . . . . . . . – –
Nonvested, end of period . . . . . . . . . . . . . . . . . . . . . . . . . . . . . . . . . . . . . . . . 3,788,634 $ 8.57
There have been no grants of stock appreciation rights under the equity plans.
As of January 29, 2011, the Company had $38 million of unrecognized compensation costs related tononvested stock options, which is expected to be recognized over a weighted average period of approximately1.7 years, $2 million of unrecognized compensation costs related to nonvested restricted stock, which is expectedto be recognized over a weighted average period of approximately 1.6 years, and $19 million of unrecognizedcompensation costs related to nonvested restricted stock units, which is expected to be recognized over aweighted average period of approximately 1.4 years.
14. Shareholders’ Equity
The authorized shares of the Company consist of 125 million shares of preferred stock (“Preferred Stock”),par value of $.01 per share, with no shares issued, and 1,000 million shares of Common Stock, par value of $.01per share, with 495.0 million shares of Common Stock issued and 423.3 million shares of Common Stockoutstanding at January 29, 2011, and with 495.0 million shares of Common Stock issued and 420.8 million sharesof Common Stock outstanding at January 30, 2010 (with shares held in the Company’s treasury being treated asissued, but not outstanding).
Commencing in January 2000, the Company’s board of directors has from time to time approvedauthorizations to purchase, in the aggregate, up to $9,500 million of Common Stock. All authorizations arecumulative and do not have an expiration date. As of January 29, 2011, $852 million of authorization remainedunused. Although the Company’s share repurchase program is currently suspended and the Company has notmade any purchases of Common Stock since February 1, 2008 and currently does not intend to make any such
F-45

NOTES TO CONSOLIDATED FINANCIAL STATEMENTS — (Continued)
purchases in 2011, it may resume purchases of Common Stock under these or possible future authorizations inthe open market, in privately negotiated transactions or otherwise at any time and from time to time without priornotice.
Common Stock
The holders of the Common Stock are entitled to one vote for each share held of record on all matterssubmitted to a vote of shareholders. Subject to preferential rights that may be applicable to any Preferred Stock,holders of Common Stock are entitled to receive ratably such dividends as may be declared by the Board ofDirectors in its discretion, out of funds legally available therefor.
Treasury Stock
Treasury stock contains shares repurchased under the share repurchase program, shares repurchased to coveremployee tax liabilities related to stock plan activity and shares maintained in a trust related to deferredcompensation plans. Under the deferred compensation plans, shares are maintained in a trust to cover the numberestimated to be needed for distribution on account of stock credits currently outstanding.
Changes in the Company’s Common Stock issued and outstanding, including shares held by the Company’streasury, are as follows:
CommonStockIssued
Treasury Stock
CommonStock
Outstanding
DeferredCompensation
Plans Other Total
(thousands)
Balance at February 2, 2008 . . . . . . . . . . . . . . . 495,038.5 (1,218.1) (74,075.4) (75,293.5) 419,745.0Stock issued under stock plans . . . . . . . . . . . . . (157.6) 464.1 306.5 306.5Stock repurchases:
Repurchase program . . . . . . . . . . . . . . . . . – –Other . . . . . . . . . . . . . . . . . . . . . . . . . . . . . (25.7) (25.7) (25.7)
Deferred compensation plan distributions . . . . . 58.0 58.0 58.0
Balance at January 31, 2009 . . . . . . . . . . . . . . . 495,038.5 (1,317.7) (73,637.0) (74,954.7) 420,083.8Stock issued under stock plans . . . . . . . . . . . . . (105.0) 937.9 832.9 832.9Stock repurchases:
Repurchase program . . . . . . . . . . . . . . . . . – –Other . . . . . . . . . . . . . . . . . . . . . . . . . . . . . (130.1) (130.1) (130.1)
Deferred compensation plan distributions . . . . . 56.6 56.6 56.6
Balance at January 30, 2010 . . . . . . . . . . . . . . . 495,038.5 (1,366.1) (72,829.2) (74,195.3) 420,843.2Stock issued under stock plans . . . . . . . . . . . . . (48.8) 2,439.5 2,390.7 2,390.7Stock repurchases:
Repurchase program . . . . . . . . . . . . . . . . . – –Other . . . . . . . . . . . . . . . . . . . . . . . . . . . . . (58.5) (58.5) (58.5)
Deferred compensation plan distributions . . . . . 165.9 165.9 165.9
Balance at January 29, 2011 . . . . . . . . . . . . . . . 495,038.5 (1,249.0) (70,448.2) (71,697.2) 423,341.3
F-46

NOTES TO CONSOLIDATED FINANCIAL STATEMENTS — (Continued)
15. Fair Value Measurements and Concentrations of Credit Risk
The following table shows the Company’s financial assets that are required to be measured at fair value on arecurring basis:
January 29, 2011 January 30, 2010
Total
Fair Value Measurements
Total
Fair Value Measurements
Quoted Pricesin Active
Markets forIdentical Assets
(Level 1)
SignificantObservable
Inputs(Level 2)
SignificantUnobservable
Inputs(Level 3)
Quoted Pricesin Active
Markets forIdentical Assets
(Level 1)
SignificantObservable
Inputs(Level 2)
SignificantUnobservable
Inputs(Level 3)
(millions)
Marketable equity anddebt securities . . . . $95 $41 $54 $ – $99 $33 $66 $ –
On February 25, 2011, the Company sold its investment in The Knot, Inc. and unrecognized gains inaccumulated other comprehensive income were reclassified into the Consolidated Statements of Operations.
Other financial instruments not measured at fair value on a recurring basis include cash and cashequivalents, receivables, short-term debt, merchandise accounts payable, accounts payable and accrued liabilitiesand long-term debt. With the exception of long-term debt, the carrying amount approximates fair value becauseof the short maturity of these instruments. The fair values of long-term debt, excluding capitalized leases, areestimated based on the quoted market prices for publicly traded debt or by using discounted cash flow analyses,based on the Company’s current incremental borrowing rates for similar types of borrowing arrangements.
The following table shows the estimated fair value of the Company’s long-term debt:
January 29, 2011 January 30, 2010
NotionalAmount
CarryingAmount
FairValue
NotionalAmount
CarryingAmount
FairValue
(millions)
Long-term debt . . . . . . . . . . . . . . . . . . . . . . . . . . . . . . . $6,702 $6,941 $6,969 $8,156 $8,431 $7,946
The following table shows certain of the Company’s non-financial assets that were measured at fair value ona nonrecurring basis during 2010 and 2009:
January 29, 2011 January 30, 2010
Total
Fair Value Measurements
Total
Fair Value Measurements
Quoted Pricesin Active
Markets forIdentical Assets
(Level 1)
SignificantObservable
Inputs(Level 2)
SignificantUnobservable
Inputs(Level 3)
Quoted Pricesin Active
Markets forIdentical Assets
(Level 1)
SignificantObservable
Inputs(Level 2)
SignificantUnobservable
Inputs(Level 3)
(millions)
Long-lived assets heldand used . . . . . . . . . $18 $ – $ – $18 $33 $ – $ – $33
During 2010, long-lived assets held and used with a carrying value of $36 million were written down totheir fair value of $18 million, resulting in an asset impairment charge of $18 million. During 2009, long-livedassets held and used with a carrying value of $148 million were written down to their fair value of $33 million,resulting in an asset impairment charge of $115 million. The fair values of these locations were calculated based
F-47

NOTES TO CONSOLIDATED FINANCIAL STATEMENTS — (Continued)
on the projected cash flows and an estimated risk-adjusted rate of return that would be used by marketparticipants in valuing these assets or prices of similar assets.
Financial instruments that potentially subject the Company to concentrations of credit risk consistprincipally of temporary cash investments. The Company places its temporary cash investments in what itbelieves to be high credit quality financial instruments.
16. Earnings (Loss) Per Share
The following table sets forth the computation of basic and diluted earnings (loss) per share:
2010 2009 2008
NetIncome Shares
NetIncome Shares
NetLoss Shares
(millions, except per share data)
Net income (loss) and averagenumber of shares outstanding . . . $847 422.2 $329 420.4 $(4,775) 420.0
Shares to be issued under deferredcompensation plans . . . . . . . . . . . 1.1 1.3 1.2
$847 423.3 $329 421.7 $(4,775) 421.2Basic earnings (loss) per
share . . . . . . . . . . . . . . . . . . $2.00 $.78 $(11.34)
Effect of dilutive securities –Stock options, restricted stock
and restricted stock units . . 4.0 1.5 –
$847 427.3 $329 423.2 $(4,775) 421.2Diluted earnings (loss) per
share . . . . . . . . . . . . . . . . . . $1.98 $.78 $(11.34)
In addition to the stock options, restricted stock and restricted stock units reflected in the foregoing table,stock options to purchase 24.8 million shares of common stock and restricted stock units relating to 260,000shares of common stock were outstanding at January 29, 2011 and stock options to purchase 28.9 million sharesof common stock, 75,000 shares of restricted stock and restricted stock units relating to 2.9 million shares ofcommon stock were outstanding at January 30, 2010 but were not included in the computation of diluted earningsper share for 2010 and 2009, respectively, because their inclusion would have been antidilutive.
Stock options to purchase 38.8 million of shares of common stock and 483,000 shares of restricted stockwere outstanding at January 31, 2009, but were not included in the computation of diluted loss per share for 2008because, as a result of the Company’s net loss for the fiscal year, their inclusion would have been antidilutive.
F-48
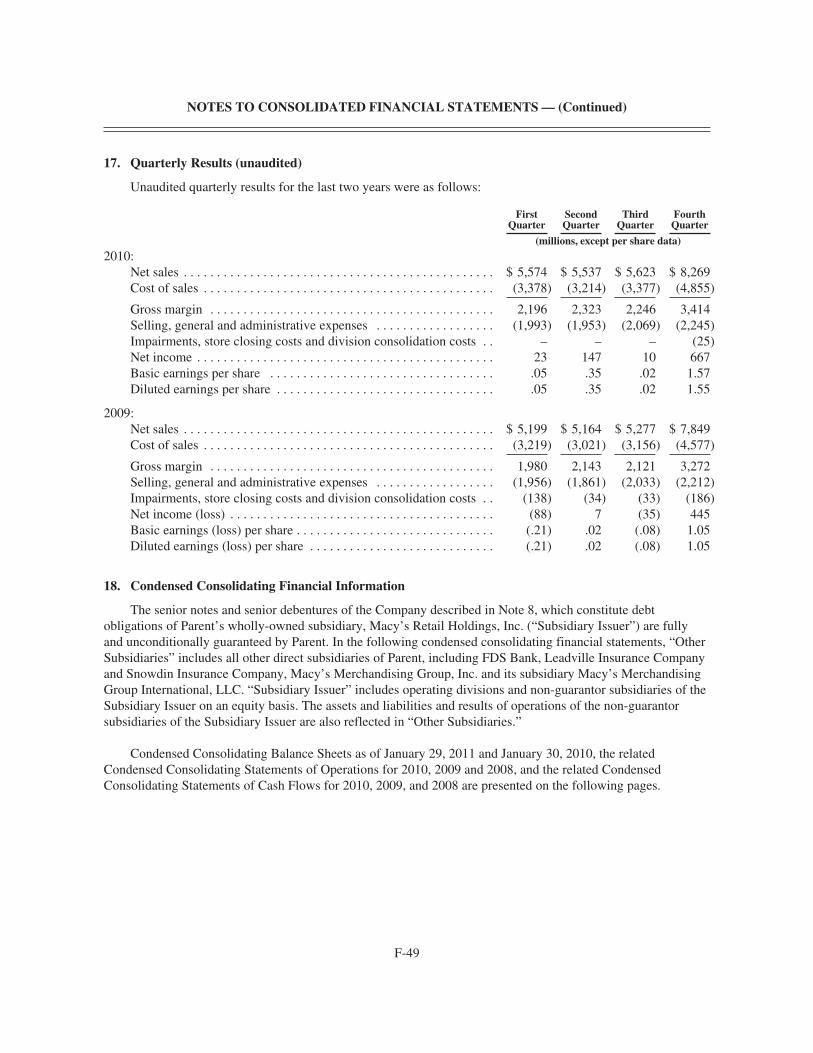
NOTES TO CONSOLIDATED FINANCIAL STATEMENTS — (Continued)
17. Quarterly Results (unaudited)
Unaudited quarterly results for the last two years were as follows:
FirstQuarter
SecondQuarter
ThirdQuarter
FourthQuarter
(millions, except per share data)
2010:Net sales . . . . . . . . . . . . . . . . . . . . . . . . . . . . . . . . . . . . . . . . . . . . . . . $ 5,574 $ 5,537 $ 5,623 $ 8,269Cost of sales . . . . . . . . . . . . . . . . . . . . . . . . . . . . . . . . . . . . . . . . . . . . (3,378) (3,214) (3,377) (4,855)
Gross margin . . . . . . . . . . . . . . . . . . . . . . . . . . . . . . . . . . . . . . . . . . . 2,196 2,323 2,246 3,414Selling, general and administrative expenses . . . . . . . . . . . . . . . . . . (1,993) (1,953) (2,069) (2,245)Impairments, store closing costs and division consolidation costs . . – – – (25)Net income . . . . . . . . . . . . . . . . . . . . . . . . . . . . . . . . . . . . . . . . . . . . . 23 147 10 667Basic earnings per share . . . . . . . . . . . . . . . . . . . . . . . . . . . . . . . . . . .05 .35 .02 1.57Diluted earnings per share . . . . . . . . . . . . . . . . . . . . . . . . . . . . . . . . . .05 .35 .02 1.55
2009:Net sales . . . . . . . . . . . . . . . . . . . . . . . . . . . . . . . . . . . . . . . . . . . . . . . $ 5,199 $ 5,164 $ 5,277 $ 7,849Cost of sales . . . . . . . . . . . . . . . . . . . . . . . . . . . . . . . . . . . . . . . . . . . . (3,219) (3,021) (3,156) (4,577)
Gross margin . . . . . . . . . . . . . . . . . . . . . . . . . . . . . . . . . . . . . . . . . . . 1,980 2,143 2,121 3,272Selling, general and administrative expenses . . . . . . . . . . . . . . . . . . (1,956) (1,861) (2,033) (2,212)Impairments, store closing costs and division consolidation costs . . (138) (34) (33) (186)Net income (loss) . . . . . . . . . . . . . . . . . . . . . . . . . . . . . . . . . . . . . . . . (88) 7 (35) 445Basic earnings (loss) per share . . . . . . . . . . . . . . . . . . . . . . . . . . . . . . (.21) .02 (.08) 1.05Diluted earnings (loss) per share . . . . . . . . . . . . . . . . . . . . . . . . . . . . (.21) .02 (.08) 1.05
18. Condensed Consolidating Financial Information
The senior notes and senior debentures of the Company described in Note 8, which constitute debtobligations of Parent’s wholly-owned subsidiary, Macy’s Retail Holdings, Inc. (“Subsidiary Issuer”) are fullyand unconditionally guaranteed by Parent. In the following condensed consolidating financial statements, “OtherSubsidiaries” includes all other direct subsidiaries of Parent, including FDS Bank, Leadville Insurance Companyand Snowdin Insurance Company, Macy’s Merchandising Group, Inc. and its subsidiary Macy’s MerchandisingGroup International, LLC. “Subsidiary Issuer” includes operating divisions and non-guarantor subsidiaries of theSubsidiary Issuer on an equity basis. The assets and liabilities and results of operations of the non-guarantorsubsidiaries of the Subsidiary Issuer are also reflected in “Other Subsidiaries.”
Condensed Consolidating Balance Sheets as of January 29, 2011 and January 30, 2010, the relatedCondensed Consolidating Statements of Operations for 2010, 2009 and 2008, and the related CondensedConsolidating Statements of Cash Flows for 2010, 2009, and 2008 are presented on the following pages.
F-49

NOTES TO CONSOLIDATED FINANCIAL STATEMENTS — (Continued)
MACY’S, INC.
Condensed Consolidating Balance SheetAs of January 29, 2011
(millions)
ParentSubsidiary
IssuerOther
SubsidiariesConsolidatingAdjustments Consolidated
ASSETS:Current Assets:
Cash and cash equivalents . . . . . . . . . . . . . . . $1,174 $ 41 $ 249 $ – $ 1,464Receivables . . . . . . . . . . . . . . . . . . . . . . . . . . – 89 303 – 392Merchandise inventories . . . . . . . . . . . . . . . . – 2,589 2,169 – 4,758Prepaid expenses and other current assets . . . – 98 187 – 285Income taxes . . . . . . . . . . . . . . . . . . . . . . . . . – – – – –Deferred income tax assets . . . . . . . . . . . . . . – – – – –
Total Current Assets . . . . . . . . . . . . . . . 1,174 2,817 2,908 – 6,899Property and Equipment – net . . . . . . . . . . . . . . . . – 5,013 3,800 – 8,813Goodwill . . . . . . . . . . . . . . . . . . . . . . . . . . . . . . . . – 3,315 428 – 3,743Other Intangible Assets – net . . . . . . . . . . . . . . . . . – 184 453 – 637Other Assets . . . . . . . . . . . . . . . . . . . . . . . . . . . . . . 4 133 402 – 539Deferred Income Tax Assets . . . . . . . . . . . . . . . . . 19 – – (19) –Intercompany Receivable . . . . . . . . . . . . . . . . . . . 1,651 – 2,738 (4,389) –Investment in Subsidiaries . . . . . . . . . . . . . . . . . . . 2,908 2,598 – (5,506) –
Total Assets . . . . . . . . . . . . . . . . . . . . . . $5,756 $14,060 $10,729 $(9,914) $20,631
LIABILITIES AND SHAREHOLDERS’ EQUITY:Current Liabilities:
Short-term debt . . . . . . . . . . . . . . . . . . . . . . . $ – $ 451 $ 3 $ – $ 454Merchandise accounts payable . . . . . . . . . . . – 680 741 – 1,421Accounts payable and accrued liabilities . . . . 144 1,069 1,431 – 2,644Income taxes . . . . . . . . . . . . . . . . . . . . . . . . . 29 18 135 – 182Deferred income taxes . . . . . . . . . . . . . . . . . . – 285 79 – 364
Total Current Liabilities . . . . . . . . . . . . . 173 2,503 2,389 – 5,065Long-Term Debt . . . . . . . . . . . . . . . . . . . . . . . . . . – 6,942 29 – 6,971Intercompany Payable . . . . . . . . . . . . . . . . . . . . . . – 4,389 – (4,389) –Deferred Income Taxes . . . . . . . . . . . . . . . . . . . . . – 400 864 (19) 1,245Other Liabilities . . . . . . . . . . . . . . . . . . . . . . . . . . . 53 748 1,019 – 1,820Shareholders’ Equity (Deficit) . . . . . . . . . . . . . . . . 5,530 (922) 6,428 (5,506) 5,530
Total Liabilities andShareholders’ Equity . . . . . . . . . . . . . $5,756 $14,060 $10,729 $(9,914) $20,631
F-50

NOTES TO CONSOLIDATED FINANCIAL STATEMENTS — (Continued)
MACY’S, INC.
Condensed Consolidating Statement of OperationsFor 2010(millions)
ParentSubsidiary
IssuerOther
SubsidiariesConsolidatingAdjustments Consolidated
Net sales . . . . . . . . . . . . . . . . . . . . . . . . . . . . . . . . . . $ – $13,124 $ 19,900 $(8,021) $ 25,003Cost of sales . . . . . . . . . . . . . . . . . . . . . . . . . . . . . . . – (8,006) (14,782) 7,964 (14,824)
Gross margin . . . . . . . . . . . . . . . . . . . . . . . . . . . . . . . – 5,118 5,118 (57) 10,179Selling, general and administrative expenses . . . . . . (8) (4,519) (3,790) 57 (8,260)Impairments, store closing costs and division
consolidation costs . . . . . . . . . . . . . . . . . . . . . . . . – (21) (4) – (25)
Operating income (loss) . . . . . . . . . . . . . . . . . . . . . . (8) 578 1,324 – 1,894
Interest (expense) income, net:External . . . . . . . . . . . . . . . . . . . . . . . . . . . . . . . 2 (575) (1) – (574)Intercompany . . . . . . . . . . . . . . . . . . . . . . . . . . (2) (165) 167 – –
Equity in earnings of subsidiaries . . . . . . . . . . . . . . . 852 417 – (1,269) –
Income before income taxes . . . . . . . . . . . . . . . . . . . 844 255 1,490 (1,269) 1,320Federal, state and local income tax benefit
(expense) . . . . . . . . . . . . . . . . . . . . . . . . . . . . . . . . 3 65 (541) – (473)
Net income . . . . . . . . . . . . . . . . . . . . . . . . . . . . . . . . $847 $ 320 $ 949 $(1,269) $ 847
F-51

NOTES TO CONSOLIDATED FINANCIAL STATEMENTS — (Continued)
MACY’S, INC.
Condensed Consolidating Statement of Cash FlowsFor 2010(millions)
ParentSubsidiary
IssuerOther
SubsidiariesConsolidatingAdjustments Consolidated
Cash flows from operating activities:Net income . . . . . . . . . . . . . . . . . . . . . . . . . . . $ 847 $ 320 $ 949 $(1,269) $ 847Impairments, store closing costs and
division consolidation costs . . . . . . . . . . . . – 21 4 – 25Equity in earnings of subsidiaries . . . . . . . . . . (852) (417) – 1,269 –Dividends received from subsidiaries . . . . . . . 541 250 – (791) –Depreciation and amortization . . . . . . . . . . . . – 566 584 – 1,150(Increase) decrease in working capital . . . . . . 179 (454) 232 – (43)Other, net . . . . . . . . . . . . . . . . . . . . . . . . . . . . . 8 (526) 45 – (473)
Net cash provided (used) byoperating activities . . . . . . . . . . . . . . . 723 (240) 1,814 (791) 1,506
Cash flows from investing activities:Purchase of property and equipment and
capitalized software, net . . . . . . . . . . . . . . . – (178) (247) – (425)Other, net . . . . . . . . . . . . . . . . . . . . . . . . . . . . . – – (40) – (40)
Net cash used by investing activities . . . – (178) (287) – (465)
Cash flows from financing activities:Debt repaid . . . . . . . . . . . . . . . . . . . . . . . . . . . – (1,242) (3) – (1,245)Dividends paid . . . . . . . . . . . . . . . . . . . . . . . . (84) – (791) 791 (84)Issuance of common stock, net of common
stock acquired . . . . . . . . . . . . . . . . . . . . . . . 42 – – – 42Intercompany activity, net . . . . . . . . . . . . . . . . (710) 1,656 (946) – –Other, net . . . . . . . . . . . . . . . . . . . . . . . . . . . . . (115) (15) 154 – 24
Net cash provided (used) byfinancing activities . . . . . . . . . . . . . . . (867) 399 (1,586) 791 (1,263)
Net decrease in cash and cash equivalents . . . . . . . (144) (19) (59) – (222)Cash and cash equivalents at
beginning of period . . . . . . . . . . . . . . . . . . . . . . . 1,318 60 308 – 1,686
Cash and cash equivalents at end of period . . . . . . $1,174 $ 41 $ 249 $ – $ 1,464
F-52

NOTES TO CONSOLIDATED FINANCIAL STATEMENTS — (Continued)
MACY’S, INC.
Condensed Consolidating Balance SheetAs of January 30, 2010
(millions)
ParentSubsidiary
IssuerOther
SubsidiariesConsolidatingAdjustments Consolidated
ASSETS:Current Assets:
Cash and cash equivalents . . . . . . . . . . . . . . . $1,318 $ 60 $ 308 $ – $ 1,686Receivables . . . . . . . . . . . . . . . . . . . . . . . . . . – 82 276 – 358Merchandise inventories . . . . . . . . . . . . . . . . – 2,536 2,079 – 4,615Prepaid expenses and other current assets . . . – 98 125 – 223Income taxes . . . . . . . . . . . . . . . . . . . . . . . . . 7 – – (7) –Deferred income tax assets . . . . . . . . . . . . . . – – 54 (54) –
Total Current Assets . . . . . . . . . . . . . . . 1,325 2,776 2,842 (61) 6,882Property and Equipment – net . . . . . . . . . . . . . . . . – 5,383 4,124 – 9,507Goodwill . . . . . . . . . . . . . . . . . . . . . . . . . . . . . . . . – 3,315 428 – 3,743Other Intangible Assets – net . . . . . . . . . . . . . . . . . – 217 461 – 678Other Assets . . . . . . . . . . . . . . . . . . . . . . . . . . . . . . 4 123 363 – 490Deferred Income Tax Assets . . . . . . . . . . . . . . . . . 113 – – (113) –Intercompany Receivable . . . . . . . . . . . . . . . . . . . 895 – 2,185 (3,080) –Investment in Subsidiaries . . . . . . . . . . . . . . . . . . . 2,574 2,790 – (5,364) –
Total Assets . . . . . . . . . . . . . . . . . . . . . . $4,911 $14,604 $10,403 $(8,618) $21,300
LIABILITIES AND SHAREHOLDERS’ EQUITY:Current Liabilities:
Short-term debt . . . . . . . . . . . . . . . . . . . . . . . $ – $ 239 $ 3 $ – $ 242Merchandise accounts payable . . . . . . . . . . . – 637 675 – 1,312Accounts payable and accrued liabilities . . . . 117 1,529 980 – 2,626Income taxes . . . . . . . . . . . . . . . . . . . . . . . . . – 4 71 (7) 68Deferred income taxes . . . . . . . . . . . . . . . . . . 93 175 – (54) 214
Total Current Liabilities . . . . . . . . . . . . . 210 2,584 1,729 (61) 4,462Long-Term Debt . . . . . . . . . . . . . . . . . . . . . . . . . . – 8,432 24 – 8,456Intercompany Payable . . . . . . . . . . . . . . . . . . . . . . – 3,080 – (3,080) –Deferred Income Taxes . . . . . . . . . . . . . . . . . . . . . – 635 610 (113) 1,132Other Liabilities . . . . . . . . . . . . . . . . . . . . . . . . . . . 48 1,137 1,412 – 2,597Shareholders’ Equity (Deficit) . . . . . . . . . . . . . . . . 4,653 (1,264) 6,628 (5,364) 4,653
Total Liabilities andShareholders’ Equity . . . . . . . . . . . . . $4,911 $14,604 $10,403 $(8,618) $21,300
F-53

NOTES TO CONSOLIDATED FINANCIAL STATEMENTS — (Continued)
MACY’S, INC.
Condensed Consolidating Statement of OperationsFor 2009(millions)
ParentSubsidiary
IssuerOther
SubsidiariesConsolidatingAdjustments Consolidated
Net sales . . . . . . . . . . . . . . . . . . . . . . . . . . . . . . . . . . . $ – $12,791 $ 16,700 $(6,002) $ 23,489Cost of sales . . . . . . . . . . . . . . . . . . . . . . . . . . . . . . . . – (7,836) (12,073) 5,936 (13,973)
Gross margin . . . . . . . . . . . . . . . . . . . . . . . . . . . . . . . – 4,955 4,627 (66) 9,516Selling, general and administrative expenses . . . . . . (8) (4,616) (3,504) 66 (8,062)Impairments, store closing costs and division
consolidation costs. . . . . . . . . . . . . . . . . . . . . . . . . – (226) (165) – (391)
Operating income (loss) . . . . . . . . . . . . . . . . . . . . . . . (8) 113 958 – 1,063Interest (expense) income, net:
External . . . . . . . . . . . . . . . . . . . . . . . . . . . . . . . 3 (558) (1) – (556)Intercompany . . . . . . . . . . . . . . . . . . . . . . . . . . . (2) (153) 155 – –
Equity in earnings of subsidiaries . . . . . . . . . . . . . . . 333 201 – (534) –
Income (loss) before income taxes . . . . . . . . . . . . . . 326 (397) 1,112 (534) 507Federal, state and local income tax benefit
(expense) . . . . . . . . . . . . . . . . . . . . . . . . . . . . . . . . 3 232 (413) – (178)
Net income (loss) . . . . . . . . . . . . . . . . . . . . . . . . . . . . $329 $ (165) $ 699 $ (534) $ 329
F-54

NOTES TO CONSOLIDATED FINANCIAL STATEMENTS — (Continued)
MACY’S, INC.
Condensed Consolidating Statement of Cash FlowsFor 2009(millions)
ParentSubsidiary
IssuerOther
SubsidiariesConsolidatingAdjustments Consolidated
Cash flows from operating activities:Net income (loss) . . . . . . . . . . . . . . . . . . . . . . . $ 329 $(165) $ 699 $(534) $ 329Impairments, store closing costs and
division consolidation costs . . . . . . . . . . . . . – 226 165 – 391Equity in earnings of subsidiaries . . . . . . . . . . (333) (201) – 534 –Dividends received from subsidiaries . . . . . . . 436 60 – (496) –Depreciation and amortization . . . . . . . . . . . . . – 619 591 – 1,210(Increase) decrease in working capital . . . . . . . 114 163 (245) – 32Other, net . . . . . . . . . . . . . . . . . . . . . . . . . . . . . 73 (96) (189) – (212)
Net cash provided byoperating activities . . . . . . . . . . . . . . . . 619 606 1,021 (496) 1,750
Cash flows from investing activities:Purchase of property and equipment and
capitalized software, net . . . . . . . . . . . . . . . – (147) (227) – (374)Other, net . . . . . . . . . . . . . . . . . . . . . . . . . . . . . – – (3) – (3)
Net cash used by investing activities . . . . – (147) (230) – (377)
Cash flows from financing activities:Debt repaid . . . . . . . . . . . . . . . . . . . . . . . . . . . . – (963) (3) – (966)Dividends paid . . . . . . . . . . . . . . . . . . . . . . . . . (84) – (496) 496 (84)Issuance of common stock, net of common
stock acquired . . . . . . . . . . . . . . . . . . . . . . . 7 – – – 7Intercompany activity, net . . . . . . . . . . . . . . . . (247) 493 (246) – –Other, net . . . . . . . . . . . . . . . . . . . . . . . . . . . . . (24) 3 (8) – (29)
Net cash used by financing activities . . . . (348) (467) (753) 496 (1,072)
Net increase (decrease) in cash andcash equivalents . . . . . . . . . . . . . . . . . . . . . . . . . . 271 (8) 38 – 301
Cash and cash equivalents atbeginning of period . . . . . . . . . . . . . . . . . . . . . . . 1,047 68 270 – 1,385
Cash and cash equivalents at end of period . . . . . . . $1,318 $ 60 $ 308 $ – $ 1,686
F-55

NOTES TO CONSOLIDATED FINANCIAL STATEMENTS — (Continued)
MACY’S, INC.
Condensed Consolidating Statement of OperationsFor 2008(millions)
ParentSubsidiary
IssuerOther
SubsidiariesConsolidatingAdjustments Consolidated
Net sales . . . . . . . . . . . . . . . . . . . . . . . . . . . . . . . . . $ – $13,540 $13,755 $(2,403) $ 24,892Cost of sales . . . . . . . . . . . . . . . . . . . . . . . . . . . . . . – (8,528) (8,812) 2,331 (15,009)
Gross margin . . . . . . . . . . . . . . . . . . . . . . . . . . . . . . – 5,012 4,943 (72) 9,883Selling, general and administrative expenses . . . . . (5) (4,747) (3,801) 72 (8,481)Impairments, store closing costs and division
consolidation costs . . . . . . . . . . . . . . . . . . . . . . . – (224) (174) – (398)Goodwill impairment charges . . . . . . . . . . . . . . . . – (3,243) (2,139) – (5,382)
Operating loss . . . . . . . . . . . . . . . . . . . . . . . . . . . . . (5) (3,202) (1,171) – (4,378)Interest (expense) income, net:
External . . . . . . . . . . . . . . . . . . . . . . . . . . . . . . 20 (583) 3 – (560)Intercompany . . . . . . . . . . . . . . . . . . . . . . . . . (5) (130) 135 – –
Equity in losses of subsidiaries . . . . . . . . . . . . . . . . (4,781) (1,880) – 6,661 –
Loss before income taxes . . . . . . . . . . . . . . . . . . . . (4,771) (5,795) (1,033) 6,661 (4,938)Federal, state and local income tax benefit
(expense) . . . . . . . . . . . . . . . . . . . . . . . . . . . . . . . (4) 560 (393) – 163
Net loss . . . . . . . . . . . . . . . . . . . . . . . . . . . . . . . . . . $(4,775) $ (5,235) $ (1,426) $ 6,661 $ (4,775)
F-56

NOTES TO CONSOLIDATED FINANCIAL STATEMENTS — (Continued)
MACY’S, INC.
Condensed Consolidating Statement of Cash FlowsFor 2008(millions)
ParentSubsidiary
IssuerOther
SubsidiariesConsolidatingAdjustments Consolidated
Cash flows from operating activities:Net loss . . . . . . . . . . . . . . . . . . . . . . . . . . . . . . $(4,775) $(5,235) $(1,426) $ 6,661 $(4,775)Impairments, store closing costs and
division consolidation costs . . . . . . . . . . . . – 224 174 – 398Goodwill impairment charges . . . . . . . . . . . . – 3,243 2,139 – 5,382Equity in losses of subsidiaries . . . . . . . . . . . . 4,781 1,880 – (6,661) –Dividends received from subsidiaries . . . . . . 800 45 – (845) –Depreciation and amortization . . . . . . . . . . . . – 689 589 – 1,278(Increase) decrease in working capital . . . . . . (35) 174 (320) – (181)Other, net . . . . . . . . . . . . . . . . . . . . . . . . . . . . (94) (617) 475 – (236)
Net cash provided byoperating activities . . . . . . . . . . . . . . . 677 403 1,631 (845) 1,866
Cash flows from investing activities:Purchase of property and equipment and
capitalized software, net . . . . . . . . . . . . . . . – (224) (567) – (791)Other, net . . . . . . . . . . . . . . . . . . . . . . . . . . . . – – (1) – (1)
Net cash used by investing activities . . . – (224) (568) – (792)
Cash flows from financing activities:Debt repaid, net of debt issued . . . . . . . . . . . . – (13) (3) – (16)Dividends paid . . . . . . . . . . . . . . . . . . . . . . . . (221) (245) (600) 845 (221)Issuance of common stock, net of common
stock acquired . . . . . . . . . . . . . . . . . . . . . . . 6 – – – 6Intercompany activity, net . . . . . . . . . . . . . . . 332 104 (436) – –Other, net . . . . . . . . . . . . . . . . . . . . . . . . . . . . (82) (32) (20) – (134)
Net cash provided (used) byfinancing activities . . . . . . . . . . . . . . . 35 (186) (1,059) 845 (365)
Net increase (decrease) in cash andcash equivalents . . . . . . . . . . . . . . . . . . . . . . . . . 712 (7) 4 – 709
Cash and cash equivalents atbeginning of period . . . . . . . . . . . . . . . . . . . . . . . 335 75 266 – 676
Cash and cash equivalents at end of period . . . . . . $ 1,047 $ 68 $ 270 $ – $ 1,385
F-57

[THIS PAGE INTENTIONALLY LEFT BLANK]

[THIS PAGE INTENTIONALLY LEFT BLANK]

[THIS PAGE INTENTIONALLY LEFT BLANK]

At Macy’s, Inc., we believe that contributing to a more sustainable environment is good business practice and the right thing to do for future generations. We also believe in taking a comprehensive approach to sustainability and renewability with our customers, associates and vendor partners.
We have made significant progress and have taken dozens of tangible steps to reduce our impact on the environment. In part, we have:
SUSTAINABILITY AT MACY’S, INC.
• Reduce our energy consumption on a kWh per square foot basis by another 8 percent to 10 percent by 2013 (compared with 2009 levels), recognizing that we have already reduced our energy consumption by about 19 percent over the previous seven years (2003 to 2009).
• Host an additional 15 percent to 25 percent of renewable energy sources by 2013.
• Reduce the amount of paper we use by at least 10 percent by 2013 (from 2009 levels). This is on top
of a reduction of 23 percent in the 2007 to 2009 period.
• Increase the percentage of recycled (10 percent PCW or higher) and/or third-party certified paper we use in marketing materials to 70 percent by 2013 from 63 percent in 2009 (up from 3 percent in 2006).
• Increase the use of sustainable building materials in all major construction projects by 20 percent (over 2010 levels).
Macy’s has been recognized by ForestEthics for reducing mailings and overall paper consumption, as well as for increased use of recycled and certified paper. The EPA has rated Macy’s as one of its top 20 partners for generating the most green electricity on site. And Newsweek ranked Macy’s among the top 150 greenest companies in America for its efforts with solar power, recycled paper and eco-friendly merchandise.
We know we have more to learn and more to do in reducing our overall impact on the environment. We want Macy’s, Inc. to be a leader in the global effort to improve our climate and we are moving forward with conviction.
TANGIBLE SuSTAINABILITy GoALS
Building on progress over the past several years, Macy’s, Inc. has set sustainability goals to guide our progress through 2013. Specifically, Macy’s, Inc. will seek to:
• Installed active solar power systems at about 40 Macy’s and Bloomingdale’s stores and facilities. When a new 3.5-megawatt high-efficiency solar power system goes into service in spring 2011 on the company’s Goodyear, AZ, online fulfillment center, it will be the largest rooftop solar power system in the United States.
• Invested in energy efficiency projects and consumption reduction initiatives that reduced our total energy use by 23 percent in the period 2002 to 2010.
• Decreased our use of office/copy paper by 36 percent and paper used in marketing by 14 percent in the period 2007 to 2010.
• Increased to 90 percent the proportion of recycled or certified paper used in our marketing materials, to 80 percent in our shopping bags, and to 89 percent in gift boxes.
• Installed more than 130,000 LED light bulbs in 2010 to cut energy consumption by up to 73 percent in 95 Macy’s stores in 2010, with continued rollout planned for 2011.
• Initiated recycling programs that diverted more than 66 tons of waste in 2010 from our stores, offices and distribution centers away from dumping in landfills.
• Created an internal website, Green Living, so our 160,000+ associates can interact with the company on sustainability-related topics at work and home.
• Substituted biodegradable packing materials in place of foam “peanuts” in shipping products bought by customers online.
• Eliminated the use of bottled water for internal meetings in Macy’s offices.
• Initiated a two-year process for eliminating foam packaging (cups, bowls, plates, to-go containers) in the company’s in-store restaurants.
• Pioneered efforts to reduce the number of empty trucks on the nation’s highways through a coordinated program called Empty Miles Service that matches empty trucks/trailers with other shippers or carriers that can use the space.
PAGE 3
macysannual2010_08.indd 3 3/22/11 12:07 AM
creo

Board of directors
stephen f. BollenbachNon-Executive Chairman of the Board of DirectorsKB Home
deirdre P. connellyPresident, North American PharmaceuticalsGlaxoSmithKline
Meyer feldbergDean Emeritus and Professor of Leadership and EthicsColumbia Business School
sara LevinsonFormer Chairman and Chief Executive OfficerClubMom, Inc.
terry J. LundgrenChairman, President and Chief Executive OfficerMacy’s, Inc.
Joseph NeubauerChairman and Chief Executive OfficerARAMARK Holdings Corporation
Joseph a. PichlerFormer Chairman The Kroger Company
Joyce M. rochéFormer President and Chief Executive OfficerGirls Incorporated
craig e. WeatherupFormer Chief Executive OfficerThe Pepsi-Cola Company
Marna c. WhittingtonChief Executive OfficerAllianz Global Investors Capital
executive MaNageMeNt teaM
terry J. LundgrenChairman, President and Chief Executive Officer
timothy M. adamsChief Private Brand Officer
thomas L. coleChief Administrative Officer
Mark s. cosbyPresident – Stores
Jeffrey gennetteChief Merchandising Officer
Julie greinerChief Merchandise Planning Officer
Karen M. HoguetChief Financial Officer
ronald KleinChief Stores Officer
Peter sachseChief Marketing Officer
Michael gouldChairman and Chief Executive Officer, Bloomingdale’s
Janet e. groveVice Chair
otHer Macy’s, iNc. corPorate officers
Joel a. BelskyController
dennis J. BroderickGeneral Counsel and Secretary
david W. clarkHuman Resources and Diversity
amy HansonProperty Development, Credit and Customer Services
robert B. HarrisonFinance
William L. Hawthorne iiiDiversity Strategies and Legal Affairs
Bradley r. MaysTax
James a. sluzewskiCorporate Communications and External Affairs
ann Munson steinesDeputy General Counsel and Assistant Secretary
felicia WilliamsRisk Management and Financial Services
shirley H. yoshidaInternal Audit
Michael ZornAssociate and Labor Relations
macysannual2010_08.indd 4 3/22/11 12:08 AM

Shareholder InformatIon
TO REACH US
www.macysinc.com/ir Sign up to have Macy’s, Inc.’s news releases sent to you via e-mail by subscribing to News Direct.
Get the latest stock price and chart, or take advantage of the historical price look-up feature.
CALL:
Macy’s, Inc. Investor Relations Department Monday-Friday, 8:30 a.m. – 5 p.m. (ET) 1-513-579-7028
Macy’s, Inc. News & Information Request Hotline: 1-800-261-5385
WRITE:
Macy’s, Inc. Investor Relations Department 7 West Seventh Street Cincinnati, OH 45202
VISIt US on the Internet:
www.macysinc.com
www.macys.com
www.macysJOBS.com
www.bloomingdales.com
www.bloomingdalesJOBS.com
TRANSFER AGENT FOR MACY’S, INC. SHARES
Macy’s, Inc. c/o BNY Mellon Shareowner Services P.O. Box 358015 Pittsburgh, PA 15252-8015 1-866-337-3311 (Inside the United States and Canada)
1-201-680-6578 (Outside the United States and Canada)
For the hearing impaired 1-800-231-5469 (TDD)
www.bnymellon.com/shareowner/equityaccess
macysannual2010_08.indd 5 3/22/11 12:21 AM
creo

www.macysinc.com www.macys.com www.bloomingdales.com
macysannual2010_08.indd 3 3/22/11 2:04 PM
creo