Deutsche Bank screenshow template
27
Deutsche Bank Investor Day, Frankfurt, 12 September 2012 Corporate Banking & Securities Colin Fan & Robert Rankin, Co-Heads of CB&S
Transcript of Deutsche Bank screenshow template
Deutsche Bank
Investor Day, Frankfurt, 12 September 2012
Corporate Banking & Securities Colin Fan & Robert Rankin, Co-Heads of CB&S

financial transparency. Colin Fan & Robert Rankin Investor Day, Frankfurt, 12 September 2012
Deutsche Bank Investor Relations
CB&S overview
Where we are today
The journey to 2015
The business in 2015
— Challenging market conditions – outlook remains uncertain — CB&S is a leading investment banking franchise — DB well placed to consolidate success in new environment
— Reaffirming client centricity — Fully committed to cultural change — Focus, scale and efficiency driving sustainable, attractive returns
— Top 3 global investment bank — EUR 1.9 bn cost savings by 2015; cost/income ratio of <65% — Post-tax RoE of ~15%, Basel 3 fully loaded(1)
1
(1) Excludes non-core operations and reflects reassignment of management responsibilities for asset-gathering business and changes to the allocation of coverage costs between CB&S and GTB

financial transparency. Colin Fan & Robert Rankin Investor Day, Frankfurt, 12 September 2012
Deutsche Bank Investor Relations
50
150
250
350
450
2007 2008 2009 2010 2011 2012
Challenging and uncertain macro environment
2
1.4 1.2
1.5 1.1
0.5
2.6
5.6
EM
Ø 2004-11 Ø 2012-15e
7.0
GDP growth, in % Central bank assets, June 2007 normalised to 100
ECB
Fed
BoE
Domestic debt outstanding, % of GDP
250
300
350
400
450
500
550
600
Europe
US
UK
2000 2004 2008 2012
Germany
Source: GDP growth: IMF World Economic Outlook (2004-2011), DB Research (2012-2015e), Bloomberg, ECB, DB Research, Haver Analytics
Lower global growth Unprecedented policy stimulus Need for deleveraging

financial transparency. Colin Fan & Robert Rankin Investor Day, Frankfurt, 12 September 2012
Deutsche Bank Investor Relations
Revenue pools to remain subdued with modest medium-term upside
Note: All volume data shown in EUR m value terms. (1) Announced M&A volumes (2) Secondary margins based on Deutsche Bank data Source: Thomson Financial, CLS, World Federation of Exchanges, Deutsche Bank
Primary volumes Secondary volumes
Margins(2) Asset valuations
1Q 10 1Q 11 1Q 12
FX Credit Equity
1Q 07 2Q 12
S&P 500 EURO STOXX 50
DCM M&A(1) ECM FX Equities
2010 2011 2012F 2010 2011 2012F
Outlook Outlook
Outlook Outlook — DCM expected to re-
main robust, particu-larly if low rates persist
— M&A activity expected to hold up as corpo-rates draw on cash balances
— ECM will remain sub-dued until investor confidence returns
— Activity to remain strong in some fixed income markets (e.g. FX)
— Equities volumes may trend higher in medium term when global recovery takes hold
— Margins have trended lower as market volatility declined
— Consolidation and capital pressure ex-pected to pull margins up (offset somewhat by regulatory change)
— Equity market valuations currently reflecting relative economic outlook in US and Europe
— Asset valuations potential to recover as sovereign risk recedes
3
-4%
-8% -31% +30% -16%

financial transparency. Colin Fan & Robert Rankin Investor Day, Frankfurt, 12 September 2012
Deutsche Bank Investor Relations
iTraxx Main spreads in bp (indexed) CHF EUR exchange rate
Policymaker action dictating asset valuations
Credit asset prices
Policy measures distorting asset prices
Event-driven markets
Idiosyncratic risk events
Market characteristics
LTRO intervention
Currencies
Swiss central bank explicit rate
peg
S&P 500
Equity markets Sovereign spreads
Quantitative Easing II
Spain 2 year bond yields Draghi “Whatever
it takes”
4
Source: Bloomberg
Jan 2012 May 2012 Nov 2010 Aug 2012
Jan 2012 Aug 2012 Jan 2010 Dec 2011

financial transparency. Colin Fan & Robert Rankin Investor Day, Frankfurt, 12 September 2012
Deutsche Bank Investor Relations
The market environment will drive increased consolidation and polarization – DB is a likely winner
30%
35%
~40%
Pre-crisis (2004-2006)
Post-crisis (2009-2011)
Post 2015
Continued market consolidation Investment banking top 3 revenue share(1)
Bar-belling of competitive landscape 2011 returns vs. market share for Deutsche Bank and peers(2)
# Top 3 market shares Low High
Low
High
Projected movement 2012-2015
Indicative
RoE
5
(1) Revenues adjusted for fair value gains, brokerage and other one-offs, excludes banking and other products. Peer set includes Barclays, Bear Stearns, BNP, BoA, Citi, CS, GS, JPM, Lehman, ML, MS, Nomura, RBS, SocGen and UBS
(2) Top 3 rankings counted for each product and major region (Americas, Europe, Asia ex Japan, Japan). Products include a wide range of fixed income, equities and corporate finance products. Rankings generally on the basis of client market share, penetration or fees. Total of 73 markets analyzed
Source: Greenwich Associates, Coalition Development, Euromoney, Dealogic, Deutsche Bank estimates
financial transparency. Colin Fan & Robert Rankin Investor Day, Frankfurt, 12 September 2012
Deutsche Bank Investor Relations
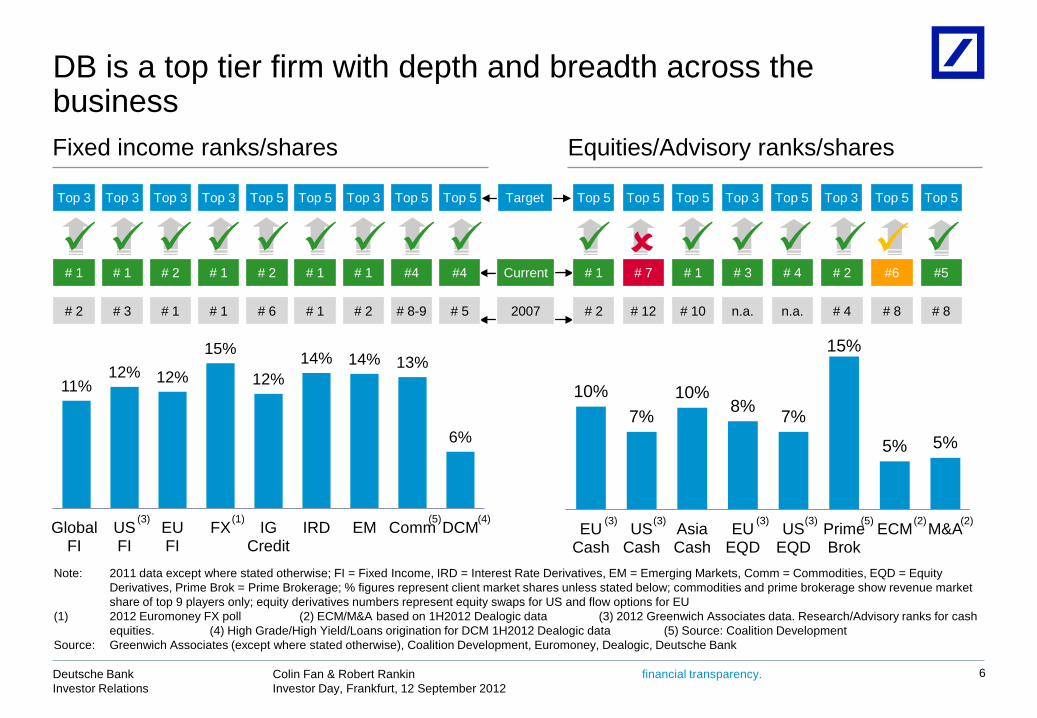
DB is a top tier firm with depth and breadth across the business
6
10% 7%
10% 8% 7%
15%
5% 5%
EU Cash
US Cash
Asia Cash
EU EQD
US EQD
Prime Brok
ECM M&A
11% 12% 12%
15%
12% 14% 14% 13%
6%
Global FI
US FI
EU FI
FX IG Credit
IRD EM Comm DCM
6
(2) (2) (1)
Equities/Advisory ranks/shares Fixed income ranks/shares
Current
Target
Top 5 Top 5 Top 5 Top 5
# 4 # 7 # 1
Top 3
# 2
Top 3
# 3 # 1 #6 #5
Top 5 Top 5
Top 3 Top 5 Top 3 Top 3
# 1 # 1 # 2
Top 3
# 1
Top 3
# 1 # 1 #4
Top 5 Top 5
2007 n.a. # 12 # 10 # 4 n.a. # 2 # 8 # 8 # 1 # 3 # 1 # 2 # 1 # 2 # 8-9 # 5
# 2
Top 5
# 6
#4
(4) (3) (3) (3) (3) (3)
Note: 2011 data except where stated otherwise; FI = Fixed Income, IRD = Interest Rate Derivatives, EM = Emerging Markets, Comm = Commodities, EQD = Equity Derivatives, Prime Brok = Prime Brokerage; % figures represent client market shares unless stated below; commodities and prime brokerage show revenue market share of top 9 players only; equity derivatives numbers represent equity swaps for US and flow options for EU
(1) 2012 Euromoney FX poll (2) ECM/M&A based on 1H2012 Dealogic data (3) 2012 Greenwich Associates data. Research/Advisory ranks for cash equities. (4) High Grade/High Yield/Loans origination for DCM 1H2012 Dealogic data (5) Source: Coalition Development
Source: Greenwich Associates (except where stated otherwise), Coalition Development, Euromoney, Dealogic, Deutsche Bank
(5) (5)

financial transparency. Colin Fan & Robert Rankin Investor Day, Frankfurt, 12 September 2012
Deutsche Bank Investor Relations
7
Higher risk businesses scaled back CB&S resources, current vs. peak levels(1)
Our flow-focused, lower risk business model is well suited to client needs
(1) Peak refers to highest level during the period 3Q2007 to 4Q2009 (2) Adjusted assets, as defined in 2Q2012 Financial Data Supplement on page 20 (3) Current RWA under Basel 2 as of Nov 2011 as DB started reporting RWA under Basel 2.5 from Dec 2011 onwards (4) Estimated maximum traded market risk loss on a return to 1Q2009 conditions over a quarter, including offsetting revenues across businesses
(35)%
(39)%
(62)%
(65)%
Balance sheet
RWA
Stress loss
Value at Risk
(4)
(2)
(3)
Deutsche Bank volumes
Number of trades, daily average 1H2012
FX Cash 206,000
IRD 2,500
Repo 11,000
Money Markets 7,200
FX Options 2,200
Bonds 57,000
Cash equities ~2,000,000

financial transparency. Colin Fan & Robert Rankin Investor Day, Frankfurt, 12 September 2012
Deutsche Bank Investor Relations
CB&S overview
Where we are today
The journey to 2015
The business in 2015
— Challenging market conditions – outlook remains uncertain — CB&S is a leading investment banking franchise — DB well placed to consolidate success in new environment
— Reaffirming client centricity — Fully committed to cultural change — Focus, scale and efficiency driving sustainable, attractive returns
— Top 3 global investment bank — EUR 1.9 bn cost savings by 2015; cost/income ratio of <65% — Post-tax RoE of ~15%, Basel 3 fully loaded(1)
8
(1) Excludes non-core operations and reflects reassignment of management responsibilities for asset-gathering business and changes to the allocation of coverage costs between CB&S and GTB

financial transparency. Colin Fan & Robert Rankin Investor Day, Frankfurt, 12 September 2012
Deutsche Bank Investor Relations
Investment banks play an essential role in the global economy Valuable functions
— Facilitating trade growth and exchange of services — Supporting corporate activity around the globe — Providing market access
Global connectivity
— Allowing firms to focus on their operational strengths — Lowering clients’ financing costs and reducing uncertainty — Immunizing non-standard risks (e.g. longevity risk for pension funds)
Risk management
— Maintaining trusted long-term relationships — Offering independent advice and transaction support — Providing guidance on strategic acquisitions and divestments
Trusted advice
9
— Enabling governments and companies to raise capital — Providing extensive global distribution networks — Facilitating investment
Capital raising & distribution

financial transparency. Colin Fan & Robert Rankin Investor Day, Frankfurt, 12 September 2012
Deutsche Bank Investor Relations
We are redefining our culture to underpin this purpose
10
Realigning compensation
Linking our values to behavior
We will lead the industry on realigning compensation balance and practices
We will make our cultural values central to the way we manage our people
— Clear compensation impact of “red flag” breaches in 2011
— Meaningful claw back and forfeiture mechanisms implemented
— Extended deferral from 3 to 5 years and change from tranche vesting to cliff vesting for share component for senior management
— “Tone at the top” communication — “Red flag” status and impact available to
individuals and supervisors – culture reinforced in promotion criteria and performance reviews
— Greater focus on ‘how’ performance is delivered through assessment of employee behavior
— Risk culture further embedded through training and communications
CB&S actions Deutsche Bank commitments

financial transparency. Colin Fan & Robert Rankin Investor Day, Frankfurt, 12 September 2012
Deutsche Bank Investor Relations
While retaining our top performers
High performing
talent
Track record of managing
change
Market leading client relationships
— Highly successful, innovative workforce with collaborative approach
— Top quartile productivity across the platform
— Relationships with leading global institutions/clients
— Unparalleled service delivery in Europe. Leader in US fixed income
— Delivered on major strategic programmes
— Extensive experience of managing change across businesses/regions
CB&S – our people Our value proposition
11
Performance culture — Meritocracy — Stronger differentiation of rewards — Execution and results oriented — Risk culture
Entrepreneurial spirit — Empowerment of business leaders — Speed and agility — Innovation
Cultural diversity — Ability to adapt and change — Respect for others — Global culture — Strongly anchored in home market

financial transparency. Colin Fan & Robert Rankin Investor Day, Frankfurt, 12 September 2012
Deutsche Bank Investor Relations
Focus, scale and efficiency will define the future CB&S business
Efficiency
— Reduce capital consumption across the business
— Align coverage to market opportunities
Focus
— Re-evaluate the CB&S portfolio to identify strategic priorities
— Transfer of non-core assets out of CB&S
— Align client profitability and balance sheet deployment better
Scale
— Leverage strengths of FICC platform
— Industrialize processes — Re-design trading
architecture
CB&S value drivers
12

financial transparency. Colin Fan & Robert Rankin Investor Day, Frankfurt, 12 September 2012
Deutsche Bank Investor Relations
… add value for clients?
… meet performance criteria
… align well to trends/outlook?
… contribute to balance?
Does the business …
Turnaround Invest
13
Focus: We have re-evaluated the CB&S portfolio to identify strategic priorities
— European equities — APAC equities — Rationalize corporate and
institutional coverage footprint
— FX — Emerging Markets — Platforms
— Capital-intensive “legacy” assets
— Consistently unprofitable clients
— Flow Rates & Credit Trading — Client Financing — North American equities — Commodities — Origination/Advisory
Exit Maintain/re-tool

financial transparency. Colin Fan & Robert Rankin Investor Day, Frankfurt, 12 September 2012
Deutsche Bank Investor Relations
1,000
2,000
3,000
4,000
5,000
6,000
7,000
8,000
9,000
10,000
Focus: Reductions in legacy assets will be further continued by the Non-Core Operations unit
CB&S post-tax RoE, 2011(1)
Basel 2 IAS 39 assets
(42)%
Securitization CDIs
(45)%
0 10 20 30 40 50 60 70 80 90
100
Correlation trading VaR, in EUR m
Monoline exposure, in EUR m
(53)%
(89)%
Jan 2010 Jun 2012
Significant de-risking of non-core assets, CB&S
Dec 2008 Jun 2012
(1) Assumes domestic statutory tax rate of 30.8%. ‘Operating business’ excludes non-core operations and reflects reassignment of management responsibilities for asset-gathering business and changes to the allocation of coverage costs between CB&S and GTB
(2) Assumes overall bank capitalization consistent with an 8% Core Tier 1 ratio under Basel 3 fully loaded and Basel 3 RWA impact commensurate with year-end 2012 targets
14
Basel 3 pro-forma, fully loaded(2)
Incl. non-core Operating business
9%
16%
6%
11%
SPLIT OPERATING vs. NON-CORE INDICATIVE
Incl. non-core Operating business
Jun 2010 Jun 2012
Mar 2009 Jun 2012
financial transparency. Colin Fan & Robert Rankin Investor Day, Frankfurt, 12 September 2012
Deutsche Bank Investor Relations
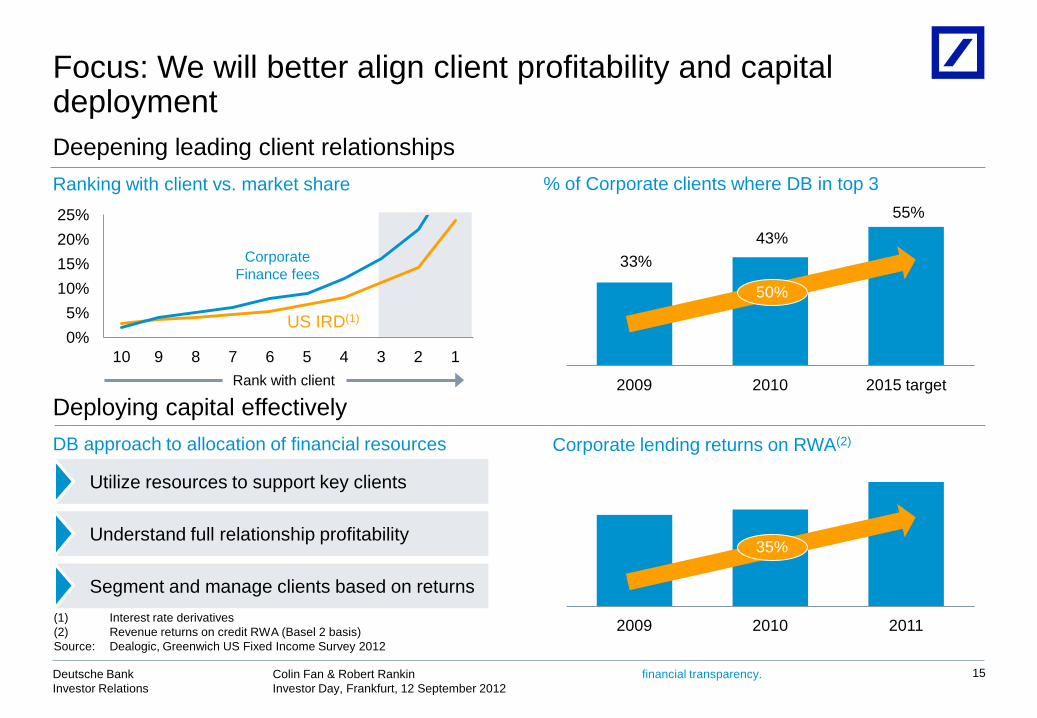
0% 5%
10% 15% 20% 25%
10 9 8 7 6 5 4 3 2 1
Focus: We will better align client profitability and capital deployment
Rank with client
Ranking with client vs. market share % of Corporate clients where DB in top 3
2009 2010 2015 target
55%
33% 43%
50%
Corporate Finance fees
US IRD(1)
DB approach to allocation of financial resources
Utilize resources to support key clients
Segment and manage clients based on returns
Understand full relationship profitability
Corporate lending returns on RWA(2)
15
(1) Interest rate derivatives (2) Revenue returns on credit RWA (Basel 2 basis) Source: Dealogic, Greenwich US Fixed Income Survey 2012
Deepening leading client relationships
Deploying capital effectively
2009 2010 2011
35%

financial transparency. Colin Fan & Robert Rankin Investor Day, Frankfurt, 12 September 2012
Deutsche Bank Investor Relations
Scale: We will continue to leverage our scale in FICC(1)
Leading FICC franchise Ranks by market share
Driving further integration opportunities
FX Rates/ MM
Credit Trading
Commod-ities
Structuring
Trade pricing, liquidity
Settlement, netting
Financial resource optimization (RWA, balance sheet, collateral)
Risk management
Sales
Business support
2009 2011/12
#7 #2 IG Credit
#4 #1 EM
#3 #1 IRD(2)
#1 #1 FX
#3 #1 Global FI
16
(1) Fixed Income, Currency and Commodities (2) Interest rate derivatives Source: Greenwich Associates (all ranks except FX), Euromoney (for FX rank only)
— Remove support function silos — Industrialize systems and process — Decommission overlapping/redundant systems — Deliver best of breed algos
financial transparency. Colin Fan & Robert Rankin Investor Day, Frankfurt, 12 September 2012
Deutsche Bank Investor Relations
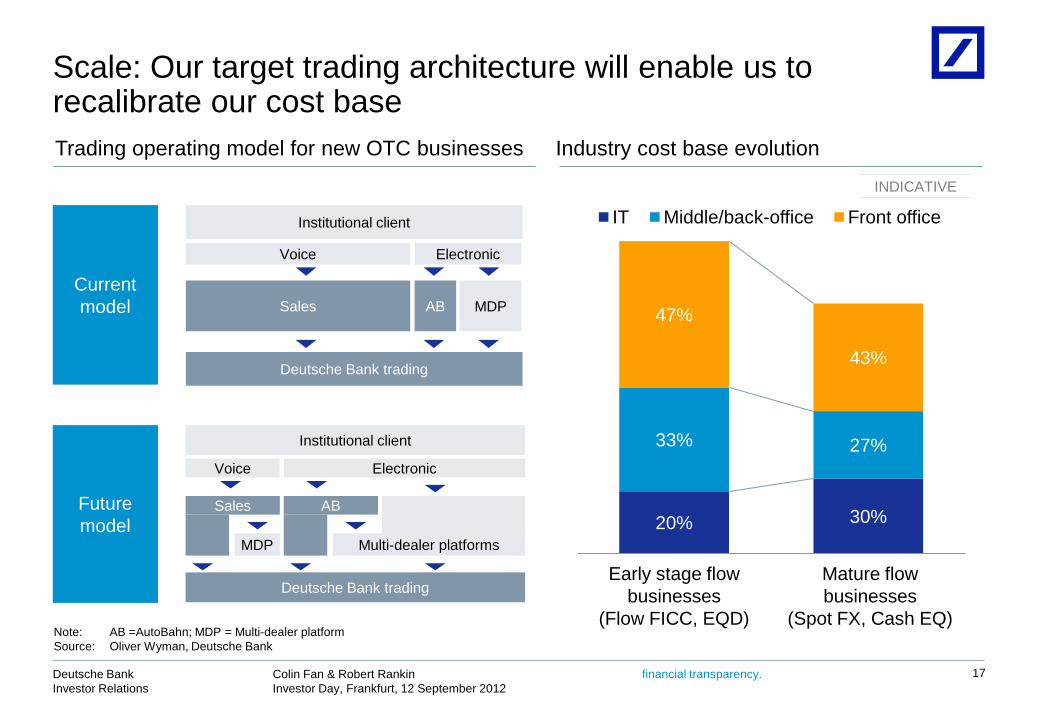
Trading operating model for new OTC businesses Industry cost base evolution
20% 30%
33% 27%
47%
43%
IT Middle/back-office Front office
Early stage flow businesses
(Flow FICC, EQD)
Mature flow businesses
(Spot FX, Cash EQ)
Institutional client
Sales
Deutsche Bank trading
AB MDP
Voice Electronic
Current model
Institutional client
Deutsche Bank trading
Multi-dealer platforms
Voice Electronic
Sales Future model
17
Scale: Our target trading architecture will enable us to recalibrate our cost base
Note: AB =AutoBahn; MDP = Multi-dealer platform Source: Oliver Wyman, Deutsche Bank
AB
MDP
INDICATIVE

financial transparency. Colin Fan & Robert Rankin Investor Day, Frankfurt, 12 September 2012
Deutsche Bank Investor Relations
165
222 93 12
(48)
103
~(70)
30 Jun 2011
Unmitigated Basel 2.5
impact
Op risk surcharge
Mitigation to date
30 Jun 2012
Basel 3 impact after
targeted mgmt. action
Capital demand
measures
31 Mar 2013
Basel 3, fully loaded
Efficiency: We exceeded our RWA mitigation targets for Basel 2.5 and will manage the impact of Basel 3
In EUR bn
CB&S risk-weighted assets
Mitigation until 31 March 2013 — Planned mitigation to year
end 2012 includes significant sales of securitization positions, tight management of market risk levels along with model and data enhancements
— Further actions are likely to include further securitization sales, correlation book transfer and further model/data/process enhancements
Management over-delivered vs. planned EUR 30 bn Basel 2.5 mitigation by containment of Stressed VaR and IRC and accelerated reduction of securitizations
18
(1)
(1) Net of other RWA movements (e.g. FX) (2) CB&S portion of EUR 109 bn Group impact. Gross RWA increase does not reflect EUR 2 bn of capital benefit from the add-back of securitization deductions (3) CB&S portion of EUR (85) bn Group impact. Net of other RWA movements (e.g. FX)
(2)
(3)
~255

financial transparency. Colin Fan & Robert Rankin Investor Day, Frankfurt, 12 September 2012
Deutsche Bank Investor Relations
Efficiency: We will continue to align headcount with market opportunities
Revenue pool CAGR (2012-2015)
Amer
icas
EM
EA
~2% — Opportunity to win share — Grow US coverage, with focus on key
sectors through resource realignment — Streamline Latin America
0% — Maintain European leadership — Grow in Germany — Rescale franchise
3-5% — Consolidate top tier position — Recalibrate footprint in line with evolving
market opportunities APAC
19
Resources and opportunities not fully aligned CB&S resource allocation
Source: Dealogic, Oliver Wyman, Deutsche Bank
% of CB&S headcount % of revenue pool

financial transparency. Colin Fan & Robert Rankin Investor Day, Frankfurt, 12 September 2012
Deutsche Bank Investor Relations
CB&S overview
Where we are today
The journey to 2015
The business in 2015
— Challenging market conditions – outlook remains uncertain — CB&S is a leading investment banking franchise — DB well placed to consolidate success in new environment
— Reaffirming client centricity — Fully committed to cultural change — Focus, scale and efficiency driving sustainable, attractive returns
— Top 3 global investment bank — EUR 1.9 bn cost savings by 2015; cost/income ratio of <65% — Post-tax RoE of ~15%, Basel 3 fully loaded(1)
20
(1) Excludes non-core operations and reflects reassignment of management responsibilities for asset-gathering business and changes to the allocation of coverage costs between CB&S and GTB

financial transparency. Colin Fan & Robert Rankin Investor Day, Frankfurt, 12 September 2012
Deutsche Bank Investor Relations
2015 run-rate savings, in EUR bn
1.1
0.8
Contribution to Group aspiration
4.5
CB&S DB Group
1.9
1.5
Cost savings
CB&S: Major cost measures
Infrastructure cost savings
0.4
0.2
0.5
0.8
1.9
— Announced 600 infrastructure headcount reduction
— Front-to-back process optimization — Optimization of location footprint
— Announced 900 front office headcount reduction (in addition to 500 reduction announced in 4Q2011). Focus on equities/corporate finance in EU/APAC
— Improved cost management
— Reduction of non-compensation costs (e.g. real estate optimisation, procurement management)
— Platform realignment to emerging regulatory changes and business performance
— Lower compensation costs — Dynamic management of business portfolio
21
We are taking significant costs out of the business
2012: Cost savings
(implemented)
2013/14: Cost initiatives
2014/15: Long-term platform
optimization
Infrastructure savings
Total
Business savings
Cumulative impact: — Cost/income ratio <65%

financial transparency. Colin Fan & Robert Rankin Investor Day, Frankfurt, 12 September 2012
Deutsche Bank Investor Relations
By 2015, a recalibrated CB&S will deliver attractive risk-adjusted returns across its portfolio of core businesses CB&S portfolio evolution 2007 – 2015 Post-tax return on equity
Note: 2007 and 2011 are based on reported pre-tax return on equity and on domestic statutory tax rates for 2007 (30.7%) and 2011 (30.8%). They include non-core operations and do not reflect reassignment of management responsibilities for asset-gathering business to AWM and changes to the allocation of coverage cost between CB&S and GTB. The projection for 2015 is based on Basel 3 pro-forma fully loaded an tax rate guidance of 30 – 35%. It excludes non-core operations and reflects the aforementioned reassignment of management responsibilities and changes to cost allocation. All years shown are based on average active equity.
2007 Basel 1
2015 projected Basel 3 (fully loaded)
2011 Basel 2
Challenging market environment
Performance optimization
CB&S = 15%
CB&S = 9% CB&S = ~15%
Capital pressure
Size proportional to Revenues FICC Equities/Advisory/Lending
15%
22
Operating business

financial transparency. Colin Fan & Robert Rankin Investor Day, Frankfurt, 12 September 2012
Deutsche Bank Investor Relations
From here to there: Aspiration 2015
2011 2015
Top 3 global investment bank
Culture fully aligned to needs of clients and stakeholders
RWA equivalent (year-end)
Cost/income ratio
Superior returns on resources Post-tax RoE(2)
23
Key take-aways Key metrics for operating business
<200
~15%
71% <65%
(1) Also reflects reassignment of management responsibilities for asset-gathering business and changes to the allocation of coverage costs between CB&S and GTB (2) Based on domestic statutory tax rate of 30.8% for 2011 and corporate tax rate guidance of 30 – 35% for 2015; based on average active equity (3) Assumes overall bank capitalization consistent with an 8% Core Tier 1 ratio under Basel 3 fully loaded and Basel 3 RWA impact commensurate with year-end 2012
targets (4) Basel 2 for RoE, Basel 2.5 for RWA equivalent
184 244
16% 11%
Pro-forma, excluding non-core operations(1)
Basel 2/2.5(4) Basel 3 fully loaded
(3)
Deutsche Bank
Investor Day, Frankfurt, 12 September 2012
Appendix
financial transparency. Colin Fan & Robert Rankin Investor Day, Frankfurt, 12 September 2012
Deutsche Bank Investor Relations
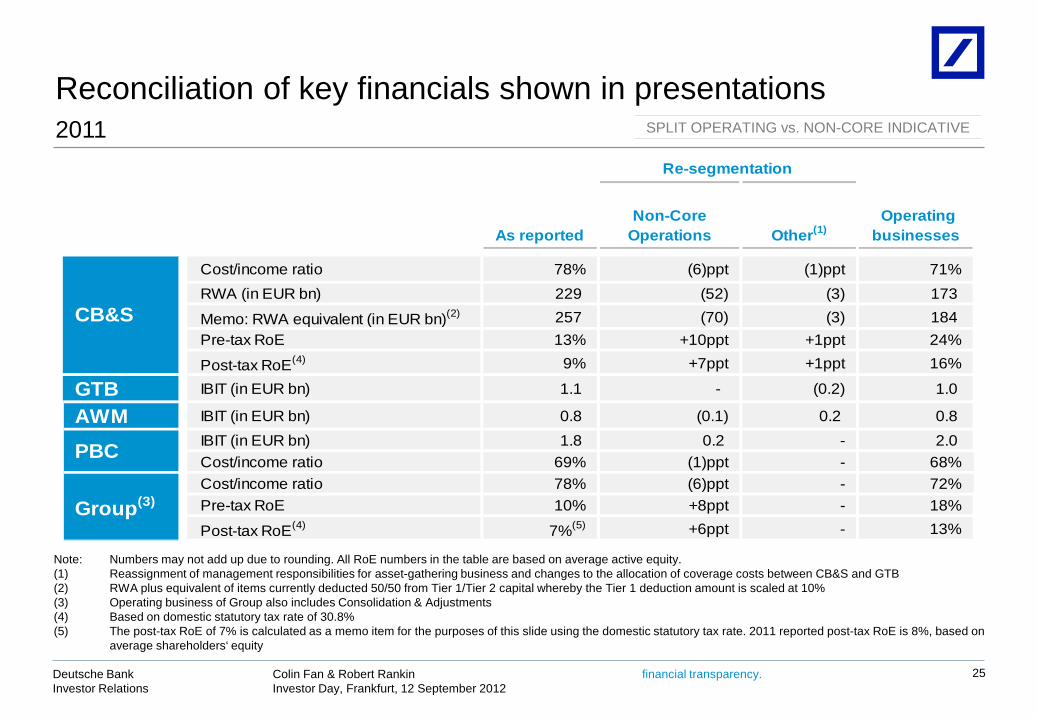
Reconciliation of key financials shown in presentations
Note: Numbers may not add up due to rounding. All RoE numbers in the table are based on average active equity. (1) Reassignment of management responsibilities for asset-gathering business and changes to the allocation of coverage costs between CB&S and GTB (2) RWA plus equivalent of items currently deducted 50/50 from Tier 1/Tier 2 capital whereby the Tier 1 deduction amount is scaled at 10% (3) Operating business of Group also includes Consolidation & Adjustments (4) Based on domestic statutory tax rate of 30.8% (5) The post-tax RoE of 7% is calculated as a memo item for the purposes of this slide using the domestic statutory tax rate. 2011 reported post-tax RoE is 8%, based on
average shareholders‘ equity
2011 SPLIT OPERATING vs. NON-CORE INDICATIVE
25
As reportedNon-Core
Operations Other(1) Operating
businesses
Cost/income ratio 78% (6)ppt (1)ppt 71%RWA (in EUR bn) 229 (52) (3) 173
Memo: RWA equivalent (in EUR bn)(2) 257 (70) (3) 184 Pre-tax RoE 13% +10ppt +1ppt 24%
Post-tax RoE(4) 9% +7ppt +1ppt 16%
GTB IBIT (in EUR bn) 1.1 - (0.2) 1.0
AWM IBIT (in EUR bn) 0.8 (0.1) 0.2 0.8 IBIT (in EUR bn) 1.8 0.2 - 2.0 Cost/income ratio 69% (1)ppt - 68%Cost/income ratio 78% (6)ppt - 72%Pre-tax RoE 10% +8ppt - 18%
Post-tax RoE(4) 7%(5) +6ppt - 13%
CB&S
PBC
Group(3)
Re-segmentation

financial transparency. Colin Fan & Robert Rankin Investor Day, Frankfurt, 12 September 2012
Deutsche Bank Investor Relations
This presentation contains forward-looking statements. Forward-looking statements are statements that are not historical facts; they include statements about our beliefs and expectations and the assumptions underlying them. These statements are based on plans, estimates and projections as they are currently available to the management of Deutsche Bank. Forward-looking statements therefore speak only as of the date they are made, and we undertake no obligation to update publicly any of them in light of new information or future events.
By their very nature, forward-looking statements involve risks and uncertainties. A number of important factors could therefore cause actual results to differ materially from those contained in any forward-looking statement. Such factors include the conditions in the financial markets in Germany, in Europe, in the United States and elsewhere from which we derive a substantial portion of our revenues and in which we hold a substantial portion of our assets, the development of asset prices and market volatility, potential defaults of borrowers or trading counterparties, the implementation of our strategic initiatives, the reliability of our risk management policies, procedures and methods, and other risks referenced in our filings with the U.S. Securities and Exchange Commission. Such factors are described in detail in our SEC Form 20-F of 20 March 2012 under the heading “Risk Factors.” Copies of this document are readily available upon request or can be downloaded from www.db.com/ir.
This presentation also contains non-IFRS financial measures. For a reconciliation to directly comparable figures reported under IFRS, to the extent such reconciliation is not provided in this presentation, refer to the 2Q2012 Financial Data Supplement, which is accompanying this presentation and available at www.db.com/ir.
Cautionary statements
26