Deutsche Bank June 16, 2005
25
Deutsche Bank June 16, 2005 Page 1 Deutsche Bank June 16, 2005
-
Upload
leigh-harper -
Category
Documents
-
view
42 -
download
0
description
Deutsche Bank June 16, 2005. “Safe Harbor”. Safe Harbor Statement Under the Private Securities Litigation Reform Act of 1995:. - PowerPoint PPT Presentation
Transcript of Deutsche Bank June 16, 2005

Deutsche Bank June 16, 2005Page 1
Deutsche BankJune 16, 2005
Deutsche Bank June 16, 2005Page 2
“Safe Harbor”
Safe Harbor Statement Under the Private Securities Litigation Reform Act of 1995:
Forward-Looking Statements: Except for historical information contained herein, this presentation contains forward-looking statements, within the meaning of the Private Securities Litigation Reform Act of 1995, including guidance given for 2005, expectations about RGU growth and customer migration to new products. These forward-looking statements involve certain risks and uncertainties that could cause actual results to differ materially from those expressed or implied by these statements. These risks and uncertainties include the continued use by subscribers and potential subscribers of our services, changes in the technology and competition, our ability to achieve expected operational efficiencies and economies of scale, our ability to generate expected revenue and achieve assumed margins including, to the extent annualized figures imply forward-looking projections, continued performance comparable with the period annualized, as well as other factors detailed from time to time in the Company’s filings with the Securities and Exchange Commission. These forward-looking statements speak only as of the date of this release. The Company expressly disclaims any obligation or undertaking to disseminate any updates or revisions to any guidance and other forward-looking statement contained herein to reflect any change in the Company’s expectations with regard thereto or any change in events, conditions or circumstances on which any such statement is based.
Please refer to the Appendix at the end of this presentation, as well as to the press releases and SEC filings, of our wholly-owned subsidiaries’, UnitedGlobalCom, Inc. and Liberty Media International, Inc., for the three months ended March 31, 2005, for definitions of the following terms which are used herein including: Operating Cash Flow (OCF), Free Cash Flow, Revenue Generating Units (RGUs), and Average Revenue per Unit (ARPU), as well as a GAAP reconciliation of non-GAAP financial measures.
Deutsche Bank June 16, 2005Page 3
Liberty Global Overview
European Product & Strategy Update
Financial Results
Q & A
Agenda
Deutsche Bank June 16, 2005Page 4
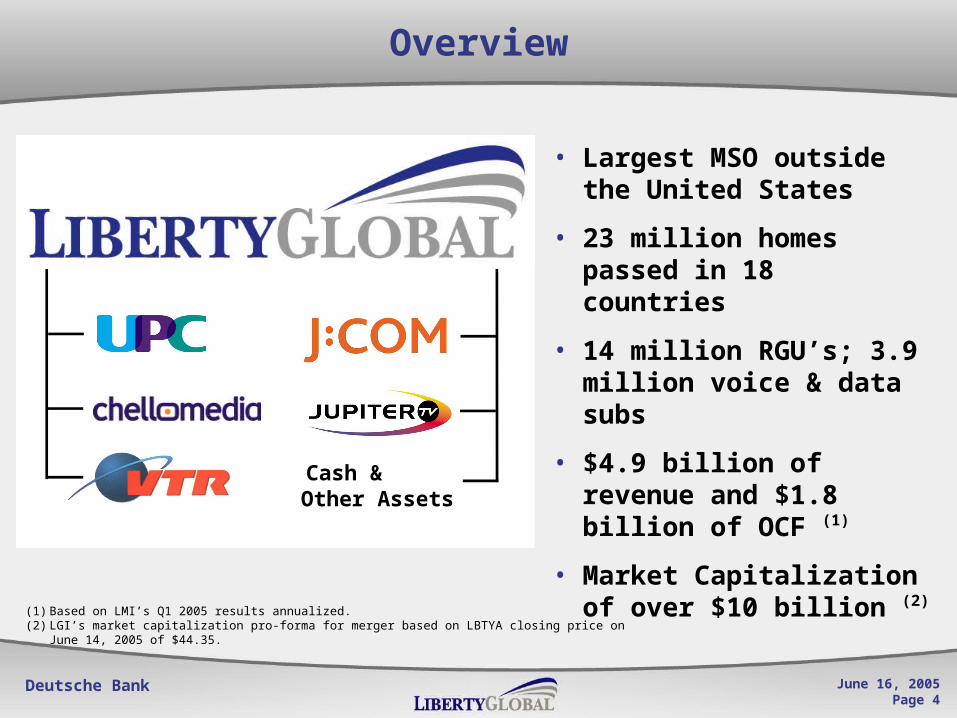
Overview
• Largest MSO outside the United States
• 23 million homes passed in 18 countries
• 14 million RGU’s; 3.9 million voice & data subs
• $4.9 billion of revenue and $1.8 billion of OCF (1)
• Market Capitalization of over $10 billion (2)
(1) Based on LMI’s Q1 2005 results annualized.(2) LGI’s market capitalization pro-forma for merger based on LBTYA closing price on June 14, 2005
of $44.35.
Cash & Other Assets
Deutsche Bank June 16, 2005Page 5
Liberty Global Overview
European Product & Strategy Update
Financial Results
Q & A
Agenda
Deutsche Bank June 16, 2005Page 6
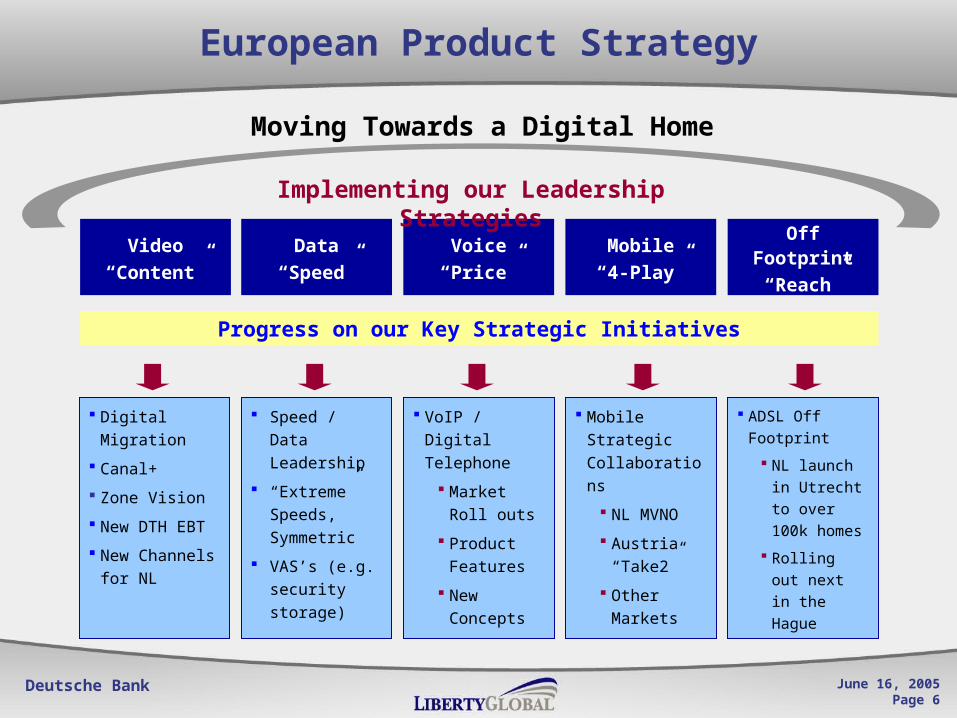
Speed / Data Leadership
“Extreme” Speeds, Symmetric
VAS’s (e.g. security storage)
European Product Strategy
Moving Towards a Digital Home
Video“Content”
Data“Speed”
Voice“Price”
Mobile“4-Play”
Off Footprint“Reach”
Progress on our Key Strategic Initiatives
Digital Migration
Canal+
Zone Vision
New DTH EBT
New Channels for NL
VoIP / Digital Telephone
Market Roll outs
Product Features
New Concepts
Mobile Strategic Collaborations
NL MVNO
Austria “Take2”
Other Markets
ADSL Off Footprint
NL launch in Utrecht to over 100k homes
Rolling out next in the Hague
Implementing our Leadership Strategies
Deutsche Bank June 16, 2005Page 7
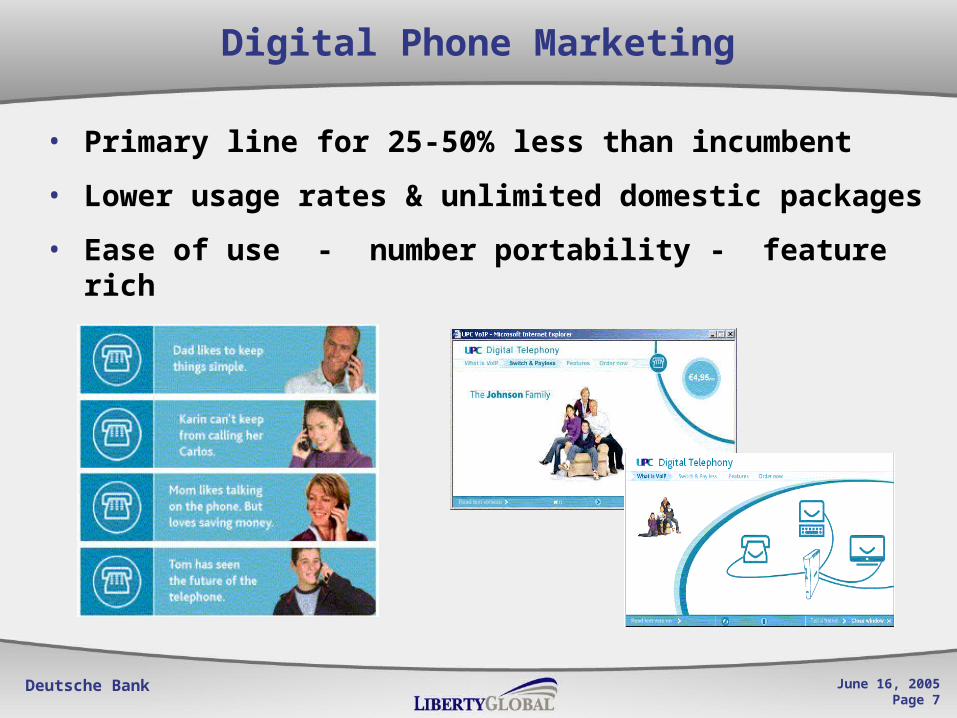
Digital Phone Marketing
• Primary line for 25-50% less than incumbent
• Lower usage rates & unlimited domestic packages
• Ease of use - number portability - feature rich
Deutsche Bank June 16, 2005Page 8
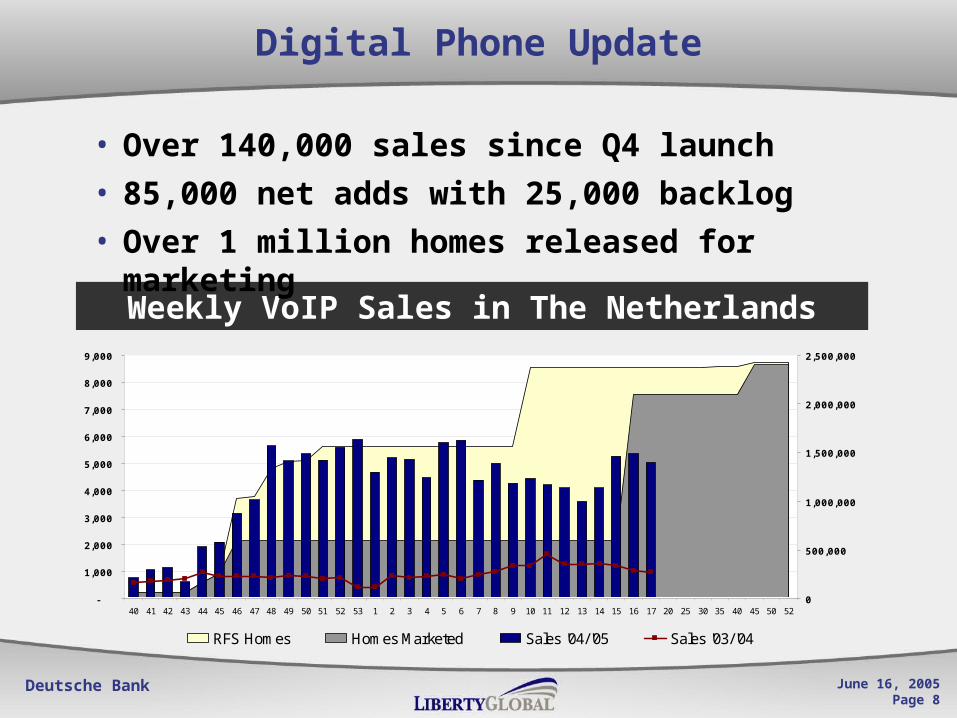
Digital Phone Update
Weekly VoIP Sales in The Netherlands
• Over 140,000 sales since Q4 launch
• 85,000 net adds with 25,000 backlog
• Over 1 million homes released for marketing
-
1,000
2,000
3,000
4,000
5,000
6,000
7,000
8,000
9,000
40 41 42 43 44 45 46 47 48 49 50 51 52 53 1 2 3 4 5 6 7 8 9 10 11 12 13 14 15 16 17 20 25 30 35 40 45 50 520
500,000
1,000,000
1,500,000
2,000,000
2,500,000
RFS Homes Homes Marketed Sales '04/'05 Sales '03/'04
Deutsche Bank June 16, 2005Page 9
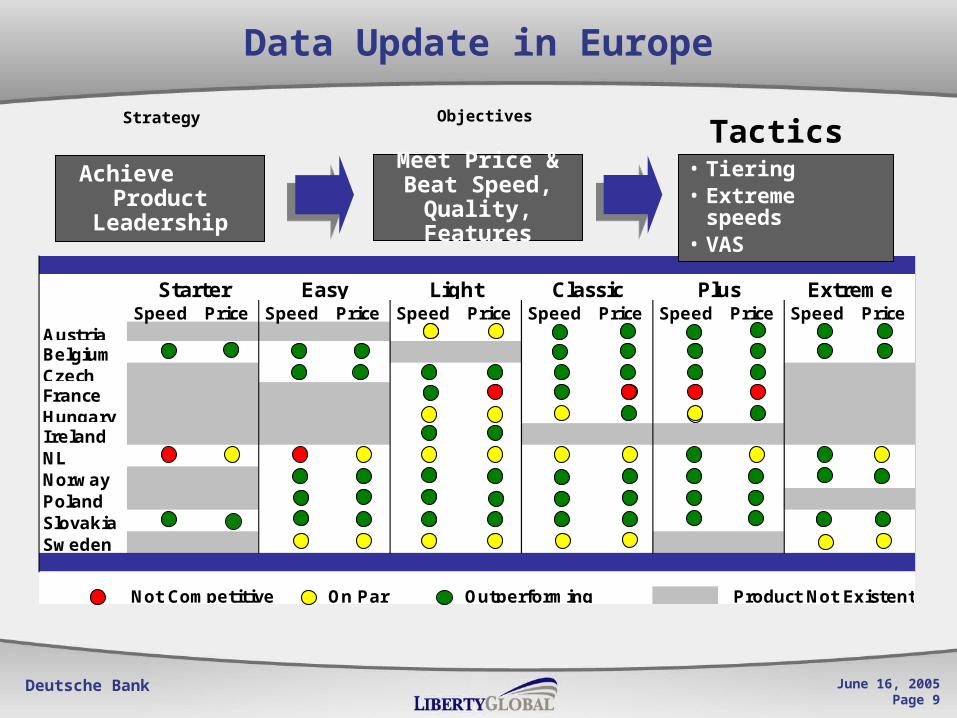
Data Update in Europe
Strategy Objectives
Achieve Product
Leadership
Tactics
Speed Price Speed Price Speed Price Speed Price Speed Price Speed PriceAustriaBelgiumCzechFranceHungaryIrelandNLNorwayPolandSlovakiaSweden
Not Competitive On Par Outperforming Product Not Existent
Plus ExtremeStarter Easy Light Classic
Meet Price & Beat Speed,
Quality, Features
• Tiering• Extreme
speeds• VAS
Deutsche Bank June 16, 2005Page 10
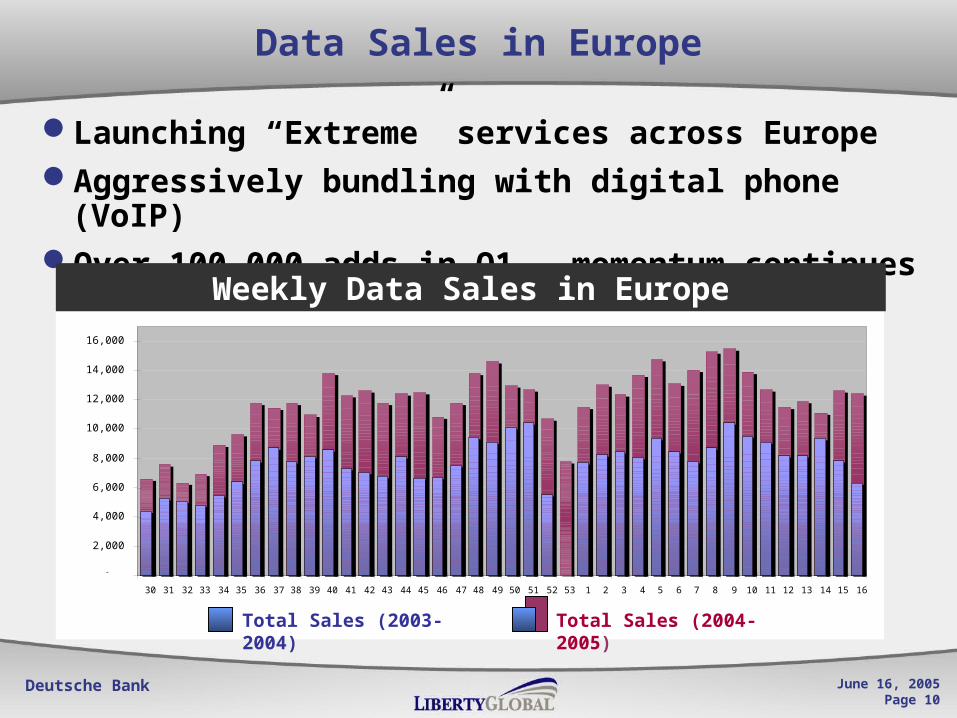
Data Sales in Europe
Launching “Extreme” services across EuropeAggressively bundling with digital phone
(VoIP)Over 100,000 adds in Q1 – momentum
continues
-
2,000
4,000
6,000
8,000
10,000
12,000
14,000
16,000
30 31 32 33 34 35 36 37 38 39 40 41 42 43 44 45 46 47 48 49 50 51 52 53 1 2 3 4 5 6 7 8 9 10 11 12 13 14 15 16
Total '04 into '05 Total '03 into '04
Weekly Data Sales in Europe
Total Sales (2003-2004)
Total Sales (2004-2005)
Deutsche Bank June 16, 2005Page 11
Why?- Reclaim digital high ground- Gateway for new service delivery - Favorable economics
Digital Migration in Holland
What is the Plan?- Aggressively migrate all analog cable customers in the Netherlands to digital platform
Roll out scheduled to begin Q4 2005 Over 2 million digital boxes
Deutsche Bank June 16, 2005Page 12
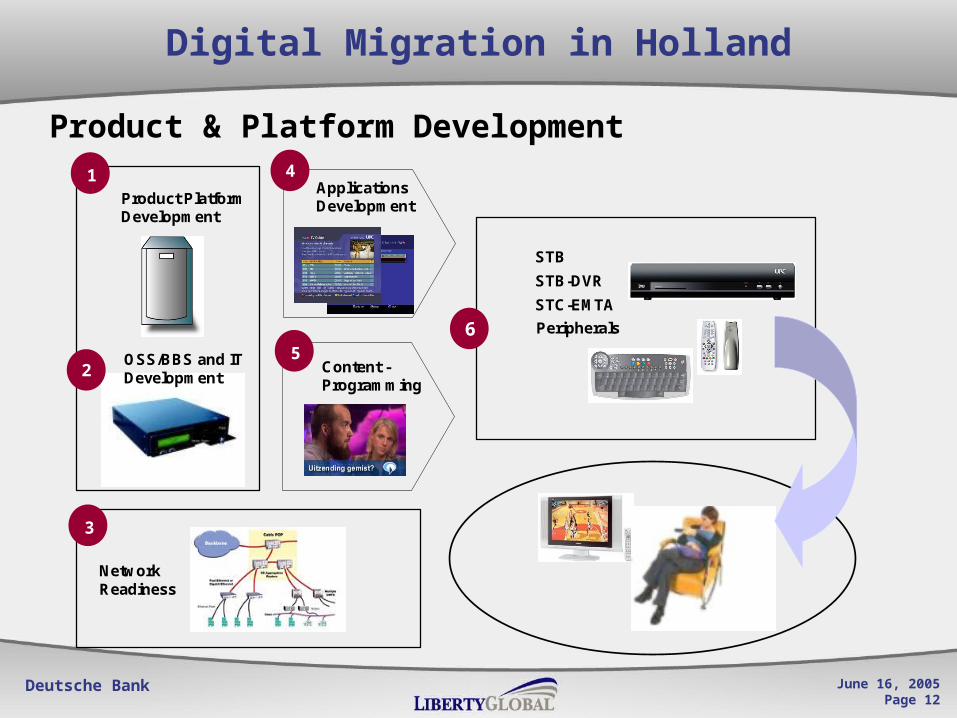
Digital Migration in Holland
Product & Platform Development
Product PlatformDevelopment
OSS/BBS and ITDevelopment
NetworkReadiness
STB
STB-DVR
STC-EMTA
Peripherals
Applications Development
Content -Programming
1
2
4
5
3
6
Deutsche Bank June 16, 2005Page 13
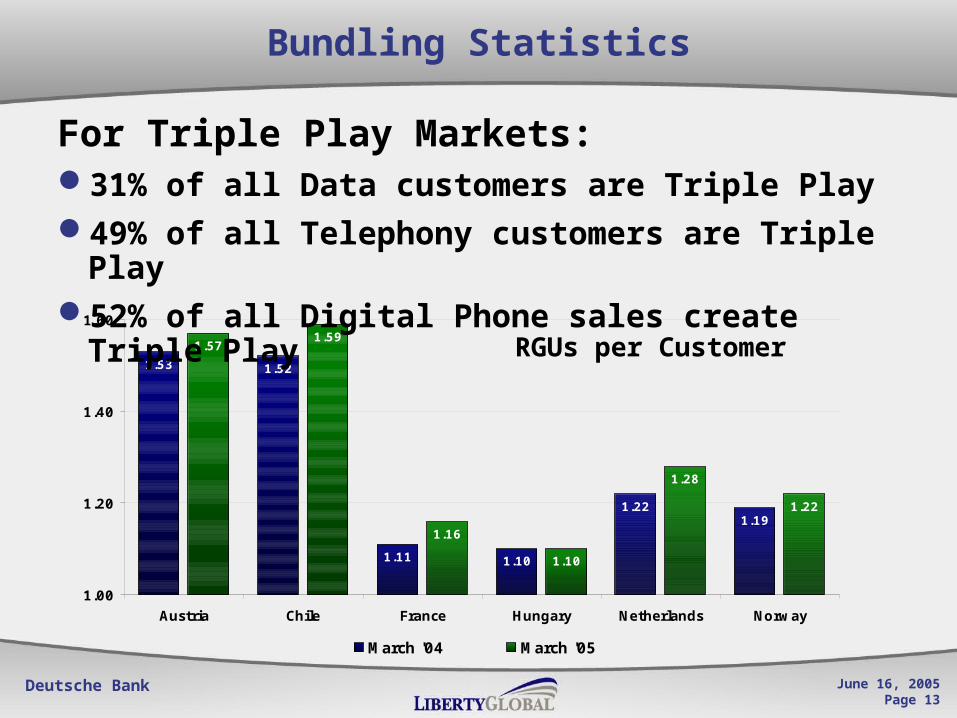
Bundling Statistics
1.53 1.52
1.11 1.10
1.221.19
1.571.59
1.16
1.10
1.28
1.22
1.00
1.20
1.40
1.60
Austria Chile France Hungary Netherlands Norway
March '04 March '05
For Triple Play Markets:31% of all Data customers are Triple Play 49% of all Telephony customers are Triple
Play52% of all Digital Phone sales create Triple
Play RGUs per Customer
Deutsche Bank June 16, 2005Page 14
Agenda
Liberty Global Overview
European Product & Strategy Update
Financial Results
Q & A

Deutsche Bank June 16, 2005Page 15
Revenue Generating Units
(1) RGUs per new methodology whereby a Digital RGU is not double counted as an Analog RGU, which was the case under the “Old Method” for UnitedGlobalCom, Inc. (UGC) only. See UGC’s press release for Q1 2005 results.
(2) Analog cable includes MMDS subscribers. (3) Organic net gain only (excludes impact of acquisitions at closing).
As of March 31, 2005 RGUs at RGUs at Net Adds(in thousands) Q1 '05 Q4 '04 Q1 '05 (3)
RGUs by Product (1)
Internet 2,273 2,131 132 Telephone 1,622 1,538 84 DTH 250 245 5 Digital 1,065 972 93
Analog Cable (2) 9,122 9,083 (68) Total RGUs 14,332 13,969 246
RGUs by Region
Europe 10,095 9,864 114 Japan 3,016 2,918 98 Chile (VTR) 1,031 1,005 27 Other 190 182 7 Total RGUs 14,332 13,969 246
Deutsche Bank June 16, 2005Page 16
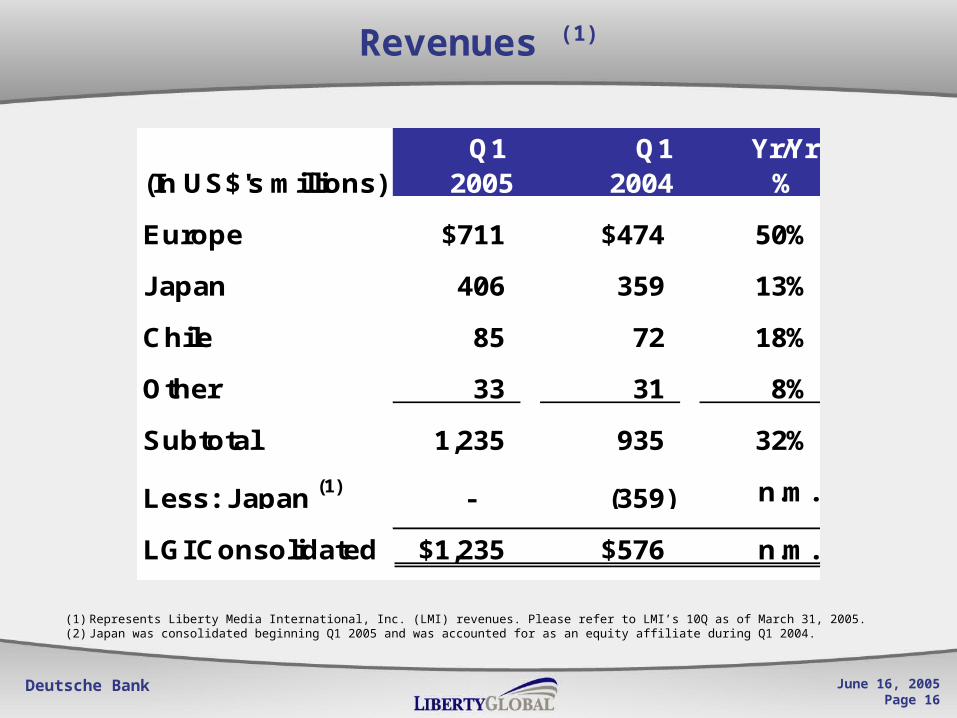
Revenues (1)
(1) Represents Liberty Media International, Inc. (LMI) revenues. Please refer to LMI’s 10Q as of March 31, 2005.(2) Japan was consolidated beginning Q1 2005 and was accounted for as an equity affiliate during Q1 2004.
Q1 Q1 Yr/Yr(In US$'s millions) 2005 2004 %
Europe $711 $474 50%
Japan 406 359 13%
Chile 85 72 18%
Other 33 31 8%
Subtotal 1,235 935 32%
Less: Japan (1) - (359) n.m.
LGI Consolidated $1,235 $576 n.m.

Deutsche Bank June 16, 2005Page 17
Operating Cash Flow (1)
(1) Represents Liberty Media International, Inc. (LMI) Operating Cash Flow. Please refer to LMI’s 10Q as of March 31, 2005.
(2) Japan was consolidated beginning Q1 2005 and was accounted for as an equity affiliate during Q1 2004.
“Operating Cash Flow” - Please see Appendix for a definition and reconciliation with net income (loss).
Q1 Q1 Yr/Yr(In US$'s millions) 2005 2004 %
Europe $261 $183 43%
Japan 168 142 19%
Chile 31 20 53%
Other (11) 2 n.m.
Subtotal 449 347 29%
Less: Japan (1) - (142) n.m.
LGI Consolidated $449 $205 n.m.

Deutsche Bank June 16, 2005Page 18
Financial Results
“Operating Cash Flow” - Please see Appendix for a definition and reconciliation with net income (loss). “Free Cash Flow” – Please see Appendix for a definition and additional information.
Q1 Q1 Yr/Yr(In US$'s millions) 2005 2004 %
Revenue $1,235 $576 114%
Operating Expenses 786 371 112%
Operating Cash Flow $449 $205 119%
% Margin 36.3% 35.7% +60 Bps
Capital Expenditures $249 $90 178%
Capex (% of Rev.) 20.1% 15.5% --
Free Cash Flow $54 $45 20%

Deutsche Bank June 16, 2005Page 19
Leverage & Liquidity
As of As of (US$'s millions) Dec-04 Mar-05
Total Debt $4,993 $6,642
Cash & Cash Equivalents 2,531 3,076
Net Debt $2,462 $3,566
Net Debt / Operating Cash Flow (1) 2.8x 2.0x
Additional Potential Liquidity
Bank Revolvers (2) 1,376 1,507
Other Investments (3) 1,052 1,056 Total 2,428 2,563
Total Potential Liquidity $4,959 $5,639
(1) For March 31, 2005, represents net debt / Operating Cash Flow annualized for the three months. (2) Subject to covenant compliance, represents the maximum potential availability under UPC Distribution
Bank Facility and Cablevision Puerto Rico as of Dec. 31, 2004 and March 31, 2005. For March 31, 2005, also includes the maximum potential availability under J:COM’s Revolving facility of Yen 20 billion.
(3) Market values of News Corporations, ABC Family Preferred, Austar United and SBS Broadcasting.
Deutsche Bank June 16, 2005Page 20
Conclusions
Aggressive 2005 game plan
Continued Focus on Operating Efficiency, Capital Discipline, and Execution
Exploiting Strategic Opportunities Wisely, Acquisition Pipeline Active
The Cable Investment for Growth
Deutsche Bank June 16, 2005Page 21
DRAFT: Version 4
Deutsche BankJune 16, 2005
Deutsche Bank June 16, 2005Page 22
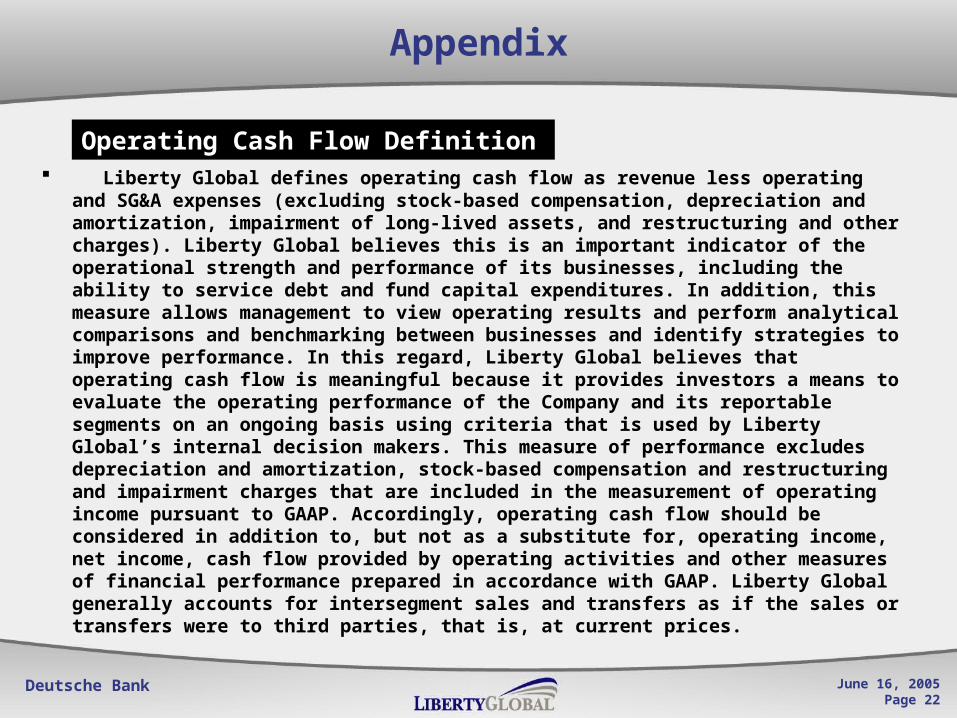
Liberty Global defines operating cash flow as revenue less operating and SG&A expenses (excluding stock-based compensation, depreciation and amortization, impairment of long-lived assets, and restructuring and other charges). Liberty Global believes this is an important indicator of the operational strength and performance of its businesses, including the ability to service debt and fund capital expenditures. In addition, this measure allows management to view operating results and perform analytical comparisons and benchmarking between businesses and identify strategies to improve performance. In this regard, Liberty Global believes that operating cash flow is meaningful because it provides investors a means to evaluate the operating performance of the Company and its reportable segments on an ongoing basis using criteria that is used by Liberty Global’s internal decision makers. This measure of performance excludes depreciation and amortization, stock-based compensation and restructuring and impairment charges that are included in the measurement of operating income pursuant to GAAP. Accordingly, operating cash flow should be considered in addition to, but not as a substitute for, operating income, net income, cash flow provided by operating activities and other measures of financial performance prepared in accordance with GAAP. Liberty Global generally accounts for intersegment sales and transfers as if the sales or transfers were to third parties, that is, at current prices.
Operating Cash Flow Definition
Appendix

Deutsche Bank June 16, 2005Page 23
Appendix
Revenue Generating Unit (“RGU”) is separately an Analog Cable Subscriber, Digital Cable Subscriber, DTH Subscriber, MMDS Subscriber, Internet Subscriber or Telephony Subscriber. A home may contain one or more RGUs. For example, if a residential customer in our Austrian system subscribed to our digital cable service, telephony service and high-speed broadband Internet access service, the customer would constitute three RGUs. “Total RGUs” is the sum of Analog, Digital Cable, DTH, MMDS, Internet and Telephony Subscribers. In some cases, non-paying subscribers are counted as subscribers during their free promotional service period. Some of these subscribers choose to disconnect after their free service period. We revised our methodology for RGUs (the new methodology), whereby a Digital RGU is no longer double counted as an Analog RGU, which was the case under the “Old Method”.
Average Revenue Per Unit (“ARPU”) is calculated as follows: average monthly broadband revenue for the period as indicated, divided by the average of the opening and closing RGUs for the period.
Other Definitions

Deutsche Bank June 16, 2005Page 24
Appendix
Non-GAAP Reconciliations
(1) We are unable to provide a reconciliation of forecasted Operating Cash Flow to the most directly comparable GAAP measure, net income (loss), because certain items are out of our control and/or cannot be reasonably predicted. For example, it is impractical to: (1) estimate future fluctuations in interest rates on our variable-rate debt facilities; (2) estimate the fluctuations in exchange rates relative to the U.S. dollar and its impact on our results of operations; (3) estimate the financial results of our non-consolidated affiliates; and (4) estimate changes in circumstances that lead to gains and/or losses such as sales of investments in affiliates and other assets. Any and/or all of these items could be significant to our forecasted financial results.
Reconciliation of Operating Cash Flow to Net Income (Loss) (1)
3 months 3 months(thousands) Q1 2005 Q1 2004 FYE 2004Total segment operating cash flow $448,875 $205,428 $888,148Stock-based compensation (18,655) (63,745) (142,762) Depreciation and amortization (327,591) (221,512) (960,888) Restructuring charges and other (4,863) (3,901) (98,371)Operating income (loss) 97,766 (83,730) (313,873)Interest expense, net (91,028) (72,485) (288,532)Interest and dividend income 20,536 8,966 65,607Share of earnings (losses) of affiliates, net (21,324) 16,090 38,710Realized and unrealized gains (losses) on derivative investments, net 85,868 (13,031) (54,947)Foreign currency transaction losses (64,762) (20,858) 92,305Gains on exchanges of investment securities 0 0 178,818Other-than-temporary declines in fair value of investments 0 0 (18,542)Gains (losses) on extinguishment of debt (11,980) 31,916 35,787Gains (losses) on dispositions of assets, net 69,572 (1,842) 43,714Other income (expense), net 684 (8,178) (7,931)Earnings (loss) before income taxes and minority investments $85,332 ($143,152) ($228,884)
Deutsche Bank June 16, 2005Page 25
Appendix
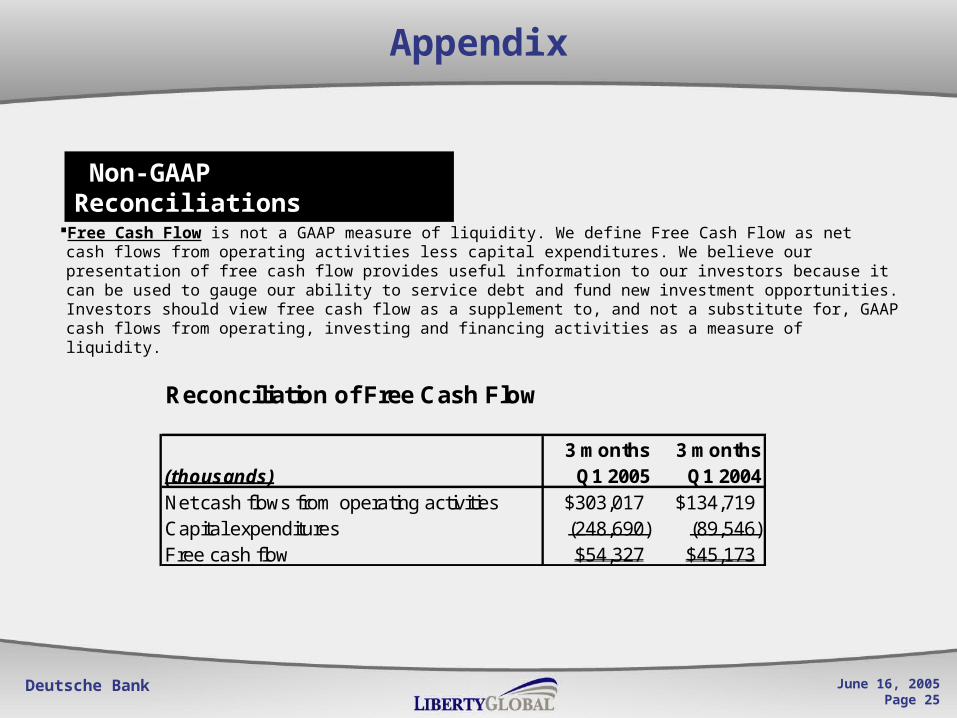
Free Cash Flow is not a GAAP measure of liquidity. We define Free Cash Flow as net cash flows from operating activities less capital expenditures. We believe our presentation of free cash flow provides useful information to our investors because it can be used to gauge our ability to service debt and fund new investment opportunities. Investors should view free cash flow as a supplement to, and not a substitute for, GAAP cash flows from operating, investing and financing activities as a measure of liquidity.
Non-GAAP Reconciliations
Reconciliation of Free Cash Flow
3 months 3 months(thousands) Q1 2005 Q1 2004Net cash flows from operating activities $303,017 $134,719Capital expenditures (248,690) (89,546)Free cash flow $54,327 $45,173