Deutsche Bank · Deutsche Bank is the beneficiary of indemnity agreements from the originators or...
44
Deutsche Bank Deutsche Bank 4Q2015 results 11 March 2016
Transcript of Deutsche Bank · Deutsche Bank is the beneficiary of indemnity agreements from the originators or...
Deutsche Bank
Deutsche Bank4Q2015 results
11 March 2016
financial transparency. 4Q2015 results 11 March 2016
Deutsche BankInvestor Relations
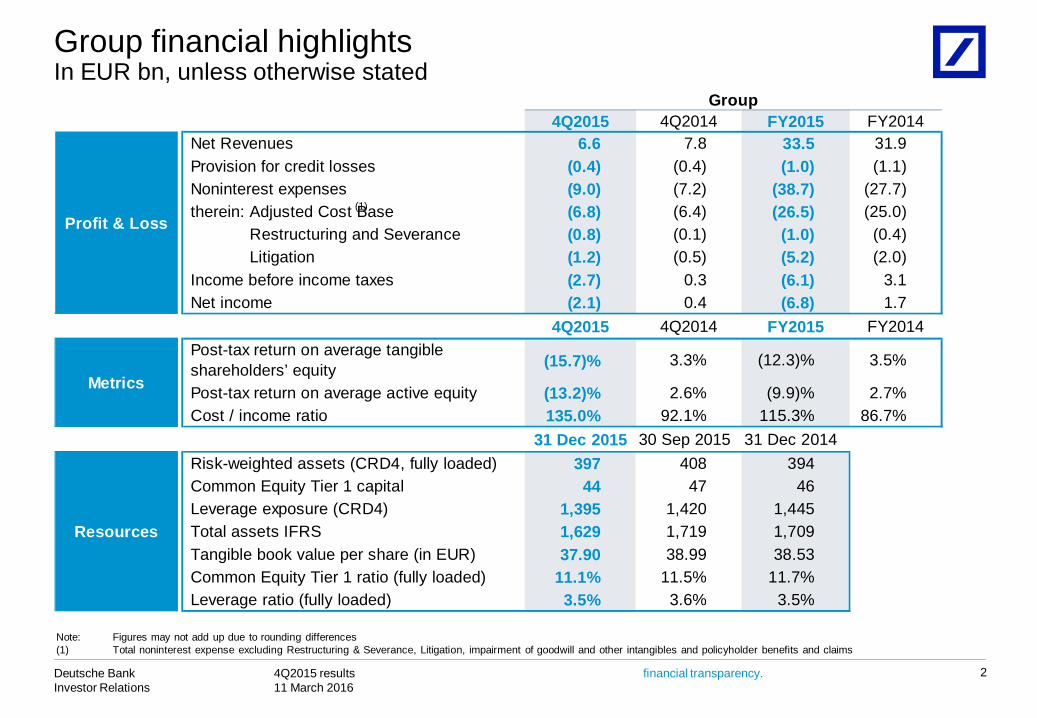
Group financial highlightsIn EUR bn, unless otherwise stated
2
(1)
4Q2015 4Q2014 FY2015 FY2014Net Revenues 6.6 7.8 33.5 31.9 Provision for credit losses (0.4) (0.4) (1.0) (1.1)Noninterest expenses (9.0) (7.2) (38.7) (27.7)therein: Adjusted Cost Base (6.8) (6.4) (26.5) (25.0)
Restructuring and Severance (0.8) (0.1) (1.0) (0.4)Litigation (1.2) (0.5) (5.2) (2.0)
Income before income taxes (2.7) 0.3 (6.1) 3.1 Net income (2.1) 0.4 (6.8) 1.7
4Q2015 4Q2014 FY2015 FY2014Post-tax return on average tangible shareholders’ equity (15.7)% 3.3% (12.3)% 3.5%
Post-tax return on average active equity (13.2)% 2.6% (9.9)% 2.7%Cost / income ratio 135.0% 92.1% 115.3% 86.7%
31 Dec 2015 30 Sep 2015 31 Dec 2014Risk-weighted assets (CRD4, fully loaded) 397 408 394 Common Equity Tier 1 capital 44 47 46 Leverage exposure (CRD4) 1,395 1,420 1,445 Total assets IFRS 1,629 1,719 1,709 Tangible book value per share (in EUR) 37.90 38.99 38.53 Common Equity Tier 1 ratio (fully loaded) 11.1% 11.5% 11.7%Leverage ratio (fully loaded) 3.5% 3.6% 3.5%
Group
Profit & Loss
Metrics
Resources
Note: Figures may not add up due to rounding differences(1) Total noninterest expense excluding Restructuring & Severance, Litigation, impairment of goodwill and other intangibles and policyholder benefits and claims

financial transparency. 4Q2015 results 11 March 2016
Deutsche BankInvestor Relations
3
Quarterly Net Income Net income 4Q2015 vs. 4Q2014, in EUR m
— Revenues declined by 19% mainly driven by weak CB&S performance, MtM losses in NCOU and the sale of Cosmo in 4Q2014
— Overall credit environment remains benign
— Costs increased mainly from higher Litigation and higher Restructuring and Severance
— Adjusted Cost slightly above 4Q2014
— Higher tax benefit due to pre-tax losses in current quarter; however, tax benefit is lower than expected due to non-tax deductible Litigation charges
Note: Comments refer to numbers excl. FX effects
FX-adjusted deltas(1):
(882) (108) 136 176 (457) (8) (11) (432) (700) 390
(2,125)
441
Liti-gation
Restr. & Sev.
(99)
LLP NetFX
effect
(9)
(49)
C&A
86
(13)
NCOU
(480)
AWM
92
GTB
93
PBC TaxCB&S
(1,127)
4Q 2014
Adj. Cost
(691)
4Q 2015
48
(686)
374
(108)
(687)
Policyh./Impairm.
Net Revenues
Total delta including FX effects
245 0 43 84 24 5 (2) (333) (10) 16(1) FX effects
(1,475)
(1,543)
HXB(3)(2)
Note: Figures may not add up due to rounding differences(1) To exclude the FX effects the prior year figures were recalculated using the corresponding current year’s monthly FX rates(2) Excludes impairment / valuation of Hua Xia Bank (HXB) stake(3) Includes reversal of impairment and transaction-related valuation effects
excluding FX effect(1)

financial transparency. 4Q2015 results 11 March 2016
Deutsche BankInvestor Relations
Full year Net Income Net income FY2015 vs. FY2014, in EUR m
4
— FY2015 EUR 6.5 bn impact from impairment of goodwill and other intangibles and Hua Xia Bank stake
— Revenues slightly up excluding impairment of HuaXia Bank
— Favourable LLP environment— Adjusted cost improved with
lower NCOU expenses and other cost saves, offset by increased regulatory spend and bank levies
— Increase in Litigation charges (EUR (3.1) bn)
— Lower tax charge, however, higher full year tax expense than expected due to significant non-tax deductible goodwill impairments and Litigation charges
Note: Comments refer to numbers excl. FX effects
FX-adjusted deltas(1):
Note: Figures may not add up due to rounding differences(1) To exclude the FX effects the prior year figures were recalculated using the corresponding current year’s monthly FX rates(2) Excludes impairment / valuation of Hua Xia Bank (HXB) stake(3) Includes impairment of stake and valuation effects
(574)148185215
184302
25037
(815)1,691
FY 2015
(6,772)(5,585)
(697)
Net FX
effect
TaxRestr. & Sev.
(3,093)
Liti-gation
874
Adj. cost base
LLPC&ANCOU
107
GTBPBCCB&SFY 2014
AWM
Net Revenues
589 44 497 705 229 210 178 (1,498) (3,247) 750(590)
(2)HXB
1,404 6 247 403 46 (5) (7) (1,646) (154) (123)(17)
(3,519)
172
Total delta including FX effects
FX effects
(3)Policyh./Impairm.
excluding FX effect(1)
financial transparency. 4Q2015 results 11 March 2016
Deutsche BankInvestor Relations
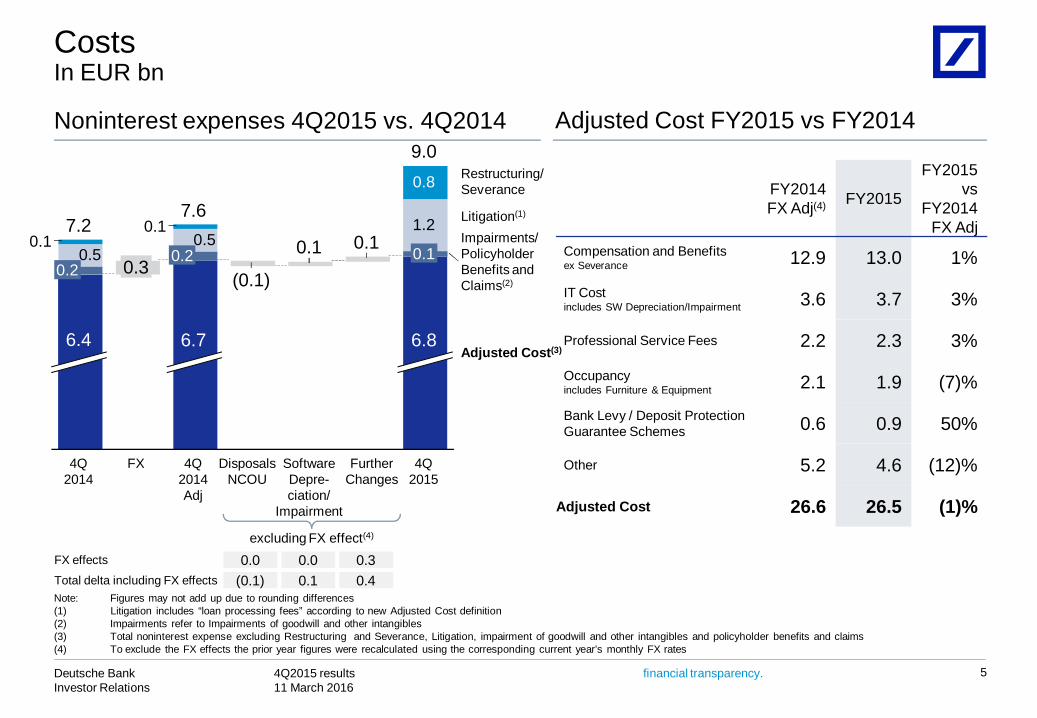
CostsIn EUR bn
5
Note: Figures may not add up due to rounding differences(1) Litigation includes “loan processing fees” according to new Adjusted Cost definition(2) Impairments refer to Impairments of goodwill and other intangibles(3) Total noninterest expense excluding Restructuring and Severance, Litigation, impairment of goodwill and other intangibles and policyholder benefits and claims(4) To exclude the FX effects the prior year figures were recalculated using the corresponding current year’s monthly FX rates
0.8
4Q2014 Adj
7.6
6.7
4Q 2014
0.50.1
FurtherChanges
0.1
Software Depre-ciation/
Impairment
0.1
DisposalsNCOU
(0.1)
FX
0.3
7.2
6.4
0.20.5
0.1
Adjusted Cost(3)
Impairments/PolicyholderBenefits andClaims(2)
Litigation(1)
0.2
Restructuring/Severance
4Q2015
9.0
6.8
0.1
1.2
excluding FX effect(4)
FX effects 0.0 0.0 0.3Total delta including FX effects (0.1) 0.1 0.4
Noninterest expenses 4Q2015 vs. 4Q2014 Adjusted Cost FY2015 vs FY2014
FY2014FX Adj(4) FY2015
FY2015 vs
FY2014 FX Adj
Compensation and Benefitsex Severance 12.9 13.0 1%
IT Costincludes SW Depreciation/Impairment 3.6 3.7 3%
Professional Service Fees 2.2 2.3 3%
Occupancyincludes Furniture & Equipment 2.1 1.9 (7)%
Bank Levy / Deposit ProtectionGuarantee Schemes 0.6 0.9 50%
Other 5.2 4.6 (12)%
Adjusted Cost 26.6 26.5 (1)%

financial transparency. 4Q2015 results 11 March 2016
Deutsche BankInvestor Relations
Litigation updateIn EUR bn
6
2.6 2.4
0.4 0.3
30 Sep 2015 31 Dec 2015
Litigation reserves Contingent liabilitiesMortgage repurchase demands/reserves(1)
DemandsReserves
In USD bn
— Settlements and resolutions have been achieved in 4Q2015 including:— US Sanction Violations (FED and
NY State DFS) - USD 258 m— DoJ Tax Program for Swiss
Banks — EC’s CDS Antitrust Investigation
and parallel US civil litigation
— Includes possible obligations where an estimate can be made and outflow is more than remote but less than probable for significant matters
— Decrease from 3Q2015 to 4Q2015 primarily driven by provisions taken in certain matters as well as closure of proceedings
— Reserves treated as negative revenues in NCOU
— Reserve decrease from 3Q2015 to 4Q2015 was the result of payments made in 4Q2015 in connection with settlements reached in prior periods
4.85.5
30 Sep 2015 31 Dec 2015
(1) As of Dec. 31, 2015, Deutsche Bank has approximately USD 2.4 bn of mortgage repurchase demands outstanding and not subject to agreements to rescind (based on original principal balance of the loans). These demands consist primarily of demands made in respect of private label securitizations by the trustees or servicers thereof. Against these outstanding demands, Deutsche Bank recorded provisions of USD 445 m (EUR 409 m) as of Dec. 31, 2015. Deutsche Bank is the beneficiary of indemnity agreements from the originators or sellers of certain of the mortgage loans subject to these demands, with respect to which Deutsche Bank has recognized receivables of USD 109 m (EUR 100 m) as of Dec. 31, 2015. The net provisions against these demands following deduction of such receivables were USD 336 m (EUR 308 m) as of Dec. 31, 2015.
2.6 2.4
30 Sep 2015 31 Dec 2015

financial transparency. 4Q2015 results 11 March 2016
Deutsche BankInvestor Relations
Tier 1 capitalCRD4, fully loaded
7
Events in the quarter Tier 1 capitalIn EUR bn
Note: Figures may not add up due to rounding differences(1) Includes both DTAs on temporary differences and DTAs on unused tax losses/tax credits
(1)
— CET1 capital down by EUR (2.8) bn, mainly driven by — EUR (2.1) bn net loss— EUR (0.5) bn higher DTA largely due to the net loss in
the quarter— EUR (0.4) bn “other”, principally higher deductions
under the 10/15% rule as the threshold for Financial Sector Entity holdings and DTA came down given the loss in the quarter
Common Equity Tier 1Additional Tier 1 capital
(0.1)
DTA
(0.5)
Net Income
(2.1)
30 Sep 2015
46.9
Other
(0.4)
AT1 Coupons
31 Dec 2015
44.1
FX Effect
0.4
4.6 4.6

financial transparency. 4Q2015 results 11 March 2016
Deutsche BankInvestor Relations
RWA In EUR bn
8
Events in the quarter RWA reduction of EUR (11) bn, key drivers:— Credit Risk RWA decreased reflecting our de-risking
efforts and reduced risk levels, partly offset by the increase in the applicable risk weight for Abbey Life from 100% to 370%, following ECB guidance in the context of harmonizing regulatory treatments across SSM-countries
— Market risk RWA declined due to reduction of securitisation inventory and lower overall risk levels
— Increase in Operational risk RWA driven by RWA inflation from recent internal and industry losses/settlements
— Signing of sale of 19.99% stake in Hua Xia Bank on Dec. 28, 2015— Pro-forma CET 1 ratio of ~11.7% as of Dec. 31, 2015;
final impact subject to regulatory capital and capital composition at time of closing
11.5% 11.1%CET 1 ratio, fully loaded
33
FX effectOpera-tional risk
Market risk
(11)
CVA(1)
(3)
Credit risk
(4)
30 Sep 2015
408
31 Dec 2015
397
30 Sep2015
31 Dec2015
QoQChange
ThereinFX
CB&S 201 195 (6) 2PBC 79 80 1 0GTB 54 52 (2) 1AWM 20 24 4 0NCOU 41 34 (7) 1Other 12 11 (0) 0Total 408 397 (11) 3
Note: Figures may not add up due to rounding differences(1) Credit Valuation Adjustments
financial transparency. 4Q2015 results 11 March 2016
Deutsche BankInvestor Relations
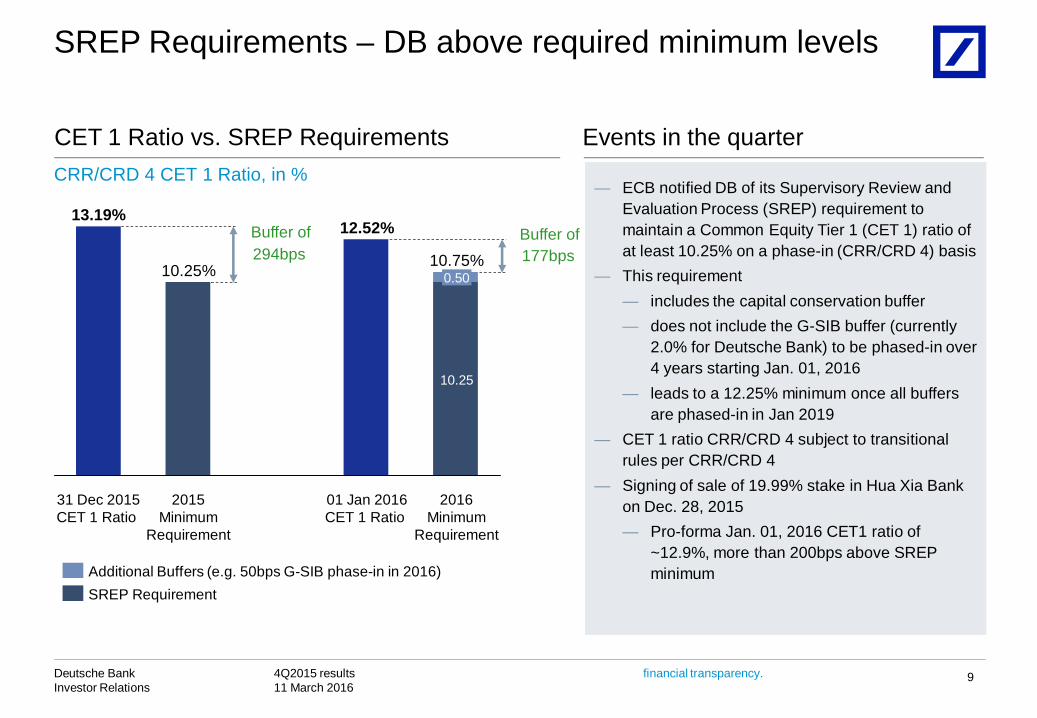
SREP Requirements – DB above required minimum levels
9
Events in the quarter
294bps 10.75% 177bps
2016 Minimum
Requirement
10.25
0.50
01 Jan 2016 CET 1 Ratio
12.52%
2015 Minimum
Requirement
10.25%
31 Dec 2015 CET 1 Ratio
13.19%
Additional Buffers (e.g. 50bps G-SIB phase-in in 2016)SREP Requirement
— ECB notified DB of its Supervisory Review and Evaluation Process (SREP) requirement to maintain a Common Equity Tier 1 (CET 1) ratio of at least 10.25% on a phase-in (CRR/CRD 4) basis
— This requirement — includes the capital conservation buffer— does not include the G-SIB buffer (currently
2.0% for Deutsche Bank) to be phased-in over 4 years starting Jan. 01, 2016
— leads to a 12.25% minimum once all buffers are phased-in in Jan 2019
— CET 1 ratio CRR/CRD 4 subject to transitional rules per CRR/CRD 4
— Signing of sale of 19.99% stake in Hua Xia Bank on Dec. 28, 2015— Pro-forma Jan. 01, 2016 CET1 ratio of
~12.9%, more than 200bps above SREP minimum
CET 1 Ratio vs. SREP RequirementsCRR/CRD 4 CET 1 Ratio, in %
Buffer of Buffer of
financial transparency. 4Q2015 results 11 March 2016
Deutsche BankInvestor Relations
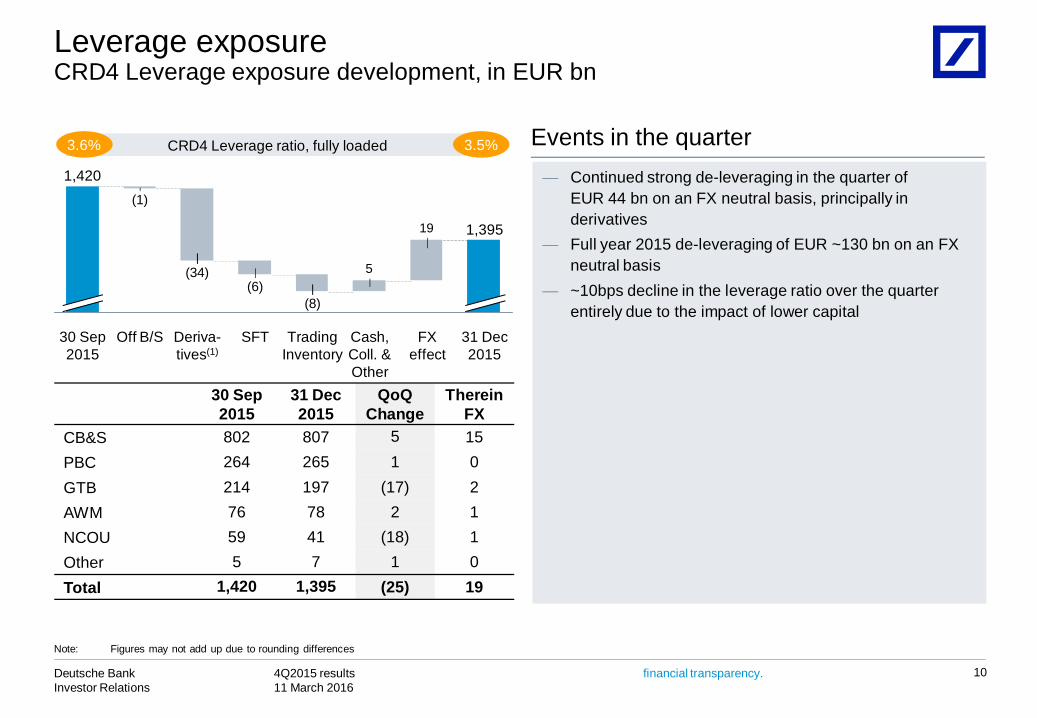
Leverage exposure CRD4 Leverage exposure development, in EUR bn
10
Events in the quarter
30 Sep2015
31 Dec2015
QoQChange
ThereinFX
CB&S 802 807 5 15 PBC 264 265 1 0 GTB 214 197 (17) 2 AWM 76 78 2 1 NCOU 59 41 (18) 1 Other 5 7 1 0 Total 1,420 1,395 (25) 19
19
5
1,420
(34)(6)
(8)
(1)
31 Dec 2015
1,395
FX effect
Cash, Coll. & Other
SFTOff B/S Trading Inventory
Deriva-tives(1)
30 Sep 2015
3.6% 3.5%CRD4 Leverage ratio, fully loaded
Note: Figures may not add up due to rounding differences
— Continued strong de-leveraging in the quarter of EUR 44 bn on an FX neutral basis, principally in derivatives
— Full year 2015 de-leveraging of EUR ~130 bn on an FX neutral basis
— ~10bps decline in the leverage ratio over the quarter entirely due to the impact of lower capital
financial transparency. 4Q2015 results 11 March 2016
Deutsche BankInvestor Relations
11
Segment results
financial transparency. 4Q2015 results 11 March 2016
Deutsche BankInvestor Relations
Corporate Banking & Securities
Income before income taxes Key featuresIn EUR m In EUR m 4Q15 4Q14 4Q15
vs. 4Q14 FY15 FY14 FY15 vs. FY14
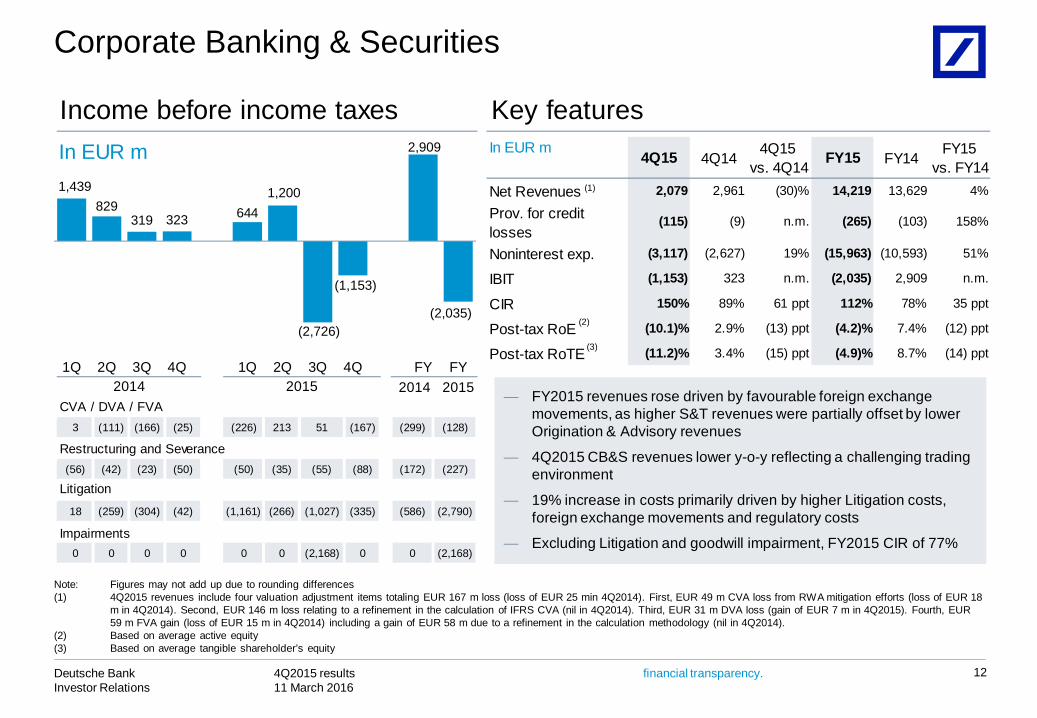
Net Revenues 2,079 2,961 (30)% 14,219 13,629 4%
Prov. for credit losses
(115) (9) n.m. (265) (103) 158%
Noninterest exp. (3,117) (2,627) 19% (15,963) (10,593) 51%
IBIT (1,153) 323 n.m. (2,035) 2,909 n.m.
CIR 150% 89% 61 ppt 112% 78% 35 ppt
Post-tax RoE (10.1)% 2.9% (13) ppt (4.2)% 7.4% (12) ppt
Post-tax RoTE (11.2)% 3.4% (15) ppt (4.9)% 8.7% (14) ppt
2014 2015CVA / DVA / FVA
3 (111) (166) (25) (226) 213 51 (167) (299) (128)
Restructuring and Severance(56) (42) (23) (50) (50) (35) (55) (88) (172) (227)
Litigation_2
18 (259) (304) (42) (1,161) (266) (1,027) (335) (586) (2,790)
Impairments0 0 0 0 0 0 (2,168) 0 0 (2,168)
2014 2015
(2)
(1)
(3)
Note: Figures may not add up due to rounding differences(1) 4Q2015 revenues include four valuation adjustment items totaling EUR 167 m loss (loss of EUR 25 min 4Q2014). First, EUR 49 m CVA loss from RWA mitigation efforts (loss of EUR 18
m in 4Q2014). Second, EUR 146 m loss relating to a refinement in the calculation of IFRS CVA (nil in 4Q2014). Third, EUR 31 m DVA loss (gain of EUR 7 m in 4Q2015). Fourth, EUR 59 m FVA gain (loss of EUR 15 m in 4Q2014) including a gain of EUR 58 m due to a refinement in the calculation methodology (nil in 4Q2014).
(2) Based on average active equity (3) Based on average tangible shareholder’s equity
1,439829
319 323 6441,200
(2,726)
(1,153)
2,909
(2,035)
1Q 2Q 3Q 4Q 1Q 2Q 3Q 4Q FY FY
12
— FY2015 revenues rose driven by favourable foreign exchange movements, as higher S&T revenues were partially offset by lower Origination & Advisory revenues
— 4Q2015 CB&S revenues lower y-o-y reflecting a challenging trading environment
— 19% increase in costs primarily driven by higher Litigation costs, foreign exchange movements and regulatory costs
— Excluding Litigation and goodwill impairment, FY2015 CIR of 77%

financial transparency. 4Q2015 results 11 March 2016
Deutsche BankInvestor Relations
Revenues Key revenue featuresDebt S&T, in EUR m
2014 2015
Equity S&T, in EUR m
2014 20152014
2014 2015
2015
Sales & Trading revenues
13
Note: 4Q2015 Sales and Trading revenues include three valuation adjustment items totaling EUR (136) m loss, of which EUR (135) m loss was included in Debt S&T and EUR (1) m loss was included in Equity S&T. First, EUR (49) m CVA loss from RWA mitigation efforts (EUR (42) m loss in Debt S&T, EUR (7) m loss in Equity S&T). Second, EUR (146) m loss in Debt S&T relating to a refinement in the calculation of IFRS CVA. Third, EUR 59 m FVA gain (EUR 53 m gain in Debt S&T, EUR 6 m in Equity S&T), including a gain of EUR 56 m due to a refinement in the calculation methodology.
Debt Sales & Trading revenues— FY2015 revenues higher y-o-y driven by favourable foreign exchange
movements coupled with strong FX and Rates performance— 4Q2015 FX in line y-o-y reflecting solid client activity and ongoing
market volatility— Rates significantly higher y-o-y driven by increased client activity in
Europe— RMBS significantly lower y-o-y reflecting ongoing market challenges— Credit Solutions lower y-o-y vs a strong 4Q2014— EM Debt higher y-o-y despite challenging markets and our exit from
RussiaEquity Sales & Trading revenues— FY2015 revenues higher y-o-y driven by favourable foreign exchange
movements, a strong 1H and good performance in Asia— 4Q2015 Cash Equities lower y-o-y on lower client activity— Equity Derivatives significantly lower y-o-y driven by lower client activity
exacerbated by challenging risk management in certain areas— Prime Finance higher y-o-y benefiting from increased client balances
2,4061,804 1,411 1,1252,617 2,1131,714
947
6,7477,391
1Q 2Q 3Q 4Q 1Q 2Q 3Q 4Q FY FY
(16)%
10%
767 698 726 7251,009 975
587 520
2,917 3,091
1Q 2Q 3Q 4Q 1Q 2Q 3Q 4Q FY FY
(28)%
6%

financial transparency. 4Q2015 results 11 March 2016
Deutsche BankInvestor Relations
Revenues Key revenue featuresIn EUR m
2014 201520152014
AdvisoryOrigination
Origination & Advisory
14
Note: Rankings and market share refer to Dealogic fees; figures may not add up due to rounding differences
2014 2015
Overall— Origination and Advisory market share declined in FY2015
partially reflecting lower risk appetite, particularly in Leveraged Finance
— 4Q2015 revenues down 43%, reflecting lower activity across origination and advisory markets and lower market share in certain segments
Advisory— FY2015 M&A market share declined y-o-y driven by Americas
and EMEA, partly offset by increase in APAC
— 4Q2015 revenues lower y-o-y driven by Europe reflecting weaker deal volume as some delayed by market conditions
Equity Origination — FY2015 revenues down y-o-y reflecting a lower fee pool in H2
— 4Q2015 revenues lower y-o-y due to increased market volatility and a relatively strong 4Q2014
Debt Origination — 4Q2015 revenues significantly lower y-o-y reflecting reduced
market activity and lower risk tolerance
— #2 in global High Yield and #3 in global Loans in FY2015
517 680 535 551 637 709455
306
2,283
2,107
106130
155 187 145 145
181116
578586
623810
690 738 782 853636
422
2,8612,693
1Q 2Q 3Q 4Q 1Q 2Q 3Q 4Q FY FY
(43)%
(6)%

financial transparency. 4Q2015 results 11 March 2016
Deutsche BankInvestor Relations
Income before income taxes Key featuresIn EUR m In EUR m 4Q15 4Q14 4Q15
vs. 4Q14 FY15 FY14 FY15 vs. FY14
Net Revenues 2,232 2,389 (7)% 8,911 9,565 (7)%Prov. for credit losses (150) (187) (20)% (501) (622) (20)%
Noninterest exp. (2,757) (2,194) 26% (11,700) (7,753) 51%
IBIT (675) 8 n.m. (3,291) 1,189 n.m.
CIR 124% 92% 32 ppt 131% 81% 50 pptPost-tax RoE (13.5)% 0.1% (14) ppt (14.1)% 5.2% (19) ppt
Post-tax RoTE (15.6)% 0.2% (16) ppt (18.2)% 7.2% (25) ppt
2014 2015Restructuring and Severance(48) 1 (22) (86) (2) 0 0 (669) (156) (670)
Litigation_2
(0) (32) (38) (330) (1) (0) (12) (3) (400) (16)
Impairments0 0 0 0 0 0 (4,251) (49) 0 (4,300)
2014 2015
(1)
(2)
(3)
(4)
Note: Figures may not add up due to rounding differences(1) Based on average active equity(2) Based on average tangible shareholders’ equity(3) Litigation includes “loan processing fees” according to new ACB definition(4) 3Q2015 includes Goodwill /other intangible impairment of EUR 3.6 bn and
impairment of Hua Xia Bank stake of EUR 0.6 bn; 4Q2015 Includes reversalof impairment and transaction-related valuation effects of Hua Xia Bank
474 379 328
8
536 483
(3,634)
(675)
1,189
(3,291)
1Q 2Q 3Q 4Q 1Q 2Q 3Q 4Q FY FY
Private & Business Clients
15
— FY2015 IBIT significantly impacted by impairments and Restructuring and Severance
— FY2015 revenues broadly flat excluding impairment of Hua Xia Bank stake
— 4Q2015 revenues impacted by stake valuation and other transaction effects relating to Hua Xia Bank. Lower Deposit revenues (due to ongoing low interest rate environment) partly offset by sustained revenue growth in Credit products
— 4Q2015 noninterest expenses impacted by Restructuring and Severance expenses as well as a software write-off of EUR 131 m
— Lower loan loss provisions reflecting portfolio quality and the benign economic environment

financial transparency. 4Q2015 results 11 March 2016
Deutsche BankInvestor Relations
Private & Business Clients: Profit by business unitIncome before income taxes, in EUR m
16
20152014
Private & Commercial Banking Postbank(1) Advisory Banking International
20152014 20152014
105146 160 168
206 224
(630)
22
1Q 2Q 3Q 4Q 1Q 2Q 3Q 4Q
Therein HXB equity pick-up:
95 110104 110 123 143 144 112168
137 127
(67)
206
122
(2,628)
(38)
1Q 2Q 3Q 4Q 1Q 2Q 3Q 4Q
201
9641
(93)
124 137
(376)
(659)
1Q 2Q 3Q 4Q 1Q 2Q 3Q 4Q
62(5)(505)(4)
:
110(3)(2)
4Q2015 IBIT significantly impacted by restructuring costs of EUR 0.6 bn and a software write-off of EUR 0.1 bn. Continued growth in credit product revenues
4Q2015 IBIT impacted by negative Hua Xia stake valuation/transaction-related effects. In Europe, stable revenues and higher costs (mainly regulatory-driven)
4Q2015 IBIT significantly impacted by severance costs of EUR 0.1 bn. Credit products with continued strong growth
(1) Contains the major core business activities of Postbank AG as well as BHW and norisbank(2) Excludes EUR (0.6) bn Hua Xia Bank stake impairment(3) Excludes EUR (49) m Hua Xia stake valuation/transaction-related effects(4) Net IBIT of Hua Xia after EUR (649) m stake impairment(5) Net IBIT of Hua Xia after EUR (49) m stake valuation/transaction-related effects

financial transparency. 4Q2015 results 11 March 2016
Deutsche BankInvestor Relations
Income before income taxes Key featuresIn EUR m In EUR m 4Q15 4Q14 4Q15
vs. 4Q14 FY15 FY14 FY15 vs. FY14
Net Revenues 1,175 1,039 13% 4,616 4,119 12%Prov. for credit losses (91) (42) 118% (127) (156) (18)%
Noninterest exp. (737) (750) (2)% (3,050) (2,811) 9%
IBIT 347 247 40% 1,439 1,152 25%
CIR 63% 72% (9) ppt 66% 68% (2) ppt
Post-tax RoE 11.6% 9.6% 2 ppt 12.2% 12.4% (0) ppt
Post-tax RoTE 13.4% 11.1% 2 ppt 14.2% 14.5% (0) ppt
2014 2015Restructuring and Severance
(4) (8) (2) (13) (2) (1) (1) (18) (27) (22)
Litigation_2
2 (100) 3 (18) (0) (139) (2) (1) (113) (141)
2014 2015
(1)
(2)
(3)
356220
329247
408282
402347
1,152
1,439
1Q 2Q 3Q 4Q 1Q 2Q 3Q 4Q FY FY
Note: Figures may not add up due to rounding differences(1) Based on average active equity(2) Based on average tangible shareholders’ equity(3) Trade Finance and Cash Management Corporates(4) Institutional Cash and Securities Services(5) The Banker, Transaction Banking Awards 2015, Oct 2015(6) Euromoney Cash Management Survey 2015, Oct 2015
Global Transaction Banking
17
— FY2015 pre-tax profit increased 25% to EUR 1.4 bn driven by good business development in still difficult environment
— FY2015 revenues increased 12% supported by favourableforeign exchange movements
— Solid 4Q2015 revenue development; volumes in TF/CMC(3) and ICSS(4) holding up predominantly in the Americas and EMEA
— LLP increase mainly due to specific cases in Trade Finance— Despite adverse FX impact, non-interest expenses decreased
mainly due to lower litigation and performance-related expenses— ‘Best Transaction Bank from Europe’(5), No.1 Best Cash
Manager for Financial Institutions’(6) and ‘No.1 Cash Management Provider for Corporates in Western Europe’(6)
financial transparency. 4Q2015 results 11 March 2016
Deutsche BankInvestor Relations
Income before income taxes Key featuresIn EUR m In EUR m 4Q15 4Q14 4Q15
vs. 4Q14 FY15 FY14 FY15 vs. FY14
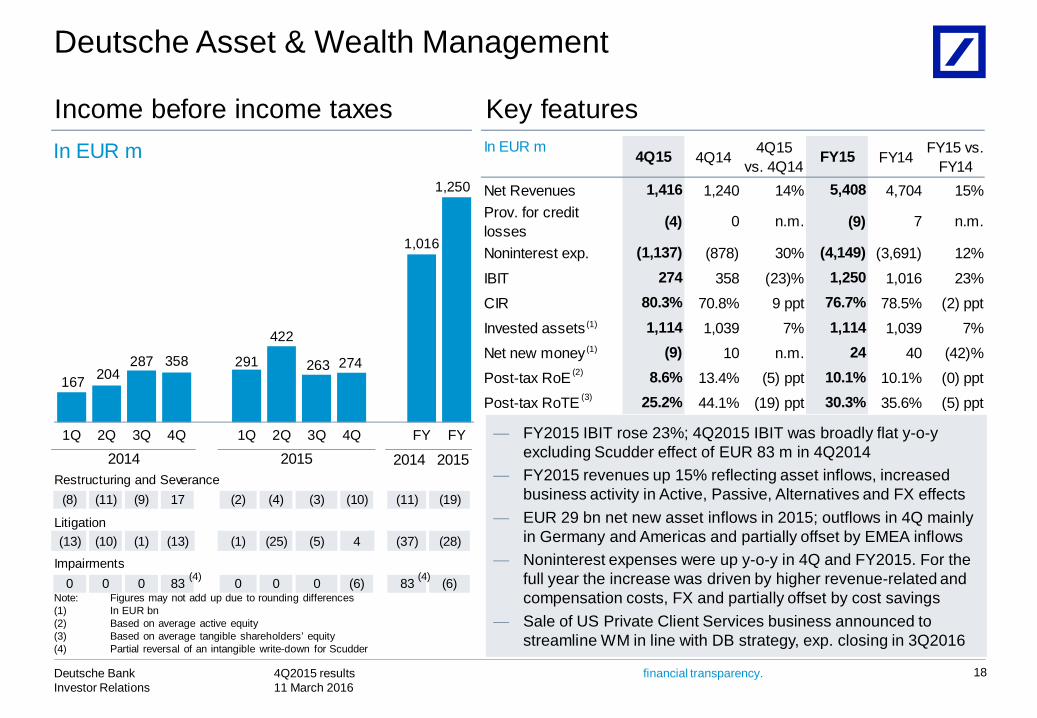
Net Revenues 1,416 1,240 14% 5,408 4,704 15%Prov. for credit losses (4) 0 n.m. (9) 7 n.m.
Noninterest exp. (1,137) (878) 30% (4,149) (3,691) 12%
IBIT 274 358 (23)% 1,250 1,016 23%
CIR 80.3% 70.8% 9 ppt 76.7% 78.5% (2) ppt
Invested assets 1,114 1,039 7% 1,114 1,039 7%
Net new money (9) 10 n.m. 24 40 (42)%
Post-tax RoE 8.6% 13.4% (5) ppt 10.1% 10.1% (0) ppt
Post-tax RoTE 25.2% 44.1% (19) ppt 30.3% 35.6% (5) ppt
2014 2015Restructuring and Severance
(8) (11) (9) 17 (2) (4) (3) (10) (11) (19)
Litigation_2(13) (10) (1) (13) (1) (25) (5) 4 (37) (28)
Impairments0 0 0 83 0 0 0 (6) 83 (6)
2014 2015
(1)
(1)
(2)
(3)167 204
287 291
422
263 274
1,016
1,250
358
1Q 2Q 3Q 4Q 1Q 2Q 3Q 4Q FY FY
Note: Figures may not add up due to rounding differences(1) In EUR bn(2) Based on average active equity(3) Based on average tangible shareholders’ equity(4) Partial reversal of an intangible write-down for Scudder
Deutsche Asset & Wealth Management
18
(4)(4)
— FY2015 IBIT rose 23%; 4Q2015 IBIT was broadly flat y-o-y excluding Scudder effect of EUR 83 m in 4Q2014
— FY2015 revenues up 15% reflecting asset inflows, increased business activity in Active, Passive, Alternatives and FX effects
— EUR 29 bn net new asset inflows in 2015; outflows in 4Q mainly in Germany and Americas and partially offset by EMEA inflows
— Noninterest expenses were up y-o-y in 4Q and FY2015. For the full year the increase was driven by higher revenue-related and compensation costs, FX and partially offset by cost savings
— Sale of US Private Client Services business announced to streamline WM in line with DB strategy, exp. closing in 3Q2016
financial transparency. 4Q2015 results 11 March 2016
Deutsche BankInvestor Relations
Income before income taxes Key featuresIn EUR m In EUR m 4Q15 4Q14 4Q15
vs. 4Q14 FY15 FY14 FY15 vs. FY14
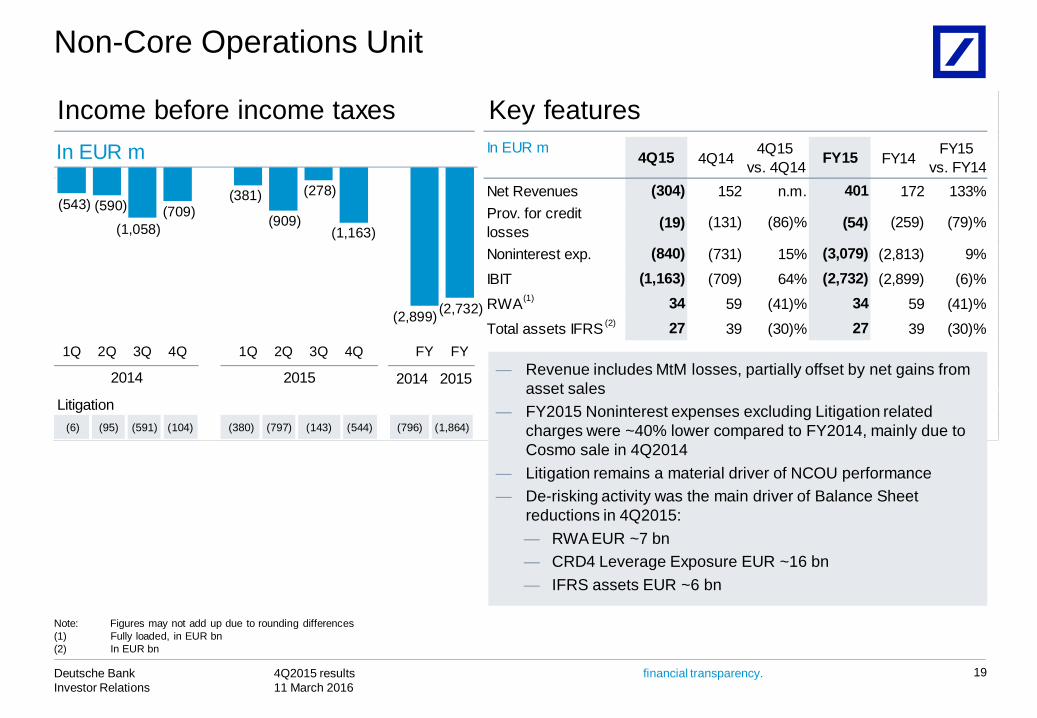
Net Revenues (304) 152 n.m. 401 172 133%Prov. for credit losses (19) (131) (86)% (54) (259) (79)%
Noninterest exp. (840) (731) 15% (3,079) (2,813) 9%
IBIT (1,163) (709) 64% (2,732) (2,899) (6)%
RWA 34 59 (41)% 34 59 (41)%
Total assets IFRS 27 39 (30)% 27 39 (30)%
2014 2015
Litigation_2(6) (95) (591) (104) (380) (797) (143) (544) (796) (1,864)
20152014
(2)
(1)
(543) (590)
(1,058)(709)
(381)
(909)
(278)
(1,163)
(2,899) (2,732)
1Q 2Q 3Q 4Q 1Q 2Q 3Q 4Q FY FY
Non-Core Operations Unit
19
— Revenue includes MtM losses, partially offset by net gains from asset sales
— FY2015 Noninterest expenses excluding Litigation related charges were ~40% lower compared to FY2014, mainly due to Cosmo sale in 4Q2014
— Litigation remains a material driver of NCOU performance— De-risking activity was the main driver of Balance Sheet
reductions in 4Q2015: — RWA EUR ~7 bn— CRD4 Leverage Exposure EUR ~16 bn— IFRS assets EUR ~6 bn
Note: Figures may not add up due to rounding differences(1) Fully loaded, in EUR bn(2) In EUR bn

financial transparency. 4Q2015 results 11 March 2016
Deutsche BankInvestor Relations
Income before income taxes Key featuresIn EUR m In EUR m 4Q15 4Q14 4Q15
vs. 4Q14 FY15 FY14 FY15 vs. FY14
IBIT (333) 25 n.m. (729) (251) 190%
thereof
V&T differences (167) (29) n.m. (146) (172) (15)%
FVA 149 18 n.m. 72 (66) n.m.Bank levies 142 1 n.m. (5) 0 n.m.Remaining (458) 35 n.m. (649) (14) n.m.
2014 2015
Litigation_2(1) (6) (1) (30) (1) (0) (21) (358) (38) (380)
20152014
(1)
(2)
Note: Figures may not add up due to rounding differences(1) Valuation and Timing (V&T) reflects the effects from different accounting
methods used for management reporting and IFRS(2) Funding Valuation Adjustment (FVA)(3) Charges reflected in 1Q2015 allocated to corporate Divisions over the
course of the year
(213)
(124)
6125
(18)
(250)
(127)
(333)(251)
(729)
1Q 2Q 3Q 4Q 1Q 2Q 3Q 4Q FY FY
Consolidation & Adjustments
20
— Negative effects in 4Q2015 from V&T driven by a narrowing of DB’s own credit spreads, narrowing of the basis spread between EUR/USD, and finalization of methodology refinements
— Remaining includes negative impact of EUR 358 m Litigation costs related to infrastructure functions reallocated from CB&S to C&A, partially offset by positive FVA on uncollateralized intercompany derivatives as well as a methodology change in 4Q2015
— 4Q2015 positive impact from offset of divisional accruals of Bank Levies(3)
financial transparency. 4Q2015 results 11 March 2016
Deutsche BankInvestor Relations
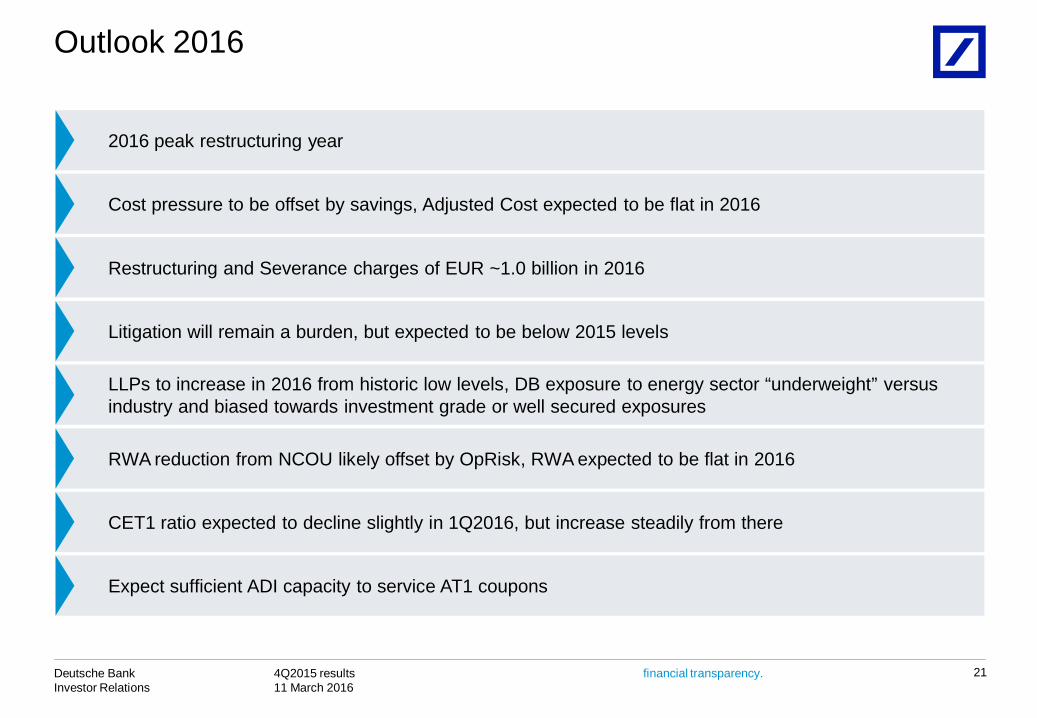
Outlook 2016
21
Expect sufficient ADI capacity to service AT1 coupons
Litigation will remain a burden, but expected to be below 2015 levels
Restructuring and Severance charges of EUR ~1.0 billion in 2016
Cost pressure to be offset by savings, Adjusted Cost expected to be flat in 2016
2016 peak restructuring year
CET1 ratio expected to decline slightly in 1Q2016, but increase steadily from there
LLPs to increase in 2016 from historic low levels, DB exposure to energy sector “underweight” versus industry and biased towards investment grade or well secured exposures
RWA reduction from NCOU likely offset by OpRisk, RWA expected to be flat in 2016

financial transparency. 4Q2015 results 11 March 2016
Deutsche BankInvestor Relations
22
Appendix

financial transparency. 4Q2015 results 11 March 2016
Deutsche BankInvestor Relations
Appendix: Table of Contents
23
24P&L Details
33NCOU Details
34CRD4 – Leverage Exposure and Risk Weighted Assets
35Loan book
36Impaired loans
37Value-at-Risk
Funding
Total Loss Absorbing Capacity (TLAC)38
39Invested assets 40Group Headcount 43
financial transparency. 4Q2015 results 11 March 2016
Deutsche BankInvestor Relations
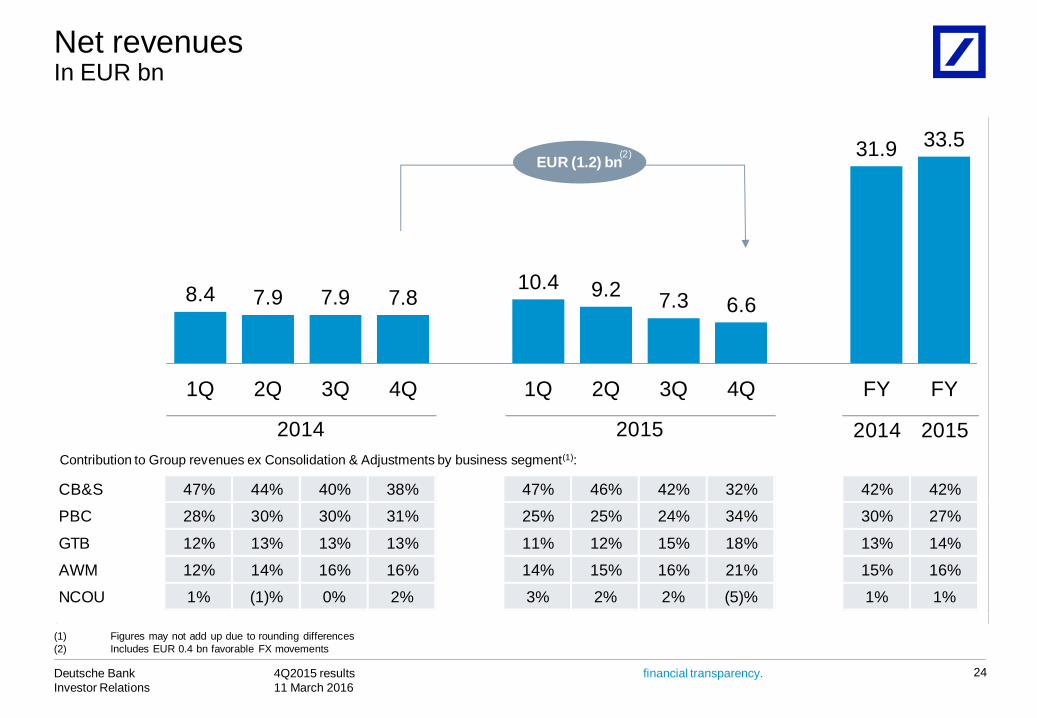
Net revenuesIn EUR bn
24
Contribution to Group revenues ex Consolidation & Adjustments by business segment(1):
2014 2015
CB&S 47% 44% 40% 38% 47% 46% 42% 32% 42% 42%
PBC 28% 30% 30% 31% 25% 25% 24% 34% 30% 27%
GTB 12% 13% 13% 13% 11% 12% 15% 18% 13% 14%
AWM 12% 14% 16% 16% 14% 15% 16% 21% 15% 16%
NCOU 1% (1)% 0% 2% 3% 2% 2% (5)% 1% 1%
2014 2015
EUR (1.2) bn(2)
(1) Figures may not add up due to rounding differences(2) Includes EUR 0.4 bn favorable FX movements
8.4 7.9 7.9 7.810.4 9.2 7.3 6.6
31.9 33.5
1Q 2Q 3Q 4Q 1Q 2Q 3Q 4Q FY FY

financial transparency. 4Q2015 results 11 March 2016
Deutsche BankInvestor Relations
179 230 227 237190 146 205
361 874 902
6719 42
131
285
2
19
25954
1Q 2Q 3Q 4Q 1Q 2Q 3Q 4Q FY FY
NCOU Core
0.00%
0.20%
0.40%
Provision for credit lossesIn EUR m
25
2014 2015
(1) (1)
2014 2015
246 250 269369
218151
1,134
956Cost of Risk DB Group Cost of Risk Core Bank
Cost of Risk(1)
207
CB&S 16 44 33 9 37 57 56 115 103 265
GTB 24 47 43 42 15 (12) 34 91 156 127
PBC 140 145 150 187 135 100 116 150 622 501
Note: Divisional figures do not add up due to omission of Deutsche AWM; figures may not add up due to rounding differences(1) Provision for credit losses annualized in % of total loan book; total loan book see page 35
380

financial transparency. 4Q2015 results 11 March 2016
Deutsche BankInvestor Relations
2014 2015
Adj. cost base (in EUR m) 6,280 6,045 6,248 6,380 6,914 6,516 6,210 6,811 24,953 26,451excludes:
Impairment of Goodwill & Intangibles 0 0 0 111 0 0 5,770 6 111 5,776
Litigation 0 501 932 538 1,544 1,227 1,209 1,238 1,971 5,218
Policyholder benefits and claims 52 80 77 80 153 10 (29) 122 289 256
Restructuring and Severance 134 67 71 103 67 45 63 790 375 965
Cost / income ratio (reported) 77% 85% 93% 92% 84% 85% 180% 135% 87% 115%
Compensation ratio (reported) 40% 38% 41% 38% 33% 38% 45% 47% 39% 40%
2014 2015
(1)
(2)
Reported and adjusted costsNoninterest expenses, in EUR bn
26
Compensation and benefitsNoninterest expenses excl. compensation and benefits
3.3 3.0 3.2 3.0 3.4 3.4 3.3 3.112.5 13.33.1 3.7 4.1 4.2 5.2 4.4 9.9 5.9
15.225.4
6.5 6.7 7.3 7.2 8.7 7.8 13.2
9.0
27.7
38.7
1Q 2Q 3Q 4Q 1Q 2Q 3Q 4Q FY FY
Note: Adjusted Cost is a non-GAAP financial measure most directly comparable to the IFRS financial measure noninterest expenses. Adjusted Cost is calculated by adjusting noninterest expenses under IFRS for the excluded items mentioned above. Figures may not add up due to rounding differences.
(1) 4Q2014 includes recovery of goodwill and other intangibles of EUR 83 m and EUR ~200 m Maher impairment in NCOU; 3Q2015 includes goodwill and other intangibles impairment of EUR 5.8 bn in CB&S and PBC
(2) 2Q2014 – 4Q2014 include charges from loan processing fees (EUR 32 m 2Q2014, EUR 38 m 3Q2014, EUR 330 m in 4Q2014)
(in EUR m)

financial transparency. 4Q2015 results 11 March 2016
Deutsche BankInvestor Relations
New definition of “Adjusted Costs”Noninterest expenses 2015, in EUR bn
27
In October 2015 we presented the new concept of “Adjusted Cost” with reduced carve-outs:
— Litigation cost
— Restructuring and Severance
— Impairments
— Policyholder benefits and claims
All other costs are included in Adjusted Cost. Restructuring and Severance are the most significant to achieve our cost savings.
Litigation(2)
Impairments /Policyholderbenefits and
claims(1)
2015old definition
Oldadjusted
cost
CtA(3)
38.7
25.4
1.8
5.2
6.3
AdjustedCost
Restructuring & Severance
~ 23.0
~3.5
38.7
26.5
1.0
5.2
6.0
Disposals(4)
Future bankperimeter
(1) Impairments refer to Impairments of goodwill and other intangibles. The old definition also includes other disclosed cost specific items, which become part of adjusted costs under the new definition
(2) Includes loan processing fees recorded in PBC (3) CtA includes other severance (4) Executed and planned disposals, e.g. related to Postbank and NCOU operating assets
2015new definition

financial transparency. 4Q2015 results 11 March 2016
Deutsche BankInvestor Relations
In EUR m IBIT reported CVA / DVA / FVA Restructuring and Severance Litigation Impairments
CB&S (1,153) (167) (88) (335) 0
PBC (675) 0 (669) (3) (49)
GTB 347 0 (18) (1) 0
AWM 274 0 (10) 4 (6)
C&A (333) 149 0 (358) (0)
Core Bank (1,541) (18) (786) (693) (55)
NCOU (1,163) 118 (4) (544) 0
Group (2,704) 100 (790) (1,238) (55)
4Q2015
(1)
4Q2015: IBIT detail
28
Note: Figures may not add up due to rounding differences(1) Includes EUR (49) m Hua Xia Bank reversal of stake impairment and other transaction related valuation effects
financial transparency. 4Q2015 results 11 March 2016
Deutsche BankInvestor Relations
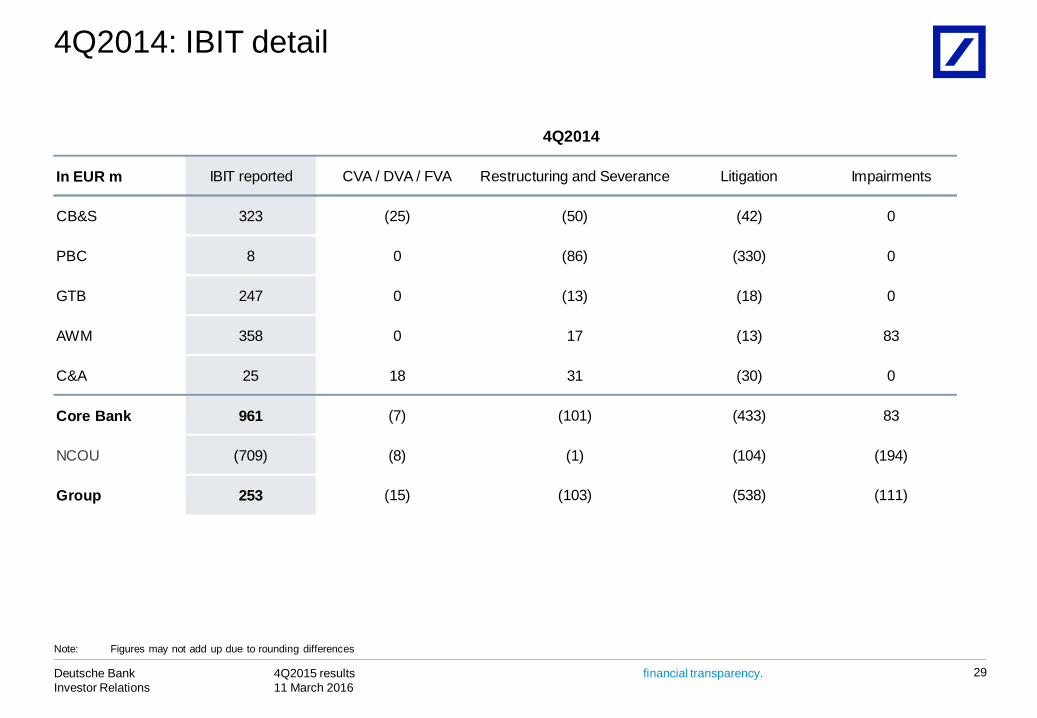
In EUR m IBIT reported CVA / DVA / FVA Restructuring and Severance Litigation Impairments
CB&S 323 (25) (50) (42) 0
PBC 8 0 (86) (330) 0
GTB 247 0 (13) (18) 0
AWM 358 0 17 (13) 83
C&A 25 18 31 (30) 0
Core Bank 961 (7) (101) (433) 83
NCOU (709) (8) (1) (104) (194)
Group 253 (15) (103) (538) (111)
4Q2014
4Q2014: IBIT detail
29
Note: Figures may not add up due to rounding differences

financial transparency. 4Q2015 results 11 March 2016
Deutsche BankInvestor Relations
In EUR m IBIT reported CVA / DVA / FVA Restructuring and Severance Litigation Impairments
CB&S (2,035) (128) (227) (2,790) (2,168)
PBC (3,291) 0 (670) (16) (4,300)
GTB 1,439 0 (22) (141) 0
AWM 1,250 0 (19) (28) (6)
C&A (729) 72 (0) (380) (0)
Core Bank (3,365) (57) (938) (3,354) (6,474)
NCOU (2,732) (26) (27) (1,864) 0
Group (6,097) (83) (965) (5,218) (6,474)
FY2015
(1)
FY2015: IBIT detail
30
Note: Figures may not add up due to rounding differences(1) Includes impairment of goodwill and other intangibles; 3Q2015 impairment of goodwill and other intangibles of EUR (2.2) bn in CB&S and EUR (3.6) bn in PBC as well as EUR (649) m
Hua Xia Bank stake impairment in PBC; includes EUR (49) m Hua Xia Bank reversal of stake impairment and other transaction related valuation effects

financial transparency. 4Q2015 results 11 March 2016
Deutsche BankInvestor Relations
In EUR m IBIT reported CVA / DVA / FVA Restructuring and Severance Litigation Impairments
CB&S 2,909 (299) (172) (586) 0
PBC 1,189 0 (156) (400) 0
GTB 1,152 0 (27) (113) 0
AWM 1,016 0 (11) (37) 83
C&A (251) (66) (0) (38) 0
Core Bank 6,015 (365) (365) (1,175) 83
NCOU (2,899) 29 (10) (796) (194)
Group 3,116 (336) (375) (1,971) (111)
FY2014
FY2014: IBIT detail
31
Note: Figures may not add up due to rounding differences
financial transparency. 4Q2015 results 11 March 2016
Deutsche BankInvestor Relations
32
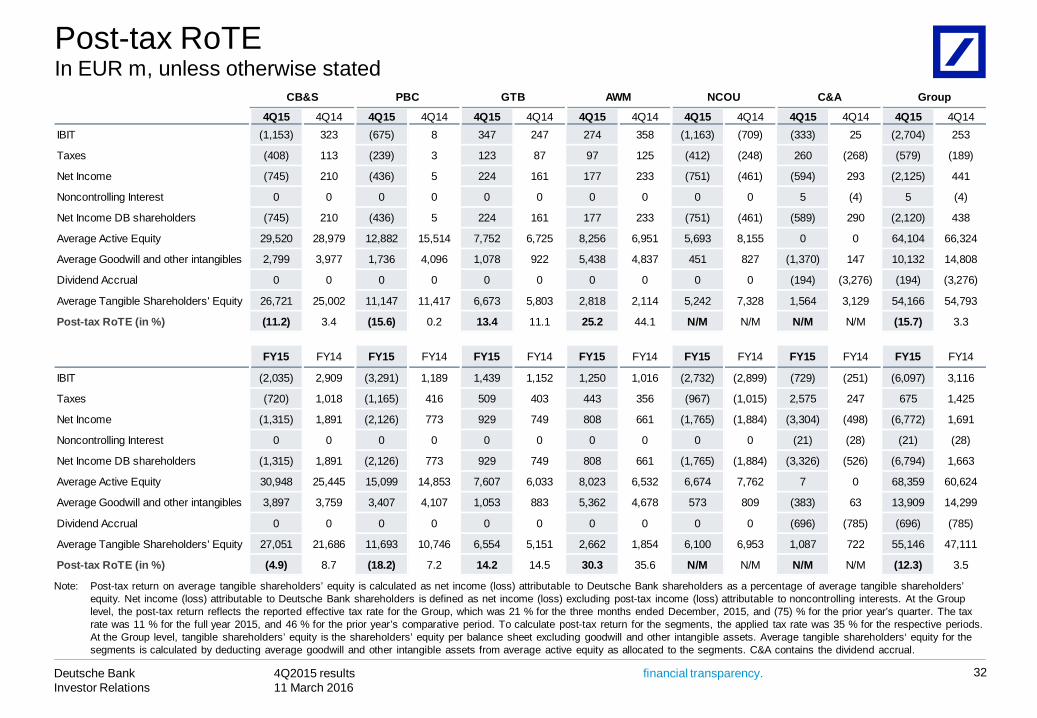
Note: Post-tax return on average tangible shareholders’ equity is calculated as net income (loss) attributable to Deutsche Bank shareholders as a percentage of average tangible shareholders’ equity. Net income (loss) attributable to Deutsche Bank shareholders is defined as net income (loss) excluding post-tax income (loss) attributable to noncontrolling interests. At the Group level, the post-tax return reflects the reported effective tax rate for the Group, which was 21 % for the three months ended December, 2015, and (75) % for the prior year’s quarter. The tax rate was 11 % for the full year 2015, and 46 % for the prior year’s comparative period. To calculate post-tax return for the segments, the applied tax rate was 35 % for the respective periods. At the Group level, tangible shareholders’ equity is the shareholders’ equity per balance sheet excluding goodwill and other intangible assets. Average tangible shareholders‘ equity for the segments is calculated by deducting average goodwill and other intangible assets from average active equity as allocated to the segments. C&A contains the dividend accrual.
4Q15 4Q14 4Q15 4Q14 4Q15 4Q14 4Q15 4Q14 4Q15 4Q14 4Q15 4Q14 4Q15 4Q14IBIT (1,153) 323 (675) 8 347 247 274 358 (1,163) (709) (333) 25 (2,704) 253
Taxes (408) 113 (239) 3 123 87 97 125 (412) (248) 260 (268) (579) (189)
Net Income (745) 210 (436) 5 224 161 177 233 (751) (461) (594) 293 (2,125) 441
Noncontrolling Interest 0 0 0 0 0 0 0 0 0 0 5 (4) 5 (4)
Net Income DB shareholders (745) 210 (436) 5 224 161 177 233 (751) (461) (589) 290 (2,120) 438
Average Active Equity 29,520 28,979 12,882 15,514 7,752 6,725 8,256 6,951 5,693 8,155 0 0 64,104 66,324
Average Goodwill and other intangibles 2,799 3,977 1,736 4,096 1,078 922 5,438 4,837 451 827 (1,370) 147 10,132 14,808
Dividend Accrual 0 0 0 0 0 0 0 0 0 0 (194) (3,276) (194) (3,276)
Average Tangible Shareholders' Equity 26,721 25,002 11,147 11,417 6,673 5,803 2,818 2,114 5,242 7,328 1,564 3,129 54,166 54,793
Post-tax RoTE (in %) (11.2) 3.4 (15.6) 0.2 13.4 11.1 25.2 44.1 N/M N/M N/M N/M (15.7) 3.3
FY15 FY14 FY15 FY14 FY15 FY14 FY15 FY14 FY15 FY14 FY15 FY14 FY15 FY14
IBIT (2,035) 2,909 (3,291) 1,189 1,439 1,152 1,250 1,016 (2,732) (2,899) (729) (251) (6,097) 3,116
Taxes (720) 1,018 (1,165) 416 509 403 443 356 (967) (1,015) 2,575 247 675 1,425
Net Income (1,315) 1,891 (2,126) 773 929 749 808 661 (1,765) (1,884) (3,304) (498) (6,772) 1,691
Noncontrolling Interest 0 0 0 0 0 0 0 0 0 0 (21) (28) (21) (28)
Net Income DB shareholders (1,315) 1,891 (2,126) 773 929 749 808 661 (1,765) (1,884) (3,326) (526) (6,794) 1,663
Average Active Equity 30,948 25,445 15,099 14,853 7,607 6,033 8,023 6,532 6,674 7,762 7 0 68,359 60,624
Average Goodwill and other intangibles 3,897 3,759 3,407 4,107 1,053 883 5,362 4,678 573 809 (383) 63 13,909 14,299
Dividend Accrual 0 0 0 0 0 0 0 0 0 0 (696) (785) (696) (785)
Average Tangible Shareholders' Equity 27,051 21,686 11,693 10,746 6,554 5,151 2,662 1,854 6,100 6,953 1,087 722 55,146 47,111
Post-tax RoTE (in %) (4.9) 8.7 (18.2) 7.2 14.2 14.5 30.3 35.6 N/M N/M N/M N/M (12.3) 3.5
GroupCB&S PBC GTB AWM NCOU C&A
In EUR m, unless otherwise statedPost-tax RoTE

financial transparency. 4Q2015 results 11 March 2016
Deutsche BankInvestor Relations
NCOU IBIT components IBIT, in EUR m
33
Note: Figures may not add up due to rounding differences(1) De-risking impact reported in LLPs are combined with revenues in the de-risking IBIT line(2) Litigation excludes Postbank related matters
NCOU (2,899) (2,732)
Asset Driven
Portfolio RevenuesDe-risking IBIT(1)
MtM/OtherLLPsCostsTotal
— Timing and size of potential impact difficult to assess
— Impact expected to decrease albeit not linked to asset profile
(1,163)
11343
(220)(13)
(161)(238)
(531)
(115)(5)
(120)
Allocations & Other Items
994179
(885)(301)
(1,135)(1,148)
509412(77)
(102)(643)
99
Allocated Costs OtherTotal
Litigation(2)
(531)(30)
(561)
(712)
(478)(37)
(514)
(1,849)
Reported IBIT
— Net IBIT expected to be impacted by accelerated wind down strategy
— Quarterly performance impacted by MtM volatility
— To be reported in a separate Postbank division in 2016
(274)(88)
Postbank IBITof which: PB Liabilities
(477)(413)
(467)(330)
FY2014 FY2015 Comments/Outlook4Q2015Component

financial transparency. 4Q2015 results 11 March 2016
Deutsche BankInvestor Relations
CRD4 – Leverage Exposure and Risk Weighted Assets
Leverage Exposure vs. RWA(1)
In EUR bn
250
6464
34
Credit Risk RWA
CVA
Market Risk RWA
31 Dec 2015
307
241
16
50
50
52
31 Dec 2015 prelim.
1,395
150109107
164
417
255
193
3071,445
12312784152
406
358
196
Reverse repo /securitiesborrowed
Lending
Derivatives(2)
Non-derivativetrading assets
31 Dec 2015
47
300
31 Dec 2014
3
125
Cash and depositswith banks
Off B/S(3)
Other
CRD4 – Leverage Exposure RWA
Note: Figures may not add up due to rounding differences; Dec 2014: NDTA, Loans, Cash and deposits for the leverage exposure are based on the IFRS consolidation circle(1) RWA excludes Operational Risk RWA of EUR 89.9 bn(2) Excludes any related Market Risk RWA which has been fully allocated to non-derivatives trading assets(3) Lending commitments and contingent liabilities

financial transparency. 4Q2015 results 11 March 2016
Deutsche BankInvestor Relations
35
Loan bookIn EUR bn
Germany excl. Financial Institutions and Public Sector:
2014 2015
Note: Loan amounts are gross of allowances for loan losses. Figures may not add up due to rounding differences
186
33 34 37 39
CB&S
GTB
PBC
DeAWMNCOU
31-Dec
411
62
77
215
18
30-Sep
401
53
77
214
19
30-Jun
393
48
77
213
21
31-Mar
386
42
76
213
22 43 44 44 45
30-Sep
433
77
79
218
16
30-Jun
430
72
81
216
17
31-Mar
434
72
84
216
18
31-Dec
80
76
218
13433
185 185 188184 184 186 184

financial transparency. 4Q2015 results 11 March 2016
Deutsche BankInvestor Relations
6.9 6.8 6.7 6.5 6.6 6.2 5.9 6.1
3.3 3.3 2.9 2.8 2.6 2.5 2.2 2.1
10.3 10.0 9.5 9.3 9.3 8.7 8.1 8.2
-
2.0
4.0
6.0
8.0
10.0
12.0
1Q 2Q 3Q 4Q 1Q 2Q 3Q 4Q0.00%
0.50%
1.00%
1.50%
2.00%
2.50%
3.00%Core Bank Non-Core Operations Unit Impaired loan ratio Deutsche Bank Group(3) Impaired loan ratio Core Bank(3)
51% 52% 54% 56% 57% 58% 60% 62%
-42.00-41.00-40.00-39.00-38.00-37.00-36.00-35.00-34.00-33.00-32.00-31.00-30.00-29.00-28.00-27.00-26.00-25.00-24.00-23.00-22.00-21.00-20.00-19.00-18.00-17.00-16.00-15.00-14.00-13.00-12.00-11.00-10.00-9.00-8.00-7.00-6.00-5.00-4.00-3.00-2.00-1.000.00
Impaired loans(1)
Period-end, in EUR bn
36
CoverageRatio(2)
Note: Figures may not add up due to rounding differences(1) IFRS impaired loans include loans which are individually impaired under IFRS, i.e. for which a specific loan loss allowance has been established, as well as loans collectively assessed
for impairment which have been put on nonaccrual status(2) Total on-balance sheet allowances divided by IFRS impaired loans (excluding collateral); total on-balance sheet allowances include allowances for all loans individually impaired or
collectively assessed(3) Impaired loans in % of total loan book
(3) (3)

financial transparency. 4Q2015 results 11 March 2016
Deutsche BankInvestor Relations
37
Value-at-RiskDB Group, 99%, 1 day, in EUR m
20
40
60
80
100
120
140
160
180
Average VaRStressed VaR(1)
4Q2014 4Q2015
46 50111 109
3899
1Q2015
46102
2Q2015 3Q2015
40111
(1) Stressed Value-at-Risk is calculated on the same portfolio as VaR but uses a historical market data from a period of significant financial stress (i.e. characterized by high volatilities and extreme price movements)
EUR 1.9 bn EUR 1.5 bnSales & Trading revenues

financial transparency. 4Q2015 results 11 March 2016
Deutsche BankInvestor Relations
9
16
11
8
17
6
10
6
1Q2014 2Q2014 3Q2014 4Q2014 1Q2015 2Q2015 3Q2015 4Q2015
Funding activities and profile
38
Funding cost and volume development Funding profile well diversified
— 2015 recap: Funding plan fully completed— Raised EUR 39 bn at average spread of 57(1) bps, ca. 40 bps
inside interpolated CDS and average tenor of 6.3 years— EUR 11 bn by public benchmark issuances / EUR 28 bn raised
via issuance in retail networks and other private placements— 2016: Funding plan of up to EUR 35 bn
DB issuance spread, 4 week moving average, in bps(1)
Issuance, in EUR bn As of 31 December 2015
Capital Markets and Equity, 22%
Retail (excl. WM deposits),
25%
WM deposits,
7%
Transaction Banking, 20%
Other Customers,
8%
Unsecured Wholesale,
6%
Secured Funding and Shorts, 11%
Financing Vehicles, 0%
74% from most stable funding sources
Total: EUR 976 bn
— Total external funding increased by EUR 57 bn to EUR 976 bn (vs. EUR 919 bn as of Dec 2014)
— 74% of total funding from most stable sources (vs. 76% as of Dec 2014)
— Liquidity Reserves EUR 215 bn
Note: Figures may not add up due to rounding differences(1) Over relevant floating index; AT1 instruments excluded from spread calculation
0
20
40
60
80
100
120
140
160
180
200

financial transparency. 4Q2015 results 11 March 2016
Deutsche BankInvestor Relations
Total Loss Absorbing Capacity (TLAC)DB well positioned to meet future TLAC requirements
39
Transitional TLAC requirement for DB (applicable from 2019)
CET1
— Final FSB term sheet requirements: higher of 16% RWAs (plus buffers) and 6% leverage exposure from 2019; higher of 18% RWAs (plus buffers) and 6.75% leverage exposure from 2022
— New German legislation ranks plain-vanilla senior debt below other senior liabilities in case of insolvency from 2017 onwards, with retroactive effect for all outstanding bonds
— CET1 and capital instruments (AT1/T2) of EUR 59 bn available to protect senior debtholders
Plain-vanilla senior debt(1)
8%
1.5%
4.5%
2.0%Tier 2 AT1
CET1
AdditionalTLAC
requirement
2.0%
2.5%
G-SIB buffer
Capital Conservation buffer
20.5% ~EUR 110 bn
Estimated available TLAC for DB
EUR 81 bn
Surplus of ~EUR26 - 28 bn
AT1/legacy Tier 1(2)
Tier 2(2)16% TLACrequirement
31 Dec 2015RWA-based Leverage-based
6%
EUR 84 bn
(1) Based on the new German legislation includes all non-callable plain-vanilla senior debt (including Schuldscheine and other domestic registered issuance) > 1 year, irrespective of issuer jurisdiction and governing law; assumes EUR 11.5 bn of legacy bonds under non-EU law without bail-in clause will be replaced over time (ca. EUR 1.6 bn outstanding in 2019 when TLAC enters into force)
(2) Instruments issued by DB AG or DB-related trusts with time to maturity or time to call > 1 year; nominal values

financial transparency. 4Q2015 results 11 March 2016
Deutsche BankInvestor Relations
Regional invested assets – Deutsche AWMIn EUR bn
40
In EUR bnRegional net new money – Deutsche AWM
Note: Figures may not add up due to rounding differences
30 Jun 2014 30 Sep 2014 31 Dec 2014 31 Mar 2015 30 Jun 2015 30 Sep 2015 31 Dec 201531 Dec 2015
vs.30 Sep 2015
Americas 261 282 297 338 327 316 325 8Asia-Pacific 75 85 86 97 96 91 93 2EMEA (ex Germany) 263 272 280 315 292 280 287 7Germany 356 366 376 409 420 401 410 8
AWM 955 1,006 1,039 1,159 1,135 1,089 1,114 26
2Q2014 3Q2014 4Q2014 1Q2015 2Q2015 3Q2015 4Q2015 FY2015
Americas 0 1 3 1 4 (2) (4) (1)Asia-Pacific 3 5 (0) 0 2 2 0 3EMEA (ex Germany) 8 7 5 10 4 (2) 3 15Germany (1) 4 2 6 5 3 (9) 6
AWM 11 17 10 17 15 1 (9) 24
financial transparency. 4Q2015 results 11 March 2016
Deutsche BankInvestor Relations
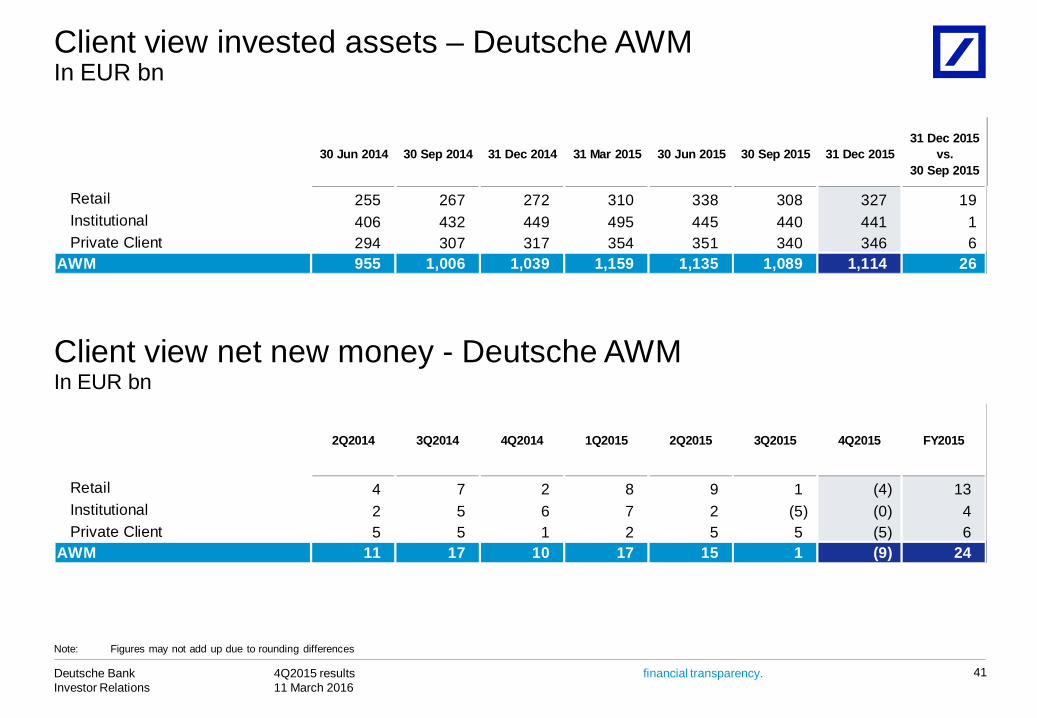
Client view invested assets – Deutsche AWMIn EUR bn
41
In EUR bnClient view net new money - Deutsche AWM
30 Jun 2014 30 Sep 2014 31 Dec 2014 31 Mar 2015 30 Jun 2015 30 Sep 2015 31 Dec 201531 Dec 2015
vs.30 Sep 2015
Note: Figures may not add up due to rounding differences
2Q2014 3Q2014 4Q2014 1Q2015 2Q2015 3Q2015 4Q2015 FY2015
Retail 4 7 2 8 9 1 (4) 13Institutional 2 5 6 7 2 (5) (0) 4Private Client 5 5 1 2 5 5 (5) 6
AWM 11 17 10 17 15 1 (9) 24
30 Sep 2015Retail 255 267 272 310 338 308 327 19
Institutional 406 432 449 495 445 440 441 1Private Client 294 307 317 354 351 340 346 6
AWM 955 1,006 1,039 1,159 1,135 1,089 1,114 26
30 Jun 2014 30 Sep 2014 31 Dec 2014 31 Mar 2015 30 Jun 2015 30 Sep 2015 31 Dec 201531 Dec 2015
vs.30 Sep 2015
financial transparency. 4Q2015 results 11 March 2016
Deutsche BankInvestor Relations
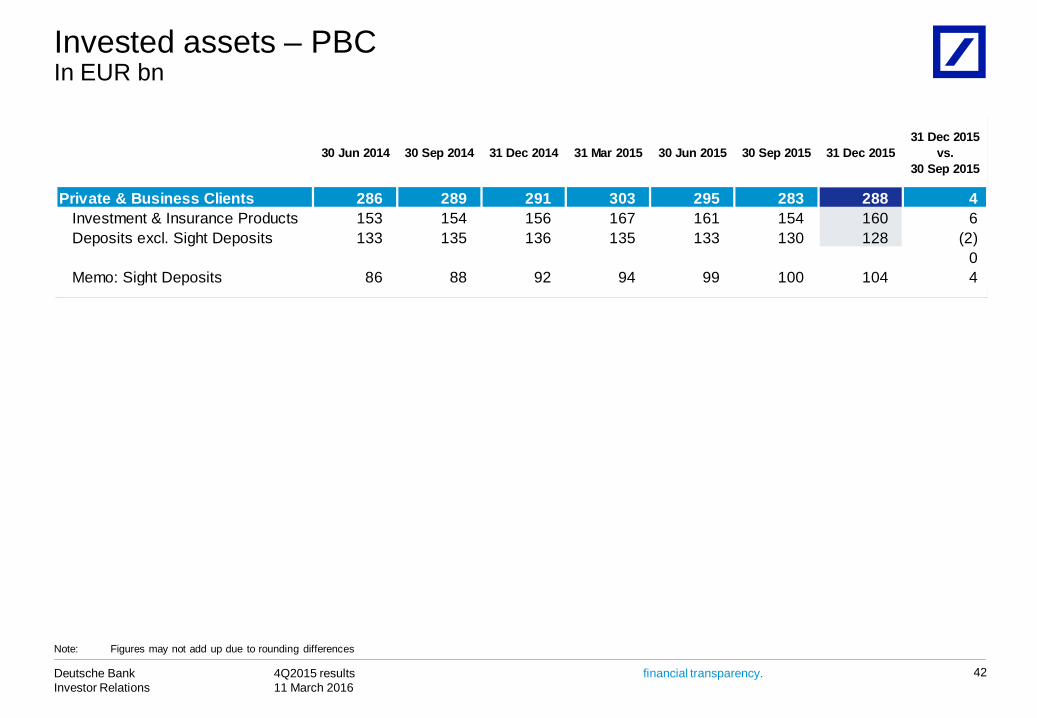
Invested assets – PBCIn EUR bn
42
30 Jun 2014 30 Sep 2014 31 Dec 2014 31 Mar 2015 30 Jun 2015 30 Sep 2015 31 Dec 201531 Dec 2015
vs.30 Sep 2015
Private & Business Clients 286 289 291 303 295 283 288 4Investment & Insurance Products 153 154 156 167 161 154 160 6Deposits excl. Sight Deposits 133 135 136 135 133 130 128 (2)
0Memo: Sight Deposits 86 88 92 94 99 100 104 4
Note: Figures may not add up due to rounding differences
financial transparency. 4Q2015 results 11 March 2016
Deutsche BankInvestor Relations
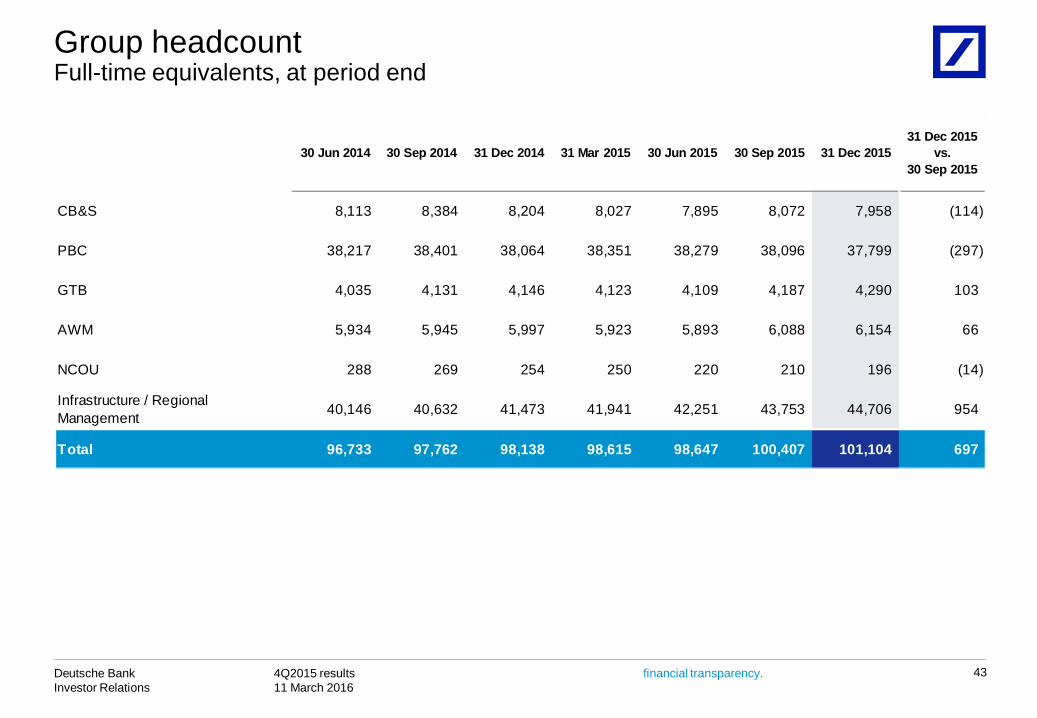
Group headcountFull-time equivalents, at period end
43
30 Jun 2014 30 Sep 2014 31 Dec 2014 31 Mar 2015 30 Jun 2015 30 Sep 2015 31 Dec 201531 Dec 2015
vs.30 Sep 2015
CB&S 8,113 8,384 8,204 8,027 7,895 8,072 7,958 (114)
PBC 38,217 38,401 38,064 38,351 38,279 38,096 37,799 (297)
GTB 4,035 4,131 4,146 4,123 4,109 4,187 4,290 103
AWM 5,934 5,945 5,997 5,923 5,893 6,088 6,154 66
NCOU 288 269 254 250 220 210 196 (14)
Infrastructure / Regional Management 40,146 40,632 41,473 41,941 42,251 43,753 44,706 954
Total 96,733 97,762 98,138 98,615 98,647 100,407 101,104 697
financial transparency. 4Q2015 results 11 March 2016
Deutsche BankInvestor Relations
This presentation contains forward-looking statements. Forward-looking statements are statements that are not historicalfacts; they include statements about our beliefs and expectations and the assumptions underlying them. Thesestatements are based on plans, estimates and projections as they are currently available to the management of DeutscheBank. Forward-looking statements therefore speak only as of the date they are made, and we undertake no obligation toupdate publicly any of them in light of new information or future events.
By their very nature, forward-looking statements involve risks and uncertainties. A number of important factors couldtherefore cause actual results to differ materially from those contained in any forward-looking statement. Such factorsinclude the conditions in the financial markets in Germany, in Europe, in the United States and elsewhere from which wederive a substantial portion of our revenues and in which we hold a substantial portion of our assets, the development ofasset prices and market volatility, potential defaults of borrowers or trading counterparties, the implementation of ourstrategic initiatives, the reliability of our risk management policies, procedures and methods, and other risks referenced inour filings with the U.S. Securities and Exchange Commission. Such factors are described in detail in our SEC Form20-F of 11 March 2016 under the heading “Risk Factors.” Copies of this document are readily available upon request orcan be downloaded from www.db.com/ir.
This presentation also contains non-IFRS financial measures. For a reconciliation to directly comparable figures reportedunder IFRS, to the extent such reconciliation is not provided in this presentation, refer to the 4Q2015 Financial DataSupplement, which is accompanying this presentation and available at www.db.com/ir.
44
Cautionary statements


![[BALKANIZE DEUTSCHE BANK]](https://static.fdocuments.in/doc/165x107/56815b15550346895dc8c5cf/balkanize-deutsche-bank-56b6efac56326.jpg)