Deutsche Bank 8th Annual Global Industrials & … Bank 8th Annual Global Industrials & Materials...
26
fcx.com June 8, 2017 Deutsche Bank 8th Annual Global Industrials & Materials Summit Kathleen L. Quirk Executive Vice President & CFO
Transcript of Deutsche Bank 8th Annual Global Industrials & … Bank 8th Annual Global Industrials & Materials...
fcx.com
June 8, 2017
Deutsche Bank 8th Annual Global Industrials & Materials Summit
Kathleen L. QuirkExecutive Vice President & CFO
2
Cautionary Statement
Regarding Forward-Looking Statements
This presentation contains forward-looking statements in which FCX discusses its potential future performance. Forward-looking statements are all statements other than statements of historical facts, such as projections or expectations relating to ore grades and milling rates, production and sales volumes, unit net cash costs, operating cash flows, capital expenditures, exploration efforts and results, development and production activities and costs, liquidity, tax rates, the impact of copper, gold and molybdenum price changes, the impact of deferred intercompany profits on earnings, reserve estimates, future dividend payments, and share purchases and sales. The words “anticipates,” “may,” “can,” “plans,” “believes,” “estimates,” “expects,” “projects,” "targets," “intends,” “likely,” “will,” “should,” “to be,” ”potential" and any similar expressions are intended to identify those assertions as forward-looking statements.
FCX cautions readers that forward-looking statements are not guarantees of future performance and actual results may differ materially from those anticipated, projected or assumed in the forward-looking statements. Important factors that can cause FCX's actual results to differ materially from those anticipated in the forward-looking statements include supply of and demand for, and prices of, copper, gold and molybdenum, mine sequencing, production rates, potential effects of cost and capital expenditure reductions and production curtailments on financial results and cash flow, potential inventory adjustments, potential impairment of long-lived mining assets, the outcome of negotiations with the Indonesian government regarding PT Freeport Indonesia's (PT-FI) Contract of Work (COW), the potential effects of violence in Indonesia generally and in the province of Papua, industry risks, regulatory changes, political risks, labor relations, weather- and climate-related risks, environmental risks, litigation results (including the final disposition of the recent unfavorable Indonesian Tax Court ruling relating to surface water taxes) and other factors described in more detail under the heading “Risk Factors” in FCX's Annual Report on Form 10-K for the year ended December 31, 2016, filed with the U.S. Securities and Exchange Commission (SEC). With respect to FCX's operations in Indonesia, such factors include whether PT-FI will be able to resolve complex regulatory matters in Indonesia.
Investors are cautioned that many of the assumptions upon which FCX's forward-looking statements are based are likely to change after the forward-looking statements are made, including for example commodity prices, which FCX cannot control, and production volumes and costs, some aspects of which FCX may not be able to control. Further, FCX may make changes to its business plans that could affect its results. FCX cautions investors that it does not intend to update forward-looking statements more frequently than quarterly notwithstanding any changes in its assumptions, changes in business plans, actual experience or other changes, and FCX undertakes no obligation to update any forward-looking statements.
This presentation also includes forward-looking statements regarding mineralized material and potential resources not included in proven and probable mineral reserves. The mineralized material and potential resources described in this presentation will not qualify as reserves until comprehensive engineering studies establish their economic feasibility. Accordingly, no assurance can be given that the estimated mineralized material and potential resources not included in reserves will become proven and probable reserves.
This presentation also contains certain financial measures such as unit net cash costs per pound of copper and molybdenum which are not recognized under U.S. generally accepted accounting principles. As required by SEC Regulation G, reconciliations of these measures to amounts reported in FCX's consolidated financial statements are in the supplemental schedules of FCX’s 1Q17 press release, which are also available on FCX's website, "fcx.com.

D R I V E N B Y V A L U E
“Driven by Value”
Global Team Came Together to “Prove Our
Mettle” in 2016
Strengthened Balance Sheet & Liquidity
Successfully Executed Operating Plans
Refocused Business on Leading Position in
Global Copper Industry
Asset Sale Valuations Demonstrated
Attractiveness of Copper Assets
Optimistic About Market Outlook for Copper -
Attractive Long-Term Fundamentals
2016 Annual Report Highlights
3

World’s Leading Copper Producers
0
500
1,000
1,500
2,000
Codelco Freeport-McMoRan
Glencore BHP SouthernCopper
Rio Tinto KGHM FirstQuantum
Antofagasta Vale
(000 t)
Top 10 Copper Producers (2017e)
Source: Wood Mackenzie March 16, 2017. Rankings based on net equity ownership.
4

Improved Market Fundamentals
• Chinese Wire & Cable Demand Remains
Strong
• Europe/North America Steady Improvement
Supply Side Issues in Focus
• Higher than Average Disruptions YTD
• Absence of Major New Projects on the
Horizon
• Less Scrap Available than 1Q 2017
Solid Fundamental Outlook
• With Modest Demand Growth (~1% per
Annum), Wood Mackenzie Estimates 5MT
of New Projects Required
• New Supplies Require > $3/lb Copper Price
• 7-10 Year Lead Time; New Greenfield
Projects are Scarce
• Deficits On The Horizon – Timing?
Copper Market Commentary
Source: Bloomberg
$1.75
$2.00
$2.25
$2.50
$2.75
$3.00
12/31/15 3/31/16 6/30/16 9/30/16 12/31/16 3/31/17
$2.13 $2.20
$2.56
6/2/17
per pound
Since 12/31/15 +20%
Since 9/30/16 +16%
YTD 2017 +2%
LME Copper Price
Price Change
5

World-Class Copper PortfolioLong-term Value in High-Quality Asset Base
NOTE: North America amounts include Cu operations: Morenci (72%), Sierrita, Bagdad, Tyrone, Safford, Miami and Chino; Primary Mo: Henderson and Climax; South America amounts include Cu operations: Cerro Verde and El Abra. Sales amounts based on 2016. Implied life for Americas equals reserves plus mineralized material divided by 2017e sales; Implied life for Indonesia through 2041 CoW. e = estimate. See Cautionary Statement.
Cu Reserves: 30.4 bn lbs
Mo Reserves: 2.3 bn lbs
Mineralized Mat.: 49 bn lbs
Implied Life: 44 yrs
Copper Sales: 1.8 bn lbs
Molybdenum Sales: 74 mm lbs
2016 Unit Cost: $1.41/lb
Cu Reserves: 26.9 bn lbs
Au Reserves: 25.8 mm ozs
Mineralized Mat.: 19 bn lbs
Implied Life: 24 yrs
Copper Sales: 1.05 bn lbs
Gold Sales: 1.05 mm ozs
2016 Unit Cost: $0.83/lb
Cu Reserves: 29.5 bn lbs
Mo Reserves: 0.64 bn lbs
Mineralized Mat.: 29 bn lbs
Implied Life: 40 yrs
Copper Sales: 1.3 bn lbs
2016 Unit Cost: $1.41/lb
6
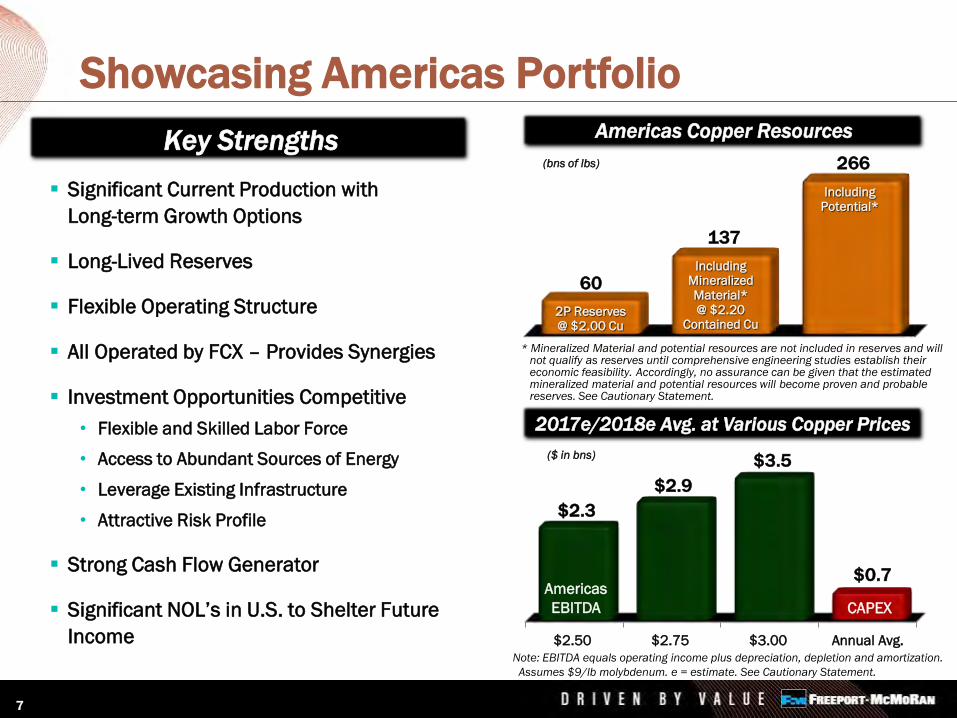
Key Strengths
Significant Current Production with
Long-term Growth Options
Long-Lived Reserves
Flexible Operating Structure
All Operated by FCX – Provides Synergies
Investment Opportunities Competitive
• Flexible and Skilled Labor Force
• Access to Abundant Sources of Energy
• Leverage Existing Infrastructure
• Attractive Risk Profile
Strong Cash Flow Generator
Significant NOL’s in U.S. to Shelter Future
Income
Showcasing Americas Portfolio
$2.50 $2.75 $3.00 Annual Avg.
$2.3
$2.9
$3.5
$0.7
($ in bns)
Americas
EBITDA CAPEX
Note: EBITDA equals operating income plus depreciation, depletion and amortization.
Assumes $9/lb molybdenum. e = estimate. See Cautionary Statement.
60
137
266
2P Reserves@ $2.00 Cu
IncludingMineralizedMaterial*@ $2.20
Contained Cu
IncludingPotential*
* Mineralized Material and potential resources are not included in reserves and will not qualify as reserves until comprehensive engineering studies establish their economic feasibility. Accordingly, no assurance can be given that the estimated mineralized material and potential resources will become proven and probable reserves. See Cautionary Statement.
Americas Copper Resources
2017e/2018e Avg. at Various Copper Prices
(bns of lbs)
7

• Bagdad
• Chino
• El Abra
• Lone Star/Safford
• Morenci
• Sierrita
Large Development Project Inventory
N
+0.3% Cu
Reserve Pit
1 km
% Copper>=0.00%
>=0.10%>=0.20%>=0.30%>=0.40%>=0.60%>=0.80%>=1.00%
N
+0.3%Cu Shell
Reserve Pit
1 km
% Copper>=0.00%
>=0.20%
>=0.30%
>=0.40%
>=0.50%
>=0.60%
Copper Sulfide Opportunities
Future Development Subject to Market Conditions
8

Exports Resumed in April
Entered into MOU with GoI Confirming that COW Would Continue to
be Valid and Honored Until New Long-term Agreement is Reached
Negotiations Commencing Immediately on Long-term Agreement
Commenced Actions to Adjust Operations, Costs & Suspend Long-
term Investment Pending Resolution
Since mid-April 2017, PT-FI has Experienced a High Level of Worker
Absenteeism, which has Impacted Mining/Milling Rates
Indonesia Update
Long-term Agreement is in the Best Interests of All Parties
9
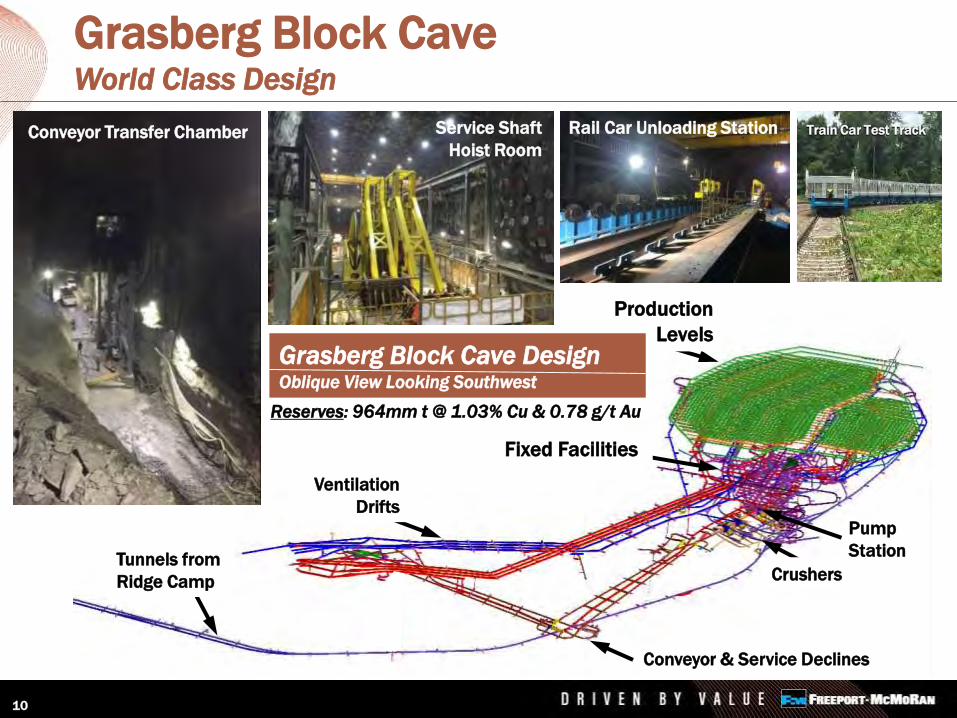
Grasberg Block CaveWorld Class Design
10
Production
Levels
Fixed Facilities
Ventilation
Drifts
Tunnels from
Ridge Camp
Pump
Station
Crushers
Conveyor & Service Declines
Rail Car Unloading Station Train Car Test TrackConveyor Transfer Chamber Service Shaft
Hoist Room
Grasberg Block Cave DesignOblique View Looking Southwest
Reserves: 964mm t @ 1.03% Cu & 0.78 g/t Au

Financial Benefits Breakdown Positive Long-term Historical Relationship
50 Year History of Operations in Indonesia
Contributed +$60 Bn to National GDP in Since 1992
Largest Private Employer in Papua & Significant
Economic Engine for Development in Region
One of the Largest Taxpayers in Indonesia
Contributed 1% of Revenues to Local Community Through the “Freeport
Partnership Fund For Community Development”
• Over $680 Million Since Inception (1996) Through 2016
Financial Benefits to Indonesia
~$19 Billion
62%
38%FCX
GOI
(2007-2016)
Future Taxes, Royalties & Dividends for Government through 2041 Expected to Exceed $40 Bn*
11
* Assumes full development; based on long-term pricing of $3/lb for copper and $1,200/oz for gold.

12
Restoring Balance Sheet StrengthYear-End 2017e Net Debt at Varying Copper Prices
YE 2017e*
(US$ billions)
Note: Sensitivity assumes $9/lb Molybdenum and $1,250/oz Gold for 2Q17e – 4Q17e. EBITDA equals operating income plus depreciation, depletion and amortization. e= estimate. See Cautionary Statement.
$0.0
$5.0
$10.0
$15.0
$20.0
12/31/2015 12/31/2016 $2.50 $2.75 $3.00
$20.1
$11.8
$9.7$9.0
$8.4
Net Debt/2017e EBITDA 1.8x 1.5x 1.2x
* Projections assume normal operating rates at PT-FI beginning mid-April 2017, and the resolution or completion of negotiations with the Indonesian government on the conversion of PT-FI’s COW to an IUPK accompanied by an investment stability agreement by October 10, 2017. Since mid-April 2017, PT-FI has experienced a high level
of worker absenteeism, which has unfavorably impacted mining and milling rates.

$0
$1
$2
$3
$4
2017 2018 2019
Committed to Balance Sheet Management –Strong Track Record
$0.7
(US$ billions)
$1.5 (2)
2.30%Sr. Notes
1) For purposes of this schedule, maturities of uncommitted lines of credit and other short term lines are included in FCX's revolver balance, which matures in 2019.
2) Excludes scheduled Cerro Verde credit facility amortization and partner loans of $0.7 bn in 2018 and $0.8 bn in 2019.
See Cautionary Statement.
Manageable Near-Term Debt Maturity Schedule (1)
FCX Debt Structure
$3.5 bn Revolver $ - $ -
Sr. Notes 14.4 13.9
Cerro Verde Non-RecourseCredit Facility 1.4 1.3
Bank Bilateral & Other 0.2 0.2
Total Debt $16.0 $15.4
Cash $ 4.2 $ 4.0
12/31/16 3/31/17
2.375%Sr. Notes
6.125%Sr. Notes
$0.2 (2)
At 3/31/17 FCX Had $7.5 Bn in Liquidity Including
$3.5 Bn Available Under Its $3.5 Bn Revolver
13

Positive Long-term Outlook
Experienced Team
of Operators &
Developers
Long-lived,
Geographically
Diverse Portfolio
Industry Leading
Copper Position
Executing Clearly Defined Strategy
Financially
Strong
14

Reference Slides
16
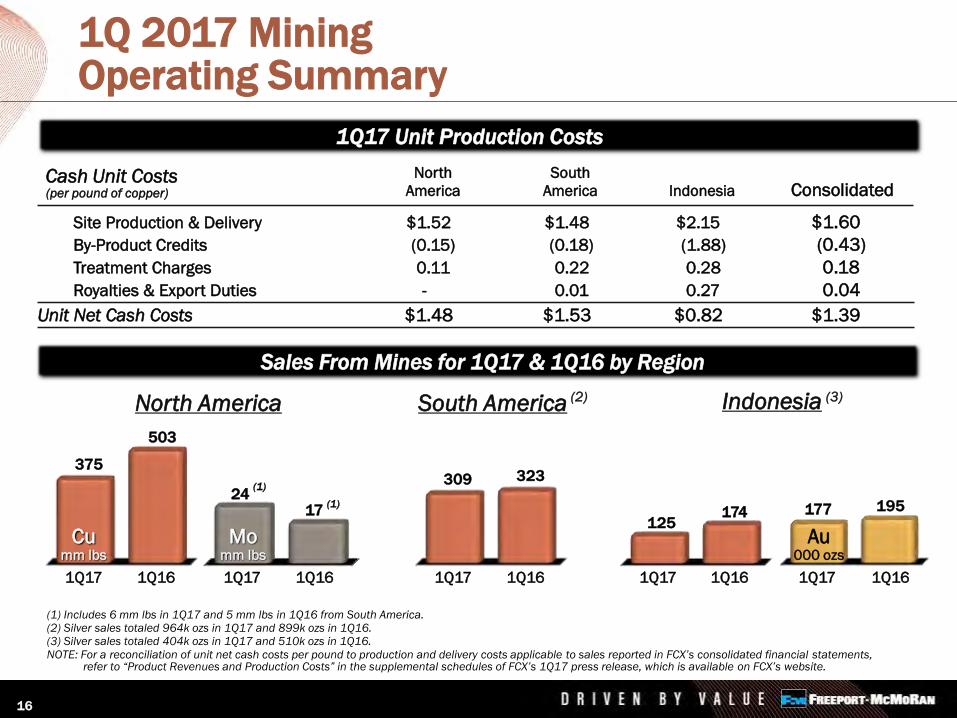
1Q 2017 MiningOperating Summary
(1) Includes 6 mm lbs in 1Q17 and 5 mm lbs in 1Q16 from South America.(2) Silver sales totaled 964k ozs in 1Q17 and 899k ozs in 1Q16.(3) Silver sales totaled 404k ozs in 1Q17 and 510k ozs in 1Q16.
NOTE: For a reconciliation of unit net cash costs per pound to production and delivery costs applicable to sales reported in FCX’s consolidated financial statements, refer to “Product Revenues and Production Costs” in the supplemental schedules of FCX’s 1Q17 press release, which is available on FCX’s website.
(per pound of copper)
North South
America America Indonesia Consolidated
Site Production & Delivery $1.52 $1.48 $2.15 $1.60
By-Product Credits (0.15) (0.18) (1.88) (0.43)
Treatment Charges 0.11 0.22 0.28 0.18
Royalties & Export Duties - 0.01 0.27 0.04
Unit Net Cash Costs $1.48 $1.53 $0.82 $1.39
Cash Unit Costs
North America
1724
(1)
(1)
Momm lbs
1Q17 1Q16
503
375
1Q17 1Q16
Cumm lbs
Indonesia (3)
174125
1Q17 1Q16
195177
1Q17 1Q16
Au000 ozs
South America (2)
1Q17 1Q16
309 323
1Q17 Unit Production Costs
Sales From Mines for 1Q17 & 1Q16 by Region
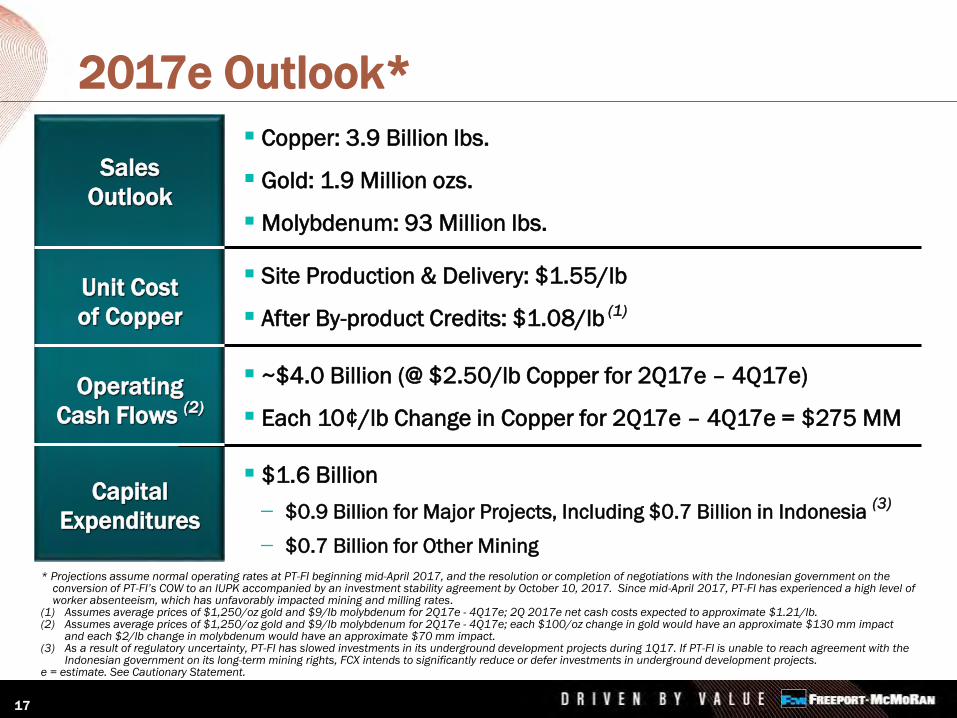
2017e Outlook*
Copper: 3.9 Billion lbs.
Gold: 1.9 Million ozs.
Molybdenum: 93 Million lbs.
Sales
Outlook
Unit Cost
of Copper
Operating
Cash Flows (2)
Capital
Expenditures
Site Production & Delivery: $1.55/lb
After By-product Credits: $1.08/lb (1)
~$4.0 Billion (@ $2.50/lb Copper for 2Q17e – 4Q17e)
Each 10¢/lb Change in Copper for 2Q17e – 4Q17e = $275 MM
$1.6 Billion
$0.9 Billion for Major Projects, Including $0.7 Billion in Indonesia (3)
$0.7 Billion for Other Mining
* Projections assume normal operating rates at PT-FI beginning mid-April 2017, and the resolution or completion of negotiations with the Indonesian government on the conversion of PT-FI’s COW to an IUPK accompanied by an investment stability agreement by October 10, 2017. Since mid-April 2017, PT-FI has experienced a high level of worker absenteeism, which has unfavorably impacted mining and milling rates.
(1) Assumes average prices of $1,250/oz gold and $9/lb molybdenum for 2Q17e - 4Q17e; 2Q 2017e net cash costs expected to approximate $1.21/lb.(2) Assumes average prices of $1,250/oz gold and $9/lb molybdenum for 2Q17e - 4Q17e; each $100/oz change in gold would have an approximate $130 mm impact
and each $2/lb change in molybdenum would have an approximate $70 mm impact.(3) As a result of regulatory uncertainty, PT-FI has slowed investments in its underground development projects during 1Q17. If PT-FI is unable to reach agreement with the
Indonesian government on its long-term mining rights, FCX intends to significantly reduce or defer investments in underground development projects.e = estimate. See Cautionary Statement.
17

18
0
1
2
3
4
5
2016 2017e 2018e
4.65
3.9 4.0
Copper Sales (billion lbs)
Sales Profile
Note: Consolidated copper sales include 910 mm lbs in 2016, 685 mm lbs in 2017e and 700 mm lbs in 2018e for noncontrolling interest; excludes purchased
copper.
e = estimate. See Cautionary Statement.
Note: Consolidated gold sales include 99k ozs in 2016, 180k ozs in 2017e and 220k ozs in 2018e for noncontrolling interest.
0
1
2
3
2016 2017e 2018e
1.1
1.92.3
0
30
60
90
2016 2017e 2018e
7493 92
Gold Sales* (million ozs)
Molybdenum Sales (million lbs)
Copper Sales* (billion lbs)
4.17
Net of Volumes
Sold in
Tenke/Morenci
Transactions
* Projections assume normal operating rates at PT-FI beginning mid-April 2017, and the resolution or completion of negotiations with the Indonesian government on the
conversion of PT-FI’s COW to an IUPK accompanied by an investment stability agreement by October 10, 2017. Since mid-April 2017, PT-FI has experienced a high level of worker absenteeism, which has unfavorably impacted mining and milling rates.
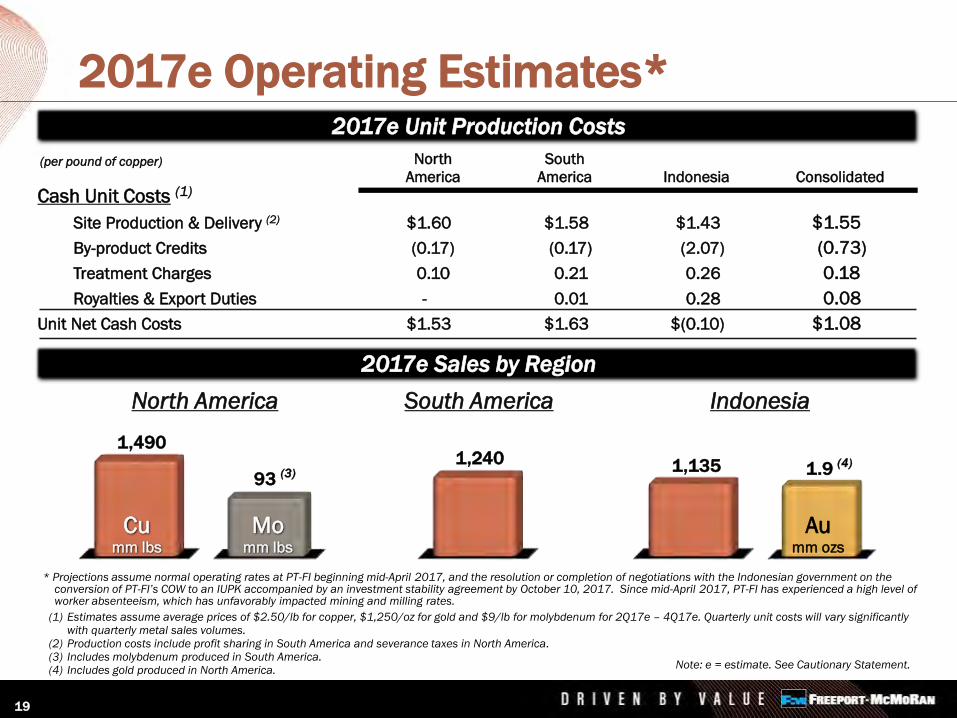
1,240
South America
93 (3)
Momm lbs
1,490
Cumm lbs
1,135
Indonesia
1.9 (4)
Aumm ozs
2017e Operating Estimates*
(1) Estimates assume average prices of $2.50/lb for copper, $1,250/oz for gold and $9/lb for molybdenum for 2Q17e – 4Q17e. Quarterly unit costs will vary significantly with quarterly metal sales volumes.
(2) Production costs include profit sharing in South America and severance taxes in North America.(3) Includes molybdenum produced in South America.(4) Includes gold produced in North America.
North America
(per pound of copper) North South
America America Indonesia Consolidated
Cash Unit Costs (1)
Site Production & Delivery (2) $1.60 $1.58 $1.43 $1.55
By-product Credits (0.17) (0.17) (2.07) (0.73)
Treatment Charges 0.10 0.21 0.26 0.18
Royalties & Export Duties - 0.01 0.28 0.08
Unit Net Cash Costs $1.53 $1.63 $(0.10) $1.08
2017e Unit Production Costs
Note: e = estimate. See Cautionary Statement.
2017e Sales by Region
19
* Projections assume normal operating rates at PT-FI beginning mid-April 2017, and the resolution or completion of negotiations with the Indonesian government on the conversion of PT-FI’s COW to an IUPK accompanied by an investment stability agreement by October 10, 2017. Since mid-April 2017, PT-FI has experienced a high level of worker absenteeism, which has unfavorably impacted mining and milling rates.
20
0
300
600
900
1,200
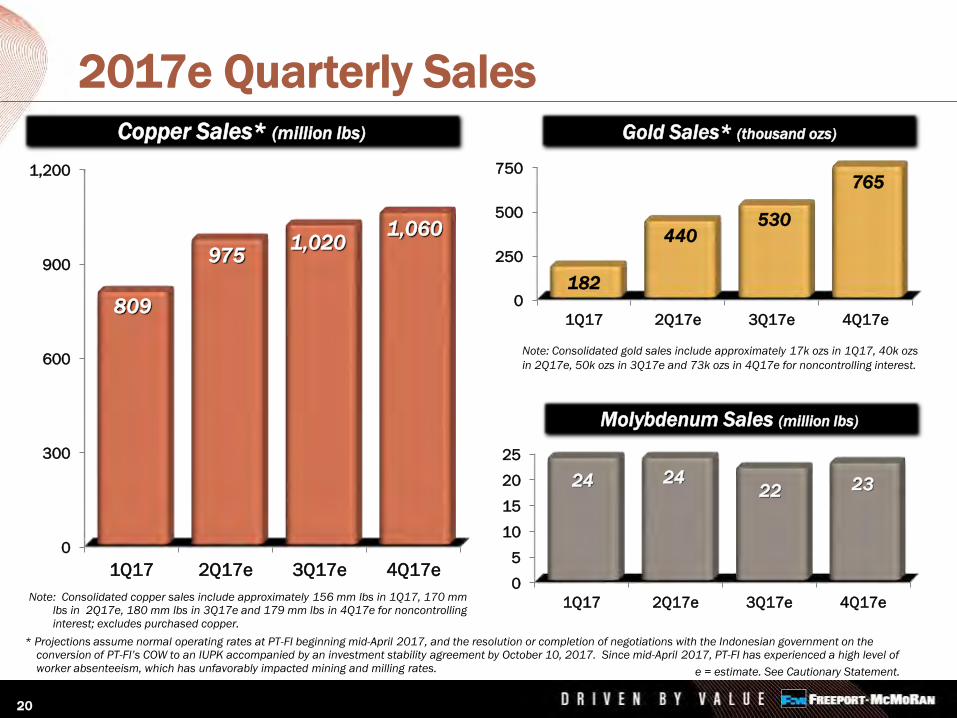
1Q17 2Q17e 3Q17e 4Q17e
809
9751,020
1,060
2017e Quarterly Sales
0
250
500
750
1Q17 2Q17e 3Q17e 4Q17e
182
440530
765
Gold Sales* (thousand ozs)
0
5
10
15
20
25
1Q17 2Q17e 3Q17e 4Q17e
24 2422 23
Molybdenum Sales (million lbs)
Note: Consolidated gold sales include approximately 17k ozs in 1Q17, 40k ozs
in 2Q17e, 50k ozs in 3Q17e and 73k ozs in 4Q17e for noncontrolling interest.
e = estimate. See Cautionary Statement.
Note: Consolidated copper sales include approximately 156 mm lbs in 1Q17, 170 mm lbs in 2Q17e, 180 mm lbs in 3Q17e and 179 mm lbs in 4Q17e for noncontrolling
interest; excludes purchased copper.
Copper Sales* (million lbs)
* Projections assume normal operating rates at PT-FI beginning mid-April 2017, and the resolution or completion of negotiations with the Indonesian government on the conversion of PT-FI’s COW to an IUPK accompanied by an investment stability agreement by October 10, 2017. Since mid-April 2017, PT-FI has experienced a high level of
worker absenteeism, which has unfavorably impacted mining and milling rates.

21
$0
$2
$4
$6
$8
Cu $2.50/lb Cu $2.75/lb Cu $3.00/lb
$0
$2
$4
$6
Cu $2.50/lb Cu $2.75/lb Cu $3.00/lb
EBITDA and Cash Flow at Various Copper Prices
Average EBITDA ($1,250/oz Gold, $9/lb Molybdenum)*
Average Operating Cash Flow (excluding Working Capital changes)($1,250/oz Gold, $9/lb Molybdenum)*
(US$ billions)
(US$ billions)
Note: For 2017e/2018e price sensitivities see slide 15. EBITDA equals operating income plus depreciation, depletion and amortization.
* Average prices as noted for 2Q17e – 4Q17e/2018e. Projections assume normal operating rates at PT-FI beginning mid-April 2017, and the resolution or completion of negotiations with the Indonesian government on the conversion of PT-FI’s COW to an IUPK accompanied by an investment stability agreement by October 10, 2017. Since mid-April 2017, PT-FI has experienced a high level of worker absenteeism, which has unfavorably impacted mining and milling rates.e = estimate. See Cautionary Statement.
2017e/2018eAverage
2017e/2018eAverage
22
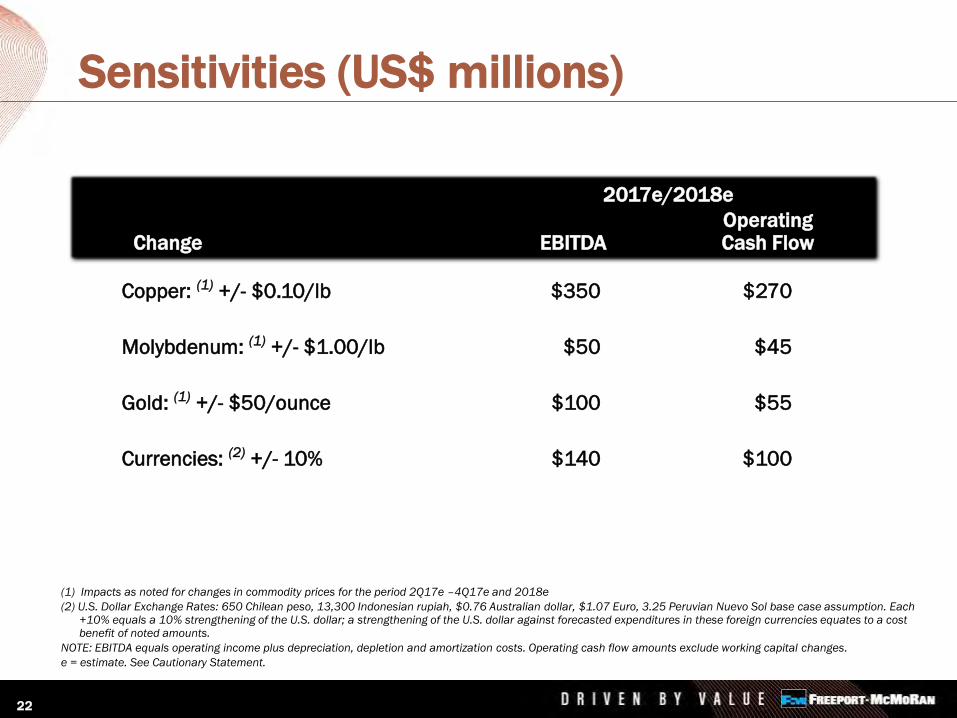
OperatingChange EBITDA Cash Flow
Sensitivities (US$ millions)
(1) Impacts as noted for changes in commodity prices for the period 2Q17e –4Q17e and 2018e
(2) U.S. Dollar Exchange Rates: 650 Chilean peso, 13,300 Indonesian rupiah, $0.76 Australian dollar, $1.07 Euro, 3.25 Peruvian Nuevo Sol base case assumption. Each +10% equals a 10% strengthening of the U.S. dollar; a strengthening of the U.S. dollar against forecasted expenditures in these foreign currencies equates to a cost benefit of noted amounts.
NOTE: EBITDA equals operating income plus depreciation, depletion and amortization costs. Operating cash flow amounts exclude working capital changes.
e = estimate. See Cautionary Statement.
2017e/2018e
Copper: (1) +/- $0.10/lb $350 $270
Molybdenum: (1) +/- $1.00/lb $50 $45
Gold: (1) +/- $50/ounce $100 $55
Currencies: (2) +/- 10% $140 $100

23
2016 2017e 2018e
Capital Expenditures(US$ billions)
Note: Includes capitalized interest. e= estimate. See Cautionary Statement.
Other Mining
Oil & Gas
1.2
0.4
Major
Mining
Projects
1.2
0.9*
0.7
$2.8
0.9
0.9*
$1.8
1.6
TOTAL
MINING
Future Spending Dependent on
Improvement in Market Conditions and
Continued Grasberg Underground Development
$1.6
* Major mining projects include $0.7 billion associated with Grasberg Underground development in 2017e and $0.75 billion for 2018e. As a result of
regulatory uncertainty, PT-FI has slowed investments in its underground development projects during 1Q17. If PT-FI is unable to reach agreement with the
Indonesian government on its long-term mining rights, FCX intends to significantly reduce or defer investments in underground development projects.
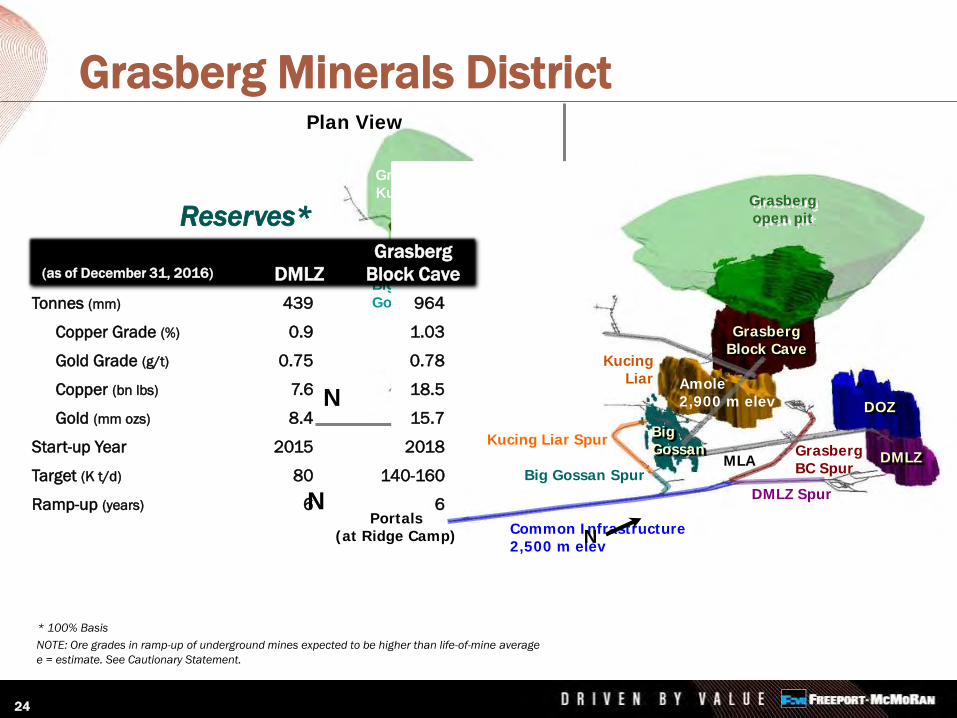
Plan View
DOZ
DMLZ
Grasberg &Kucing Liar
BigGossan
N
N
DOZ
DMLZ
GrasbergBlock Cave
KucingLiar
Grasbergopen pit
MLA
Common Infrastructure2,500 m elev
GrasbergBC Spur
Kucing Liar Spur
Big Gossan Spur
DMLZ Spur
Portals(at Ridge Camp)
BigGossan
Amole2,900 m elev
N
Grasberg Minerals District
e = estimate. See Cautionary Statement.
Tonnes (mm) 439 964
Copper Grade (%) 0.9 1.03
Gold Grade (g/t) 0.75 0.78
Copper (bn lbs) 7.6 18.5
Gold (mm ozs) 8.4 15.7
Start-up Year 2015 2018
Target (K t/d) 80 140-160
Ramp-up (years) 6 6
* 100% Basis
NOTE: Ore grades in ramp-up of underground mines expected to be higher than life-of-mine average
Reserves*
(as of December 31, 2016)
Grasberg
DMLZ Block Cave
24

PT-FI Mine Plan* PT-FI’s Share of Metal Sales, 2017e-2022e
2017e – 2022e PT-FI ShareTotal: 6.3 billion lbs copper
Annual Average: 1.05 billion lbs
2017e – 2022e PT-FI ShareTotal: 9.0 million ozs gold
Annual Average: 1.5 million ozs
Note: Timing of annual sales will depend upon mine sequencing, shipping schedules and other factors.
e = estimate. Amounts are projections; see Cautionary Statement.
25
1.141.28
0.91.0 1.0 1.0
1.91
2.3
1.1 1.1 1.1
1.5
2017e 2018e 2019e 2020e 2021e 2022e
Go
ld, m
m o
zs
Co
pp
er,
bn
lbs
* Projections assume normal operating rates at PT-FI beginning mid-April 2017, and the resolution or completion of negotiations with the Indonesian government on the conversion of PT-FI’s COW to an IUPK accompanied by an investment stability agreement by October 10, 2017. Since mid-April 2017, PT-FI has experienced a high level
of worker absenteeism, which has unfavorably impacted mining and milling rates.
$0
$2
$4
$6
$8
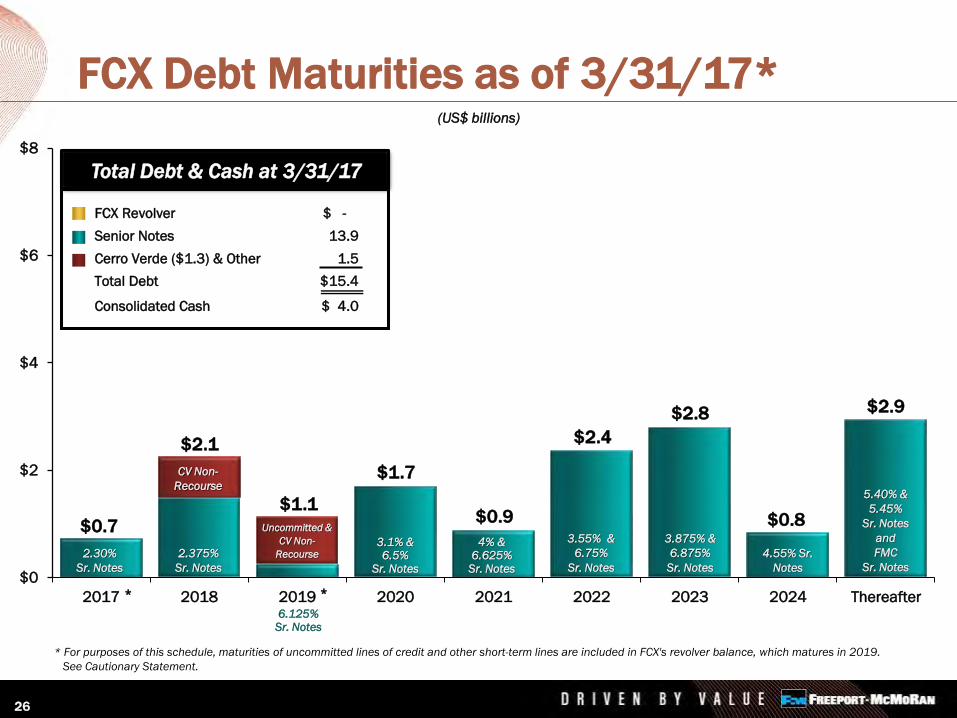
2017 2018 2019 2020 2021 2022 2023 2024 Thereafter
FCX Debt Maturities as of 3/31/17*
$2.1
$1.1
(US$ billions)
$0.9
$2.9
5.40% &
5.45%
Sr. Notes
and
FMC
Sr. Notes
$0.7
$1.7
$2.4
6.125% Sr. Notes
* For purposes of this schedule, maturities of uncommitted lines of credit and other short-term lines are included in FCX's revolver balance, which matures in 2019.
See Cautionary Statement.
* *
Uncommitted &
CV Non-
Recourse
$2.8
3.875% &
6.875%
Sr. Notes
3.55% &
6.75%
Sr. Notes
4% & 6.625%
Sr. Notes
3.1% &6.5%
Sr. Notes
2.375%
Sr. Notes
2.30%
Sr. Notes
CV Non-
Recourse
$0.8
4.55% Sr.
Notes
26
FCX Revolver $ -
Senior Notes 13.9
Cerro Verde ($1.3) & Other 1.5
Total Debt $15.4
Consolidated Cash $ 4.0
Total Debt & Cash at 3/31/17