Draft Follow-Up #2.docx - hartnell.edu viewDraft Follow-Up #2.docx - hartnell.edu

AN EVALUATION OF APPROACHES FOR MONITORING EMERGING PRIORITY HAZARDOUS SUBSTANCESDraft Final Report to the Department for Environment, Food and Rural Affairs
/tt/file_convert/5aa19de77f8b9a1f6d8c2802/document.doc
DEFRA 6211

AN EVALUATION OF APPROACHES FOR MONITORING EMERGING HAZARDOUS SUBSTANCES
Draft Final Report to the Department for Environment, Food and Rural Affairs
Report No: DEFRA 6211
Authors: Carla Littlejohn, Steve Nixon, Yvonne Rees and Brad Searle (WRc)
Andrew Kenny (CEFAS)
Martin Adams and Peter Coleman (AEA Technology Environment)
Contract Manager: Carla Littlejohn
Contract No: 12989-0
DEFRA Reference No: CDEP 84/5/313
Contract Duration: Feb 2002 - Nov 2003

CONTENTS
1. INTRODUCTION...........................................................................................1
1.1 Background............................................................................................................1
1.2 Aims and Objectives.............................................................................................2
1.3 Scope.......................................................................................................................2
2. TASK 1: PROJECT INCEPTION..................................................................4
3. TASK 2: DEVELOPMENT OF MONITORING MATRICES..........................5
3.1 Task Objectives.....................................................................................................5
3.2 Monitoring currently undertaken.......................................................................5
3.3 Development of monitoring of hazardous substances in the UK......................7
4. TASK 3 – EVALUATION OF HARP-HAZ: PART A COMPARISON BETWEEN NORTH SEA STATES.......................................................................9
4.1 Task Objectives.....................................................................................................9
4.2 Development of the HARP-HAZ prototype........................................................94.2.1 History of the North Sea Conferences............................................................94.2.2 Development of Harmonised Quantification and Reporting........................114.2.3 Objectives of the HARP-HAZ Prototype......................................................114.2.4 Structure of the HARP-HAZ Guidance Documents.....................................124.2.5 Reporting to the 5th North Sea Conference (REP-HAZ)...............................13
4.3 HARP-HAZ Evaluation Process........................................................................144.3.1 Collation and review of information.............................................................154.3.2 Consultation with Norway and the Netherlands...........................................154.3.3 Preliminary HARP-HAZ evaluation.............................................................164.3.4 HARP-HAZ workshop..................................................................................16
4.4 Overview of the Implementation of the HARP-HAZ prototype for the 5th North Sea Conference...........................................................................................16
4.4.1 Evaluation of NSS reporting approaches......................................................164.4.2 Factors affecting transparency and comparability of results........................234.4.3 Data Availability...........................................................................................254.4.4 Data suitability..............................................................................................25
5. TASK 3 – EVALUATION OF HARP-HAZ: PART B NORWAY AND THE NETHERLANDS.................................................................................................26
i

5.1 Evaluation of reporting approaches - Norway.................................................265.1.1 Source Identification.....................................................................................265.1.2 Infrastructure Requirements..........................................................................285.1.3 Advantages associated with approach...........................................................335.1.4 Difficulties encountered................................................................................355.1.5 Cost Effectiveness of the Approach..............................................................365.1.6 Future Developments....................................................................................36
5.2 Evaluation of Reporting Approaches - The Netherlands................................375.2.1 Source Identification.....................................................................................375.2.2 Infrastructure Requirements..........................................................................395.2.3 Advantages of the approach..........................................................................445.2.4 Difficulties Encountered...............................................................................445.2.5 Cost Effectiveness of the Approach..............................................................455.2.6 Future Developments....................................................................................46
5.3 Discussion.............................................................................................................46
6. TASK 4 – EVALUATION OF MONITORING APPROACHES....................49
6.1 Task Objectives...................................................................................................49
6.2 Overview of the Approaches to Monitoring.....................................................496.2.1 Source-Oriented Approaches........................................................................496.2.2 Environmental (including biological) monitoring........................................516.2.3 Non-traditional biological monitoring..........................................................536.2.4 A pragmatic combination of approaches......................................................54
6.3 Relevant documents/procedures........................................................................556.3.1 OSPAR HASH..............................................................................................556.3.2 Water Framework Directive Common Implementation Strategy (CIS) Guidance 56
6.4 Status of Monitoring Obligations Under Relevant Policy Drivers.................586.4.1 Overlapping/conflicting policy objectives....................................................586.4.2 International reporting obligations................................................................596.4.3 Monitoring requirements and targets............................................................676.4.4 Legal standing...............................................................................................67
6.5 Environmental Pathways...................................................................................68
6.6 Fate and Behaviour.............................................................................................69
6.7 PBT Properties....................................................................................................70
6.8 Usage and Detection............................................................................................72
6.9 Spatial and temporal scale of Monitoring / Compartments............................72
ii

6.10 Monitoring Cost..................................................................................................73
7. TASK 5 - ESTABLISHING A UK WIDE MONITORING STRATEGY FOR HAZARDOUS SUBSTANCES...........................................................................77
7.1 Task Objectives...................................................................................................77
7.2 Approach to Strategy Development..................................................................777.2.1 Issues considered...........................................................................................777.2.2 Emerging Substances....................................................................................787.2.3 Development of a monitoring strategy framework (decision tree)...............79
7.3 Examples of Application of the Decision Tree..................................................837.3.1 Choice of substances for testing decision tree..............................................837.3.2 Mercury.........................................................................................................847.3.3 Atrazine.........................................................................................................897.3.4 Clotrimazole..................................................................................................947.3.5 Polybrominated diphenylethers....................................................................98
7.4 Advantages and Limitations of the approach................................................103
7.5 Process for Implementation of the UK Strategy for Monitoring Hazardous Susbtances......................................................................................................................104
7.5.1 Step 2 – Identification and prioritisation of substances..............................1057.5.2 Step 3 – Identification of data and information gaps..................................1067.5.3 Step 4 – Preparation of monitoring programme..........................................1077.5.4 Step 5 – Implementation of monitoring programme...................................108
8. CONCLUSIONS AND RECOMMENDATIONS.........................................109
8.1 Conclusions........................................................................................................1098.1.1 Evaluation of HARP-HAZ..........................................................................1098.1.2 Status of monitoring obligations under relevant policy drivers..................1108.1.3 Monitoring costs.........................................................................................1108.1.4 Monitoring Strateygy for Hazardous Substances........................................110
8.2 Recommendations.............................................................................................111
ANNEX I – SPECIFICATION-PROGRAMME OF WORK................................116
ANNEX II - INCEPTION REPORT....................................................................120
ANNEX III - CURRENT AND EMERGING HAZARDOUS SUBSTANCE MONITORING REQUIREMENTS.....................................................................123
ANNEX IV - WORKSHOP DELEGATES.........................................................163
iii

ANNEX V - HARP-HAZ WORKSHOP – SUMMARY OF OUTCOMES...........164
Annex VI - application of ecotoxicological methods for assessing water quality..........................................................................................................................169
LIST OF TABLES
Table 3.1 Monitoring programmes reviewed for each media. 6Table 4.1 Evaluation of Member State reporting approaches in relation to
the emission, discharge and loss of heavy metals, organics and pesticides to air water. Note: Adapted from Table 5.3, North Sea Progress Report (North Sea Secretariat, 2000L) 18
Table 6.1 Characteristics of the main policy drivers in relation to emerging priority hazardous substances 62
Table 6.2 Examples of log Kow values of currently regulated organic substances (Nixon et al. 1996). 69
Table 6.3 UK marine pollution compliance monitoring programmes 75Table 6.4 UK Marine Quality Status Monitoring Programmes 75Table 7.1 Checklist template for development of a monitoring strategy for
individual substances 80Table 7.2 Overview of substances selected for testing the decision tree 83Table 7.3 Checklist template for development of a monitoring strategy for
Mercury 84Table 7.4 Checklist template for development of a monitoring strategy for
Atrazine 89Table 7.5 Checklist for development of a monitoring strategy for
Clotrimazole 94Table 7.6 Checklist for development of a monitoring strategy for PBDEs98
LIST OF FIGURES
Figure 5.1 Key organisations and data flows for reporting percentage reductions for hazardous substances 31
Figure 5.2 LOA Vs SOA for monitoring Mercury emissions to water in Norway 34
Figure 5.3 Key organisations and data flows for reporting percentage reductions for hazardous substances in the Netherlands 42
Figure 7.1 Proposed monitoring strategy for Mercury 88Figure 7.2 Proposed monitoring strategy for Atrazine 93Figure 7.3 Proposed monitoring strategy for Clotrimazole 97Figure 7.4 Proposed monitoring strategy for PBDEs 102
iv

ABBREVIATIONS
CBS Central Bureau of Statistics
CEI Common Emission Inventory
CONSSO Committee of North Sea Senior Officials
CORINAIR Co-ordination of Information on AIR emissions
DEFRA Department of Food, Environment and Rural Affairs
DPSIR Driving Forces, Pressures, States and Impacts
EA Environment Agency
EC European Commission
ECE-LRTRAP Convention on Long Range Transboundary Air Pollution
EC-LNV Expert’s Centre of Agriculture, Nature Conservation and Fishery
EEA European Environment Agency
EIS Emission Inventory System
EPER European Pollution Emission Register
HARP-HAZ Harmonised Quantification and Reporting of Hazardous Substances
IMH Inspectorate for Environmental Protection
IPPC Integrated Pollution Prevention Control
LNV Ministry of Agriculture, Nature Conservation and Fishery
LOA Load Orientated Approach
NAIS Norweigan Agricultural Inspection Service
NOSE Nomenclature for Sources and Emissions
NSC North Sea Conference
NSS North Sea State
OSPAR The Convention for the Protection of the Marine Environment of the North-East Atlantic
v

OSPAR-RID OSPAR Riverine Inputs and Direct Discharges
PBT Persistence, Liability to Bioaccumulate and Toxicity
PER Pollution Emission Register
PR Product Register
REP-HAZ Reporting on Hazardous Substances Manual
RIVM National Institute for Public Health and the Environment
RIZA Netherlands Institute for Inland Water Management and Wastewater Treatment
SOA Source Orientated Approach
SSB Statistics Norway
TNO Organisation of Applied Scientific Research
V & W Ministry of Transport Public Works and Water Management
VROM Ministry of Housing Spatial Planning and the Environment
WWTPs Waste Water Treatment Plants
vi

EXECUTIVE SUMMARY
Introduction
A Consortium comprising WRc plc, AEAT Technology Environment and CEFAS was appointed by DEFRA in February 2002 to undertake an evaluation of approaches for monitoring emerging priority hazardous substances.
This study was initiated to:
Provide an overview of existing monitoring obligations in relation to hazardous substances in the UK;
Examine the emerging and international obligations for monitoring hazardous substances and to determine the priority hazardous substances likely to be targeted and the associated monitoring requirements and costs;
Assess the practicality and resource implications of using source estimation/monitoring as opposed to traditional target monitoring; and,
Propose an outline UK strategy for assessing reductions of emerging priority hazardous substances in consideration of emerging and future international obligations.
Five Tasks were identified to achieve the above objectives:
Task 1 - Preparation of an Inception Report;
Task 2 - Development of monitoring matrices for current and emerging hazardous substances;
Task 3 - Evaluation of the Harmonised Quantification and Reporting Propotype (HARP-HAZ);
Task 4 - Evaluation of monitoring approaches; and
Task 5 - Development of an outline strategy for monitoring emerging priority hazardous substances.
This report presents the outcomes of the above tasks.
Task 1 – Project Inception
A project intiation meeting was undertaken and an inception report produced clarifying the objectives and scope of the project, tasks to be undertaken, outputs of the study and any further issues. The Inception Report is provided in Annex II.
Task 2 – Development of Monitoring Matrices
The objectives of Task 2 were to produce matrices which include:
vii

1. Hazardous substances currently being estimated or monitored in connection with international obligations; and
2. Hazardous substances that have recently been identified by OSPAR, the EC and other international organisations and those that are likely to be identified for mandatory monitoring programmes over the next five years.
Data for substances currently monitored in the UK and those required to be monitored was collated and tabulated, providing a complete list of hazardous substances currently monitored/listed for marine, freshwater and air compartments. This list is provided as Annex III (Table 1).
The second part of the monitoring matrix is composed of drivers such as EC Directives and OSPAR which list hazardous substances for priority action. The substances, which appear against each of the specified drivers are listed in Annex III (Table 2).
Task 3 - Evaluation of HARP-HAZ
An evaluation was undertaken of the Source Orientated Approach (SOA) to monitoring as proposed by Norway in the HARP-HAZ prototype, and how this approach has been applied by North Sea States (NSSs) in connection with reporting to the 5th North Sea Conference. The evaluation provides and overview of the reporting processes used in North Sea States, with specific focus on Norway and the Netherlands.
The HARP-HAZ protocol requires NSSs to report on hazardous substance emissions to air and water over a 14/15-year period. The results generated must be transparent and comparable. The evaluation is based on information obtained from the country specific reports, with respect to use of the SOA for reporting on emissions of hazardous substances to OSPAR.
With the exception of the UK, all NSSs reported percentage reduction in emissions, discharges and losses using the SOA.
A high degree of variability was evident between NSS reporting approaches for hazardous substance emission routes to air and water. The Netherlands, Norway, UK and to a lesser extent Denmark best illustrated transparency and comparability in their reporting regarding HARP-HAZ requirements.
A more detailed evaluation of the SOA as used by Norway and the Netherlands was undertaken to overcome limitations in data associated with the country specific reports and to enable the UK authorities to obtain a better understanding as to the feasibility of adoption of the SOA for reporting on hazardous substance emissions in the UK.
Task 4 – Evaluation of Monitoring Approaches
The advantages and disadvantages of a number of approaches currently used in monitoring hazardous substances including SOA, Load Orientated Approaches (LOA), environmental (including biological) monitoring, non-traditional biological monitoring (e.g. ecotoxicological and biomarker measures) and a combination of approaches are discussed.
A summary of the main drivers that determine the need and requirements for the monitoring of emerging hazardous substances is provided. Such drivers included the Air
viii

Quality Framework Directive, the Water Framework Directive, IPPC Directive and OSPAR Strategy for Hazardous Substances. Key issues in relation to the status of monitoring obligations under the relevant driver are discussed. These issues include:
Consideration of overlapping/conflicting policy objectives;
Monitoring requirements and targets;
Legal standing; and,
Reporting obligations.
This section also provides an overview of the environmental pathways, substance properties (fate/behaviour, PBT, usage and detection and spatial and temporal monitoring scales) and monitoring costs that need to be considered for the cost effective design of a hazardous susbtacnes monitoring strategy.
Task 5 – Establishing a UK Wide Monitorng Strategy for Hazardous Substances
An outline monitoring strategy is proposed, using a decision tree approach based on the identification and assessment of the key considerations outlined in Task 4, namely:
Status of monitoring obligations required under international policy drivers;
Environmental pathways; and,
Individual substance properties.
The strategy requires completion of a checklist of relevant information, followed by taking an individual substance through the decision tree.
Four substances (Mercury, Atrazine, Clotrimazole and Polybrominated Diphenylethers), representative of a range of pollutant types, properties and pathways were selected to test the decision tree.
The advantages and limitations of the approach are discussed and the following 5-step process for implementation is proposed:
Step 1. Co-ordination of roles and responsibilities;
Step 2. Identification and prioritisation of substances to be incorporated into the monitoring programme;
Step 3. Identification of gaps in data and information;
Step 4. Preparation of national monitoring programme (including provisions for periodic revision); and,
Step 5. Implementation of the programme through cross-sectoral River Basin Management Committee.
ix

Conclusions
Evaluation of HARP-HAZ
1. The UK was the only country to report on emissions using the LOA, whilst all other Member States used a combination of SOA1 and SOA2 when reporting on emissions of hazardous substances.
2. The Netherlands, Norway, the UK and, to a lesser extent, Denmark have best illustrated transparency and comparability in their reporting with regard to HARP-HAZ requirements. However, the difference between LOA and SOA reporting has resulted in significant variation in the way which data is reported between the UK and Norway and the Netherlands. Although the UK took all sources into account, only percentage reductions were provided for each substance.
3. Some of the benefits associated with using the SOA highlighted by Norway and the Netherlands are:
Rapid identification of target group sources that are key contributors of hazardous substances;
Key contributors of hazardous substances to the environment bear the cost of reporting under the SOA, enabling more resources to be focussed on quantifying diffuse sources; and
SOA is not influenced by transboundary issues (especially with regard to water).
4. Some of the difficulties encountered in implementation of HARP-HAZ requirements when reporting emissions using SOA, include:
Data gaps exist for some substances over the 14/15 year reporting period. As a result extrapolation had to occur using data from more recent years with information regarding source apportionment;
Inaccurate or incomplete data obtained from some sources;
Some industries may overlap source divisions resulting in difficulties when apportioning emissions amongst contributory sources;
Non-availability of data for diffuse sources of hazardous substances is a key problem in that data are often required to be estimated using statistical data or through expert judgement.
5. Norway and the Netherlands found difficulties in apportioning costs associated with the SOA due to the large number of organisations involved in the reporting process.
6. Norway and the Netherlands found that SOA was cost effective in terms of directing management priorities for the reduction of emissions. Furthermore, as major point sources self-report, more resources are available in which to focus quantification of emissions from unknown sources.
7. The difficulties and benefits associated with the SOA and the LOA indicate that a combination of both approaches may result in minimising problems related to data
x
quality and source apportionment. This is likely to be reinforced further by key drivers such as the WFD, which requires accurate monitoring data for specific substances as well as an indication of key sources of hazardous substances within specific River Basin Districts.
Status of monitoring obligations under relevant policy drivers
8. The prime legislative drivers that will identify emerging hazardous substances, and that might have monitoring requirements and implications, are considered to be the Air Quality Framework Directive, Water Framework Directive, IPPC Directive (air and water) and the OSPAR Strategy with regard to Hazardous Substances (air and water). All have iterative procedures for identifying hazardous substances of concern and have priority or action lists of substances that will be periodically updated. DEFRA should therefore continue to closely follow developments in the appropriate fora for these policy drivers.
9. The requirements of Directives are legally binding whilst those arising from OSPAR and North Sea Conferences might be considered as moral obligations. This difference should be considered in deciding whether an emerging substance should be monitored.
Monitoring costs
10. In order to develop a cost effective monitoing programme it is necessary to monitor the relevant substances in the appropriate matrix, at the appropriate locations and frequencies, and with acceptable levels of confidence and precision in the results. To achieve this, consideration must be given to the requirements of the policy driver/s, environmental pathways and substance specific properties. Consideration must also be given to existing monitoring regimes and other policy requirements likely to emerge in the future to avoid duplication of effort and ensure that an integrated monitoring programme is implemented that meets ALL the legislative/moral monitoring requirements in the most practical and cost effective way.
Monitoring Strateygy for Hazardous Substances
11. A decision-tree approach has been proposed for the identification of monitoring strategies for emerging hazardous substances. The decision-tree starts with the needs and requirements for monitoring (e.g. legislative drivers), then considers the usage/production/sources of the substance, its environmental fate and behaviour, its intrinsic chemical and ecotoxicological properties, leading to the identification of the most appropriate monitoring approach.
12. The decision-tree has been demonstrated using four substances with differing properties and hence different monitoring approaches. These are mercury, atrazine, clotrimazole and brominated diphenyl ethers.
13. The decision tree offers a simple approach to defining appropriate monitoring strategies for emerging hazardous substances but requires specific detailed information on each substance. In many cases some of this information will be lacking in which case a more precautionary approach should be adopted entailing preliminary surveillance monitoring and/or a risk assessment.
xi

14. A key source of information in determining monitoring strategies is on the usage, production and discharges of hazardous substances at a river basin and water body level. The development of a pollution emissions inventory/register at an appropriate scale will be a future valuable source of information for the proposed approach and also for the implementation of the Water Framework Directive.
15. A 5-step process for implementation of the monitoring strategy is proposed. The aim of this process is to co-ordinate activities through a national platform in order to ensure the preparation and implementation of a comprehensive monitoring programme for hazardous substances in the UK.
Recommendations
1. The outcomes of the study provide sound basis for the identification of the specific monitoring requirements for hazardous substances resulting from emerging international obligations and how these requirements could be fulfilled in a cost effective way. It is recommdended that additional work be undertaken to clarify the scope and roles of organisations responsible for (or impacted by) future monitoring programmes. This could be achieved by following the proposed step-by-step process for implementation and undertaken on a national scale through the establishment of a mulit-sectoral River Basin Management Committee.
2. It is recommended that DEFRA maintains a watching brief on the developments of the prime legislative drivers (such as the Water Framework Directive) so that it can develop its monitoring strategies in terms of emerging hazardous substances in a timely and cost-effective way, in order to meet the required international reporting obligations.
xii

An Evaluation of Approaches for Monitoring Emerging Hazardous Substances
1. INTRODUCTION
1.1 Background
The United Kingdom (UK) currently undertakes several monitoring programmes to estimate and measure inputs to, and levels of, hazardous substances in the environment. These programmes have been designed to address national and international requirements. In recent years the emergence of previously unidentified hazardous substances has resulted in a need to develop appropriate monitoring strategies to ensure that these substances are appropriately quantified.
The UK has traditionally favoured environmental approaches for monitoring hazardous substances as a result of extensive compliance and quality status monitoring programmes, which measure contamination in the environment. These programmes have been implemented in the UK due to recognition of the assimilative capacity of the environment and the need to set appropriate Environmental Quality Standards (EQS). However, the emergence of new policy drivers has resulted in a need to ensure the existence of an appropriate balance between compliance and quality status monitoring.
Mandatory aspects for monitoring hazardous substances have changed substantially in recent years. Many of these new requirements have not been fully implemented into UK monitoring practices. For example the Water Framework Directive introduces far reaching requirements with respect to the aquatic environment. As a result a combined approach of emission limits and quality standards is likely to be required to ensure Member States control hazardous substances on the Priority List.
This study was initiated by DEFRA to determine the existing monitoring obligations for hazardous substances required in accordance with existing policy and to develop a pragmatic strategy for monitoring hazardous substances likely to emerge under future policy requirements. The Consortium was appointed by DEFRA (Contract CDEP 84/5/313) in February 2002 to undertake a strategic review of how the United Kingdom (UK) should best address the estimation and monitoring of ‘emerging hazardous substances1’, and how best use could be made of resources.
This draft final report provides an evaluation of various monitoring approaches currently used and proposes a strategy for the development of monitoring programmes to assess emerging hazardous substances, in consideration of the relevant policy drivers and substance properties.
1.2 Aims and Objectives
The overall aim of the study is to provide an evaluation of approaches for monitoring emerging priority hazardous substances and provide recommendations as to the most
1 Emerging hazardous substances refers to substances that are of possible concern to the environment, that do not appear on any current monitoring lists, but may be required to be monitored in the future (e.g. as relevant hazardous substances lists are revised).
1

An Evaluation of Approaches for Monitoring Emerging Hazardous Substances
appropriate strategy for assessing reductions of priority hazardous substances in the UK, taking account of emerging and future international obligations.
The objectives of this study are to:
Provide an overview of which substances are currently being estimated and monitored in connection with existing international obligations, the approximate cost of this monitoring and the scope for reducing this monitoring;
Examine the emerging and international obligations relevant to the marine / aquatic environment for estimation of monitoring hazardous substances in discharges, emission and losses and to identify the emerging priority hazardous substances likely to be targeted and the associated monitoring requirements and costs;
Assess the practicality and resource implications of using source estimation/monitoring, as opposed to traditional target monitoring, in meeting future international reporting obligations and for assessing whether the chemicals identified as priority substances in national and international forums are decreasing over time and will meet relevant cessation and/or risk management targets; and,
Propose an outline UK strategy for assessing reductions of emerging priority hazardous substances in consideration of emerging and future international obligations.
The study was divided into the following five key tasks:
Task 1. Preparation of an Inception Report;
Task 2. Development of monitoring matrices for current and emerging hazardous substances;
Task 3. Evaluation of Harmonised Quantification and Reporting Propotype HARP-HAZ;
Task 4. Evaluation of monitoring approaches; and
Task 5. Development of an outline strategy for monitoring emerging priority hazardous substances.
The specific objectives of these tasks are defined in Annex I (Specification and Programme of Work) and further elaborated under the relevant section in the report.
1.3 Scope
This evaluation focuses specifically on the four monitoring approaches listed below:
1. Source monitoring approach;
2. Environmental monitoring (including biological – concentrations of contaminants and community structure);
3. Non-traditional biological monitoring (e.g. ecotoxicology and biomarkers); and,
2
An Evaluation of Approaches for Monitoring Emerging Hazardous Substances
4. A pragmatic combination of the above approaches.
Using the information obtained from the evaluation process a monitoring strategy, based on a decision tree approach, has been developed for emerging priority hazardous substances. The practical application of the decision tree is tested using substances with varying productions/use, data availability, pathways and properties to determine if the approach is suitable for the development of monitoring strategies for a range of emerging substances.
3

An Evaluation of Approaches for Monitoring Emerging Hazardous Substances
2. TASK 1: PROJECT INCEPTION
The objective of Task 1 was to prepare an inception report further defining:
The objectives and scope of the project;
The tasks to be undertaken to fulfil the objectives;
The outputs of the study; and,
Any issues to be discussed in order to clarify the understanding of what is required within the contract.
A draft inception report was presented for discussion at an initial project meeting held with DEFRA on 19 March 2002. The inception report was subsequently revised based on these discussions. The final inception report presented the way forward for the completion of the study and is provided in Annex II.
4

An Evaluation of Approaches for Monitoring Emerging Hazardous Substances
3. TASK 2: DEVELOPMENT OF MONITORING MATRICES
3.1 Task Objectives
The objectives of Task 2 were to produce matrices which include:
Hazardous substances currently being estimated or monitored in connection with international obligations; and
Hazardous substances that have recently been identified by OSPAR, the EC and other international organisations and those that are likely to be identified for mandatory monitoring programmes over the next five years.
The following sections describe the process undertaken for compilation of the matrices. The complete matrices are provided in Annex III, Tables 1 and 2 (current and emerging monitoring, respectively).
3.2 Monitoring currently undertaken
Data for substances currently monitored in the UK and those required to be monitored was collated and tabulated. A complete list of hazardous substances currently monitored/listed for marine, freshwater and air compartments is provided in Annex III (Table 1).
The data tabulated on substances is separated into two parts, namely:
i. Substances which are monitored in the marine, freshwater and air environments (colour shaded); and,
ii. Substances which are required to be monitored by various mandatory drivers and which appear as listed substances in EC Directives and OSPAR.
The information on substances monitored in the environment relied on information collated by the Marine Pollution Monitoring Management Group review of marine monitoring activities (MPMMG, in press) and the report and database produced by RPA on ‘Monitoring chemicals in the environment’ (RPA, 2002).
For each media (marine, freshwater, air) the relevant monitoring programmes were investigated and the lists of substances monitored under each programme (see Table 3.1) were listed along with information on the number of sites and the frequency of sampling undertaken. The column which indicates the “monitoring effort” is simply a relative index of the number of sites sampled multiplied by the frequency of sampling divided by 100, assuming that all sites were sampled at least once per year, the index represents an annual measure of relative effort.
5

An Evaluation of Approaches for Monitoring Emerging Hazardous Substances
Table 3.1 Monitoring programmes reviewed for each media
MarineProgramme Name DriverNational Marine Monitoring Programme OSPAR JAMPDangerous Substances Directive EC Directive OSPAR RIDShellfish Waters Directive EC DirectiveShellfish Hygiene Directive EC DirectiveDisposal site monitoring Food and Environment Protection ActTitanium Dioxide EC Directive
AirProgramme Name DriverPAHs Monitoring and Analysis Network UNECE POPs protocol; EC DirectiveToxic Organic Micropollutants Network UNECE POPs protocol; EC DirectiveUK Acid Deposition Monitoring Network UNECE CLRTAP, CORINAIRRural Trace Elements Network (now replaced by the Metal Deposition Network)
UNECE HM Protocol, EC Directive
North Sea Network (now replaced by the Metal Deposition Network)
OSPAR
Heavy Metal Content of Airborne Particulate Material (non specified)Monitoring of Heavy Metals in the UK EC DirectiveNorth Sea Network OSPARTrace Elements Measurements in London and beyond with a particular emphasis on mercury
(non specified)
FreshwaterProgramme Name DriverDangerous Substances Directive EC DirectiveDrinking Water Directive EC DirectiveFreshwater Fish Directive EC DirectiveGroundwater Directive EC DirectiveSurface Water Directive EC DirectiveUrban Waste Water Treatment Directive EC DirectiveRiver Ecosystems GQA Water Resources Act 1991Titanium Dioxide Directive EC Directive
The second table of the monitoring matrix is composed of drivers such as EC Directives and OSPAR, which list hazardous substances for priority action. The substances, which appear against each of the specified drivers are listed in Table 2 (Annex III). In addition, inputs to the environment of those substances that are self-assessed by industry to comply with the IPPC Directive and the EPER are listed under the Pollution Inventory heading in Annex III. The Environment Agency (EA) co-ordinates returns for the Pollution Inventory from which data from some 1700 sites (returns) are used to compile information on substances discharged to the environment in kg per year. Several sectors are reported separately and total emissions are estimated as either measured, calculated or estimated quantities. The EA has a number of site inspectors who audit the returns by visiting sites and undertaking validation measurements. This process enables the review of consents on a periodic basis. Scotland does not have a pollution inventory but will require one in the near future to meet IPPC Directive EPER requirements.
6
An Evaluation of Approaches for Monitoring Emerging Hazardous Substances
3.3 Development of monitoring of hazardous substances in the UK
A review of OSPAR, EC and other international organisations was undertaken to determine what hazardous substances have recently been identified, and those likely to be identified in the next five years. A list of emerging hazardous substances likely to require mandatory monitoring in the marine, freshwater and air compartments, is provided in Annex III (Table 2).
The Dangerous Substances Directive (76/464/EEC) introduced the requirements to regulate hazardous substances at EU level. It covered discharges to freshwaters, estuaries and coastal waters. The Directive identified two lists of substances: List I comprising the most dangerous requiring control measures and targets at an EU level for the elimination of pollution from these substances; and, List II substances requiring national measures for reducing the pollution from these substances.
For List I substances, the Directive stipulates two approaches for control: limit values (LVs) which release standards set at a national level are not to exceed; and, release standards set by reference to (environmental) quality objectives (QOs). Both types of standard are set on a Community level. A Member State may use the latter approach if it can prove that the QOs laid down by the Council are met, and continuously maintained throughout the area that might be affected. The UK adopted the latter approach, that is the implementation of Environmental Quality Standards (Objectives) For List II substances, Member States are required to set QOs and to establish emission reduction programmes based on these standards.
Where a Member State has implemented emission standards for discharges to surface waters they may be expressed in three different ways:
As a load in terms of the quantity discharged during a certain period (e.g. one day, one month, one year);
As a quantity of substance discharged in relation to the quantity of product produced; or,
As a concentration of a substance in the effluent discharged from the plant.
Article 5 of Directive requires Member States to implement either of the first two types of emission standard, and the third type. The UK has adopted the alternative regime which entails emission standards being set by reference to (environmental) quality standards.
The Annexes to the Dangerous Substances Directive specify monitoring procedures to be applied to discharges to check compliance with the emission standards (i.e. a source-oriented approach). In terms of quality objectives measurements must be taken sufficiently close to the point of discharge to assess compliance.
The daughter Directives to Directive 76/464/EEC state that Member States shall be responsible for monitoring the aquatic environment affected by industrial discharges. In the UK the mixing zone concept was established where the discharge was ‘allowed’ to mix in a certain volume of water before compliance was assessed: in practice mixing zones were established using mathematical models. Another key historical driver in terms of determining the need for monitoring information are the Ministerial Conferences on the Protection of the North Sea. At the London Conference in 1987 it was agreed
7

An Evaluation of Approaches for Monitoring Emerging Hazardous Substances
that the inputs of substances that are persistent, toxic and liable to bioaccumulate should be reduced. Reduction targets were set including:
Around 50% reduction between 1985 and 1995 of total inputs to the North Sea via rivers and estuaries of substances that are persistent, toxic and liable to bioaccumulate;
Reduction of atmospheric emission of pollutants from key industrial and other sectors.
The former Paris Commission started the “Comprehensive Study on Riverine Inputs and Direct Discharges” (RID) in 1989 as an annual data collection exercise aiming at collecting from coastal countries their geographically referenced annual waterborne load data for a standard set of determinands (12 mandatory determinands and 3 recommended types of contaminants). The participating countries undertook to aim to monitor at least 90 % of the total loads reaching the maritime area from their coastal interface (i.e. a load oriented approach).
The reporting on discharges, emissions and losses of hazardous substances to the 4 th
North Sea Conference (4 NSC) at Esbjerg, in 1995, highlighted the need for increased harmonisation regarding definitions of sources and transparency, as well as harmonisation in the quantification of these discharges/emissions/losses of hazardous substances. Norway, as the hosts of the 5th North Sea Conference, subsequently undertook an exercise aimed at harmonising the reporting requirements for the targeted substances (HEAP-HAZ) and the resulting guidance was used as the basis for reporting discharges/emissions/losses of hazardous substances to the Fifth North Sea Conference.
8
An Evaluation of Approaches for Monitoring Emerging Hazardous Substances
4. TASK 3 – EVALUATION OF HARP-HAZ: PART A COMPARISON BETWEEN NORTH SEA STATES
4.1 Task Objectives
The objective of Task 3 was to evaluate the Source Orientated Approach (SOA) to monitoring as proposed by Norway in the HARP-HAZ prototype and how this approach has been applied by North Sea States in connection with reporting to the 5th North Sea Conference.
To achieve the objective, the evaluation was required to include:
An overview of the in-country infrastructure required to support it;
Limitations of the approach and how it works in practice; and,
Comparability of results between NSS, using Norway and the Netherlands as specific examples.
A small two day workshop was undertaken to facilitate this process (refer to Section 4.4 for details).
The following sections provide an overview of the SOA as proposed in the HARP-HAZ prototype and how it has been applied in NSS.
4.2 Development of the HARP-HAZ prototype
4.2.1 History of the North Sea Conferences
There was growing concern in the early 80s that the large inputs of various harmful substances from diffuse run-off, direct discharges and dumping could cause irreversible damage to the ecosystems of the North Sea. Some NSS were also dissatisfied with the lack of progress made by the competent national organisations responsible for protecting the marine environment. This resulted in the initiation of an international conference on the Protection of the North Sea in Bremen in 1984 and the subsequent conferences in London (1987), The Hague (1990), Esbjerg (1995) and Bergen (2002). In addition to the five formal conference meetings to date there have been two intermediate meetings between the Minister of Environment and the Ministers responsible for Agriculture and Fisheries, respectively (Denmark, 1993 and Norway, 1997).
The North Sea Conferences have focussed on a number of areas, including the protection of species and habitats and reducing and phasing out of hazardous substances. They provide the political framework for a broad and comprehensive assessment of the measures required to protect the North Sea. The conferences also play an important role in influencing environmental management decisions, for example
9

An Evaluation of Approaches for Monitoring Emerging Hazardous Substances
adoption of the precautionary principle and acceptance of the concepts of sustainable development and the integrated ecosystem approach.
Ministers from nine countries plus the European Commission participate in the Conferences. These countries are:
Belgium;
Denmark;
France;
Germany;
The Netherlands;
Norway;
Sweden;
Switzerland; and
The United Kingdom.
The aim of the 1st International Conference in Bremen 1984 was to provide a political forum to intensify the work and ensure more efficient implementation of the existing international legislation related to the marine environment in all NSS. It was thought that a political declaration from a North Sea perspective would stimulate and bring further ongoing work within the existing international conventions (e.g. the Oslo Convention on dumping at sea, the Paris Convention on pollution from land-based sources and the IMO Convention on shipping issues).
Ministers at the 3rd North Sea Conference agreed to achieve reduction of inputs via rivers, estuaries, and atmospheric emissions of 50%, 70% or more between 1985 and 1995 for the 36 substances listed in Annex 1A of the Hague Declaration. This number was increased to 37 with the addition of PAHs at the 1993 Intermediate Ministerial Meeting.
The main outcomes of the 4th Conference (1995) were continued action to achieve, by 2000, those targets from the Hague Declaration not yet achieved and the introduction of the ‘one generation target’. The goal of the ‘one generation target’ is to prevent pollution of the North Sea by the year 2020 (25 years), through a continuous reduction in discharges, emissions and losses of hazardous substances with the ultimate aim of reducing concentrations in the environment near background levels for naturally occurring substances and close to zero for man-made synthetic substances.
A committee of North Sea senior officials representing the NSS and the European Commission (CONSSO) was formed in order to supervise implementation of the actions resulting from the 4th North Sea Conference (Esbjerg Declaration) and to consider the need for additional actions in preparation for the 5th North Sea Conference.
Since the 4th North Sea Conference, an important achievement has been the adoption of a number of new strategies to the OSPAR convention, including one with regard to
10

An Evaluation of Approaches for Monitoring Emerging Hazardous Substances
hazardous substances. Nevertheless, Ministers attending the 5th North Sea Conference stressed that a further increase in effort was necessary in order to meet the ‘one generation’ target. To achieve this goal it was identified that action should be undertaken to determine the increased controls required on the use of hazardous substances in consumer products. Therefore, the Ministers agreed the consumer use of hazardous substances should be addressed as a priority issue in the reform of the EU chemicals policy and the development of the EU integrated product policy.
4.2.2 Development of Harmonised Quantification and Reporting
Ministers attending the 4th North Sea Conference highlighted that comparability in the quantification and reporting of the discharges, emissions and losses of hazardous substances between NSS was inhibited due to the lack of harmonised procedures for collecting, storing and reporting of data.
As a result, it was agreed that a system should be developed and implemented to provide source definitions, transparency in reporting and develop harmonised procedures for the quantification of discharges, emissions and losses of hazardous substances. Furthermore it was emphasised that this system would be based on a common set of procedures and, where possible utilise the existing reporting procedures of the European Commission (EC), the European Environment Agency (EEA) and the OSPAR Commission.
Norway, in co-operation with the EC and EEA, was invited to lead a project to develop a set of guidelines and procedures to enable the establishment of a system for transparent, reliable and comparable quantification and reporting of hazardous substances within NSS. The HARP-HAZ project was initiated in response to this invitation. Norway was assisted by the HARP-HAZ contact group, which is comprised of representatives from some OSPAR countries, the DG XI of the EC and the EEA.
The development of a HARP-HAZ prototype was initiated following the first HARP-HAZ workshop in September 1998. It was agreed that this prototype would be developed and implemented as a trial for reporting on the losses, discharges, and emissions of hazardous substances and presented to the 5th North Sea Conference to be held in Norway on 21-22 March 2002.
The HARP-HAZ prototype was developed in reference to various international developments (e.g. Rhine Commission), the OSPAR List of Hazardous Substances for Priority Action, the 37 hazardous substances from the North Sea Conferences, Ministerial Declarations and the EC Water Framework Directive list of Priority Hazardous Substances.
4.2.3 Objectives of the HARP-HAZ Prototype
The main objective of the HARP-HAZ Prototype is to present a general scheme that can enable the discharges, emissions and losses of specific hazardous substances to be quantified and reported on in a transparent and harmonised way.
The specific objectives, as defined in the Overall HARP-HAZ Guidance document, are to:
11
An Evaluation of Approaches for Monitoring Emerging Hazardous Substances
Provide transparency and comparability of the national reports on the achievement of the 50% and 70% reduction targets, as specified in the Ministerial Declarations of the North Sea Conferences;
Provide a basis for further evaluation on the sources and/or entry routes that are relevant for the specific hazardous substances to be reported on; and
Give guidance on how to quantify and report discharges, emissions and losses of hazardous substances in a way that is transparent and, to the extent possible, harmonised between countries.
Due to the short time frames provided for development of the HARP-HAZ prototype, it was not possible to quantify and report on all 37 substances. Therefore, the initial testing was based on a selection of 11 hazardous substances, or groups of hazardous substances, which comprise several of the OSPAR list of substances for priority action, namely:
Dioxins (PCDDs and PCDFs);
PCBs;
PAHs;
SCCPs (Short chained chlorinated paraffins);
Mercury;
Cadmium;
Lead;
Lindane (HCH);
TBT/TPT;
Nonylphenol / ethoxylates (NP/NPEs); and
Brominated flame retardants.
4.2.4 Structure of the HARP-HAZ Guidance Documents
The HARP-HAZ Prototype provides an overview of the important sources and sub-sources of each of the 11 selected hazardous substances and provides guidance on the quantification and reporting on discharges, emissions and losses of hazardous substances from relevant sources and entry routes.
The prototype consists of an overall guidance document and individual guidance documents for the 11 selected hazardous substances.
The guidelines provide NSS with the flexibility to report using either the source-orientated approach (SOA) i.e. monitoring of emissions at source or the load-orientated approach (LOA) i.e. monitoring in environmental media. Procedures are provided in the
12

An Evaluation of Approaches for Monitoring Emerging Hazardous Substances
11 individual guidance documents to quantify the discharges, emissions and losses using both of the approaches.
4.2.5 Reporting to the 5th North Sea Conference (REP-HAZ)
In order to facilitate transparent and harmonised reporting on the discharges, emissions and losses of the 11 selected hazardous substances to the 5th North Sea Conference a simple reporting system (in Microsoft Access) was developed. The reporting system was developed based on the information contained in the HARP-HAZ prototype. An outline of the system and instructions on entering relevant data are provided in the ‘REP-HAZ User Manual’ (2001).
Quantitative and qualitative data for the years 1985, and 1999/2000 was imported into the REP-HAZ system. Norway prepared a compilation of submitted inputs for presentation to the 5th North Sea Conference. A progress report was then prepared by CONSSO based on this information. The progress report provides, inter-alia, an assessment of the transparency and comparability achieved from implementation of the HARP-HAZ prototype, and summarises the overall success to date in meeting the 50/70% reduction targets for the 37 substances included in the Hague and Esbjerg Ministerial Declarations.
The assessment of emissions, discharges and losses of pollutants should be consistent with the European Environment Agencies’ conceptual framework i.e. Driving forces, Pressures, States, Impacts, Responses (DPSIR). DPSIR identifies the links between the driving forces, pressures, state of the environment, impacts and responses. In order to quantify and report on hazardous substances the assessment must identify the driving forces and link them to the current state of the environment. If these links are identified it is possible to test any scenarios regarding driving forces by examining the effects of the state (De Paepe, 2000).
The HARP-HAZ prototype provides NSS with the flexibility to quantify pollutants by using either the SOA or the Load Orientated Approach (LOA), or a combination of the two depending on the specific reporting requirements. While this report is principally focussed on evaluating the SOA as proposed in the prototype, it is first necessary to provide an overview of both approaches to enable a comparison to be drawn in relation to the limitations and cost effectiveness of each approach in relation to meeting legal requirements.
SOA as specified in the HARP-HAZ prototype
Reporting based on the SOA requires quantitative data on the various sources of the hazardous substances that have a potential to impact on surface waters, including atmospheric emissions. The overall HARP-HAZ guidance identifies the major groups of sources and sub-sources, the majority of which are already specified in the EUROSTAT nomenclature for sources and emissions (NOSE). In the SOA information about the emissions, discharges and losses from all significant sources should be considered. However, it is recognised that identification of such sources and the relevant transfer processes may be very complex.
According to the HARP-HAZ prototype the SOA can be applied using either of two methods:
13

An Evaluation of Approaches for Monitoring Emerging Hazardous Substances
SOA 1 requires measurement of concentration levels at source, quantified using additional data about the source (e.g. discharged, lost or emitted volumes per period of time, tonnage); and
SOA 2 requires estimations based on emission factors, quantified using additional data such as activity rates, sales statistics, material flow/distribution factors or reported values from literature. A number of equations are provided, relating specifically to air (emission) and water (discharge) and the relevant approach selected (e.g. SOA 1 or 2).
LOA as specified in the HARP-HAZ prototype
The HARP-HAZ prototype identifies the main entry routes to marine areas and provides recommendations on the appropriate measurement/estimation of pollutant loads entering marine waters.
The prototype describes four methodologies to be employed. LOA 1 requires that measurements in rivers be taken in accordance with the description provided in the OSPAR RID programme. The OSPAR RID programme identifies a total of twelve substances that must be monitored on an ongoing basis. While only four of these, Mercury, Cadmium, Lead and Lindane are common to the substances selected in the HARP-HAZ prototype, the overall guidance document states that, in principle, this methodology could be used for other hazardous substances.
LOA 2 requires determination of load based on measurements of direct discharges at site and refers primarily to industry and wastewater discharges. LOA 3 and 4 refer to estimation of other direct inputs, where sufficient empirical data is not available.
The LOA as described in the HARP-HAZ prototype refers only to ‘riverine’ discharges. All reporting for air is based on emission inventories (i.e. SOA). Therefore, to quantify the airborne component of the total load to the marine environment, the prototypes states that results from emission inventories should be used in addition to the riverine LOA.
4.3 HARP-HAZ Evaluation Process
An initial evaluation was undertaken on the approaches employed by all NSS for reporting emissions of hazardous substances to air and water.
The second phase of the evaluation process involved focussing specifically on Norway and the Netherlands and their utilisation of the SOA approach. Key elements included identification of organisations involved in the reporting process, infrastructure required for using SOA, advantages and difficulties encountered when implementing the approach as well as its overall cost-effectiveness.
The final stage of the evaluation process involved conducting a workshop between representatives from Norway and the Netherlands and the UK environmental departments including DEFRA, SEPA, EA and DOE. This enabled the facilitation of information between the countries with regard to use of the SOA.
14
An Evaluation of Approaches for Monitoring Emerging Hazardous Substances
4.3.1 Collation and review of information
Collation and review of information focussed on three key sources:
Literature and web searches;
Compilation of Submitted Inputs and Progress Report to the 5th North Sea Conference; and,
Other relevant literature provided by Norway and the Netherlands.
A literature search and web search was undertaken to provide necessary background information and to provide a broad overview in the context of the evaluation.
The initial review of information focussed on two key pieces of information. The 5 th North Sea Conference Progress Report, which provided an overall summary of key trends with regard to transparency and comparability and the Compilation of Submitted Inputs to the 5th North Sea Conference, which contains the raw data on hazardous substances reported by NSS. Data contained within this document varied greatly between NSS.
Additional information provided by representatives from Norway and the Netherlands was also consulted when considering specifically their use of the SOA for reporting emissions of hazardous substances.
4.3.2 Consultation with Norway and the Netherlands
The initial consultation with Norway and the Netherlands involved:
Development and circulation of a questionnaire to relevant officials fomr Norway and the Netherlands; and
Personal contact with source monitoring experts from UK, Norway and the Netherlands.
A questionnaire was developed to obtain key information regarding implementation of the SOA in Norway and the Netherlands. The questions focused on key variables such as organisational requirements, infrastructure, advantages and difficulties encountered and overall cost-effectiveness regarding use and potential application of the SOA.
Representatives from the Norweigan Pollution Control Authority (NPCA) (Christian Dons) and the Netherlands Institute for Inland Water Management and Wastewater Treatment (RIZA) (Joost van den Roovaart) were selected with the assistance of DEFRA. The questionnaire was completed during a series of telephone interviews undertaken with these representatives.
4.3.3 Preliminary HARP-HAZ evaluation
A preliminary evaluation of the SOA as proposed in the HARP-HAZ prototype was undertaken following the collation and review of information and initial consultation with NSS. The evaluation was prepared in as quantitative way as possible using the following criteria:
15

An Evaluation of Approaches for Monitoring Emerging Hazardous Substances
Approach selected for quantification of each substance (e.g. SOA1, equation 1);
Methodology and details of source identification;
Support infrastructure requirements required for implementation;
Cost effectiveness in terms if meeting legal requirements;
Difficulties encountered in implementing the HARP-HAZ prototype for each substance; and,
Applicability of the information obtained (e.g. did the data reported meet the requirements of the HARP-HAZ prototype and was the data comparable between States).
The draft report was disseminated to the representatives of Norway and the Netherlands for comment following the inclusion of their inputs.
4.3.4 HARP-HAZ workshop
A two day workshop, hosted by DEFRA, was undertaken on Wednesday the 2nd and Thursday October 3, 2002. A total of 23 people attended the workshop, including representatives from DEFRA, monitoring experts from the UK and representatives from Norway and the Netherlands who are instrumental in the implementation of the SOA, as well as key members of the project team. A full list of delegates, including contact details is provided in Annex IV.
The preliminary HARP-HAZ evaluation was discussed at the workshop in October and subsequently revised to take account of the proceedings. A summary of the outcomes of the HARP-HAZ workshop is provided in Annex V.
4.4 Overview of the Implementation of the HARP-HAZ prototype for the 5th North Sea Conference
4.4.1 Evaluation of NSS reporting approaches
All NSS, with the exception of the UK (LOA for water), reported percentage reductions of hazardous substances (both ari and water) to the 5th North Sea Conference, using the SOA (North Sea Secretariat 2002n). A study undertaken by the ETC/IW for the EEA (2000) also confirms the SOA approach is the most widely used method for the assessment of nutrient emissions. In this study ten assessment procedures covering eight Member States were examined and compared. The study found that while inconsistencies arose in the selection of sources, the general approach (i.e. SOA) was principally the same, with the exception of the Rhine River Study.
The UK is the only NSS to have reported data for the HARP-HAZ prototype according to the LOA. The UK has traditionally favoured the LOA as a result of extensive compliance and quality status monitoring programmes, aimed at measuring long-term trends in surface water contamination. Such programmes have been implemented in the UK in
16

An Evaluation of Approaches for Monitoring Emerging Hazardous Substances
recognition of the assimilative capacity of the environment and the need to set appropriate Environmental Quality Standards (EQSs).
The compilation of submitted inputs to the progress report on the 5 th North Sea Conference (North Sea Secretariat, 2001k) identifies three major categories for reporting on hazardous substances, namely:
Heavy metals;
Organic substances not mainly used as pesticides; and
Pesticides.
A number of sources and sub-sources contribute hazardous substances to air and water for each of the categories identified above. To achieve harmonised reporting for both the SOA and LOA, NSS were required to report on emissions of hazardous substances for all sources of significance. Although the overall guidance document recognised the complexity of identifying the various sources and transfer processes, the 11 guidance documents focussing on specific substances provided indicative lists of the main sources and sub-sources.
An evaluation in relation to heavy metals, organics and pesticides to air and water was undertaken in order to determine the effectiveness of NSS reporting in relation to HARP-HAZ requirements. Table 4.1 illustrates the different reporting approaches adopted by Member States for reporting on hazardous substances to the 5th North Sea Conference.
17

An Evaluation of Approaches for Monitoring Emerging Hazardous Substances
Table 4.2 Evaluation of Member State reporting approaches in relation to the emission, discharge and loss of heavy metals, organics and pesticides to air water. Note: Adapted from Table 5.3, North Sea Progress Report (North Sea Secretariat, 2000L)
Category Approach Source ID Approach Source ID
CO
UN
TRY
SO
A1
LOA
1
N/A
Mai
n +
sub-
sour
ce
Mai
n on
ly
Tota
l sou
rce
% re
d’n
No
repo
rting
SO
A1
SO
A2
LOA
1
LOA
2
Mai
n +
sub-
sour
ce
Mai
n on
ly
Tota
l sou
rce
% re
d’n
Sal
es s
tat’s
No
repo
rting
B Heavy Metals
a a a a
Organics
Pesticides
CH Heavy Metals
b
Organics
Pesticides c
D Heavy Metals
f
Organics f f c
Pesticides c
Dk Heavy Metals
a
Organics
Pesticides d
F Heavy Metals
g g
Organics e
Pesticides
N Heavy Metals
h h
Organics h h c
Pesticides c
NL Heavy Metals
h h
Organics h h
Pesticides
S Heavy Metals
Organics c
Pesticides
UK Heavy Metals
f f
Organics f f
Pesticides i
18

An Evaluation of Approaches for Monitoring Emerging Hazardous Substances
Notes
a) Source and sub-source profile provided for heavy metals for the year 1999 but only total data provided for all sources in 1985. This is likely to be a function of insufficient data.
b) Data regarding source apportionment for some substances is minimal e.g. copper to air in case of Switzerland. Therefore only percentage reduction reported.
c) No reporting on some substances due to substance phase-out i.e. 100% reduction already achieved for substances such as DDT.
d) Percentage reduction not reported for substances as data only available for recent years e.g. PAH.
e) Percentage reduction not reported over 14/15 year time period, although quantitative data provided for years 1990 onwards.
f) Percentage reduction reported with no information on total loads.
g) France reported on 1986 baseline year as opposed to 1985 for emissions of metals to air and water.
h) Norway and the Netherlands extrapolated data from the year 1990 for the baseline year 1985, enabling formation of source/subs-source profiles for 1985 where data previously unavailable.
i) UK reported on pesticides using actual use data as opposed to sales statistics.
19

An Evaluation of Approaches for Monitoring Emerging Hazardous Substances
Heavy Metals
The heavy metals required to be reported on for implementation of the HARP-HAZ prototype were:
mercury;
copper;
lead;
chromium;
cadmium;
zinc;
arsenic; and
nickel.
All NSS used the SOA1 for reporting on heavy metal reductions in air and water with the exception of the UK who applied the LOA1 / LOA2 when reporting on reduction of heavy metals in water. Although most NSS were relatively consistent in terms of the reporting approach adopted there were substantial differences in source identification resulting from variables such as access to accurate data, monitoring techniques and infrastructure.
Denmark, Norway and the Netherlands were the only NSS who reported quantitative data for each of the main sources and sub-sources of heavy metals. For example in determining the total mercury load in water in 1999 the Netherlands provided figures in kg/yr for each of the main sources e.g. waste disposal and key associated sub-sources such as waste incineration (Table 4.1).
Reporting methods involving total pollutant loads for all contributing sources of heavy metals were used by countries such as France (heavy metals to air and water) and the UK (heavy metals to air). For example France reported a total pollutant load for all sources of copper emitted to air and water. No information was provided on source and sub-source profiles making it impossible to determine if all of the key sources and pathways were considered in the overall result (Table 4.1).
Reporting using reduction percentages for hazardous substances is the least informative as it contains no information on contributing pathways and entry routes. Examples of this method were shown by Germany (heavy metals to air) who reported only a percentage reduction for individual substances released to air over the period 1985-1999/2000, whilst Sweden used this method for reporting in relation to water (see Table 4.1).
Some of the countries utilised a combination of the approaches discussed above, depending on factors such as availability of data, when reporting on hazardous substances within this category.
20
An Evaluation of Approaches for Monitoring Emerging Hazardous Substances
Organic Substances
Organic substances required to be reported on for implementation of the HARP-HAZ prototype were:
pentachlorophenol;
hexachlorobutadiene;
chloroform;
trichloroethylene;
PAH;
hexachlorobenzene;
carbontetrachloride;
tbt-compounds;
tetrachloroethylene;
dichloroethane, 1,2; and
dioxins.
The majority of NSS used the SOA1 for reporting on organic substance emissions to air and water with the exception of the UK who applied the LOA1 and LOA2 when reporting on contributions of organic substances to water.
Norway and the Netherlands were the only NSS that reported quantitative data for each of the main sources and sub-sources of organic substances to air and water. For example when reporting on carbon tetrachloride emitted to air in 1999 Norway provided figures in kg/yr for each of the main sources e.g. small and medium enterprises as well as sub-sources e.g. laboratories.
Denmark was the only NSS that reported on the main sources for a number of organic substances emitted to air and water whilst Sweden reported on the main entry routes of organic substances to air and water using this approach.
Reporting methods for organic substances involving total pollutant loads for all sources were used by some NSS e.g. Belgium, Switzerland and France. For example Belgium reported a total pollutant load for air and water (kg/yr) was reported for carbon tetrachloride. No information was provided on source and sub-source profiles making it difficult to determine if all of the key sources and pathways were considered in the overall result.
Percentage reductions, an approach which does not provide quantitative data for major sources / entry routes were reported by Germany and the UK for emissions of organic hazardous substances to air and water (Table 4.1).
21
An Evaluation of Approaches for Monitoring Emerging Hazardous Substances
Pesticides
The HARP-HAZ protocol does not require reporting on atmospheric emissions for pesticides. Therefore, no reporting by NSS of the emissions and losses of pesticides to air was undertaken. Pesticides required to be reported on for emissions to water include:
drins;
hch;
ddt;
trifluralin;
endosulfan;
simazine;
atrazine;
azinphos-ethyl;
azinphos-methyl;
fenitrothion;
fenthion;
parathion;
parathion-methyl; and
dichlorvos.
All Member States, with the exception of the Netherlands and the UK, reported discharges and losses of pesticides to water using various forms of SOA2. Countries such as France, Belgium and Sweden reported using sales statistics for all in this category (Table 4.1).
The majority of NSS used SOA2 to report on pesticides due to minimal availability of accurate quantitative source data. Only the Netherlands applied quantitative data to each of the sources and sub-sources for pesticides. However, some substances such as DDT and Fenitrothion were not reported on due to substance phase out or product bans.
Other countries such as Norway and Denmark reported using SOA2, in combination with SOA1. In this case more quantitative data was available for some of the substances within this category as opposed to others (see Table 4.1).
The UK was the only country to report on pesticides using the LOA1/ LOA2 for the main entry routes. Although minimal quantitative information was provided in relation to the main sources and results were presented primarily in the form of a reduction percentage.
22

An Evaluation of Approaches for Monitoring Emerging Hazardous Substances
4.4.2 Factors affecting transparency and comparability of results
Conformity with the HARP-HAZ protocol requires reporting on the major pathways and entry routes of hazardous substances to air and water for each of the categories described in Section 4.2. Only two countries, the Netherlands and Norway (and to a lesser extent Denmark) were able to report in detail on sources and sub-sources, achieving compliance with reporting requirements. It should be noted that although the UK did not report data on sources, the LOA inherently takes account of all sources. All other Member States adopted variable approaches in reporting reductions in heavy metals, organics and pesticides as outlined in Section 4.2 (North Sea Secretariat, 2002k).
Factors effecting transparency and comparability lie within the approaches adopted by NSS for reporting on hazardous substances. These are likely to include:
The reporting selected approach;
Calculation methods;
Period for which the data was reported; and
Data availability.
In terms of transparency, some NSS provided sufficient detail of the major sources and sub-sources of hazardous substance emissions, while others only provided the major sources. Comparability of the data reported by NSS was superficially good in that all countries reported a reduction percentage for hazardous substances emitted. However in order for results to be transparent a reduction percentage must be accompanied by data for the major sources and sub-sources for a particular substance. Only a small number of NSS were able to provide this information which minimised the comparability between NSS reporting approaches.
The Netherlands and Norway achieved a high level of transparency, reporting on all major contributing sources and sub-sources of hazardous substance emissions. For the remaining NSS, the transparency in data reported was relatively poor. Some countries such as Belgium achieved minimal transparency by reporting on the major entry routes to air and water for hazardous substances whilst other countries such as France did not provide information on the major contributing pathways, with only a total load figure reported for the years 1985 and 1999.
In reporting reductions of hazardous substances the UK appear to have only used LOA1. LOA2 involving quantification of direct discharges is stated within the Compilation of Submitted Inputs as being used but there is no evidence that this is the case. Therefore, only reduction percentages have been reported. It is impossible to identify trends in terms of source apportionment for a particular hazardous substance.
According to the progress report “different calculation methods were employed by NSS for reporting on hazardous substances to air and water, with each figure reported often consisting of different quantifications”. The majority of NSS did not provide information on how sources were identified and inputs from these various sources calculated. Where calculation methods were specified it was evident that different methods were used amongst different countries. An example of this is highlighted by France and Germany, who reported total nickel loads from sewage treatment plants using different
23

An Evaluation of Approaches for Monitoring Emerging Hazardous Substances
methods, France using a quantitative approach while Germany’s approach involved calculating backwards for 1985 data by using 1995 concentrations of nickel in sewage sludge.
Data sets for the year 1985 tend to be less transparent than data sets for the years 1999/2000. Belgium, when reporting on heavy metals to air and water provided only a total figure for all sources for 1985 whilst a profile of the main contributing sources was provided for 1999 data (Table 4.1). Further problems relating to transparency have arisen when some countries such as Norway have attempted to improve 1985 data by estimating it from more recent years. In some cases it was assumed that the ratio between 1990 data and 1985 data was 1:1. However, no information as to why and how extrapolation occurred has been provided in the compilation of submitted inputs.
Limitations in data sets in terms of availability and suitability as well as reporting approaches adopted have limited the scope comparing reporting approaches between NSS. This is reinforced by the 5th North Sea Conference report, which states that these discrepancies “limit a further comparative analysis and make it impossible to establish general, reliable trends in the discharges and emissions from specific primary sources”(North Sea Secreatariat, 2001).
The limitations to the extrapolation of data, as identified above, significantly impede the ability to make a comparison of data sets between NSS. A comparison between actual 1985 (e.g. Belgium, PAH to water) source data and estimated 1985 source data using data from the year 1990 (e.g. the Netherlands, PAH to water) will therefore be limited. Belgium has reported on the required 14/15 year period whilst the Netherlands have only reported over a period of 9 years. The variability in the approaches implemented by these countries will limit the accuracy and usefulness of results obtained from such a comparison.
Problems relating to comparability also arise when considering the accuracy and availability of data. This is highlighted by Norway and the Netherlands because although these counties achieved relatively good transparency in their reporting, the approaches for reporting some hazardous substances varied. For example when reporting pesticides Norway utilised a more qualitative approach (SOA2) whilst the Netherlands used a more quantitative approach (SOA1). The limitations of sales statistics effects the comparability of data between Norway and the Netherlands, in that the Netherlands has reported quantitatively on actual data obtained from the source/sub-source, whilst Norway reported using a more qualitative approach due to insufficient monitoring data.
Another factor limiting the scope for comparing percentage reduction results reported by NSS is the identification of sources. It is not possible to compare percentage reductions between countries that reported only on industrial sources and countries that reported on industrial and diffuse sources. Furthermore comparisons are unable to be made between countries that included all major sources and sub-sources for a particular pollutant and those countries which only reported a total pollutant load.
4.4.3 Data Availability
A general lack of data for the reference year 1985 was apparent in relation to some hazardous substances. Data availability for the reference year 1999/2000 tended to be more accurate and reliable. For example Norway when reporting on organic compounds estimated the 1985 data sets for dioxins and PAHs emitted to air. This is likely to be the
24

An Evaluation of Approaches for Monitoring Emerging Hazardous Substances
result of significant improvements in monitoring, knowledge regarding emission factors and source apportionment over the reference period. In addition estimations were undertaken for some sources as more reliable data became available regarding source patterns around the year 1990. An example of this is provided by Norway where data was extrapolated from the year 1991 to 1985 for the emission of organic substance chloroform to water from small and medium enterprises.
The compilation of submitted inputs suggests a lack of national release data within some Member States. Some countries such as the Netherlands were able to acquire all of the required data for reporting on source and sub-source for heavy metals, Nickel and Zinc whilst others such as Belgium only reported a total pollutant load for these hazardous substances to air and water (see Table 4.1) (North Sea Secretariat 2002n).
Another problem associated with data availability is the fact that it is very time-consuming and sometimes not feasible to obtain and adjust the large number of required release data. An example of this involves incorporating the EEA CO-ordination of Information on AIR emissions (CORINAIR) Programme into the HARP-HAZ reporting system (Progress Report, 2002).
4.4.4 Data suitability
The suitability of data for reporting reductions of hazardous substances to air and water varies between Member States. The majority of NSSs used sales statistics in order to report on pesticides with the UK and the Netherlands being the only countries which reported on pesticides using quantitative approaches.
In estimating the amount of hazardous substances transmitted to the North Sea environment it is important to take into account diffuse pollution. Some NSS chose not to report diffuse sources of substances, which is likely to undermine data accuracy and the amount of a substance actually present within the environment. For example Germany considered groundwater to be a significant diffuse source of nickel whereas Sweden did not report on any diffuse pathways for nickel. By not taking into account diffuse sources of hazardous substances it is likely that reduction targets will be more easily achieved but these reductions are unlikely to portray a realistic picture of what is actually emitted, discharged and lost to the North Sea.
The utilisation of Nomenclature for Sources of Emission (NOSE) codes by Norway, the Netherlands and Denmark has enabled them to report more accurately in relation to individual sources contributing hazardous substances to air and water. All other NSS are expected to implement the use of NOSE codes by 2002/2003.
Data suitability is also likely to be compromised when considering the self-reporting style approach adopted by industry. There appears to be a high degree of variability in the calculation methods utilised for reporting heavy metals to air and water from the source and sub-source by industries providing information on emissions and discharges (Compilation of submitted inputs, 1999).
25

An Evaluation of Approaches for Monitoring Emerging Hazardous Substances
5. TASK 3 – EVALUATION OF HARP-HAZ: PART B NORWAY AND THE NETHERLANDS
Norway and the Netherlands have most closely adhered to the guidance provided by the HARP-HAZ prototype. As a result they have been able to achieve relatively good transparency and comparability in their results for reporting on hazardous substance emissions to air and water.
The following sections provide detailed information on the use of the SOA by Norway and the Netherlands. Each section provides an evaluation of the following:
How the approach has been applied;
What infrastructure is required to implement the approach;
The advantages and difficulties encountered in implementing the approach; and,
Cost effectiveness of the approach.
5.1 Evaluation of reporting approaches - Norway
Norway used SOA1 to report on substance emissions to air and water for most organic substances not considered as pesticides and heavy metals. For pesticides and a small number of organic substances Norway mainly used SOA2 involving use of sales statistics. NOSE codes are used to quantify measured data from source / sub-source. Norway reported data for both the major sources and sub-sources of all categories of hazardous substances.
Under OSPAR-RID Norway is required to report using the load approach for a number of hazardous substances. Norway believe that although this approach may provide useful information on the total amount of a pollutant found within the North Sea there are significant difficulties involved in source apportionment and data accuracy due to the nature of the method.
5.1.1 Source Identification
The REP-HAZ manual identifies each of the major sources and sub-sources for 13 substances contained within one of the three categories capable of contributing hazardous substances to the marine environment via the pathways of air and water. Each source is assigned a contribution factor i.e. major, medium or minor in terms of the capacity of a particular source / sub-source to discharge substances to water or emit them to air.
In some cases however, sources outlined as being major contributor’s of hazardous substances to air and water were not taken into account as they were considered to be insignificant or non-existent in Norway. It can be assumed from this the significance of contributory sources is likely to vary between Member Sates.
Norway obtains its data from four source areas as follows:
26

An Evaluation of Approaches for Monitoring Emerging Hazardous Substances
1. industry;
2. diffuse sources including product use;
3. municipal wastewater treatment plants; and
4. air emissions.
1. Industry
Norway relies on a self-reporting system for industry where installations are required to report data annually in permits. Currently there is approximately 1000 individual installations characterised as the major polluters regulated through discharge permits. This self-reporting system was introduced in 1988 but did not generate useful data until 1992/1993. At this point it was considered that total emission data could be used and not just individual entities. Initially installations were required to report only on key priority substances contained within their permits. However, this was amended later to ensure that installations reported on all priority hazardous substances. A key driver in this process was the North Sea Conference priority hazardous substance list requiring reporting on 37 substances. This development enabled a host of additional industries to be included in the reporting process increasing the accuracy of reporting when considering substances such as PAH. Although data obtained from this source is continually increasing to encompass additional industries a large proportion of this data only accounts for a small proportion of total emissions for industry.
Small-scale industries such as repair shops, gasoline stations, dry cleaning etc are not regulated by discharge permits. As a result discharges to water are to a large extent included in the estimates from municipal wastewater (HARP-HAZ Secretariat,1998).
2. Diffuse sources including product use
The emissions of hazardous substances from diffuse sources are estimated on the basis of annual consumption and the average content of certain pollutants contained within specific products. In determining products including pesticide loads, estimates are made in terms of the annual consumption. The sale of products containing hazardous substances is calculated on the basis of questionnaires and statistics obtained from Norway’s Product Register and Statistics Norway. Therefore, qualitative evaluations must be made to determine inputs to air and water (HARP-HAZ Secretariat, 1998).
Material flow analysis is primarily used to identify users and emissions of hazardous substances from product and diffuse sources. This type of analysis seeks to locate significant sources of hazardous substances as well as the levels used. Information is obtained from a variety of sources such as product registers, which contain information regarding annual data volumes. Use patterns and potential emission levels are also generated through direct contact with major producers, importers and user categories. In addition, literature containing information on estimates/factors of emission for some products is also utilised. Other factors such as substance properties, waste treatment practices, cleaning systems etc are also consulted. The final result involves the provision of estimate release factors for substances to air, water and soil.
27

An Evaluation of Approaches for Monitoring Emerging Hazardous Substances
3. UWWTPs
The reporting of hazardous substances arising from urban waste water treatment plant sources involves consideration of the emissions and discharges of waste incinerators, sewage, sludge and landfills in relation to micro-pollutants. Smaller industry discharges tend to be included in this category as well. Monitoring takes place at the point of discharge, although only the larger plants are self-monitored with monitoring of sludge also being carried out at a number of these plants (system not currently in place to account for emissions of substances from sludge).
Smaller UWWTPs emissions are estimated from mean emissions concentrations obtained from larger plants combined total mean flow through all treatment plants i.e. all plants are required to report flow through their cleaning systems.
4. Air emissions
To identify key sources of hazardous substances to air Norway uses an air emission model. The model is also used to report air emissions to the UN-ECE (United Nations Convention for Long-Range Transport). This model now contains emissions data for Pb, Cd, Hg, PAH and dioxins and will be expanded in the future to include Cu, Cr and As. Statistics Norway utilise activity and emission data to predict sources and sub-sources for hazardous substances emitted to air. This model incorporates point source emission data from INKOSYS, data from various official statistics including production and import statistics as well as activity data and processed data obtained from the product register and material flow analysis.
For some sources such as large installations actual data provided by the Norweigan Pollution Control Authority (NPCA) is used where as the model tends to be utilised to predict emissions for small and medium enterprises, households and the energy/transport sector. For example Norway’s’ households are key contributors of heavy metals and POPs to air as large amounts of wood are used for heating in Norway over winter.
5.1.2 Infrastructure Requirements
For the purpose of this report infrastructure is defined as key institutions responsible for generating data used for reporting emissions of hazardous substances. There are three important resources within these institutions influencing the overall effectiveness of the approach include:
People;
Databases and models; and
Monitoring.
Norway has five institutions that contain essential infrastructure for reporting on emissions of priority hazardous substances. Significant volumes of data must be collected through a variety of channels that cover all of the relevant sources and associated sub-sources. The roles that these institutions play in the reporting process is outlined in Figure 5.1 and Table 5.1 and described in detail below:
28

An Evaluation of Approaches for Monitoring Emerging Hazardous Substances
(NPCA);
Local Authorities;
Product register (PR);
Statistics Norway (SSB); and
Norwegian Agricultural Inspection Service (NAIS).
NPCA
The NPCA is a sub-ordinate to the Ministry of Environment and its internal control system oversees and collates data reported by large installations in relation to their discharge permits. The NPCA is also responsible for providing reduction percentage figures for hazardous substances to OSPAR as well as undertaking one-off material flow analysis’ with inputs from SSB.
Quality control in relation to data reported from industry is undertaken by pollution control officers and represents a key element in reporting on emissions of hazardous substances. There are approximately 15-20 officers in the central authority who are responsible for comparing data reported with previous years and similar industries to identify any potential inconsistencies. Each officer is required to screen figures reported for between 10 and 30 individual installations.
Maintenance of relevant databases used for reporting on a host of different conventions requires an administrative assistant as well as a technical input consultant. An additional consultant is also required to undertake an annual update of material flow analysis.
The NPCA maintains a database called INKOSYS which has been in operation since 1978 and holds an overview of all self-reported industrial point source data collected in Norway. This database is a crucial element in the reporting process as it feeds the smaller databases and models required for reporting percentage reductions for substances from the sources described in Section 5.1.1.
A smaller database called MUNIN is used for reporting to the North Sea Commission but only a small percentage of this data is actually reported to the North Sea Commission. MUNIN contains large amounts of additional information such as environmental monitoring data. Industry emission data is automatically transferred daily to the MUNIN database from INKONSYS. Product and diffuse source and sewage treatment plant data are also transferred into MUNIN but the type of input varies. Data for substances upgraded from material flow analysis must be input manually whereas air emission source data that has been manipulated by SSB is entered manually into MUNIN on an annual basis.
The NPCA is also responsible for implementation of the governmental monitoring programme for air and water quality and therefore undertakes environmental monitoring. For example in accordance with OSPAR-RID requirements, industry carry out monitoring for hazardous substances and data is reported to either NPCA or local authorities. Monitoring is also undertaken at some of the major point sources, particularly at those locations where discharges into environmentally sensitive areas such as fjords take place.
29

An Evaluation of Approaches for Monitoring Emerging Hazardous Substances
Local Authorities
The importance of local authorities in relation to data collation and assessment is rapidly increasing in Norway. There are 18 local authorities in Norway which are directly responsible for entering all point source data into the INKOSYS database. It is anticipated that local authorities will eventually be responsible for approximately 50% of industrial permit maintenance.
Pollution control officers collate data reported from industry and ensure that there are no significant discrepancies in the data which is reported. This data is not required to be transferred as the database is accessible to local and central authorities.
Local authorities do not undertake monitoring, as specific installations are required to monitor for priority hazardous substances.
Product Register
The product register was established in 1981 and falls under the Ministry of the Environment. It is a central register of substances and chemical products and represents a key link in the HARP-HAZ reporting process. The register holds information on approximately 25000 chemical products as well as information on companies responsible for producing, importing or exporting products containing hazardous substances, product names, contents in terms of chemical breakdown and the net volume of product currently circulated i.e. difference between that which is imported and exported.
Statistics Norway
SSB is primarily responsible for collating and reporting data for emissions to air as well as assisting NPCA in undertaking material flow analysis (see Figure 5.1).
SSB employs approximately three staff members / year who are responsible for transferring data from industry (via the INKOSYS database) as well as diffuse sources into an air emission model. However, these staff members are also involved in reporting in relation to additional conventions so a breakdown can not be provided in terms of their contributions to the HARP-HAZ reporting process.
The long-range air emission transport model is used to identify key sources / sub-sources of emissions to air. This model is primarily used for sources such as small and medium enterprises, households and the energy/transport sector.
SSB is not responsible for direct environmental monitoring, and data is obtained from the NPCA and other key sources. A reciprocal agreement exists between both organisations allowing free flow of data between them.
NAIS
The NAIS is a sub-ordinate agency of the Ministry of Agriculture. The importance of this organisation in the reporting process lies in its long connection with sales and tax. NAIS is responsible for provisions of sales statistics mainly for pesticides, which are manually input into the MUNIN database.
30
An Evaluation of Approaches for Monitoring Emerging Hazardous Substances
Figure 5.1 Key organisations and data flows for reporting percentage reductions for hazardous substances
OSPAR
Statistics NorwayMaintain and operate air emission model data
Small and Medium Industries
Monitor emissions of all hazardous substances
Report data to Local Authorities
NPCA (central authority)
Maintain databases QA data from large industriesEstimate emissions from product use using product register and material flow analysis
INKOSYS (Database containing information on all reported data)
MUNIN (Database for reporting reductions in hazardous substances)
Bas
ic d
ata
colle
ctin
g sy
stem
Emission factors estimated using Material Flow Analysis by NPCA
Losses estimated using Air emission model by SSB
Energy / Transport
Report data on:Fuel consumptionBitumen consumptionTyre import and exportVehicle import
Local AuthoritiesQA emissions data from small and
medium industry
Large IndustriesMonitor emissions of all hazardous substances Report data to NCPA
Urban Waste Water Treatment PlantsMonitor emissions of all hazardous substancesReport data to NCPA
Producers and ImportersComplete questionnaires on
product use.
Ministry of the Environment
Maintain product register
Dat
a co
llatio
n an
d co
llatio
nIn
tern
atio
nal
Rep
ortin
g
Product RegisterAgricultural Inspection ServicePesticide data input
31

An Evaluation of Approaches for Monitoring Emerging Hazardous Substances
Table 5.1 Summary of Hazardous Substance data collection, collation, and reporting activities in Norway
Source Data
Industry UWWTPs Products Energy/ Transport
Raw Data collectedEmission data for all HS (not just those in permits)
Emission/ concentration data for some HS
Sales and content of HS
Engine fuel consumption, consumption of bitumen, import and export of tyres, production of vehicles
Method Measurements and estimation Monitoring and estimation
Reporting and Questionnaires
Statistic reports (production, import
By whom Industry MWWTPs Producers/importers
Reported to major industry to NPCA
smaller industry via Local Authorities to NPCA
NPCA/local authorities
Product register and NPCA (Consultant)
Statistics Norway
How often yearly Yearly Yearly yearly yearly
What format Letter/electronically Letter/electronically
Letter/electronically
QA Checked Vs previous years data and for similar industries for anomalies
Checked Vs previous years data N/A
Yes by Product register, consultant and NPCA
yes
By whom 15-20 officers in NPCA
Pollution Control Officers in Local Authorities
Checked by Product register
Statistics Norway
Data collation/treatment
Calculation Material Flow Analysis and yearly updating
Air Emission Modelling
Other data used in treatment
Statistical information on UWWTP
Literature on material behaviour
Emission factors
By whom NCPA NCPA SSB NPCA (Consultants)
Statistics Norway – (internal database and model)
Databases INKOSYS MUNIN
Maintained by NPCA - MUNIN also extracts data from INKOSYS relevant for aggregation of total emission of HS
32

An Evaluation of Approaches for Monitoring Emerging Hazardous Substances
5.1.3 Advantages associated with approach
The advantages of Norway’s use of the SOA are largely highlighted by the limitations of the LOA. Although the SOA sometimes presents a worse case scenario (e.g. assimilative capacity of environment is not taken into account) it still provides a more accurate picture of key sources contributing hazardous substances to the environment. Therefore if reduction targets are not met for a particular hazardous substance, measures can be formulated by focussing on the key contributory sources and as a result authorities are able to identify and prioritise important sources in terms of reducing emissions. As a result the SOA is useful in the generation of exposure / risk assessments particularly for hazardous chemicals.
Although Norway does monitor loads for substances prescribed under OSPAR-RID it feels that the approach has more limitations than SOA with regard to source apportionment and accuracy of data. As previously stated the LOA is transparent in that all sources contributing hazardous substances to the environment are taken into account but with no measurement or quantification at the source it is difficult to obtain a representation of the key sources. For example it is not possible to accurately apportion mercury loads entering the North Sea between industrial and agricultural sources.
According to Christian Dons of the NPCA another key advantage of the SOA is that it is less dependent on natural events such as precipitation. For example, when monitoring pesticides Norway found that it was unable to obtain accurate data from its major river systems as loads were generated by multiplying small concentrations of pesticide at or near below the limit of detection with large flows. Norway does have an environmental monitoring system in place to collect data for pesticides but this occurs primarily in small streams in agricultural areas which are not indicative of the countries major river systems.
Another advantage of the SOA is evident when comparing the LOA and SOA for monitoring emissions of mercury to water in the year 1999. Source figures for this year were approximately 200kg whilst loads were approximately 1500kg (see Figure 5.2). This discrepancy was due to an abnormal flooding event in autumn resulting in larger than expected loads for substances in the riverine input data. Therefore the SOA is less influenced by natural noise as opposed to data obtained from environmental monitoring. But the LOA is more representative of what is actually happening in the environment so a combination of both approaches should still be used.
Preferential adoption of the SOA as opposed to the LOA arises from the fact that installations, which contribute hazardous substances to the environment must bear the cost of reporting. As a result resources can be focussed on estimating emissions of hazardous substances from diffuse sources. Core data necessary for the SOA has been part of industry permits for many years.
The SOA is not influenced by long range transboundary issues. This is the case especially for water where it is likely that riverine input data will contain a small proportion of substances originating from other countries.
33

An Evaluation of Approaches for Monitoring Emerging Hazardous Substances
0500
10001500200025003000
Kg
1990
1992
1994
1996
1998
2000
Year
Riverine Input Data obtained via LOA for Mercury in Norway
Figure 5.2 LOA Vs SOA for monitoring Mercury emissions to water in Norway
Mercury Emissions to Water Obtained from SOA for Mercury in Norway
0200400600800
1000
1994 1995 1996 1997 1998 1999 2000
Year
Kg
34

An Evaluation of Approaches for Monitoring Emerging Hazardous Substances
5.1.4 Difficulties encountered
Norway encountered problems of data availability when attempting to monitor over the 14/15-year time period set out by the HARP-HAZ protocol, which resulted in significant data gaps existed for some substances due to insufficient monitoring for the baseline year and knowledge of source patterns. Therefore, extrapolation was undertaken using data from more recent years. For example when reporting on chloroform emitted to water from laboratories (sub-source of Small and Medium Enterprises) estimates were made for 1985 using 1991 data. This was undertaken by calculating backwards using information on production volume, production facility etc. Where this information was not available it was assumed that 1990 data was on a 1:1 ratio with 1985 data. Such an assumption indicates that there will be problems with transparency as 1990 data is unlikely to be equivalent to 1985 data.
Other problems regarding data quality are likely to include a lack of availability of data for hazardous substances leaching from industrial and municipal waste landfill sites i.e. this is likely to be an important source currently not accounted for (quantified) in Norway’s reporting process. UWWTP data is also very poor and in terms of actual monitoring only 5 or 6 wastewater treatment plants regularly monitor emissions but not all of the 37 priority substances are monitored. As a result variability in data from this source is high with regard to quality and completeness and total estimates are poor with errors of +/- 50%.
Problems were incurred when apportioning emissions between different contributory sources. In some cases, a particular type of industry may overlap source divisions. For example, when considering the industrial source as well as its sub-sources a factory that produces paper may also be responsible for burning waste material. Therefore, a particular installation could be considered within the pulp and paper category whilst also contributing hazardous substances to the waste/disposal category. Thus when attempting to formulate OSPAR action measures difficulties can emerge when identifying key sub-sources requiring priority action measures.
Another major difficulty encountered in source reporting is the accuracy of self-reporting from industry. Each discharge/emission permit specifies maximum emission limits (e.g. mg/day) that installations must comply with. Installations must also report on their total annual emissions. However, no methodology has been harmonised/standardised for reporting this figure in Norway. As a result quality control is highly variable. For example, some installations monitor only a few times per year for specific hazardous substances, whilst some monitor on a monthly basis. Therefore figures reported have varying degrees of uncertainty which can range in magnitude from +/- 10% to +/- 30%. Best Available Technique (BAT) measures implemented in the future under the Integrated Pollution Prevention Control (IPPC) directive may improve this situation.
Double counting was another difficulty encountered when utilising the SOA with sources such as wastewater treatment plants likely to report on data that has already been included in the product and diffuse source category. For example Mercury from dentistry practices was previously discharged directly into sewerage systems but practices are now required to install cleaning systems which are still not 100 per cent efficient in terms of mercury removal. Therefore, although product information and activity rates are used to calculate the amount of mercury entering WWTPs from this source it is likely that data from mercury obtained directly from sewage treatment plants will also contain mercury from dentistry practices.
35
An Evaluation of Approaches for Monitoring Emerging Hazardous Substances
5.1.5 Cost Effectiveness of the Approach
Norway utilises the SOA for reporting under a wide range of international conventions, protocols and contexts some of which include the Arhus Convention, OSPAR –RID, European Pollution Emission Register (EPER), OECD and the Convention on Long range Transboundary Air Pollution (ECE-LRTAP). Therefore it is very cost-effective as data generated from the SOA is multi-functionable because of the wide variety of purposes for which data is used. Hence it is difficult to apportion costs.
Approximately two months was required to extract data from the MUNIN database into the HARP-HAZ database. Data extrapolation for the 1985 baseline year accounted for at-least half of this time. However, it should be noted that this is a one-off cost. The other major element of this stage involves categorising codes between the databases with each source having to be entered individually.
The self-reporting nature of industry is very cost-effective in that industry bears the burden of the costs in terms of data collection. In terms of maintaining the data collected from industry an administrative maintenance person is required equivalent to 1 man / year. A technical input consultant is also required representing an equivalent of 0.5 man/year.
A large proportion of the costs in terms of data reported from industry arises in the area of quality control. Pollution control officers are required to screen permits and data to ensure that reporting has been undertaken correctly. It is estimated 15-20 executive pollution control officers are required for one month each year to oversee data reported from industry prior to being entered into the database.
The major cost associated with product and diffuse sources results from an annual update of data for all substances in regards to data presented through material flow analysis. This is undertaken by an independent consultant at a cost of €28 600-€42 900. Norway is currently developing methodology for its material flow analysis. It is anticipated that this will enable a simplified yearly updating procedure to take place for all relevant hazardous substances emitted from product and diffuse sources. This information will then be used in an annual project to enable data to be updated for priority hazardous substances where product/chemical use is considered important.
Norway estimates that approximately 1-man month / year is required for co-ordinating the data between the separate databases that is in turn input into the air/emission model. SSB estimates that approximately 2 - 3 people / year are required to maintain and run the air emission model but this model is also used for reporting on long range transport to the EC.
5.1.6 Future Developments
At present there is a move towards developing and improving models utilising product use registers and statistics to enable hazardous substance sources to be prioritised and identified. Therefore incorporating additional smaller levels of industry in terms of reporting quantitative data is unlikely to occur as it is considered that the benefits would not outweigh the costs. Norway believes that contributions from this category are insignificant in regards to the larger installations.
36

An Evaluation of Approaches for Monitoring Emerging Hazardous Substances
Norway recognises that significant differences currently exist in reporting approaches. At present there is greater harmonisation in reporting on hazardous substances emitted to air. Therefore, Norway is aware that more research in relation to reporting hazardous substances to water is required in order to close the gap and increase standardisation.
The NPCA currently controls approximately 80 per cent of all installations at a central level and 20 per cent are controlled by local authorities. In the future it is anticipated that this division will place more of an emphasis on the role of local authorities such that installations under their control will increase to 50 per cent. This emphasis is aimed at providing local authorities with more power to address local problems in relation to small and medium industry with the central authority concentrating on control of the large installations. However, this is likely to have impacts on the quality of data reported as local authorities priorities may differ between regions.
5.2 Evaluation of Reporting Approaches - The Netherlands
The Netherlands used SOA1 for reporting reductions in emissions of heavy metals and organic substances and was the only country that reported using SOA1 for all substances within the pesticide category (Table 4.1).
The Netherlands reported data for both the major sources and sub-sources of all categories of hazardous substances. NOSE codes are used to quantify measured data from source / sub-source.
Under OSPAR-RID the Netherlands is required to report using the LOA for approximately twelve hazardous substances. The Netherlands geographical location as a downstream nation results in it monitoring for at least 40 hazardous substances, particularly in its largest rivers such as the Meuse and the Rhine. Therefore a combination of the SOA and LOA enables the Netherlands to derive a more accurate picture of hazardous substances produced domestically versus those entering from other countries.
5.2.1 Source Identification
The Netherlands focuses on the following two source pathways when reporting on emissions of hazardous substances to air and water:
large point sources- emission data for most pollutants reported in annual environmental reports for large installations; and
non–large point sources (small and diffuse sources)- emission data for sources calculated by applying statistical information about activity rates of different activities. Estimations of emissions are undertaken by multiplying activity rates with emission factors.
The pathways identified above can be further subdivided into major sources of hazardous substances through designation of target groups. Each target group is assigned reduction goals to be achieved over the upcoming years. Key source categories/ target groups include:
1. Industry;
37

An Evaluation of Approaches for Monitoring Emerging Hazardous Substances
2. Waste disposal;
3. Agriculture; and
4. Households.
1. Industry
The Netherlands, like Norway, relies on a self-reporting system for industry where large installations are required to report data annually. The Netherlands 2100 largest companies are treated as point sources. Only 320 of these companies that are classified as the most significant polluters are obliged to report annual emissions to air and water in a report to the national government. These reports contain data for all relevant substance emissions and discharges. This data is quality assessed by the local authorities who maintain extensive measuring programs and by the National Institute for Water Management and Wastewater Treatment (RIZA).
Emissions from small and medium enterprises are either estimated directly from known emissions for major point sources using information such as activity rates or included in the estimates from wastewater treatment plants (Van der Most, 1999).
2. Waste Disposal
The reporting of hazardous substances arising from waste disposal includes emissions from WWTPs, waste incinerators, sewage, sludge and landfills. Urban WWTPs are treated as point sources as quantitative monitoring for individual substances is undertaken directly at the source. To assist in these calculations the Pollution Emission Register (PER) contains a register of sewerage system areas and their connections to WWTPs. Waste burning plants are treated as point sources as emissions are measured at the stack. Landfill emissions are calculated using data from a yearly statistic, which contains information related to the type of emission waste and emission abatement techniques used (Van der Most, 1999).
3 Traffic
Traffic is considered as a line source as well as a non-point source. Traffic intensities for the main roads are measured on a regular basis with locations of roads housed within the PER in a digitized format and emissions calculated from using emission factors such as per car/km. All other emissions are calculated using more qualitative techniques including fuel statistics, population density and expert judgement.
4. Agr i culture
Agriculture represents probably the most significant diffuse source of emissions of hazardous substances in the Netherlands. The major sources of pollution from agriculture are pesticide use and excess manure production. In estimating pesticides emissions a model is used that involves incorporating real use data (i.e. import / export information) and this is in turn entered into a hydrological model that predicts emissions
38

An Evaluation of Approaches for Monitoring Emerging Hazardous Substances
to air and water. This data is not incorporated into the overall emission register, but is maintained separately.
Diffuse sources of nitrates and phosphates are estimated using an additional model. Factors such as emission factors, literature etc are consulted in order to predict final values.
5. Households
Household addresses are located on a national grid with an indication of the number of inhabitants per address. This is important for quantifying emissions which are related to population density (e.g. use of solvents).
5.2.2 Infrastructure Requirements
The most essential element of infrastructure for reporting emissions to OSPAR is the PER. Data on emissions to air and discharges to water of hazardous substances are stored within this central database. According to CONSSO this Emission Inventory System (EIS) “comprises the registration, analysis, localisation and presentation of emission data from both industrial and non-industrial sources”. This inventory monitors annual emissions/discharges of all sources contributing hazardous substances to air and water and disseminates emission data to the public and for pollution modelling purposes with data being updated annually.
The structure of the PER has three important dimensions including substances, sources and locations. Substances taken into account are derived from environmental problems as well as international obligations whilst the selection of sources is directly related to the prioritising of the substances.
The monitoring system of the PER contains two interconnected information systems:
an individual system (IEI) – contains emissions to air, water and soil for large industrial point sources; and
a collective system (CEI) – geographical information system containing spatial resolved emission data and information on waste flows. This system includes data from industrial and non-industrial sources.
Three ministries house the necessary institutions for maintenance and development of the PER. Supporting institutions contained within each of these ministries have the necessary infrastructure including people, monitoring and databases to report on emissions of hazardous substances. The relationship between the three key ministries and their supporting institutions is summarised in Figure 5.3 and outlined below:
(1) Ministry of Housing, Spatial Planning and the Environment (VROM / HIMH).
Inspectorate for Environmental Protection (IMH);
Central Bureau of Statistics (CBS); and
National Institute for Public Health and the Environment (RIVM).
39
An Evaluation of Approaches for Monitoring Emerging Hazardous Substances
(2) Ministry of Transport, Public Works and Water Management (V&W).
National Institute of Water Management and Wastewater Treatment (RIZA); and
Organisation for Applied Scientific Research (TNO).
(3) Ministry of Agriculture, Nature Conservation and Fishery (LNV).
Expert’s Centre of Agriculture, Nature Conservation and Fishery (EC-LNV).
The role of these six institutions in terms of contributions of infrastructure to the reporting process (people, databases and models) is discussed below:
Inspectorate for Environmental Protection (IMH)
IMH is a sub-ordinate of the Ministry for Housing Spatial Planning and the Environment. The major responsibility of this institution is the overall management and co-ordination of data with respect to the PER. IMH makes appointments with all suppliers of pollution source information and gathers the required data. In close co-operation with the competent authorities IMH also handles the emissions data in such a way that presentation on different levels of aggregation is possible to fulfil the requirements of the stakeholders or other users (Van der Most, 1999).
Central Bureau of Statistics -Statistics Netherlands (CBS)
CBS is a sub-ordinate of the Ministry for Housing Spatial Planning and the Environment and its major responsibilities include collection of data from WWTPS as well as maintenance and revision of national statistical information. Data obtained from WWTPs is in turn reported directly to RIZA.
National Institute for Public Health and the Environment (RIVM)
RIVM is primarily responsible for carrying out the maintenance of information systems necessary for reporting on emissions of hazardous substances. It also contributes directly to the agricultural consensus model for estimation of diffuse sources.
National Institute of Water Management and Wastewater Treatment (RIZA)
RIZA falls under the Ministry of Transport, Public Works and Water Management (V&W). RIZAs key responsibility involves collection of data on discharges to water and receives data on industrial waste loads from 30 local water boards (i.e. local waters and for 10 regional branches).
A team of 7 people is required to analyse emissions data but only three people carry out the majority of the work with respect to this emissions data. One person is required to write the report for emissions of hazardous substances to water.
40

An Evaluation of Approaches for Monitoring Emerging Hazardous Substances
RIZA maintains separate databases for industry and UWWTPs. These databases are essentially extracts from the larger PER system. This institution also contributes directly to the agricultural consensus model for estimation of diffuse sources.
RIZA monitors loads in its largest rivers (e.g. the Meuse and Rhine) for at least 40 hazardous substances. Random compliance monitoring is also undertaken as a quality control mechanism to ensure specific installations are complying with their discharge permits. Indirect monitoring is undertaken through the water boards which RIZA oversees. The water boards are responsible for quality control of the data reported from industry.
Organisation for applied scientific research (TNO)
The TNO is responsible for a large amount of the work with regard to reporting to OSPAR and is a sub-ordinate of the V&W. Key responsibilities involve collecting emission data from the large point sources and undertaking processing and publication with respect to this data. Although the TNO focuses on industry they also provide raw estimates for other sources where quantitative data is not available. The TNO also undertake facilitation between key members of the different target groups and use the data gathered to evaluate policy progress such as progression with respect to achieving reduction targets with respect to hazardous substances.
41

An Evaluation of Approaches for Monitoring Emerging Hazardous Substances
Figure 5.3 Key organisations and data flows for reporting percentage reductions for hazardous substances in the Netherlands
OSPAR
CBS
Maintain national statistical infoCollect data from UWWTPsEstimation SMEs
Small and Medium Industries
Estimated from large point sources
Data also estimated by CBS
IMH and RIVM
Maintain and manage central databases Co-ordination of activities with respect to database
CEI (collective system)IEI (individual system)
PER (Database for reporting reductions in hazardous substances)
Bas
ic d
ata
colle
ctin
g sy
stem
Air emission model
Transport:Fuel consumptionBitumen consumptionTyre import and exportVehicle production
Local WaterboardsCollect data from UWWTPsQA / monitoringPass data on to RIZA
Large IndustriesMonitor emissions of all hazardous substances Report data to TNO
Waste Disposal
Monitor emissions of all hazardous substancesReport data local waterboards
Agriculture
Mainly pesticides and nutrients
Import/export information
Dat
a co
llatio
n an
d tre
atm
ent
Inte
rnat
iona
l R
epor
ting
Agricultural consensus model
Estimation of diffuse sources
HouseholdsConsumption ratePopulation density
RIZACollect data on discharges to water
EC-LNV
Diffuse source estimation
RIVM
RIZA
42

An Evaluation of Approaches for Monitoring Emerging Hazardous Substances
Expert’s centre of agriculture, nature conservation and fishery (EC-LNV)
EC-LNV contributes directly to the agricultural consensus model for estimation of diffuse sources. This organisation also plays a key role in an additional mode which is used for the prediction of pesticide sources.
Table 5.2 Summary of Hazardous Substance data collection, collation, and reporting activities in The Netherlands
Source Data
Industry Waste Disposal Households Agriculture Traffic
Raw Data collected
Emission data for all HS (not just those in permits)
Emission data for all HS (not just those in permits)
Sales and average content of HS
Hydrological, statistical, water movement and rainfall information
Engine fuel consumption, consumption of bitumen, import and export of tyres, production of vehicles
Method Monitoring for largest point sources
Estimation for SMEs
Monitoring Literature Model – sales statistics, estimation
Activity rates etc
By whom Industry MWWTPs RIZA Various institutes
Various institutes
Reported to TNO
RIZA
Smaller industry via RIZA
Local waterboards
Statistics Netherlands
Statistics Netherlands
EC-LNV Statistics Netherlands
How often Annually Annually Annually Annually Annually Annually
What format Letter / electronically
Letter / electronically
Letter/electronically
Electronically Electronically Electronically
QA RIZA, TNO RIZA, TNO Various institutes
Various institutes
Various institutes
Various institutes
By whom As above As above As above As above As above As above
Data collation/treatment
TNO, RIVM TNO, RIVM, CBS
TNO, RIVM TNO, RIVM, TNO, RIVM, TNO, RIVM,
Other data used in treatment
By whom
Databases Pollution Emission Register
Maintained by IMH
43

An Evaluation of Approaches for Monitoring Emerging Hazardous Substances
5.2.3 Advantages of the approach
The “polluter pays principle” is inherent within the Netherlands and it is believed that the SOA ties in well with this principle, enabling contributing sources of hazardous substances to the environment to be identified. One of the major reasons for the Netherlands use of SOA is that it enables rapid identification of those target group sources e.g. households or industry primarily responsible for emissions of hazardous substances. As a result policy makers can more easily formulate reduction measures for specific sources.
The SOA incorporates qualitative elements allowing figures to be identified for sources where sufficient quantitative data is not available. This can be achieved through expert judgements, evaluation of relevant literature and estimating emissions from known sources. For example when reporting emissions of mercury to water from small and medium enterprises, loads were estimated from known production capacity for which quantitative source data was available.
The approach links very well to the Netherlands geographical spatial information system. This system maps the location of the major point sources of hazardous substances Thus the SOA enables emissions to be connected more easily to point sources when combined with the spatial information system.
The SOA is not dependent on hydrological fluctuations and is therefore more constant in time. Unlike the LOA factors such as rainfall do not distort accuracy of figures reported as the SOA is based on constant measurements of emissions at the source where monitoring may take place weekly, monthly etc.
Additional advantages for selection of the SOA as opposed to the LOA for reporting emissions arise from limitations associated with the LOA. The LOA requires greater amounts of time and money in order to produce accurate results. The LOA unlike SOA does not enable production of short-term accurate data to allow the formulation of measures for reducing emissions. Therefore when considering sources such as agriculture where reduction targets have not been achieved for specific substances it is unlikely that measures for reduction can be justified without reliable short-term data.
Preferential adoption of the SOA as opposed to LOA also arises from the complexity of the Netherlands waters, particularly for smaller river systems. Many of the countries waters are regulated and tend to flow in different directions due to the countries position in relation to sea level. This results in difficulties between linking loads with their associated sources.
5.2.4 Difficulties Encountered
The availability of data was a major difficulty when considering diffuse sources of pollution in the Netherlands. As a result sources of substances from this source were largely estimated using statistical data and best guesses in the form of expert judgement. Therefore hazardous substance data for diffuse sources stored in the PER is weak in terms of accuracy.
The large amount of complex organisations and ministries involved in the HARP-HAZ reporting process for the Netherlands requires extensive co-operation to ensure that the process runs efficiently. Sometimes problems exist when formulating measures
44

An Evaluation of Approaches for Monitoring Emerging Hazardous Substances
regarding collection and improvement of data due to varying priorities of many of the institutions incorporated within the HARP-HAZ process. This bureaucracy results in data flow between the many institutions often taking the form of different formats. Currently there are in excess of 2000 different sources and associated sub-sources contained within the system.
Models used for predicting source contributions such as the agricultural consensus model are sometimes very complex, reducing the transparency in the data output produced by the model.
Problems regarding data availability were encountered when attempting to monitor over the 14/15-year time period set out by HARP-HAZ protocol. Significant data gaps exist for some substances which is likely to be due to insufficient monitoring and knowledge of source patterns. Therefore extrapolation took place using data from more recent years. This was undertaken by calculating backwards. In cases where this information was not available it was assumed that 1990 data was on a 1:1 ratio with 1985 data. For example when reporting on PAH emitted to air for all sources 1990 data were used as opposed to 1985 data. Although comparability between Netherlands data sets may be improved by using current knowledge and techniques regarding source apportionment, transparency of these data sets is likely to be compromised.
The Netherlands constantly cross-check each years data for a particular substance with new information which may have arisen regarding additional sources, monitoring techniques, activity rates etc. This information is then utilised to update data sets for earlier years to ensure that the comparability of data sets is maintained. However this may ultimately impact on the comparability of the Netherlands data sets with other countries.
The SOA covers more of the picture for substances that have been regulated for longer as well as for sources (e.g. industrial point sources where monitoring has been undertaken for a relatively long period of time). As a result, information is still lacking for some diffuse sources. For example a recent toxicity experiment undertaken in the Rhine river found that of the total toxicity measured, only 30 per cent of this toxicity could be accounted for by known substances.
5.2.5 Cost Effectiveness of the Approach
The Netherlands has utilised the SOA for monitoring annual loads of hazardous substance emissions for approximately ten years. The approach enables authorities to easily identify areas where reduction targets have not been met and the improvements required ensuring that this occurs. As stated previously the Netherlands also uses LOA, mainly in its largest rivers i.e. the Rhine and Meuse primarily to ensure that it is aware of the contribution of hazardous substances from other countries due to its location as a downstream nation. However the Netherlands preferably use SOA for reporting emissions to the North Sea Convention as it correlates well to its emissions limit value system as well as the polluter pays principle.
The generation of emissions data from large point sources of pollution is very cost effective in that industry bear the burden of reporting. Monitoring has also been largely standardised in terms of calculation methods, approach and equipment allowing greater accuracy in reported data.
45

An Evaluation of Approaches for Monitoring Emerging Hazardous Substances
The Netherlands Pollution Emission Register (PER) is used for reporting on a diversity of international conventions and protocols rendering it cost-effective i.e. data is obtained from the system depending on the basis for which it is required. Examples of these include the Meuse and Rhine conventions as well as the convention on long range transboundary air pollution (UNECELRTAP). Therefore, the costs associated with collection and tabulation of data are not solely connected to HARP-HAZ but to a wide range of conventions.
The Netherlands total HARP-HAZ reporting budget is approximately 2.5 million € / year. The Ministry for Housing Spatial Planning and the Environment (VROM) receives 80 per cent of this budget whilst the Ministry of transport Public Works and Water Management (V & W) is allocated the remaining 20 per cent. In terms of contribution of staff to reporting emissions to the North Sea Commission, VROM have approximately 2 full time employees (fte) connected to the process whilst RIZA have 1 fte. Staff members from all other institutions account for approximately 3 fte. Variables that are additional to this budget include projects for improving quality of data, a large proportion of the data collection by the Central Bureau of Statistics as well as costs associated with waterboards and external data collecting companies.
5.2.6 Future Developments
The Netherlands is currently in the process of increasing the level of transparency within their reporting. Fact sheets for specific sources are being produced that contain details regarding factors such as calculation methods, relevant literature on emission factors etc. It is anticipated that by publishing such information the accuracy in reporting of hazardous substance emissions will increase.
Projects aimed at developing information for new substances as well as source apportionment have recently commenced. Examples of these projects include looking at storm water overflows and contributions of hazardous substances as well as heavy metals leaching from agricultural soils. These projects seek to better quantify emissions from diffuse sources.
In order to increase the accessibility of the emission registration data, this information has been made available on the Internet in the so-called Data Warehouse Emission Registration. An English version of the Data Warehouse is expected to be available in 2004.
5.3 Discussion
Establishing a system for using the SOA for reporting emissions of hazardous substances requires a large amount of organisation as is revealed by systems that Norway and the Netherlands currently have in place. A large amount of organisation is required, primarily between the central level and regional authorities to ensure harmonisation and standardisation of methods throughout the entire reporting process. In addition backstops involving guidance are required to be in place for default approaches where emission data for particular sources are not available.
In contrast to the LOA the SOA is not inherently transparent. Accuracy in reporting using this approach will depend on the amount of attention which is focussed on capturing all relevant source emissions of a particular hazardous substance. Norway and the
46

An Evaluation of Approaches for Monitoring Emerging Hazardous Substances
Netherlands in reporting emissions of hazardous substances to the 5 th North Sea Conference provide the best example for use of the SOA. Both countries have demonstrated a high degree of transparency in their reporting, providing loads for key sources and sub-sources of hazardous substances.
The SOA appears to have been initially adopted by both countries due to its close ties to the emission limit value (ELV) environmental standard approach, which has been in place for a number of years in Norway and the Netherlands. The self-reporting nature of large industrial installations (a key source of emissions of hazardous substances) is also likely to have influenced the adoption of this approach for reporting on emissions under the HARP-HAZ protocol. It is important to note that although both the Netherlands and Norway have adopted SOA with regard to HARP-HAZ reporting they are also required to monitor using LOA under other international conventions such as OSPAR-RID. This places both countries in a strong position to assess the strengths and limitations of both the SOA and LOA.
Common advantages highlighted by Norway and the Netherlands for selection of the SOA for reporting on emissions tended to focus on limitations that they had experienced when using the LOA. Both countries stated that a key advantage of SOA was providing authorities with the ability to formulate reduction targets and associated programmes of measures to reduce emissions from specific sources. As stated previously the LOA is inherently transparent with the total load measured within a river accounting for all source emissions (including diffuse sources) of a substance. However, the reporting of a total load figure that essentially combines all sources does not provide a picture of which sources may require attention to ensure that reduction targets prescribed by the North Sea Commission are effectively achieved.
Another common advantage with regard to the SOA is that it is relatively constant in time and not susceptible to environmental noise. In using LOA monitoring prevalence/frequency can have significant implications upon the accuracy of results. In order to achieve measurements that are comparable to the SOA for a substance such as lead a large amount of money must be spent to ensure that for example episodic rainfall events do not distort figures. In addition monitoring loads for substances such as pesticides can result in multiplying small concentrations at or below the limit of detection with large flows yielding results that do not provide a true indication of pesticide emissions. In contrast the SOA has qualitative elements incorporated into it that enable these problems to be overcome through utilisation of sales statistics, activity rates and emission factors.
Although Norway and the Netherlands represent the countries which have best used the SOA for reporting on emissions, difficulties have been encountered and limitations noted with regard to the SOA. The 14 / 15 year reporting period prescribed under HARP-HAZ proved to be a major difficulty encountered by Norway and the Netherlands when reporting on emissions. This was primarily associated with the 1985 baseline year where minimal data was available for some substances. In an attempt to improve comparability of data sets extrapolation was undertaken using data from more recent years where information regarding source apportionment etc was more accurate.
The Netherlands noted that although that the SOA has enabled them to obtain a solid representation of emissions from point sources the accuracy of data for diffuse sources are significantly lower. This is because best guesses through expert judgement combined with estimations have been utilised in an attempt to quantify emissions from
47
An Evaluation of Approaches for Monitoring Emerging Hazardous Substances
this source. However it is likely that these figures will be associated with higher levels of uncertainty as opposed to actual point source measurements.
Norway highlighted the issue of quality control as being a significant limitation with regard to the SOA. The high degree of variability in the accuracy of monitoring between point sources will have implications upon the quality of data reported. Furthermore this uncertainty is likely to be exacerbated when these results are used to estimate emissions from small and medium industrial enterprises. Data for urban wastewater treatment plants is also associated with degrees of uncertainty due to a lack of direct measurement at the source for the majority of plants in Norway.
Both countries found it difficult to isolate costs for reporting using the SOA for HARP-HAZ as the data generated is used for reporting on a diversity of international conventions. However they were able to provide some indication of costs which was most difficult for the Netherlands due to the large amount of institutions and organisations involved in the reporting process. The SOAs major element of cost-effectiveness involves the self-reporting nature of large point sources which enables authorities to allocate more resources toward quantifying diffuse sources. The qualitative elements incorporated into the approach such as sales statistics, use of activity rates, emission factors etc is also useful in generating data for sources where effective measurement at the source is not possible. Perhaps the most useful cost-effective element of the approach ties to the ability to identify key sources in terms of emissions of hazardous substances. The importance of this element is likely to be strengthened in the future with the introduction of the Water Framework Directive which requires key sources to be identified and quantified within specific river basin districts.
48

An Evaluation of Approaches for Monitoring Emerging Hazardous Substances
6. TASK 4 – EVALUATION OF MONITORING APPROACHES
6.1 Task Objectives
The objective of the task is to evaluate the practicalities, logistics and resources necessary for implementing the SOA in the UK and estimate the adequacy and approximate costs of four possible monitoring scenarios for emerging substances as identified under Task 2.
A number of approaches exist for monitoring hazardous substances in the environment. The suitability of each approach will depend on a number of factors including:
Status of monitoring obligations under the relevant policy drivers (objectives, targets and monitoring requirements) for emerging hazardous substances; and,
Environmental pathways;
Substance properties (e.g. fate, behaviour, PBT etc);
Substance production, use and detection;
Spatial and temporal monitoring scales; and,
Monitoring costs.
The following sections outline the advantages and disadvantages of the following monitoring approaches, in consideration of the above factors:
SOA;
Environmental Monitoring (including the LOA and biological monitoring);
Non-traditional biological monitoring; and,
A combination of monitoring approaches.
6.2 Overview of the Approaches to Monitoring
6.2.1 Source-Oriented Approaches
Source Oriented Approaches (SOAs) focus on quantifying discharges, emissions and losses to water and air at the source. These approaches can be based on measurement of concentration levels at the source or estimations based on various emission factors. The information may be expressed by means of loss coefficients and multiplied by a characteristic unit to quantify the amount. Detailed methodologies can be implemented using specific models for each pathway (e.g. runoff models) and the results for
49

An Evaluation of Approaches for Monitoring Emerging Hazardous Substances
individual models summed to provide the total discharge, emission or loss of a particular substance to water or air (De Paepe et al 2001).
Quantification of emissions, discharges and losses based on emission factors are generally considered to provide the most accurate data for point sources, as long as there is confidence that:
All the relevant sources have been identified;
Reliable measurements of the determinands are carried out; and,
The emission factors are of proven accuracy.
Quantification of emissions, discharges and losses from diffuse sources generally involves best guesses and estimation using emission factors, sales figures and/or models. As a result the accuracy of data reported for diffuse sources can, in some situations, be considerably lower than those reported for point sources.
Complications can arise when considering the (often very complex) retention and transfer processes between sources. These processes can exhibit wide spatial variation and occur at, with varying rates, at different stages of pollutant transfer from source to receiving body. These processes influence pollutant loads transported to surface water along the different hydrological pathways. For example, while retention processes may temporarily decrease pollutant concentrations, changes in environmental factors (e.g. physico-chemical or biological processes) may result in transformation and re-mobilisation of the pollutant back into the water column. Therefore, the use of, for example, sales statistics to predict emissions, discharges or losses of hazardous substances may not provide an accurate representation of actual environmental conditions as it does not consider assimilative capacity or pollutant retention and transformation processes.
SOAs allow for the production of short-term data, enabling competent authorities to formulate reduction targets and associated programmes of measures to reduce emissions from specific sources. SOAs are also more constant in time due to direct measurement at, or estimation of, the source and are therefore not dependent on environmental variability (e.g. hydrological fluctuations, physico-chemical changes etc).
Regulations such as the Integrated Pollution Prevention and Control (IPPC) Directive (Council Directive 96/61/EC), require Member States to monitor emissions discharges and losses of listed substances to air and water and report data against reduction or cessation targets. For the purpose of compliance testing against agreed reduction/cessation targets, the SOA can be a cost-effective monitoring method, particularly in relation to obtaining data from point sources. The main costs are associated with quality control and incorporating the data into appropriate databases (inventories/registers) as well as undertaking material flow analyses to update information with respect to specific substances.
Through the Defra and Devolved Administrations’ National Atmospheric Emissions Inventory (NAEI), the UK has developed significant expertise in SOA methods related to the quantification of air emissions. The NAEI has run since 1982, and covers emissions of all greenhouse gases and the pollutants affecting air quality and acid deposition. The inventory covers 39 pollutants or groups of pollutants and provides a time series of emissions in the UK from 1970 to the most recent year statistics are available, currently
50

An Evaluation of Approaches for Monitoring Emerging Hazardous Substances
2001. Emissions are calculated from individual source sectors using source-related emission factors and activity data.
The NAEI and the accompanying Greenhouse Gas Inventory are designed to provide UK air emissions data in formats required for international submissions to United Nations Economic Commission for Europe (UNECE) and the United Nations Framework Convention on Climate Change (UNFCCC). Under the UNFCCC, the UK’s emission inventories of direct greenhouse gases (CO2, CH4, N2O, HFCs, PFCs and SF6) and indirect greenhouse gases (NOx, CO, NMVOCs) are compiled based on the methodology guidelines publishd by the IPCC. A range of statistical procedures combined with expert judgement are used to quantify the uncertainties in the overall emission estimates and emissions from different sources. The information from the emission inventory has been a major input to UK policy-making with respect to pollution abatement and control. It has also been used in discussions with various international fora such as the EC and the UNECE. The data forms a vital input and link to atmospheric dispersion modelling, and summary data are published annually for general public information.
All monitoring undertaken by CEFAS in the UK is based upon measuring the concentrations of substances in environmental matrices (i.e. LOA). The Environment Agency, SEPA and EHS do monitor pipeline discharges as part of the license consents they issue for direct discharges. Surface water samples are also collected in the vicinity of significant discharges for reporting under various EC Directives, notably the Dangerous Substances Directive and the Urban Waste Water Treatment Directive.
6.2.2 Environmental (including biological) monitoring
Environmental monitoring includes monitoring physico-chemical concentrations, pollutant loads (load orientated approach – LOA) and biological monitoring (contaminant concentrations and community structure).
The UK has traditionally favoured environmental monitoring approaches for quantifying and reporting on emissions, discharges and losses of hazardous substances to water due to the extensive compliance and environmental quality standard (EQS) programmes in place. Environmental monitoring is also used extensively throughout the EU for the periodic assessment and reporting of water quality at a national level. However, most Member States report data on sources in relation to international obligations (e.g. Marine Conventions and Directives), for compliance checking against reduction/cessation targets.
Load Orientated Approaches (LOA)
The UK favoured the load-oriented approach (LOA) to reporting under the HARP-HAZ protocol (North Sea Secretariat 2002 and 2001b). The LOA aims to assess and quantify the riverine or direct discharges of hazardous substances on a catchment or sub-catchment basis. This approach involves quantifying the loads transported by the river at downstream monitoring points and quantifying direct discharges downstream of the riverine monitoring points and then apportioning the total load between the relevant sources.
51

An Evaluation of Approaches for Monitoring Emerging Hazardous Substances
Other than for the direct discharges, source apportionment is not directly obtainable. Retention and transformation processes are taken into account (sedimentation, chemical reactions) in this approach and hence may give a more direct indication of loads entering seas. While the LOA takes into account point and diffuse sources and environmental processes, it is often difficult to apportion the different loads between the sources. This is particularly the case in river basins where there are multiple land uses and pressures, as is the case for the majority of the UK. Furthermore, as a wide range of determinand concentrations and water flows must be monitored in order to provide sufficient information on the various pollutant sources and total loads, the LOA has the potential to carry large associated costs.
The OSPAR Principles of the Comprehensive Study on Riverine Inputs and Direct Discharges (RID) provides an agreed methodology for applying the LOA approach (OSPAR 1998-05). The objectives of the OSPAR RID programme is to provide as accurate an estimate as possible of the input load of selected substances per annum and use this information to provide information on the long-term trends in inputs and/or contaminant concentrations. OSPAR RID requires that the load of a specific substance transported by rivers to Convention waters should be calculated taking the product of the mean flow-weighted concentration and the total flow. Where insufficient information is available, an estimation of the pollutant load should be made by taking the average of the product of flow and concentration for a series of measurements.
Biological monitoring
Biological monitoring is extensively undertaken in the UK. However, many biological assessment schemes are to assess general water quality in particular in relation to organic pollution and are not necessarily designed to detect or quantify the impacts of hazardous substances. For example, around 7000 sites are monitored in England and Wales for river invertebrates in the EA’s GQA scheme. The NRA developed a predictive model (RIVPACS) which is currently used to predict the BMP score based on a particular sites’ hydromorphological and physico-chemical characteristics to give an indication of relative impact (mainly organic pollution). Current biological monitoring is based on measuring community structural attributes e.g. composition, abundance and presence/absence of sensitive species. The importance of this type of biological monitoring is likely to increase in the future as a result of the monitoring and classification requirements under Annex V of the Water Framework Directive. For example, more trophic levels will have to be included, and the extent of monitoring in some water categories increased (e.g. in lakes and estuaries).
Biological monitoring can also provide information on the short and long term effects of pollution on community structure (e.g. abundance and diversity). While monitoring sources, loads and concentrations is generally based on individual substances, biological communities respond to the effects of mixtures and therefore can provide an overall indication of the pollution status of a waterbody.
Some taxonomic groups exhibit high spatial and temporal variability. For example, phytoplankton biomass and community structure are influenced by a range of environmental factors such as nutrient availability, temperature and sunlight. In addition, a high level of taxonomic expertise is generally required for species determination. Therefore, large costs may be associated with biological monitoring in order to achieve adequate levels in confidence and precision of the results.
52

An Evaluation of Approaches for Monitoring Emerging Hazardous Substances
6.2.3 Non-traditional biological monitoring
In recent years, environmental regulators have emphasised the importance of using of ecotoxicological methods for assessing receiving water quality. This has largely involved testing field collected samples using laboratory-based analyses, including those currently specified for the assessment of individual chemicals as part of notification processes. However, interest has focussed more recently on the application of in-situ (field deployed) single species, population or community-based methods to assess fresh, estuarine and marine receiving waters.
The WFDs objectives regarding ecological status, OSPAR requirements and development of the European Commissions strategy with regard to the control of endocrine disrupting substances, is likely to increase the significance of ecotoxicological monitoring methods in future years.
A wide range of active in-situ procedures have been developed which use species from many different taxa (including phytoplankton, macrophytes, invertebrates and fish) and which incorporate various endpoints. In organisms deployed in the field the endpoints measured can include lethality and sub-lethal biochemical, physiological and behavioural indices. These methods may require the test organisms to be returned to the laboratory for elucidation of the test endpoint. Physiological endpoints such as feeding rate, growth and reproduction will tend to respond to a wide range of substances whereas biochemical endpoints (or biomarkers) can either be general or substance-specific. For example, the enzyme acetylcholinesterase can be induced in invertebrates and fish following exposure to organo-phosphorus pesticides. Specific examples of the successful application of ecotoxicological methods for assessing water quality are provided in Annex VI.
The key advantage of ecotoxicological methods is that they can be used to determine both environmental quality and measure the success of regulatory measures. These methods can be used whenever an environmental sample is collected, providing a degree of temporal and spatial definition and comparability making them useful for monitoring large areas, identifying potential hot spots and identifying the source and cause of any impact (Nixon et al 2000).
However these methods often need to be combined with chemical methods as although they can identify a toxic effect they cannot discriminate between toxicants. In order to obtain an accurate indication of a substances effect on biota, data are also likely to be required for sediments and the water column. In comparison to traditional chemical methods for monitoring ecotoxicology tests can be expensive.
In order to accurately quantify the impacts of a specific substance using ecotoxicological methods the best method involves gathering data for each trophic level but this incurs carries large associated costs. In reality the method tends to focus on a single species, which is extrapolated to the community level which can create problems in establishing the realistic environmental effects of hazardous substances.
53

An Evaluation of Approaches for Monitoring Emerging Hazardous Substances
6.2.4 A pragmatic combination of approaches
Often an effective water quality monitoring and management strategy requires a combination of monitoring approaches. A number of international obligations, such as the Water Framework Directive and OSPAR’s Joint Assessment and Monitoring Programme (JAMP), require Member States to adopt a combination of environmental monitoring and source monitoring.
The monitoring approaches described above are compatible, and when integrated, reveal more about the presence, strength, nature and effects of toxicants than could be discovered from any single approach. Each technique serves to both confirm and extend the understanding of environmental contamination in surface waters, sediments, or soil. Multivariate statistical techniques now mean that analysing complex multi-type datasets has become relatively straightforward which aids in directing subsequent regulatory actions (Nixon et al 2000). Each approach differs in function and should be used when there is a specific purpose for which it is suitable.
Recent international obligations to manage and protect the marine ecosystem (e.g. OSPAR DPSIR framework) recognise that it is no longer acceptable or justifiable to only adopt a single method for quantifying pollution of surface waters. For example, the OSPAR DPSIR framework recognises that a combination of LOAs and SOAs are required in order to determine trends in hazardous substances in the environment.
In aquatic environments there will clearly be scenarios where the responses of the biological and ecotoxicological data might be expected to give similar responses, for example in very contaminated conditions (Birge et al 1989, Eagleson et al 1990, Dickson et al 1992). There will also be scenarios when the response of the biological and ecotoxicological data might be expected to be different, for example in conditions of moderate to low contamination (Dickson et al 1992). In these situations, the extra sensitivity of the toxicological response might be expected to give a signal but the effects might be such that they have not fed through to the community level. Therefore, regulatory action can be implemented before a signal in the biological data may have become apparent. Across the spectrum of contamination, the biological and ecotoxicological responses could provide complementary information which together provide a better assessment and an enhanced view of environmental quality.
Direct biological-effect testing, where some measure of biological ‘health’ is determined, can aid decision-makers in these tasks by predicting and detecting effects, screening and prioritising problems and by quantitatively estimating hazards. This will ultimately improve the quality and confidence of these decisions. Effect testing can, therefore, be used as a potential environmental quality ‘viewpoint’ and be used to set and enforce standards and measure the success of regulatory measures.
For the quantification of emissions, discharges and losses of hazardous substances in the UK, it is likely that a combination of monitoring approaches will be required in order to comply with the relevant policy drivers as well as increase the precision and confidence in data obtained.
54

An Evaluation of Approaches for Monitoring Emerging Hazardous Substances
6.3 Relevant documents/procedures
6.3.1 OSPAR HASH
OSPAR recognised the need to report, on a regular basis, progress with moving towards the 2020 cessation target for the substances which it has identified for priority action (refer Annex I). As a result, an intersessional correspondence group (HASH-ICG) was established in Spring 2001 to identify and initiate activities to develop and provide necessary strategies and tools for the evaluation of progress with respect to achieving the targets (OSPAR 2002b). OSPAR HASH-ICG has included this task in the Joint Assessment Monitoring Programme (JAMP), and produced a guidance document to enable lead countries responsible for individual substances to develop a monitoring programme which will enable progress towards the cessation.
This guidance document has been adopted as tool HT-1 in the JAMPA draft of the tool HT-1a of the new JAMP was presented to the Working Group on Point and Diffuse Sources in November 2002. The guidance is designed to assist lead countries in the development of a draft monitoring strategy for an individual substance. However, the strategy is suitable for the development of strategies for other substances not included on the OSPAR list (OSPAR 2002b).
The tool is based on a decision tree approach, which takes into account the main issues for the design of a monitoring programme for hazardous substances, such as:
Production and use;
Environmental pathways;
Substance properties (fate and behaviour, PBT etc)
Availability/suitability of information and analytical methods; and,
Selection of an appropriate monitoring medium.
The tool developed represents a suitable starting point for the development of a hazardous substances monitoring strategy for the UK in that it addresses the majority of relevant issues. However, the tool has been developed specifically for the OSPAR JAMP so it does not address substances that have multiple drivers. As the monitoring requirements vary between different drivers, this was seen as the key consideration for the development of an integrated strategy as it is the driver/s that ultimately decide if, where, when and how a substance should or must be monitored. For example, if a driver sets an EQS for a particular substance within the water column, monitoring for that substance in sediments would be futile, unless of course it was required by another driver.
While the decision tree approach proposed in HASH-ICG tool HT-1a represents a useful reference, it is not suitable for use in the development of a monitoring strategy for the UK as it does not consider the key targets, objectives and monitoring requirements for other policy drivers. Nevertheless, this tool has been used as a basis for comparison in the development of a UK monitoring strategy.
55
An Evaluation of Approaches for Monitoring Emerging Hazardous Substances
6.3.2 Water Framework Directive Common Implementation Strategy (CIS) Guidance
The Water Directors from EU Member States and Norway identified a number of elements for a Common Implementation Strategy (CIS) for the Water Framework Directive (WFD) such as the need to integrate activities on different horizontal issues for the effective development of river basin management plans and implementation of the WFD and the need to establish working groups and develop informal guidance and supporting documents on key aspects of the WFD.
Ten working groups (WGs) were established under the CIS to develop a common understanding and approaches for key technical issues in relation to the Annexes II, III and V of the Directive. A result of these working groups has been the development and approval of informal, practical guidance documents for support of the overall implementation process and for testing in pilot river basin.
Two of the guidance documents, Analysis of Pressures and Impacts (IMPRESS) (WFD CIS Guidance Document No. 1, 2002) and Monitoring (WFD CIS Guidance Document No. 7, 2002) provide useful information to assist the UK in the development of a monitoring strategy for emerging hazardous substances.
IMPRESS
The IMPRESS guidance document has a central role in the river basin management planning process as it provides information on the assessment of risks, resulting from human activity, of failing the objectives of the WFD (WFD CIS Guidance Document No. 1, 2002). The document has been prepared to provide Member States with non-legally binding guidance on the review of human activity and its impact on the status of surface water and groundwater (Article 5, Annex II 1.4-2.5).
The first pressures and impact analyses will be required to be undertaken by the end of 2004 with respect to the characterisation process and will be carried out largely using existing monitoring data. The analysis will seek to identify those water bodies which are at risk of failing to meet the Directives environmental objectives such as the achievement of good chemical status.
The IMPRESS guidance is of particular relevance to the establishment of a monitoring strategy as it can be used to target the monitoring programmes required under Article 8, so that they provide sufficient information to validate the analyses and assess the effectiveness of the programmes of measures.
The Directive gives a generic group of pollutants listed in Annex VIII that covers a large number of individual substances and groups of substances, including hazardous substances. For non-Priority List substances it is up to Member States to establish an appropriate list of specific pollutants to be assessed for their relevance in terms of meeting the Directive’s objectives. However, the methodology for identifying specific pollutants is not specified in the Directive. One possible approach for identifying specific pollutants is to start with the ‘universe of chemicals’ and rely on all available knowledge of the substances in order to screen for those which are of relevance in a river basin. Available knowledge would include information on substances’ intrinsic properties (e.g. physico-chemical properties, persistence, toxicity and bioaccumulation) and on inventories of substance use and emissions for each river basin.
56
An Evaluation of Approaches for Monitoring Emerging Hazardous Substances
The Directive also requires the identification of Priority Substances, and within those Priority Hazardous Substances, for which EU initiatives and measures are required to reduce pollution from Priority Substances, or to phase out or cease emissions, losses and discharges of Priority Hazardous Substances. These substances have arisen through a prioritisation process using the generic list of substances, as a starting point. The priority list included in Annex III of this report has been used to determine those specific substances that will require mandatory monitoring under the Directive. Furthermore, it is the priority substances that will be controlled at the EU level, while the generic groups listed in Annex VIII of the Directive will be controlled more at a local or national level.
Monitoring
The purpose of the Monitoring guidance document is to provide guidance on establishing appropriate monitoring programmes for surface water and groundwater with specific emphasis on the appropriate selection of quality elements in accordance with Article 8 and Annex V of the WFD (WFD CIS Guidance Document No. 7, 2002). The document provides a common understanding of the key concepts and terms relevant to monitoring for the WFD and provides non-legally binding guidance on the establishment of programmes of measures in consideration of legal requirements, best practice and statistical methods.
Annex V identifies legal requirements for monitoring, including quality elements to be monitored for each water body and minimum sampling frequencies that must be undertaken. However, there is scope to develop individual monitoring programmes based on existing best practices and to achieve the required levels of precision and confidence. The Monitoring Guidance goes some way to provide Member States with guidance on the appropriate selection of water bodies, quality elements, sampling sites and sampling frequencies for lakes, rivers, transitional, coastal and ground waters. The document addresses the monitoring requirements for priority list substances and provides useful information for the establishment of a targeted monitoring programme that could be further developed by the UK to address the WFD specific monitoring requirements for hazardous substances.
Expert Advisory Forum for Priority Substances
The CIS for the WFD has also established an Expert Advisory Forum (EAF) for Priority Substances which will be responsible for developing legislative proposals for Emission Standards and Environmental Quality Standards (EQSs) for the Priority Substances. The Commission is aiming to publish its proposal for EQSs for priority substances by the end of 2003. The focus at this stage will be on EQSs for the water column for all surface water categories rather than on EQSs for biota and sediment. The latter 2 compartments are considered to be too difficult at this stage and there is a lack of appropriate data for many substances. However, it is likely that standards for biota and sediment will be established at some stage in the future.
The Commission were due to have reviewed the status of the 14 substances identified as potential priority hazardous substances by the end of 2002. It is now intended to complete this by end of September 2003. The whole priority substance list is to be reviewed by the end of December 2004.
57

An Evaluation of Approaches for Monitoring Emerging Hazardous Substances
An expert sub-group of this EAF is on the Analysis and Monitoring of Priority Substances (AMPS) and has the task of providing guidance of current methods and standards for the analysis of these substances. The group has concluded so far that there are analytical standard methods for 32 of 33 compounds/compound groups but the methods performance data do not match all EQS proposals for inland waters and marine waters. In addition not all existing methods are up-to-date with only 21 of 33 substances covered by methods from 2000/2001/2002. The group will also have to consider what monitoring is required to assess compliance with EQSs established for water, sediment and biota.
6.4 Status of Monitoring Obligations Under Relevant Policy Drivers
Consideration of the characteristics of the key policy drivers that set out the monitoring and assessment requirements of hazardous substances in fresh and marine waters is essential in order to develop a focussed and cost effective monitoring strategy to determine the emissions, discharges and losses of hazardous substances in the UK. To achieve this, an understanding of the overlapping and conflicting policy objectives and differences/commonalities in monitoring requirements in relation to meeting the specific policy objectives must be obtained.
In accordance with the focus of the study on ‘emerging’ priority hazardous substances, consideration has been limited to those policy drivers that are currently revising or likely to revise lists of substances.
The following sections outline the objectives of the main policy drivers and provide a general comparison of overlaps and differences that require consideration to enable the development of a monitoring strategy for emerging priority hazardous substances. A Summary of the key Characteristics of the main policy drivers in relation to emerging priority hazardous substances is provided in Table 6.1.
6.4.1 Overlapping/conflicting policy objectives
There is potential for duplication of monitoring where commonalities in monitoring requirements between different drivers exist (e.g. in terms of environmental objectives, water categories and/or temporal and spatial requirements).
The objectives for monitoring between the different policy drivers are often similar, in that they aim to monitor pollutant levels, describe the spatial and temporal trends and use this information to assess progress towards policy objectives (e.g. to reduce pollution from List II substances), and to develop remediation programmes and advise decision makers. However, specific environmental and monitoring requirements vary. For example, none of the marine conventions has the requirement to monitor and assess ecological status, ecological potential and chemical status as required by the Water Framework Directive (WFD). Therefore, the requirements of OSPAR mainly apply to monitoring contaminants or pollutants, whereas WFD objectives focus on ecological or biological monitoring. This creates difficulties in developing a co-ordinated monitoring strategy to address all relevant drivers as different media will require monitoring for different drivers.
58

An Evaluation of Approaches for Monitoring Emerging Hazardous Substances
Overlaps exist between OSPAR and the WFD in the waterbodies to be monitored for substances common to both drivers. For example, OSPAR requires monitoring of listed substances of priority concern within the maritime area, while the WFD requires monitoring of priority list substances discharged into rivers, lakes transitional and coastal waters. Therefore, for substances appearing on both OSPAR and WFD lists, monitoring is may be required in the same waterbody. The WFD however does not include offshore (outside territorial limits) marine waters.
There is generally scope within the policy drivers for countries to develop individual monitoring programmes, including spatial and temporal requirements. For example, while the WFD identifies specific quality elements to be monitored for each waterbody, it only provides ‘minimum’ sampling frequencies and requires Member States to develop monitoring programmes to achieve ‘acceptable levels of precision and confidence’. Therefore, scope exists for countries to integrate monitoring programmes, where possible, in relation to spatial and temporal requirements.
6.4.2 International reporting obligations
While the international requirements for reporting do not drive the monitoring requirements for individual countries, they will determine the way data is collected, stored and reported under the various legislative reporting drivers. The reporting requirements will also govern the timing for implementation of monitoring programmes in order to meet the strict reporting deadlines imposed. It is therefore important to understand the various international reporting requirements how these relate to the key policy drivers establishing the monitoring and assessment requirements of hazardous substances in fresh and marine waters.
The Directive standardising and rationalising reports on the implementation of Directives relating to the environment (91/692/EEC) (the Standardised Reporting Directive - SRD) was adopted in 1991 and is intended to harmonise and improve the reporting requirements included in existing Directives. As a result of the Directive’s adoption, a number of Directives in the field of the environment were amended to require Member States to submit information on the implementation of those Directives to the European Commission every three years. Some of the necessary information includes the results and information from national monitoring programmes. National reports were to be drawn up on the basis of a questionnaire or outline drafted by the Commission and approved by a Committee of Member States’ representatives. Outline questionnaires for 14 Directives on water were first adopted in Commission Decision 92/446/EEC, which were further amended, following further consultations with the Committee, by Commission Decision 95/337/EEC.
The Directives covered by Decision 92/446/EEC are:
1. Directive 76/464/EEC on pollution caused by certain dangerous substances discharged into the aquatic environment of the Community;
2. The Daughter Directives to 76/464/EEC (82/176/EEC, 83/513/EEC, 84/156/EEC, 84/491/EEC, 86/280/EEC);
3. Directive 78/659/EEC on the quality of fresh waters needing protection or improvement in order to support fish life;
59
An Evaluation of Approaches for Monitoring Emerging Hazardous Substances
4. Directive 78/176/EEC on waste from the titanium dioxide industry, as amended by Direcive 83/29/EEC;
5. Directive 79/923/EEC on the quality required of shellfish waters;
6. Directive 80/68/EEC on the protection of groundwater against pollution caused by certain dangerous substances;
7. Directive 75/440/EEC on the quality of surface water intended for the abstraction of drinking water in the Member States;
8. Directive 79/869/EEC concerning the methods of measurement and frequencies of sampling and analysis of surface water intended for the abstraction of drinking water in the Member States;
9. Directive 80/778/EEC relating to the quality of water intended for human consumption; and
10. Directive 76/160/EEC concerning the quality of bathing water.
In addition, two of Directives in the water sector adopted in 1991 placed reporting requirements upon the Member States, namely:
Directive 91/271/EEC concerning urban waste water treatment (the UWWT Directive);
Directive 91/676/EEC concerning the protection of waters against pollution caused by nitrates from agricultural sources;
A similar procedure to that used under the SRD was used to define the requirements for the format and content of the reports required under the UWWT Directive. However, the information required in the reports to be submitted under the Nitrate Directive is specified in the Directive itself.
With the exception of the Bathing Water Directive, the first report Member States were required to submit under the SRD covered 1993 – 1995 and reports were required by the 1 September 1996. For the Bathing Water Directive the Member States have been required to submit annual report by 31 December since 1993. For the UWWT Directive Member States are required to report every 2 years with the first report submitted by the end of June 1994, and for the Nitrate Directive they must report every four years with the first report submitted at the end of December 1995.
More recently the European Commission has been considering the development of a new Framework Reporting Directive, which would cover all environmental themes and would seek to rationalise and harmonise reporting requirements. In addition, the European Commission is developing the reporting requirements associated with the Water Framework Directive. This is being done under the auspices of one of the working groups set up under the Common Implementation Strategy.
The other legislative drivers may also have reporting requirements that include monitoring information. Examples include the HARP-HAZ initiative and OSPAR’s RID programme. The latter requires the annual report of riverine and direct discharges of specified pollutants to sea.
60

An Evaluation of Approaches for Monitoring Emerging Hazardous Substances
61
An Evaluation of Approaches for Monitoring Emerging Hazardous Substances
Table 6.3 Characteristics of the main policy drivers in relation to emerging priority hazardous substances
Driver Key Objectives Associated targets (if different from objectives)
Status of any targets Requirements for monitoring
Status of monitoring requirements
Comments
Water Framework Directive (2000/60/EC)
Prevent further deterioration and protect, enhance and restore all bodies of surface water
Progressively reduce pollution from priority substances
Cease or phase out emissions, discharges and losses of priority hazardous substances
Achieve good surface water status or, for heavily modified water bodies, good ecological potential and good chemical status by 2015.
Must meet EU EQSs for PS and EQSs set by member states for other pollutants by 2015
Cessation/phase out of Priority hazardous substances 20 years after adoption of measures at EU level.
Mandatory with defined derogations and exceptions. .
Biological, physico-chemical and hydromorphological quality elements.
Priority list substances and other pollutants in surface water bodies
Scope and extent will vary between counties
Guidance produced to facilitate harmonised approaches and implementation.
Transboundary (international and into seas) pollutant loads (i.e. load monitoring).
Estimation and identification of significant point and diffuse source pollution of main pollutants (i.e. source monitoring and/or indirect assessments).
The establishment of surveillance, operational and investigative monitoring programmes for surface waters, and for protected areas is mandatory
Mandatory monitoring of all listed Priority Substances identified as being discharged into surface and GW bodies & other pollutants discharged in significant quantities.
Monitoring not mandatory for substances not discharged
Combination of monitoring approaches (source, load and environmental) required to comply with Directive.
Ecotoxicology may also have a role in investigative monitoring.
It is likely that further guidance on how to assess cessation and phasing out of emissions, discharges and losses of Priority Hazardous Substances will arise in association with Daughter Directives.
Priority lists will be revised based on recommendations from COMMPS prioritisation procedure for candidate substances
IPPC Directive(96/61/EC)
Achieve integrated prevention and control of pollution arising from point source activities listed in Annex I of the Directive.
Lays down measures designed to prevent, or where that is not practicable, reduce emissions in air, water and land, in order to achieve a high level of
All new installations must operate with a permit and all existing permits must be reconsidered at the latest 2004
Releases of substances identified in Annex III will be checked for compliance against Emission Limit Values (ELVs) established by the relevant Competent Authority (CA), based on best available techniques
Legal requirement to comply with all permit conditions set by the Competent Authority
Must report results of monitoring of releases for compliance checking against ELVs.
Mandatory reporting by Member States to European Commission of emissions to air and water for which
Mandatory monitoring of releases to air, water and land from all installations identified in Annex I.
Permit must set out monitoring requirements (e.g. measurement methodology and frequency, evaluation procedures etc)
Emissions data for the European Pollution Emissions Register for
Monitoring of substances identified in Annex III mandatory when released from an installation identified in Annex I, if relevant for fixing ELVs
Only installations above certain thresholds included.
Monitoring of releases at point sources required (e.g. source monitoring).
62

An Evaluation of Approaches for Monitoring Emerging Hazardous Substances
Driver Key Objectives Associated targets (if different from objectives)
Status of any targets Requirements for monitoring
Status of monitoring requirements
Comments
protection of the environment as a whole.
The operator must inform the CA of results of monitoring of releases and of incidents or accidents affecting the environment to enable compliance checking
threshold values are exceeded (European Pollution Emission Register).
each qualifying installation can be reported as measured, calculated or estimated amounts.
Marine Strategy (COM(2002 539 final)
To define and develop a thematic strategy for the protection of the marine environment, for example in terms of hazardous substances.
To reach close to zero concentrations of hazardous substances in the marine environment by 2020 and
To integrate this aim into Community policies regarding chemicals and pesticides and other relevant policies so as to achieve a progressive reduction of discharges, emissions and losses of these substances from all sources and sectors.
Policy proposals will emerge from the strategy. These will be mandatory if formulated in Directives.
To develop harmonised methods and procedures for monitoring and assessment of the marine environment at national and international level.
As a first step, the Commission will promote initiatives aimed at the adoption of a common marine monitoring and assessment strategy in 2004.
No mandatory requirements at the moment.
Present draft is only the starting point in the process of developing the Marine Strategy.
OSPAR strategy on hazardous substances (including JAMP and substances of concern)
Prevent pollution of the maritime area by continuously reducing discharges, emissions and losses of hazardous substances, with the ultimate aim of achieving concentrations in the marine environment near background values for naturally occurring substances and close to zero for man-made synthetic substances
Make every endeavour to move towards the target of the cessation of discharges, emissions and losses of hazardous substances by the year 2020.
Complete the development of a dynamic selection and prioritisation mechanism (DYNAMEC) to select the hazardous substances to be given priority and apply the selection mechanism to substances and groups of substances of concern, including those substances and groups of substances set out in the OSPAR List
Decisions have to be complied with by Contracting Parties who have accepted the relevant decisions. If not they must withdraw from the convention or decisions made thereof.
International law takes precedence over Community and national law, the European Union and its Member States are required to amend national/EU legislation should it conflict with OSPAR rules.
All types of water within the OPSAR maritime area are included.
Monitoring includes: Marine monitoring (CEMP), Riverine inputs and direct discharges (RID) monitored for all major load bearing rivers and direct discharges, atmospheric inputs (CAMP).
Has developed Background Reference Concentrations (BRCs) and Ecotoxicological Assessment Criteria (EACs) as assessment tools, originally for the assessment of contaminant
Substances measured are recommended only and monitored on a voluntary basis: hydrocarbons (especially PAHs and mineral oil (strongly recommended]), PCBs, and other hazardous substances, particularly organohalogen compounds.
Monitoring varies per country, differs between media being measured for contaminants monitored.
National monitoring initiatives co-ordinated
Diffuse and direct inputs, and inputs from minor river systems are not included in the monitoring programme, but are assessed using “best estimates” of concentrations and flow.
OSPAR HASH-ICG has been set up to develop tools and strategies with respect to achieving OSPAR Objectives. Currently developing the first tool – HT-!a (Guidance on a common framework for the establishment of the monitoring strategies for each substance on the OSPAR List of Chemicals
63

An Evaluation of Approaches for Monitoring Emerging Hazardous Substances
Driver Key Objectives Associated targets (if different from objectives)
Status of any targets Requirements for monitoring
Status of monitoring requirements
Comments
of Candidate Substances in order to review the list of chemicals for priority action set out in Annex 2.
levels and their effects, however, these tools are currently being reviewed and expanded..
through OSPAR JAMP. for Priority Action).
North Sea Conferences
Continual reduction of discharges, emissions and losses of hazardous substances moving towards target of their cessation within one generation (2020), with the ultimate aim of achieving concentrations in the North Sea near background values for naturally occurring substances and close to zero for man-made synthetic substances
50%/70% reduction targets for hazardous substances listed in Annex 1A of the Hague Declaration and ultimately Cessation of hazardous substances by 2020.
Identify what action may be needed to tighten control on the use of hazardous substances in consumer products.
Develop and support further initiatives on substitution of hazardous substances with safer, non-hazardous alternatives
Ministerial declarations do not constitute a legally binding measure, only a political obligation to aim for compliance. The 2020 phase out date for dangerous substances is a political goal only (Sintra declaration).
With regard to the OSPAR strategy (see above), Ministers invite OSPAR to develop an effective and efficient monitoring and assessment process for the chemicals selected for priority action, in order to demonstrate publicly, clearly and transparently whether and how progress toward the cessation of discharges, emissions and losses is being achieved.
The North Sea Conference process has now effectively transferred the reporting requirements on hazardous substances to OSPAR and the EC.
Aarhus Convention on access to information, public participation in decision making and access to justice in environmental matters
To establish a coherent, integrated, nationwide pollutant release and transfer register (PRTR).
PRTR should be facility-specific, include diffuse pollution, pollutant-specific, releases to air, land and water and based on mandatory reporting.
Measurement, calculation or estimation of pollutants allowed.
Owners or operators of facilities may include monitoring data, emission factors, mass balance equations, indirect monitoring or other calculations, engineering judgments and other methods.
Eighty-four pollutants listed for PRTR.
Thresholds for qualifying facilities given.
Contracting parties must give relevant national authorities sufficient powers to enforce reporting.
Meeting of CPs will assess compliance in a non-adversarial way.
UNEP/POPS (Stockholm Convention)
Protect human health and the environment from persistent organic
Eliminate emissions, discharges and losses of Annex A POPs and restrict production and use of
Legally binding international convention. As with OSPAR, Decisions
Encourage and/or undertake appropriate monitoring for POPs, alternatives and candidate
Monitoring explicit in text of convention ie. ‘encouraged’ and shall be undertaken ‘within
Monitoring releases (e.g. source monitoring) as well as environmental trends (concentrations or
64

An Evaluation of Approaches for Monitoring Emerging Hazardous Substances
Driver Key Objectives Associated targets (if different from objectives)
Status of any targets Requirements for monitoring
Status of monitoring requirements
Comments
pollutants (POPs) Ultimate objective is
to eliminate any discharges, emissions, and losses of POPs
Annex B POPs by the year 2000.
Reduction (and where feasible elimination) of total releases derived from anthropogenic sources of Annex C POPs
Reduction and elimination of releases from stockpiles and wastes of POPs identified in Annex A, B and C.
POP review committee established to develop scientific criteria for identifying other POPs for possible inclusion.
have to be complied with by Contracting Parties who have accepted the relevant decisions. If not they must withdraw from the convention or decisions made thereof.
Targets identified are goals to move towards and not an objective to be achieved therefore is a political goal with no legal force.
POPs including: Sources and releases to
the environment Presence, levels and
trends in humans and environment
Environmental fate, transport and transformation
Release reduction or elimination
Effects on human health and the environment;
Making the results accessible to the public
their capabilities’ so does not imply that it is mandatory. Moral rather than legal requirement.
loads). No specific reference to biological monitoring except human health.
No formal reporting mechanism required for monitoring releases or trends. Parties required to report on measures taken to reach objectives and statistical data (or reasonable estimates) on total quantities of production, import and export of POPs listed in Annex A and B.
Not as yet ratified by the UK
UNECE Convention on Long-range Transboundary Air Pollution and protocols
To regulate emissions on a regional basis
To protect eco-systems from transboundary pollution
See specific protocols and national implementation
See specific protocols The Heavy Metals and
POPs Protocol require Parties to encourage, monitoring of;
long-range transport and deposition levels and existing levels in the biotic and abiotic environment
Inventories in representative ecosystems;
Extended by eight separate protocols since original 1983 convention
Most relevant protocols are those concerning Persistent Organic Pollutants which covers 16 substances and the heavy metals which covers Cd Hg and Pb.
EU Air Quality Framework Directive and Daughter Directives
Overall strategy to control human non-occupational out-door exposure to specified air pollutants
Daughter directives in force address concentrations of NOx, SO2, Pb, O3
future 4th daughter directive will cover As, Cd, Ni, Hg and PAHs
Limiting Air Quality Concentrations for specified pollutants
Public Information about levels and particularly alerts
Limit values to be attained by set target dates. Implementation and reporting of progress required
Need of monitoring in zones, predominantly rural) and agglomerations (urban areas with populations of 250000 or more).
If concentrations demonstrated to be comfortably below limit values monitoring may be relaxed.
to be carried out using CEN specified reference
as required by daughter directives.
method, uncertainty and minimum data capture specified in daughter directives
Only Pb daughter directive relevant of those presently in place
draft covering As, Cd, Ni , Hg and PAHs under negotiation
65

An Evaluation of Approaches for Monitoring Emerging Hazardous Substances
Driver Key Objectives Associated targets (if different from objectives)
Status of any targets Requirements for monitoring
Status of monitoring requirements
Comments
methods or equivalent legislation
UK Air Quality Strategy (AQS)
Focuses on reducing airborne concentrations through a very broad range of policies
Wide range of policies with individual targets
Air Quality Objectives are regulatory
PAH objective is presently provisional and unlikely to be made regulatory
Local Authorities responsible for review and assessment of air quality which may if levels assessed as significant lead to monitoring
Depends on concentrations assessed
Has led to review and assessment of air quality for each of the GB local authorities. Northern Ireland is getting underway.
LA R+A will not presently cover pollutants relevant to this study
66
An Evaluation of Approaches for Monitoring Emerging Hazardous Substances
6.4.3 Monitoring requirements and targets
In general, OSPAR and the WFD require the assessment of riverine loads and direct discharges of certain substances in surface waters. Both share the target of reducing, ceasing and phasing out emissions of certain identified substances., The WFD requires the achievement of good ecological and chemical status. Ecological status is defined in terms of specified structural attributes of the biological communities supported by physico-chemical and hydromorphological quality elements. Chemical status is defined in terms of complying with EQSs to be set for Priority Substances in water and/or biota and/or sediment. These concepts are largely absent from the Marine Conventions, although OSPAR is introducing the concept of Ecological Quality Objectives (EcoQOs) they are not defined in the same way as the in WFD. OSPAR compares contaminant concentrations against Ecotoxicological Assessment Criteria and Background Reference Concentrations.
The WFD requires the monitoring of priority list substances in each river basin district and water body into which they are discharged. Monitoring results for water, sediment and biota will be compared to appropriate EQSs. Monitoring is also required for other pollutants if they are discharged in ‘significant quantities’. No definition of significance is given but one might assume that a discharge impacting on a protected area, or which caused exceedence of any national standard or caused biological or ecotoxicological effect in a waterbody would be expected to be significant.
6.4.4 Legal standing
Contracting parties to OSPAR are legally bound to adopt or amend their internal law, once a decision has been accepted by a contracting party. Ministerial declarations as made at North Sea Conferences are not recognised in a legal sense, although as an international obligation, they are morally and politically binding. They set out political statements of future intentions, but are not intended to be legally binding, although some have subsequently become part of international law. In comparison, EU directives must be implemented in national legislation thereby legally binding Member States to achieve the stated objectives within the time limits specified in the directive. Therefore, the implementation of strategies developed under the marine conventions is more of a ‘moral’ obligation as opposed to a ‘legal’ one.
This could potentially influence the decision making process by raising the issue of precedence. For example, EU Member States face over five thousand reporting obligations (often based on some monitoring information) for freshwater and four thousand for marine waters (Nixon et al 2000b). Three quarters of these obligations are legally enforceable. It is likely that countries under resource constraints will prioritise the legally enforceable requirements, rather than moral obligations, to avoid enforcement proceedings. In this context, the legal reporting obligations set out under legislation such as the SRD, The WFD and the Framework Reporting Directive (currently being considered - refer to Section 6.4.2) will influence the legal standing of reporting requirements.
Regardless of the legal precedence, the underlying principles (e.g. the precautionary principle) and overall aims of the various policy drivers are similar. Furthermore, specific monitoring requirements are not generally prescribed and Member States or contracting parties are required/encouraged to develop programmes of measures based on Best
67

An Evaluation of Approaches for Monitoring Emerging Hazardous Substances
Available Techniques (BAT). This provides opportunities for countries to develop monitoring programmes in a co-ordinated and cost efficient manner that addresses all legal and moral international policy requirements.
6.5 Environmental Pathways
A number of pathways exist with respect to emissions, discharges and losses of hazardous substances to the aquatic environment. These pathways include:
Emissions to air and atmospheric deposition;
Diffuse sources from surface runoff;
Point source discharges including:
Run-off (surface and subsurface (interflow) runoff);
Leaching;
Soil erosion (wind erosion, surface water erosion);
Drainage; and
Groundwater.
The intrinsic properties of a pollutant as well as its emission source/use will ultimately affect the likely pathways which it takes in reaching the aquatic environment. The three main environmental compartments where hazardous substances are likely to end up are water, sediment and soil.
For example the major pathways for mercury into the aquatic environment are deposition from atmosphere, leaching or volatilisation from landfill and runoff from soil. Mercury also tends to undergo redistribution processes between water, soil and environmental compartments.
In terms of polybrominated diphenylethers (PBDEs) transport is mainly by air, water and particles with the transport associated with particles more important with increasing bromination of the PBDE compounds. PBDEs bind strongly to suspended particulate matter in water as would be expected from their partition coefficients. For decaBDE there are many small industries which are potential sources, especially furniture upholstery for which the application process uses water. Impregnation of clothing with PBDE does not seem to be a problem. An important secondary source of PBDEs appears to be sewage treatment plants receiving industrial wastes.
The release of hazardous substances to air can occur via a variety of sectors and pathways. Such emissions can be generically split into two groups, those arising unintentionally via fugitive releases as a result of a given activity (e.g. dioxins emissions from combustion processes), and those arising from the intentional and direct use of a chemical-containing product (e.g. agricultural pesticide applications). Emissions of chemicals from stacks, transport/roads and fields are dispersed in air, and numerous chemical reactions and atmospheric transport processes can occur after release. This
68

An Evaluation of Approaches for Monitoring Emerging Hazardous Substances
results in pollutant inputs to aquatic bodies which can vary strongly dependent upon location, time, and the pollutant itself.
6.6 Fate and Behaviour
The final fate of a substance in air and the aquatic environment will help to determine which media (air, water, sediment or biota) is best monitored for its presence and effects.
For example, the log Kow value (octanol-water partition coefficient) is a measure of the hydrophobicity of an organic chemical, i.e. the binding potential of a chemical to the solid phase. Any substance with a log Kow of <3 is unlikely to be found in significant concentrations in the sediment. As the log Kow increases, the extent of binding to sediment increases. Examples of log Kow values of currently regulated organic substances are provided in Table 6.2: the values shown represent the highest values found in the literature (Nixon et al. 1996).
Table 6.4 Examples of log Kow values of currently regulated organic substances (Nixon et al. 1996).
Contaminant UK Red List EC List I Log Kow
PCBs * 7.75DDT (DDD, DDE) * * 6.36Aldrin * * 6.23Endrin * * 5.63Trifluralin * 5.38Hexachlorobenzene * * 5.31Pentachlorophenol * * 5.12Hexachlorobutadiene * * 4.78Dieldrin * * 4.55Trichlorobenzene * * 4.10Lindane * * 3.85Tri-organotins * 3.85Endosulfan * 3.83Fenitrothion * 3.38Azinphos-methyl * 2.99Atrazine * 2.63Malathion * 2.36Simazine * 2.34Dichlorvos * 2.291,2-Dichloroethane * 1.48
Time trend studies for PBDEs shows that the production history seems to correlate well with sediment core data. For example, pentaBDEs can be detected in cores deposited from about 1955 and decBDE from about 1970, which reflect the respective dates of their first production. Small quantities of decaBDEs have been found in the blood of both animals and humans but the retention half life is not known.
POP type substances such as hexachlorobutadiene and mercury have a high potential for long-range atmospheric transport and this would impact on the way in which the
69
An Evaluation of Approaches for Monitoring Emerging Hazardous Substances
substance is monitored. Levels of mercury vapour in the atmosphere away from point sources tend to approach a global background concentrations.
Other compounds such as dioxins PCBs and PAHs, while relatively involatile, tend to be more mobile through the atmosphere. Hence inputs into the OSPAR area may be dominated by atmospheric releases though at lower local water concentrations as deposition occurs to the full area of the marine area whereas riverine and direct inputs are of decreasing significance with increasing distance from the coast.
Degradation and deposition act as removal mechanisms which decrease the aquatic loading of pollutants. Principal chemical degradation occurs by reaction with the OH radical or ozone. UV degradation can be important for other species. Deposition occurs of both particle bound and vapour phase species but is typically more rapid for chemicals emitted from agricultural or industrial activities.
6.7 PBT Properties
The derivation of OSPAR’s List of Substances of Possible Concern for the marine environment has an initial selection step which by a worst case screening procedure identifies certain hazardous substances on the basis of their intrinsic hazardous properties of persistence, liability to bioaccumulate and toxicity (P, B and T).
The cut-off values for PBT characteristics of substances to included in the screening of substances for the OSPAR List are:
Persistency (P) Half life of 50 days in freshwater or the marine environment, and;
Liability to bioaccumulate (B) Log Kow >=4 or BCF>=500, and
Toxicity (T) Taq: acute L(E)C50 =<1 mg/l, long term NOEC =<0.1 mg/l or
Tmammalian: CMR or chronic toxicity.
Persistence
The persistence of a substance within the aquatic environment relates directly to its biodegradability. Therefore, substances which are not biodegradable will persist for long periods of time within the environment. For example the pesticide HCB is a substance which has not been produced for a long period of time but it is still recorded at levels which are above the determination limit in the UK aquatic environment.
Bioconcentration and Bioaccumulation
Some substances have a high tendency to bioaccumulate within organisms in the aquatic environment. For substances that have high bio concentration factors (BCFs) i.e. above 5000 it may be more effective to monitor them in biota as opposed to the water column. Furthermore, the potential for bioaccumulation can also be estimated from its partition co-efficient (log Kow) (see previous section).
70

An Evaluation of Approaches for Monitoring Emerging Hazardous Substances
In addition, in monitoring substances with a high potential for bioaccumulation it may prove more effective to monitor them in marine biota as opposed to fresh or estuarine waters due to factors such as greater contact time between a chemical and the recipient/sequestering species.
For example, bivalve molluscs are particularly well adapted to living in mud and sandy sediments with the adults exhibiting a sessile and sedentary lifestyle. A number of different feeding mechanisms have evolved in bivalves in response to the range of environmental conditions in which they are found. Some are deposit feeders whilst others are suspension feeders, but in both cases one finds their densities greatest at the mouth of estuaries where the supply of organically enriched sediment and water tends to be high. Because of their location and mode of feeding bivalves can concentrate many chemical substances at orders of magnitude greater than concentrations found in the adjacent environment, resulting in shellfish hygiene and toxicity problems for consumers. Internationally agreed safety limits for the consumption of some substances of concern have been set in the form of Provisional Maximum Tolerable Daily Intake (PMTDI). These are estimates of substance that can be ingested over a lifetime without appreciable risk to human health and are expressed on a body weight basis. PMTDIs have been set for a wide range of contaminants by a number of expert committees such as; i. the Joint Expert Committee on Food Additives (JECFA) of the Food and Agriculture Organisation of the World Health Organisation, ii. the Committee on Toxicity of Chemicals In Food, iii. Consumer Products and the Environment (CoT) and iv. the joint FAO/WHO meeting on Pesticide Residues (WHO, 1998a). There are no PMTDIs for PBDEs, PCBs, PAHs.
The Shellfish Hygiene Directive requires that chemical contaminants must not be present in shellfish in quantities that will exceed the PMTDI. For example, the JEFCA PTWI for Hg is 0.005 mg.kg-1.week-1, equivalent to 0.043 mg.day-1 for a 60 kg adult.
Determination of endocrine disruption in aquatic organisms from hazardous substances such as PCBs and pesticides through bioconcentration may also be appropriate for the determination of substance-specific effects. For example along the coast of the UK it is well documented that TBT, an antifouling agent causes infertility in dog-whelk snails Bryan et al (1987).
Although POP substances may be emitted in small concentrations their persistence and tendency to bioaccumulate in the environment can result in significant issues such as biomagnification i.e. for many hydrophobic chemicals there is a tendency for transfer of chemicals via the food chain, resulting in an increase of the internal concentration in organisms at higher levels.
Toxicity
Toxicity is also an important factor in establishing a monitoring strategy. For example substances characterised by high acute toxicity values are more likely to be water soluble and therefore should be monitored within the water column.
There is little information available about the toxicity of PBDE on organisms in the environment, although there appear to be some similarities with the toxic effects caused by PCBs. Studies have shown that commercially obtained penta- and tetra-BDE can affect the thyroid system of mammals as a result of inducing the production of enzymes in the liver. The liver also appears to be sensitive and for penta-BDE a no-observed-
71

An Evaluation of Approaches for Monitoring Emerging Hazardous Substances
adverse-effect level of 1 mg.kg-1day-1 has been determined. The exposure range for humans via food has been calculated at between 0.2 and 0.7 mg.day-1.
6.8 Usage and Detection
Understanding the use/source of a hazardous substance can assist in determining its pathways to the aquatic environment and in establishing a strategy for monitoring emissions, discharges or losses. The use of some substances is widespread (e.g. lead), others have restricted uses in certain products and some are discharged or emitted unintentionally (e.g. PAHs, Dioxins, PCBs). Current production and import volumes and the actual use/source of a substance provides important additional information for the design of an appropriate monitoring strategy.
The implications of usage on the development of an appropriate strategy for a specific substance is highlighted by TBT. TBTs major use is as an anti-fouling agent on large ships and therefore monitoring tends to be focused in marine areas.
However, information on the use and presence of hazardous substances within a river basin (that is one of the pathways into the marine environment) may not always be readily available. At present with England and Wales there is the Pollution Inventory established to meet the requirements of national IPC policy and the IPPC Directive. The scope of this inventory may well have to be expanded to meet the needs of the WFD in terms of characterising significant pressures within River Basin Districts.
The possibility of detection for a substance in the environment will also determine the way in which it can be monitored. For example if a substance is far below the limit of detection in the aquatic environment it cannot be monitored directly in only one compartment. Therefore monitoring in more than one compartment may be required (e.g. sediment and biota). Alternatively, if a substance is well above the limit of detection environmental monitoring will be directly feasible.
6.9 Spatial and temporal scale of Monitoring / Compartments
Determination of temporal and spatial scales in production and use are important to enable the monitoring programme to be targeted accordingly. For example if a hazardous substance tends to be lost to the environment primarily through discharge and its use is localised then monitoring effort is likely to be focused downstream of the discharge within the catchment where it is used.
Temporal issues can be highlighted by the deposition in sediments of some substances which do not bioaccumulate and have long half lives. For substances having these properties monitoring may only be required to be undertaken bi-annually. The application of pesticides to agricultural land tends to occur at specific times of the year and monitoring should be targeted to take account of periods of application. When undertaking biological monitoring with respect to molluscs monitoring should take account of factors such as spawning.
The application of sheep dip to agricultural land also provides a good example of the importance of spatial and temporal issues when undertaking monitoring. Because sheep dip is only applied in sheep farming areas at pre-defined time periods, monitoring can be targeted accordingly.
72

An Evaluation of Approaches for Monitoring Emerging Hazardous Substances
A number of air-monitoring programmes are run throughout the UK, on a variety of temporal and geographical resolutions. UK-wide air quality monitoring networks are run by a number of different contractors for Defra and the devolved administrations. The aim of this monitoring is in most cases to evaluate UK compliance with regards to the statutory or moral requirements of EU Directives, international obligations and UK-specific legislation and strategies. Across the UK, 1500 sites monitor a range of air pollutants using both automatic and non-automatic networks.
Automatic networks produce hourly concentrations for the ‘traditional’ air pollutants such as NOx, SO2 and particulates and which generally fall outside the scope of this work. Non-automatic networks have been set up in the UK to provide a wide range of analyses for a range of chemicals, or groups of chemicals, although measurements are available less frequently than for the automatic monitoring networks i.e. typically daily, weekly or monthly. Such networks provide information on the concentrations of chemicals such as toxic organic micro-pollutants (e.g. dixoins, PAHSs and PCBs), trace elements including heavy metals, and benzene. Results from the UK air monitoring networks are available from www.airquality.co.uk. In addition to the UK-wide monitoring networks, specific air-monitoring activities on a limited or site-specific basis are performed by local authorities, and by industry. For those industries incorporating Part A1 activities and installations regulated by the Environment Agency under Statutory Instrument 2000 No 1973 Pollution Prevention and Control (England and Wales) Regulations 2000 (PPC Regulations), an assessment and reporting of pollutant releases is required. This information is publicly available through the Environment Agency’s Pollution Inventory web-site.
6.10 Monitoring Cost
Cost-effectiveness of monitoring is likely to be influenced by the relevant policy driver requirements, environmental pathway and the fate and behaviour of a substance. For example, if a substance is water soluble then sediment monitoring would not be appropriate. Alternatively a substance may be a very hydrophobic as well as being characterised by high bioconcentration factors. Therefore it may prove more to be more cost-effective to monitor for this substance in sediments as opposed to biota.
The determination of the appropriate levels of precision and confidence should also be considered in relation to cost-effectiveness. For example, UK monitoring programmes generally require a confidence level of 95%, however, scope is available to trade off precision against confidence to produce a more congenial statistical specification for a given amount of sampling effort (Littlejohn et al 2002). However, Ellis (1989) points out that reducing the confidence level much below 90% represents a spurious saving. There is nothing to be gained by having a high degree of precision if there is only a poor level of confidence that it will actually be achieved.
The cost of running UK-wide air-monitoring programmes is not insignificant. For example, the air pollution monitoring performed using the automatic and non-automatic networks costs Defra and the devolved administrations ca. £4 million per year. Monitoring campaigns for individual chemicals will vary in cost depending on whether technical method development is required and on the geographical scope of monitoring required. As an indicative value, a recent three month sampling programme funded by Defra to investigate the concentration of MCCPs and other trace organics in air samples collected from remote rural locations in western Ireland and north west England, cost around £50,000.
73

An Evaluation of Approaches for Monitoring Emerging Hazardous Substances
There are 24 separately managed marine pollution monitoring programmes across the regions of the UK (see Table 6.3), which ensure compliance against 9 EC Directives and national regulatory drivers (e.g. FEPA). These programmes are managed in the main by 6 agencies (DoENI, SEPA, EA, CEFAS, FRS and DARD-NI) who, when combined, have responsibility for the collection and analysis of approximately 2,700 samples at marine and estuarine sites at a total annual cost of about £5 million. This figure represents a gross estimate of the spend associated with the direct collection, analysis and assessment of the samples collected under the programmes identified. However, it does not include other significant costs such as local authority input, charges for buildings and other overheads. It is also important to appreciate that there is a very clear separation between programmes which protect the health of the public and those that protect the quality of the environment as exemplified by the Shellfish Waters and Shellfish Hygiene Directives, most compliance monitoring is characterised by measuring specific critical chemical determinands frequently at a large number of sites, with relatively low levels of precision. The average sample cost across all compliance programmes is about £1,700 annually. Another characteristic of compliance monitoring is the relatively short reporting intervals following sampling, which in some cases is weekly, but in all cases is annually or less, this is especially true for the public health protection monitoring programmes.
By contrast there are 14 separetly maganegd quality status programmes (not including the WFD) which serve OSPAR and the Habitats Directive (see Table 6.4). These are delivered by 8 organisations which account for about 300 stations at an annual cost of about £3 million. Although there are 14 separately financed and managed quality status programmes, 9 of these are coordinated and effectively represent a single integrated programme known as the National Marine Monitoring Programme which provides quality status data to comply with the OSPAR JAMP. Compared to compliance monitoring, the NMMP undertakes a comprehensive assessment of the chemical, biological and physical characteristics of the environment (see NMMP Green Book) at relatively few sites. The advantage of this approach is that it provides a means of conducting integrated analysis which helps determine the causality of change at the community level, and therefore allows the ‘health’ and function of an ecosystem to be estimated. It also improves our understanding of how ecosystems work and respond to pollution events. In addition, the results of the NMMP provide valuable data for the development and validation of ecosystem models presently being researched and developed. This results in the average site/sample assessment costs being high compared to the compliance type monitoring, £10,000 per site/sample compared to £1,700 per sample, respectively. However, the NMMP, concentrates on depositional environments with a history of contamination and therefore does not lend itself to the assessment of non-contaminated sites or sites supporting coarse sediment habitats. In this respect the equivalent nature conservation quality status programme, undertaken to comply with the Habitats and Wild Birds Directives (92/43/EEC & 79/409/EEC respectively), in part fills this gap, but is itself limited by a lack of biological effects and chemical monitoring. Again, the Water Framework Directive which introduces an integrated and co-ordinated approach to water quality management will support a ‘quality status’ monitoring programme with associated appropriate standards to ensure Directive compliance, but it will lack any routine biological effects monitoring. Clearly, no one programme covers all the requirements for comprehensive quality status assessments.
Where monitoring for a specific substance is required by more than one policy driver, it may be cost effective to develop an integrated monitoring strategy to address the
74

An Evaluation of Approaches for Monitoring Emerging Hazardous Substances
requirements of each policy driver. This however is only possible where flexibility in the approach is permitted within the requirements of the driver.
Table 6.5 UK marine pollution compliance monitoring programmes2
Pollution Compliance Monitoring ProgrammesAgency Programme Drivers Reporting Sites
CEFAS 1 Disposal Sites FEPA 1 Year 6
CEFAS 2 Shellfish Hygiene Directive monthly 406
CEFAS 3 Shellfish Waters Directive (phytoplankton) weekly 22
CEFAS 4 Shellfish Waters Directive (toxins) weekly 79
DARDNI 5 Shellfish Waters Directive (toxins) monthly 380
DoENI 6 Bathing Waters Directive 2 weeks 27
DoENI 7 Dangerous Substances Directive 1 year 40
DoENI 8 Disposal Sites FEPA 1 year 2
DoENI 9 Shellfish Hygiene Directive 3 months 31
DoENI 10 Urban Waste Water Directive 1 - 4 years 12
EA 11 Bathing Waters Directive 1 year 446
EA 12 Chlor-alkali Directive 1 year 13
EA 13 Dangerous Substances Directive 1 year 350
EA 14 Shellfish Hygiene Directive 1 year 119
EA 15 Titanium 1 year 40
EA 16 Urban Waste Water Directive 1 - 4 years 51
EA 17 Radioactive Substances 1 year 450
FRS 18 Disposal Sites FEPA 1 year 3
FRS 19 Shellfish Waters Directive (phytoplankton) weekly 30
FRS 20 Shellfish Waters Directive (toxins) weekly 70
SEPA 21 Bathing Waters Directive monthly 30
SEPA 22 Dangerous Substances Directive 1 year 47
SEPA 23 Shellfish Hygiene Directive 1 year 32
SEPA 24 Urban Waste Water Directive 1 - 4 years 30
Table 6.6 UK Marine Quality Status Monitoring Programmes3
Quality Status MonitoringAgency Programme Drivers Reporting Sites
CEFAS 1 NMMP - Fish Disease 1 year 18
FRS 2 NMMP - Fish Disease 1 year 5
DARDNI 3 NMMP - Fish Disease 1 year 3
2 For further details refer to Marine Pollution Monitoring Management Group (MPMMG 2003)
3 For further details refer to Marine Pollution Monitoring Management Group (MPMMG 2003)
75

An Evaluation of Approaches for Monitoring Emerging Hazardous Substances
DoENI 4 Estuarine 1 year 62
CEFAS 5 NMMP - OSPAR 3 years 40
DARDNI 6 NMMP - OSPAR 3 years 7
DoENI 7 NMMP - OSPAR 3 years 4
EA 8 NMMP - OSPAR 3 years 40
FRS 9 NMMP - OSPAR 3 years 6
SEPA 10 NMMP - OSPAR 3 years 11
MBA 11 MarClim & Fish 1 year 20
JNCC 12 Habitat/SACs 6 years 70
JNCC 13 Habitat/Wintering Birds 1 year 6
JNCC 14 Habitat/Breeding Birds 1 year 7
76

An Evaluation of Approaches for Monitoring Emerging Hazardous Substances
7. TASK 5 - ESTABLISHING A UK WIDE MONITORING STRATEGY FOR HAZARDOUS SUBSTANCES
7.1 Task Objectives
The objective of this task was to propose an outline strategy for monitoring emerging hazardous substances, based on the findings from Tasks 1-4, and list the steps needed to implement this.
The following sections outline how the monitoring strategy has been developed and the steps involved in applying this approach.
7.2 Approach to Strategy Development
7.2.1 Issues considered
The approach to the development of a UK wide strategy on monitoring hazardous substances has involved gaining an understanding of the main objectives and targets associated with the relevant policy drivers, as these will ultimately determine if a substance has to be monitored, how this monitoring will be undertaken and what, if any are the legal requirements (e.g. cessation targets, EQSs etc).
The emphasis of this study is on development of a monitoring strategy for emerging hazardous substances. Therefore, the ‘decision tree’ has been developed based on identification and assessment of the key policy drivers that are likely to influence monitoring in upcoming years as a result of the identification of new substances or revision of existing hazardous substances lists.
Whilst determination of the mandatory requirements of the policy driver is essential, consideration of the environmental and substance specific properties will also be required where no clear strategy for monitoring has been identified (e.g. appropriate medium to monitor, spatial and temporal scales, sources or loads etc).
Due to the variation in the pathways and properties of individual hazardous substances the development of a monitoring strategy needs to consider substance-specific issues. Therefore, it was considered not appropriate to develop a generic monitoring strategy for all groups of hazardous substances, rather to concentrate on individual substances or groups of substances. This approach is similar to that adopted by ASMO in development of the tool HT-1a (Guidance on a common framework for the establishment of the monitoring strategies for each substance on the OSPAR List of Chemicals for Priority Action).
77

An Evaluation of Approaches for Monitoring Emerging Hazardous Substances
7.2.2 Emerging Substances
The main drivers in terms of emerging hazardous substances appear to be the Water Framework Directive and OSPAR’s Strategy with regard to Hazardous Substances. These are linked as it will be a requirement for OSPAR initiatives to be considered when revising the Priority Substance and Priority Hazardous substances under the Water Framework Directive. Thus Decision 2455/2001/EC establishing the list of priority substances in the field of water policy and amending Directive 2000/60/EC states in paragraph 15 of the preamble.
“The identification of the priority hazardous substances on the list of priority substances should be made with regard, inter alia, to hazardous substances agreed for phase-out or for cessation of discharges, emissions and losses in international agreements, such as hazardous substances which are agreed for phase-out in inter- national fora including IMO, UNEP or UN-ECE; hazardous substances which are agreed for cessation of discharges, emissions and losses as a priority in the OSPAR Convention, including hazardous substances identified by the OSPAR DYNAMEC Selection I or III; hazardous substances which give rise to an equivalent level of concern as substances that are persistent, toxic and liable to bioaccumulate (PTBs),such as endocrine disrupters identified under the OSPAR Strategy; and heavy metals included in the Protocol on Heavy Metals of the UN-ECE Convention on Long-Range Transboundary Air Pollution and selected for priority action under OSPAR 1998 and 2000,which give rise to an equivalent level of concern as PTBs.”
The first priority list must be reviewed within 4 years of adoption of the Water Framework Directive that is by 22 December 2004. It is intended that a revised COMMPS procedure is again used in this selection. The Commission were due to have reviewed the status of the 14 substances identified as potential priority hazardous substances by the end of 2002. This they were unable to do because of resource problems. They now intend to complete this by end of September 2003.
The OSPAR List of Substances of Possible Concern is a dynamic working list and will be regularly revised, as new information becomes available (refer to Annex III and http://www.sopar.org). This may lead to exclusion of substances present on the current version of the OSPAR List of Substances of Possible Concern and to inclusion of other substances if data on persistence, toxicity and liability to bioaccumulate (or evidence that they give rise to an equivalent level of concern) show that they should be added. The List was last revised on 28 June 2002.
The List of Substances of Possible Concern is used to select a List of Chemicals for Priority Action. Once substances are on the Priority Action List then further characterisation of the substance is required including identification of sources, environmental pathways, assessment whether the substance represents a local or a widespread problem and the identification of relevant measures to deal with the problem. This characterisation is usually led by one of OSPAR’s signatory countries, and information reported as ‘background’ documents. There are some 45 hazardous substances (or groups of substances) on the 2002 List of Chemicals for Priority Action, 32 of which have background documents completed or being prepared.
It will of course be in the interest of DEFRA to follow developments in both of these policy drivers, in particularly in terms of substances which might require some supportive monitoring information when assessing the extent and risk of any problems
78

An Evaluation of Approaches for Monitoring Emerging Hazardous Substances
arising from particular substances. The proposed decision tree approach can help in designing appropriate monitoring strategies.
The European Commission is also developing a generic strategy to deal with the problem of endocrine disrupting substances COM(1999)706. The strategy has short, medium and long term actions. The short-term actions are focused on the need to gather up to date information and to the identification of substances for further evaluation. In the long term it is envisaged that existing laws and legislation concerning chemicals might need to be amended and adapted to address endocrine disrupting substances. Priority is being given to conducting and in depth study of 12 candidate substances. Nine of the chemicals are industrial or other substances for which there is scientific evidence of endocrine disruption or potential endocrine disruptions and which are neither restricted nor currently being addressed under existing Community legislation. In addition, three synthetic/natural hormones, oestrone, ethinyl oestradiol and oestradiol, will be evaluated in order to gather up-to-date evidence of environmental exposure and effects related to these substances. The nine substances are:
140-66-9 4- tert- Octylphenol99-99-0 4- Nitrotoluene108-46-3 Resorcinol120-83-2 2, 4 Dichlorophenol59- 50- 7 4- chloro- 3- methylphenol 1675- 54- 3 2, 2’- bis( 4-( 2, 3- epoxypropoxy) phenyl) propane - 2,2’, 4, 4’- Tetrabrominated diphenyl ether90- 43- 7 o- phenylphenol 75- 15- 0 Carbon disulphide
Octylpenol and the brominated dipheny ethers are on the WFD Priority Substance List. The three hormones will also potentially occur in the aquatic environment.
It is also intended that additional chemicals will be added to the UNEP POPs Convention sometime in the future. Draft criteria have been developed by a Criteria Expert Group (CEG) for the selection of future substances and on the basis of a risk assessment for PentaBDE, a proposal may be made for future inclusion of this substance (RPA 2000). There may be additional monitoring requirements arising from the EC Chemical Policy and its implementation as well as from the national UK list of substances of conern.
7.2.3 Development of a monitoring strategy framework (decision tree)
A preliminary substance specific monitoring strategy has been developed based on the decision tree approach. The preliminary decision tree shown in Figure 7.1 has been developed in consideration of the key policy drivers and substance specific issues identified in section three.
A checklist of relevant information has been developed to ensure the appropriate information is obtained to enable the elaboration of a monitoring strategy for a specific substance (Table 7.1). It is advised that as the checklist be completed as far as possible, based on existing information, for each substance. Once all available information has been obtained and recorded, the substance can be taken through the decision tree shown in Figure 7.1 to determine the appropriate monitoring strategy.
79

An Evaluation of Approaches for Monitoring Emerging Hazardous Substances
Table 7.7 Checklist template for development of a monitoring strategy for individual substances
MONITORING STRATEGY CHECKLIST OF AVAILABLE INFORMATION1. General Information
Substance nameCAS NumberInformation sources
2. Policy drivers
Under what policy driver/s is monitoring of the substance likely to be required as part of emerging obligations?Is current monitoring sufficient to comply with the requirements of the policy driver/s? If no, briefly explain (e.g. requires higher frequency, greater number of sites etc)
None/some/type of monitoring
What are the main objectives/targets of the policy driver/s?Briefly outline the monitoring requirements for each driver
3. Production and use
Is the substance produced in the UKIs the substance used in/imported into the UK?Is the substance likely to be present from long-range atmospheric transportation?Has the substance been used in the UK in the past?List the main usesList the main entry routes/sources to the environmentOutline the main historical and current usage patterns
4. Substance properties
What are the main pathways into the environment?What medium (or media) is the substance most likely to be found? (water, air, sediment, biota)Is the substance toxic to biota? If yes, briefly explain (e.g. acute/chronic)Is the substance persistent? Is the substance likely to bioaccumulate?Are there any transformation processes that may enable re-mobilisation into the environment? If yes, briefly explain.
5. Analytical Information
Are there suitable analytical (chemical/biological) methods? Provide an estimate of costs associated with analysis
80

An Evaluation of Approaches for Monitoring Emerging Hazardous Substances
6. Existing monitoring information
Is the substance currently monitored in the UK? If yes, provide details.Is the substance currently monitored in the UK? If yes, provide brief detailsAre there existing EQSs used in the UK? Provide detailsBased on results of monitoring, is the substance detected in the environment? If yes, is it detected in significant quantities?Are any predictive models available/used to assess/determine the substances likely environmental concentrations?
7. Monitoring strategy
Where should monitoring be undertaken to satisfy driver?
air – source monitoring No/yes/number of sources air – environmental monitoring No/yes/number of locations water – source monitoring No/yes/number of sources water – load monitoring No/yes/number of locations water - environmental monitoring –
categoryRivers/lakes/estuaries/marine waters
water – environmental monitoring - compartment (contaminant concentrations)
Water column/sediment/biota/number of locations
water – environmental monitoring - biological community structure
No/yes/number of locations
water – ecotoxicological monitoring No/yes/water/sediment/biota/number of locations
How much precautionary/surveillance monitoring should be undertaken? (e.g. how confident are you in the available information and the resultant strategy?- The lower the confidence, the higher the need for a precautionary approach).What are the required levels of confidence and precision to be achieved in the monitoring results?What are the monitoring costs? (e.g. human resources, analytical costs, monitoring equipment etc)? If no absolute values are available then relative costs should be provided.Can the required monitoring be incorporated in current monitoring programmes. If yes by how much would this reduce effort/costs?Recommended monitoring strategy (results of the decision tree).
81

An Evaluation of Approaches for Monitoring Emerging Hazardous Substances
Figure 7.4 Preliminary decision tree for developing a monitoring programme for hazardous substances
82

An Evaluation of Approaches for Monitoring Emerging Hazardous Substances
7.3 Examples of Application of the Decision Tree
7.3.1 Choice of substances for testing decision tree
Four substances were selected to test the preliminary decision tree approach demonstrated above, namely:
Mercury (control substance);
Atrazine;
Clotrimazole; and,
Polybrominated diphenylethers (PBDE).
The substances were selected as representative of a range of pollutant types and properties covering each of the three major pathways – freshwater, marine and air. In order to test the decision tree it was necessary to select a control substance (mercury) that is relevant for each pathway, has a considerable amount of existing monitoring data and information on the chemical properties.
An overview of the substances selected and main pathway/s is provided in Table 7.2.
Table 7.8 Overview of substances selected for testing the decision tree
Substance Type Fresh Marine Air Comments
Mercury Heavy Metal X X X Selected as a control/benchmark. Good monitoring data for all matrices. Included on both WFD and OSPAR lists
Atrazine Agricultural Pesticide
X X On OSPAR’s 1998 List of Candidate Substances, not on List for Priority Action. WFD Priority Substances and for review as a Priority Hazardous Substance. Good monitoring data.
Clotrimazole Pharmaceutical fungicide
X X Not on WFD lists, but on revised OSPAR list of Chemicals for Priority Action.
PBDE Brominated diphenyl ethers
X On OSPAR list of chemicals for Priority Action and WFD Priority Substance (pentabromo-biphenylether is a Priority Hazardous Substance)
83

An Evaluation of Approaches for Monitoring Emerging Hazardous Substances
The following sections demonstrate practical application of the decision tree approach for the four selected substances.
7.3.2 Mercury
Table 7.9 Checklist template for development of a monitoring strategy for Mercury
MONITORING STRATEGY CHECKLIST OF AVAILABLE INFORMATION1. General InformationSubstance name MercuryCAS Number 7439-97-6Information sources Haskoning (2002), AEAT (2002), DEFRA (2003),
WHO (1976)
2. Policy driversUnder what policy driver/s is monitoring of the substance likely to be required as part of emerging obligations?
WFD, OSPAR, NSC, UNECE-LCRTP, EU Air Quality Directive and daughter directives, Air quality strategy.
What are the main objectives/targets of the policy driver/s?
Reduce emissions, discharges and losses of mercury.Reduction/cessation targets (e.g. NSC – 70% by 1995), Compliance with EU EQSs
Briefly outline the monitoring requirements for each driver
See Table 3.1
3. Production and useIs the substance produced in the UK No (produced in Finland and Spain)Is the substance used in/imported into the UK?
Yes.
Is the substance likely to be present from long-range atmospheric transportation?
Yes
Has the substance been used in the UK in the past?
Yes.
List the main uses Dentistry (amalgam), measuring and control equipment, batteries, fluorescent lamps, chlo-alkali industry, fire works and munitions
List the main entry routes/sources to the environment
Industry, coal combustion processes, landfill, incineration of waste, accidental spillage/breakage of mercury containing equipment, illegal disposal, cremation of bodies (containing dental amalgam), natural gas processing.
Outline the main historical and current usage patterns
Production, storage and supply of Hg based pesticides banned in 1992. No longer used for wood preservation, marine anti-fouling paints, textile treatment and industrial wastewater treatment. Small residual use likely, but Hg from these products unlikely to represent signification source.Still used for certain industrial processes etc (see above). Bans/restrictions have been placed on some uses, but residual in environment (e.g. dentistry/landfill). Emissions estimated to have declined by approx
84

An Evaluation of Approaches for Monitoring Emerging Hazardous Substances
75% between 1970-1998 (NAEI), mainly due to controls/replacement of mercury cells and reduction in coal use.
4. Substance propertiesWhat are the main pathways into the environment?
Hg and compounds may be emitted to air, land and water. Atmosphere is major transport route (8.5 tonnes in 2000). Mostly present in atmosphere in unreactive form as a gaseous element, but long atmospheric lifetimes (>1 yr) means can travel long distances. 0.52 tonnes to water (main sources chlor-alkali (46%), WWT (21%), Steel Industry (17%)). No data on releases to land.Main pathway to humans is through ingestion of food and not via inhalation.
What medium (or media) is the substance most likely to be found? (water, air, sediment, biota)
Likely to be found in water, sediment and biota (fish, mammals). May accumulate in sediments from diffuse runoff (atmospheric deposition, sewage sludge).Found in low concentrations in air.
Is the substance toxic to biota? If yes, briefly explain (e.g. acute/chronic)
Extremely toxic (acute and chronic). Main impact to humans associate with Methyl mercury (identified as possible carcinogen). Poisoning associated with tremors, gingivitis, minor psychological changes, spontaneous abortion and congenital malformation.
Is the substance persistent? Yes. Element which cannot be degraded into harmless products, therefore will be permanently recycled in physical, chemical and biological processes in environment.
Is the substance likely to bioaccumulate? Yes. Methyl-mercury taken up by fish. Accumulates most efficiently in predatory species e.g. swordfish, shark and marlin. Methyl-mercury non-toxic to fish but represents greatest risk to humans through ingestion.Bioconcentration Factor (BCF) ranges between 5-800 depending on species of fish and Hg compound.
Are there any transformation processes that may enable re-mobilisation into the environment? If yes, briefly explain.
Relatively stable in anaerobic environment. Can be remobilised.Elemental mercury relatively unreactive.
5. Analytical InformationAre there suitable analytical (chemical/biological) methods?
Yes. Flameless Atomic Adsorption – favoured method by WHO (1976).
Provide an estimate of costs associated with analysis
Toxic substances in water approx £16 per sampleToxic substances in sediment/biota £40 per sample.Higher analytical cost balanced out by required sampling frequency (e.g. min 12/yr for water, 1/yr for sediment and biota)
6. Existing monitoring informationIs the substance currently monitored in the UK? If yes, provide details.
Yes
Is the substance currently monitored in the Yes. Monitored in food, air, water, sediment soil
85

An Evaluation of Approaches for Monitoring Emerging Hazardous Substances
UK? If yes, provide brief details and wild mammalsAre there existing EQSs used in the UK? Provide details
Inland water - 1µg/L (total Hg)Estuarine water – 0.5µg/L (dissolved Hg)Seawater – 0.3 µg/L (dissolved Hg)Fish – 0.3 mg/kg wet flesh (under revision)
Based on results of monitoring, is the substance detected in the environment? If yes, is it detected in significant quantities?
WQ data from EA National Environmental Database Service showed a limited no. (between 0-8 each year) of freshwater, estuarine or coastal EQS exceedences since 1990. Problem sites not consistent between years. Canal sites in Cheshire near former Chlo-Alkali plant have been a concern. EU position paper on mercury – low concentrations in drinking water.Total gaseous Hg generally found in low concentrations in air (near LoD). No breaches of proposed 4th Air Quality Directive found. Lee et al 2001 – summary of Hg concentrations in air. Limited data collected since 1970s.Limited data on Hg concentrations in sediment. Extensive studies in Mersey estuary and River Rother due to presence of chloro-alkali plant. Hg accumulation in sediment studies since 1974. General decreasing trend observed, although not substantial.Limited data on Hg concentrations in soil. Some increases in background levels around near industrial sites.Bioaccumulation study of methyl-mercury undertaken in Mersey estuary. Study found benthic organisms contained concentrations between 10-100 times greater than sediments, although no measures above statutory guideline for food. Food Standards Agency – 2 monitoring programmes. Early results on concentrations in imported fish and shellfish led to warnings that consumption of swordfish, shark and marlin be avoided by pregnant women and children under 16.Mammalian concentrations analysed by Joint Nature Conservation Committee (JNCC). General decline in liver contamination of birds between 1963-1997. Concentrations highest in predatory birds but found in quantities too low too impact on breeding success.
Are any predictive models available/used to assess/determine the substances likely environmental concentrations?
Most commonly used model to describe air-water exchange mechanisms two-film model, although surface renewal and boundary layer sometimes used.
7. Monitoring strategyWhere should monitoring be undertaken to satisfy driver?
air – source monitoring Yes air – environmental monitoring No water – source monitoring No: Not needed for current drivers – may be for
86
An Evaluation of Approaches for Monitoring Emerging Hazardous Substances
WFD. water – load monitoring Yes, required for OSPAR RID and North Sea
Conference commitments – Harmonised monitoring network stations (number?)
water - environmental monitoring – category
All categories (rivers, lakes, marine waters) in principle – depending on location of discharges.
water – environmental monitoring - compartment (contaminant concentrations)
Water column for assessment of compliance with EQS. Locations: 119 to surface waters in 1995, 8 of which had details of size and industrial sector. (565 discharges to sewer, 62 of which had details of size and industrial sector.)
water – environmental monitoring - biological community structure
No
water – ecotoxicological monitoring NoHow much precautionary/surveillance monitoring should be undertaken? (e.g. how confident are you in the available information and the resultant strategy?- The lower the confidence, the higher the need for a precautionary approach).
None required, extensive information on drivers, sources and fate and behaviour.
Is current monitoring sufficient to comply with the requirements of the policy driver/s? If no, briefly explain (e.g. requires higher frequency, greater number of sites etc)
Yes.
What are the required levels of confidence and precision to be achieved in the monitoring results?
Non specified – EQS expressed as annual averages.
What are the monitoring costs? (e.g. human resources, analytical costs, monitoring equipment etc)? If no absolute values are available then relative costs should be provided.
Well established methods in place – relative low.
Can the required monitoring be incorporated in current monitoring programmesIf yes by how much would this reduce effort/costs?
Yes, particularly in terms of RID. EQS assessment is however discharge specific.
Recommended monitoring strategy (results of the decision tree).
Monitoring should be focussed around usage areas (e.g. chloro-alkali plants, landfills etc), although consideration should also be given to distribution via long distance atmospheric transport.Monitoring of concentrations in water downstream of each discharge and at the harmonised monitoring network stations to determine riverine loads. Monitoring of direct discharges containing mercury downstream of harmonised monitoring network stations.
87
An Evaluation of Approaches for Monitoring Emerging Hazardous Substances
Figure 7.5 Proposed monitoring strategy for Mercury
88
An Evaluation of Approaches for Monitoring Emerging Hazardous Substances
7.3.3 Atrazine
Table 7.10 Checklist template for development of a monitoring strategy for Atrazine
MONITORING STRATEGY CHECKLIST OF AVAILABLE INFORMATION
1. General InformationSubstance name AtrazineCAS Number 1912-24-9Information sources WRc (1996)
EA 1998, EA 1999Oregon University
2. Policy driversUnder what policy driver/s is monitoring of the substance likely to be required as part of emerging obligations?
On OSPAR’s 1998 List of Candidate Substances, not on List for Priority Action. WFD Priority Substances and for review as a Priority Hazardous Substance.
What are the main objectives/targets of the policy driver/s?
Reduction/ phase out
Briefly outline the monitoring requirements for each driver
See Table 3.1
3. Production and useIs the substance produced in the UK No. UK production ceased in mid 90s. Is the substance used in/imported into the UK?
Yes. All Atrazine used in UK is imported. Sales to agriculture around 100-200 tonnes/year.
Is the substance likely to be present from long-range atmospheric transportation?
Spray application close to ground only
Has the substance been used in the UK in the past?
Yes
List the main uses Broad spectrum herbicide for total vegetation control. Main non-agricultural users are local authorities, industry and transport (e.g. British Rail). Some minor domestic applications (paths, driverways).
List the main entry routes/sources to the environment
Surface diffuse runoff from treated (agricultural and non agricultural) sitesSoil leaching and drainage from treated sitesSpray driftEquipment cleaning and disposal of containers.No production plants in UK and formulation plants produce negligible waste, therefore point sources only minor source.
Outline the main historical and current usage patterns
Used as a broad spectrum herbicide for both pre- and post- emergence control of annual grasses and broad leaved weeds in agriculture, horticulture and forestry. In UK approved for use in maize, sweetcorn and raspberry. Approval for professional use on non-cropped land was revoked in 1992. Main users historically were local authorities, industry and transport (e.g. British Rail).
89

An Evaluation of Approaches for Monitoring Emerging Hazardous Substances
Around 80% non-agricultural applications between March-August. Most usage in South East England (~ 35%).Typical agricultural application 0.6 to 2.5 kg/ha and remains active in soil for 4-6 months. Replacement products developed. Increased maize production in UK may offset decline in use due to alternative products.
4. Substance propertiesWhat are the main pathways into the environment?
Main pathways include spray drift, surface water run-off and groundwater leaching.Inputs from surface water runoff only occurs for a few weeks after application. However, due to persistency in soil, contamination via groundwater can occur long after applications have stopped.
What medium (or media) is the substance most likely to be found? (water, air, sediment, biota)
Mainly found in soil, sediment and water. Negligible volatilisation and deposition,Adsorption to sediment and suspended clay can remove significant amounts from solution (20-60%).Persistence in water dependent on local conditions. More rapidly removed from saline water than fresh. Estimated half lives of 4-8months in lakes and ponds, but likely to be less persistent in flowing waters.
Is the substance toxic to biota? If yes, briefly explain (e.g. acute/chronic)
Yes. Algae and plants are particularly sensitive, but animals can be affected thorough secondary effects such as loss of habitat and food.
Is the substance persistent? Half-life varied but generally in the order of 3 weeks to 3 months, although some as long as 12 months have been reported. Atrazine is considered to be highly persistent in soil.
Is the substance likely to bioaccumulate? The relatively high solubility and low octanol-water partition coefficient suggests it has low-to-moderate tendency to bioaccumulate in biota which is confirmed by bioaccumulation factors (BCF) in laboratory experiments and field studies. No food chain biomagnification shown to occur.
Are there any transformation processes that may enable re-mobilisation into the environment? If yes, briefly explain.
Stable in pure solution with estimate half life in sterile neutral water of 1800 yrs. H and CO2 major hydrolysis catalysts and increases at higher pH. Degradation processes enhanced by light and in presence of organic material. Biodegraded (slowly) by range of aquatic algae, bacteria and fungi and also some higher plants and animals (e.g. resistant plant species and certain crustaceans).
5. Analytical InformationAre there suitable analytical (chemical/biological) methods?
Yes
90

An Evaluation of Approaches for Monitoring Emerging Hazardous Substances
Provide an estimate of costs associated with analysis
£10 - £50 (immunoassay test kits are available for screening water)
6. Existing monitoring informationIs the substance currently monitored in the UK? If yes, provide brief details
Yes
Are there existing EQSs used in the UK? Provide details
YesFreshwater 2g/l (annual average); Saltwater 2g/l (annual average);
Based on results of monitoring, is the substance detected in the environment? If yes, is it detected in significant quantities?
Atrazine widespread in surface waters in UK (generally in low concentrations). Detected in over half rivers sampled in 1986-87 (WRc 1996). Most groundwater monitoring has been undertaken at sites of expected contamination. Reported in most GW samples (90%) in concentrations ranging between <0.01 to 0.5µg/L.Concentrations in marine environment likely to be lower as entry restricted to river inputs, sewage and industrial discharges and direct losses from application at coastal sites. Was detected in 5 out of 7 estuaries.DSD List II substances monitored routinely and compared against EQSs. Atrazine monitored at about 2,000 surface freshwater and 580 groundwater sites throughout England and Wales by EA. Results assessed against EQSs and expressed as annual averages. Results for 1995 showed that 2% of fresh water samples exceeded 0.1 µg/L in 2001, and 5% of groundwater samples exceeded 0.1 µg/L in 1995. EA monitors coastal and estuarine waters for DSD List II substances. Only required to monitor sediments for List I substances.
Are any predictive models available/used to assess/determine the substances likely environmental concentrations?
Yes – (e.g. fugacity models to predict mass distribution in soil and water).
7. Monitoring strategyWhere should monitoring be undertaken to satisfy driver?
air – source monitoring No air – environmental monitoring No water – source monitoring Yes – sales statistics, application rates water – load monitoring Yes water - environmental monitoring –
categoryAll surface water categories (river, lakes, estuaries, marine)
water – environmental monitoring - compartment (contaminant concentrations)
Water Column and sediment
water – environmental monitoring - biological community structure
No
water – ecotoxicological monitoring NoHow much precautionary/surveillance monitoring should be undertaken? (e.g. how
None required, extensive information on drivers, sources and fate and behaviour.
91

An Evaluation of Approaches for Monitoring Emerging Hazardous Substances
confident are you in the available information and the resultant strategy?- The lower the confidence, the higher the need for a precautionary approach).Is current monitoring sufficient to comply with the requirements of the policy driver/s? If no, briefly explain (e.g. requires higher frequency, greater number of sites etc)
Yes for surface waters. Additional monitoring recommended to determine background levels and trends in sediment.
What are the required levels of confidence and precision to be achieved in the monitoring results?
None defined
What are the monitoring costs? (e.g. human resources, analytical costs, monitoring equipment etc)? If no absolute values are available then relative costs should be provided.
Monitored as part of national programme. Noi additional resource costs. Analytical costs approximately £40 for water and £60 for sediment (due to pre-treatment). Analysed as component of pesticide suite of substances.
Can the required monitoring be incorporated in current monitoring programmes. If yes by how much would this reduce effort/costs?
Yes. Will not provide reduction in effort/costs as already monitored under national monitoring network. Additional analytical costs would be associated with sediment monitoring.
Recommended monitoring strategy (results of the decision tree).
Monitoring should be focussed around usage areas, particularly south east England (e.g. Anglian region) and near major transport routes. Monitoring sales statistics and usage patterns recommended.Monitoring concentrations in water at the harmonised monitoring network stations to determine riverine loads. Monitoring concentrations in sediments as selected harmonised monitoring network stations to determine background levels and trends.
92

An Evaluation of Approaches for Monitoring Emerging Hazardous Substances
Figure 7.6 Proposed monitoring strategy for Atrazine
93

An Evaluation of Approaches for Monitoring Emerging Hazardous Substances
7.3.4 Clotrimazole
Table 7.11 Checklist for development of a monitoring strategy for Clotrimazole
MONITORING STRATEGY CHECKLIST OF AVAILABLE INFORMATION
1. General InformationSubstance name ClotrimazoleCAS Number 23593-75-1Information sources http://www.ospar.org/. http://www.hull.ac.uk
2. Policy driversUnder what policy driver/s is monitoring of the substance likely to be required as part of emerging obligations?
OSPAR list of Chemicals for Priority Action.
What are the main objectives/targets of the policy driver/s?
OSPAR propose clotrimazole as a pilot/test substance for the control of contamination in the marine environment by pharmaceuticals
Briefly outline the monitoring requirements for each driver
Not required in current drivers
3. Production and useIs the substance produced in the UK UnknownIs the substance used in/imported into the UK?
Yes. 2,171,000 prescriptions in UK in 1997.
Is the substance likely to be present from long-range atmospheric transportation?
No
Has the substance been used in the UK in the past?
Yes
List the main uses Pharmaceutical; topical anti-fungal applications
List the main entry routes/sources to the environment
Disposal of unused product
Outline the main historical and current usage patterns
In use since the 1960-70s. Used in creams and other topical preparations at a concentration of approximately 1%w/w. Not widely administered by mouth – ineffective because low solubility means low absorption. One of the earliest of a wide range of azole and triazole fungicides.
4. Substance propertiesWhat are the main pathways into the environment?
Disposal of unused product (landfill, wastewater effluent, hospital waste)
What medium (or media) is the substance most likely to be found? (water, air, sediment, biota)
High logK0w – favours partition to sediment / accumulation in biota – in the absence of mechanisms for degradation.On OSPAR List of substances of possible concern because of its PBT properties, thus recommend biota monitoring - likely to be in ng/l concs in water - as are other pharmaceuticals. Not an air problem. Does not appear on lists of substances with potential endocrine
94
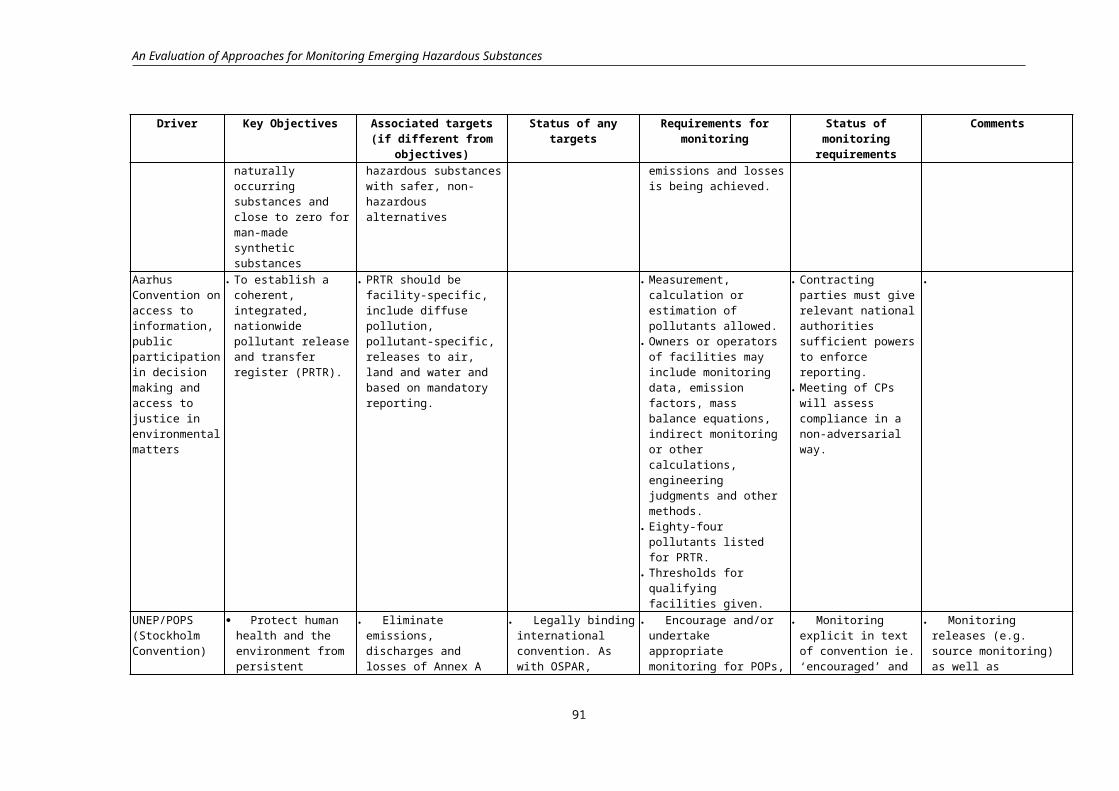
An Evaluation of Approaches for Monitoring Emerging Hazardous Substances
disruption properties thus these biological effects do not need to be monitored for.
Is the substance toxic to biota? If yes, briefly explain (e.g. acute/chronic)
Yes, reported as very toxic from Danish QSAR assessment.No environmental toxicity studies appear to have been conducted.
Is the substance persistent? Literature data suggest that, in vivo, the imidazole ring may be subject to considerable metabolic inactivation(Univ. of Hull – antifungal drugs course synopsis) A related (though more water-soluble) compound, ketoconazole, is reported to be metabolically vulnerable (<5% excreted unchanged). Abiotic degradation by acid or alkaline hydrolysis indicates half life of a few hours.
Is the substance likely to bioaccumulate? Immobilised in cell membrane. High bio-accumulation potential (QSAR EPIWIN estimation) – though see comments on degradation. High bioconcentration factor.
Are there any transformation processes that may enable re-mobilisation into the environment? If yes, briefly explain.
No transformations other than degradation to simpler and probably less harmful substances. The low solubility of clotrimazole may be increased by its formulation with solvents or surfactants, leading to its greater mobility and lower partitioning to solid phase.
5. Analytical InformationAre there suitable analytical (chemical/biological) methods?
Yes, HPLC and capillary electrophoretic methods have been reported for the analysis of formulations containing the substance (at levels of mg/ml).Routine methodology not available at present for the determination of considerably lower environmental concentrations
Provide an estimate of costs associated with analysis
>£200 but cost depends on the level of interest.
6. Existing monitoring informationIs the substance currently monitored in the UK? If yes, provide details.
No but data are available from a one-off special survey of UK estuaries commissioned by Defra in 2002
Are there existing EQSs used in the UK? Provide details
No
Based on results of monitoring, is the substance detected in the environment? If yes, is it detected in significant quantities?
Yes. The substance is detectable in water samples from the UK marine environment, but due to lack of sediment analysis and toxicity testing it is not possible to estimate the significance of the problem
Are any predictive models available/used to assess/determine the substance’s likely environmental concentrations?
Yes but not reliable ones, given the lack of information on processes of abiotic and biotic degradation. Further data on production and use are also required.
95

An Evaluation of Approaches for Monitoring Emerging Hazardous Substances
7. Monitoring strategyWhere should monitoring be undertaken to satisfy driver?
air – source monitoring No air – environmental monitoring No water – source monitoring Direct discharges from point sources
(sewage effluent, landfill, hospital waste) water – load monitoring No water - environmental monitoring –
categoryRivers, lakes, coastal
water – environmental monitoring - compartment (contaminant concentrations)
sediment/biota
water – environmental monitoring - biological community structure
No
water – ecotoxicological monitoring NoHow much precautionary/surveillance monitoring should be undertaken? (e.g. how confident are you in the available information and the resultant strategy?- The lower the confidence, the higher the need for a precautionary approach).
Assessment of risk is the first priority.
Is current monitoring http://www.ospar.org/sufficient to comply with the requirements of the policy driver/s? If no, briefly explain (e.g. requires higher frequency, greater number of sites etc)
No monitoring required until information on production, use, toxicity to aquatic life and biotic and abiotic degradation have been obtained.
What are the required levels of confidence and precision to be achieved in the monitoring results?
None defined
What are the monitoring costs? (e.g. human resources, analytical costs, monitoring equipment etc)? If no absolute values are available then relative costs should be provided.
No specific monitoring equipment or resources required. High analytical costs. Will result in increased costs due to lack of information (i.e. requirement for risk assessment and surveillance monitoring).
Can the required monitoring be incorporated in current monitoring programmes. If yes by how much would this reduce effort/costs?
Yes, due to nature of key point sources, could be harmonised with existing monitoring.
Recommended monitoring strategy (results of the decision tree).
Initially, a risk assessment is required to provide further background on which a monitoring strategy can be based. Following risk assessment, surveillance monitoring of direct discharges from key point sources and monitoring sediment and biota to determine background levels in the environment.
96
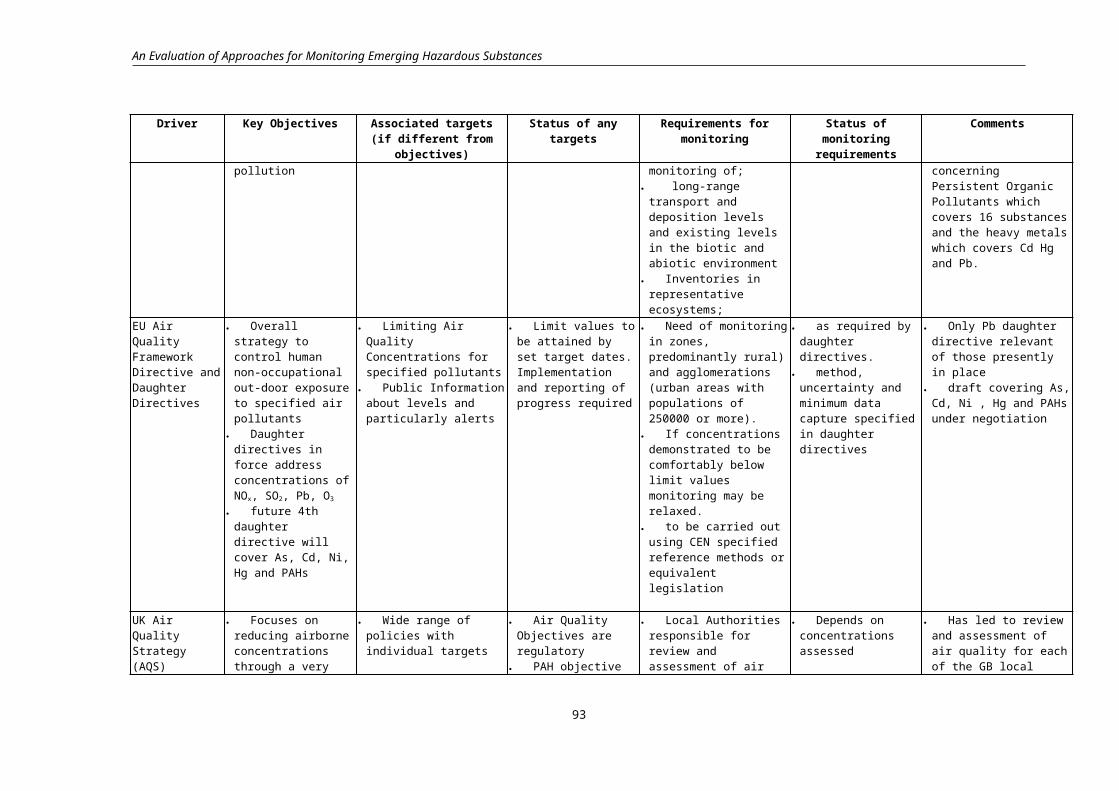
An Evaluation of Approaches for Monitoring Emerging Hazardous Substances
Figure 7.7 Proposed monitoring strategy for Clotrimazole
97

An Evaluation of Approaches for Monitoring Emerging Hazardous Substances
7.3.5 Polybrominated diphenylethers
Table 7.12 Checklist for development of a monitoring strategy for PBDEs
MONITORING STRATEGY CHECKLIST OF AVAILABLE INFORMATION
1. General InformationSubstance name Polybrominated diphenyl ethers CAS Number 32534-81-9: Pentabromodiphenylether
(pentaBDE)32536-52-0: Octabromodiphenylether (oktaBDE)1163-19-5: Decabromodipheylether (decaBDE)
Information sources HAR-HAZ Guidance (BFR), Peltola J and Ylä-Mononen (2000)WHO (1994), RPA (2000),. Law and Allchin (2001).
2. Policy driversUnder what policy driver/s is monitoring of the substance likely to be required as part of emerging obligations?
OSPAR list of chemicals for Priority ActionWFD Priority Substance(s) (pentabromo-biphenylether is a Priority Hazardous Substance)4th NSC Ministers agreed to take action to substitute brominated flame retardants by less hazardous alternatives.On IPPC list for emissions to waterLikely proposal for inclusion of PentaBDE on UNEP POPs on basis of risk assessment.
What are the main objectives/targets of the policy driver/s?
Reduction and phase out of PBDEs. Refer table 3.1
Briefly outline the monitoring requirements for each driver
Refer table 3.1.Not included in OSPAR-RID monitoring programme.
3. Production and useIs the substance produced in the UK 8 manufacturers currently producing PBDEs
– Only 1 in UK (Great Lakes Chemical Ltd). PentaBDE not manufactured in EU.
Is the substance used in/imported into the UK?
Yes, used in and imported into the UK. Up to 2,000 tonnes PBDE per year used in UK. 1000-1200 tonnes/year decaBDE used – mainly in textile industry. Around 300 tonnes/year PentaBDE used in UK, with further 800 tonnes imported in finished articles. PentaBDE represents just 9% of PBDEs used in EU.
Is the substance likely to be present from long-range atmospheric transportation?
Yes
Has the substance been used in the UK in the past?
Yes. E.g. around 95% of all upholstery materials are flame retarded and estimated 50% of total PDBE use is in the textile industry
List the main uses Have inhibitory effect on ignition of fire in
98

An Evaluation of Approaches for Monitoring Emerging Hazardous Substances
organic materials. Added to plastics and textiles in order to comply with fire safety requirements. Other uses – wire and cable insulation, electrical/electronic connectors.
List the main entry routes/sources to the environment
Manufacturing and washing of textiles, manufacturing of plastics and electrical and electronic industries. Accidental spillage during transportation. PBDE containing products disposed of to normal domestic waste (e.g. landfill/incineration)
Outline the main historical and current usage patterns
Major use for pentaBDE is as a flame retardant (FR) additive in polyurethane foam for furniture and upholstery. Also used as FR in epoxy resins, phenolic resins, unsaturated polyesters and textiles.Around 95% octaBDE used as FR in acrylobutaienestyrene (ABS) plastics. Others include nylon and low density polyethylene, polycarbonate, phenol-formaldehyde resins and unsaturated polyesters and in adhesives and coatings.DecaBDE used as FR mostly in plastics and textiles industries.Of the 75 FRs only octaBDE and pentaBDE are subject to phase out by EU. Future decision on decaBDE to be based on risk assessments due for completion in 2003.Consumption has increased due to the significant reduction in fire hazard for the public in a range of applications. Voluntary commitment made by FR industry in 1995 to reduce environmental risks of PBDEs.
4. Substance propertiesWhat are the main pathways into the environment?
Emissions to air during processing of plasticsDischarges to water whilst washing textiles containing PBDEs
What medium (or media) is the substance most likely to be found? (water, air, sediment, biota)
Because of extremely low water solubility and vapour pressure, PBDEs likely to be transported primarily by adsorption to sediment. Therefore likely to accumulate in sediment and soil. Also shown to accumulate in biota (e.g. sperm whales)DecaBDE not widely found in environment and where found, likely to be confined to sediments near point sources.
Study showed that 99% of PentaBDE distributed to the environment will be found in soil (60.4%) and sediment (38.7%) (in Peltola J and Ylä-Mononen (2000).
Is the substance toxic to biota? If yes, briefly explain (e.g. acute/chronic)
Mildly toxic, but toxicology varies with degree of bromination. Some liver effects in mammals from octaBDE and PentaBDE.Acute toxicity of decaBDE low.
Is the substance persistent? Yes. Not readily biodegradeable. Shown to persist in marine sediments for decades. High persistency to biodegradation in the
99

An Evaluation of Approaches for Monitoring Emerging Hazardous Substances
environment, although photodgradation can be significant..
Is the substance likely to bioaccumulate? Yes, but varies with degree of bromination.Commercial OctaBDE shown to accumulate in fish.PentaBDE has logKow > 5. Shown to bioconcentrate in carp. Concentrations shown to be higher at higher trophic levels.DecaBDE poorly adsorbed and rapidly excreted, therefore unlikely to bioaccumulate..Study by de Boer et al found traces of PBDE blend in tissue of sperm whales of Dutch coast. DecaBDE not found.
Are there any transformation processes that may enable re-mobilisation into the environment? If yes, briefly explain.
One of main concerns is transformation into polybrominated dibenzo-p-dioxins and dibenzofurans from combustion.
5. Analytical InformationAre there suitable analytical (chemical/biological) methods?
Yes, methods available to determine residues in various media (air, sewage sludge, sediment, human adipose tissue, marine organisms, fish etc)
Provide an estimate of costs associated with analysis
£200-£250
6. Existing monitoring informationIs the substance currently monitored in the UK? If yes, provide details.
Not routinely monitored in freshwater. Few studies on environmental concentrations. DETR commissioned special survey and initial results of European Survey (DIFFCHEM) released in 1997. Concentrations of Penta and OctaBDE in the UK ranged between 0.2 to 6.9µg/kg. Highest concentrations were recorded in the Humber. Concentrations of DecaBDE ranged between 2.1 to 1,700µg/kg, with highest value in the Mersey(Law and Allchin 2001). UK pilot study was undertaken on sediment and fish tissue in the vicinity and downstream of potential sources of BFRs. PBDEs were detected in all but one of the fish and shellfish samples, including 5 offshore samples. High concentrations found in sediments of River Skerne and River Tees (downstream of a former production site).
Are there existing EQSs used in the UK? Provide details
No
Based on results of monitoring, is the substance detected in the environment? If yes, is it detected in significant quantities?
Yes, studies show widespread concentrations in water (near sources), sediment and biota.
Are any predictive models available/used to assess/determine the substances likely environmental concentrations?
Multivariate model developed by Swedish Museum of Natural History to model concentrations of PBDEs in guillemot eggs.
7. Monitoring strategyWhere should monitoring be undertaken to
100

An Evaluation of Approaches for Monitoring Emerging Hazardous Substances
satisfy driver? air – source monitoring Yes air – environmental monitoring No water – source monitoring No water – load monitoring No water - environmental monitoring –
categoryYes
water – environmental monitoring - compartment (contaminant concentrations)
Yes. Marine and freshwater sediment and biota
water – environmental monitoring - biological community structure
No
water – ecotoxicological monitoring NoHow much precautionary/surveillance monitoring should be undertaken? (e.g. how confident are you in the available information and the resultant strategy?- The lower the confidence, the higher the need for a precautionary approach).
Not routinely monitored. Surveillance monitoring required to determine background levels near main sources and how widespread are the environmental concentrations (sediment and biota). Some surveillance monitoring of marine and freshwater required to determined background levels.
Is current monitoring sufficient to comply with the requirements of the policy driver/s? If no, briefly explain (e.g. requires higher frequency, greater number of sites etc)
No monitoring currently required by drivers. Mandatory monitoring likely in the future. Sufficient risk assessment data available and some preliminary surveillance monitoring undertaken. Additional surveillance monitoring required. May need to be included on national monitoring programme. Sites and frequencies can be harmonised with national network, and some additional locations in vicinity of points sources (if not already covered).
What are the required levels of confidence and precision to be achieved in the monitoring results?
None specified
What are the monitoring costs? (e.g. human resources, analytical costs, monitoring equipment etc)? If no absolute values are available then relative costs should be provided.
No specialised monitoring equipment or additional resources required. High analytical cost.
Can the required monitoring be incorporated in current monitoring programmes. If yes by how much would this reduce effort/costs?
Yes. Overall costs would increase due to high analytical costs, but resource/equipment costs can be minimised by inclusion in current programmes.
Recommended monitoring strategy (results of the decision tree).
National programme of surveillance/precautionary monitoring to determine levels of accumulation in sediment and biota and long range transport.Monitoring emissions to air and discharges to water at key sources.Limited fresh and marine environmental monitoring, at key locations downstream from major sources (e.g. textile plants), and disposal (e.g. sewage outflows and landfill) to determine if there are detectable environmental concentrations.
101

An Evaluation of Approaches for Monitoring Emerging Hazardous Substances
Figure 7.8 Proposed monitoring strategy for PBDEs
102
An Evaluation of Approaches for Monitoring Emerging Hazardous Substances
7.4 Advantages and Limitations of the approach
An advantage of the proposed approach is simple in that it takes into consideration combination of driver requirements, usage patterns and substance properties. The consideration of a substances properties enables appropriate selection of a monitoring approach (e.g. source, load, environmental monitoring) and the medium(a) in which the substance should be measured. Thus targeted and therefore cost-effective monitoring should be possible, and effort not wasted, for example, by sampling the wrong environmental compartment or in water bodies where the substance is unlikely to be present. The approach also allows a judgement to be made as to whether monitoring is legally required (and therefore has to be done) for a particular or is a moral obligation when a choice can be made as to whether or not monitoring is undertaken (perhaps because of resource constraints).
However the decision tree requires a lot of information. The more information there is on a substance, the more targeted the monitoring can be. Emerging substances will have varying degrees of background information on its use and properties, and also in terms of background monitoring data. For example, PBDE has considerable information about substance properties as is used extensively throughout the EU. Clotrimazole is on OSPAR list of substances for Priority Action, but very limited environmental health and toxicological data. It is not monitored routinely, and so there are no background data and limited information on its fate and behaviour. Thus for substances with limited amounts of information a precautionary approach may be required where some limited monitoring or risk assessment may be undertaken as a reassurance measure and to aid any decision. In these cases the decision tree may have to be reapplied to reassess and/or refine preliminary monitoring decisions.
In terms of limitations the approach is substance specific, and as such does not take into account complex reactions between multiple substances within the environment. It is also time consuming to undertake for individual substances. However, substances could be assessed as groups when they have similar properties and or use patterns.
A further limitation is that it does not consider how the identified monitoring requirements for specific emerging substances could be incorporated into current monitoring, for example, by additional sampling at existing monitoring locations. In the latter case inclusion in existing monitoring programmes would be the most cost effective approach, though for some substances it may not give the optimal information. The approach also does not take into account any resource implications for adding emerging substances to existing monitoring programmes. There is often financial constraints on regulatory monitoring and perhaps the recommended monitoring approach would considered to be too expensive, and a less optimal approach would have to be taken to make the monitoring affordable.
103

An Evaluation of Approaches for Monitoring Emerging Hazardous Substances
7.5 Process for Implementation of the UK Strategy for Monitoring Hazardous Susbtances
The previous sections have outlined what should be considered when designing an overall strategy for monitoring hazardous substances in the UK. The outline strategy is based on a decision tree approach, which requires collation and assessment of relevant substance-specific data and information to determine the appropriate monitoring regime for individual substances.
This section proposes a step-by-step process for the implementation of the overall UK monitoring strategy for emerging hazardous substances.
The following 5-step process is proposed:
Step 1. Co-ordination of roles and responsibilities;
Step 2. Identification and prioritisation of substances;
Step 3. Identification of data and information gaps;
Step 4. Preparation of monitoring programme; and,
Step 5. Implementation of monitoring programme;
The requirements of each of the 5 steps are outlined below:
Step 1. Coordination of roles and responsibilities
DEFRA will be responsible for reporting the results of monitoring to the relevant policy holders (e.g. European Commission and OSPAR Commission) and would represent the main source fo funding for implementation of monitoring programmes. Therefore, it would be logical for them to take overall ownership of the process and ensure responsibilities are assigned to the relevant organisations where necessary.
For a national monitoring programme to be implemented successfully, the first step is to clarify the roles and responsibilities of the key players that may be involved, or impacted by, the process. DEFRA should establish a robust and transparent mechanism for implementation at the outset to ensure that the monitoring programme addresses the relevant legislative requirements (monitoring and reporting) in a cost effective way.
This mechanism should include:
Identification of the key players, such as EA, CEFAS, Industry and Agriculture and other stakeholders (e.g. Statutory Conservation bodies, NGOs etc);
Identification of the roles and responsibilities of each of the key players;
Establishment of a cross-sectoral River Basin Management Committee as the platform for discussion and development of technical protocols4;
4 Note: Such a Committee could be established to address a number of roles (e.g. RBM issues in relation to the WFD).
104

An Evaluation of Approaches for Monitoring Emerging Hazardous Substances
Determination of the type and availability of data:
o What data is available?
o Who holds the data?
o Is the data readily available (e.g. product registers, emissions inventories, sales figures etc)?
o In what form is the data stored (e.g. database/spreadsheet, hardcopy etc)?
o Are there any gaps in the data (e.g. should a register/inventory be established)?
Determination of issues that may limit the availability of data (e.g. confidentiality, co-operation with national Ministries etc) and how such issues could be addressed; and,
Identify linkages between other international parties/organisations (e.g. Marine Conventions, European Union, UNECE, OECD etc), in relation to meeting legal/moral monitoring and reporting requirements.
7.5.1 Step 2 – Identification and prioritisation of substances
Comprehensive lists of substances currently monitored, and those likely to be required to be monitored in the next five years are provided in Annex III (Tables 1 and 2, respectively). These lists should be used as the basis for determining the substances to be included in the national monitoring programme.
A process of selection and prioritisation should then be undertaken in consideration of legal/moral obligations and cost effectiveness. The choice of whether or not to monitor a substance cannot be influenced by costs if there is a legal obligation to monitor it. However, costs of monitoring can be minimised through adequate consideration of the pathways and substance properties and existing monitoring programmes.
Where the policy requirement presents a ‘moral’ obligation for monitoring, then consideration of costs may be more relevant. In this case a ‘legal’ requirement will take precedence over a ‘moral’ requirement. However, in all cases, every attempt should be made to effectively meet both ‘moral’ and ‘legal’ requirements. The issue of cost is raised purely in recognition that there is not an endless pool of resources available for monitoring, and as such prioritisation over space and time may be required.
Where there is a legal requirement to monitor a substance, but this monitoring is not required to be implemented for several years, there may be opportunities to reduce initial costs through phasing the implementation of the programme.
A final consideration relates to substances in which monitoring is legally required only if it is used/produced in the UK (e.g. WFD priority substances). If the substance is not used/produced in the UK it may be excluded from the initial monitoring programme (unless it appears on another mandatory list). However, the substance should be re-
105
An Evaluation of Approaches for Monitoring Emerging Hazardous Substances
considered during subsequent revisions of the monitoring programme, should the production/use circumstances change.
Using the scenarios above, it is suggested that a phased approach to monitoring hazardous substances is undertaken. This phased approach involves the identification of high and medium priority substance lists and would be implemented in the following timescales:
High priority substances– substances that are legally required to be monitored within the next 2 years. Would require development and implementation of a monitoring programme as soon as possible and requires urgent evaluation of data and information availability.
Medium priority substances -
o Substances that are legally required to be monitored within the next 5 years. Would require development and implementation of a monitoring programme in the next 3-5 years, but must ensure that the data collection and evaluation is undertaken in time to implement the programmes (i.e. within 2-3 years).
o Substances that are morally required to be monitored. Consideration of cost effectiveness (e.g. are there likely to be substantial costs for monitoring, or is the substance already included in a routine monitoring programme). If excluded from initial monitoring programme, then the substance should be re-evaluated during the programme review. If it is deemed that the moral obligation is binding, then all effort should be made to account for these substances in the high priority monitoring programme.
o Substances that are legally required to be monitored only if produced/used. If excluded from initial monitoring programme, then the substance should be re-evaluated in the programme review.
7.5.2 Step 3 – Identification of data and information gaps
Following the identification and prioritisation of hazardous substances, an assessment of the availability of data and information should be made for each high priority substance. This step involves completion of the checklist identified in Table 7.1. Where information is not available this should be flagged and the appropriate steps taken to ensure that the relevant data is collected as soon as possible.
The decision tree (Figure 7.1) should be completed to determine preliminary monitoring requirements. For those substances that do not have sufficient information to make a scientific judgement on the monitoring requirements, then further information should be gathered and the substance re-run through the decision tree.
For the substances identified as medium priority, efforts should be made to assess the availability of data and information at the earliest possible time following completion of the evaluation for the high priority substances, and at least in time for the programme review.
106

An Evaluation of Approaches for Monitoring Emerging Hazardous Substances
7.5.3 Step 4 – Preparation of monitoring programme
Once the monitoring requirements for individual substances have been determined, an overall programme for monitoring hazardous substances should be developed. It is envisaged that DEFRA will have the responsibility for:
Funding and Co-ordination of activities;
Establishment of a platform to discuss the monitoring requirements for substances on the list. This could be the River Basin Management Committee or some inter agency (e.g. DEFRA/CEFAS/EA/Industry etc);
Arrangement of meetings to discuss monitoring requirements and identify likely costs;
Determining the process for data collection and storage and the format for data reporting (to DEFRA);
Determine the monitoring/reporting responsibilities of the relevant organisations, for example:
o EA –Implement monitoring programme (up to territorial waters), report results to DEFRA, store and manage data in agreed formats;
o CEFAS - Implement monitoring programme (offshore marine waters), report results to DEFRA, store and manage data in agreed formats;
o Industry/agriculture/stakeholders – report results, encourage transparency and deliver relevant data and information to EA/CEFAS in agreed formats.
Preparation of the overall monitoring programme based on the technical input from the River Basin Management Committee, including;
o Roles and Responsibilities for monitoring and reporting;
o Legislative drivers addressed by the monitoring programme and possible emerging legislation;
o Substances to be monitored;
o Site locations, frequencies and monitoring matrix;
o Levels of confidence and precision required;
o Approximate costs of monitoring (over and above existing programmes);
o Procedure for revision of the programme (every 2-3 years, as new legislation emerges, roles and responsibilities change or substance production/use changes);
107

An Evaluation of Approaches for Monitoring Emerging Hazardous Substances
7.5.4 Step 5 – Implementation of monitoring programme
To ensure the monitoring programme is implemented successfully, each player must be clear of their role in the process. This could be monitoring, reporting, consultation or all three. While DEFRA will co-ordinate the process and establish the necessary national and international links, each organisation will need to work in a cooperative manner.
DEFRA needs to ensure that appropriate consultation is undertaken throughout the process and should facilitate data flows and information exchange between all parties.
In most if not all cases DEFRA will be responsible for reporting to the European Commission, OSPAR and other international organisations (e.g. EUROSTAT). Where reports are based on monitoring information, DEFRA will have to obtain the required information from those with the responsibility for undertaking the monitoring. It is imperative that data flows from the data providers must be timely and in a required format if DEFRA is to meet its international reporting deadlines.
8. CONCLUSIONS AND RECOMMENDATIONS
8.1 Conclusions
8.1.1 Evaluation of HARP-HAZ
1. The UK was the only country to report on emissions using the LOA, whilst all other Member States used a combination of SOA1 and SOA2 when reporting on emissions of hazardous substances;
2. The Netherlands, Norway, the UK and to a lesser extent Denmark have best illustrated transparency and comparability in their reporting with regard to HARP-HAZ requirements. However, the difference between LOA and SOA reporting has resulted in significant variation in the way which data is reported between the UK and Norway and the Netherlands. Although the UK took all sources into account, only percentage reductions were provided for each substance;
3. Some of the benefits associated with using the SOA highlighted by Norway and the Netherlands are:
Rapid identification of target group sources that are key contributors of hazardous substances;
Key contributors of hazardous substances to the environment bear the cost of reporting under the SOA, enabling more resources to be focussed on quantifying diffuse sources; and
SOA is not influenced by transboundary issues (especially with regard to water).
4. Some of the difficulties encountered in implementation of HARP-HAZ requirements when reporting emissions using SOA, include:
108
An Evaluation of Approaches for Monitoring Emerging Hazardous Substances
Data gaps exist for some substances over the 14/15-year reporting period. As a result extrapolation had to occur using data from more recent years with information regarding source apportionment;
Inaccurate or incomplete data obtained from some sources;
Some industries may overlap source divisions resulting in difficulties when apportioning emissions amongst contributory sources;
Non-availability of data for diffuse sources of hazardous substances is a key problem in that data are often required to be estimated using statistical data or through expert judgement.
5. Norway and the Netherlands found difficulties in apportioning costs associated with the SOA due to the large number of organisations involved in the reporting process.
6. Norway and the Netherlands found that SOA was cost effective in terms of directing management priorities for the reduction of emissions. Furthermore, as major point sources self-report more resources are available in which to focus quantification of emissions from unknown sources; and,
7. The difficulties and benefits associated with the SOA and the LOA indicate that a combination of both approaches may result in minimising problems related to data quality and source apportionment. This is likely to be reinforced further by key drivers such as the WFD, which requires accurate monitoring data for specific substances as well as an indication of key sources of hazardous substances within specific River Basin Districts.
8.1.2 Status of monitoring obligations under relevant policy drivers
8. The prime legislative drivers that will identify emerging hazardous substances and that might have monitoring requirements and implications are considered to be the Air Quality Framework Directive, Water Framework Directive, IPPC Directive (air and water) and the OSPAR Strategy with regard to Hazardous Substances (air and water). All have iterative procedures for identifying hazardous substances of concern and have priority or action lists of substances that will be periodically updated. DEFRA should therefore continue to closely follow developments in the appropriate fora for these policy drivers.
9. The requirements of Directives are legally binding whilst those arising from OSPAR and North Sea Conferences might be considered as moral obligations. This difference should be considered in deciding whether an emerging substance should be monitored.
8.1.3 Monitoring costs
10. In order to develop a cost effective monitoing programme it is necessary to monitor the relevant substances in the appropriate matrix, at the appropriate locations and frequencies and with acceptable levels of confidence and precision in the results. To achieve this, consideration must be given to the requirements of the policy driver/s, environmental pathways and substance specific properties. Consideration must also
109

An Evaluation of Approaches for Monitoring Emerging Hazardous Substances
be given to existing monitoring regimes and other policy requirements likely to emerge in the future to avoid duplication of effort and ensure that an integrated monitoring programme is implemented that meets ALL the legislative/moral monitoring requirements in the most practical and cost effective way.
8.1.4 Monitoring Strateygy for Hazardous Substances
11. A decision-tree approach has been proposed for the identification of monitoring strategies for emerging hazardous substances. The decision-tree starts with the needs and requirements for monitoring (e.g. legislative drivers), then considers the usage/production/sources of the substance, its environmental fate and behaviour, its intrinsic chemical and ecotoxicological properties leading to the identification of the most appropriate monitoring approach.
12. The decision-tree has been demonstrated using four substances with differing properties and hence different monitoring approaches. These are mercury, atrazine, clotrimazole and brominated diphenyl ethers.
13. The decision tree offers a simple approach to defining appropriate monitoring strategies for emerging hazardous substances but requires specific detailed information on each substance. In many cases some of this information will be lacking in which case a more precautionary approach should be adopted entailing preliminary surveillance monitoring and/or a risk assessment.
14. A key source of information in determining monitoring strategies is on the usage, production and discharges of hazardous substances at a river basin and water body level. The development of a pollution emissions inventory/register at an appropriate scale will be a future valuable source of information for the proposed approach and also for the implementation of the Water Framework Directive.
15. A 5-step process for implementation of the monitoring strategy is proposed. The aim of this process is to co-ordinate activities through a national platform in order to ensure the preparation and implementation of a comprehensive monitoring programme for hazardous substances in the UK.
8.2 Recommendations
1. The outcomes of the study provide sound basis for the identification of the specific monitoring requirements for hazardous substances resulting from emerging international obligations and how these requirements could be fulfilled in a cost effective way. It is recommdended that additional work be undertaken to clarify the scope and roles of organisations responsible for (or impacted by) future monitoring programmes. This could be achieved by following the proposed step-by-step process for implementation and undertaken on a national scale through the establishment of a mulit-sectoral River Basin Management Committee.
2. It is recommended that DEFRA maintains a watching brief on the developments of the prime legislative drivers (such as the Water Framework Directive) so that it can develop its monitoring strategies in terms of emerging hazardous substances in a timely and cost-effective way, in order to meet the required international reporting obligations.
110

An Evaluation of Approaches for Monitoring Emerging Hazardous Substances
REFERENCES
Bryan, G. W., Gibbs, P. E, Burt, G. R. and Hummerstone, C. G. (1987). The effects of tributyltin (TBT) accumulations on adult dog whelk, Nucella lapillus: long-term field and laboratory experiments. J. Mar. Biol. Assoc. UK., 67: 525-544.
COMMPS report (1999). Study on the Prioritisation of Substances Dangerous to the Aquatic Environment. Office for Official Publications of the European Communities, 1999 (ISBN 92-828-7981-X).
Council Directive 2000/60/EEC of 20 December 2000 concerning ??? ‘The Water Framework Directive’.
Council Directive 96/61/EC of 24 September 1996 concerning integrated pollution prevention and control ‘the IPPC Directive’.
De Paepe V. (2000). Nutrient Emissions to Inland Waters: Comparability of Assessments undertaken within a number of European Union Member States. June 2000.
De Paepe V., Boschet A-F., and Nixon S (2001). Comparability of Assessments of Nutrient Emissions to Inland Waters Undertaken Within Eight European Union Member States.
Ellis (1989). Handbook on the design and implementation of monitoring programmes.
Environment Agency (1998). The State of the Environment of England and Wales – Fresh Waters. ISBN: 0-11-310-148-1.
Environment Agency (1999). The State of the Environment of England and Wales – Coasts. ISBN: 0-11-310-162-7.
ETC/WTR (2002). EUROWATERNET – Emissions A European Inventory of Emissions to Water: Proposed Operational Methodology. Fourth Draft, February 2002.
ETC-WTR October 2002. Overlap between the monitoring requirements of the Water Framework Directive and the Marine Conventions (Richards R, Nixon S, Joanny M, Ærtebjerb G and Zenetos A). 3rd draft.
Evers C.W.A and van der Most P.F.J. (1998). Estimating Environmental Releases from Diffuse Sources – a guide to methods, July 1998.
Evers C.W.A. (1998) National Pollutant Emission Register in the Netherlands, September 9-11 1998.
HARP-HAZ Secretariat (1998). Calculation/estimation of point and diffuse sources in Norway, OSLO: 21-24 September 1998.
Marine Environment Monitoring Group (2003). Towards the development of a comprehensive marine monitoring programme in the UK: environmental quality monitoring action plan. Marine Environment Monitoring Group, pp71.
111

An Evaluation of Approaches for Monitoring Emerging Hazardous Substances
Marine Pollution Monitoring Management Group (2003)5. A review of marine monitoring towards a national strategy. A report prepared for Defra by the Marine Pollution Monitoring Management Group. pp55.
Munkittrick, K.R. and McCarty, L.S. (1995) An integrated approach to aquatic ecosystem health: Top-down, bottom-up or middle-out? J. Aquat. Ecosystem Health 4, 77-90.
Nixon S, France S. and Rickard L. (2002). Adequacy to the EEA of data reported to the European Commission and other international organisations. European Environment Agency (EEA), European Topic Centre on Inland Waters (ETC-IW) report No PO1999/11754-7/2. December 2002.
Nixon S., Fleming R., Gunby A. and Clarke S. (1996). Development and testing of General Quality Assessment Schemes: Sediment quality in estuaries and coastal water. NRA Project Record 469/21/H0.
Nixon S., Mitchell R. E., Johnson I., Moran G., Rees Y. J., Baker R., Forrow D., Elvira M., Bogestrand J., Sortkjær O., and Faby O. Hazardous substances in European waters: what we do, what we know and what do we need to do?. Second draft, November 2000. Report prepared for EEA ETC-WTR. Report No PO99-8/2000/2.
North Sea Secretariat (2001a). Electronic Reporting System on Hazardous Substances for the 5th North Sea Conference 2002, REP-HAZ User Manual.
North Sea Secretariat (2001b). Overall HARP-HAZ Guidance Document.
North Sea Secretariat (2001b). Overall HARP-HAZ Guidance Document.
North Sea Secretariat (2001c). HARP-HAZ Guidance Document on Quantification and Reporting on the Discharges, Emissions and Losses of Lindane.
North Sea Secretariat (2001d). HARP-HAZ Guidance Document on Quantification and Reporting on the Discharges, Emissions and Losses of Short Chained Chlorinated Paraffins (SCCP).
North Sea Secretariat (2001e). HARP-HAZ Guidance Document on Quantification and Reporting on the Discharges, Emissions and Losses of Lead.
North Sea Secretariat (2001f). HARP-HAZ Guidance Document on Quantification and Reporting on the Discharges, Emissions and Losses of Dioxins.
North Sea Secretariat (2001g). HARP-HAZ Guidance Document on Quantification and Reporting on the Discharges, Emissions and Losses of Brominated Flame Retardants (BFR).
North Sea Secretariat (2001h). HARP-HAZ Guidance Document on Quantification and Reporting on the Discharges, Emissions and Losses of Tributyltin (TBT) and Triphenyltin (TPT) Compounds.
5 The MPMMG became the Marine Environment Monitoring Group on 1st July 2003
112
An Evaluation of Approaches for Monitoring Emerging Hazardous Substances
North Sea Secretariat (2001i). HARP-HAZ Guidance Document on Quantification and Reporting on the Discharges, Emissions and Losses of Polycyclic Aromatic Hydrocrabons (PAHs).
North Sea Secretariat (2001j). HARP-HAZ Guidance Document on Quantification and Reporting on the Discharges, Emissions and Losses of Mercury Compounds.
North Sea Secretariat (2001k). HARP-HAZ Guidance Document on Quantification and Reporting on the Discharges, Emissions and Losses of Nonylphenols (NP) and Nonylphenolethoxylates (NPE) and related substances.
North Sea Secretariat (2001l). HARP-HAZ Guidance Document on Quantification and Reporting on the Discharges, Emissions and Losses of Cadmium.
North Sea Secretariat (2001m). HARP-HAZ Guidance on carrying out and reporting on inventories of uncontrolled PCB-containing products.
North Sea Secretariat (2002). Compilation of Submitted Inputs to the Progress Report to the 5th North Sea Conference – The Prevention of Pollution by Hazardous Substances. January 4, 2002.
North Sea Secretariat (2002n). Progress Report – Fifth International Conference on the Protection of the North Sea 20-21 March 2002 Bergen, Norway.
OSPAR (1998). OSPAR strategy with regard to Hazardous Substances. Ministerial meeting of the OSPAR Commission, Sintra July 1998. Ref:1998-16.
OSPAR (1999). OSPAR Action Plan 1998-2003 (update 1999). Meeting of the OSPAR Commission, Kingston upon Hull 21-24 June 1999. Annex 14 Ref 7.4.
OSPAR (2000c). Briefing document on the work of DYNAMEC and the DYNAMEC mechanism for the selection and prioritisation of hazardous substances.
OSPAR (2002). First draft of a new OSPAR strategy for a Joint Assessment and Monitoring Programme (JAMP). Meetings of the biodiversity committee (BDC), eutrophication committee (EUC), hazardous substances committee (HSC), offshore industry committee (OIC) and Radioactive substances committee (RSC). Presented by the Sectretariat.
OSPAR (2002). OSPAR List of substances of possible concern. (update 2002). Revised 28 June 2002, Ref 2002-17.
OSPAR (2002a). OSPAR List of chemicals for priority action (update 2002). Meeting of the OSPAR Commission, Amsterdam 24-28 June 2002, Annex 5 Ref 2002-18.
OSPAR (2002b). Provisional instruction manual for the dynamic selection and prioritisation mechanism for hazardous substances (DYNAMEC). ISBN 0946956 96 0.
OSPAR Commission (1998-05). Principles of the Comprehensive Study on Riverine Inputs and Direct Discharges (RID).
113
An Evaluation of Approaches for Monitoring Emerging Hazardous Substances
OSPAR Commission (1998-16). OSPAR Strategy with regard to Hazardous Substances. Annex 34: Ministerial Meeting of the OSPAR Commission, Sintra, July 1998.
OSPAR HASH-ICG report (Nov 2002). Evaluation of Progress with Respect to the Achievement of the OSPAR Objectives with Regard to Hazardous Substances – report on the development of tool HT-1a of the draft on the new JAMP. 25-29 Nov 2002.
Peltola J,. Ylä-Mononen L., (2000). Pentabromodiphenyl ether as a global POP. Finnish Environment Institute: Chemicals Division.
RPA (2000a). Risk Reduction Strategy and Analysis of Advantages and Drawbacks for Pentabromodiphenyl Ether. Report prepared for DETR. No. CDEP 141/17.
RPA (2000b). Socio-Economic Impacts of the Identification of Priority Hazardous Substances under the Water Framework Directive. Final Report to the European Commission. Directorate General Environment. Report No. J347/WFD.
The North Sea Secretariat (2002). Compilation of Submitted Inputs to the Progress Report to the 5th North Sea Conference – The Prevention of Pollution by Hazardous Substances. January 4, 2002.
The Rhine Commission (1998). Information on the International Commission for Protection of the Rhine, OSLO: 21-24 September 1998.
Van der Most P (2001). Design and Development of the PRTR in the Netherlands, Moscow: November 26-29 2001.
Van der Most P and Grootveld G van (1999). National Pollutant Emission Register in the Netherlands, Moscow: December 8-9 1999.
WFD CIS Guidance Document No. 3 (Dec 2002). Final Draft - Guidance for the Analysis of Pressures and Impacts in Accordance with the Water Framework Directive. ISBN No (92-894-5123-8), ISSN No (1725-1087).
WFD CIS Guidance Document No. 7 (Jan 2003). Final Draft - Guidance on Monitoring for the Water Framework Directive. ISBN No.(92-894-5127-0), ISSN No (1725-1087).
World Health Organisation (1976). International Programme on Chemical Safety (INCHEM), Environmental Health Criteria 1 – Mercury. Published under joint responsibility of UNEP and WHO.
World Health Organisation (1994). International Programme on Chemical Safety (INCHEM), Environmental Health Criteria 162 – Brominated Diphenyl Ethers. Published under joint responsibility of UNEP, ILO, WHO.
WRc plc (1996). Proposed Environmental Quality Standards for Water – Atrazine and Simazine. Final report to the Department of Environment. Report No. DoE2316(P).
114

An Evaluation of Approaches for Monitoring Emerging Hazardous Substances
ANNEX I – SPECIFICATION-PROGRAMME OF WORKDEPARTMENT FOR ENVIRONMENT, FOOD AND RURAL AFFAIRS (DEFRA)
SPECIFICATION - PROGRAMME OF WORK
SPECIAL SURVEYS OF HAZARDOUS SUBSTANCES
BACKGROUND
The UK has, in recent years, set up a number of sophisticated monitoring programmes covering a number of chemicals of concern to address national and international requirements (e.g. the harmonised monitoring scheme, the National Monitoring Programme for Marine Waters, National Atmospheric Emissions Inventory). Surface and marine waters are monitored regularly in various programmes for specified parameters for either mandatory or investigative reasons. Emissions to air for specified substances (many of which might eventually reach the marine environment or surface waters ) are also regularly monitored. More recently, the Environment Agency has gone on line with its Toxic Release Inventory which records emissions and discharges of certain substances specified in permits for large industrial installations, and is working on a more detailed water pollution inventory.
In the last couple of years, several international organisations have identified a number of "new" hazardous substances for priority action on the basis of their hazardous properties. (eg OSPAR with list of Substances for Priority Action and the EC with its Article 16 priority list in the Water Framework Directive which are not necessarily included in traditional monitoring programmes and inventories. These organisations are currently working out how to develop appropriate monitoring strategies to address them.
In this respect, methodologies have been developed for the 5th North Sea Conference by which North Sea States report on reductions of specific hazardous substances either using a "source-oriented approach" where amounts are calculated from the known sources and uses of a chemical, or the "load oriented" approach in which the concentrations of the chemical are measured in estuaries, and the tonnages entering the sea are calculated. OSPAR is expected to build on this process and develop a similar approach to assess whether hazardous chemicals identified for priority action by OSPAR will meet the OSPAR 2020 cessation target. Most Contracting Parties have a strong preference for using the source-oriented approach, rather than the more traditional aquatic monitoring historically favoured by the UK.
In the Water Framework Directive, various monitoring requirements are envisaged for the substances on the Article 16 list, for example in connection with meeting water quality standards for aquatic and coastal/transitional waters.
In the light of existing statutory/mandatory monitoring commitments, and in view of these evolving obligations, it is now appropriate to take a strategic look at how the UK should best address the monitoring of these "new" hazardous substances, whether it
115

An Evaluation of Approaches for Monitoring Emerging Hazardous Substances
should develop a source-oriented approach, and how best use could be made of resources.
OBJECTIVES
a) To provide an overview of which substances are currently being monitored in connection with existing international obligations, the rough cost of this monitoring and the scope for reducing this monitoring;
b) To examine the emerging and future international obligations for monitoring hazardous substances in discharges, emissions and losses6 and to identify the new hazardous substances likely to be targeted and the associated monitoring requirements and costs;
c) To assess the practicality and resource implications of using source monitoring, as opposed to traditional aquatic monitoring in meeting future international monitoring obligations and for assessing whether the chemicals identified as priority substances in national and international forums are decreasing over time and will meet relevant cessation and/ or risk management targets;
d) To propose an outline UK monitoring strategy which takes account of emerging and future international obligations on hazardous substances.
PROGRAMME OF WORK
The following tasks are envisaged:
TASK 1
The contractor will be required to produce matrices which include
a) The various hazardous substances which are currently being monitored in connection with international obligations, either at source, or in surface and marine waters and the atmosphere including the frequency, approximate costs per sample, the drivers for continued monitoring, and the possibilities for reducing or stopping monitoring. The ongoing DEFRA research contract which is reviewing information on activities related to monitoring chemicals in the environment will provide much of the information for this task.
b) The hazardous substances which have recently been identified by OSPAR, the EC and other international organisations, and those which are likely to be newly identified for mandatory monitoring programmes over the next five years together with the type of monitoring requirements and costs. It is recognised that there may not be much evidence for some aspects of this task, so it will be important for the consultant to provide explanations for the choice.
The matrices should draw attention to key points or issues using appropriate text boxes, or by using accompanying text and footnotes.
6 With particular reference to OSPAR, relevant EC Directives on water and air
116
An Evaluation of Approaches for Monitoring Emerging Hazardous Substances
TASK 2
The contractor will evaluate the source-orientated approach to monitoring as proposed by Norway in the HARP-HAZ prototype produced in connection with reporting to the 5 th
North Sea Conference. This evaluation should include an overview of how this approach has been used and the in-country infrastructure needed to support it. The limitations of this approach and how works in practice should also be investigated, together with the comparability of results obtained by different Countries, using the Netherlands and Norway as specific examples. The Department will host a small [one day] [2 day] workshop for around 20 people organised and serviced by the consultants to assist this process which should include relevant officials from the UK and experts on source monitoring from Netherlands and Norway7.
TASK 3
In the light of the findings above, the consultant should evaluate the practicalities, logistics and resources necessary for implementing the source-oriented approach in the UK, and bearing in mind the likely mandatory requirements, the contractor should estimate the approximate costs of 4 possible monitoring scenarios8 for the "new" chemicals9 identified in Task 1.:
Using the source-oriented approach;
Using the traditional aquatic/marine based approach;
Using a pragmatic combination of the source and the aquatic/marine approach;
Using biological monitoring accompanied by specific identification techniques.
TASK 4
In the light of the findings in Tasks 1, 2 and 3, propose an outline monitoring strategy for "new chemicals" and list the steps needed to implement this.
7 The Department will supply relevant contact addresses
8 It is expected that these scenarios may need to be modified in the light of progress made during the work.
9 the new chemicals chosen for this task should be agreed by the Department
117

An Evaluation of Approaches for Monitoring Emerging Hazardous Substances
ANNEX II - INCEPTION REPORT
118

An Evaluation of Approaches for Monitoring Emerging Hazardous Substances
119

ANNEX III - CURRENT AND EMERGING HAZARDOUS SUBSTANCE MONITORING REQUIREMENTS
Table 1: Hazardous substances currently being estimated or monitored in connection with international obligations
CAS number Chemical Determinands Marine Freshwater AirPollution Inventory
Bat
hing
Wat
er
Dan
gero
us s
ubst
ance
s (7
6/46
4/EE
C) L
ist I
DSD
Lis
t II s
ubst
ance
s
Drin
king
Wat
er (9
8/83
/EC
)
EPER
Fres
hwat
er fi
sh
(78/
659/
EEC
)
Gro
undw
ater
(80/
68/E
EC)
List
I su
bsta
nces
GW
Lis
t II s
ubst
ance
s
OSP
AR
che
mic
als
for
Prio
rity
Act
ion
Shel
lfish
wat
ers
(79/
923/
EEC
)
Surf
ace
wat
er (7
5/44
0/EE
C)
and
(79/
869/
EEC
)
Tita
nium
oxi
de
UW
WT
WFD
Alphabetical order Monitored Effort Monitored Effort Monitored Effort Water Air
range of chemicals unlisted Brominated diphenylethers X Y Y
104-40-5 (4-(para)-nonylphenol) Y Y Y
205-99-2 (Benzo(b)fluoranthene) Y 55Y 2.78 Y
207-08-9 (Benzo(k)fluoranthene) Y 55Y 2.36 Y
6108-10-7 (gamma-isomer,Lindane) Y
27193-28-8 (para-tert-octylphenol) Y Y
4051-63-2 [1,1'-bianthracene]-9,9',10,10'-tetrone, 4,4'-diamino-
10331-57-4 [1,1'-biphenyl]-2,2'-diol, 5,5'-dichloro
91-94-1 [1,1'-biphenyl]-4,4'-diamine, 3,3'-dichloro-
612-83-9 [1,1'-biphenyl]-4,4'-diamine, 3,3'-dichloro-, dihydrochloride Y
29398-96-7 [1,1'-biphenyl]-4,4'-diamine, N,N'-bis(2,4-dinitrophenyl)-3,3'-dimethoxy-
2668-47-5 [1,1'-biphenyl]-4-ol, 3,5-bis(1,1-dimethylethyl)-
71-55-6 1,1,1-trichloroethane Y 9.7 Y Y Y Y
630-20-6 1,1,2,2,-Tetrachloroethane Y
79-00-5 1,1,2-trichloroethane Y 9.7 Y Y
13654-09-6 1,1'-biphenyl, 2,2',3,3',4,4',5,5',6,6'-decabromo-
2051-24-3 1,1'-biphenyl, 2,2',3,3',4,4',5,5',6,6'-decachloro-
33979-03-2 1,1'-biphenyl, 2,2',4,4',6,6'-hexachloro-
2437-79-8 1,1'-biphenyl, 2,2',4,4'-tetrachloro-
7012-37-5 1,1'-biphenyl, 2,4,4'-trichloro-
92-86-4 1,1'-biphenyl, 4,4'-dibromo-
2050-68-2 1,1'-biphenyl, 4,4'-dichloro-
121

CAS number Chemical Determinands Marine Freshwater AirPollution Inventory
Bat
hing
Wat
er
Dan
gero
us s
ubst
ance
s (7
6/46
4/EE
C) L
ist I
DSD
Lis
t II s
ubst
ance
s
Drin
king
Wat
er (9
8/83
/EC
)
EPER
Fres
hwat
er fi
sh
(78/
659/
EEC
)
Gro
undw
ater
(80/
68/E
EC)
List
I su
bsta
nces
GW
Lis
t II s
ubst
ance
s
OSP
AR
che
mic
als
for
Prio
rity
Act
ion
Shel
lfish
wat
ers
(79/
923/
EEC
)
Surf
ace
wat
er (7
5/44
0/EE
C)
and
(79/
869/
EEC
)
Tita
nium
oxi
de
UW
WT
WFD
41604-19-7 1,1'-biphenyl, 4-bromo-2-fluoro-
1336-36-3 1,1'-biphenyl, chlorinated
36355-01-8 1,1'-biphenyl, hexabromo-
53742-07-7 1,1'-biphenyl, nonachloro-
87-61-6 1,2,3 trichlorobenzene Y 12.28 Y Y
120-82-1 1,2,4-trichlorobenzene Y 12.28 Y Y Y
117-81-7 1,2-benzenedicarboxylic acid, bis(2-ethylhexyl) ester
84-69-5 1,2-benzenedicarboxylic acid, bis(2-methylpropyl) ester
85-68-7 1,2-benzenedicarboxylic acid, butyl phenylmethyl ester
84-74-2 1,2-benzenedicarboxylic acid, dibutyl ester
68515-48-0 1,2-benzenedicarboxylic acid, di-C8-10-alkyl esters, branched
28553-12-0 1,2-benzenedicarboxylic acid, diisononyl ester
27554-26-3 1,2-benzenedicarboxylic acid, diisooctyl ester
117-84-0 1,2-benzenedicarboxylic acid, dioctyl ester
107-06-2 1,2-dichloroethane Y 12.28Y 64 Y Y Y Y Y
1257-78-9 1,2-Ethanedisulfonic acid, compd. with 2-chloro-10-[3-(4-methyl-1-piperazinyl)propyl]-10H-phenothiazine (1:1)
2385-85-5 1,3,4-metheno-1H-cyclobuta[cd]pentalene, 1,1a,2,2,3,3a,4,5,5,5a,5b,6-dodecachlorooctahydro-
143-50-0 1,3,4-metheno-2H-cyclobuta(cd)pentalen-2-one, 1,1a,3,3a,4,5,5,5a,5b,6-decachlorooctahydro-
19666-30-9 1,3,4-oxadiazol-2(3H)-one, 3-[2,4-dichloro-5-(1-methylethoxy)phenyl]-5-(1,1-dimethylethyl)-
52434-90-9 1,3,5-triazine-2,4,6(1H,3H,5H)-trione, 1,3,5-tris(2,3-dibromopropyl)-
26603-40-7 1,3,5-triazine-2,4,6(1H,3H,5H)-trione,
122

CAS number Chemical Determinands Marine Freshwater AirPollution Inventory
Bat
hing
Wat
er
Dan
gero
us s
ubst
ance
s (7
6/46
4/EE
C) L
ist I
DSD
Lis
t II s
ubst
ance
s
Drin
king
Wat
er (9
8/83
/EC
)
EPER
Fres
hwat
er fi
sh
(78/
659/
EEC
)
Gro
undw
ater
(80/
68/E
EC)
List
I su
bsta
nces
GW
Lis
t II s
ubst
ance
s
OSP
AR
che
mic
als
for
Prio
rity
Act
ion
Shel
lfish
wat
ers
(79/
923/
EEC
)
Surf
ace
wat
er (7
5/44
0/EE
C)
and
(79/
869/
EEC
)
Tita
nium
oxi
de
UW
WT
WFD
1,3,5-tris(3-isocyanatomethylphenyl)-
108-70-3 1,3,5-trichlorobenzene Y 12.28 Y Y
106-99-0 1,3-Butadiene Y
77-47-4 1,3-cyclopentadiene, 1,2,3,4,5,5-hexachloro-, hexacyclopentadiene (HCCP) Y
632-79-1 1,3-isobenzofurandione, 4,5,6,7-tetrabromo-
123-91-1 1,4 Dioxane Y
431357 1,4-benzenediamine, N-(1,4-dimethylpentyl)-N'-phenyl-
15233-47-3 1,4-benzenediamine, N-(1-methylheptyl)-N'-phenyl-
64381-97-1 1,4-benzenediamine, N,N,N'-tris(1-methylpropyl)-
3081-14-9 1,4-benzenediamine, N,N'-bis(1,4-dimethylpentyl)-
139-60-6 1,4-benzenediamine, N,N'-bis(1-ethyl-3-methylpentyl)-
93-46-9 1,4-benzenediamine, N,N'-di-2-naphthalenyl-
79-74-3 1,4-benzenediol, 2,5-bis(1,1-dimethylpropyl)-
106-46-7 1,4-Dichlorobenzene Y
5208-93-5 1,4-pentadien-3-ol, 3-methyl-1-(2,6,6-trimethyl-1-cyclohexen-1-yl)-
50-63-5 1,4-pentanediamine, N(4)-(7-chloro-4-quinolinyl)-N(1),N(1)-diethyl-, phosphate (1:2)
69-05-6 1,4-pentanediamine, N4-(6-chloro-2-methoxy-9-aziridinyl)-N1,N1-diethyl-, dihydrochloride Y
54-05-7 1,4-pentanediamine, N4-(7-chloro-4-quinolinyl)-N1,N1-diethyl-
4904-61-4 1,5,9 cyclododecatriene? Y
7212-44-4 1,6,10-dodecatrien-3-ol, 3,7,11-trimethyl-
40716-66-3 1,6,10-dodecatrien-3-ol, 3,7,11-trimethyl-, (E)-
4757-55-5 10(9h)-acridinepropanamine, n,n,9,9-tetramethyl-
123

CAS number Chemical Determinands Marine Freshwater AirPollution Inventory
Bat
hing
Wat
er
Dan
gero
us s
ubst
ance
s (7
6/46
4/EE
C) L
ist I
DSD
Lis
t II s
ubst
ance
s
Drin
king
Wat
er (9
8/83
/EC
)
EPER
Fres
hwat
er fi
sh
(78/
659/
EEC
)
Gro
undw
ater
(80/
68/E
EC)
List
I su
bsta
nces
GW
Lis
t II s
ubst
ance
s
OSP
AR
che
mic
als
for
Prio
rity
Act
ion
Shel
lfish
wat
ers
(79/
923/
EEC
)
Surf
ace
wat
er (7
5/44
0/EE
C)
and
(79/
869/
EEC
)
Tita
nium
oxi
de
UW
WT
WFD
679175 10(9H)-acridinepropanamine, N,N,9,9-tetramethyl-, [R-(R*,R*)]-2,3-dihydroxybutanedioate (1:1)
440-17-5 10H-phenothiazine, 10-[3-(4-methyl-1-piperazinyl)propyl]-2-(trifluoromethyl)-, dihydrochloride Y
58-38-8 10H-Phenothiazine, 2-chloro-10-[3-(4-methyl-1-piperazinyl)propyl]-
239-64-5 13H-dibenzo[a,i]carbazole
57-63-6 17-ethynylestradiol
375-72-4 1-butanesulfonyl fluoride, 1,1,2,2,3,3,4,4,4-nonafluoro-
57648-21-2 1-butanone, 4-[4-(2,3-dihydro-2-thioxo-1
106-89-9 1-Chloro-2,3-Epoxypropane (Epichlorohydrin) Y
469-61-4 1H-3a,7-methanoazulene, 2,3,4,7,8,8a-hexahydro-3,6,8,8-tetramethyl-, [3R-(3alpha,3abeta,7beta,8aalpha)]-
423-50-7 1-hexanesulfonyl fluoride, 1,1,2,2,3,3,4,4,5,5,6,6,6-tridecafluoro-
22916-47-8 1H-imidazole, 1-[2-(2,4-dichlorophenyl)-2-[(2,4-dichlorophenyl)methoxy]ethyl]-
22832-87-7 1H-imidazole, 1-[2-(2,4-dichlorophenyl)-2-[(2,4-dichlorophenyl)methoxy]ethyl]-, mononitrate
116-66-5 1H-indene, 2,3-dihydro-1,1,3,3,5-pentamethyl-4,6-dinitro-
1691-99-2 1-octanesulfonamide, N-ethyl-1,1,2,2,3,3,4,4,5,5,6,6,7,7,8,8,8-heptadecafluoro-N-(2-hydroxyethyl)-
67969-69-1 1-octanesulfonamide, N-ethyl-1,1,2,2,3,3,4,4,5,5,6,6,7,7,8,8,8-heptadecafluoro-N-[2-(phosphonooxy)ethyl]-, diammonium salt
127-25-3 1-phenanthrenecarboxylic acid, 1,2,3,4,4a,4b,5,6,10,10a-decahydro-1,4a-dimethyl-7-(1-methylethyl)-, methyl ester, [1R-(1.alpha.,4a.beta.,4b.alpha.,10a.alpha.)]-
124

CAS number Chemical Determinands Marine Freshwater AirPollution Inventory
Bat
hing
Wat
er
Dan
gero
us s
ubst
ance
s (7
6/46
4/EE
C) L
ist I
DSD
Lis
t II s
ubst
ance
s
Drin
king
Wat
er (9
8/83
/EC
)
EPER
Fres
hwat
er fi
sh
(78/
659/
EEC
)
Gro
undw
ater
(80/
68/E
EC)
List
I su
bsta
nces
GW
Lis
t II s
ubst
ance
s
OSP
AR
che
mic
als
for
Prio
rity
Act
ion
Shel
lfish
wat
ers
(79/
923/
EEC
)
Surf
ace
wat
er (7
5/44
0/EE
C)
and
(79/
869/
EEC
)
Tita
nium
oxi
de
UW
WT
WFD
19941-28-7 1-phenanthrenecarboxylic acid, tetradecahydro-1,4a-dimethyl-7-(1-methylethyl)-, methyl ester, [1R-(1alpha,4abeta,4balpha
666-84-2 1-phenanthrenemethanol, 1,2,3,4,4a,4b,5,6,10,10a-decahydro-1,4a-dimethyl-7-(1-methylethyl)-, [1R-(1.alpha.,4a.beta.,4b.alpha.,10a.alpha.)]-
127-36-6 1-phenanthrenemethanol, 1,2,3,4,4a,4b,5,6,7,9,10,10a-dodecahydro-1,4a-dimethyl-7-(1-methylethyl)-
13393-93-6 1-phenanthrenemethanol, tetradecahydro-1,4a-dimethyl-7-(1-methylethyl)-
69-23-8 1-Piperazineethanol, 4-[3-[2-(trifluoromethyl)-10H-phenothiazin-10-yl]propyl]-
146-56-5 1-Piperazineethanol, 4-[3-[2-(trifluoromethyl)-10H-phenothiazin-10-yl]propyl]-, dihydrochloride Y
6842-15-5 1-propene, tetramer
1606-67-3 1-pyrenamine
51775-36-1 2,2,5-endo,6-exo,8,9,10-heptachloronorbornane
36065-30-2 2,4,6-bromophenyl 1-2(2,3-dibromo-2-methylpropyl) * Y
88-060-2 2,4,6-Trichlorophenol Y 55
732-26-3 2,4,6-tri-tert-butylphenol Y
94-75-7 2,4-D (non ester) Y 9.7 Y Y
94-75-7? 2,4-D (total ester) Y 9.7Y 139 Y Y
102-83-2 2,4-dichlorophenol Y 9.7Y 139 Y Y
50471-44-8 2,4-oxazolidinedione, 3-(3,5-dichlorophenyl)-5-ethenyl-5-methyl-
583-78-8 2,5-Dichlorophenol Y 55
1024-57-3 2,5-methano-2H-indeno[1,2-b]oxirene, 2,3,4,5,6,7,7-heptachloro-1a,1b,5,5a,6,6a-hexahydro-, (1a.alpha.,1b.beta.,2.alpha.,5.alpha.,5a.beta.,6.beta.,6a.alpha.)-
125
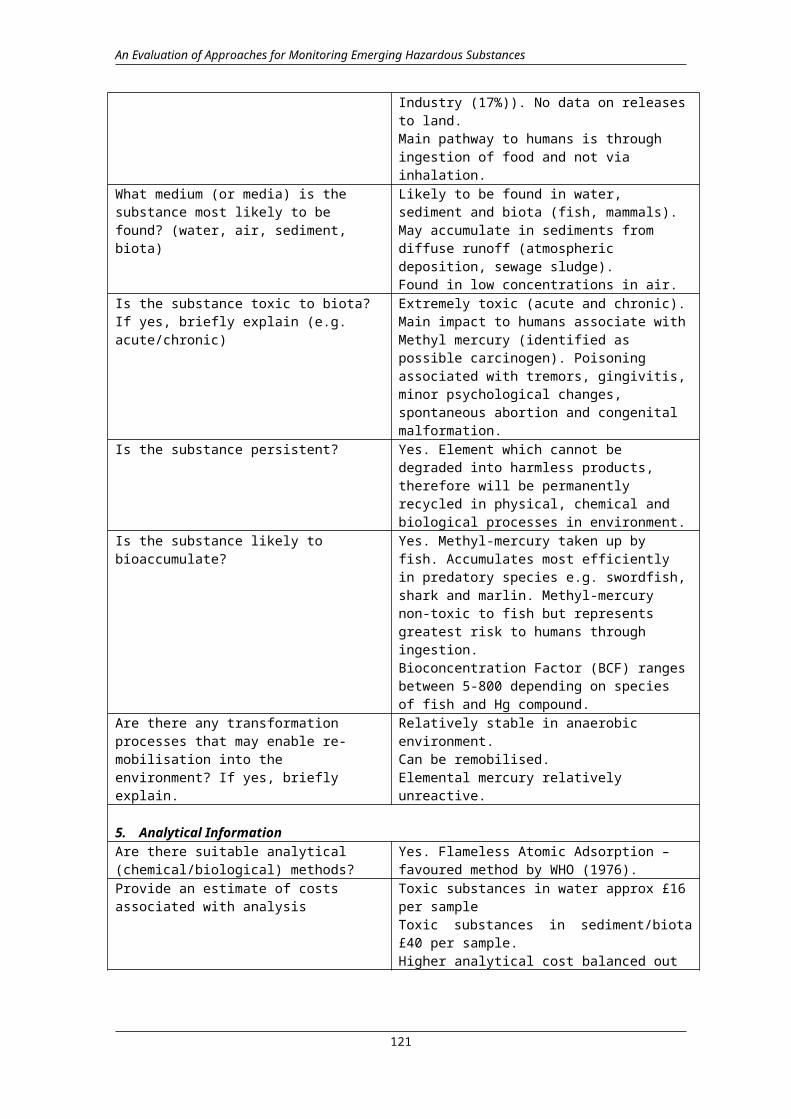
CAS number Chemical Determinands Marine Freshwater AirPollution Inventory
Bat
hing
Wat
er
Dan
gero
us s
ubst
ance
s (7
6/46
4/EE
C) L
ist I
DSD
Lis
t II s
ubst
ance
s
Drin
king
Wat
er (9
8/83
/EC
)
EPER
Fres
hwat
er fi
sh
(78/
659/
EEC
)
Gro
undw
ater
(80/
68/E
EC)
List
I su
bsta
nces
GW
Lis
t II s
ubst
ance
s
OSP
AR
che
mic
als
for
Prio
rity
Act
ion
Shel
lfish
wat
ers
(79/
923/
EEC
)
Surf
ace
wat
er (7
5/44
0/EE
C)
and
(79/
869/
EEC
)
Tita
nium
oxi
de
UW
WT
WFD
52740-90-6 2-anthracenecarboxamide, 1-amino-N-(3-bromo-9,10-dihydro-9,10-dioxo-2-anthracenyl)-9,10-dihydro-9,10-dioxo-
68083-48-7 2-butanone, O-[[[[1,3,3-trimethyl-5-[[[[(1-methylpropylidene)amino]oxy]carbonyl]amino]cyclohexyl]methyl]amino]carbonyl]oxime
6119-92-2 2-butenoic acid, 2-(1-methylheptyl)-4,6-dinitrophenyl ester
39300-45-3 2-butenoic acid, 2(or 4)-isooctyl-4,6(or 2,6)-dinitrophenyl ester
485-31-4 2-butenoic acid, 3-methyl-, 2-(1-methylpropyl)-4,6-dinitrophenyl ester
not listed 2-chloro-4-nitroluene Y 9.7
not listed 2-chloro-5-nitroluene Y 9.7
83-42-1 2-chloro-6-nitroluene Y 9.7
95-57-8 2-chlorophenol Y 9.7Y 194 Y Y
?? 3-chlorophenol Y
112-15-2? 2-Ethoxyethanol Y
28772-56-7 2H-1-benzopyran-2-one, 3-[3-(4'-bromo[1,1'-biphenyl]-4-yl)-3-hydroxy-1-phenylpropyl]-4-hydroxy-
39083-38-0 2-hexene, 3,4,5,5-tetramethyl-
not listed 2-Methylphenol Y 55
494-03-1 2-naphthalenamine, N,N-bis(2-chloroethyl)-
67124-09-8 2-propanol, 1-(tert-dodecylthio)-
59447-55-1 2-propenoic acid, (pentabromophenyl)methyl ester
559-11-5 2-propenoic acid, 2,2,3,3,4,4,5,5,6,6,7,
55525-54-7 3,3'-(ureylenedimethylene)bis(3,5,5-trimethylcyclohexyl) diisocyanate* Y
95-76-1 3,4-dichloroaniline
14816-18-3 3,5-dioxa-6-aza-4-phosphaoct-6-ene-8-nitrile, 4-ethoxy-7-phenyl-, 4-sulfide
515-69-5 3-cyclohexene-1-methanol, .alpha.,4-dimethyl-.alpha.-(4-methyl-3-pentenyl)-, (R*,R*)-
126

CAS number Chemical Determinands Marine Freshwater AirPollution Inventory
Bat
hing
Wat
er
Dan
gero
us s
ubst
ance
s (7
6/46
4/EE
C) L
ist I
DSD
Lis
t II s
ubst
ance
s
Drin
king
Wat
er (9
8/83
/EC
)
EPER
Fres
hwat
er fi
sh
(78/
659/
EEC
)
Gro
undw
ater
(80/
68/E
EC)
List
I su
bsta
nces
GW
Lis
t II s
ubst
ance
s
OSP
AR
che
mic
als
for
Prio
rity
Act
ion
Shel
lfish
wat
ers
(79/
923/
EEC
)
Surf
ace
wat
er (7
5/44
0/EE
C)
and
(79/
869/
EEC
)
Tita
nium
oxi
de
UW
WT
WFD
25428-43-7 3-cyclohexene-1-methanol, .alpha.,4-dimethyl-.alpha.-(4-methyl-3-pentenyl)-, (R*,R*)-(.+-.)-
23089-26-1 3-cyclohexene-1-methanol, alpha,4-dimethyl-alpha-(4-methyl-3-pentenyl)-, [S-(R1,R1)]-
123-48-8 3-heptene, 2,2,4,6,6-pentamethyl-
not listed 3-Methylphenol Y 55
793-24-8 4-(dimethylbutylamino)diphenylamin (6PPD) Y
80-05-7 4,4'-methylethylidenebisphenol
57-74-9 4,7-methano-1H-indene, 1,2,4,5,6,7,8,8-octachloro-2,3,3a,4,7,7a-hexahydro-
76-44-8 4,7-methano-1H-indene, 1,4,5,6,7,8,8-heptachloro-3a,4,7,7a-tetrahydro-
3734-48-3 4,7-methano-1H-indene, 4,5,6,7,8,8-hexachloro-3a,4,7,7a-tetrahydro-
297-78-9 4,7-methanoisobenzofuran, 1,3,4,5,6,7,8,8-octachloro-1,3,3a,4,7,7a-hexahydro-
115-27-5 4,7-methanoisobenzofuran-1,3-dione, 4,5,6,7,8,8-hexachloro-3a,4,7,7a-tetrahydro-
not listed 4-4'-Methyenediphenyl diisocyanate Y
89-59-8 4-chloro-2-nitroluene Y 9.7
59-50-7 4-chloro-3-methylphenol Y 9.7Y 139 Y Y
not listed 4-chloro-3-nitroluene Y 9.7
59467-70-8 4H-imidazo[1,5-a][1,4]benzodiazepine, 8-chloro-6-(2-fluorophenyl)-1-methyl-
26864-56-2 4-piperidinol, 1-[4,4-bis(4-fluorophenyl
4-tert-butyltoluene Y
82-05-3 7H-benz[de]anthracen-7-one
81-98-1 7H-benz[de]anthracen-7-one, 3,9-dibromo-
81-96-9 7H-benz[de]anthracen-7-one, 3-bromo-
194-59-2 7H-dibenzo[c,g]carbazole
17354-14-2 9,10-anthracenedione, 1,4-bis(butylamino)-
128-83-6 9,10-anthracenedione, 1-amino-2-bromo-
127

CAS number Chemical Determinands Marine Freshwater AirPollution Inventory
Bat
hing
Wat
er
Dan
gero
us s
ubst
ance
s (7
6/46
4/EE
C) L
ist I
DSD
Lis
t II s
ubst
ance
s
Drin
king
Wat
er (9
8/83
/EC
)
EPER
Fres
hwat
er fi
sh
(78/
659/
EEC
)
Gro
undw
ater
(80/
68/E
EC)
List
I su
bsta
nces
GW
Lis
t II s
ubst
ance
s
OSP
AR
che
mic
als
for
Prio
rity
Act
ion
Shel
lfish
wat
ers
(79/
923/
EEC
)
Surf
ace
wat
er (7
5/44
0/EE
C)
and
(79/
869/
EEC
)
Tita
nium
oxi
de
UW
WT
WFD
4-[(4-methylphenyl)amino]-
15114-15-5 9,10-anthracenedione, 4,8-diamino-2-(4-ethoxyphenyl)-1,5-dihydroxy-
83-32-9 acenaphthylene, 1,2-dihydro-
57966-95-7 Acetaldehyde (Ethanal) Y
60-35-5 acetamide, 2-cyano-N-[(ethylamino)carbonyl]-2-(methoxyimino)-
2545-59-7 acetic acid, (2,4,5-trichlorophenoxy)-, 2-butoxyethyl ester
1928-47-8 acetic acid, (2,4,5-trichlorophenoxy)-, 2-ethylhexyl ester
93-79-8 acetic acid, (2,4,5-trichlorophenoxy)-, butyl ester
25168-15-4 acetic acid, (2,4,5-trichlorophenoxy)-, isooctyl ester
120-39-8 acetic acid, (2,4,5-trichlorophenoxy)-, pentyl ester
75-05-8 Acetotrinitrile Y
107-13-1 Acrylonitrile Y
15972-60-8 Alachlor Y
309-00-2 Aldrin Y 12.28 Y Y
not listed alkanes, C14-17, chloro
7429-90-5 Aluminium Y 8 Y 0.36 Y
7664-41-7 ammonia/ammonium Y Y Y Y Y
315-37-7 androst-4-en-3-one, 17-[(1-oxoheptyl)oxy]-, (17.beta.)-
62-53-3 Aniline Y
120-12-7 Anthracene Y 12.28 Y 2.34 Y
90640-80-5 anthracene oil
90640-81-6 anthracene oil, anthracene paste
91995-15-2 anthracene oil, anthracene paste, anthracene fraction
91995-17-4 anthracene oil, anthracene paste, distn. Lights
90640-82-7 anthracene oil, anthracene-low
7440-36-0 Antimony Y 0.36 Y Y
7440-38-2 Arsenic Y 8Y 194Y 7.3Y Y Y Y Y Y Y Y
128

CAS number Chemical Determinands Marine Freshwater AirPollution Inventory
Bat
hing
Wat
er
Dan
gero
us s
ubst
ance
s (7
6/46
4/EE
C) L
ist I
DSD
Lis
t II s
ubst
ance
s
Drin
king
Wat
er (9
8/83
/EC
)
EPER
Fres
hwat
er fi
sh
(78/
659/
EEC
)
Gro
undw
ater
(80/
68/E
EC)
List
I su
bsta
nces
GW
Lis
t II s
ubst
ance
s
OSP
AR
che
mic
als
for
Prio
rity
Act
ion
Shel
lfish
wat
ers
(79/
923/
EEC
)
Surf
ace
wat
er (7
5/44
0/EE
C)
and
(79/
869/
EEC
)
Tita
nium
oxi
de
UW
WT
WFD
68844-77-9 astemizole
1912-24-9 Atrazine Y 9.7 Y Y Y
2642-71-9 Azinphos-ethyl Y 9.7 Y Y
86-50-0 Azinphos-methyl Y 9.7 Y
7440-39-3 Barium Y 55 Y Y
25057-89-0 Bentazone Y 9.7 Y
57-97-6 benz[a]anthracene, 7,12-dimethyl-
56-49-5 benz[j]aceanthrylene, 1,2-dihydro-3-methyl-
100-52-7 Benzaldehyde Y
50849-47-3 benzaldehyde, 2-hydroxy-5-nonyl-, oxime
2277-92-1 benzamide, 2,3,5-trichloro-N-(3,5-dichlo
57808-65-8 benzamide, N-[5-chloro-4-[(4-chlorophenyl)cyanomethyl]-2-methylphenyl]-2-hydroxy-3,5-diiodo-
527-20-8 benzenamine, 2,3,4,5,6-pentachloro-
634-83-3 benzenamine, 2,3,4,5-tetrachloro-
3481-20-7 benzenamine, 2,3,5,6-tetrachloro-
74070-46-5 benzenamine, 2-chloro-6-nitro-3-phenoxy-
29312-59-2 benzenamine, 4-(2,6-diphenyl-4-pyridinyl)-N,N-dimethyl-
129-73-7 benzenamine, 4,4'-(phenylmethylene)bis[N,N-dimethyl-
13680-35-8 benzenamine, 4,4'-methylenebis[2,6-diethyl-
5285-60-9 benzenamine, 4,4'-methylenebis[N-(1-methylpropyl)-
135-91-1 benzenamine, 4,4'-methylenebis[N,N-diethyl-
40487-42-1 benzenamine, N-(1-ethylpropyl)-3,4-dimethyl-2,6-dinitro-
26399-36-0 benzenamine, N-(cyclopropylmethyl)-2,6-dinitro-N-propyl-4-(trifluoromethyl)-
37893-02-0 benzenamine, N-[3-phenyl-4,5-bis[(trifluoromethyl)imino]-2-thiazolidinylidene]-
129

CAS number Chemical Determinands Marine Freshwater AirPollution Inventory
Bat
hing
Wat
er
Dan
gero
us s
ubst
ance
s (7
6/46
4/EE
C) L
ist I
DSD
Lis
t II s
ubst
ance
s
Drin
king
Wat
er (9
8/83
/EC
)
EPER
Fres
hwat
er fi
sh
(78/
659/
EEC
)
Gro
undw
ater
(80/
68/E
EC)
List
I su
bsta
nces
GW
Lis
t II s
ubst
ance
s
OSP
AR
che
mic
als
for
Prio
rity
Act
ion
Shel
lfish
wat
ers
(79/
923/
EEC
)
Surf
ace
wat
er (7
5/44
0/EE
C)
and
(79/
869/
EEC
)
Tita
nium
oxi
de
UW
WT
WFD
1861-40-1 benzenamine, N-butyl-N-ethyl-2,6-dinitro-4-(trifluoromethyl)-
71-43-2 Benzene Y 9.7Y 140 Y Y Y Y Y
83-66-9 benzene, 1-(1,1-dimethylethyl)-2-methoxy-4-methyl-3,5-dinitro-
98-51-1 benzene, 1-(1,1-dimethylethyl)-4-methyl- Y
21850-44-2 benzene, 1,1'-(1-methylethylidene)bis[3,5-dibromo-4-(2,3-dibromopropoxy)-
50-29-3 benzene, 1,1'-(2,2,2-trichloroethylindine)bis[4-chloro-
475-26-3 benzene, 1,1'-(2,2,2-trichloroethylindine)bis[4-fluoro-
72-54-8 benzene, 1,1'-(2,2-dichloroethylidene)bis[4-chloro-
72-55-9 benzene, 1,1'-(dichloroethenylidene)bis[4-chloro-
101-81-5 benzene, 1,1'-methylenebis-
101-76-8 benzene, 1,1'-methylenebis[4-chloro-
32536-52-0 benzene, 1,1'-oxybis-, octabromo deriv.
32534-81-9 benzene, 1,1'-oxybis-, pentabromo deriv.
1163-19-5 benzene, 1,1'-oxybis[2,3,4,5,6-pentabromo-
634-66-2 benzene, 1,2,3,4-tetrachloro-
634-90-2 benzene, 1,2,3,5-tetrachloro-
95-94-3 benzene, 1,2,4,5-tetrachloro-
6936-40-9 benzene, 1,2,4,5-tetrachloro-3-methoxy-
116-29-0 benzene, 1,2,4-trichloro-5-[(4-chlorophenyl)sulfonyl]-
3278-89-5 benzene, 1,3,5-tribromo-2-(2-propenyloxy)-
1836-77-7 benzene, 1,3,5-trichloro-2-(4-nitrophenoxy)-
1460-02-2 benzene, 1,3,5-tris(1,1-dimethylethyl)-
41999-84-2 benzene, 1,4-dichloro-2,5-bis(dichloromethyl)-
65925-28-2 benzene, 1-[2-(2-chloroethoxy)ethoxy]-4-(1,1,3,3-tetramethylbutyl)-
42074-68-0 benzene, 1-chloro-2-
130

CAS number Chemical Determinands Marine Freshwater AirPollution Inventory
Bat
hing
Wat
er
Dan
gero
us s
ubst
ance
s (7
6/46
4/EE
C) L
ist I
DSD
Lis
t II s
ubst
ance
s
Drin
king
Wat
er (9
8/83
/EC
)
EPER
Fres
hwat
er fi
sh
(78/
659/
EEC
)
Gro
undw
ater
(80/
68/E
EC)
List
I su
bsta
nces
GW
Lis
t II s
ubst
ance
s
OSP
AR
che
mic
als
for
Prio
rity
Act
ion
Shel
lfish
wat
ers
(79/
923/
EEC
)
Surf
ace
wat
er (7
5/44
0/EE
C)
and
(79/
869/
EEC
)
Tita
nium
oxi
de
UW
WT
WFD
(chlorodiphenylmethyl)-
789-02-6 benzene, 1-chloro-2-[2,2,2-trichloro-1-(4-chlorophenyl)ethyl]-
3424-82-6 benzene, 1-chloro-2-[2,2-dichloro-1-(4-chlorophenyl)ethenyl]-
53-19-0 benzene, 1-chloro-2-[2,2-dichloro-1-(4-chlorophenyl)ethyl]-
134-83-8 benzene, 1-chloro-4-(chlorophenylmethyl)-
121-14-2 benzene, 1-methyl-2,4-dinitro-
1836-75-5 benzene, 2,4-dichloro-1-(4-nitrophenoxy)-
25321-09-9 benzene, bis(1-methylethyl)-
87-82-1 benzene, hexabromo-
38521-51-6 benzene, pentabromo(bromomethyl)-
87-83-2 benzene, pentabromomethyl-
82-68-8 benzene, pentachloronitro-
not listed Benzene-1,2,4-Tricarboxylic Acid 1,2-Anhydride Y
51630-58-1 benzeneacetic acid, 4-chloro-.alpha.-(1-methylethyl)-, cyano (3-phenoxyphenyl)methyl ester
66230-04-4 benzeneacetic acid, 4-chloro-.alpha.-(1-methylethyl)-, cyano(3-phenoxyphenyl)methyl ester, [S-(R*,R*)]-
510-15-6 benzeneacetic acid, 4-chloro-.alpha.-(4-chlorophenyl)-.alpha.-hydroxy-, ethyl ester
80-06-8 benzenemethanol, 4-chloro-.alpha.-(4-chlorophenyl)-.alpha.-methyl-
56296-78-7 benzenepropanamine, N-methyl-.gamma.-[4-(trifluoromethyl)phenoxy]-, hydrochloride Y
68015-60-1 benzenesulfonic acid, 2-amino-, (1-methylethylidene)di-4,1-phenylene ester
133-49-3 benzenethiol, pentachloro-
68-90-6 benziodarone
56-55-3 Benzo(a)anthracene Y 12.28
50-32-8 Benzo(a)pyrene Y 12.28Y 55Y 2.76 Y Y
191-24-2 Benzo(ghi)perylene Y 12.28 Y 2.76 Y
131

CAS number Chemical Determinands Marine Freshwater AirPollution Inventory
Bat
hing
Wat
er
Dan
gero
us s
ubst
ance
s (7
6/46
4/EE
C) L
ist I
DSD
Lis
t II s
ubst
ance
s
Drin
king
Wat
er (9
8/83
/EC
)
EPER
Fres
hwat
er fi
sh
(78/
659/
EEC
)
Gro
undw
ater
(80/
68/E
EC)
List
I su
bsta
nces
GW
Lis
t II s
ubst
ance
s
OSP
AR
che
mic
als
for
Prio
rity
Act
ion
Shel
lfish
wat
ers
(79/
923/
EEC
)
Surf
ace
wat
er (7
5/44
0/EE
C)
and
(79/
869/
EEC
)
Tita
nium
oxi
de
UW
WT
WFD
215-58-7 benzo[b]triphenylene
195-19-7 benzo[c]phenanthrene
192-97-2 benzo[e]pyrene
189-55-9 benzo[rst]pentaphene
29098-15-5 benzoic acid, 2-[(2,6-dichloro-3-methylp
42576-02-3 benzoic acid, 5-(2,4-dichlorophenoxy)-2-nitro-, methyl ester
100-44-7 Benzyl Chloride (A-Chlorotoluene) Y Y
7440-41-7 Beryllium Y Y Y
36861-47-9 bicyclo(2.2.1)heptan-2-one, 1,7,7-trimethyl-3-[(4-methylphenyl)methylene]-
3389-71-7 bicyclo[2.2.1]hepta-2,5-diene, 1,2,3,4,7,7-hexachloro-
79-92-5 bicyclo[2.2.1]heptane, 2,2-dimethyl-3-methylene-
80-56-8 bicyclo[3.1.1]hept-2-ene, 2,6,6-trimethyl-
92-52-4 Biphenyl Y 9.7Y 140 Y Y
1303-86-2? Boron Y 8Y 140 Y Y Y
range of chemicals unlisted brominated flame retardants Y
1715-40-8 bromocylene
10457-90-6 bromperidol
50772-29-7 butanoyl chloride, 4-[2,4-bis(1,1-dimethylpropyl)phenoxy]- Y
25167-67-3 Butene (all Isomers) Y
25013-16-5 butylhydroxyanisol
98-54-4 butylphenol
C 10-13 -chloroalkanes X Y Y
7440-43-9 Cadmium Y 8Y 119Y 6.5Y Y Y Y Y Y Y Y Y Y Y
10108-64-2 cadmium chloride Y
7440-70-2 Calcium Y 840Y 146 Y
2303-17-5 carbamothioic acid, bis(1-methylethyl)-, S-(2,3,3-trichloro-2-propenyl) ester
56-23-5 carbon tetrachloride Y
11028-42-5 cedrene-
132
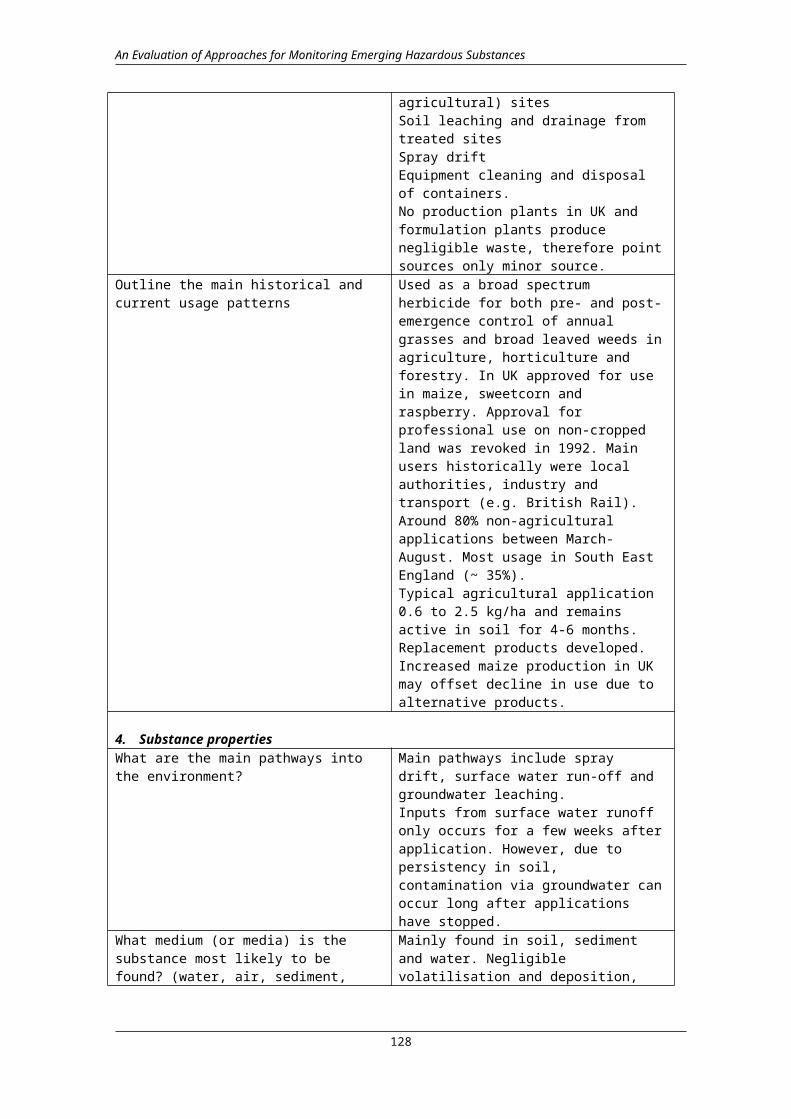
CAS number Chemical Determinands Marine Freshwater AirPollution Inventory
Bat
hing
Wat
er
Dan
gero
us s
ubst
ance
s (7
6/46
4/EE
C) L
ist I
DSD
Lis
t II s
ubst
ance
s
Drin
king
Wat
er (9
8/83
/EC
)
EPER
Fres
hwat
er fi
sh
(78/
659/
EEC
)
Gro
undw
ater
(80/
68/E
EC)
List
I su
bsta
nces
GW
Lis
t II s
ubst
ance
s
OSP
AR
che
mic
als
for
Prio
rity
Act
ion
Shel
lfish
wat
ers
(79/
923/
EEC
)
Surf
ace
wat
er (7
5/44
0/EE
C)
and
(79/
869/
EEC
)
Tita
nium
oxi
de
UW
WT
WFD
certain phthalates: dibutylphthalate, diethylhexylphthalate Y
CFC's (Chlorofluorocarbons) Y
470-90-6 Chlorfenvinphos Y 9.7 Y Y
7782-50-5 Chlorine Y 0.36 Y Y Y Y
Chloro-alkanes Y
75-01-4 Chloroethene (Chloroethylene, Vinyl Chloride) Y Y
67-66-3 Chloroform Y 12.28Y 64 Y Y Y Y
74-87-3 Chloromethane Y
(not listed) Chloronitrotoluene Y 9.7Y 140 Y Y
50-53-3 chlorpromazine
2921-88-2 Chlorpyrifos (X) Y
18540-29-9 Chromium Y 8Y 194Y 6.5Y Y Y Y Y Y Y Y
218-01-9 Chrysene Y 12.28
3351-28-8 chrysene, 1-methyl-
1705-85-7 chrysene, 6-methyl-
23593-75-1 clotrimazole Y
7440-48-4 Cobalt Y 0.36 Y Y Y
7440-50-8 Copper Y 8Y 1267Y 6.5Y Y Y Y Y Y Y Y
191-07-1 coronene
420-04-2 Cyanamide Y
57-12-5 Cyanide Y 55 Y Y Y Y Y
294-62-2 cyclododecane Y
3178-22-1 cyclohexane, (1,1-dimethylethyl)-
608-73-1 cyclohexane, 1,2,3,4,5,6-hexachloro- Y
58-89-9 cyclohexane, 1,2,3,4,5,6-hexachloro-, (1.alpha.,2.alpha.,3.beta.,4.alpha.,5.alpha.,6.beta.)- Y
4098-71-9 cyclohexane, 5-isocyanato-1-(isocyanatomethyl)-1,3,3-trimethyl-
54914-37-3 cyclohexanemethanamine, 1,3,3-trimethyl-N-(2-methylpropylidene)-5-[(2-methylpropylidene)amino]-
68877-29-2 cyclohexanol, (1,7,7-trimethylbicyclo[2.2.1]hept-2-yl)-
133

CAS number Chemical Determinands Marine Freshwater AirPollution Inventory
Bat
hing
Wat
er
Dan
gero
us s
ubst
ance
s (7
6/46
4/EE
C) L
ist I
DSD
Lis
t II s
ubst
ance
s
Drin
king
Wat
er (9
8/83
/EC
)
EPER
Fres
hwat
er fi
sh
(78/
659/
EEC
)
Gro
undw
ater
(80/
68/E
EC)
List
I su
bsta
nces
GW
Lis
t II s
ubst
ance
s
OSP
AR
che
mic
als
for
Prio
rity
Act
ion
Shel
lfish
wat
ers
(79/
923/
EEC
)
Surf
ace
wat
er (7
5/44
0/EE
C)
and
(79/
869/
EEC
)
Tita
nium
oxi
de
UW
WT
WFD
5989-27-5 cyclohexene, 1-methyl-4-(1-methylethenyl)-, (R)-
64257-84-7 cyclopropanecarboxylic acid, 2,2,3,3,-tetramethyl-, cyano(3-phenoxyphenol)methyl ester, (.+-.)-
39515-41-8 cyclopropanecarboxylic acid, 2,2,3,3-tetramethyl-, cyano(3-phenoxyphenyl)methyl ester
52918-63-5 cyclopropanecarboxylic acid, 3-(2,2-dibromoethenyl)-2,2-dimethyl-, cyano(3-phenoxyphenyl)methyl ester, [1R-[1.alpha.(S*),3.alpha.]]-
52315-07-8 cyclopropanecarboxylic acid, 3-(2,2-dichloroethenyl)-2,2-dimethyl-, cyano(3-phenoxyphenyl)methyl ester
67375-30-8 cyclopropanecarboxylic acid, 3-(2,2-dichloroethenyl)-2,2-dimethyl-, cyano(3-phenoxyphenyl)methyl ester, [1-alpha.(S*),3.alpha.]-(.+-.)-
68085-85-8 cyclopropanecarboxylic acid, 3-(2-chloro-3,3,3-trifluoro-1-propenyl)-2,2-dimethyl-, cyano(3-phenoxyphenyl)methyl ester
68359-37-5 cyclopropanecarboxylic acid, 3-(2,2-dichloroethenyl)-2,2-dimethyl-, cyano(4-fluoro-3-phenoxyphenyl)methyl ester, Cyfluthrin Y 9.7
8065-48-3 Demeton Y 9.7 Y Y
298-03-3 Demeton – o Y 9.7 Y
126-75-0 Demeton – s Y 9.7 Y
919-86-8 Demeton – s – methyl Y 9.7 Y
17040-19-6 Demeton – s – methyl sulphone Y 9.7 Y
Di(2-ethylhexyl)phthalate (DEHP)(X) Y Y
333-41-5 Diazinon Y 9.7 Y
53-70-3 dibenz[a,h]anthracene
224-41-9 dibenz[a,j]anthracene
1746-01-6 dibenzo(b,e)(1,4)dioxin, 2,3,7,8-tetrachloro- Y
189-64-0 dibenzo[b,def]chrysene
191-26-4 dibenzo[def,mno]chrysene
4378-61-4 dibenzo[def,mno]chrysene-6,12-dione,
134
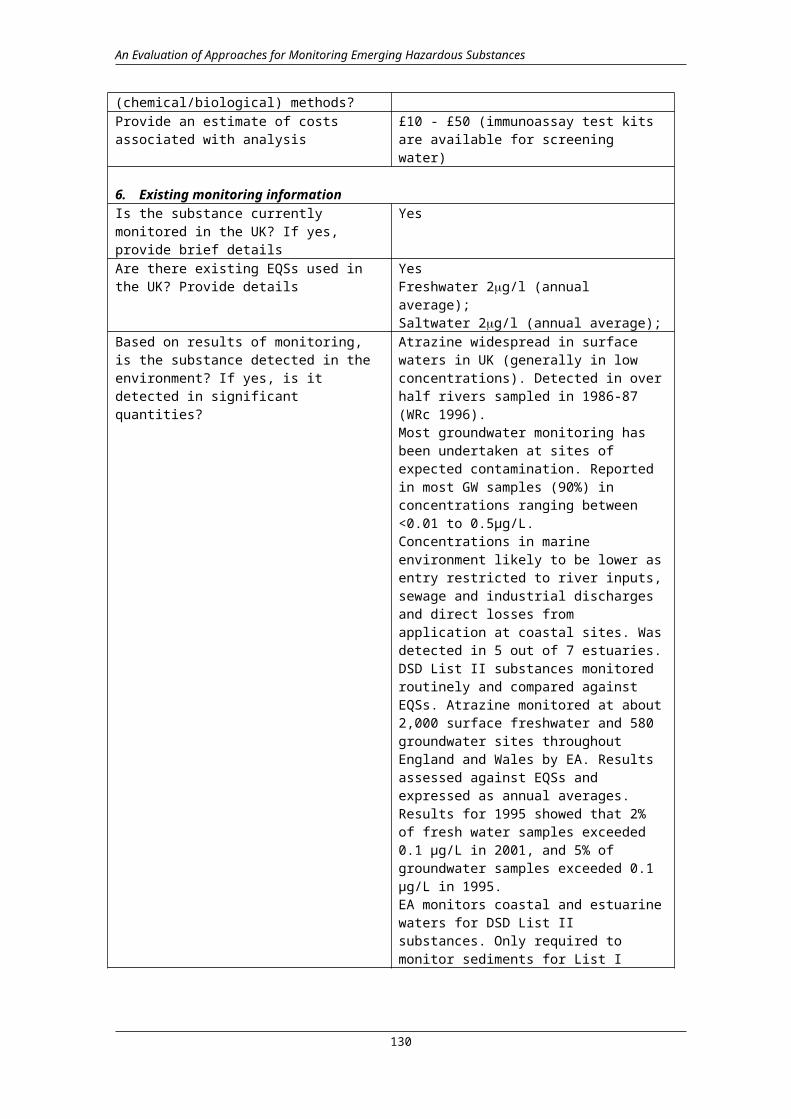
CAS number Chemical Determinands Marine Freshwater AirPollution Inventory
Bat
hing
Wat
er
Dan
gero
us s
ubst
ance
s (7
6/46
4/EE
C) L
ist I
DSD
Lis
t II s
ubst
ance
s
Drin
king
Wat
er (9
8/83
/EC
)
EPER
Fres
hwat
er fi
sh
(78/
659/
EEC
)
Gro
undw
ater
(80/
68/E
EC)
List
I su
bsta
nces
GW
Lis
t II s
ubst
ance
s
OSP
AR
che
mic
als
for
Prio
rity
Act
ion
Shel
lfish
wat
ers
(79/
923/
EEC
)
Surf
ace
wat
er (7
5/44
0/EE
C)
and
(79/
869/
EEC
)
Tita
nium
oxi
de
UW
WT
WFD
4,10-dibromo-
191-30-0 dibenzo[def,p]chrysene
132-65-0 dibenzothiophene
75-09-2 Dichloromethane (methylene Chloride or Dichloride) Y Y Y
62-73-7 Dichlorvos Y 9.7 Y Y
115-32-2 dicofol Y
18080 dicroden
3972-13-2 DIDT
60-57-1 Dieldrin Y 12.28 Y Y
64-67-5 Diethyl Sulphate Y
56-53-1 diethylstilbestrol
60-51-5 Dimethoate Y 9.7 Y Y
77-78-1 Dimethyl Suphate Y
68-12-2 Dimethylformamide Y
512-04-9 diosgenin* Y
not listed Dioxins Y Y Y
56-35-9 distannoxane, hexabutyl-
13356-08-6 distannoxane, hexakis(2-methyl-2-phenylpropyl)-
91995-42-5 distillates (coal tar), heavy oils, pyrene fraction
91995-52-7 distillates (coal tar), pitch, pyrene fraction
101316-50-1 distillates (petroleum), alkene-alkyne manuf. pyrolysis oil, condensed arom. ring-contg.
90640-86-1 distillates, coal tar, heavy oils
Diuron (X) Y
97280-83-6 dodecene, branched
115-29-7 Endosulphan Y 9.7 Y Y Y Y
72-20-8 Endrin Y 12.28 Y
67-72-1 ethane, hexachloro-
8072-20-6 ethanol, 1,1-bis(4-chlorophenyl)-, mixed
135

CAS number Chemical Determinands Marine Freshwater AirPollution Inventory
Bat
hing
Wat
er
Dan
gero
us s
ubst
ance
s (7
6/46
4/EE
C) L
ist I
DSD
Lis
t II s
ubst
ance
s
Drin
king
Wat
er (9
8/83
/EC
)
EPER
Fres
hwat
er fi
sh
(78/
659/
EEC
)
Gro
undw
ater
(80/
68/E
EC)
List
I su
bsta
nces
GW
Lis
t II s
ubst
ance
s
OSP
AR
che
mic
als
for
Prio
rity
Act
ion
Shel
lfish
wat
ers
(79/
923/
EEC
)
Surf
ace
wat
er (7
5/44
0/EE
C)
and
(79/
869/
EEC
)
Tita
nium
oxi
de
UW
WT
WFD
32388-55-9 ethanone, 1-(2,3,4,7,8,8a-hexahydro-3,6,8,8-tetramethyl-1H-3a,7-methanoazulen-5-yl)-, [3R-(3alpha,3abeta,7beta,8aalpha)]
68517-09-9 ethanone, 1-(2-hydroxy-5-tert-nonylphenyl)-, oxime
57499-57-7 ethanone, 1-[1,6-dimethyl-4-(4-methyl-3-pentenyl)-3-cyclohexen-1-yl]-
140-88-5 Ethyl acrylate Y
2104-64-5 ethyl O-(p-nitrophenyl) phenyl phosphonothionate Y
611-14-3 Ethyl Toluene Y
100-41-4 Ethylbenzene Y
74-85-1 Ethylene Y
75-21-8 Ethylene Oxide Y
7440-53-1 Europium Y 0.36
122-14-5 Fenitrothion Y 9.7 Y Y
55-38-9 Fenthion Y 9.7 Y
not listed Flucofuron Y 9.7
70124-77-5 flucythrinate* Y
206-44-0 Fluoranthene Y 12.28Y 55Y 2.76 Y
Fluoride Y 55 Y Y
7782-41-4 Fluorine Y
50-00-0 Formaldehyde Y 64 Y
110-00-9 Furans Y Y
69898-41-5 furo[3,4-b]pyridin-7(5H)-one, 5-[4-(diethylamino)-2-ethoxyphenyl]-5-(1-ethyl-2-methyl-1H-indol-3-yl)-
7440-57-5 Gold Y 0.36
Halogenated Organic Compounds Y
Halons Y
range of chemicals unlisted HCFC's (Hydrochlorofluorocarbons) Y
789-02-6 HCH - beta Y 12.28 Y Y Y Y Y
same as above? HCH – alpha Y 12.28 Y Y Y
136

CAS number Chemical Determinands Marine Freshwater AirPollution Inventory
Bat
hing
Wat
er
Dan
gero
us s
ubst
ance
s (7
6/46
4/EE
C) L
ist I
DSD
Lis
t II s
ubst
ance
s
Drin
king
Wat
er (9
8/83
/EC
)
EPER
Fres
hwat
er fi
sh
(78/
659/
EEC
)
Gro
undw
ater
(80/
68/E
EC)
List
I su
bsta
nces
GW
Lis
t II s
ubst
ance
s
OSP
AR
che
mic
als
for
Prio
rity
Act
ion
Shel
lfish
wat
ers
(79/
923/
EEC
)
Surf
ace
wat
er (7
5/44
0/EE
C)
and
(79/
869/
EEC
)
Tita
nium
oxi
de
UW
WT
WFD
same as above? HCH – delta Y 12.28 Y Y Y
same as above? HCH – gamma Y 12.28 Y Y Y
1335-87-1 heptachloronaphthalene* Y
28680-45-7 heptachloronorbornene* Y
62199-62-6 heptane, 2,2,4,4,6-pentamethyl-
335-57-9 heptane, hexadecafluoro-
26447-49-4 hexabromododecane
118-74-1 Hexachlorobenzene Y 9.7 Y Y Y Y
87-68-3 Hexachlorobutadiene Y 9.7Y 64 Y Y Y Y
1335-87-1 hexachloronaphthalene Y
107-46-0 hexamethyldisiloxane (HMDS) Y
355-43-1 hexane, 1,1,1,2,2,3,3,4,4,5,5,6,6-tridecafluoro-6-iodo-
16938-22-0 hexane, 1,6-diisocyanato-2,2,4-trimethyl-
355-42-0 hexane, tetradecafluoro-
63059-55-2 hexanoyl chloride, 2-[2,4-bis(1,1-dimethylpropyl)phenoxy]- Y
67485-29-4 hydramethylnon
7647-01-0 Hydrogen Chloride Y Y
74-90-8 Hydrogen cyanide Y
I-Butyraldehyde (2-Methylpropanal) Y
193-39-5 Indeno(123-cd)pyrene Y 12.28Y 55 Y
7440-74-6 Indium Y 0.36
7553-56-2 Iodine Y 0.36
74-88-4 Iodomethane Y
7439-89-6 Iron Y 8Y 197Y 6.5 Y Y Y Y
465-73-6 Isodrin Y 12.28 Y Y Y
34123-59-6 Isoproturon (X) Y
7439-92-1 Lead Y 8Y 194Y 6.5Y Y Y Y Y Y Y Y Y
78-00-2 lead, tetraethyl-
75-74-1 lead, tetramethyl-
not listed Linuron Y 9.7 Y Y
137

CAS number Chemical Determinands Marine Freshwater AirPollution Inventory
Bat
hing
Wat
er
Dan
gero
us s
ubst
ance
s (7
6/46
4/EE
C) L
ist I
DSD
Lis
t II s
ubst
ance
s
Drin
king
Wat
er (9
8/83
/EC
)
EPER
Fres
hwat
er fi
sh
(78/
659/
EEC
)
Gro
undw
ater
(80/
68/E
EC)
List
I su
bsta
nces
GW
Lis
t II s
ubst
ance
s
OSP
AR
che
mic
als
for
Prio
rity
Act
ion
Shel
lfish
wat
ers
(79/
923/
EEC
)
Surf
ace
wat
er (7
5/44
0/EE
C)
and
(79/
869/
EEC
)
Tita
nium
oxi
de
UW
WT
WFD
7439-93-2 Lithium Y 8
not listed as an element Magnesium Y 840Y 145
121-75-5 Malathion Y 9.7 Y Y
108-31-6 Maleic Anhydride Y
7439-96-5 Manganese Y 8Y 55Y 6.5 Y Y Y Y Y
25319-90-8 MCPA Y 9.7
7085-19-0 Mecoprop Y 9.7 Y Y
7439-97-6 Mercury Y 8Y 119Y 6.5Y Y Y Y Y I Y Y Y Y
72-33-3 mestranol
75-52-5 methane, nitro-
19774-82-4 methanone, (2-butyl-3-benzofuranyl)[4-[2-(diethylamino)ethoxy]-3,5-diiodophenyl]-, hydrochloride Y
not listed Methlamine Y
72-43-5 methoxychlor Y
74-83-9 Methyl bromide Y
65294-17-9 methylium, tris[4-(dimethylamino)phenyl]-, salt with 3-[[4-(phenylamino)phenyl]azo]benzenesulfonic acid (1:1)
7786-34-7 Mevinphos Y 9.7 Y Y
7469-98-7 Molybdenum Y 0.36 Y
81412-43-3 morpholine, 2,6-dimethyl-4-(C10-13)-alkyl-
81-15-2 Musk xylene Y
108-38-3 M-xylene Y 9.7 Y
92-24-0 naphthacene
91-57-6 naphthalene, 2-methyl-
38640-62-9 naphthalene, bis(1-methylethyl)-
70776-03-3 naphthalene, chloro derivs. * Y
192-65-4 naphtho[1,2,3,4-def]chrysene
91-20-3 Napthalene Y 12.28Y 139 Y Y Y
51000-52-3 neodecanoic acid, ethenyl ester Y
7440-02-0 Nickel Y 8 Y 6.5Y Y Y Y Y Y Y Y
4394-00-7 niflumic acid
138
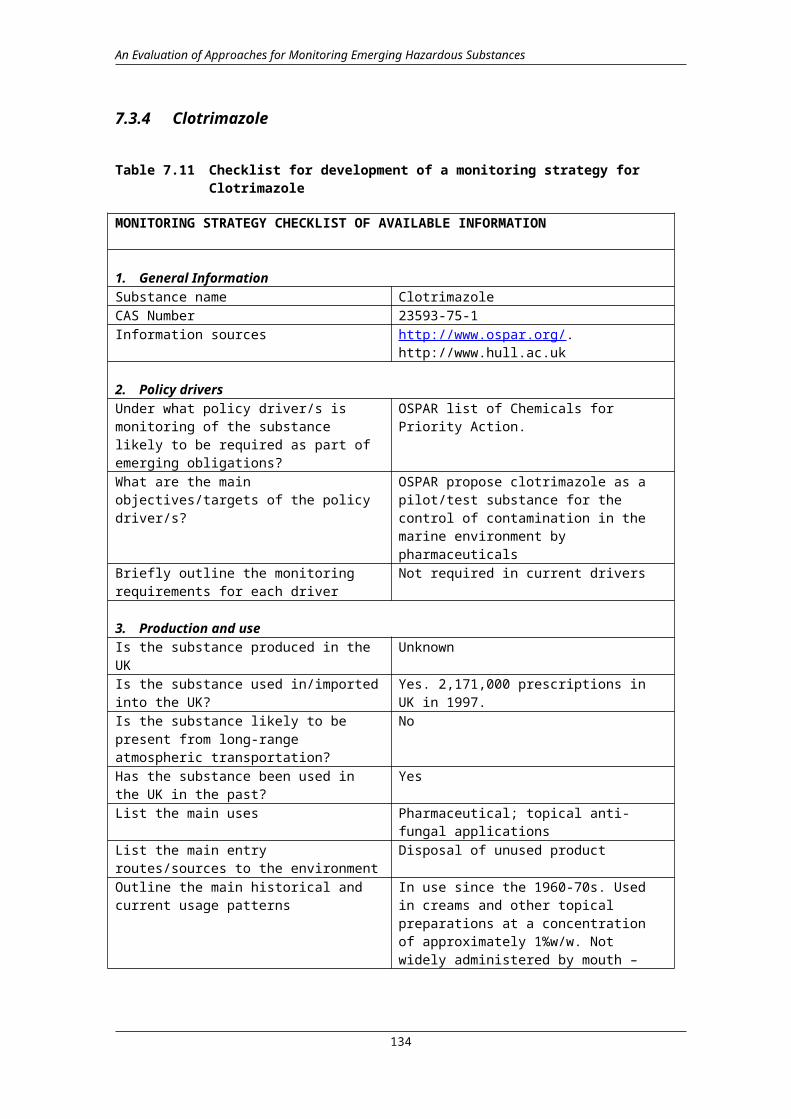
CAS number Chemical Determinands Marine Freshwater AirPollution Inventory
Bat
hing
Wat
er
Dan
gero
us s
ubst
ance
s (7
6/46
4/EE
C) L
ist I
DSD
Lis
t II s
ubst
ance
s
Drin
king
Wat
er (9
8/83
/EC
)
EPER
Fres
hwat
er fi
sh
(78/
659/
EEC
)
Gro
undw
ater
(80/
68/E
EC)
List
I su
bsta
nces
GW
Lis
t II s
ubst
ance
s
OSP
AR
che
mic
als
for
Prio
rity
Act
ion
Shel
lfish
wat
ers
(79/
923/
EEC
)
Surf
ace
wat
er (7
5/44
0/EE
C)
and
(79/
869/
EEC
)
Tita
nium
oxi
de
UW
WT
WFD
98-95-3 Nitrobenzene Y
27753-52-2 nonabromobiphenyl
9016-45-9 Nonylphenol ethoxylate Y Y
25154-52-3 Nonylphenols Y Y Y
27858-07-7 octabromobiphenyl
2234-13-1 octachloronaphthalene*
140-66-9 Octylphenols Y Y Y
50-28-2 oestradiol
53-16-7 oestron
not listed Omethoate Y 9.7 Y Y
789-02-6 op-DDT Y 12.28 Y Y
organotin compounds Y
58138-08-2 oxirane, 2-(3,5-dichlorophenyl)-2-(2,2,2-trichloroethyl)-
53500-83-7 oxiranecarboxylic acid, 3-methyl-3-[4-(2-methylpropyl)phenyl]-, 1-methylethyl ester
95-47-6 O-xylene Y 9.7
301-12-2 Oxydemeton – methyl Y 9.7
PAH's Y 20.8 Y Y Y Y Y
63449-39-8 paraffin waxes and hydrocarbon waxes, chlorinated
56-382 Parathion Y 9.7 Y
298-00-0 Parathion-methyl Y 9.7 Y
range of chemicals unlisted PCB’s (range of) Y 12.28 Y Y Y
range of chemicals unlisted PCDD's Y 0.28 Y Y
range of chemicals unlisted PCSD’s Y 9.7
85-22-3 pentabromoethylbenzene* Y
1825-21-4 pentachloroanisole Y
608-93-5 Pentachlorobenzene X Y
1321-64-8 pentachloronaphthalene Y
139
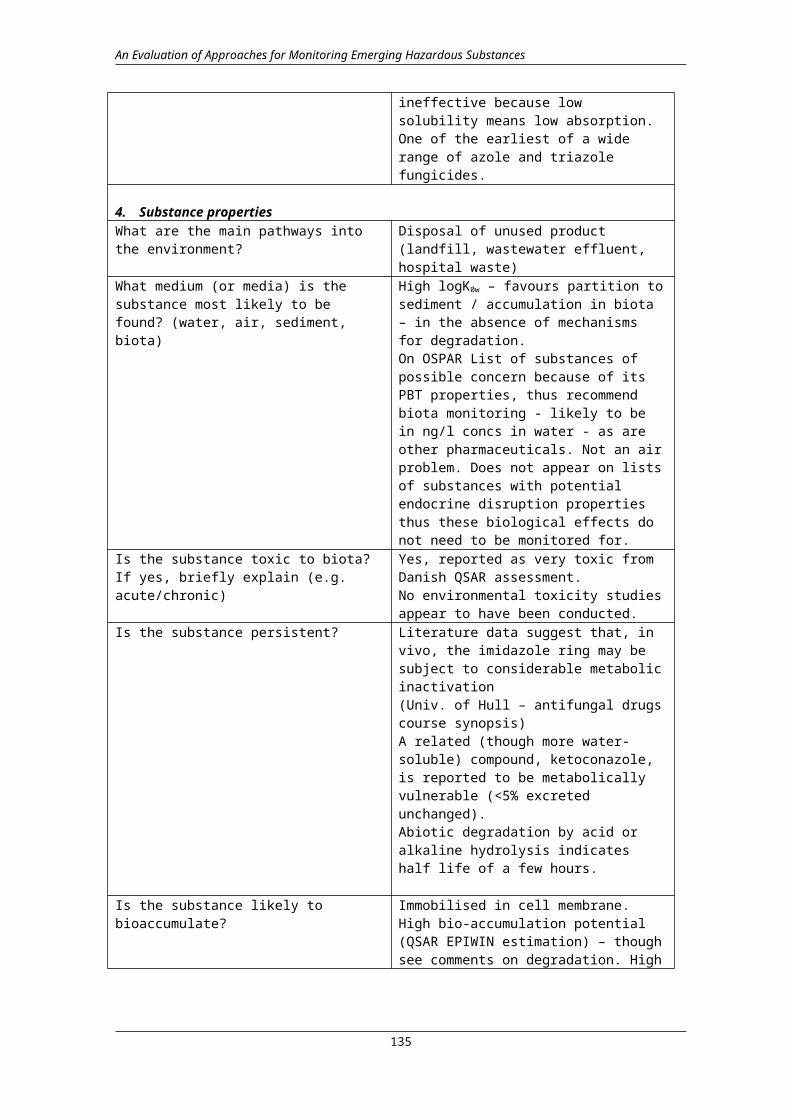
CAS number Chemical Determinands Marine Freshwater AirPollution Inventory
Bat
hing
Wat
er
Dan
gero
us s
ubst
ance
s (7
6/46
4/EE
C) L
ist I
DSD
Lis
t II s
ubst
ance
s
Drin
king
Wat
er (9
8/83
/EC
)
EPER
Fres
hwat
er fi
sh
(78/
659/
EEC
)
Gro
undw
ater
(80/
68/E
EC)
List
I su
bsta
nces
GW
Lis
t II s
ubst
ance
s
OSP
AR
che
mic
als
for
Prio
rity
Act
ion
Shel
lfish
wat
ers
(79/
923/
EEC
)
Surf
ace
wat
er (7
5/44
0/EE
C)
and
(79/
869/
EEC
)
Tita
nium
oxi
de
UW
WT
WFD
87-86-5 Pentachlorophenol Y 12.28Y 64 Y Y Y Y Y Y
110-62-3 Pentanal (Valeraldehyde) Y
109-67-1 Pentene (all isomers) Y
56245-53-1 Permethrin Y 9.7 Y
198-55-0 perylene
128-69-8 perylo[3,4-cd:9,10-c'd']dipyran-1,3,8,10-tetrone
947-72-8 Phenanthrene Y 12.28
108-95-2 Phenol Y
group of chemicals phenols Y Y Y Y
3147-75-9 phenol, 2-(2H-benzotriazol-2-yl)-4-(1,1,3,3-tetramethylbutyl)-
3846-71-7 phenol, 2-(2H-benzotriazol-2-yl)-4,6-bis(1,1-dimethylethyl)-
25973-55-1 phenol, 2-(2H-benzotriazol-2-yl)-4,6-bis(1,1-dimethylpropyl)-
70-30-4 phenol, 2,2'-methylenebis[3,4,6-trichloro-
1940-43-8 phenol, 2,2'-methylenebis[4,6-dichloro-
97-18-7 phenol, 2,2'-thiobis[4,6-dichloro-
95-95-4 phenol, 2,4,5-trichloro-
497-39-2 phenol, 2,4-bis(1,1-dimethylethyl)-5-methyl-
120-95-6 phenol, 2,4-bis(1,1-dimethylpropyl)-
39489-75-3 phenol, 2,4-dichloro-5-nitro-, carbonate (2:1) (ester)
17540-75-9 phenol, 2,6-bis(1,1-dimethylethyl)-4-(1-methylpropyl)-
5510-99-6 phenol, 2,6-bis(1-methylpropyl)-
1138-52-9 phenol, 3,5-bis(1,1-dimethylethyl)-
21150-89-0 phenol, 4-(1,1-dimethylethyl)-, hydrogen phosphate
79-94-7 phenol, 4,4'-(1-methylethylidene)bis[2,6-dibromo- Y
79-95-8 phenol, 4,4'-(1-methylethylidene)bis[2,6-dichloro-
140
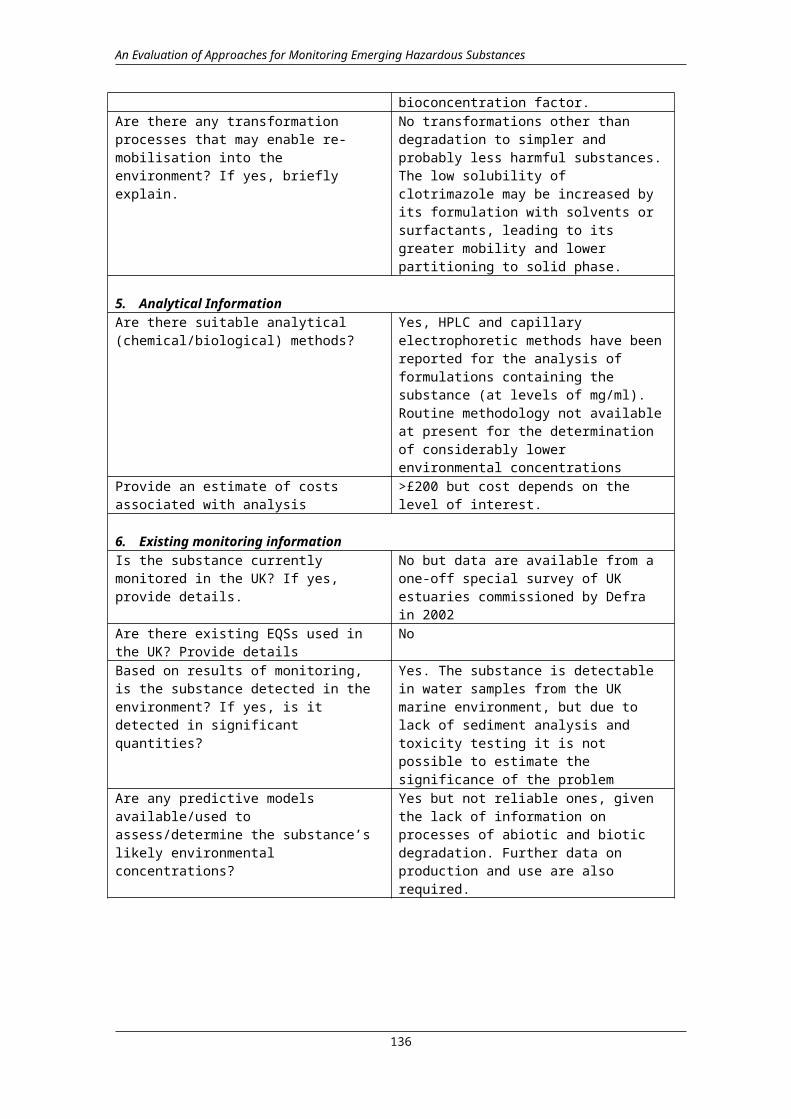
CAS number Chemical Determinands Marine Freshwater AirPollution Inventory
Bat
hing
Wat
er
Dan
gero
us s
ubst
ance
s (7
6/46
4/EE
C) L
ist I
DSD
Lis
t II s
ubst
ance
s
Drin
king
Wat
er (9
8/83
/EC
)
EPER
Fres
hwat
er fi
sh
(78/
659/
EEC
)
Gro
undw
ater
(80/
68/E
EC)
List
I su
bsta
nces
GW
Lis
t II s
ubst
ance
s
OSP
AR
che
mic
als
for
Prio
rity
Act
ion
Shel
lfish
wat
ers
(79/
923/
EEC
)
Surf
ace
wat
er (7
5/44
0/EE
C)
and
(79/
869/
EEC
)
Tita
nium
oxi
de
UW
WT
WFD
84852-15-3 phenol, 4-nonyl-, branched
11081-15-5 phenol, isooctyl-
25154-52-3 phenol, nonyl-
90481-05-3 phenol, nonyl-, manuf. of, by-products from, high-boiling
608-71-9 phenol, pentabromo-
298-02-2 Phorate Y
75-44-5 Phosgene Y
327-98-0 phosphonothioic acid, ethyl-, O-ethyl O-(2,4,5-trichlorophenyl) ester
21609-90-5 phosphonothioic acid, phenyl-, O-(4-bromo-2,5-dichlorophenyl) O-methyl ester
1241-94-7 phosphoric acid, 2-ethylhexyl diphenyl ester
29761-21-5 phosphoric acid, isodecyl diphenyl ester
1330-78-5 phosphoric acid, tris(methylphenyl) ester
26999-29-1 phosphorodithioic acid, O,O-diisooctyl ester
563-12-2 phosphorodithioic acid, S,S'-methylene O,O,O',O'-tetraethyl ester
786-19-6 phosphorodithioic acid, S-[[(4-chlorophenyl)thio]methyl] O,O-diethyl ester
18181-70-9 phosphorothioic acid, O-(2,5-dichloro-4-iodophenyl) O,O-dimethyl ester
57018-04-9 phosphorothioic acid, O-(2,6-dichloro-4-methylphenyl) O,O-dimethyl ester
4824-78-6 phosphorothioic acid, O-(4-bromo-2,5-dichlorophenyl) O,O-diethyl ester
2104-96-3 phosphorothioic acid, O-(4-bromo-2,5-dichlorophenyl) O,O-dimethyl ester
64131-85-7 phosphorothioic acid, O,O,O-tris(4-nitrophenyl) ester
2062-78-4 pimozide
range of chemicals unlisted polychlorinated dibenzofurans (PCDFs) Y Y
141

CAS number Chemical Determinands Marine Freshwater AirPollution Inventory
Bat
hing
Wat
er
Dan
gero
us s
ubst
ance
s (7
6/46
4/EE
C) L
ist I
DSD
Lis
t II s
ubst
ance
s
Drin
king
Wat
er (9
8/83
/EC
)
EPER
Fres
hwat
er fi
sh
(78/
659/
EEC
)
Gro
undw
ater
(80/
68/E
EC)
List
I su
bsta
nces
GW
Lis
t II s
ubst
ance
s
OSP
AR
che
mic
als
for
Prio
rity
Act
ion
Shel
lfish
wat
ers
(79/
923/
EEC
)
Surf
ace
wat
er (7
5/44
0/EE
C)
and
(79/
869/
EEC
)
Tita
nium
oxi
de
UW
WT
WFD
range of chemicals unlisted polychlorinated naphthalenes*, ? Y
72-55-9 pp-DDE Y 12.28
50-29-3 pp-DDT Y 12.28 Y
range of chemicals unlisted pp-TDE Y 12.28
630-56-8 pregn-4-ene-3,20-dione, 17-[(1-oxohexyl)oxy]-
19398-13-1 propanoic acid, 2-(2,4,5-trichlorophenoxy)-, 2-butoxyethyl ester
52179-28-9 propanoic acid, 2-[4-(2,2-dichlorocyclopropyl)phenoxy]-2-methyl-, ethyl ester
87237-48-7 propanoic acid, 2-[4-[[3-chloro-5-(trifluoromethyl)-2-pyridinyl]oxy]phenoxy]-, 2-ethoxyethyl ester
111479-05-1 propaquizafop
115-07-1 Propene (Propylene) Y
31218-83-4 Propetamphos Y 9.7
503-30-0 Propylene Oxide (Methyloxirane) Y
106-42-3 P-xylene Y 9.7
129-00-0 Pyrene Y 12.28
128-63-2 pyrene, 1,3,6,8-tetrabromo-
5522-43-0 pyrene, 1-nitro-
1913545 pyrimido[5,4-d]pyrimidine, 2,6-dichloro-4,8-di-1-piperidinyl-
92061-94-4 residues (coal tar), pitch distn.
483-65-8 Retene Y 140
7440-17-7 Rubidium Y 0.36
7440-19-9 Samarium Y 0.36
not listed Scandium Y 0.36
7782-49-2 Selenium Y 8Y 55Y 0.36 Y Y Y
range of chemicals unlisted
short chained chlorinated paraffins (SCCP) Y
52468-60-7 sibelium
142

CAS number Chemical Determinands Marine Freshwater AirPollution Inventory
Bat
hing
Wat
er
Dan
gero
us s
ubst
ance
s (7
6/46
4/EE
C) L
ist I
DSD
Lis
t II s
ubst
ance
s
Drin
king
Wat
er (9
8/83
/EC
)
EPER
Fres
hwat
er fi
sh
(78/
659/
EEC
)
Gro
undw
ater
(80/
68/E
EC)
List
I su
bsta
nces
GW
Lis
t II s
ubst
ance
s
OSP
AR
che
mic
als
for
Prio
rity
Act
ion
Shel
lfish
wat
ers
(79/
923/
EEC
)
Surf
ace
wat
er (7
5/44
0/EE
C)
and
(79/
869/
EEC
)
Tita
nium
oxi
de
UW
WT
WFD
18379-25-4 silane, trichloro(2,4,4-trimethylpentyl)-
7440-22-4 Silver Y 8 Y 0.36 Y Y
122-34-9 Simazine Y 9.7 Y Y Y Y
7440-23-5 Sodium Y 145 Y
427-45-2 stannane, fluorotris-p-chlorophenyl-
76-87-9 stannane, hydroxytriphenyl-
3090-36-6 stannane, tributyl(1-oxododecyl)oxy-
85409-17-2 stannane, tributyl-, mono(naphthenoyloxy) derivs.
13121-70-5 stannane, tricyclohexylhydroxy-
668-34-8 stannylium, triphenyl-
8001-50-1 strobane
100-42-5 Styrene Y
not listed Sulcofuron Y 9.7
?? tellurium Y
26140-60-3 terphenyl
61788-33-8 terphenyl, chlorinated
not listed tetrabromobisphenol A (TBBP-A) Y
127-18-4 Tetrachloroethylene Y 12.28Y 64 Y Y Y Y
509-14-8 Tetrachloromethane Y 64 Y
20020-02-4 tetrachloronaphthalene Y
2227-13-6 tetrasul* Y
44-28-0 thallium Y
7440-32-6 Titanium Y 9.7Y 2Y 0.36 Y Y
108-88-3 Toluene Y 9.7Y 140 Y Y Y
several CAS numbers Toluene Diamine (all isomers) Y
584-84-9 Toluene Diisocyanate (all isomers) Y
range of chemicals unlisted Total drins Y 12.28 Y
8001-35-2 toxaphene
24017-47-8 Triazophos Y 9.7 Y Y
143

CAS number Chemical Determinands Marine Freshwater AirPollution Inventory
Bat
hing
Wat
er
Dan
gero
us s
ubst
ance
s (7
6/46
4/EE
C) L
ist I
DSD
Lis
t II s
ubst
ance
s
Drin
king
Wat
er (9
8/83
/EC
)
EPER
Fres
hwat
er fi
sh
(78/
659/
EEC
)
Gro
undw
ater
(80/
68/E
EC)
List
I su
bsta
nces
GW
Lis
t II s
ubst
ance
s
OSP
AR
che
mic
als
for
Prio
rity
Act
ion
Shel
lfish
wat
ers
(79/
923/
EEC
)
Surf
ace
wat
er (7
5/44
0/EE
C)
and
(79/
869/
EEC
)
Tita
nium
oxi
de
UW
WT
WFD
several CAS numbers Tributyltin Y 9.7Y 140 Y Y Y Y Y
12202-48-4 / 87-61-6 / 120-82-1 / 108-70-3 Trichlorobenzene Y 64 Y Y Y Y
79-01-6 Trichloroethylene Y 12.28Y 64 Y Y Y Y
594-42-3 Trichloromethane Y
1321-65-9 trichloronaphthalene Y
6639-30-1 Trichlorotoluene Y
749-13-3 trifluperidol
1582-09-8 Trifluralin Y 9.7 Y Y Y Y
526-73-8 Trimethylbenzene (all isomers) Y
603-35-0 triphenyl phosphine Y
217-59-4 triphenylene
several compounds: 900-95-8 / 639-58-7 / 379-52-2 Triphenyltin Y 9.7Y 140 Y Y Y Y
7440-33-7 Tungsten Y 0.36
7440-61-1 uranium Y
101-20-2 urea, N-(4-chlorophenyl)-N'-(3,4-dichlorophenyl)-
7440-62-2 Vanadium Y 8Y 140Y 6.5 Y Y Y Y
1330-20-7 Xylenes (total) Y 9.7Y 140 Y Y Y Y
7440-66-6 Zinc Y 8Y 1212Y 6.5Y Y Y Y Y Y Y Y
144

Table 2: Hazardous substances that have recently been identified and those that are likely to be identified for mandatory monitoring over the next five years.
Che
mic
al D
eter
min
ands
Mar
ine
Fres
hwat
er
Air
Pollu
tion
Inve
ntor
y
IPPC
(EPE
R)
OSP
AR
WFD
OSP
AR
Sub
stan
ces
of C
once
rn
Prio
rity
List
I
Prio
rity
List
II
Bat
hing
Wat
er
Shel
lfish
wat
ers
(79/
923/
EEC
)
Dan
gero
us s
ubst
ance
s (7
6/46
4/EE
C)
UW
WT
Nitr
ate
from
Agr
icul
ture
Prot
ectio
n of
gro
undw
ater
(80/
68/E
EC)
Fres
hwat
er fi
sh (7
8/65
9/EE
C)
Abs
trac
tion
of d
rinki
ng w
ater
(7
5/44
0/EE
C)
Drin
king
Wat
er (9
8/83
/EC
)
Chl
oral
kali
Tita
nium
oxi
de
Qua
lity
of d
rinki
ng w
ater
(80/
778/
EEC
)
Alphabetical orderMonitored Effort
Monitored Effort
Monitored Effort Water Load Air Load
Brominated diphenylethers X Y
(4-(para)-nonylphenol) Y
(alpha-endosulfan) Y
(Benzo(b)fluoranthene) Y 55Y 2.78 Y Y
(Benzo(k)fluoranthene) Y 55Y 2.36 Y Y
(gamma-isomer,Lindane) Y
(para-tert-octylphenol) Y
[1,1'-bianthracene]-9,9',10,10'-tetrone, 4,4'-diamino- Y
[1,1'-biphenyl]-2,2'-diol, 5,5'-dichloro Y
[1,1'-biphenyl]-4,4'-diamine, 3,3'-dichloro- Y
[1,1'-biphenyl]-4,4'-diamine, 3,3'-dichloro-, dihydrochloride Y
[1,1'-biphenyl]-4,4'-diamine, N,N'-bis(2,4-dinitrophenyl)-3,3'-dimethoxy- Y
[1,1'-biphenyl]-4-ol, 3,5-bis(1,1-dimethylethyl)- Y
1,1,1-trichloroethane Y 9.7 Y 1100.5Y 10594Y Y
1,1,2,2,-Tetrachloroethane Y 37795
1,1,2-trichloroethane Y 9.7 Y 123.14 Y
1,1'-biphenyl, 2,2',3,3',4,4',5,5',6,6'-decabromo- Y
1,1'-biphenyl, 2,2',3,3',4,4',5,5',6,6'-decachloro- Y
1,1'-biphenyl, 2,2',4,4',6,6'-hexachloro- Y
1,1'-biphenyl, 2,2',4,4'-tetrachloro- Y
1,1'-biphenyl, 2,4,4'-trichloro- Y
1,1'-biphenyl, 4,4'-dibromo- Y
1,1'-biphenyl, 4,4'-dichloro- Y
145

1,1'-biphenyl, 4-bromo-2-fluoro- Y
1,1'-biphenyl, chlorinated Y
1,1'-biphenyl, hexabromo- Y
1,1'-biphenyl, nonachloro- Y
1,2,3 trichlorobenzene Y 12.28 Y Y Y
1,2,4-trichlorobenzene Y 12.28 Y Y Y Y
1,2-benzenedicarboxylic acid, bis(2-ethylhexyl) ester Y
1,2-benzenedicarboxylic acid, bis(2-methylpropyl) ester Y
1,2-benzenedicarboxylic acid, butyl phenylmethyl ester Y
1,2-benzenedicarboxylic acid, dibutyl ester Y
1,2-benzenedicarboxylic acid, di-C8-10-alkyl esters, branched Y
1,2-benzenedicarboxylic acid, diisononyl ester Y
1,2-benzenedicarboxylic acid, diisooctyl ester Y
1,2-benzenedicarboxylic acid, dioctyl ester Y
1,2-dichloroethane Y 12.28Y 64 Y 9892Y 37795Y Y Y Y
1,2-Ethanedisulfonic acid, compd. with 2-chloro-10-[3-(4-methyl-1-piperazinyl)propyl]-10H-phenothiazine (1:1)
Y
1,3,4-metheno-1H-cyclobuta[cd]pentalene, 1,1a,2,2,3,3a,4,5,5,5a,5b,6-dodecachlorooctahydro-
Y
1,3,4-metheno-2H-cyclobuta(cd)pentalen-2-one, 1,1a,3,3a,4,5,5,5a,5b,6-decachlorooctahydro-
Y
1,3,4-oxadiazol-2(3H)-one, 3-[2,4-dichloro-5-(1-methylethoxy)phenyl]-5-(1,1-dimethylethyl)-
Y
1,3,5-triazine-2,4,6(1H,3H,5H)-trione, 1,3,5-tris(2,3-dibromopropyl)- Y
1,3,5-triazine-2,4,6(1H,3H,5H)-trione, 1,3,5-tris(3-isocyanatomethylphenyl)- Y
1,3,5-trichlorobenzene Y 12.28 Y Y Y
1,3-Butadiene Y 73622 Y
1,3-cyclopentadiene, 1,2,3,4,5,5-hexachloro- Y
1,3-isobenzofurandione, 4,5,6,7-tetrabromo- Y
1,4 Dioxane Y 37861
146

1,4-benzenediamine, N-(1,4-dimethylpentyl)-N'-phenyl- Y
1,4-benzenediamine, N-(1-methylheptyl)-N'-phenyl- Y
1,4-benzenediamine, N,N,N'-tris(1-methylpropyl)- Y
1,4-benzenediamine, N,N'-bis(1,4-dimethylpentyl)- Y
1,4-benzenediamine, N,N'-bis(1-ethyl-3-methylpentyl)- Y
1,4-benzenediamine, N,N'-di-2-naphthalenyl- Y
1,4-benzenediol, 2,5-bis(1,1-dimethylpropyl)- Y
1,4-Dichlorobenzene Y 1564
1,4-pentadien-3-ol, 3-methyl-1-(2,6,6-trimethyl-1-cyclohexen-1-yl)- Y
1,4-pentanediamine, N(4)-(7-chloro-4-quinolinyl)-N(1),N(1)-diethyl-, phosphate (1:2)
Y
1,4-pentanediamine, N4-(6-chloro-2-methoxy-9-aziridinyl)-N1,N1-diethyl-, dihydrochloride
Y
1,4-pentanediamine, N4-(7-chloro-4-quinolinyl)-N1,N1-diethyl- Y
1,5,9 cyclododecatriene? Y Y
1,6,10-dodecatrien-3-ol, 3,7,11-trimethyl- Y
1,6,10-dodecatrien-3-ol, 3,7,11-trimethyl-, (E)- Y
10(9h)-acridinepropanamine, n,n,9,9-tetramethyl- Y
10(9H)-acridinepropanamine, N,N,9,9-tetramethyl-, [R-(R*,R*)]-2,3-dihydroxybutanedioate (1:1) Y
10H-phenothiazine, 10-[3-(4-methyl-1-piperazinyl)propyl]-2-(trifluoromethyl)-, dihydrochloride Y
10H-Phenothiazine, 2-chloro-10-[3-(4-methyl-1-piperazinyl)propyl]- Y
13H-dibenzo[a,i]carbazole Y
17-ethynylestradiol Y
1-butanesulfonyl fluoride, 1,1,2,2,3,3,4,4,4-nonafluoro- Y
1-butanone, 4-[4-(2,3-dihydro-2-thioxo-1 Y
1-Chloro-2,3-Epoxypropane (Epichlorohydrin) Y 9701
1H-3a,7-methanoazulene, 2,3,4,7,8,8a-hexahydro-3,6,8,8-tetramethyl-, [3R-(3alpha,3abeta,7beta,8aalpha)]- Y
147
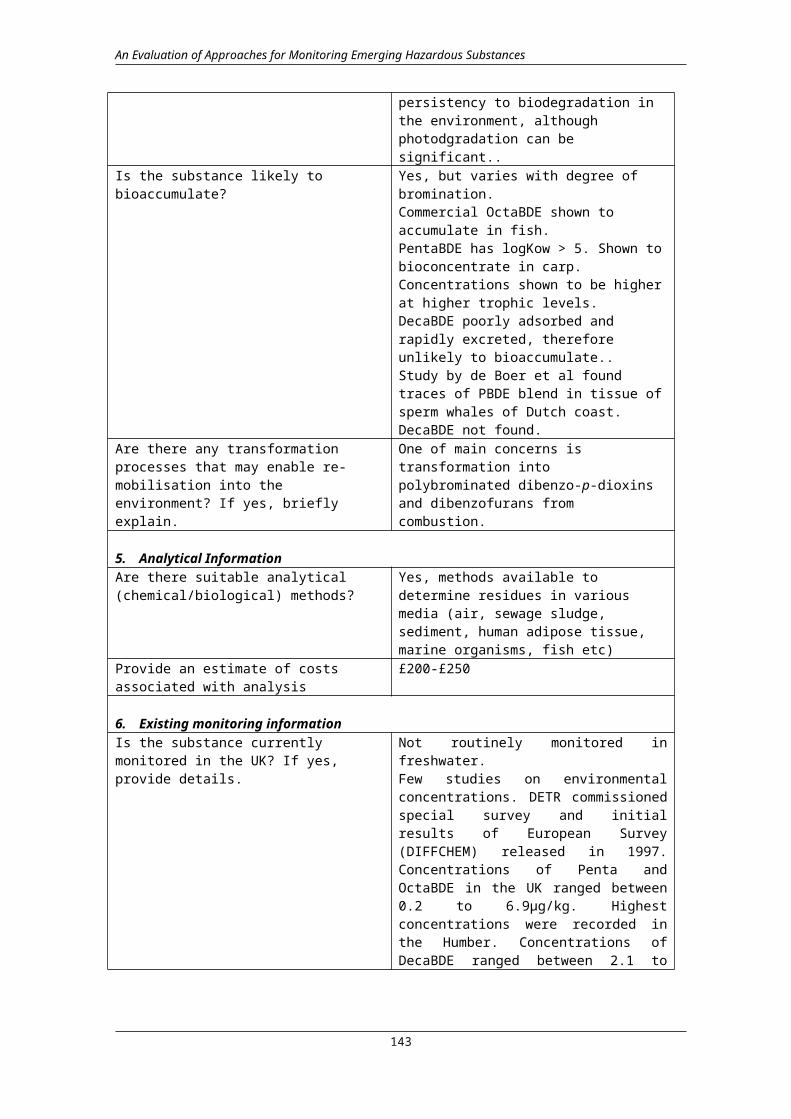
1-hexanesulfonyl fluoride, 1,1,2,2,3,3,4,4,5,5,6,6,6-tridecafluoro- Y
1H-imidazole, 1-[2-(2,4-dichlorophenyl)-2-[(2,4-dichlorophenyl)methoxy]ethyl]- Y
1H-imidazole, 1-[2-(2,4-dichlorophenyl)-2-[(2,4-dichlorophenyl)methoxy]ethyl]-, mononitrate
Y
1H-indene, 2,3-dihydro-1,1,3,3,5-pentamethyl-4,6-dinitro- Y
1-octanesulfonamide, N-ethyl-1,1,2,2,3,3,4,4,5,5,6,6,7,7,8,8,8-heptadecafluoro-N-(2-hydroxyethyl)- Y
1-octanesulfonamide, N-ethyl-1,1,2,2,3,3,4,4,5,5,6,6,7,7,8,8,8-heptadecafluoro-N-[2-(phosphonooxy)ethyl]-, diammonium salt
Y
1-phenanthrenecarboxylic acid, 1,2,3,4,4a,4b,5,6,10,10a-decahydro-1,4a-dimethyl-7-(1-methylethyl)-, methyl ester, [1R-(1.alpha.,4a.beta.,4b.alpha.,10a.alpha.)]-
Y
1-phenanthrenecarboxylic acid, tetradecahydro-1,4a-dimethyl-7-(1-methylethyl)-, methyl ester, [1R-(1alpha,4abeta,4balpha
Y
1-phenanthrenemethanol, 1,2,3,4,4a,4b,5,6,10,10a-decahydro-1,4a-dimethyl-7-(1-methylethyl)-, [1R-(1.alpha.,4a.beta.,4b.alpha.,10a.alpha.)]- Y
1-phenanthrenemethanol, 1,2,3,4,4a,4b,5,6,7,9,10,10a-dodecahydro-1,4a-dimethyl-7-(1-methylethyl)- Y
1-phenanthrenemethanol, tetradecahydro-1,4a-dimethyl-7-(1-methylethyl)- Y
1-Piperazineethanol, 4-[3-[2-(trifluoromethyl)-10H-phenothiazin-10-yl]propyl]-
Y
1-Piperazineethanol, 4-[3-[2-(trifluoromethyl)-10H-phenothiazin-10-yl]propyl]-, dihydrochloride
Y
1-propene, tetramer Y
1-pyrenamine Y
2,2,5-endo,6-exo,8,9,10-heptachloronorbornane Y
2,4,6-bromophenyl 1-2(2,3-dibromo-2-methylpropyl) * Y Y
2,4,6-Trichlorophenol Y 55
2,4,6-tri-tert-butylphenol Y Y
2,4-D (non ester) Y 9.7 Y 13 Y
2,4-D (total ester) Y 9.7Y 139 Y 0 Y
148

2,4-dichlorophenol Y 9.7Y 139 Y 2.3 Y
2,4-oxazolidinedione, 3-(3,5-dichlorophenyl)-5-ethenyl-5-methyl- Y
2,5-Dichlorophenol Y 55
2,5-methano-2H-indeno[1,2-b]oxirene, 2,3,4,5,6,7,7-heptachloro-1a,1b,5,5a,6,6a-hexahydro-, (1a.alpha.,1b.beta.,2.alpha.,5.alpha.,5a.beta.,6.beta.,6a.alpha.)- Y
2-anthracenecarboxamide, 1-amino-N-(3-bromo-9,10-dihydro-9,10-dioxo-2-anthracenyl)-9,10-dihydro-9,10-dioxo- Y
2-butanone, O-[[[[1,3,3-trimethyl-5-[[[[(1-methylpropylidene)amino]oxy]carbonyl]amino]cyclohexyl]methyl]amino]carbonyl]oxime
Y
2-butenoic acid, 2-(1-methylheptyl)-4,6-dinitrophenyl ester Y
2-butenoic acid, 2(or 4)-isooctyl-4,6(or 2,6)-dinitrophenyl ester Y
2-butenoic acid, 3-methyl-, 2-(1-methylpropyl)-4,6-dinitrophenyl ester Y
2-chloro-4-nitroluene Y 9.7 Y
2-chloro-5-nitroluene Y 9.7 Y
2-chloro-6-nitroluene Y 9.7 Y
2-chlorophenol Y 9.7Y 194 Y 0 Y
2-Ethoxyethanol Y 24008
2H-1-benzopyran-2-one, 3-[3-(4'-bromo[1,1'-biphenyl]-4-yl)-3-hydroxy-1-phenylpropyl]-4-hydroxy- Y
2-hexene, 3,4,5,5-tetramethyl- Y
2-Methylphenol Y 55
2-naphthalenamine, N,N-bis(2-chloroethyl)- Y
2-propanol, 1-(tert-dodecylthio)- Y
2-propenoic acid, (pentabromophenyl)methyl ester Y
2-propenoic acid, 2,2,3,3,4,4,5,5,6,6,7, Y
3,3'-(ureylenedimethylene)bis(3,5,5-trimethylcyclohexyl) diisocyanate* Y Y
3,4-dichloroaniline Y
3,5-dioxa-6-aza-4-phosphaoct-6-ene-8-nitrile, 4-ethoxy-7-phenyl-, 4-sulfide Y
3-cyclohexene-1-methanol, .alpha.,4-dimethyl-.alpha.-(4-methyl-3-pentenyl)-, (R*,R*)-
Y
3-cyclohexene-1-methanol, .alpha.,4-dimethyl-.alpha.-(4-methyl-3-pentenyl)-, (R*,R*)-(.+-.)- Y
149

3-cyclohexene-1-methanol, alpha,4-dimethyl-alpha-(4-methyl-3-pentenyl)-, [S-(R1,R1)]-
Y
3-heptene, 2,2,4,6,6-pentamethyl- Y
3-Methylphenol Y 55
4-(dimethylbutylamino)diphenylamin (6PPD) Y Y
4,4'-methylethylidenebisphenol Y
4,7-methano-1H-indene, 1,2,4,5,6,7,8,8-octachloro-2,3,3a,4,7,7a-hexahydro- Y
4,7-methano-1H-indene, 1,4,5,6,7,8,8-heptachloro-3a,4,7,7a-tetrahydro- Y
4,7-methano-1H-indene, 4,5,6,7,8,8-hexachloro-3a,4,7,7a-tetrahydro- Y
4,7-methanoisobenzofuran, 1,3,4,5,6,7,8,8-octachloro-1,3,3a,4,7,7a-hexahydro-
Y
4,7-methanoisobenzofuran-1,3-dione, 4,5,6,7,8,8-hexachloro-3a,4,7,7a-tetrahydro-
Y
4-4'-Methyenediphenyl diisocyanate Y 6
4-chloro-2-nitroluene Y 9.7 Y
4-chloro-3-methyl phenol Y 9.7Y 139 Y 0 Y
4-chloro-3-nitroluene Y 9.7 Y
4H-imidazo[1,5-a][1,4]benzodiazepine, 8-chloro-6-(2-fluorophenyl)-1-methyl- Y
4-piperidinol, 1-[4,4-bis(4-fluorophenyl Y
4-tert-butyltoluene Y
7H-benz[de]anthracen-7-one Y
7H-benz[de]anthracen-7-one, 3,9-dibromo- Y
7H-benz[de]anthracen-7-one, 3-bromo- Y
7H-dibenzo[c,g]carbazole Y
9,10-anthracenedione, 1,4-bis(butylamino)- Y
9,10-anthracenedione, 1-amino-2-bromo-4-[(4-methylphenyl)amino]- Y
9,10-anthracenedione, 4,8-diamino-2-(4-ethoxyphenyl)-1,5-dihydroxy- Y
acenaphthylene, 1,2-dihydro- Y
Acetaldehyde (Ethanal) Y 1
acetamide, 2-cyano-N-[(ethylamino)carbonyl]-2-(methoxyimino)- Y
acetic acid, (2,4,5-trichlorophenoxy)-, 2-butoxyethyl ester Y
acetic acid, (2,4,5-trichlorophenoxy)-, 2-ethylhexyl ester Y
150

acetic acid, (2,4,5-trichlorophenoxy)-, butyl ester Y
acetic acid, (2,4,5-trichlorophenoxy)-, isooctyl ester Y
acetic acid, (2,4,5-trichlorophenoxy)-, pentyl ester Y
Acetotrinitrile Y 78426
Acrylonitrile Y11309
99
Alachlor Y
Aldrin Y 12.28 Y 0.4 Y Y Y
alkanes, C14-17, chloro Y
Aluminium Y 8 Y 0.36 Y
androst-4-en-3-one, 17-[(1-oxoheptyl)oxy]-, (17.beta.)- Y
Aniline Y 50457
Anthracene Y 12.28 Y 2.34 Y Y Y
anthracene oil Y
anthracene oil, anthracene paste Y
anthracene oil, anthracene paste, anthracene fraction Y
anthracene oil, anthracene paste, distn. Lights Y
anthracene oil, anthracene-low Y
Antimony Y 0.36 Y 7852 Y
Arsenic Y 8Y 194Y 7.3Y 15220Y 21595Y Y Y Y
astemizole Y
Atrazine Y 9.7 Y 3.4 Y Y Y
Azinphos-ethyl Y 9.7 Y 0.03
Azinphos-methyl Y 9.7 Y 2.6 Y
Barium Y 55 Y
Bentazone Y 9.7 0 Y
benz[a]anthracene, 7,12-dimethyl- Y
benz[j]aceanthrylene, 1,2-dihydro-3-methyl- Y
Benzaldehyde Y 6436
benzaldehyde, 2-hydroxy-5-nonyl-, oxime Y
benzamide, 2,3,5-trichloro-N-(3,5-dichlo Y
benzamide, N-[5-chloro-4-[(4-chlorophenyl)cyanomethyl]-2-methylphenyl]-2-hydroxy-3,5-diiodo- Y
benzenamine, 2,3,4,5,6-pentachloro- Y
benzenamine, 2,3,4,5-tetrachloro- Y
benzenamine, 2,3,5,6-tetrachloro- Y
151

benzenamine, 2-chloro-6-nitro-3-phenoxy- Y
benzenamine, 4-(2,6-diphenyl-4-pyridinyl)-N,N-dimethyl- Y
benzenamine, 4,4'-(phenylmethylene)bis[N,N-dimethyl- Y
benzenamine, 4,4'-methylenebis[2,6-diethyl- Y
benzenamine, 4,4'-methylenebis[N-(1-methylpropyl)- Y
benzenamine, 4,4'-methylenebis[N,N-diethyl- Y
benzenamine, N-(1-ethylpropyl)-3,4-dimethyl-2,6-dinitro- Y
benzenamine, N-(cyclopropylmethyl)-2,6-dinitro-N-propyl-4-(trifluoromethyl)- Y
benzenamine, N-[3-phenyl-4,5-bis[(trifluoromethyl)imino]-2-thiazolidinylidene]-
Y
benzenamine, N-butyl-N-ethyl-2,6-dinitro-4-(trifluoromethyl)- Y
Benzene Y 9.7Y 140 Y27942
4Y65726
73Y Y Y
benzene, 1-(1,1-dimethylethyl)-2-methoxy-4-methyl-3,5-dinitro- Y
benzene, 1-(1,1-dimethylethyl)-4-methyl- Y
benzene, 1,1'-(1-methylethylidene)bis[3,5-dibromo-4-(2,3-dibromopropoxy)- Y
benzene, 1,1'-(2,2,2-trichloroethylidene)bis[4-chloro- Y
benzene, 1,1'-(2,2,2-trichloroethylidene)bis[4-fluoro- Y
benzene, 1,1'-(2,2-dichloroethylidene)bis[4-chloro- Y
benzene, 1,1'-(dichloroethenylidene)bis[4-chloro- Y
benzene, 1,1'-methylenebis- Y
benzene, 1,1'-methylenebis[4-chloro- Y
benzene, 1,1'-oxybis-, octabromo deriv. Y
benzene, 1,1'-oxybis-, pentabromo deriv. Y
benzene, 1,1'-oxybis[2,3,4,5,6-pentabromo- Y
benzene, 1,2,3,4-tetrachloro- Y
benzene, 1,2,3,5-tetrachloro- Y
benzene, 1,2,4,5-tetrachloro- Y
benzene, 1,2,4,5-tetrachloro-3-methoxy- Y
benzene, 1,2,4-trichloro-5-[(4-chlorophenyl)sulfonyl]- Y
152

benzene, 1,3,5-tribromo-2-(2-propenyloxy)- Y
benzene, 1,3,5-trichloro-2-(4-nitrophenoxy)- Y
benzene, 1,3,5-tris(1,1-dimethylethyl)- Y
benzene, 1,4-dichloro-2,5-bis(dichloromethyl)- Y
benzene, 1-[2-(2-chloroethoxy)ethoxy]-4-(1,1,3,3-tetramethylbutyl)- Y
benzene, 1-chloro-2-(chlorodiphenylmethyl)- Y
benzene, 1-chloro-2-[2,2,2-trichloro-1-(4-chlorophenyl)ethyl]- Y
benzene, 1-chloro-2-[2,2-dichloro-1-(4-chlorophenyl)ethenyl]- Y
benzene, 1-chloro-2-[2,2-dichloro-1-(4-chlorophenyl)ethyl]- Y
benzene, 1-chloro-4-(chlorophenylmethyl)- Y
benzene, 1-methyl-2,4-dinitro- Y
benzene, 2,4-dichloro-1-(4-nitrophenoxy)- Y
benzene, bis(1-methylethyl)- Y
benzene, hexabromo- Y
benzene, hexachloro- Y
benzene, pentabromo(bromomethyl)- Y
benzene, pentabromomethyl- Y
benzene, pentachloro- Y
benzene, pentachloronitro- Y
Benzene-1,2,4-Tricarboxylic Acid 1,2-Anhydride Y 0
benzeneacetic acid, 4-chloro-.alpha.-(1-methylethyl)-, cyano (3-phenoxyphenyl)methyl ester Y
benzeneacetic acid, 4-chloro-.alpha.-(1-methylethyl)-, cyano(3-phenoxyphenyl)methyl ester, [S-(R*,R*)]- Y
benzeneacetic acid, 4-chloro-.alpha.-(4-chlorophenyl)-.alpha.-hydroxy-, ethyl ester
Y
benzenemethanol, 4-chloro-.alpha.-(4-chlorophenyl)-.alpha.-methyl- Y
benzenepropanamine, N-methyl-.gamma.-[4-(trifluoromethyl)phenoxy]-, hydrochloride
Y
benzenesulfonic acid, 2-amino-, (1-methylethylidene)di-4,1-phenylene ester Y
benzenethiol, pentachloro- Y
benziodarone Y
Benzo(a)anthracene Y 12.28 Y Y
153

Benzo(a)pyrene Y 12.28Y 55Y 2.76 Y 7377 Y Y Y
Benzo(ghi)perylene Y 12.28 Y 2.76 Y Y Y
benzo[b]triphenylene Y
benzo[c]phenanthrene Y
benzo[e]pyrene Y
benzo[rst]pentaphene Y
benzoic acid, 2-[(2,6-dichloro-3-methylp Y
benzoic acid, 5-(2,4-dichlorophenoxy)-2-nitro-, methyl ester Y
Benzyl Chloride (A-Chlorotoluene) Y 5141
Beryllium Y 1183 Y
bicyclo(2.2.1)heptan-2-one, 1,7,7-trimethyl-3-[(4-methylphenyl)methylene]- Y
bicyclo[2.2.1]hepta-2,5-diene, 1,2,3,4,7,7-hexachloro- Y
bicyclo[2.2.1]heptane, 2,2-dimethyl-3-methylene- Y
bicyclo[3.1.1]hept-2-ene, 2,6,6-trimethyl- Y
Biphenyl Y 9.7Y 140 Y 5620 Y
Boron Y 8Y 140 Y11886
03 Y
brominated flame retardants Y
bromocylene Y
bromperidol Y
butanoyl chloride, 4-[2,4-bis(1,1-dimethylpropyl)phenoxy]- Y
Butene (all Isomers) Y12928
50
butylhydroxyanisol Y
butylphenol Y
C 10-13 -chloroalkanes X Y Y
Cadmium Y 8Y 119Y 6.5Y 5952Y 11119 Y Y Y Y Y Y
cadmium chloride Y
Calcium Y 840Y 146
carbamothioic acid, bis(1-methylethyl)-, S-(2,3,3-trichloro-2-propenyl) ester Y
cedrene- Y
certain phthalates: dibutylphthalate, diethylhexylphthalate Y
CFC's (Chlorofluorocarbons) Y11113
7
Chlorfenvinphos Y 9.7 Y 2 Y Y
Chlorine Y 0.36 Y
Chloro-alkanes Y
154

Chloroethene (Chloroethylene, Vinyl Chloride) Y17454
85
Chloroform Y 12.28Y 64 Y 5830Y46862
5 Y Y Y
Chloromethane Y41454
70
Chloronitrotoluene Y 9.7Y 140 Y 66
chlorpromazine Y
Chlorpyrifos (X) Y Y
Chromium Y 8Y 194Y 6.5Y22976
5Y20862
2Y Y Y Y
Chrysene Y 12.28 Y Y
chrysene, 1-methyl- Y
chrysene, 6-methyl- Y
clotrimazole Y Y
Cobalt Y 0.36 Y
Copper Y 8Y 1267Y 6.5Y 70437Y11284
9Y Y Y Y
coronene Y
Cyanamide Y 449
Cyanide Y 55 Y Y Y Y
cyclododecane Y Y
cyclohexane, (1,1-dimethylethyl)- Y
cyclohexane, 1,2,3,4,5,6-hexachloro- Y
cyclohexane, 1,2,3,4,5,6-hexachloro-, (1.alpha.,2.alpha.,3.beta.,4.alpha.,5.alpha.,6.beta.)- Y
cyclohexane, 5-isocyanato-1-(isocyanatomethyl)-1,3,3-trimethyl- Y
cyclohexanemethanamine, 1,3,3-trimethyl-N-(2-methylpropylidene)-5-[(2-methylpropylidene)amino]- Y
cyclohexanol, (1,7,7-trimethylbicyclo[2.2.1]hept-2-yl)- Y
cyclohexene, 1-methyl-4-(1-methylethenyl)-, (R)- Y
cyclopropanecarboxylic acid, 2,2,3,3,-tetramethyl-, cyano(3-phenoxyphenol)methyl ester, (.+-.)-
Y
cyclopropanecarboxylic acid, 2,2,3,3-tetramethyl-, cyano(3-phenoxyphenyl)methyl ester
Y
cyclopropanecarboxylic acid, 3-(2,2-dibromoethenyl)-2,2-dimethyl-, cyano(3-phenoxyphenyl)methyl ester, [1R-[1.alpha.(S*),3.alpha.]]- Y
155

cyclopropanecarboxylic acid, 3-(2,2-dichloroethenyl)-2,2-dimethyl-, cyano(3-phenoxyphenyl)methyl ester Y
cyclopropanecarboxylic acid, 3-(2,2-dichloroethenyl)-2,2-dimethyl-, cyano(3-phenoxyphenyl)methyl ester, [1-alpha.(S*),3.alpha.]-(.+-.)- Y
cyclopropanecarboxylic acid, 3-(2,2-dichloroethenyl)-2,2-dimethyl-, cyano(4-fluoro-3-phenoxyphenyl)methyl ester Y
cyclopropanecarboxylic acid, 3-(2-chloro-3,3,3-trifluoro-1-propenyl)-2,2-dimethyl-, cyano(3-phenoxyphenyl)methyl ester Y
Cyfluthrin Y 9.7 Y
Demeton Y 9.7 Y 0 Y
Demeton – o Y 9.7 Y
Demeton – s Y 9.7 Y
Demeton – s – methyl Y 9.7 Y
Demeton – s – methyl sulphone Y 9.7 Y
Di(2-ethylhexyl)phthalate (DEHP)(X) Y
Diazinon Y 9.7 Y 4.0115 Y
dibenz[a,h]anthracene Y
dibenz[a,j]anthracene Y
dibenzo(b,e)(1,4)dioxin, 2,3,7,8-tetrachloro- Y
dibenzo[b,def]chrysene Y
dibenzo[def,mno]chrysene Y
dibenzo[def,mno]chrysene-6,12-dione, 4,10-dibromo- Y
dibenzo[def,p]chrysene Y
dibenzothiophene Y
Dichloromethane (methylene Chloride or Dichloride) Y
11996502Y Y
Dichlorvos Y 9.7 Y 5.5275 Y
dicofol Y Y
dicroden Y
DIDT Y
Dieldrin Y 12.28 Y 0.4931 Y Y Y
Diethyl Sulphate Y 0
diethylstilbestrol Y
Dimethoate Y 9.7 Y 0 Y
Dimethyl Suphate Y 0
Dimethylformamide Y13998
70
156

diosgenin* Y Y
Dioxins Y 0.3Y
distannoxane, hexabutyl- Y
distannoxane, hexakis(2-methyl-2-phenylpropyl)- Y
distillates (coal tar), heavy oils, pyrene fraction Y
distillates (coal tar), pitch, pyrene fraction Y
distillates (petroleum), alkene-alkyne manuf. pyrolysis oil, condensed arom. ring-contg.
Y
distillates, coal tar, heavy oils Y
Diuron (X) Y
dodecene, branched Y
Endosulphan Y 9.7 Y 0.4 Y Y Y Y
Endrin Y 12.28 Y 0.4 Y Y
ethane, hexachloro- Y
ethanol, 1,1-bis(4-chlorophenyl)-, mixed Y
ethanone, 1-(2,3,4,7,8,8a-hexahydro-3,6,8,8-tetramethyl-1H-3a,7-methanoazulen-5-yl)-, [3R-(3alpha,3abeta,7beta,8aalpha)]
Y
ethanone, 1-(2-hydroxy-5-tert-nonylphenyl)-, oxime Y
ethanone, 1-[1,6-dimethyl-4-(4-methyl-3-pentenyl)-3-cyclohexen-1-yl]- Y
Ethyl acrylate Y 3902
ethyl O-(p-nitrophenyl) phenyl phosphonothionate Y Y
Ethyl Toluene Y 9193
Ethylbenzene Y
Ethylene Y24052
011
Ethylene Oxide Y57052
1
Europium Y 0.36
Fenitrothion Y 9.7 Y 4 Y
Fenthion Y 9.7 Y 0.3
Flucofuron Y 9.7 Y
flucythrinate* Y Y
Fluoranthene Y 12.28Y 55Y 2.76 Y Y Y
Fluoride Y 55 Y Y
Fluorine Y
Formaldehyde Y 64 Y23178
8
157

Furans Y
furo[3,4-b]pyridin-7(5H)-one, 5-[4-(diethylamino)-2-ethoxyphenyl]-5-(1-ethyl-2-methyl-1H-indol-3-yl)- Y
Gold Y 0.36
Halogenated Organic Compounds Y
Halons Y 7967
HCB Y 9.7 Y
HCFC's (Hydrochlorofluorocarbons) Y44706
5
HCH - beta Y 12.28 Y 30.753Y Y Y Y Y
HCH – alpha Y 12.28 Y Y Y Y
HCH – delta Y 12.28 Y Y Y Y
HCH – gamma Y 12.28 Y Y Y Y
heptachloronaphthalene* Y Y
heptachloronorbornene* Y Y
heptane, 2,2,4,4,6-pentamethyl- Y
heptane, hexadecafluoro- Y
hexabromododecane Y
Hexachlorobenzene Y 9.7 Y 11.5 Y Y Y
Hexachlorobutadiene Y 9.7Y 64 Y 9 Y Y Y
hexachlorocyclopentadiene (HCCP) Y
hexachloronaphthalene Y
hexamethyldisiloxane (HMDS) Y Y
hexane, 1,1,1,2,2,3,3,4,4,5,5,6,6-tridecafluoro-6-iodo- Y
hexane, 1,6-diisocyanato-2,2,4-trimethyl- Y
hexane, tetradecafluoro- Y
hexanoyl chloride, 2-[2,4-bis(1,1-dimethylpropyl)phenoxy]- Y
hydramethylnon Y
Hydrogen Chloride Y25976
4124
Hydrogen cyanide Y
I-Butyraldehyde (2-Methylpropanal) Y 945
Indeno(123-cd)pyrene Y 12.28Y 55 Y Y
Indium Y 0.36
Iodine Y 0.36
Iodomethane Y 6950
Iron Y 8Y 197Y 6.5 Y
Isodrin Y 12.28 Y 0.1147 Y Y Y Y
Isoproturon (X) Y
158

Lead Y 8Y 194Y 6.5Y11484
7Y52533
7Y Y Y Y Y Y
lead, tetraethyl- Y
lead, tetramethyl- Y
Linuron Y 9.7 Y 0 Y
Lithium Y 8
Magnesium Y 840Y 145
Malathion Y 9.7 Y 3 Y
Maleic Anhydride Y 30753
Managenese Y 8Y 55Y 6.5 Y19712
6 Y
MCPA Y 9.7 Y
Mecoprop Y 9.7 Y 0 Y
Mercury Y 8Y 119Y 6.5Y 1428Y 18329Y Y Y Y Y Y Y Y
mestranol Y
methane, nitro- Y
methanone, (2-butyl-3-benzofuranyl)[4-[2-(diethylamino)ethoxy]-3,5-diiodophenyl]-, hydrochloride Y
Methlamine Y 35090
methoxychlor Y Y
Methyl bromide Y37905
7
methylium, tris[4-(dimethylamino)phenyl]-, salt with 3-[[4-(phenylamino)phenyl]azo]benzenesulfonic acid (1:1) Y
Mevinphos Y 9.7 Y 0
Molybdenum Y 0.36 Y
morpholine, 2,6-dimethyl-4-(C10-13)-alkyl- Y
musk xylene
M-xylene Y 9.7 Y Y Y
naphthacene Y
naphthalene, 2-methyl- Y
naphthalene, bis(1-methylethyl)- Y
naphthalene, chloro derivs. * Y Y
naphtho[1,2,3,4-def]chrysene Y
Napthalene Y 12.28Y 139 Y 4738 Y Y Y
neodecanoic acid, ethenyl ester Y Y
Nickel Y 8 Y 6.5Y 51488Y11905
3Y Y Y Y
niflumic acid Y
Nitrobenzene Y 8634 Y
159

nonabromobiphenyl Y
Nonylphenol ethoxylate Y 46844 Y
Nonylphenols Y 8825 Y Y Y
octabromobiphenyl Y
octachloronaphthalene* Y Y
Octylphenols Y 1216 Y Y Y Y
oestradiol Y
oestron Y
Omethoate Y 9.7 Y 0.02
op-DDT Y 12.28 Y 0.7 Y Y
oxirane, 2-(3,5-dichlorophenyl)-2-(2,2,2-trichloroethyl)- Y
oxiranecarboxylic acid, 3-methyl-3-[4-(2-methylpropyl)phenyl]-, 1-methylethyl ester
Y
O-xylene Y 9.7 Y
Oxydemeton – methyl Y 9.7 Y
PAH's Y 20.8 Y24349
1Y Y Y
paraffin waxes and hydrocarbon waxes, chlorinated Y
Parathion Y 9.7 Y 0.1
Parathion-methyl Y 9.7 Y 0.3
PCB’s (range of) Y 12.28 Y 20.5Y 42 Y Y
PCDD's Y 0.28 Y
PCSD’s Y 9.7 Y
pentabromoethylbenzene* Y Y
pentachloroanisole Y Y
Pentachlorobenzene X Y
pentachloronaphthalene Y
Pentachlorophenol Y 12.28Y 64 Y 86Y 3Y Y Y Y Y
Pentanal (Valeraldehyde) Y 1360
Pentene (all isomers) Y73302
0
Perchloroethylene Y 12.28 Y Y
Permethrin Y 9.7 Y 0.01 Y Y
perylene Y
perylo[3,4-cd:9,10-c'd']dipyran-1,3,8,10-tetrone Y
Phenanthrene Y 12.28 Y Y
Phenol Y14873
5Y
phenol, 2-(2H-benzotriazol-2-yl)-4-(1,1,3,3- Y
160

tetramethylbutyl)-
phenol, 2-(2H-benzotriazol-2-yl)-4,6-bis(1,1-dimethylethyl)- Y
phenol, 2-(2H-benzotriazol-2-yl)-4,6-bis(1,1-dimethylpropyl)- Y
phenol, 2,2'-methylenebis[3,4,6-trichloro- Y
phenol, 2,2'-methylenebis[4,6-dichloro- Y
phenol, 2,2'-thiobis[4,6-dichloro- Y
phenol, 2,4,5-trichloro- Y
phenol, 2,4-bis(1,1-dimethylethyl)-5-methyl- Y
phenol, 2,4-bis(1,1-dimethylpropyl)- Y
phenol, 2,4-dichloro-5-nitro-, carbonate (2:1) (ester) Y
phenol, 2,6-bis(1,1-dimethylethyl)-4-(1-methylpropyl)- Y
phenol, 2,6-bis(1-methylpropyl)- Y
phenol, 3,5-bis(1,1-dimethylethyl)- Y
phenol, 4-(1,1-dimethylethyl)-, hydrogen phosphate Y
phenol, 4,4'-(1-methylethylidene)bis[2,6-dibromo- Y
phenol, 4,4'-(1-methylethylidene)bis[2,6-dichloro- Y
phenol, 4-nonyl- Y
phenol, 4-nonyl-, branched Y
phenol, isooctyl- Y
phenol, nonyl- Y
phenol, nonyl-, manuf. of, by-products from, high-boiling Y
phenol, pentabromo- Y
phenol, pentachloro- Y
Phorate Y 0.005
Phosgene Y 8512
phosphonothioic acid, ethyl-, O-ethyl O-(2,4,5-trichlorophenyl) ester Y
phosphonothioic acid, phenyl-, O-(4-bromo-2,5-dichlorophenyl) O-methyl ester Y
phosphoric acid, 2-ethylhexyl diphenyl ester Y
phosphoric acid, isodecyl diphenyl ester Y
phosphoric acid, tris(methylphenyl) ester Y
phosphorodithioic acid, O,O-diisooctyl ester Y
phosphorodithioic acid, S,S'-methylene O,O,O',O'-tetraethyl ester Y
161
phosphorodithioic acid, S-[[(4-chlorophenyl)thio]methyl] O,O-diethyl ester
Y
phosphorothioic acid, O-(2,5-dichloro-4-iodophenyl) O,O-dimethyl ester Y
phosphorothioic acid, O-(2,6-dichloro-4-methylphenyl) O,O-dimethyl ester Y
phosphorothioic acid, O-(4-bromo-2,5-dichlorophenyl) O,O-diethyl ester Y
phosphorothioic acid, O-(4-bromo-2,5-dichlorophenyl) O,O-dimethyl ester Y
phosphorothioic acid, O,O,O-tris(4-nitrophenyl) ester Y
pimozide Y
polychlorinated dibenzofurans (PCDFs) Y
polychlorinated naphthalenes*, ? Y
pp-DDE Y 12.28 Y
pp-DDT Y 12.28 Y Y
pp-TDE Y 12.28 Y
pregn-4-ene-3,20-dione, 17-[(1-oxohexyl)oxy]- Y
propanoic acid, 2-(2,4,5-trichlorophenoxy)-, 2-butoxyethyl ester Y
propanoic acid, 2-[4-(2,2-dichlorocyclopropyl)phenoxy]-2-methyl-, ethyl ester Y
propanoic acid, 2-[4-[[3-chloro-5-(trifluoromethyl)-2-pyridinyl]oxy]phenoxy]-, 2-ethoxyethyl ester
Y
propaquizafop Y
Propene (Propylene) Y26744
707
Propetamphos Y 9.7 Y
Propylene Oxide (Methyloxirane) Y24552
9
P-xylene Y 9.7 Y
Pyrene Y 12.28 Y Y
pyrene, 1,3,6,8-tetrabromo- Y
pyrene, 1-nitro- Y
pyrimido[5,4-d]pyrimidine, 2,6-dichloro-4,8-di-1-piperidinyl- Y
residues (coal tar), pitch distn. Y
Retene Y 140
Rubidium Y 0.36
Samarium Y 0.36
Scandium Y 0.36
162

Selenium Y 8Y 55Y 0.36 Y 58008 Y
short chained chlorinated paraffins (SCCP) Y
sibelium Y
silane, trichloro(2,4,4-trimethylpentyl)- Y
Silver Y 8 Y 0.36 Y Y
Simazine Y 9.7 Y 3Y 0 Y Y
Sodium Y 145 Y
stannane, fluorotris-p-chlorophenyl- Y
stannane, hydroxytriphenyl- Y
stannane, tributyl(1-oxododecyl)oxy- Y
stannane, tributyl-, mono(naphthenoyloxy) derivs. Y
stannane, tricyclohexylhydroxy- Y
stannylium, triphenyl- Y
strobane Y
Styrene Y59623
2
Sulcofuron Y 9.7 Y
terphenyl Y
terphenyl, chlorinated Y
tetrabromobisphenol A (TBBP-A) Y
Tetrachloroethylene Y 64 Y 865Y12426
14Y Y
Tetrachloromethane Y 64 Y
tetrachloronaphthalene Y
tetrasul* Y Y
Titanium Y 9.7Y 2Y 0.36 Y
Toluene Y 9.7Y 140 Y20789
4 Y Y
Toluene Diamine (all isomers) Y 1730
Toluene Diisocyanate (all isomers) Y 560
Total drins Y 12.28 Y
toxaphene Y
Triazophos Y 9.7 Y 0.01 Y
Tributyltin Y 9.7Y 140 Y 29 Y Y Y Y
Trichlorobenzene Y 64 Y 36 Y Y Y
Trichloroethylene Y 12.28Y 64 Y 1436Y42194
66Y Y Y
Trichloromethane Y
trichloronaphthalene Y
Trichlorotoluene Y 2682
163

trifluperidol Y
Trifluralin Y 9.7 Y 0.4 Y Y Y Y
Trimethylbenzene (all isomers) Y12283
4
triphenyl phosphine Y Y
triphenylene Y
Triphenyltin Y 9.7Y 140 Y 19 Y Y
Tungsten Y 0.36
urea, N-(4-chlorophenyl)-N'-(3,4-dichlorophenyl)- Y
Vanadium Y 8Y 140Y 6.5 Y12283
4 Y
Xylenes (total) Y 9.7Y 140 Y23363
6Y12000
3Y
Zinc Y 8Y 1212Y 6.5Y60765
7Y67220
22Y Y Y Y
164

ANNEX IV - WORKSHOP DELEGATES
Organisation Name Telephone FaxAEAT Environment plc Dr Martin AdamsAEAT Environment plc Miss Jone Ayres 01235 433753 01235 433536AEAT Environment plc Mr Peter ColemanCEFAS Andrew FranklinCEFAS Andy Kenny 01621 787200 01621 784989CEFAS Dave SheahanDEFRA Dr Mike Collins 0207 944 5253 0207 944 5229DEFRA Dr Richard EmmersonDEFRA Dr Richard MoxonDEFRA Mr Nigel ThurlowDEFRA CGMP Ms Kathleen Cameron 0207 944 5272 0207 944 5229DOE NI Mr John Farren 028 9025 4851 028 9025 4761Environment Agency Dr Peter Bird 01454 878 417 01454 878 681Environment Agency Mr Charlie Corbishley 0117 914 2816 0117 914 2929Environment Agency Ms Jo Kennedy 07770 792910 0117 914 2929Environment Agency Dr Ian Whitwell 0117 914 2715 0117 914 2929Norwegian Pollution Control Authority (SFT)
Mr Christian Dons 00 47 2257 3434 00 47 22676 706
RIZA Dr Joost van den Roovaart 0320 298 866 0320 298 514SEPA Dr Ian Ridgway 0131 449 7296 0131 449 7277WRc Mr Steve Nixon 01793 865 166 01793 865 001WRc Ms Yvonne Rees 01793 865 127 01793 865 001WRc Mr Brad Searle 01793 865 184 01793 865 001
165
ANNEX V - HARP-HAZ WORKSHOP – SUMMARY OF OUTCOMES
Introduction
A two-day workshop was undertaken on the 2nd and 3rd October 2002 to explore the robustness of the Source Oriented Approach (SOA) and the practicalities associated with its implementation.
Day 1 comprised a workshop on source-oriented monitoring and involved participants from the Netherlands, Norway and the UK whilst Day 2 involved an internal project meeting with UK participants only in order to agree on an outline strategy for how best to instigate the Source Orientated Approach (SOA) in the UK.
Aims and Scope
The main aim of the workshop was to discuss the implications for the UK of adopting a SOA to monitoring emerging PHS, as proposed in the HARP-HAZ monitoring prototype, and to learn of the experiences of other countries in implementing the SOA.
The workshop provided an opportunity to hear, first-hand, from those involved in implementing the SOA in the Netherlands and Norway and to discuss the implications of adopting such an approach in the UK. Specific areas discussed and evaluated are listed below:
Justification for approaches used to quantify each substance;
Methodology and details of source identification;
Support infrastructure requirements needed for implementation (including practicalities and costs);
Cost effectiveness of the SOA compared with other approaches, particularly in terms of meeting legal requirements;
Difficulties encountered in implementing the HARP-HAZ prototype for each substance; and,
Applicability and robustness of the information obtained (e.g. could the data reported be quality controlled or independently verified, and does it meet the requirements of the HARP-HAZ prototype? Was the data comparable between States?).
These discussions and evaluations were utilised to assess how the SOA can be used to best effect for individual substances as well as their use as a tool in the wider framework of meeting the UK’s various international obligations on monitoring hazardous substances.
166

Outcomes – Day 1
Key outcomes from the proceedings of Day 1 are listed and identified below:
1. Geography is likely to play a major role in the type of approach adopted i.e. SOA or LOA. For example traditionally the adoption of the LOA in the UK has been more favourable as there are no transboundary issues in terms of contributing river systems. In contrast the Netherlands has preferentially adopted the SOA as it is a downstream nation, situated on a delta of three major river systems i.e. the Rhine, the Meuse and the Scheldt. Therefore it is important to monitor to ensure awareness with respect to hazardous substances produced domestically versus those entering from other countries.
2. The UK was the only country to report on emissions using the LOA i.e. primarily LOA1 and LOA2 whilst all other Member States used a combination of SOA1 and SOA2 when reporting on emissions of hazardous substances. However it is important to note that all countries do utilise a combination of both approaches to varying degrees due to international reporting requirements such as OSPAR-RID.
3. The Netherlands, Norway, the UK and to a lesser extent Denmark have best illustrated transparency and comparability in their reporting with regard to HARP-HAZ requirements. However, the difference between LOA and SOA reporting has resulted in significant variation in the way which data is reported between the UK and Norway and the Netherlands. Although the UK took all sources into account only percentage reductions were provided for each substance.
4. In contrast to the LOA the SOA is not inherently transparent. Accuracy in reporting using this approach will depend on the amount of attention which is focussed on capturing all relevant source emissions of a particular hazardous substance.
5. Common advantages highlighted by Norway and the Netherlands for selection of the SOA for reporting on emissions tended to focus on limitations that they had experienced when using the LOA These are listed below:
SOA is constant in time and not susceptible to environmental noise such as sporadic rainfall events;
rapid identification of target group sources that are key contributors of hazardous substances, allowing policy makers to formulate reduction measures for specific sources;
key contributors of hazardous substances to the environment bear the cost of reporting under the SOA, enabling more resources to be focussed on quantifying diffuse sources; and
transboundary issues especially with regard to water do not influence SOA. Riverine input data have the potential to include a proportion of substances originating from other countries.
6. Common difficulties highlighted by Norway and the Netherlands when reporting on emissions are listed below:
167

data gaps exist for some substances over the 14/15-year reporting period. As a result extrapolation had to occur using data from more recent years in addition with information regarding source apportionment;
quality and completeness of data obtained from some sources e.g. waste landfill sites and UWWTPs in Norway. Data generated for these sources is either non-existent or highly inaccurate;
some industries may overlap source divisions resulting in difficulties when apportioning emissions amongst contributory sources. This is also likely to impact on focussing resources on specific sources in terms of reducing emissions;
quality assessment is another key difficulty associated with the SOA both in terms of actual measurement at the source as well as estimation using activity rates etc;
double counting may occur with a particular substance such as mercury being measured twice within two different source categories; and
non-availability of data for diffuse sources of hazardous substances is a key problem in that data often are required to be estimated using statistical data or best guesses through expert judgement.
7. In terms of the costs associated with the SOA approach both Norway and the Netherlands found it difficult to apportion these due to the large amount of organisations involved in the reporting process as well as the host of additional contexts for which the data is utilised. The cost-effective elements of the approach include authorities being able to easily identify sources requiring attention in terms of reducing emissions as well as that major point sources self-report allowing more resources to be focussed on quantifying emissions from unknown sources
Outcomes – Day 2
Key outcomes from the proceedings of Day 2 are listed and identified below:
1. The main discussions and conclusions from the previous days Harp-Haz workshop were presented by WRc. Figure 1 was the focus for discussion in developing a strategy for monitoring of hazardous substances in the UK with an emphasis on the applicability of the SOA.
168

Figure 1: Schematic for discussion in developing a strategy for monitoring hazardous substances in the UK
169
Hazardous Substances identified by national or international body
(highest pressure WFD?)
Report must flag up the
legal requirements, pressures and uncertainties
Questions to assist in Development of a UK Strategy for Monitoring Hazardous Substances
are there significant sources in the UK?
Is a comprehensive risk assessment available? Has a material flow analysis been carried out? Any monitoring information? DEFRA or EA?
if yes, and sources significant, how do we deal with the substance?
Develop a pragmatic plan depending on information available, legal requirements and UK commitments?
Develop infrastructure to compile regular source estimates, following negotiations with relevant producers, companies. Do we have appropriate powers?
Carry out regular monitoring in appropriate locations to the extent necessary (main drivers will be international commitments?)
how could we finance new work?
DEFRA consultancies or research programmes? Environment Agency via the Concordat? Dropping existing monitoring programmes which provide no useful information to free up resources?

2. Based on the current approach for monitoring hazardous substances in the UK the balance between LOA and SOA may need to alter in order fulfill the requirements of key international drivers. Although a combination of both approaches is not required for OSPAR and North Sea reporting, Directives such as the Water Framework Directive require monitoring in the environment as well as at the source.
3. The difficulties and benefits associated with the SOA and the LOA indicated that a combination of both approaches may result in minimising problems related to data quality and source apportionment. This is likely to be reinforced further by key drivers such as the WFD, which requires accurate monitoring data for specific substances as well as an indication of key sources of hazardous substances within specific River Basin Districts.
170

ANNEX VI - APPLICATION OF ECOTOXICOLOGICAL METHODS FOR ASSESSING WATER QUALITY
Endocrine Disruption in UK aquatic environment; an example using plasma vitellogenin (VTG) analysis in an estuarine fish, the European Flounder (Platichthys flesus).
Early research on the effects of oestrogenic chemicals in the UK aquatic environment indicated that many sewage treatment final effluents contained substances that were oestrogenic to male fish, as manifested by the induction of female yolk precursor protein vitellogenin (VTG), and appearance of oocytes (ie intersex) in the testis. The causal agents in some instances have been identified as being the natural hormones 17B-oestradiol and oestrone and the synthetic hormones ethynylestradiol. In some locations the surfactant nonylphenol has been implicated.
Extensive laboratory and field studies on the effects endocrine disruption in the marine environment have been conducted eg EDMAR (Endocrine Disruption in the Marine Environment). A good example of a study is the measurement of plasma VTG concentrations in male flounder (Platichthys flesus) captured from several UK estuaries between 1996-2002. It has been confirmed that plasma VTG concentrations in male flounder have remained elevated in several UK estuaries (e.g. Tees, Mersey and Tyne) throughout the period covered by this study. However, the time series data indicate that plasma VTG, has decreased in fish captured from several estuaries, especially those of the Tyne and Mersey. Shorter time series datasets from the Forth and Clyde estuaries also suggest a decrease in oestrogen contamination at these sites. Trends associated with specific point sources of oestrogenic contamination show site-specific patterns. For instance, plasma VTG levels in male flounder captured near to the Howdon sewage treatment outfall (Tyne) have showed a steady decline to near baseline levels in 2001, while the plasma of male fish captured at a site adjacent to the Dabholm Gut discharge in the Tees estuary have shown little evidence of a sustained decline. These results and trends have been used to succesfully monitor levels of oestrogenic contaminant exposure in estuaries and to investigate the effectiveness of schemes to improve the final effluent from sewage treatment works.
For further detail refer to:
Kirby, Mark F., Allen, Yvonne T., Dyer, Robert A., Feist, Steve W., Katsiadaki, Ioanna, Matthiessen, Peter, Scott, Alex P., Smith, Andrew, Stentiford, Grant M., Thain, John E., Thomas, Kevin V., Tolhurst, Laura and Waldock, Michael J. (2004). Surveys of plasma vitellogenin and intersex in male flounder (Platichthys flesus) as measures of endocrine disruption by oestrogenic contamination in UK estuaries: Temporal trends 1996 – 2001. Environmental Toxicology and Chemistry, 23 (3).
171

Imposex in Buccinum undatum and Neptunia antiqua: A Monitoring Tool for Assessing Changes in TBT Exposure.
TBT-specific biological effects monitoring was first established in the mid 1980s when thickening of shells of the Pacific Oysters (Crassostrea gigas) and the development of imposex in whelks and periwinkles was attributed to this compound. The data collected by 1987 using these two species provided the evidence for environmental damage and subsequently, led to a UK ban on the use of TBT on small boats and in aquaculture. In 1989, the European Union imposed a similar ban (EU, Council Directive (76/769/EEC).
Imposex is the imposition of male sexual organs in female whelks and periwinkles and has been found to be a very sensitive indicator of TBT exposure, the effect is dose related and severe imposex can lead to sterility in females and detrimental reproductive effects on individuals and populations.
Over the past fifteen years extensive surveys have been conducted to measure the prevalence of imposex in the UK. In 1992, in preparation for the 1993 North Sea Quality Status Report was conducted around the North Sea. To compliment this study a further survey was conducted using a similar sampling strategy around the Celtic Sea with the added emphasis on including some 'hot spot' monitoring. In 1998, Defra funded funded a further North Sea study which included some TBT chemical analysis of the flesh of animals.
In the past fifteen years Analytical Quality Control procedures have been developed through QUASIMEME and BEQUALM for the measurement of imposex with regular intercalibration studies being conducted Europe wide. OSPAR guidelines for TBT-specific biological effects monitoring are now in place.
An IMO International Convention on the Control of Harmful Anti-fouling Systems agreed at a Diplomatic Conference, in October 2001, to prohibit the application or re-application to ships of organostanic compounds as biocides in antifouling systems from 1st January 2003. This has now been implemented in the EU by Council Directive 2002/62/EC and, in the UK, approval for use of organostanic compounds acting as biocides in antifouling systems, granted under the Food and Environment Protection Act (FEPA) or the Control of Pesticides Regulations (COPR), have now been revoked.
Under the OSPAR JAMP, the UK has an obligation to report data on JAMP issue 1.3 – to what extent do biological effects occur in the vicinity of major shipping routes, offshore installations, marinas and shipyards etc. It is included in the CEMP (Appendix 8 – TBT specific biological effects plus organotins in sediments) and is category 1 rated i.e. is mandatory since it is fully supported by AQC procedures.
Currently within the UK NMMP a limited amount of data are collected in a fragmented fashion with no overall strategy. DOE NI conducts surveys annually at 30-40 sites. SEPA has carried out a number of ad hoc surveys over the years both for spatial and temporal assessment and for point source and non-point source assessment: it is currently in the process of developing an integrated survey plan to meet OSPAR and NMMP requirements and will include ca. 50 sites. CEFAS and EA carry out no surveys with the exception of occasional ad hoc projects. FRS has carried out two surveys at 5-year intervals at ca. 150 sites throughout the UK and conducts an ongoing biennial survey of TBT effects at the Sullom Voe oil terminal. The sites in these surveys are not NMMP listed but are still of use to the NMMP. In the past two years CEFAS has carried out pilot surveys both offshore and inshore in English coastal waters using Buccinum
172
undatum and Neptunea antigua. DOE NI and SEPA have also undertaken similar pilot studies with B. undatum.
In the light of the EU ban and the revocation of approvals in the UK for the application of TBT, it is appropriate that a baseline survey of the effects and residual concentrations of TBT in UK waters be established. The data from a UK-wide survey would provide a baseline for further monitoring (trends), provide the basis for a UK-wide strategy to be developed for the UK NMMP, provide data for the next State of Sea Report and OSPAR Assessment. It would also fulfil the UK obligation to the OSPAR CEMP on issue 1.3.
For further detail refer to:
Critical Appraisal of the Evidence for Tributyltin-Mediated Endocrine Disruption in Mollusks. Matthiessen,P; Gibbs,P.E. ET&C, 17, 1, 37-43, 1998
173