Detonation Prediction and Mitigation: Some observations ...ukelg.ps.ic.ac.uk/40GO.pdf · Detonation...
37
Aber Shock and Detonation Research Limited Detonation Prediction and Mitigation: Some observations based on personal experiences of process pipeline explosion safety studies Gwyn Oakley Based on an outline of an invited plenary lecture( Geraint Thomas) 19 th ICDERS Hakone Japan (2003)
Transcript of Detonation Prediction and Mitigation: Some observations ...ukelg.ps.ic.ac.uk/40GO.pdf · Detonation...

Aber Shock and Detonation Research Limited
Detonation Prediction and Mitigation:Some observations based on personal
experiences of process pipeline explosion safety studies
Gwyn Oakley
Based on an outline of an invited plenary lecture( Geraint Thomas) 19th ICDERS Hakone Japan (2003)

Aber Shock and Detonation Research Limited
IntroductionThe number of reported detonation incidents within process
plant and industry in general is thankfully low compared to other potential explosion hazards.
However the extreme pressure generated in a detonation, ca. 1.8 Mpa for a hydrocarbon air mixture, increasing to 4.5 MPaduring normal reflection poses a severe threat to industrial plant. The pressures and potential damage may however be greater in localized regions undergoing transition to detonation.
Detonation is thus greatly feared by process safety engineers. Is this justified and, if so, how well can they be
predicted/mitigated and what might the consequences be?
Aber Shock and Detonation Research Limited
Evaluating explosion safety
Basic recommended approachesThe first stage in assessing any potential industrial explosion hazard is to conduct a thorough paper audit of all possible perceived hazards that could arise: These are the familiarHAZOPHAZANHowever, once a potential detonation hazard has been identified how does one quantify the probability of detonation developing?

Aber Shock and Detonation Research Limited
The enigma of detonationDetonation is probably the most destructive accidental explosionevent that could develop, especially within a confined process pipeline such as a vent header.The enigma of detonation is that from a theoretical standpoint our understanding of detonation in explosive mixtures is well advanced but our ability to predict if detonation will develop cannot be done using any proven scientific methodA further complicating factor is that effective one dimensional theories are complicated in practice by complex three dimensional gasdynamic effects.Finally although detonation is a chemical phenomenon reliant on exothermic chemical reactions to sustain continued propagation, coupled to complex gasdynamic interactions, the development of conditions that lead to detonation is usually governed by turbulent deflagration phenomena at both macro-and micro-scopic scales
Aber Shock and Detonation Research Limited
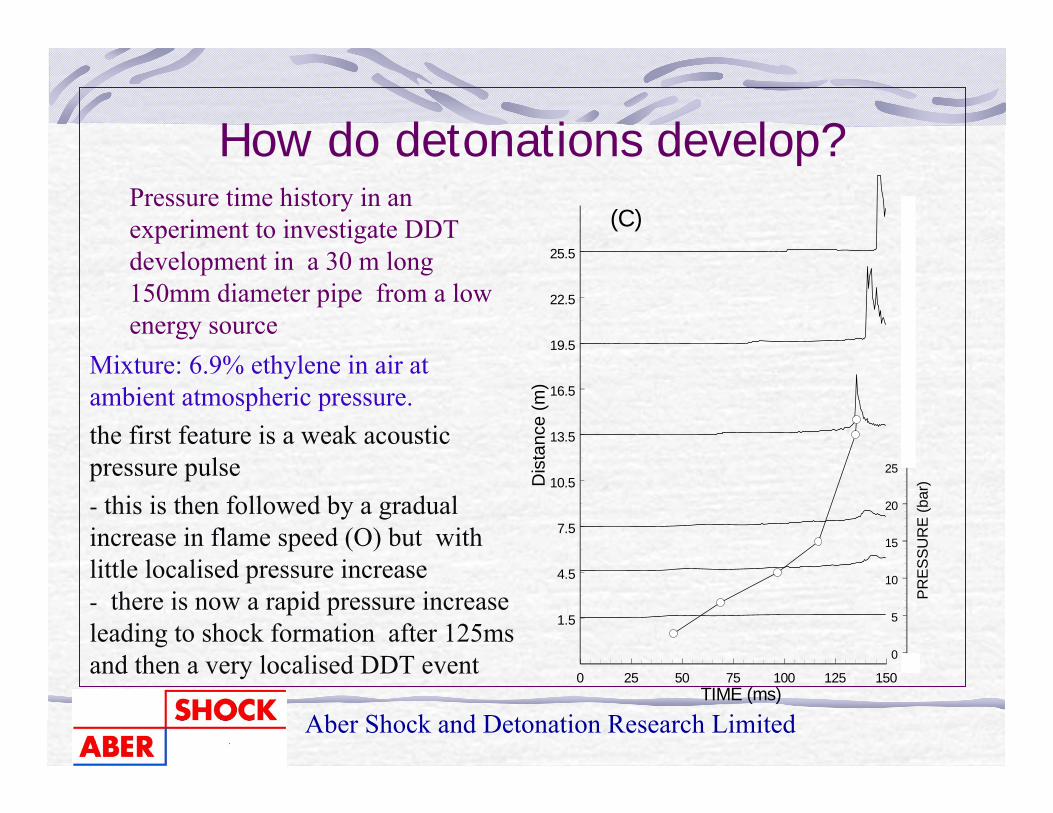
Mixture: 6.9% ethylene in air at ambient atmospheric pressure.the first feature is a weak acoustic pressure pulse- this is then followed by a gradual increase in flame speed (O) but with little localised pressure increase- there is now a rapid pressure increase leading to shock formation after 125ms and then a very localised DDT event 0 25 50 75 100 125 150
TIME (ms)
PR
ES
SU
RE
(bar
)
0
5
10
15
20
25
1.5
4.5
7.5
10.5
13.5
16.5
19.5
22.5
25.5
Dis
tanc
e (m
)
(C)Pressure time history in an experiment to investigate DDT development in a 30 m long 150mm diameter pipe from a low energy source
How do detonations develop?

Aber Shock and Detonation Research Limited
Flame Acceleration CharacteristicsSummary of flame acceleration characteristics for fuels in stoichiometric mixture with air. Ambient temperature and pressure. Only h2- and c2h4-air detonated 0 100 200 300 400 500 600
Time (ms)
0
2
4
6
8
10
12
14
16
Dis
tanc
e (m
)
methaneacetonepropanehydrogen ethylene

Aber Shock and Detonation Research Limited
Phases of Pipe Explosion Development IPressure histories from gauges 1.5,
4.5, 7.5 and 13.5 m from the spark igniton source (0.6 J)
All gauges show a gradual, nearly homogeneous pressure increase as the flame first accelerates.
A sudden pressure increase is seen first at the gauge at 13.5 m, around the time the flame arrives
The pressure excursions seen by gauges closer to the spark are due to the pressure waves from the upstream transition 0 50 100 150
TIME (ms)
0
1
2
3
4P
1 1.5m from the spark
ETH15 - 6.9% ethylene/Air in straight tube
0 50 100 150TIME (ms)
0
1
2
3
4
P2
4.5m from the spark
0 50 100 150TIME (ms)
0
1
2
3
4
P3
7.5m from the spark
0 50 100 150TIME (ms)
0
5
10
15
P4
13.5m from the spark

Aber Shock and Detonation Research Limited
Phases of Explosion Development IIPressure histories from gauges 13.5,
19.5 and 25.5 m from the spark source
A strong shock arrives at the first gauge(lower).
This has increase in strength by the time it reaches the gauge at 19.5 m, and is trailed by a flame and a further pressure increase(middle).
The last gauge(upper) shows a profile typical of a post-transition detonation. The blast from the transition can be seen on the middle gauge. 120 125 130 135 140 145
tim e (m s)
05
10152025303540
pres
sure
(bar
)
13.5m from the spark
120 125 130 135 140 145time (m s)
0
10
20
30
40
pres
sure
(bar
) 19.5m from the spark
120 125 130 135 140 145time (m s)
0
10
20
30
40
pres
sure
(bar
) 25.5m from the spark
ETH15 - 6.9% ethylene/Air in straight tube

Aber Shock and Detonation Research Limited
Modes of Initiation of Detonation _______________________________Source ModeEnergy________________________________________
High Detonation
Low
DirectCritical
Blast fromsolid explosives Flame
AccelerationSpark ignition
Prior to detonation there is always a shock and trailing flame front whatever the source

Aber Shock and Detonation Research Limited
direct initiation of detonationSmoked foil image of high energy spark initiation showing role of transverse cell structure left-cylindrical, right- spherical geometry c2h2-o2
Note the visual evidence for initially unburned shocked gas between the lead shock front and trailing combustion within which evidence for a transverse detonation can be identified

Aber Shock and Detonation Research Limited
Under field conditions it is impossible to study the onset of detonation in detail because of the stochastic nature of flame acceleration
However we do know that the final deflagration to detonation transition (DDT) occurs in shock heated gas or mixtures compressed by other means- e.g. knock in internal combustion engines
We can therefore use laboratory reflected shock techniques to re-create the gas dynamic and thermodynamic conditions close to the transition conditions and watch how the flame develops
Why/How does the final transition occur?

Aber Shock and Detonation Research Limited
This example shows a flame front several 100’s μs after a distributedauto-igniton. There is a ‘turbulent like’ flame front and one or two small spherical flame kernels
There is a rapid local acceleration of the ‘flame’ front

Aber Shock and Detonation Research Limited
After 10 μs a compression front seems to be developing below the locally accelerating flame front, to the left of the spherical flame bubble

Aber Shock and Detonation Research Limited
After a further 10 μs a second compression front develops closer to the lower wall. The original combustion front-pressure wave continues to evolve.

Aber Shock and Detonation Research Limited
Detonation has formed 10 μs later, centred near to the small flame bubble.
Finally a detonation emerges

Aber Shock and Detonation Research Limited
Pressure during transition
The most significant pressures developed during a transition to detonation occur as shock heated mixture supports a local detonation
Lead shock velocity post shock pressure shocked gas CJ pressure
m/s bar bar
640 4.52 50.9
1000 9.92 77
2593 18.92 102
Data for undiluted ethylene-air, CJ pressure ca. 18.4 bar

Aber Shock and Detonation Research Limited
What predictive tools do we have? I
For process pipe explosions cell size theoriesStudies at Mcgill suggest that detonations cannot develop if the detonation cell size(λ) is greater than some multiple of the pipe diameter(D), e.g λ must be greater than πD for detonation to develop

Aber Shock and Detonation Research Limited
Studies in a 7mm tube at elevated T&P Experimental tests have been performed in a 7 mm tube with initial pressures and temperatures as great as 7 bar and 540K respectively: mixtures tested include C2H4-oxygen as well as H2+CH4 with oxygen.
Cell widths were predicted as a multiple of the auto-ignition delay time in the theoretical von-neuman zone

Aber Shock and Detonation Research Limited
Studies in a 7mm tube at elevated T&P
0 10 20 30 40 50 60 70 80 90 100
Oxygen (%)
0
2
4
6
8
10
12
14
16
18
20
Max
imun
Pre
ssur
e (B
ar)
H2/O2
0.0
0.1
0.2
0.3
0.4
0.5
0.6
0.7
0.8
0.9
1.0
Indu
ctio
n zo
ne le
ngth
(mm
)
721a
0 10 20 30 40 50 60 70 80 90 100
Oxygen (%)
0
10
20
30
40
Max
imum
Pre
ssur
e (B
ar)
0.0
0.1
0.2
0.3
0.4
0.5
0.6
0.7
0.8
0.9
1.0
Indu
ctio
n z
one
leng
ht (m
m)
1/3 CH4 + 2/3 H2 / O2
0 10 20 30 40 50 60 70 80 90 100
Oxygen (%)
0
10
20
30
40
50
Max
imum
Pre
ssur
e (B
ar)
0.0
0.1
0.2
0.3
0.4
0.5
0.6
0.7
0.8
0.9
1.0
Indu
ctio
n zo
ne le
nght
(mm
)
2/3 CH4 + 1/3 H2 / O2
0 10 20 30 40 50 60 70 80 90 100
Oxygen %
0
10
20
30
40
50
Max
imun
Pre
ssur
e (B
ar)
0
1
2
3
4
5
6
7
8
9
10
Indu
ctio
n zo
ne le
ngth
(mm
)
CH4/O2
The limits for severe pressure events correlated well with predicted cell widths for four h2/CH4/O2 mixes ranging from
pure h2 to pure CH4

Aber Shock and Detonation Research Limited
Ethylene air in150 and 50 mm pipesPredicted(○) and published measured(●) cell widths are close but measured detonation limits (150 mm tests) correspond to a much smaller cell width than anticipated
0.4 0.6 0.8 1.0 1.2 1.4 1.6 1.8 2.0Equivalence ratio
0
50
100
150
200
250
300
Cel
l wid
th (m
m)
D
During tests in a 50 mm pipe the limit for overpressure development(●) again correlates with published cell widths(□) but the critical cell width is not as anticipated
30 40 50 60 70 80 90Nitrogen % dilution
0
10
20
30
40
50
60
70
80
90
100
p4m
ax(a
tm.)
0
5
10
15
20
25
30
cell_
wid
th (m
m)
ethylene data· - Pmax measured
- cell size predicted

Aber Shock and Detonation Research Limited
Recent results with non-standard fuel-oxidisersNo cell size data is available for the mixtures tested and limited supporting kinetic data for cell size prediction calculations.However pressure measurements identify distinct limits of detonationCHEM A+Nitrous Oxide CHEM B+Oxygen
0 10 20 30 40 50 60 70 80 90 100
N2percent
0
10
20
30
40
50
60
P4
0
1000
2000
3000
4000
5000
cell_
wid
th
CHEM A+nitrous oxide data· - P4 measured
- cell size predicted
25 35 45 55
o2perc
0
10
20
30
40
50
60
Max
Pre
ssur
e (a
tm.)

Aber Shock and Detonation Research Limited
Preliminary tests with standard unleaded fuel
As in the previous tests Chemical B was a liquid at room temperature the fuel delivery apparatus was also used for some preliminary observations of flame propagation with a standard commercial (Murco) unleaded automotive fuel, again in a 50 mm diameter 6m long steel pipe.
Note: the testing dates were in early September so the fuel was probably a low vapour fraction summer blend. P1bar P2bar P3bar P4bar
-1.0
-0.8
-0.6
-0.4
-0.2
0.0
0.2
0.4
0.6
0.8
1.0Pressure bar
0.0 0.5 1.0 1.5 2.0 2.5
Time [S]
0
1
2
3
4
5
6distance [m
Initial tube wall temperature 140oC, Fuel:air ratio ~14:1Spark ignitionMax press. ca. 1 bargFlame speeds 9.8→1.7 ms-1

Aber Shock and Detonation Research Limited
What predictive tools do we have II
CFD capabilities are in general limited in their usefulness when it comes to detonation.
Because of the need to model accurately the early turbulent deflagration phases most explosion codes excel in this area and unfortunately the solution techniques used cannot then capture the critical shock development phase.
Recent code developments at Tel Tek Norway have however provided a code that does capture most of the operative physics and gas-dynamics

Aber Shock and Detonation Research Limited
Initial results of flame acceleration and transition to detonation obtained using a MATLAB based RCM code with a turbulent energy release model.
Recent CFD Modelling Activity

Aber Shock and Detonation Research Limited
RCM Deflagration SolutionThe new combustion model for RCM is based on the Rankine-Hugoniotrelations. The burning velocity, St, is directly related to the states either side of the of the combustion waveFrom the conservation of mass and energy we can calculate the Hugoniotcurve. When the turbulent burning velocity St is specified the state of the combustion products can be found at the intersection of the Hugoniot curve with the Rayleigh line, also known as the weak deflagration solutionThe new combustion model used in RCM, which is illustrated in Figure 2, treats the combustion wave as a discontinuity. If St and heat release q is known we can treat the flame propagation in the domain between two grid points as a reactive Riemann problem.
Distance
ppB
pU
Deflagration(Combustion
Wave)
Rightrunningwave
Left runningwave
p*U
p*B
Fig. 2 : RCM combustion model

Aber Shock and Detonation Research Limited
Quasi-1D Model for Pipe ExplosionsAlthough 1-D in macroscopic terms, local flame front structure will be multi-dimensionalWe therefore confinelocally a complex flame front interface to a single mesh pointWe represent the correct mass burning rate and corresponding energy release by an effective turbulent burning velocity St if A is the cross sectional area of the pipe.
dQ/dt= St ρ A qWe must now introduce a model for the turbulent burning, based initially on turbulence intensity u’ in the unburned gasUnfortunately, little data exists on u’ dependence on mean gas flow u even for steady flows, and none for transient pipe flowsInitially use correlation due to Lawn; u’ = 0.168 u Re-0.119

Aber Shock and Detonation Research Limited
Development of Pipe ExplosionsOver-Pressure PMean Flow velocity U
U + U’
Q
St
Distance
Time
Pressure-time
Compression characteristics due to energy release at flame front
The extent of flame acceleration is controlled by the degree of turbulent combustion feedback generated due to viscous interaction with the tube walls
As the flame accelerates, pressure and waves and propagate forward into the unburned mixture along characteristics. The unburned gas velocity is no longer zero. As the flame velocity and local flame pressure increase, the characteristics converge and a shock forms

Aber Shock and Detonation Research Limited
Preliminary RCM Simulations of Pipe ExplosionsFlame front position with time
Initial acceleration is over-predicted
Need a better description of the initial laminar to wrinkled flame transition phase
0
5
10
15
Dis
tanc
e (m
)
0 50 100 150Time (ms)

Aber Shock and Detonation Research Limited
Preliminary RCM Simulations of Pipe ExplosionsFlame front position with time as given by the pressure field
General features are reproduced but the absolute times and pressures are incorrect
Shock formation following convergence of compression waves from the accelerating flame front is caught but we need a further transition to detonation criterion based on ignition delay data.
Aber Shock and Detonation Research Limited
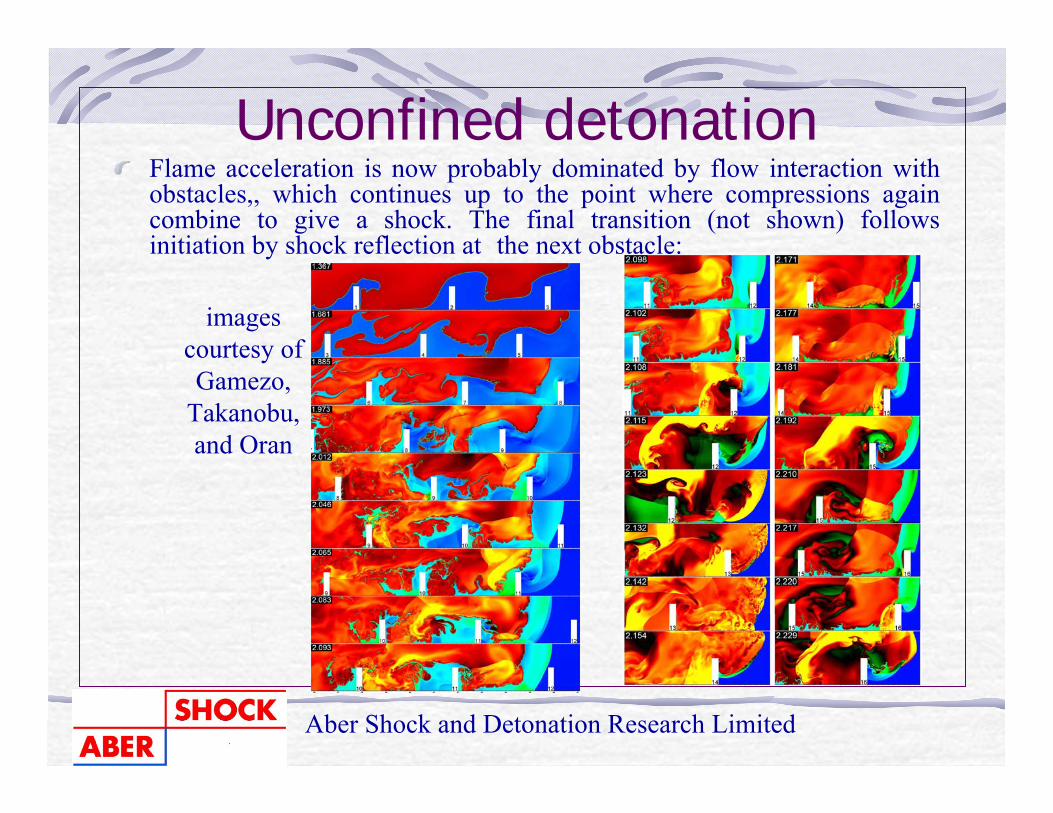
Unconfined detonationFlame acceleration is now probably dominated by flow interaction with obstacles,, which continues up to the point where compressions again combine to give a shock. The final transition (not shown) follows initiation by shock reflection at the next obstacle:
images courtesy ofGamezo,
Takanobu, and Oran

Aber Shock and Detonation Research Limited
Pipeline detonations: Possible consequences
mechanical failure!, as with this HDPE pipe.Original 4 sections of 300mm diameter, these were reduced to 54 pieces after the passage of an ethylene-
air detonation
0 10 20 30 40 50 60
fragment number
0
1000
2000
3000
4000
5000
Mas
s (g
m)

Aber Shock and Detonation Research Limited
Passage of a detonation leads to axial and hoop strains in the pipe wall
0 2 4 6 8 10 12 14 16 18 20Time (ms)
-2000
-1000
0
1000
2000
3000
4000
Stra
in (m
icro
stra
in)
grp13_sgloc_2 Hoop
2.8 2.9 3.0 3.1 3.2 3.3 3.4 3.5 3.6 3.7 3.8Time (ms)
-2000
-1000
0
1000
2000
3000
4000
Stra
in (m
icro
stra
in)
grp13_sgloc_2
Axial
Hoop
0
10
20
30
40
50
Pre
ssur
e (A
tm.)
5 6 7 8 9 10 11 12 13Distance (m)
0
1
2
3
4
5
Tim
e (m
s) Start of GRP tube
2740 m/s
1820 m/s
The Propagation velocity of the axial wave is greater than that of the hoop strain,which is close to the detonation velocity
Aber Shock and Detonation Research Limited
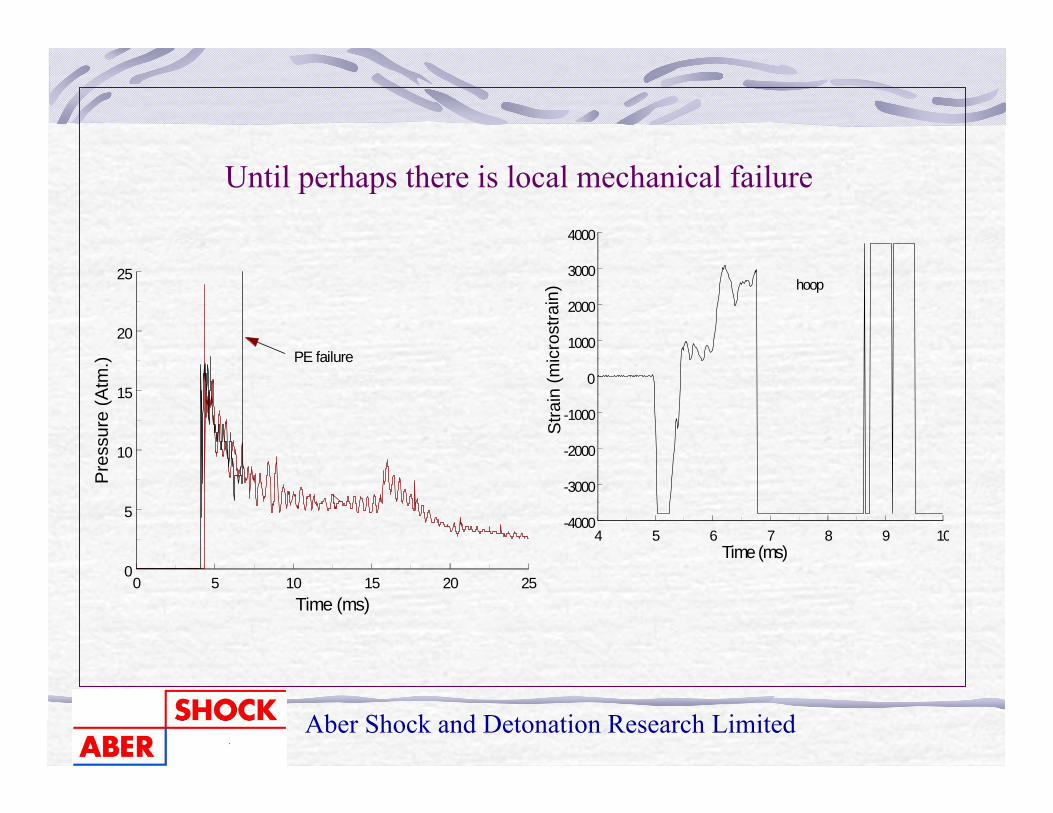
Until perhaps there is local mechanical failure
0 5 10 15 20 25Time (ms)
0
5
10
15
20
25
Pre
ssur
e (A
tm.) PE failure
4 5 6 7 8 9 10Time (ms)
-4000
-3000
-2000
-1000
0
1000
2000
3000
4000
Stra
in (m
icro
stra
in) hoop
Aber Shock and Detonation Research Limited
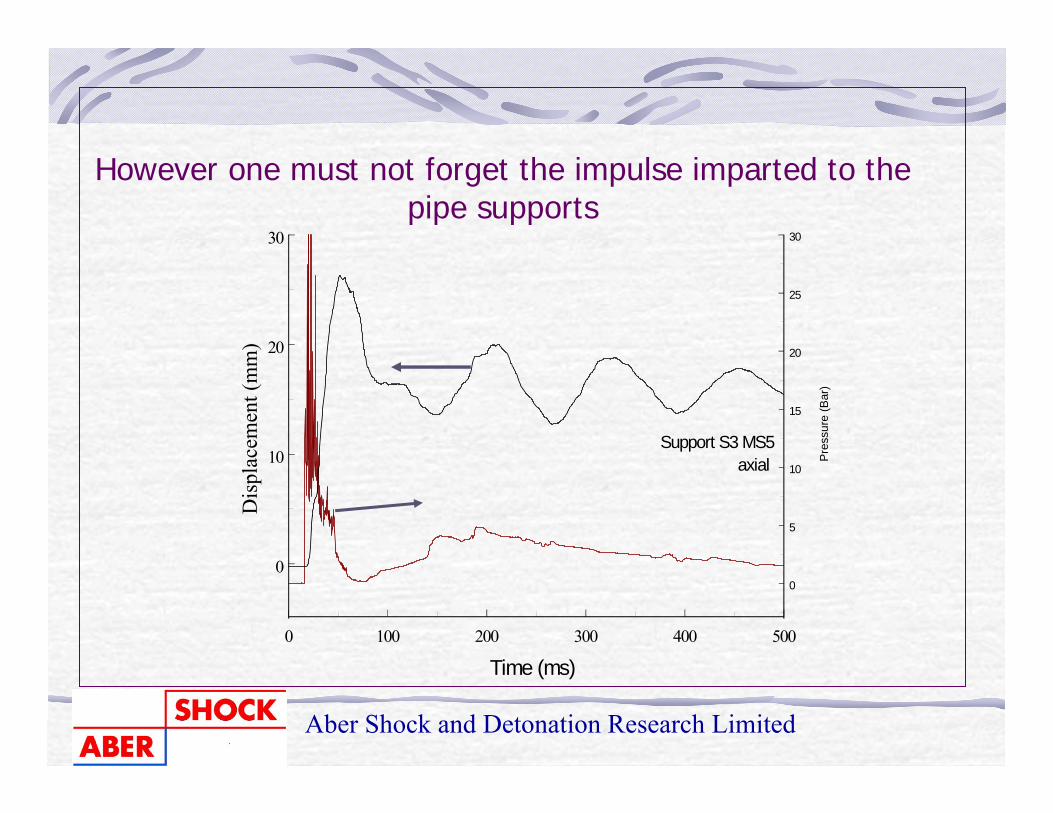
However one must not forget the impulse imparted to the pipe supports
0 100 200 300 400 500
Time (ms)
0
10
20
30D
ispl
acem
ent (
mm
)
Support S3 MS5axial
0
5
10
15
20
25
30
Pre
ssur
e (B
ar)

Aber Shock and Detonation Research Limited
Mitigation
several approaches are possible:
a) Dilution with an inert, usually nitrogen, to reduce intrinsicreactivity and detonability.
b) For fuel- oxygen systems- robust controls on oxygen content
c) Water sprays have been shown to work but have attendant problems as part of an active explosion barrier
d) Passive explosion arrester devices

Aber Shock and Detonation Research Limited
Detonation arresters
The exact mechanisms by which these work are not known precisely. Most are assumed to work by destroying the transverse wave structure and then abstracting heat energy and momentum from the detonation products.
Schlieren images of detonation waves incident on and hot gases emerging from a simulated crimped ribbon explosion arrestor
Aber Shock and Detonation Research Limited
Current capabilities and deficiencies
We do not know how to characterize or rank the relative hazards of mixtures other than the widely studied hydrocarbons and hydrogen. Often the only recourse available is direct experimental testing using the final geometry and mixtures.There is a distinct lack of CFD capabilities that can predict accurately the generation of the compressed heated gas that undergoes the final onset of detonation process


![Experimental Observations of Detonation in Ammonium ... · where the detonation velocity exceeds the sound speed of most con ners. In these ideal HE systems, ... [7], while the longitudinal](https://static.fdocuments.in/doc/165x107/5e4508cc5e1601420e742093/experimental-observations-of-detonation-in-ammonium-where-the-detonation-velocity.jpg)