DETERMINING VOLCANIC DEFORMATION AT SAN MIGUEL...
38
73 CHAPTER 4 DETERMINING VOLCANIC DEFORMATION AT SAN MIGUEL VOLCANO, EL SALVADOR BY INTEGRATING RADAR INTERFEROMETRY AND SEISMIC ANALYSES ABSTRACT From the early 1500’s to the present day, San Miguel volcano has experienced at least 25 small eruptions making it one of the most active volcanoes in the El Salvadoran volcanic chain. From 1867 to present, the volcano experienced at most 15 explosive, central vent eruptions with Volcano Explosivity Indices (VEI) of 1 or 2. To understand the explosive volcanism, we conduct an integrated geophysical study to determine which areas around the volcano are undergoing deformation that could lead volcanic hazards such as slope failure or flank lava flows. We analyze the volcanism by integrating interferometric synthetic aperture radar (InSAR) results with earthquake source location data from a ten-month (March 2007-January 2008) seismic deployment. The InSAR results show a maximum of 6 ± 0.1 cm of volcanic inflation from March 2007 to mid-October 2007. During this time, seismic activity increased to a Real- time Seismic-Amplitude Measurement (RSAM) value of >400. Normal RSAM values for this volcano are <50. A period of quiescence began in mid-October 2007, and a maximum of 4 ± 0.1 cm of deflation was observed in the interferometry results from mid-October to mid-January 2008. Clustering of at least 50 earthquakes that occurred between March 2007 and January 2008 defines a 7 km long, 1.5 km wide, and 1.75 km deep region of volcano-tectonic deformation. This activity is the result of magma and gas movement along the San Miguel Fracture Zone (SMFZ), a north-south fracture that cuts across the summit crater. The earthquakes in this zone were classified into four types, and among them gas movement is indicated by “Tectonic” events
Transcript of DETERMINING VOLCANIC DEFORMATION AT SAN MIGUEL...

73
CHAPTER 4
DETERMINING VOLCANIC DEFORMATION AT SAN MIGUEL VOLCANO, EL
SALVADOR BY INTEGRATING RADAR INTERFEROMETRY AND SEISMIC
ANALYSES
ABSTRACT
From the early 1500’s to the present day, San Miguel volcano has experienced at least 25
small eruptions making it one of the most active volcanoes in the El Salvadoran volcanic chain.
From 1867 to present, the volcano experienced at most 15 explosive, central vent eruptions with
Volcano Explosivity Indices (VEI) of 1 or 2. To understand the explosive volcanism, we
conduct an integrated geophysical study to determine which areas around the volcano are
undergoing deformation that could lead volcanic hazards such as slope failure or flank lava
flows. We analyze the volcanism by integrating interferometric synthetic aperture radar (InSAR)
results with earthquake source location data from a ten-month (March 2007-January 2008)
seismic deployment. The InSAR results show a maximum of 6 ± 0.1 cm of volcanic inflation
from March 2007 to mid-October 2007. During this time, seismic activity increased to a Real-
time Seismic-Amplitude Measurement (RSAM) value of >400. Normal RSAM values for this
volcano are <50. A period of quiescence began in mid-October 2007, and a maximum of 4 ± 0.1
cm of deflation was observed in the interferometry results from mid-October to mid-January
2008. Clustering of at least 50 earthquakes that occurred between March 2007 and January 2008
defines a 7 km long, 1.5 km wide, and 1.75 km deep region of volcano-tectonic deformation.
This activity is the result of magma and gas movement along the San Miguel Fracture Zone
(SMFZ), a north-south fracture that cuts across the summit crater. The earthquakes in this zone
were classified into four types, and among them gas movement is indicated by “Tectonic” events

74
where as magma movement is indicated by “Tremor” events. The earthquake cluster coincides
with an area of surface deformation observed in the interferometry results. Forward modeling
was done using the geometry for the SMFZ inferred from the earthquake hypocenters to produce
synthetic interferograms. A comparison between profiles from the synthetic interferograms, and
the vertical component of deformation from the interferometry results shows that the vertical
deformation is a likely the result of fluid (e.g. gas, hydrothermal waters, and/or magma)
overpressure along the SMFZ. In the seismic analysis, we also find a second, broadly spherical
cluster of tremor events beneath the southwest flank of the volcano. The tremor activity in this
zone and nearby tremors to the northeast indicate that fluids are migrating into this area from the
SMFZ and accumulating. This accumulation could result in a flank lava flow. The presence of
this second feature, and nearby tremors indicate the existence of fractures with in the southwest
flank of San Miguel. These fractures and the lack of a well-developed soil contribute a high
potential for water infiltration and slope destabilization.
KEYWORDS: Radar Interferometry; InSAR; San Miguel volcano; El Salvador; volcano
seismicity; volcanic tremor; Forward Model

75
4.1 INTRODUCTION
The San Miguel volcano lies within the Central American volcanic chain in eastern El
Salvador (Figure 4.1). San Miguel most recently erupted in 2002 and prior explosive, central
vent eruptions had Volcano Explosivity Indices (VEI) of 1 or 2 (Perez et al., 2006; GVN
Bulletin, 2002). In Octobers of both 2006 and 2007, the volcano experienced annual repetitive
periods of heightened seismic activity (GVN Bulletin, 2006; GVN Bulletin, 2007). As of mid-
October 2008, however, the volcano had not experienced any heightened seismic activity.
Considering the historically explosive and recently cyclic behavior of this volcano, it is critical to
study the volcanic activity occurring there. The population at risk from an eruption is a mix of
both urban and rural. The city of San Miguel, which lies on the northeastern flank of the volcano
(Figure 4.1), has a population of ~150,000 and is the economic center of eastern El Salvador
(Perez et al., 2006). The Pan-American and Costal highways also cross the northern and southern
flanks of the volcano, and a major eruption could devastate this infrastructure while endangering
the lives of the local residents.
We conduct an integrated geophysical study to determine which areas around the volcano
are undergoing deformation that could lead volcanic hazards such as slope failure or lava flows.
We synthesize results from radar interferometry and seismic data from a temporary, six-station,
broadband network deployed around San Miguel volcano (Figure 4.1). This seismic deployment
was done in collaboration with researchers from Servicio Nacional de Estudios Territoriales
(SNET). The interferometry analysis was done on synthetic aperture radar (SAR) data acquired
between February 2007 and January 2008. The seismic network recorded continuously during
approximately the same time, from March 2007 to January 2008. Using the seismic data and

76
forward modeling, we developed synthetic interferograms that were compared to observed
interferograms in order to show the interaction between subsurface deformation and surface
deformation. We conclude that the volcanism at San Miguel is driven by tensile forces occurring
perpendicular to the San Miguel Fracture Zone (SMFZ). The SMFZ is the location for
upwelling of volcanic material. This material is either released through the SMFZ or is stored in
the southwestern slope of the volcano.
4.2 BACKGROUND
4.2.1 TECTONIC SETTING
The Central American volcanic arc occurs where the Cocos plate subducts under the
Caribbean plate at a rate of 73-84 mm/yr in a northeast direction (Corti et al., 2005). At this
portion of the arc, the subduction zone has a dip of 45-55° and a crustal thickness of 32-40 km
(Carr, 1984). The arc in El Salvador is oblique to the Central American trench, and the El
Salvador fault zone (ESFZ) accommodates the transpressional plate tectonic regime (Figure 4.1).
The ESFZ comprises a pair of ~2 m.y.-old, right-lateral strike slip faults that strike NW-SE,
parallel to the trench and the volcanic arc (Corti et al., 2005). A continuous GPS survey has
shown that 14 mm/yr of transcurrent movement is associated with the ESFZ (DeMets, 2001).
Within the ESFZ, a central graben, known as the Median Trough, accommodates tensional en-
echelon faulting, which has led to pull-apart basins and the faults may act as guides for fissure
eruptions (Corti et al., 2005; Agostini et al., 2006; Chesner et al., 2004).
San Miguel volcano is located in the eastern portion of the Median Trough (Agostini et
al., 2006; Chesner et al., 2004). It is believed that one of these en-echelon faults is the conduit
for fissure eruptions at San Miguel, as well as other volcanoes in the Salvadorian chain (Agostini

77
et al., 2006; Chesner et al., 2004). East of San Miguel, the Median Trough is not well
understood due to a lack of seismic activity, the lack of obvious surface geomorphology
indicative of significant faulting, and limited access to the eastern portion of the country due to
civil unrest (Corti et al., 2005; Agostini et al., 2006).
4.2.2 SAN MIGUEL VOLCANO
San Miguel volcano, known locally as Chaparrastique, is a symmetrical stratovolcano
(Figure 4.1) (Chesner et al., 2002). The volcano is 2130-m high, with a summit crater ~600 m in
diameter and ~340 m deep (Figure 4.1) (Chesner et al., 2004). The most explosive eruption at
San Miguel occurred in 1510 AD, the event that destroyed the formerly pointed peak and created
the modern summit crater (Meyer-Abich, 1956).
The volcano is composed of numerous basaltic-andesite to basalt lava flows, spatter, and
scoria (Chesner et al., 2004). There have been five recent lava flows that date from 1867 to
1699. These flows occur on the flanks of the volcano along known fractures or vents (Figure
4.1). Although it lacked lava flows, the last eruptive activity occurred in January 2002 and had a
VEI of 1 (GVN Bulletin, 2002). This eruption was a central vent eruption with explosions and a
gas plume (GVN Bulletin, 2002). During heightened activity in 2005, a fumarole has formed in
the central crater during (GVN Bulletin, 2006).
The volcano has had three heightened periods of both volcano-tectonic (VT) and long-
period (LP) seismic activity since the 2002 eruption. The first period was in October of 2005,
and consisted of ~70 VT events. In September 2005, there were fewer than 10 VT events (GVN
Bulletin, 2006). This low seismic activity is common in the months prior to a pulse of
heightened seismic activity (GVN Bulletin, 2006). A second period of heightened seismic

78
activity occurred during June 2006 with > 45 VT earthquakes, > 7,500 LP earthquakes, and a
real-time seismic amplitude measurement (RSAM; Endo and Murray, 1991) of 45 units, which
was previously at 8 units (GVN Bulletin, 2006; GVN Bulletin, 2007). This period was followed
by another period of high seismic activity on 9 October 2006 (GVN Bulletin, 2007). This one-
day event had a RSAM of 200 units (Escobar, 2007). The most recent period of heightened
seismic activity, with a RSAM > 400 units, occurred during October 2007 and was captured by
our seismic deployment (Escobar, 2007).
During the 2005 and 2006 period of heightened activity, a small amount of lahars or
landsliding occurred. In September to November 2005, small landslides occurred within the
crater and a lahar occurred on the northern flank during heavy summer monsoonal rainfall (GVN
Bulletin, 2006). Landsliding occurred within the crater again in latter part of October 2007
seismic event (Escobar, 2007).
4.2.3 INTERFEROMETRIC SYNTHETIC APERTURE RADAR (INSAR)
InSAR is a powerful tool that can be used to measure surface deformation associated with
volcanic inflation and deflation. It has been successfully applied to volcanic areas such as
Mauna Loa, Hawaii (Sandwell et al., 2007); Arenal, Costa Rica (Wadge et al., 2006); Socorro,
New Mexico (Fialko et al., 2001b); the Galapagos Islands (Yen et al., 2006); and Long Valley
Caldera, California (Fialko et al., 2001b). InSAR uses synthetic aperture radar (SAR) data to
measure near-vertical surface displacements, e.g., terrain displacement in the range, or line-of-
sight, direction with respect to the antenna. To do this, the difference in phase between two
time-separated SAR images is determined. This phase difference is a convolution of five effects:
(1) differences in the orbital parameters of the two input images; (2) systematic satellite and

79
environmental noise; (3) atmospheric noise; (4) topography; and (5) ground deformation (Lu et
al., 2007). In order to obtain an interferogram that primarily shows ground deformation, a two-
step process is used. The first step is to select appropriate image pairs for the analysis. One
criterion is to use image pairs with small differences in their satellite orbital parameters, or
baselines (Burgmann et al., 2000). This minimizes the orbital and systematic noise effects
(Burgmann et al., 2000; Lu et al., 2007). A second criterion is to use images containing little or
no vegetation. This will reduce environmental noise that, for example, arises from changing
vegetation patterns, and that often results in temporal decorrelation between image pairs, making
interferograms difficult or impossible to compute. A third criterion is to use a small temporal
separation (baseline), which can also minimize atmospheric noise (Lu et al., 2007). In addition
to these selection criteria, we also minimize atmospheric effects in our results by visually
inspecting the differential interferograms for obvious atmospheric and environmental artifacts,
and, using a comparison strategy (Massonnet and Feigl, 1995), we isolate radar images with
highly spatially-variable atmospheric artifacts.
The second step in maximizing the deformation signal is to minimize the influence of
topography in the inteferogram (Burgmann et al., 2000; Lu et al., 2007). Topography is removed
by first using an accurate digital elevation model (DEM) and the imaging geometry of the input
SAR images to generate a synthetic interferogram (Burgmann et al., 2000; Lu et al., 2007). This
synthetic interferogram is subtracted from the raw interferogram obtained from the input SAR
images, resulting in a ground deformation interferogram.
For our analyses, we use L-band data from the Advanced Land Observing Satellite
(ALOS) mission (ALOS, 2008). The ALOS data is useful because microwave radiation at the L-
band frequency (1.25 GHz; 23 cm) can penetrate through the vegetation covering most of flanks

80
of San Miguel volcano (ALOS, 2008). We find that atmospheric artifacts cause a small amount
of noise, typically leading to ~1 mm of error in the computed interferograms. This amount of
noise is relatively small compared to the cm-scale deformation we have observed on the volcano.
4.2.4 SEISMIC DEPLOYMENT
Seismic monitoring has done by SNET since the 1960s (Fernandez et al., 2004). From
from March 25, 2007 to January 20, 2008 UTEP augmented the SNET seismic network in the
vicinity of San Miguel with a continuously-recording, six-seismometer temporary network. The
temporary deployment was configured to focus on the southern slope of San Miguel volcano
(Figure 4.1), an area that has been the site of increased number of seismic events compared to the
rest of the volcano during the past three episodes of seismic activity (Figure 4.2) (Escobar,
2007).
The UTEP network comprised Gurlap broadband seismometers Four of the six
seismometers were co-located with SNET 1Hz seismometers to ensure the equipment was
housed in a secure location that had good coupling with the ground. Three of the four co-located
stations – “VSM”, “LAC”, and “BM” – were located on the flanks of the volcano (Figure 4.1).
These sites were equipped with Gurlap 40T seismometers. The fourth co-located station,
“PAC,” was located on the neighboring El Pacayal volcano, northwest of San Miguel volcano
(Figure 4.1), and this site was equipped with a Gurlap 3T seismometer. Two additional Gurlap
3T instruments – “MAR” and “GPS” – were placed on the south flank of the volcano (Figure
4.1). MAR was located in a Papaya orchard and GPS was co-located in a hut with a Global
Positioning System (GPS) station operated by the University of Wisconsin.

81
The 3T instruments enabled us to record longer periods seismic signals, ~100 s,
compared to the 30-s response of the 40T instruments (Gurlap, 2008). This longer seismic
response afforded by the 3T seismometers is useful for studying long period volcanic tremor.
All of the seismometers were powered by solar panels and car batteries. The data recorder for
each seismometer was a RefTech 130.
4.3 DATA PROCESSING
We do a radar interferometry analysis to determine the amount of inflation and (or)
deflation, and the spatial pattern of the volcanic deformation at San Miguel. We also process the
raw seismic data from the temporary network using a combination of the Antelope Boulder
Realtime technologies (BRTT), EvLOC, and HypoDD software packages. The seismic
processing is done to yield precise relative earthquake locations.
4.3.1 INSAR DATA PROCESSING
We applied a two-pass differential interferometry technique (Zebker et al., 1994) to 7
ALOS radar images of San Miguel volcano acquired between February 2007 and January 2008.
Processing was done using the Gamma Remote Sensing Interferometry package. Topographic
phase contributions were removed using the 30-m resolution Shuttle Radar Topography Mission
(SRTM) DEM. This analysis gives us a final set of four interferograms (Figure 4.3) spanning the
time between February 2007 and January 2008. The two interferograms for the periods
03/03/2007-10/19/2007 and 10/19/2007-01/19/2008 are from an ascending satellite track. The
other two interferograms, for the periods 02/27/2007-10/15/2007 and 10/15/2007-01/15/2008,
are from a descending satellite track.

82
By combining the interferograms from the ascending and descending tracks, a vertical
and horizontal deformation velocity can be calculated (Manzo et al., 2006). Manzo et al. (2006)
define the vertical (
€
Δz ) and east-west (
€
Δe) displacements for a volcanic area as:
€
Δz =ΔlD + ΔlA( ) 2cos θ( )
(4.1),
€
Δe =ΔlD −ΔlA( ) 2sin θ( )
(4.2),
where
€
Δla is the line of sight (LOS) deformation for the ascending interferogram,
€
Δlb is LOS
deformation for the descending interferogram, and
€
θ is the average look angle (34° for ALOS in
the center of the image). Since the San Miguel volcano is not located in the center of any of our
SAR images, we must modify equations 4.1 and 4.2 to account for both range-direction variation
in
€
θ and for differences in the position of the volcano in our ascending and descending track
images. The new equations are:
€
Δz =
ΔlDcos θD( )
+ΔlA
cos θA( )
2 (4.3),
€
Δe =
ΔlDsin θD( )
−ΔlA
sin θA( )
2 (4.4).
For the ascending images, the appropriate value for
€
θA is 33.8°. The descending images (
€
θB ) had
a value of 35°.
4.3.2 EARTHQUAKE LOCATIONS
The purpose of the seismic processing is to resolve relative earthquake locations from the
collected raw seismic data. The raw seismic data was first processed using Antelope (BRITT)

83
software to achieve automated first arrival detentions and events. These events are then
relocated using a modified version of HypoDD (Ammon, 2008). The resulting earthquake
locations are then classified into 4 groups to aid in finding regions of tectonic or volcanic
deformation.
4.3.2.1 Automated Detection
We use a short-term average window (STA) to long-term average window (LTA)
automated detector to pick first arrivals on the continuous data using the Antelope (BRTT)
software (Velasco et al., 2007). For a detection to be made, the ratio between the STA and LTA
must be greater than an empirically set signal to noise ratio (SNR). We adjusted the 5 sec STA
and 10 sec LTA time windows to optimize the process of identifying both impulsive volcano-
tectonic events and emergent tremors. For both types of detections, a SNR value of 3.0 was
used. A 5- and 10-Hz filter was used on the data to remove regional seismic noise from the
nearby subduction zone, thus focusing the detections on local events. The 5-Hz filter detected
first arrivals of both volcano-tectonic and volcanic-tremor (Figure 4.5a). The 10-Hz filter aided
in detecting first arrivals from overlapping VT and LP events (Figure 4.5b).
Once the detections were made, the detections were associated to events on a grid of
hypothetical locations (Velasco et al., 2007). The detected P-wave must be observed in
seismograms from at least four stations in order to be associated with an event. Once an
association is determined and an event is recorded, we locate the hypothetical events to relative
geographic locations using EvLoc (Bratt and Bache, 1987). We obtained 600 preliminary
earthquake epicenters from this analysis. Of these 57 were used because they were the only ones
within the deployment area.

84
4.3.2.2 Relative Earthquake Locations
To refine our epicentral locations, we use a modified version of the double-difference
approach (HypoDD; Waldhauser and Ellsworth, 2000) that allows for constraints and weights on
seed depths to control the amount of movement in the depth estimates for the singular value
decomposition (SVD) approach (Ammon, 2008). The constraint parameter ranges between 0
and 10, with 0 indicating a tightly constrained depth and 10 an unconstrained depth. The weight
parameter ranges between 0 and 10, with 10 indicating the highest possible weight given to a
particular location in the model. Constraining and weighting the seed depths is performed
because we do not have sufficient depth control to calculate an absolute depth for each
earthquake location due to station aperture and the small number of stations in the temporary
network.
We tested the sensitivity of this modified HypoDD approach to obtain relative earthquake
locations by running a series of tests using different seed depths (1 km, 1.5 km, 1.75 km, 2 km,
2.25 km, 2.5 km, 3 km, 4 km) and varying weights and constraints. This range of seed depths
was chosen because SNET’s continuous monitoring indicates the source of volcanic deformation
lies within this depth range (Escobar, 2007). The constraints used ranged from 0 to 5 and the
complementing weights were between 5 and 10. A constraint of 5 and weight of 5 allowed
depths to vary within a ±2.5 km range, whereas a constraint of 0 and weight of 10 restricted
variation in depth to a range of ±0.5 km. We found that a seed depth of 1.75 km with a
constraint of 2 and weight of 7 gave the best relative earthquake locations. Figure 4.5 shows the
resulting relative earthquake epicenters plotted with the historic earthquake locations from
SNET. The relative earthquake location results display a cluster of 57 earthquakes located along
the SMFZ (Figures 4.1 and 4.5).

85
4.3.2.3 Earthquake Location Classification
Spectrograms for each earthquake were calculated and used to classify them by earthquake
type. We found four distinct types of earthquakes in our dataset. The first, Type 1 or
“Tectonic”, is an event characterized by high frequencies (>15 Hz) and no background volcanic
tremor (Figure 4.6a). We classified 9 events in this type. The second type, Type 2 or “Tectonic
with Background Volcanic Tremor”, is an event similar to the first with the addition of volcanic
tremor as a background signal (Figure 4.6b). There are 16 events in this category. The third,
Type 3 or “Tectonic with a Precursory event and Background Volcanic Tremor”, is a tectonic
event with both volcanic tremor and a volcanic tremor precursory event leading into the high-
frequency, tectonic event (Figure 4.6c). There are 6 events of this type in the dataset. The last
category is “Volcanic Tremor” (Type 4) (Figure 4.6d). The majority of the events in the catalog
are of Type 4, with a total of 26 events. The spatial distribution of the classified events is shown
in Figure 4.7.
4.4 RESULTS
4.4.1 INSAR RESULTS
Figure 4.4 shows the resulting vertical and east-west components of the deformation
field. We find deformation to be occurring within the top portion of the cone. Figure 4.4a
depicts a maximum of 6 ± 0.1 cm of inflation before mid-October 2007. Following mid-October
2007, a maximum of 4 ± 0.1 cm of deflation occurs until mid- January 2008 (Figure 4.4c). Both
inflation and deflation are localized to the upper part of the cone and define a broad area that
spans the top of San Miguel from southwest to northeast.

86
Profiles taken from west to east across the vertical and east-west deformation maps for
San Miguel volcano indicate that the greatest amount of inflation and deflation occurred in the
vicinity of the summit crater (Figure 4.8). Interestingly, the vertical profile showing deflation is
the inverse of that showing inflation (Figure 4.8). This inverse relationship suggests that
inflation and deflation arise from the same mechanism.
4.4.2 EARTHQUAKE LOCATION RESULTS
From our earthquake locations and the historic SNET data (Figure 4.7) show that the
earthquake locations occurred along linear trend closely aligned with the SMFZ (Figure 4.1) and
not in a circular cluster. The locations that are scattered to the west of SMFZ can be attributed to
magma and (or) gas movement from the SMFZ into the volcano’s southern slope (Figure 4.7).
In cross-section, the earthquake hypocenters define a ~6 km long, ~2 km diameter, and ~2 km
think seismic zone that strikes 348° with a near-vertical dip (Figure 4.7). This zone spans depths
from the near-surface to approximately 3 km (Figure 4.7d). Seismic activity of the northern end
of the zone consists of all four event types, and, interestingly, the northern end is the only place
where Type 3 occurs (Figure 4.7b). At southern end of the seismic zone activity includes Types
1, 2, and 4 (Figure 4.7c). Also present in the southern end of the seismic zone is a spherical
group of Type 2 and 4 events.
4.5 DISCUSSION
To examine the relationship between the earthquake locations and surface deformation,
forward modeling of the inflation that occurred before mid-October 2007 and the deflation that
occurred after mid-October 2007 was preformed. We use the results of the seismic analysis to

87
build the sub-surface geometry of the SMFZ. In cross-section, the seismogenic zone defined by
the earthquake hypocenters has a prolate spheroid geometry (Figure 4.7). We use this as a
deformation source in our model. In addition to this prolate spheroid source (Yang et al., 1988),
Figure 4.7c shows evidence of a spherical, 1-km diameter, Mogi-type (Mogi, 1956) source in the
southwestern slope.
For the modeling process, we used a MATLAB program called the Synthetic
Interferogram Calculator (SIC) (Fialko, 2008). Given a subsurface deformation source, SIC will
compute a predicted surface deformation field. In addition to the prolate spheroid source (Yang
et al., 1988) we use for San Miguel, SIC can forward model a Mogi-type point source (Mogi,
1958), an Okada rectangular dislocation (Okada, 1985, 1992), or a penny-shaped crack (Fialko et
al., 2001a). The geometry of the prolate spheroid source – including the dimensions of the
major, and minor axes; the strike and dip of major axis; and the depth – were obtained from the
earthquake locations. Parameters including the satellite look angle, satellite azimuth, and SAR
radar wavelength were obtained from the interferogram parameters files. The shear modulus and
Poisson’s ratio used in the model are typical values for volcanic areas (Fialko et al., 2001a;
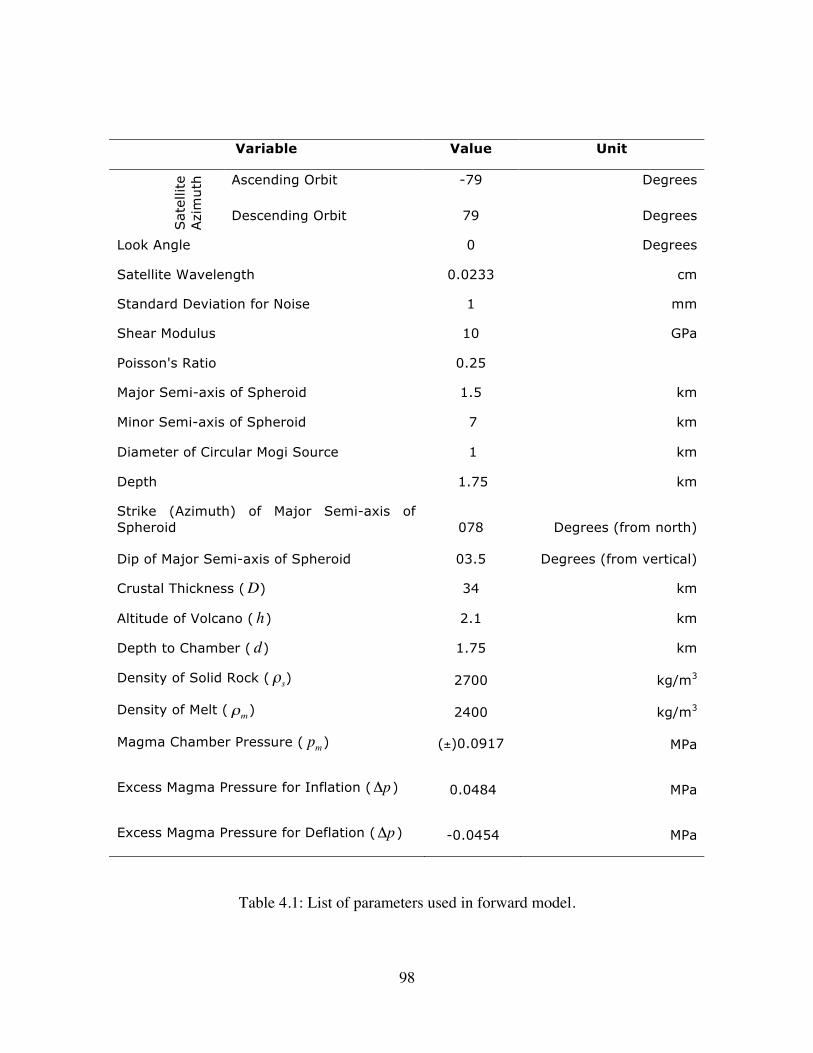
Fialko et al., 2001b; Gottsmann et al., 2006). A complete list of model parameters is given in
Table 4.1.
A critical parameter in Table 4.1 is the excess magma pressure (
€
Δp), which was
calculated using a technique given by Yun et al. (2006):
(4.5),
(4.6),
where
€
pm is the magma chamber pressure calculated using equation 4.6,
€
ρs is the density of the
surrounding solid rock,
€
ρm is the melt density,
€
g is gravity, is the magma chamber depth,
!
"p = pm # $sgd
!
pm = "sgD# "mg(h + D# d)
!
d
!
h

88
is the summit elevation of the volcano above sea level, and is the crustal thickness. Using the
values in Table 4.1 and making the assumption that the magma chamber lies 1.75 km below the
surface results in an excess magma pressure is 0.0484 MPa for inflation model and -0.0454 MPa
for the deflation model.
Since the crustal thickness under San Miguel volcano is not well constrained, we
calculated the excess magma pressure for a range of crustal thicknesses (32-40 km) to arrive at
the value above. These crustal thicknesses were used because the crustal thickness is 40 km to
the west in Guatemala and 32 km to the east in Nicaragua (Carr, 1984). We iteratively ran the
forward model for each calculated excess magma pressure and corresponding crustal thickness.
We stopped the iteration when the resulting synthetic deformation map gave us the same
magnitude of surface deformation in the observed vertical deformation maps, and we used the
corresponding excess magma pressure in our subsequent modeling.
We then began to test how much surface deformation is derived from using one prolate-
spheroidal magmatic source vs. two magmatic sources, a prolate spheroid with a circular Mogi
source. From this test, we find that the model-derived deformation is not changed with
introduction or exclusion of the circular Mogi source. Thus the Mogi source deformation is
insignificant compared to that due to the prolate spheroid source, and, for this reason, we decide
to exclude it from the model.
The output of the forward model is a synthetic vertical interferogram (Figure 4.9). The
output interferograms are visually compared with the calculated vertical deformation map. Since
most of the deformation we are concerned with is in the vertical direction, the east-west
deformation maps are not used in the comparison. At first glance, the synthetic interferograms
and the calculated vertical deformation maps (Figure 4.4a,c) do not appear to be comparable.
!
D

89
However certain features of each are comparable. First, observe that moderate deformation
occurs along the profile lines in the synthetic interferograms above the center of the model space,
which is also the center of the prolate spheroidal source (Figure 4.8a-b). Note also that the
synthetic interferogram has two high deformation discontinuities located in the top and bottom
center parts of the images (Figure 4.8a-b). In comparison, the observed deformation maps show
a similarly moderate amount of deformation around the summit crater (Figure 4.4a,c), which is
directly above the center of the prolate spheriodal seismogenic zone (Figure 4.7). In addition,
the observed deformation maps also show two high deformation discontinuities located to the
north and south of the summit zone in positions relative to ends of the SMFZ (and northern and
southern extents of the prolate spheroidal source) (Figure 4.4a,c; Figure 4.7) comparable to the
geometry seen in the synthetic deformation map.
The synthetic deformation profiles (Figure 4.8c-d) display a step function at the center of
the profile lines. Depending on the type of deformation, inflation or deflation, being modeled,
the profile either steps up (inflation; Figure 4.9c) or steps down (deflation; Figure 4.9d). This
step corresponds to the modeled position of the SMFZ, which is directly above the prolate
spheroid source. The observed deformation profiles in Figure 4.8 display a similar magnitude
step at the location of the SMFZ. Where the synthetic profiles cross the source in Figure 4.9c,d,
a 2 cm step exists. This is comparable the ~2-3 cm step in the observed vertical profiles (Figure
4.8).
It is also notable in the model results, that inflation profile and deflation profile are anti-
symmetric and of equal magnitude. This arises from the fact that in our model deflation arises
from complete release of the overpressure introduced during inflation. However, the observed
vertical deformation profiles, while anti-symmetric are not of equal magnitude. There is an

90
observed 3 cm of inflation prior to mid-October 2007 followed by 2 cm of deflation. If the
amount of inflation is indicative of the amount of overpressure accumulated until mid-October
2007 (0.0484 MPa), these results suggest that the deflationary event did not fully relax the
overpressure. There remains 0.003 MPa of overpressure within the SMFZ.
The rates of inflation and deflation can be simply calculated from Figure 4.4 by dividing
the maximum amount of vertical deformation by the amount of time spanned by the
interferograms used to make the deformation map. We find that the rate of inflation is half the
rate of deflation. The inflation rate is 0.26 mm/day assuming inflation was constant during the
period of observation. The deflation rate is 0.43 mm/day with the same assumption. This
suggests that the processes for inflation are gradual where as those responsible for deflation is
more rapid.
The temporal record of the seismic events during the temporary deployment reflects the
time scale for the seismic events causing inflation (Figure 4.10). Type 1 events are indicative of
breaking rock possibly from the releasing of gas or overpressure from fluid (e.g. water or
magma) movement (Cramer and McNutt, 1997), where as Type 4 events are indicative of fluid
movement (Cramer and McNutt, 1997). Types 2 and 3 are hybrid events with the difference
being a precursor event present in Type 3. This precursory event could be indicative of fluid
movement (Cramer and McNutt, 1997). Type 4 activity occurs throughout the deployment. The
only time Type 4 do not account for the majority is October 2007, which is a period of overall
heightened seismicity and the transition from inflation to deflation at San Miguel. Just before
the transition, a few very long-period Type 4 events occurred, equivalent to a RSAM >400 units
(Escobar, 2007). Following this event, many small rockslides occurred within the summit crater.
In fact, these slides were still occurring when we picked up the instruments at the end of January

91
2008. The spike in seismic activity is mainly Type 1 and Type 2 events, which are events that do
not occur together any other time except May 2007, during another spike in seismic activity.
During the heightened May 2007 period, the fumaroles in San Miguel’s summit crater increased
in activity.
Based on the earthquake hypocenters and event Types occurring at that location, we
believe that magma and (or) gases are upwelling in the northern part of the seismic zone near the
summit crater where the Type 3 events occur. We believe the upwelling occurs in this location
due to the large amount Types 2, 3, and 4 events occurring in this region. We believe inflation at
San Miguel volcano is due to this upwelling of gas charged magma. This happens throughout
the time span prior to the climatic mid-October transition to deflation. We think the deflationary
process is due to the release of pressurized gas partially to the atmosphere through the fumaroles.
This is associated with Types 1 and 2 events such as those seen in October 2007. There is an
additional small degassing episode in May that similarly results in Types 1 and 2 events with
increased fumarolic emission of gas (Escobar, 2007). We therefore suggest that a small amount
of deflation, below the resolution of our InSAR results, could have occurred in May 2007.
In addition to the release of gases through fumaroles at the summit crater, gas and magma
could be diverted along the small fractured zone to the broadly spherical cluster of tremor events
beneath the southwest flank of the volcano (Figure 4.7). Type 2 and 4 events happen in the
pathway between the summit and this feature. This could be indicative of migration of magma to
the spherical feature, which may be a storage reservoir for the diverted material. Although not
seen in our InSAR results, at other times this could be a significant mechanism of surface
inflation and (or) deflation. Alternatively, this reservoir has the potential to become a flank vent
for lava flows.

92
4.6 CONCLUSIONS
Integrating the seismic and InSAR data explains geometries and processes driving the
volcanism at San Miguel volcano. Our forward model using the seismic data yields results
comparable to the observed deformation pattern found in the interferometry. Thus the surface
deformation is the result of the same processes that produce the seismic activity. In addition
these process that drive volcanism at San Miguel are localized along and within the SMFZ.
Among the processes is inflation due to upwelling/intrusion of gas-charged magmas. The
observed surface deformation at San Miguel is a direct result of volcanic material upwelling
within the SMFZ. Another important process is deflation due to release of gas pressure, either
through fumaroles and subsurface migration through fractures. In addition, magma may be
pooling beneath the southwest flank of San Miguel volcano. Although not important in the
observed surface deformation field, this may contribute to hazards along the southwestern slope
of San Miguel. From the earthquake locations (Figure 4.7) we find that most of the scattered
earthquakes west of the SMFZ occur within the southwestern slope, thus, forming a secondary
fractured zone. These fractures make this slope structurally weaker, so we consider this
southwestern slope to have the greatest volcano hazard when compared to the rest of the
volcano’s perimeter. The types of volcanic hazards we would expect are lava flows, landslides,
or both. Landslides could occur if the fractured areas in the southwestern slope become
lubricated with water from heavy monsoonal rains. A lava flow could occur if the reservoir we
infer beneath the southwestern flank is filled with magma that vents out through the small
fractures. Both could occur, along with increased surface deflation, during future explosive.

93
4.7 ACKNOWLEDGEMENTS
We would like to thank Bridget Konter and Yuri Fialko for their forward modeling
expertise. We would also like to acknowledge Bill Rose and Craig Chesner contributions, for
their help coordinating this project in El Salvador. Galen Kaip, and SNET for there help
deploying the instruments. We need to thank the gracious people of the Cuidad de San Miguel
for taking care of instruments and us. This research was funded by NASA Earth System Science
Fellowship number NNX06AF78H.

94
4.8 REFERENCES
Agostini, S., Corti, G., Doglioni, C., Carminati, E., Innocenti, F., Tonarini, S., Manetti, P., Di
Vincenzo, G., Montanari, D., 2006, Tectonic and magmatic evolution of the active
volcanic front in El Salvador: insight into the Berlin and Ahuachapan geothermal areas.
Geothermics, vol. 35, p. 368 – 408.
ALOS, 2008, http://www.eorc.jaxa.jp/ALOS/.
Ammon, C., 2008, personal commication (electronic) to Aaron Velasco.
Bratt, S.R., and Bache, T.C., 1988, Locating Events With a Sparse Network of Regional Arrays
Bulletin of the Seismological Society of America, vol. 78, p. 780-798.
Burgmann, R., Rosen, P.A., and Fielding, E.J., 2000, Synthetic Aperture Radar Interferometry to
Measure Earth's Surface Topography and Its Deformation: Annual Reviews of Earth and
Planetary Sciences, vol. 28, p. 169-209.
Carr, M.J., 1984, Symmetrical and segmented variation of physical and geochemical
characteristics of the Central American volcanic front. Journal of Volcanology and
Geothermal Research, vol. 20, p. 231–252.
Cramer, C.H., and McNutt S.R., 1997, Spectral analysis of earthquakes in the 1989 Mammoth
Mountain Swarm near Long Valley, California. Bulletin of the Seismological Society of
America, vol. 87, no. 6, p. 1454-1462.
Chesner, C.A., Pullinger, C., Escobar, C.D., 2004, Physical and chemical evolution of San
Miguel Volcano, El Salvador. Geological Society of America Special Paper, vol. 375, p.
213-236.
Corti, G., Carminati, E., Mazzarini, F., Garcia, M.O., 2005, Active strike-slip faulting in El
Salvador (Central America). Geology, vol. 33, p. 989–992.

95
DeMets, C., 2001, A new estimate for present-day Cocos-Caribbean plate motion: Implications
for slip along the Central American volcanic arc. Geophysics Research Letters, vol. 28, p.
4043-4046
Endo, E.T., and Murray, T., 1991, Real-time Seismic Amplitude Measurement (RSAM): a
volcano monitoring and prediction tool. Bulletin of Volcanology, vol. 53, p. 533-545.
Escobar, C.D., 2007, personal communication (electronic).
Fernandez, M., Escobar, C.D., and Redondo, C.A., 2004, Seismograph networks and seismic
observation in El Salvador and Central America. Geological Society of America Special
Paper, vol. 375, p. 257 – 167.
Fialko, Y., 2008, personal communication (electronic) to Bridget Konter.
Fialko, Y., Khazan, Y., Simons, M., 2001a, Deformation due to a pressurized horizontal circular
crack in an elastic half-space, with applications to volcano geodesy. Geophysical Journal
International, vol. 146, p. 181–191.
Fialko, Y., Simons, M., Khazan, Y., 2001b. Finite source modeling of magmatic unrest in
Socorro, New Mexico, and Long Valley California. Geophysical Journal International,
vol. 146, p. 191– 200.
Gottsmann, J., Rymer, H., and Berrino, G., 2006, Unrest at the Campi Flegrei caldera (Italy): A
critical evaluation of source parameters from geodetic data inversion. Journal of
Volcanology and Geothermal Research, vol. 150, p. 132– 145.
GVN Bulletin, 2002, Minor gas-and-ash emission in January 2002; Summary of earlier activity.
Bulletin of the Global Volcanology Network, vol. 27, no. 02.
GVN Bulletin, 2006, Restlessness persists during 2005-6; heavy tropical rains trigger lahars.
Bulletin of the Global Volcanology Network, vol. 31, no. 10.
GVN Bulletin, 2007, Background seismicity since October 2006; crater visit in July 2007.
Bulletin of the Global Volcanology Network, vol. 32, no. 09.

96
Lu, Z., Kwoun, O., and Rykhus, R., 2007, Interferometric synthetic aperture radar (InSAR): Its
past, present and future. Photogrammetric Engineering and Remote Sensing, vol. 73, p.
217-221.
Manzo, M., Ricciardi, G.P., Casu, F., Ventura, G., Zeni, G., Borgstrom , S., Berardino, P., Del
Gaudio, C., Lanari, R., 2006, Surface deformation analysis in the Ischia Island (Italy)
based on spaceborne radar interferometry. Journal of Volcanology and Geothermal
Research, vol. 151, p. 399–416.
Massonnet, D., Feigl, K.L., 1995, Discrimination of geophysical phenomena in satellite radar
interferograms. Geophysical Research Letters, vol. 22, no. 12, p. 1537-1540.
Meyer-Abich, H., 1956, Los Volcanes Activos de Guatemala y El Salvador (America Central).
Anales del Servicio Geologico Nacional de El Salvador, vol. 3, p. 49–62.
Mogi, K., 1958, Relations between the eruptions of various volcanoes and the deformations of
the ground surfaces around them. Bulletin Earthquake Research Institute, vol. 36, p. 99-
134.
Okada, Y., 1985, Surface deformation due to shear and tensile faults in a half-space. Bulletin of
the Seismological Society of America, vol. 75, no. 4, p. 1135-1154.
Okada, Y., 1992. Internal deformation due to shear and tensile faults in a half-space. Bulletin of
the Seismological Society of America, vol. 82, no. 2, p. 1018– 1040.
Perez, N.M., Hernandez, P.A., Padron, E., Cartagena, R., Olmos, R., Barahoma, F., Melian, G.,
Salazar, P., and Lopez, D.L., 2006, Anomalous Diffuse CO2 Emission prior to the
January 2002 Short-term Unrest at San Miguel Volcano, El Salvador, Central America.
Pure Applied Geophysics, vol. 163, p. 883-896.
Sandwell, D., Myer, D., Mellors, R., Shimada, M., Brooks, B., and Foster, J., 2007, Accuracy
and Resolution of ALOS Interferometry: Vector Deformation Maps of the Father's Day
Intrusion at Kilauea. IEEE Transactions on Geosciences and Remote Sensing, vol. 2007-
00737.R1, p. 1-12.

97
Velasco, A.A., Gee, V.L., Rowe, C., Grüjic, D., Hollister, L.S., Hernandez, D., Miller, K.C.,
Tobgay, T., Fort, M., and Harder, S., 2007, Using Small Temporary Seismic Networks
for Investigation Tectonic Deformation: Brittle Deformation and Evidence for Strike-Slip
Faulting in Bhutan. Seismological Research Letters, vol. 78, no. 4, p. 446-453.
Wadge, G., Dorta , D.O., Cole, P.D., 2006, The magma budget of Volcán Arenal, Costa Rica
from 1980 to 2004. Journal of Volcanology and Geothermal Research, vol. 157, p. 60-
74.
Waldhause, F., and Ellsworth, W. L., 2000, A double-difference earthquake location algorithm:
method and application to the Northern Hayward fault. Bulletin of the Seismological
Society of America, vol. 90, p. 1353–1368.
Yang, X.-M., Davis, P., Dietrich, J.H., 1988. Deformation from inflation of a dipping finite
prolate spheroid in an elastic halfspace as a model for volcanic stressing. Journal of
Geophysical Research, vol. 93, p. 4249– 4257.
Yun, S., Segall, P., Zebker, H., 2006, Constraints on magma chamber geometry at Sierra Negra
Volcano, Galapagos Islands, based on InSAR observations. Journal of Volcanology and
Geothermal Research, vol. 150, p. 232 – 243.
Zebker, H.A., Rosen, P.A., Goldstein, R.M., Gabriel, A., Werner, C.L., 1994, On the derivation
of coseismic displacement fields using differential radar interferometry: The Landers
earthquake. Journal of Geophysical Research, vol. 99, no. 19, p. 617-19,634.
98
Variable Value Unit
Ascending Orbit -79 Degrees
Sate
llite
Azi
muth
Descending Orbit 79 Degrees
Look Angle 0 Degrees
Satellite Wavelength 0.0233 cm
Standard Deviation for Noise 1 mm
Shear Modulus 10 GPa
Poisson's Ratio 0.25
Major Semi-axis of Spheroid 1.5 km
Minor Semi-axis of Spheroid 7 km
Diameter of Circular Mogi Source 1 km
Depth 1.75 km
Strike (Azimuth) of Major Semi-axis of Spheroid 078 Degrees (from north)
Dip of Major Semi-axis of Spheroid 03.5 Degrees (from vertical)
Crustal Thickness (
€
D) 34 km
Altitude of Volcano (
€
h) 2.1 km
Depth to Chamber (
€
d) 1.75 km
Density of Solid Rock (
€
ρs) 2700 kg/m3
Density of Melt (
€
ρm) 2400 kg/m3
Magma Chamber Pressure (
€
pm) (±)0.0917 MPa
Excess Magma Pressure for Inflation (
€
Δp) 0.0484 MPa
Excess Magma Pressure for Deflation (
€
Δp) -0.0454 MPa
Table 4.1: List of parameters used in forward model.

99
Figure 4.1: Map of San Miguel volcano. Inset shows location of study area in El Salvador. Black dashed line in inset indicates location of ESFZ. Gray shaded area around black dashed line is the Median Trough. Green lines are faults. The fracture marked A is the San Miguel Fracture Zone (SMFZ). Triangles denote seismometers. Circles are locations of the vents the fed historic lava flows with the year of eruption. Squares are small villages. Black polygon in upper right is the city of San Miguel. Red lines are highways.

100
Figure 4.2: Historic seismicity map (Escobar, 2007). Triangles denote the locations of seismometers in the temporary seismic network.

101
Figure 4.3: Interferograms of San Miguel volcano: (a) 03/03/3007-10/19/200719, (b) 02/27/2007-10/15/2007, (c) 10/19/2007-01/19/2008, and (d) 10/15/2007-01/15/2008. Interferograms (a) and (c) are obtained from descending orbits. Interferograms (b) and (d) are obtained from ascending orbits. Interferograms prior to mid-October 2007 show inflation. These interferograms will have positive LOS motion (e.g. towards the satellite) on the color bar. The interferogram after mid-October 2007 show deflation, and have negative motion (e.g. away from the satellite). All interferograms have a noise standard deviation of 1 mm. White lines indicate profiles in Figure 4.10.

102
Figure 4.4: (a) Vertical deformation map calculated from the interferograms in Figure 4.3a-b. (b) Easting deformation map calculated from the interferograms in Figure 4.3a-b. (c) Vertical deformation map calculated from the interferograms in Figure 4.3c-d. (d) Easting deformation map calculated from the interferograms Figure 4.3c-d. Red dashed ellipse marks the outline of the summit crater of San Miguel. White lines indicate profiles in Figure 4.10. White dashed lines show placement of SMFZ. Arrows denote points of comparison with modeled deformation maps.

103
Figure 4.4 continued.

104
Figure 4.5: Earthquake locations from the temporary seismic deployment with historic activity (Escobar, 2007).

105
Figure 4.6: Example seismic events: (a) Tectonic; (b) Tectonic with Volcanic Tremor; (c) Tectonic with a Precursory Event and Volcanic Tremor; (d) Volcanic Tremor. Top panel of each set is the calculated spectrogram. Each spectrogram depicts the frequencies captured at a specific time in the waveform. Bottom panel of each set is the waveform used to calculate the spectrogram.

106
Figure 4.6 continued.

107
Figure 4.7: (a) Classified earthquake locations using the results of the temporary seismic network and SNET (Escobar, 2007) historic data. (b) Cross-section at northern end. (c) Cross-section at southern end. (d) Cross-section along strike of the SMFZ.

108
Figure 4.8: Deformation profiles from the interferograms in Figures 4.3-4.4. (a) Profiles for inflation taken from Figures 4.3(a-b)-4.4(a-b). (b) Profiles for deflation taken from Figures 4.3(c-d)-4.4(c-d).

109
Figure 4.9: Synthetic vertical interferograms calculated from the forward model showing (a) inflation and (b) deflation. Deformation profiles from the synthetic vertical interferograms: (c) inflation and (d) deflation.

110
Figure 4.10: Temporal distribution of the classified earthquakes (not including historic events) shown in Figure 4.7.