DETERMINING THE QUALITY OF PASTEURISED AND … · based prototype model to test overall quality of...
170
DETERMINING THE QUALITY OF PASTEURISED AND HOMOGENISED COW MILK USING MICROWAVE SENSORS KEYUR H JOSHI A thesis submitted in partial fulfilment of the requirements of Liverpool John Moores University for the degree of Doctor of Philosophy AUGUST 2018
Transcript of DETERMINING THE QUALITY OF PASTEURISED AND … · based prototype model to test overall quality of...

DETERMINING THE QUALITY OF PASTEURISED
AND HOMOGENISED COW MILK USING
MICROWAVE SENSORS
KEYUR H JOSHI
A thesis submitted in partial fulfilment of the
requirements of Liverpool John Moores University for
the degree of Doctor of Philosophy
AUGUST 2018

Keyur H. Joshi i
DEDICATION
I would like to dedicate this PhD thesis to my parents, Mrs. Ashadevi Joshi and
Mr. Himanshubhai Joshi, without whose continued motivation, sustained support,
and everlasting belief in me, this passionate dream could not have been a reality.

Keyur H. Joshi ii
ABSTRACT
More than 6 billion people worldwide consume milk and milk products and this
number is rapidly growing every year (FAO, 2015a), there are numerous
occurrences where the milk quality was below acceptable standards causing
severe health hazards among consumers including young children. The aim of
this research work is to design and develop a novel, microwave spectroscopy,
approach for determination of overall quality of milk. In particular, this quality
determination of milk products was achieved by identification of deterioration or
spoilage of milk over time, classification of the milk product based on composition
(e.g. fat content), in addition to the contamination (e.g. adulteration due to
presence of detergents, urea). An extensive literature review was carried out to
establish the scope of the PhD work and in order to achieve the objectives.
Current advancements were studied along with the traditional methods of milk
quality testing to identify the key areas where further development can take place
to enable the quality control of milk products outside the laboratory premises. This
work addresses the drawbacks in currently employed methodologies and
attempts to overcome or minimize their overall limiting effect.
The application of this sensor system is aimed within the milk supply-chain
hierarchy after the production at dairy plants and before sale to allow easy and
real-time quality testing. The dielectric property tests were conducted to produce
unique spectral signatures for three mainly consumed categories of fresh milk;
whole milk, semi-skimmed milk and skimmed milk bought from a supermarket
over a period of a week, which served to build a reference database. Based on
these spectral signatures for the three categories of milk, a planar, microwave
resonator sensor acting as a fluidic sensor was designed, simulated and
fabricated to determine spoilage, classification of milk and identify presence of
contamination. This work has achieved distinct results to verify the statement,
followed by validation, to serve as a platform for the establishment of a laboratory
based prototype model to test overall quality of Milk products, with coefficient of
determination R2 ≥ 0.95 in all experimental measurements.

Keyur H. Joshi iii
ACKNOWLEDGEMENTS
I pay my profound gratefulness to Prof. Ahmed Al-Shamma’a, The Dean, Faculty
of Engineering and Technology, LJMU for giving me an opportunity to undertake
this research work by selecting me as a part of the Radio Frequency and
Microwave (RFM) research group as a PhD Student. I must thank him for sparing
his valuable time from his busy schedule and for offering me partial financial
support to pay towards half of my second year tuition fees to be able to continue
my research program, as a self-funded student.
I express my unbounded sense of obligation and gratitude, to my supervisory
team that includes Director of Studies (DoS) - Prof. Andy Shaw and Dr. Patryk
Kot for their help and support in the overall improvement of this work by their
continuous guidance and review process with constant encouragement through
the completion of my PhD. I would also like to thank Dr. Alex Mason, Animalia
AS, Norway followed by Dr. Olga Korostynska, for sharing their expertise. I
sincerely thank Dr. Yaroslava Zhukova from the Institute of Food Resources,
National Academy of Agrarian Sciences of Ukraine, Kyiv for sharing her valuable
advice on experiments related to urea adulteration in milk.
I extend my sincere acknowledgements to Dr. Jeff Cullen, Dr. Magomed Muradov
Dr. Steve Wylie, Dr. Montse Ortoneda Pedrola and Prof. David Phipps for
providing me with technical assistance to help with the project work within or
outside the laboratory as per required and assistance sought.
Finally yet importantly, I express my absolute gratitude and heartfelt appreciation
towards my parents, family members, friends and colleagues who have been an
integral part of this journey explicitly or implicitly and without whose support the
successful execution of this project would have been impossible.
KEYUR H. JOSHI
(Student ID: 701160)

Keyur H. Joshi iv
TABLE OF CONTENTS
TABLE OF CONTENTS .................................................................................... iv
LIST OF FIGURES .......................................................................................... viii
LIST OF TABLES ............................................................................................. xii
CHAPTER 1 INTRODUCTION ........................................................................... 1
1.1 Milk and Global Dairy Sector ................................................................. 1
1.2 Importance of Milk Processing ............................................................... 6
1.3 Milk Supply Chain and Scope of the Research ...................................... 7
1.4 Milk adulteration and its impact ............................................................ 10
1.5 Motivation, Aim and Objectives ............................................................ 12
1.5.1 Motivation and Need of Project ..................................................... 12
1.5.2 Aim of the Research ...................................................................... 14
1.5.3 Objectives of the Project ............................................................... 14
1.6 Statement of Novelty............................................................................ 15
1.7 Organisation of the Thesis ................................................................... 15
1.8 Summary ............................................................................................. 17
CHAPTER 2 MILK QUALITY CONTROL: CURRENT STATE OF THE ART .. 19
2.1 Background .......................................................................................... 19
2.2 Milk Quality Control Techniques in Industries ...................................... 22
2.2.1 The Organoleptic Test ................................................................... 23
2.2.2 Acidity Test .................................................................................... 24
2.2.3 Clot on Boiling (C.O.B) Test .......................................................... 25
2.2.4 The Alcohol Test ........................................................................... 26
2.2.5 Resazurin Test .............................................................................. 26
2.2.6 Fat and Protein Analysis Methods ................................................. 28
2.2.7 The Lactometer Test ..................................................................... 29
2.2.8 Inhibitor Test ................................................................................. 29
2.2.9 Freezing Point Determination ........................................................ 30
2.3 Milk Spoilage Detection Techniques in Research Domain ................... 31
2.3.1 Lipid based Disposable Sensors ................................................... 31
2.3.2 Gas Sensor Arrays ........................................................................ 32
2.3.3 IR Spectroscopy ............................................................................ 32
2.3.4 Amperometric Method ................................................................... 34
2.3.5 Magneto-elastic Sensors ............................................................... 34

Table of Contents
Keyur H. Joshi v
2.3.6 Photonic Sensors .......................................................................... 35
2.4 Techniques used to Determine Milk Adulteration ................................. 38
2.5 Summary ............................................................................................. 42
CHAPTER 3 EM WAVES AND MICROWAVE WAVE SENSORS ................... 43
3.1 Background .......................................................................................... 43
3.2 Working Principle ................................................................................. 44
3.3 Advantage of Microwave Sensors ....................................................... 45
3.4 The Wave Equations............................................................................ 45
3.5 Existing Microwave Sensors ................................................................ 47
3.5.1 Waveguides .................................................................................. 48
3.5.2 Cavity Resonators ......................................................................... 49
3.5.3 Interdigitated Electrodes (IDEs) .................................................... 51
3.5.4 Planar Resonators ......................................................................... 52
3.5.5 Comparison of Microwave Measurement Methods ....................... 52
3.6 Sensor Design Considerations: For Milk Quality Monitoring ................ 53
3.6.1 Primary Design Considerations ..................................................... 53
3.6.2 Identifying the Frequencies of Interest .......................................... 54
3.7 Summary ............................................................................................. 55
CHAPTER 4 DIELECTRIC PROPERTY OF COW MILK AND SENSOR DESIGN ............................................................................................................ 56
4.1 Dielectric properties of cow milk .......................................................... 56
4.2 Measurement of Dielectric Property of Cow Milk ................................. 57
4.2.1 Sample Preparation ....................................................................... 58
4.2.2 Measurement Conditions .............................................................. 59
4.2.3 Instrumentation and Procedure ..................................................... 60
4.2.4 Result and Discussion ................................................................... 60
4.3 Resistance and Capacitance Analysis of Milk ...................................... 64
4.4 Microwave Sensor Design ................................................................... 67
4.4.1 Microwave Resonator Cavity (Sensor A) ....................................... 67
4.4.2 Inter-Digitated Electrodes (Sensor B) ............................................ 70
4.4.3 Microwave Fluidic Planar Resonator (Sensor C) ........................... 73
4.5 Methodology involving Microwave Sensors ......................................... 76
4.6 Summary ............................................................................................. 77
CHAPTER 5 DETECTING SPOILAGE IN MILK SAMPLES ............................ 79
5.1 Background .......................................................................................... 79
5.2 Methodology and Measurements ......................................................... 80

Table of Contents
Keyur H. Joshi vi
5.2.1 Sample Preparation ....................................................................... 80
5.2.2 Sensor A: Measurement conditions............................................... 81
5.2.3 Sensor B: Measurement conditions............................................... 83
5.3 Results and Discussion........................................................................ 85
5.3.1 Using Sensor A ............................................................................. 85
5.3.2 Using Sensor B ............................................................................. 87
5.3.3 Using Sensor C ............................................................................. 90
5.4 Summary ............................................................................................. 91
CHAPTER 6 CLASSIFYING MILK QUALITY BASED ON CONTENT ............ 93
6.1 Introduction and Background ............................................................... 93
6.2 Methodology and Measurements ......................................................... 93
6.2.1 Sample Preparation ....................................................................... 93
6.2.2 Measurement conditions ............................................................... 95
6.3 Results and Discussion........................................................................ 96
6.3.1 Using Sensor A ............................................................................. 96
6.3.2 Using sensor B .............................................................................. 98
6.3.3 Using Sensor C ............................................................................. 99
6.4 Summary ............................................................................................. 99
CHAPTER 7 DETECTION OF ADULTERATION IN MILK............................. 101
7.1 Background ........................................................................................ 101
7.2 Methodology and Measurements ....................................................... 102
7.2.1 Spectrophotometry (Gold-standard) ............................................ 103
7.2.2 Microwave Spectroscopy ............................................................ 106
7.3 Results and Discussion...................................................................... 108
7.3.1 Using Spectrophotometry (Gold-standard) .................................. 108
7.3.2 Using Proposed Methodology (EM Wave Spectroscopy) ............ 109
7.4 Detection of Detergents Present as Cleaning Agents ........................ 111
7.4.1 Using Sensor A ........................................................................... 112
7.4.2 Using Sensor B ........................................................................... 114
7.4.3 Using Sensor C ........................................................................... 116
7.5 Summary ........................................................................................... 118
CHAPTER 8 COMPARATIVE REVIEW, FINDINGS AND RECOMMENDATIONS .................................................................................. 120
8.1 Review of the Research Project ......................................................... 120
8.2 Findings and Recommendations ....................................................... 123
8.3 Summary ........................................................................................... 127

Table of Contents
Keyur H. Joshi vii
CHAPTER 9 CONCLUSIONS AND FURTHER WORK ................................. 128
9.1 Concluding Remarks.......................................................................... 128
9.2 Further Work ...................................................................................... 131
REFERENCES ............................................................................................... 132
APPENDIX A ABBREVIATIONS AND ACRONYMS ................................... 147
APPENDIX B NOMENCLATURE ................................................................. 149
APPENDIX C COSHH .................................................................................. 151
APPENDIX D PUBLICATIONS .................................................................... 156

Keyur H. Joshi viii
LIST OF FIGURES
Figure 1.1 Global Growth of Milk Production ...................................................... 2
Figure 1.2 The complexity of milk composition ................................................... 3
Figure 1.3 The global growth of Milk Production around the world ..................... 4
Figure 1.4 The top 10 milk producing countries contributing to 62% of the global
Milk Production ................................................................................................... 4
Figure 1.5 The Cow milk shares 83% of total Milk Produce of the world ............ 5
Figure 1.6 The scope of the proposed research in milk supply chain ................. 8
Figure 1.7 A dairy farmer handling milk (representative image) .......................... 9
Figure 1.8 Aim of the project to determine the Quality of Processed and
Packaged Cow Milk .......................................................................................... 14
Figure 2.1 Basic flow-chart of Milk Production and Processing ........................ 20
Figure 2.2 Organoleptic Analysis (the visual inspection of a compound) .......... 23
Figure 2.3 Milk titratable Acidity Testing apparatus ........................................... 24
Figure 2.4 Milk sample clotted at the end of Boiling Test (Indication of acidic
milk) .................................................................................................................. 25
Figure 2.5 Resazurin Test setup for Milk as filed in patent by Norman Golding 27
Figure 2.6 Hydrometer used in lactometer test to measure density of milk
sample .............................................................................................................. 29
Figure 2.7 Apparatus required for Milk Inhibitor Test ........................................ 30
Figure 2.8 Disposable Taste Sensor System (Schematic) ................................ 31
Figure 2.9 Optical layout of a typical Fourier Transform Infrared Spectrometer 33
Figure 2.10 Optical Sensor configuration for Microlitre Analysis of Milk ............ 35
Figure 3.1 Full EM Wave Spectrum with wavelengths and frequencies ........... 43
Figure 3.2 Experimental setup for Microwave Sensing explaining its Working
Principle ............................................................................................................ 44
Figure 3.3 Range of frequencies for Microwave Applications ........................... 48
Figure 3.4 A small Rectangular Waveguide ..................................................... 49
Figure 3.5 Modes in microwave cavity: (A) All modes are potential operating
modes; (B) Operating mode is the one that matches the excitation frequency . 50
Figure 3.6 A microwave resonator cavity testing milk sample ........................... 50
Figure 3.7 An IDE Sensor with 9x9 interdigitated electrodes fitted with well ..... 51
Figure 3.8 A 2-port Microstrip Planar Resonator Sensor .................................. 52

List of Figures
Keyur H. Joshi ix
Figure 4.1 (a) Dielectric Property Measurement DAK Kit, (b) Dielectric
Permittivity values for Skimmed, Semi-skimmed and Whole Milk Samples ...... 60
Figure 4.2 Dielectric Permittivity vs. Frequency values for three Cow Milk types
.......................................................................................................................... 61
Figure 4.3 Dielectric Permittivity vs. Frequency values for Skimmed milk
samples Day-1 to Day-8 ................................................................................... 62
Figure 4.4 Dielectric Permittivity vs. Frequency values for Semi-skimmed milk
samples Day-1 to Day-8 ................................................................................... 62
Figure 4.5 Dielectric Permittivity vs. Frequency values for Whole milk samples
Day-1 to Day-8 .................................................................................................. 63
Figure 4.6 HAMEG instruments LCR bridge circuit setup ................................. 64
Figure 4.7 The probe inserted in the milk sample for LCR Analysis .................. 64
Figure 4.8 Resistance vs. Frequency values for Skimmed Milk (Day-1 to 5) .... 65
Figure 4.9 Resistance vs. Frequency Values for Semi-skimmed Milk (Day-1 to
5) ....................................................................................................................... 65
Figure 4.10 Resistance vs. Frequency values for Whole Milk (Day-1 to 5) ....... 66
Figure 4.11 Resistance vs. Frequency for all three milk types (Day-1) ............. 66
Figure 4.12 Capacitance vs. Frequency Values for all three Milk Types (Day-1)
.......................................................................................................................... 67
Figure 4.13 HFSS Simulation Model for 2-port Microwave Resonator Cavity
Sensor .............................................................................................................. 68
Figure 4.14 HFSS simulation: S21 vs. Frequency plot for the microwave cavity
sensor ............................................................................................................... 69
Figure 4.15 S21 vs. Frequency plot for the fabricated microwave Cavity Sensor
.......................................................................................................................... 69
Figure 4.16 HFSS Simulation Model for 1-port Microwave IDE Sensor ............ 71
Figure 4.17 HFSS Model Simulation S11 vs. Frequency Plot for the IDE Sensor
.......................................................................................................................... 72
Figure 4.18 S11 vs. Frequency Plot for the Fabricated Sensor B ...................... 72
Figure 4.19 HFSS Simulation of Fluidic Sensor (Hairpin Resonator) ................ 73
Figure 4.20 Simulation Results of Hairpin Resonator Sensor ........................... 74
Figure 4.21 S21 vs. Frequency plot for the fabricated planar Hairpin Resonator
Sensor .............................................................................................................. 75

List of Figures
Keyur H. Joshi x
Figure 4.22 The Screen Printing EAGLE Board Layout of Hairpin Resonator (all
dimensions in mm) ............................................................................................ 75
Figure 4.23 The Fabricated Planar Hairpin Resonator Fluidic Sensor .............. 76
Figure 4.24 Experimental set-up for milk quality analysis using fluidic sensor .. 77
Figure 5.1 Sample preparation: milk spoilage detection using EM wave sensors
.......................................................................................................................... 81
Figure 5.2 Spoilage detection using EM wave cavity sensor ............................ 82
Figure 5.3 Spoilage detection of milk: (a) Measurement setup, (b) Sensor B .. 83
Figure 5.4 Milk samples being agitated with vertex mixer ................................. 85
Figure 5.5 S21 for Day-1(Red) and Day-7(Grey) Skimmed milk using Cavity
Sensor .............................................................................................................. 86
Figure 5.6 S21 for Day-1(Green) and Day-7(Grey) Semi-skimmed milk using ... 86
Figure 5.7 S21 for Day-1(Blue) and Day-7(Grey) whole milk using cavity sensor
.......................................................................................................................... 87
Figure 5.8 S11 for Day-1(Red) and Day-7(Grey) skimmed milk using IDE sensor
.......................................................................................................................... 88
Figure 5.9 S11 for Day-1(Green) and Day-7(Grey) semi-skimmed milk using
Sensor B ........................................................................................................... 88
Figure 5.10 S11 for Day-1(Blue) and Day-7(Grey) whole milk using IDE sensor
.......................................................................................................................... 89
Figure 5.11 S21 vs. Frequency Day-1 to Day-5 for Skimmed Milk ..................... 90
Figure 5.12 S21 vs. Frequency Day-1 to Day-5 for Semi-skimmed Milk ............ 90
Figure 5.13 S21 vs. Frequency Day-1 to Day-5 for Whole Milk .......................... 91
Figure 6.1 Sample preparation for milk quality measurement based on its
contents ............................................................................................................ 95
Figure 6.2 S21 vs. fat content graph using EM wave cavity sensor, at f =
5.45986 GHz ..................................................................................................... 97
Figure 6.3 S21 vs. protein content graph using EM wave cavity sensor, at f =
4.98968 GHz ..................................................................................................... 97
Figure 6.4 S11 vs. frequency graph using IDE sensor for: (a) three types of milk
(b) three milk types and deionised water .......................................................... 98
Figure 6.5 S21 vs. Frequency plot with hairpin resonator fluidic sensor Day-1 .. 99
Figure 7.1 8-milk samples in the centrifuge grouped in two sets of equal masses
........................................................................................................................ 105

List of Figures
Keyur H. Joshi xi
Figure 7.2 Milk samples with precipitated protein after centrifugation ............. 105
Figure 7.3 Filtration of precipitated protein from milk samples ........................ 106
Figure 7.4 Samples added with colour reagent for spectrophotometry ........... 106
Figure 7.5 Experimental setup of determining urea detection in milk using .... 107
Figure 7.6 The coated planar resonator sensor with tube carrying fluid sample
........................................................................................................................ 107
Figure 7.7 Skimmed milk samples spiked with urea as detected in
spectrophotometer .......................................................................................... 108
Figure 7.8 S21 vs. frequency plot for all spiked milk samples with urea between
........................................................................................................................ 109
Figure 7.9 Precipitated milk samples spiked with urea adulteration, graded at
........................................................................................................................ 110
Figure 7.10 Urea spiked milk samples directly measured with hairpin resonator
sensor ............................................................................................................. 111
Figure 7.11 S21 Plot centred at 1.5 GHz for Acid Descaler 8-fold samples. .... 112
Figure 7.12 S21 Plot centred at 2.8 GHz for Acid Descaler 8-fold samples. .... 113
Figure 7.13 S21 Plot centred at 1.5 GHz for Liquid Gold 8-fold samples. ........ 113
Figure 7.14 S21 Plot centred at 2.8 GHz for Liquid Gold 8-fold samples. ........ 114
Figure 7.15 S11 vs. Frequency Acid Descaler 8-fold samples ......................... 115
Figure 7.16 S11 vs. Frequency Liquid Gold 8-fold samples ............................. 115
Figure 7.17 S21 vs. Frequency Acid Descaler 8-fold samples ......................... 116
Figure 7.18 S21 vs. Concentrations for AD at around 986MHz frequency ....... 117
Figure 7.19 S21 vs. Frequency Liquid Gold 8-fold samples ............................. 117
Figure 7.20 S21 vs. Concentrations for LG at around 10.5 MHz frequency ..... 118
Figure 8.1 Flow-chart of Milk Processing with retrofitted ................................. 121
Figure 8.2 Microwave sensors used in this research: (a) Sensor A, (b) Sensor
B, and (c) Sensor C ........................................................................................ 122
Figure 8.3 Graph of S21 vs. frequencies for Skimmed, Semi-skimmed and
Whole milk using Sensor A under Simulation and Real-life ............................ 123
Figure 8.4 Graph of S21 vs. frequencies for Skimmed, Semi-skimmed and
Whole milk using Sensor B under Simulation and Real-life ............................ 124
Figure 8.5 Graph of S21 vs. frequencies for Skimmed, Semi-skimmed and
Whole milk using Sensor C under Simulation and Real-life ............................ 125
Keyur H. Joshi xii
LIST OF TABLES
Table 1.1 Milk composition for different mammal species .................................. 1
Table 2.1 Comparison of Current State of the Art with Proposed Technique .... 37
Table 2.2 Milk Quality Testing Techniques with their Attributes and Applications
.......................................................................................................................... 41
Table 3.1 A simple comparison for microwave measurement techniques ...... 52
Table 4.1 General Classification of Materials based on Permittivity ................. 58
Table 4.2 Milk compositional values for each milk type under test ................... 59
Table 4.3 Measurement conditions for Dielectric Property test of Cow Milk types
.......................................................................................................................... 59
Table 5.1 The nutritional components of the three milk types under test .......... 80
Table 5.2 Measurement specifications for resonator cavity (sensor A): Spoilage
Detection ........................................................................................................... 82
Table 5.3 Measurement specifications for sensor B: Spoilage Detection ........ 84
Table 6.1 Two new milk categories derived by mixing milk types in ascending
order of their fat contents for sensor A measurements ..................................... 94
Table 6.2 Measurement specifications for resonator cavity (sensor A): Based on
contents ............................................................................................................ 96
Table 7.1 Milk samples spiked with 8-fold urea concentration ........................ 102
Table 7.2 Calculation of masses to determine dilution factors in spiked milk . 104
Table 7.3 Measurement Conditions for Detection of Detergent Presence in Milk
........................................................................................................................ 111
Table 7.4 8-fold samples of Acid Descaler and Liquid Gold ........................... 112
Table 8.1 The three microwave sensor types ................................................. 126

Keyur H. Joshi 1
CHAPTER 1
INTRODUCTION
This chapter presents the foundation of this research, introducing the
fundamental concepts and global trends with respect to milk products and their
quality detection and control, giving a general idea of the problem and hence
emphasizing the need for this project. Furthermore, the aim and objectives of the
research are laid out in this chapter following a discussion based on facts and
figures in the dairy sector around the world, the challenges involved and a brief
idea of drawbacks in current techniques, with further critical analysis being made
in Chapter 2 of the thesis.
1.1 Milk and Global Dairy Sector
Milk and dairy products play an important part not only in the diets we follow daily,
but also in the overall economy of many developing as well as developed nations.
Milk is a single food source of good quality nutrients like proteins, carbohydrates,
fat, minerals and vitamins in a significant amount compared to any other single
food (Afzal et al., 2011). Milk and dairy products are nutritiously rich foods due to
having the essential nutrients in appropriate amounts. Besides being a source of
a balanced diet, detailed analyses have shown that there are unique and very
complex structures present in milk structure that contribute towards various
health-promoting functions (Cifelli, German and O’Donnell, 2011).
Table 1.1 Milk composition for different mammal species
Milk From Mammals
Fat Content (Lipids)
%
Protein Content
%
Carbohydrate (Lactose)
%
Ash Content
%
Total Milk Solids
%
Human 3.8 1.0 7.0 0.2 12.2
Cow 3.7 3.4 4.8 0.7 12.7
Buffalo 7.4 3.8 4.8 0.8 16.8
Goat 4.8 2.9 4.1 0.8 12.3
Sheep 7.4 4.5 4.8 1.0 19.3
Camel 5.4 3.8 5.2 0.7 15.0

Chapter 1 • Introduction
Keyur H. Joshi 2
Table 1.1 highlights some of the main components in selected mammal species
as discussed by Fox, (2011b). The dairy sector is the fastest growing industry,
specifically in Asian, Latin American and Caribbean parts of the globe with the
increasing consumption of milk products in recent decades (Gerosa and Skoet,
2013). The use of milk products is regularly growing around the world pertaining
to several factors, like, improving nutritional awareness, changing dietary
patterns, increasing incomes and population as well as urbanisation and overall
development in the economies (Ministry of Agriculture - Republic of Kenya, 2011),
whereas the developed nations already had a higher consumption of milk
products per capita (FAO, 2015a). The increasing intake of dairy products
provides vital health benefits to a large population of the world, except the fact
that millions of people in developing nations still cannot afford this better quality
diet which is expensive due to the inherently high costs of milk production or its
subsequent stage of milk processing (Kenny, 2013).
More than 6 billion people worldwide consume milk and milk products, most of
which belong to the developing nations of the world, and this number is rapidly
growing (FAO, 2015a). This growth can be further seen from Figure 1.1, which
highlights the fact that the global milk production has drastically increased by
54%, which is, from 482 million tons in 1982 to 801 million tons in 2015. This
growth in 33 years, is projected to further increase by around 175 million tons
(23%) by the year 2024 with comparison to that of the base years (2012-14)
(FAO, 2015c) (OECD and FAO, 2015).
Year
Glo
ba
l M
ilk P
rodu
ctio
n
(Mill
ion
To
ns)
Figure 1.1 Global Growth of Milk Production

Chapter 1 • Introduction
Keyur H. Joshi 3
These numbers show how milk and milk products are an integral part of the daily
food, especially for those who follow a vegetarian diet due to their nutritious
values. The World Health Organisation (WHO) reports that around 600 million
people in the world, i.e. approximately 1 in every 10 people, fall ill after eating
contaminated food and about 420,000 of them die every year (WHO, 2017).
Moreover, raw and unpasteurised milk are one of the main reasons for foodborne
bacteria such as Campylobacter and Enterohaemorrhagic Escherichia
coli, respectively, affecting millions of people globally besides other factors like
raw or undercooked poultry, drinking water and undercooked meat, fresh fruits
as well as vegetables. This fact signifies the importance of processing raw milk.
Figure 1.2 shows the very complex milk composition with almost 400 fatty acids,
18 different amino acids, several minerals, vitamins and other solids. Mainly it
comprises of water as fundamental element. This composition of milk collectively
makes it a very nutritional platform not only for the consumers but also for the
bacteria to develop and breed. Due to this reason,
Figure 1.2 The complexity of milk composition

Chapter 1 • Introduction
Keyur H. Joshi 4
Figure 1.3 illustrates the global growth of milk production emphasizing on the fact
that Asian dairy sector has grown by 241%. Figure 1.4 shows major 10 dominant
countries producing milk and covering a share of 62% milk production worldwide,
defining the major areas in the world with India, United States of America, China,
and Pakistan sharing 42% of overall global milk production. This also refers to
the size of the problem these countries encounter due to having a large and
globally dominant dairy sector.
Figure 1.3 The global growth of Milk Production around the world
(Source: http://www.fao.org/resources/infographics/infographics-details/en/c/273893/ ©: FAO)
Figure 1.4 The top 10 milk producing countries contributing to 62% of the global
Milk Production
(Source: http://www.fao.org/resources/infographics/infographics-details/en/c/273893/ ©:FAO)

Chapter 1 • Introduction
Keyur H. Joshi 5
Figure 1.5 emphasises on the reason why the research oriented towards quality
monitoring of cow milk is important – 83% milk globally is in the form of cow milk,
contributing to nine out of every ten glasses of milk consumed by people
worldwide (Agriculture in the Classroom, 2018). This is primary reason why the
scope of this project is targeted mainly towards the cow milk.
Quality, in general, could be more of a subjective term than objective and the idea
of a good quality product can differ in each case depending upon the context it is
discussed in, as well as what parameters are being considered to define and
determine overall quality. Milk quality, in particular, could be defined in several
ways too, e.g., for a common consumer the simplest form of a good quality milk
product would be a product that appears normal, smells fresh and the one that
tastes good.
However, the same might not be true if the idea of the said quality is scrutinised
through some rigorous means of testing and monitoring the factors associated
with the milk quality. This is also the reason why people with ill intention of making
financial gains counterfeit milk with synthetic milk that tastes, smells and looks
like milk but does not resemble the nutritional components that an ideal or normal
milk product should have.
Figure 1.5 The Cow milk shares 83% of total Milk Produce of the world
(Source: http://www.fao.org/resources/infographics/infographics-details/en/c/273893/ ©: FAO)

Chapter 1 • Introduction
Keyur H. Joshi 6
1.2 Importance of Milk Processing
Milk provides a very favourable environment, for growth of the microorganisms
known as bacterial pathogens to further develop and breed, due to its high
nutritional value. This phenomenon eventually causes spoilage of milk and
practically leads to the short shelf life of milk and other dairy products made by
processing of such milk. Apart of shortening the overall usable lifespan, bacteria
adulteration of any milk products can also cause consumers to contract different
food borne illnesses when these adulterated products are consumed.
For example one such story was reported in California (News Desk, 2015),
related to the contamination found in raw whole milk, where the inspectors from
California Department of Food and Agriculture confirmed the bacterial presence
following the product testing as a routine inspection and sample collection from
the facility. All the products of the said batch were ordered to be quarantined,
followed by their removal and disposal from the store shelves, including those
already sold and stored in customers’ refrigerators.
Symptoms due to campylobacteriosis mainly include cramps in stomach,
diarrhoea, or fever. These are observed generally after 2 to 5 days from being
exposed to Campylobacter and last for around a week. Usually most persons with
campylobacteriosis recover completely as this illness is mild, and some people
with campylobacteriosis show no symptoms at all. Less likely, yet possible,
symptoms could be joint pain and/or swelling.
Also, a rare disease known as Guillain-Barré syndrome, which brings weakness
and paralysis may occur some weeks after the initial phase of symptoms. Another
example is E. coli O157:H7 infection, normally associated with non-pasteurised
milk, which develops symptoms of Haemolytic Uraemic Syndrome (HUS) that can
lead to kidney failure as reported by News Desk, (2012).
In the year 2000, as many as 13,800 schoolchildren were affected in Japan after
consuming skimmed milk that was contaminated. A power cut resulted in time–
temperature tempering of the product. The company then inappropriately applied
corrective action by an attempt to reheat the milk without realising that the S.
aureus enterotoxins are heat stable once they are formed.

Chapter 1 • Introduction
Keyur H. Joshi 7
Motarjemi et al. (2014) list further similar incidents on foodborne disease
outbreaks in their book chapter on milk and dairy products. These could be
avoided to an extent by diligent handling, good storage conditions as well as milk
processing. Milk processing enables its preservation for much longer periods and
helps in reducing or avoiding food-borne illnesses resulting from the spoilage or
lack of quality (FAO, 2015b). For these reasons, in the supply chain of dairy
products, milk processing becomes the second very important stage at the
industrial level after milk production at the dairy farms. It is important to note that
the primary goal of milk processing is to help maintain the actual quality of raw
milk and thereby to ensure its preservation.
Milk, which is improved in overall quality naturally, is preferred more over the milk
that has artificially added nutritious values by means of processing. The high
costs of production are not only because of the high value of raw milk alone but
also due to its subsequent stages of milk processing that add to the overall retail
value of the end product. Hence, Dairy industries, that procure milk from dairy
farms to process the raw milk in order to produce pasteurised milk, cheese,
butter, ice-cream etc., also play a very significant part in the overall economy of
many developing as well as developed countries (Kenny, 2013).
1.3 Milk Supply Chain and Scope of the Research
In this section, the general structure of the milk supply chain is discussed while
addressing the scope of this research within the supply chain. To understand
where the significant challenges and main problems lie in the supply chain, it is
necessary to study this hierarchy including their difficulties. It ranges from the
procurement level, taking place at dairy farms, to the handling via the transport
stage, and stretches to the storage at retail units followed by the end
consumer level. Primary quality concerns arise at various stages of this entire
hierarchy, including at the retailers that sell the milk products received after being
processed and packaged from the dairy industries.
The tampering of quality, in the milk supply chain, generally takes place beyond
the packaging and processing stage with some portion of real and fresh milk

Chapter 1 • Introduction
Keyur H. Joshi 8
being added with other malicious components such as detergents and urea, as
explained in detail in section 1.4 of this chapter. The milk contamination could
also result due to lack of diligent handling or done deliberately to prolong its shelf
life and give false positives in basic routine tests. Such malpractice puts health of
the consumers at severe risk especially when the presence of the harmful
adulterants are not perceivable with organoleptic test as explained in Chapter 2.
It emphasizes on the fact that the proposed microwave sensing technology,
although targeted towards the lower end of milk supply chain - beyond the milk
processing and packaging stage, it could well be retrofitted to existing industrial
setup due to its advantage of being low profile. Figure 1.6 illustrates the scope of
proposed research in existing milk supply chain.
As an example, testing is made at both levels, of procurement and packaging, by
the industries for assuring the required quality, but at the end of each phase of
transportation, it is likely that the checked quality of the milk product would have
been altered. Specifically if the transport distance is long, the quantity of milk is
large and the storage conditions are not maintained at required level.
Figure 1.6 The scope of the proposed research in milk supply chain

Chapter 1 • Introduction
Keyur H. Joshi 9
The proposed sensor is targeted beyond the distribution stage of this chain, where
food inspectors have to collect the samples to test and send it to laboratories owing
to limitation of current standard practices. Furthermore, as the proposed
technology is based on electromagnetic wave sensing, it could be easily retrofitted
to existing robust industrial setup within the dairy industries.
Another big challenge, that raises concerns of milk quality and milk procurement,
is fragmented milk production, where milk production takes place in an
unorganised sector. This is prevalent over many countries like India – which is
the largest producer as well as consumer of milk, having the largest livestock
worldwide (NPCS Team, 2014). The research report by NPCS Team, (2014) also
adds that milk supply chains face difficulties in transporting milk, especially in
large quantity, under desired conditions over longer distances (>200km) while
ensuring the quality of milk.
Figure 1.7 shows a representative image of such a fragmented sector where
many small dairy farmers are sometimes dealing with customers directly, instead
of with industries, and sell them the milk on regular basis on daily, monthly or
yearly contracts. On the other hand, the European Union (EU) has one of the
strictest food safety protocols in the world and hence even if there is any individual
case of milk fraud, The Rapid Alert System, for Food and Feed Safety, feeds back
the information when risks to public health are detected in the food chain
(Handford, Campbell and Elliott, 2016).
Figure 1.7 A dairy farmer handling milk (representative image)
(Photo Credit: ILRI/Stevie Mann; https://www.flickr.com/photos/ilri/4028978890/) (License: https://creativecommons.org/licenses/by-nc-sa/4.0/legalcode)

Chapter 1 • Introduction
Keyur H. Joshi 10
In addition, in the transport stage of the milk supply chain, it has been perceived
that the milk samples can be adulterated with foreign materials which can cause
severe health hazards, such as detergents which were found in 103 (8.4%) of the
total observed samples.
Furthermore, because of poor hygiene and sanitation practised during milk
handling and packaging, detergents (used for cleaning purpose) are not removed
(indicating poor cleaning of milk containers) which eventually end up in milk
(Handford, Campbell and Elliott, 2016). Hence, it is understood that the milk
quality can deteriorate even post-production and post-processing stages due to
certain poor conditions unfavourable for the quality maintenance of pasteurised
and homogenised packaged milk.
This project is aimed at such stages beyond the industrial phase, once the milk
product is processed and packaged for selling into market, where determination
of milk quality and the monitoring process requires the technologies and systems
to be very compact, reliable, non-invasive, real-time and non-destructive to save
both time and resources.
1.4 Milk adulteration and its impact
The Food Safety and Standards Authority of India (FSSAI) defines adulteration
in food as, ‘An act of intentionally debasing the quality of food offered for sale
either by admixture or substitution of inferior substances or by the removal of
some valuable ingredient’ (Food Safety and Standards Authority of India, 2014).
Adulteration can be mainly of the two following types -
Intentional – done for commercial gains, e.g. adding water to pure milk or
Accidental – occurring incidentally due to presence of bacterial organisms
or foreign particles due to factors such as inappropriate handling and/or
storage, both in pasteurised as well as non-pasteurised milk.
Around 68% of milk in India, which is the largest producer of milk globally with
16% share of world milk production (FAO, 2015c), doesn’t meet the
recommended quality standards (Saxena, 2016).

Chapter 1 • Introduction
Keyur H. Joshi 11
As previously explained in section 1.2, on a regular basis from around the world,
articles regarding the quality of milk, its contamination, spoilage and/or
adulteration, with its possible adverse effect on consumers keep appearing in
newspapers and other related media. The Hans India (2017) reported another
similar story where local police in the city of Hyderabad arrested three
businesspersons along with eight milk vendors for adulteration of milk with
hazardous materials, which included some chemicals. In the operation, police
seized a large quantity of Hydrogen Peroxide (H2O2), soda, salt (NaCl), milk
powder and oil that were being used to adulterate the milk, evidently for making
financial gains by artificially fabricating a product that could taste and look similar
to pure quality milk.
Melamine, a synthetic chemical used in plastic coatings and laminates, was found
to have been added to milk in China to boost its overall protein content. The
Chinese Ministry of Health reported around 294,000 infants were caught sick after
consuming the melamine contaminated infant formula, and more than 50,000
infants had been hospitalised with six deaths being confirmed (WHO, 2009).
Melamine develops crystals in urine when its presence exceeds a threshold
concentration. Several of the affected infants, in the above-mentioned incident in
China, had developed kidney stones or calculi in the ureter or bladder and, hence,
renal failure.
The intentionally added adulterants, for the purpose of commercial gains, include
water, carbonates and bi-carbonates (such as NaHCO3), starch, gelatine, and
urea (CO(NH₂)₂). These have been reported to be a prevalent form of adulteration
of milk in India, which is the largest producer as well as consumer of milk
worldwide (Bhandare and Waskar, 2010).
A national survey conducted by FSSAI, in India, exposed water as the most
widely used adulterant in milk, which greatly compromised the nutritional contents
and hence the quality of milk samples. From all the non-confirming samples, 574
(46.8%) samples, belonged to the category of low solid non-fat (SNF) because of
milk being diluted with water (Handford, Campbell and Elliott, 2016). The survey
also proved that the second highest non-conformity was seen in skimmed milk
powder, which was present in 548 (44.7%) samples, out of which glucose was

Chapter 1 • Introduction
Keyur H. Joshi 12
present in 477 samples, mainly added to enhance its SNF content.
Reports have also been made that the multinational firms, that are very strict in
the quality maintenance of their products in developed countries, are allegedly
adulterating milk and milk powder including infant meals as urea is a natural
constituent in milk and its adulteration is easy (Dai et al., 2010). From a total of
60 various milk samples collected from various public places as well as
educational institutions in Faisalabad, Pakistan 63% and 87% were identified with
urea adulteration, respectively (Afzal et al., 2011).
In another work, a total of 365 children, in the age group between 1 and 22 years,
from various urban and rural households, in Uttar Pradesh, India, were surveyed
and samples were taken from each of these households (Bhatt, Singh and Bhatt,
2008). The researchers further collected 160 samples from local markets to
analyse the presence of urea and detergent. The samples collected from urban
regions showed higher levels of adulteration than the ones collected from rural
areas, with children affected in all age groups suffering eyesight problems (57%
in urban, 16% in rural) as well as diarrhoea, whereas headache was reported in
the children within age group of 6 to 18 years. The age group of younger children
within 1 to 5 years of age mainly relied on breastmilk and hence
had reported the minimum of health related problems pertaining to affected milk
consumption (Handford, Campbell and Elliott, 2016).
Urea is one commonly used adulterant because of the fact that it is a naturally
found constituent, in milk as non-protein nitrogen (NPN), varying from 20 mg/100
ml up to 70mg/100ml, but any value beyond that 700ppm mark is indicative of
urea which is externally spiked (FSSAI, 2012). Any higher amount of urea in milk
than its natural component can cause a fatal health hazard.
1.5 Motivation, Aim and Objectives
1.5.1 Motivation and Need of Project
Recent years have seen a push towards an innovative approach in terms of milk
spoilage prevention but this pursuit does not eliminate the need for future
research into milk spoilage detection methods (Lu et al., 2013).

Chapter 1 • Introduction
Keyur H. Joshi 13
There is a developing need for an accurate spoilage detection technique for
processed and packaged milk as much as there is a growing demand to prevent
the wastage of milk and the illnesses occurring due to contaminated milk
consumption. The current state of the art and its detailed critical analysis is given
in Chapter 2.
Based on the study of dairy production and agriculture programmes as well as
school-based milk programmes, Muehlhoff, Bennett and McMahon (2013) report
that the problems related to suitable levels of fat, added sugar and flavouring in
milk are still required to be addressed. There is no effective yet easy-to-use and
affordable method currently existing to achieve these goals (Lu et al., 2013). In
the late 1990s and early 2000s, the evolvement in high-speed instrumental
testing techniques to measure dairy and packaged milk composition provided the
required platform for enhancement in the overall effectiveness and accuracy of
traditional chemical analysis methods (Barbano and Lynch, 2006).
The motivation of this research work is to introduce a novel, rapid milk quality
monitoring technique, using a non-invasive, non-destructive, real-time approach
incorporating microwave sensors, which is less complex, accurate and adding
further to the current technologies in a time and resource saving manner. This
technique aims to cover three aspects of quality testing, namely spoilage
detection, classification of milk in terms of nutritional constituents present, and
adulteration check, within a single system. There is no technique, currently
available, incorporating all of these three elements of quality control under one
system. Based on the literature reviewed, it was apparent that there is little in the
way of rapid measurement for the spoilage, constituent and contamination
(adulteration) of milk by a single technique.
Those systems, which do exist in the research or commercial domains, are
largely laboratory based or require significant cost for installation. Therefore, the
purpose of this work is to investigate the use of EM wave sensors, operating at
Radio and microwave frequencies, to provide real-time solutions for the milk
quality testing. Hence, developing novel industrially focussed sensor system,
which is compact, less costly and readily retrofitted to current processes for milk
quality testing in real-time environment, is the main drive of this work.

Chapter 1 • Introduction
Keyur H. Joshi 14
1.5.2 Aim of the Research
The aim of this research is to develop a novel, microwave sensor system for
monitoring overall quality of pasteurised and homogenised cow milk in terms of
spoilage determination, classification of milk types based on composition, and
identifying adulteration. The aim is targeted beyond the dairy plant stage after
milk is processed and packed for the retail selling. Figure 1.8 breaks down the
main aim of this research work broadly.
1.5.3 Objectives of the Project
To achieve the aim of this project for determining the overall quality of packaged
cow milk, using EM wave based sensing technique, following objectives were
established:
Investigate the problems faced by dairy industry for quality monitoring of
processed and packaged milk and the limitations of current state of the art in
industry as well recent advancements in the research domain.
Investigate the EM wave theory, its advantages and study of the currently
existing microwave sensors to establish the scope of this research work.
Determine the dielectric property of the freshly bought milk types (skimmed,
semi-skimmed, whole) for a week’s period to understand the dielectric
property changes with respect to milk types (i.e. contents) as well as the
occurrence of spoilage over time.
Figure 1.8 Aim of the project to determine the Quality of Processed and
Packaged Cow Milk

Chapter 1 • Introduction
Keyur H. Joshi 15
Design and simulate theoretical model of the sensor based on the dielectric
property data using ANSYS High Frequency Structure Simulator (HFSS).
Design and fabricate a lightweight and portable microwave sensor, ideally a
planar sensor of few centimetres size; carry out the experimental test
measurements for spoilage determination, milk type classification, and
adulteration with the help of common and easily undetectable adulterants.
Analyse the recorded EM spectral data to determine the milk spoilage, milk
type classification, and adulteration using novel microwave sensor.
Make comparative review of the microwave sensing technology with regards
to the existing technologies and give recommendations of choice of
microwave sensor design for processed and packaged milk quality control.
1.6 Statement of Novelty
This thesis describes the development of low-cost, low profile, non-invasive, non-
destructive, time and resource efficient microwave fluidic sensor system for
monitoring of milk quality by measurements of spoilage, composition and
adulteration, which is currently not available for the packaged milk analysis
beyond dairy processing and packaging stage. This research work demonstrates
rapid measurement technique for milk quality control incorporating, spoilage
detection, content based milk type classification, and determining adulteration
through a single sensor-system. This will help to eliminate the time- and resource-
consuming stages in several currently used methodologies, such as
requirements of preparing and adding reagents.
1.7 Organisation of the Thesis
This PhD thesis consists of eight chapters as described below:
Chapter 1 provides a brief introduction about the whole research project by
discussing the background and its primary aim, objectives and motivation for the
need to implement this research work along with its novelty.

Chapter 1 • Introduction
Keyur H. Joshi 16
Chapter 2 describes the milk quality control with the current state of the art in the
dairy industry as well as recent advancements in research domain, with their
critical review, highlighting the advantages and disadvantages of each of the
techniques studied.
Chapter 3 discusses the advantages and principle of using microwave sensing
technology over the other existing approaches as explained in Chapter 2. In
addition, existing microwave sensor designs and its applications are briefly
discussed followed by highlighting the design considerations for this research
work.
Chapter 4 discusses the dielectric property of milk. The methodology adopted for
dielectric property test, of three milk product types, namely skimmed milk, semi-
skimmed milk and whole milk, is explained along with results and discussion.
Microwave sensors used in this research work are simulated, based on the
spectral signatures data recorded from dielectric property tests in this chapter,
followed by, design of a low profile, non-destructive, non-invasive planar
resonator type fluidic sensor for milk quality monitoring technique.
Chapter 5 shows the use of a variety of EM wave sensors to detect spoilage and
periodic deterioration of milk over time. The methodology adopted and sample
preparation are explained followed by the discussion of test results achieved for
the measurements of spoilage detection. The analysed data are shown in graphs
for further interpretation.
Chapter 6 gives the methodology based on microwave spectroscopy to
distinguish among types of milk samples based on their content. The primary
focus was on fat content of milk, based on which packaged milk types are
commercially classified. Results for varying protein content are also evaluated
and discussed.
Chapter 7 studies the adulteration of milk with urea, and detergents in deionised
water as cleaning agents, as forms of adulteration. The results show the
concentrations of adulterants as they grow in volume. Liquid Gold and Acid
Descaler were used as alkali and acidic detergents, respectively, as used by milk
industries to wash large containers carrying milk before refilling cycles.

Chapter 1 • Introduction
Keyur H. Joshi 17
Chapter 8 presents the critical review of the entire research project in comparison
of the existing technologies, and shows where the proposed technology stands
with regards to the current state of the art. The recommendations related to
suitable choice of the type of microwave sensor within EM wave sensing
technology, for processed and packaged milk quality monitoring, are also made
in this chapter.
Chapter 9, based on the results achieved from various microwave sensors,
including the fluidic planar resonator sensor for milk quality tests, summarises the
research work with regards to the research objectives laid out in Chapter 1 and
the concludes the project. Further expansion work is also suggested to improvise
the prototype design.
1.8 Summary
This research work seeks to provide a proof-of-concept solution, which could
serve effectively and be employed beyond the dairy industry’s robust setups at
the consumer end of the milk supply chain hierarchy. This means that the
primary focus of this work is aimed towards the user end of the production chain
and not at the milk procurement level, where dairies already have the robust
quality assessment techniques existing within the industries as explained in
Chapter 2.
This project is targeted towards the rapid measurement technique quality
determination of packaged skimmed, semi-skimmed and whole milk, which is
non-invasive, non-destructive and can be applied at food quality and testing
laboratories. The aim of the research is to further aid the product quality
inspection such as the tests done by food inspectors, or by medium and large
scale retailers, who receive the milk from dairies for selling in packaging, to help
allow the quality assurance and also to ensure that the customers are getting
what they are paying for.
The food inspectors can implement random checks for the packaged products
from a given batch, as the proposed methodology addresses all three aspects of
milk quality control in terms of spoilage detection, milk type classification and

Chapter 1 • Introduction
Keyur H. Joshi 18
adulteration check. This can eventually eliminate the need to check every single
package of the same batch and hence not every end user need to have this
application in hand to assess the quality of milk as it could be broadly applied at
the link just before the very end consumer.

Keyur H. Joshi 19
CHAPTER 2
MILK QUALITY CONTROL: CURRENT STATE OF THE ART
2.1 Background
This chapter discusses milk processing and standard quality control techniques
generally performed on raw milk to preserve its natural nutritional value to
acceptable standards, which prolong the shelf life ensuring that the processed milk
is safe to consume and free from elements like bacterial pathogens, contamination
and spoilage. As discussed in the previous chapter the risk of foreign particles or
microorganisms adulterating the milk is more when milk is raw and not processed
to filter out any inherent bacterial pathogens that come along from the farm during
the procurement stage. This chapter further discusses and critically analyses the
recent advancements in milk quality monitoring techniques while highlighting the
gaps and limitations within existing practice.
Milk quality control is the application of approved testing techniques, ensuring
standards related to the milk and milk products are regulated to expected levels.
This also takes into account the composition, purity and the level of different
microorganisms present within milk. Broadly, it covers testing milk and milk
products for quality as well as monitoring that - milk products, milk processors and
the marketing agencies involved adhere to the accepted codes of practices
(Ministry of Agriculture - Republic of Kenya, 2011).
Each country ideally has a general set of guidelines outlined in a specific legal
document normally governed by a regulatory body or respective food and quality
control agencies of the nation. In the EU, food hygiene legislation, with effect from
1 January 2006, sets out clear duties of food businesses in safe production while
being consistent at it. That covers the entire food chain from the farm to the fork
(Food Standards Agency, 2016). For England and Wales the Food Standards
Agency (FSA), defines “A Practical Guide for Milk Producers” under The Food
Safety and Hygiene (England) Regulations, 2013 and The Food Hygiene (Wales)
Regulations, 2006. Similarly, in India the regulatory body Food Safety and
Standards Authority of India (FSSAI) sets out instructions and standard protocols.

Chapter 2 • Milk Quality Control: Current State of the Art
Keyur H. Joshi 20
In the commercial market, the milk producers would expect a fair price according
to the quality of milk that they produce, whereas the milk processors pay the
producers, having been assured, that the milk received for processing has normal
composition, as well as being suitable for processing into different dairy products.
The consumer eventually expects to pay a fair price for milk and various other milk
products that could range between acceptable and excellent quality.
Figure 2.1 Basic flow-chart of Milk Production and Processing

Chapter 2 • Milk Quality Control: Current State of the Art
Keyur H. Joshi 21
Figure 2.1 gives a general overview of the milk production chain in the form of a
process flow-chart. The significance of studying this procedural hierarchy is to
emphasise on the fact that there already exists a robust mechanism to deal with
quality issues related to the raw milk at industrial levels. Hence, the focus of this
research is targeted specifically beyond the milk processing and packaging stage.
Milk contamination can take place in different ways, including by dairy cattle directly
shedding the organism in their milk. Hence, milk refrigeration right after milking is
important for controlling the growth of these organisms. However, considering the
fact that, microorganisms such as L. monocytogenes can survive adverse
environmental conditions, even at low temperatures, the collected milk from the
dairy farms should be processed as soon as possible (Motarjemi et al., 2014).
The procured milk undergoes a number of operations in the dairy plant starting
from storage and followed by processing stages such as clarification, preheating,
separation, standardisation of fat content, homogenisation, pasteurisation, cooling
and finally packaging. The raw milk is stored in silos for a limited time below 7°C
as per local regulatory requirements as it is essential for limiting the growth of
organisms. Pasteurisation is very important for the safety of raw milk, which is
received from farms, to eliminate foodborne pathogens. Vegetative cells of
foodborne pathogens are sensitive to heat and, therefore, the most heat-resistant
pathogens like C. burnetii, M. tuberculosis and L. monocytogenes, are killed during
the pasteurisation stage. Other pathogens namely Brucella, Campylobacter, E.
coli, Salmonella, S. aureus and Yersinia are also killed during this stage. Spoilage
bacteria and undesirable enzymes (lipases as well as protease) are also reduced
during the pasteurisation process, ensuring safety of the milk product as well as
prolonging the shelf life with minimum changes to its flavour and nutritional quality
(Motarjemi et al., 2014).
Low Temperature-Long Time (LTLT) method is used in batch pasteurisation of milk
while it is stirred continuously at 63°C for a minimum period of 30 minutes, whereas
the High Temperature-Short Time (HTST) is more energy efficient and applied for
a minimum of 15 seconds at 71.7°C in heat exchangers. The limitation of
pasteurisation is that it does not eliminate bacteria spores, and many other
spoilage bacteria are actually resistant to the temperatures used in pasteurisation.

Chapter 2 • Milk Quality Control: Current State of the Art
Keyur H. Joshi 22
To destroy these endospores, higher heat treatment such as Ultra-High
Temperature (UHT) must be applied at 135°C for 1 second (Motarjemi et al., 2014).
The UHT processed milk can be stored unrefrigerated, and has a long shelf life,
provided it is unopened and packed with aseptic packaging. The pasteurised milk
on the other hand has to be refrigerated as soon as possible after being processed
to prevent development and growth of S. aureus and thereby production of heat
stable enterotoxins.
2.2 Milk Quality Control Techniques in Industries
In the first section, the techniques, which are widely used at present in dairy
industries, are discussed in general. This allows the understanding of the ways
in which the practical application of milk quality checks is carried out currently in
industrial domain, at large. The simplest form of milk quality sensing is the manual
sensory method that simply involves sensing the change in smell, colour or
texture of the milk product. There are various milk quality testing techniques being
applied and experimented within laboratories and industrial levels.
The tests focused on determination of adulteration in milk are predominant in the
industries; besides these, certain general tests are carried out to find overall milk
quality, which include tests like the phosphatase test done on pasteurised milk
and the acidity development test used for Ultra High Temperature (U.H.T.)
processed milk (Ministry of Agriculture - Republic of Kenya, 2011). Interest is also
increasing in techniques which are aimed specifically at checking the
contamination within milk, such as Detergent Residue Testing (Dunsmore, 1983).
In the work done by Deeth et al. (2002), spoilage patterns for skimmed and whole
milk are studied and distinguished, using a manual sensory method first and then,
using Gram strain and oxidase test, preliminary identification of spoilage bacteria
was made, followed by identification of the isolates through an Analytical Profile
Index (API) supplied by Bio Merieux S.A., France. The preliminary identification
was carried out through an oxidase test and rating was done with averaging of
visual analysis and the smell of milk samples performed by two different qualified
milk graders on a scale from 0 to 9.

Chapter 2 • Milk Quality Control: Current State of the Art
Keyur H. Joshi 23
The samples were then also sent to a laboratory for total aerobic count of bacteria
and further analysis. The milk that scored less than or equal to 1 and hence
termed as grossly spoiled, was later isolated from corresponding agar plates for
bacteria isolation. The other commonly used approaches in milk industry are
briefed as follows (Ministry of Agriculture - Republic of Kenya, 2011):
2.2.1 The Organoleptic Test
As shown Figure 2.2 in this test, no equipment is required, but the milk grader
must have a good sense of sight, smell and taste. Janzen, Bishop and Bodine
(1982) applied such tests on milk samples with the help of two experienced
judges from the American Dairy Science Association (ADSA), who graded milk
samples with flavour score under 6.0, out of a scale of total 10, as ‘unacceptable’.
Hence, milk samples, which cannot be sufficiently judged through the
organoleptic test, must be subjected to other more sensitive and objective tests.
Nicolaou-Markide (2011) employs a similar organoleptic test besides pH and
Total Viable Count (TVC) to analyse the results achieved. These tests are basic
approaches and cannot detect odourless and tasteless adulterants such as urea.
Figure 2.2 Organoleptic Analysis (the visual inspection of a compound)
The ‘image’ originally presented here cannot be made freely available via LJMU E-
Theses Collection because of 'copyright'. The image was sourced from:
[focuswish.com. Available at:
http://www.focuswish.com/img/buy-adrafinil-organoleptic-testing-dbd9dc2f.jpg].

Chapter 2 • Milk Quality Control: Current State of the Art
Keyur H. Joshi 24
2.2.2 Acidity Test
Overall acidity content of milk is increased as it spoils. Hence, acidity level is
quantified to enable milk quality measurement. For dairy products, acidity content
can be expressed in two ways - titratable acidity (as shown in Figure 2.3), which
shows total acidity (not acid strength) and hydrogen ion concentration (pH), which
indicates acid strength (Lu et al., 2013). Bacteria developing in raw milk normally
produce more or less lactic acid. From this, the lactic acid percentage can be
calculated. The natural acidity of milk is 0.16 - 0.18%. Therefore, with the help of
this test, it is revealed that any figures higher than this would be an indication of
the developed acidity due to action of bacteria present.
There are different ways of measuring milk pH value. While a pH meter that gives
a definite value, pH indicator paper strips are used for general estimate of milk
acidity by dipping a strip into the milk sample and then matching the colour obtained
by it to those in the colour chart. Another form of pH testing includes pH indicator
kits where universal pH indicator solution is added to the milk sample and its colour
Figure 2.3 Milk titratable Acidity Testing apparatus
(Source: http://img.sparknotes.com/figures/3/3a5994498f24d59f5d5d762b40844a2a/titsetup.gif,
Credit: SparkNotes.com)

Chapter 2 • Milk Quality Control: Current State of the Art
Keyur H. Joshi 25
change is matched with a colour palette chart ranging from acidic to alkaline.
Among these existing current techniques, pH Indicators mainly focus on the pH
level detection, and may or may not always represent the perceivable spoilage of
the sample. Based on pH value detected, they aim to determine the deterioration
which leads to inaccurate results because pH levels easily fluctuate and the pH of
unspoiled milk is around 6.7, which is also the pH value at which many forms of
bacterial micro-organisms develop (Klaenhammer, 1988). At lower pH values
between 4.0 - 5.0, lactic acid bacteria can grow and produce lactic acid, which is
the phenomenon used for fermentation of milk for making various other dairy
products.
2.2.3 Clot on Boiling (C.O.B) Test
If milk is stored at room temperature, there is increased acidity in that milk which
is referred to as developed acidity. Any such increase of milk acidity by more than
0.2 percent, will introduce coagulation in milk due to heat treatment, taking place
due to calcium dissociating from caseinate salt (My Agriculture Information Bank,
2015). Therefore, it becomes necessary to know the heat stability of incoming
raw milk for its suitability for further processing. This is one of the old tests for too
acidic milk (pH<5.8) or abnormal milk (e.g. mastitis milk).
Figure 2.4 Milk sample clotted at the end of Boiling Test
(Indication of acidic milk)
(Source: https://allaboutbiologyworld.blogspot.co.uk/2017/07/cob-clot-on-boiling-test.html,
Photo Credit: Ahmed Ashraf)

Chapter 2 • Milk Quality Control: Current State of the Art
Keyur H. Joshi 26
Figure 2.4 shows a positive result with the presence of clots at the end of the
boiling test upon the milk sample under consideration, indicating that the milk is
acidic. This means that the milk sample has failed in the test, the milk must
contain many acid or rennet producing microorganisms or the milk has an
abnormally high amount of proteins like colostral milk. Such milk cannot stand the
heat treatment in milk processing and must, therefore, be rejected.
2.2.4 The Alcohol Test
It is based on the instability of the proteins when the levels of acid and/or rennet
are increased and acted upon by the alcohol. It is used as a rapid determination
of the elevated acidity of milk, when the milk sample seems sour from the
organoleptic test. If the test results show too high acidity in milk then the sample
is sent to the lab for further titratable acidity testing (Siirtola, 2000).
This test relies on the phenomenon that the proteins, in sour milk due to lactic
acid formation by bacteria, become susceptible to alcohol precipitation. If the
mixing of equal quantities of milk and 68% alcohol in a test tube results in
coagulation of proteins, then it indicates that milk has become sour and, hence,
is not fit for any procedures that apply pasteurisation on it. This is because
proteins, in milk with elevated acidity, have also loosed the heat stability
against the temperatures used for pasteurisation. For this reason, it is
recommended that the alcohol test should be applied to each incoming milk
container if the milk is to be treated for pasteurisation.
The Alcohol-Alizarin test is procedurally the same as the alcohol test but this test
is more informative. Alizarin is a colour indicator which changes colour as per the
acidity level (Ministry of Agriculture - Republic of Kenya, 2011).
2.2.5 Resazurin Test
It is the most widely used test for hygiene and the storing quality of raw milk.
Resazurin is a type of dye indicator. Under specified conditions Resazurin is
dissolved in distilled, boiled water. This solution is later used to examine the
microbial activity in a given milk sample. With the growth of bacteria in milk, the
redox potential of the milk also changes with time and the general trend for
potential to change is in a negative direction.

Chapter 2 • Milk Quality Control: Current State of the Art
Keyur H. Joshi 27
A rapid change is seen after the dissolved oxygen in milk has been consumed by
aerobic type bacteria, and can be determined by a change in colour of certain
dyes added in the milk sample.
These dyes are oxidants of redox systems, forming the basis of methylene blue
and Resazurin reduction tests for quality of milk, in terms of bacterial presence
(Bhandari and Singh, 2002). As the time that passes before these dyes are
reduced to a colourless reductant form, the colour reduction is approximately
proportional to the number of bacteria present. Hence, this reduction time
becomes an index for the degree of bacterial contamination. Figure 2.5 shows
the patent experimental setup image as filed in 1946 (Golding, 1952).
Figure 2.5 Resazurin Test setup for Milk as filed in patent by Norman
Golding
(Source: https://patentimages.storage.googleapis.com/pages/US2609275-0.png,
Credit: United States Patent and Trademark Office, https://www.uspto.gov/)

Chapter 2 • Milk Quality Control: Current State of the Art
Keyur H. Joshi 28
2.2.6 Fat and Protein Analysis Methods
The Gerber Butterfat tests are done in order to make accurate adjustments of the
butterfat percentage in standardised milk and milk products. Lipid/Fat content is
determined by the Gerber method (or modified Gerber method; Troy Fucoma) in
Europe where dairy product is added into a butyrometer with Sulphuric acid and
Amyl alcohol, both behaving as dissolvent agents to the non-fat milk solids (Kleyn
et al., 2001). Another improved approach, the Mojonnier method, is accurate but
very costly (Moore and Morse, 1926). In the US, a very similar method called
Babcock is used. Gravimetric estimations like the Rose-Gottlieb method achieves
higher accuracy as milkfat is extracted using solvents and weighed, which makes
them independent of butterfat composition (Houston, 1955).
Protein or fat counts is another approach some researchers have used to account
for the spoilage in milk by measuring the protein/fat counts as explained by
Yagoub, Bellow and El Zubeir (2008). Pseudomonas aeruginosa (P. aeruginosa)
was correlated to proteolytic activities in all food systems by many other studies
as well. It not only produces a significant amount of proteinases and lipases but
also plays a vital role in producing by-products by taking part in lipid and protein
breakdown along with temperature effects and storage time conditions
(Kohlmann et al., 1991). Hence, a good amount of technical ability and knowledge
is required, which makes this method less favourable amongst end users.
Nicolaou-Markide (2011) specifically focuses on the adulteration of milk and
especially on the various types of data analysis techniques done on the captured
data, whereas, Reinemann and Helgren (2004) describe the lack of intelligent
approaches in milk sensing technologies currently being used. As after the
determination of good or poor quality of milk, most of the systems do not offer the
automated diversion of poor quality of milk to maintain the high standards of their
products at the manufacturers’ end. The industrial approach to determine Protein
levels known as the Dumas method is an enhanced version of the standard
Kjeldahl method and hence more preferred (Chiacchierini et al., 2003). Both the
methods need to convert measured nitrogen concentration to a protein
concentration, as they do not directly measure the protein, which leads to
inaccuracies.

Chapter 2 • Milk Quality Control: Current State of the Art
Keyur H. Joshi 29
Other fat analysis techniques include Gas Chromatography (GC) techniques,
which are now enhanced from conventional techniques to high speed for
industrial application due to being relatively bulky as well as highly expensive.
Povolo and Contarini (2009) employed such fast GC for milk fat purity analysis of
cows’ milk. Whereas Dai et al. (2010) made analysis of urea in milk and milk
powder by isotope dilution gas chromatography–mass spectrometry.
2.2.7 The Lactometer Test
The density of milk changes from its normal value to an abnormal value when
water or other materials are added to it. The lactometer test is designed to detect
the change in density of such adulterated milk. This is one of the basic
types of test to detect simpler adulteration affecting the density of milk. Singuluri
and Sukumaran (2014) report that the sodium chloride is used particularly to
manipulate the lactometer readings, to enable false positive measurements,
masking the added water in milk. Figure 2.6 shows a hydrometer as used in
lactometer test to find milk density.
2.2.8 Inhibitor Test
Milk collected from producers may contain drugs and/or pesticides residues.
These, when present in significant amounts in milk, may hinder the growth of
lactic acid bacteria used in the making of fermented milk products such as cheese
Figure 2.6 Hydrometer used in lactometer test to measure density of milk
sample
The ‘image’ originally presented here cannot be made freely available via LJMU E-
Theses Collection because of 'copyright'. The image was sourced from:
[indiamart.com. Available at:
https://4.imimg.com/data4/EO/BO/MY-27096831/calibration-certificate-for-
leimco-sp-gr-hydrome-500x500.jpg].

Chapter 2 • Milk Quality Control: Current State of the Art
Keyur H. Joshi 30
and yoghurt, in addition to being a health hazard. This method tests the
suspected milk sample to determine and distinguish between any changes.
Kohlmann et al. (1991) determined the effect of known protease inhibitors on
protease activity.
Figure 2.7 shows apparatus involved in the inhibitor test for milk where the milk
sample under test is subjected to a fermentation test using starter culture and its
acidity is checked after 3 hours. The titratable acidity value, obtained, is then
compared with that of a similarly treated sample which is free from any inhibitory
substances, i.e., normal milk sample (Ministry of Agriculture - Republic of Kenya,
2011).
2.2.9 Freezing Point Determination
This test is done by simply observing the freezing point of a given milk sample.
The freezing point of milk is known to be the most consistent of all measurable
milk properties. A small adulteration of milk with water will cause a detectable
elevation of the freezing point of milk from its normal value, which is -0.54 ºC. The
adulterated milk by addition of water may have also been standardised by adding
skimmed milk or partially skimmed milk. Even in this case this test can detect the
variations because of the fact that when solutes are dissolved in an
aqueous solvent, the freezing point of the solvent is lowered. Such lowering is
normally directly proportional to the concentration of solutes added in the solvent
(Bhandari and Singh, 2002).
Figure 2.7 Apparatus required for Milk Inhibitor Test
(Source: http://www.fao.org/ag/againfo/resources/documents/MPGuide/Image30.jpg, ©: FAO)

Chapter 2 • Milk Quality Control: Current State of the Art
Keyur H. Joshi 31
2.3 Milk Spoilage Detection Techniques in Research Domain
In this section, other research works and techniques related to milk quality testing,
in terms of milk spoilage detection, are discussed in brief and critically analysed
at the end.
2.3.1 Lipid based Disposable Sensors
Another approach has been developed where lipid based, disposable, screen-
printed sensors are employed along with the support of Principal Component
Analysis (PCA), which is a pattern recognition technique, using SPSS (Statistical
Programme for Social Scientist). Figure 2.8 shows a cross-sectional view of the
screen-printed lipid membrane sensor as used by Mee Sim et al. (2003).
In this design, the working electrode as well as the reference electrode were
integrated onto a single strip, which comprises of eight circular graphite working-
electrodes and an Ag/AgCl reference-electrode. The disposable strip was printed
on a polyester planar substrate and nine conducting paths were printed with silver
ink.
The disposable sensors were rinsed with distilled water before being immersed
Figure 2.8 Disposable Taste Sensor System (Schematic)
(Source: Mee Sim et al., 2003)

Chapter 2 • Milk Quality Control: Current State of the Art
Keyur H. Joshi 32
into the pasteurised and UHT milk samples bought over the counter. From screen-
printing to acquiring results followed by processing and distinguishing among the
results, this process requires highly technical supervision, making it complicated
for the common market use. In this technique also, the primary focus was on the
detection of spoilage and not on the type of milk. Due to the excessive technical
knowledge required regarding the lipid materials to be used while designing the
disposable sensor and then setting up the taste sensor system, this approach is
not so favourable for real-time and rapid testing systems.
2.3.2 Gas Sensor Arrays
Gas Sensor Arrays, specifically aim to detect the strains due to the strong volatile
compounds; moreover, they require a very large and costly setup. These arrays
normally involve solid state, i.e. Metal Oxide Semiconductor (MOS) and MOS
Field Effect Transistor (MOSFET) or IR based CO2 gas-sensor arrays, as used
by Haugen et al. (2006). The approach is to detect volatile bacterial metabolites
by predicting the strain cultures that a certain compound produces.
The highest CO2 readings were recorded in the pure S. marcescens N9 culture
and in the mixed culture, whereas the pure Pseudomonas culture contributed a
relatively lower production of volatiles including also CO2. This operational
behaviour of gas-sensors inflicts a limitation on overall testing system, as for
every individual volatile compound produced by different bacteria – it is required
to establish a dedicated gas-sensor to detect resulting strains. Moreover, in the
case of bacteria that generate lesser volatile compounds, the sensitivity of the
sensor has to be potentially high in order to be able to sense the low number of
strains.
2.3.3 IR Spectroscopy
An Infra-Red (IR) spectrometer produces IR light over a range of wavelengths
and monitors the vibration of molecules. Figure 2.9 illustrates the schematic
diagram of an FT-IR spectrometer (Subramanian, Prabhakar and Rodriguez-
Saona, 2011). The general setup comprises of a source that produces IR light,
an interferometer that generates a range of wave numbers, and a detector that
records the signal.

Chapter 2 • Milk Quality Control: Current State of the Art
Keyur H. Joshi 33
The interferometer is the key component of a spectrometer, which comprises of
a fixed mirror, moving mirror as well as a beam-splitter. The beam-splitter splits
an incoming IR beam followed by recombining it to produce varying IR
wavelengths. A combination of mirrors is used to deflect the beam, whereas the
laser acts as a time reference for data collection. The detector records the signal
as an interferogram, which is later Fourier-transformed resulting in a single-beam
spectrum. Fourier transform converts recorded data to absorbance and
transmittance from a frequency and wavelength form.
IR Spectroscopy, in general, is less used in the industries than the other methods
and also requires a costly laboratory setup. The biochemical changes occurring
in milk due to bacterial growth could be detected by visible and Short Wavelength
Near Infra-Red (SW-NIR) diffuse spectroscopy (600nm-1,100nm) to distinguish
between good-quality and spoiled milk samples without requiring to enumerate
bacteria by monitoring quality loss in pasteurised skimmed milk (Al-Qadiri et al.,
2008).
Figure 2.9 Optical layout of a typical Fourier Transform Infrared Spectrometer
(Source: Subramanian, Prabhakar and Rodriguez-Saona, 2011)

Chapter 2 • Milk Quality Control: Current State of the Art
Keyur H. Joshi 34
As high as about 90% accuracy was achieved using multivariate data analytical
techniques such as Principal Component Analysis (PCA), Soft Independent
Modelling of Class Analogy (SIMCA), and Partial Least Squares (PLS) under
segregated storage treatments (6°C-37°C storage for 0h-30h). The main
drawback with this method is its high installation cost of experimental setups. This
procedure again focuses on spoiled and good quality milk. The pH count and
bacterial proliferation were used to compare with various spectral features. Again,
a spectrometer was used to acquire the NIR spectra using a fibre optic set-up,
making the design costly and complicated, as the acquired data needs to be
mathematically processed to give any usable correlation.
2.3.4 Amperometric Method
This method monitors the growth of coliforms in milk by measuring the current
change in an amperometric sensor. The sensor designed by Lee et al. (2009)
comprised of a circuit with a potentiostat and two electrodes which were
immersed in milk samples containing Methylene Blue with various concentrations
of bacterial inoculums.
The microbial metabolism leads to the reduction of Methylene Blue, gradually,
resulting in a change of current. The Detection Time (DT) required for sensing
this detectable change of current gives the measure of present microorganisms
available at any given time. This method is simpler compared to conventional
bacteria plating methods but it requires the supervision of skilled worker and
hence it is time consuming and not preferred.
2.3.5 Magneto-elastic Sensors
Wireless Detection, in terms of a remote-query technique to detect spoilage of milk
is again an emerging field (Lu et al., 2013). Remote-query sensor, as used by
Huang et al. (2008) to measure the bacterial count of Staphylococcus aureus ssp.
Anaerobius (S. aureus) in milk, is ideally a stand-alone, magneto-elastic sensing
layer comprising of ribbon-like thick-film linked with some chemical or bio-chemical.
Here, S. aureus are the bacteria that reside in milk and multiply as milk spoils;
infection with S. aureus can result in such human diseases as toxic shock
syndrome, endocarditis, and septicaemia (Guntupalli et al., 2007).

Chapter 2 • Milk Quality Control: Current State of the Art
Keyur H. Joshi 35
The sensor was placed inside of a 2 ml cuvette that contained milk sample followed
by within a solenoid coil used for signal telemetry. The sensor reacted in terms of
resonance frequency shifts based on viscosity changes. This happens due to
Staphylococcus aureus (S. aureus) growth and hence the sensor undergoes
sensing of the spoiled milk. The sensitivity of the sensor was achieved well in milk
than in the culture medium, as milk is a more viscous medium than the culture
medium itself. Passive sensors in particular do not require internal battery as they
are powered by query-field. These sensors get deformed mechanically when they
are subjected to a magnetic field, which eventually launches elastic waves, within
the sensor, having the highest magnitude at mechanical resonance frequency of
the sensor (Ruan, Zeng and Grimes, 2003).
Subsequently, the mechanical deformation of the sensor generates a certain
amount of magnetic flux that can be detected remotely by a pickup coil, i.e. without
any physical contact between sensor and the apparatus, sensing takes place.
Guntupalli et al. (2007) developed such a sensor for microorganisms based upon
antigen–antibody interaction.
2.3.6 Photonic Sensors
Optical capillaries have been employed as the components of photonic sensor
micro-systems in the past (Borecki et al., 2008).
Figure 2.10 Optical Sensor configuration for Microlitre Analysis of Milk
The ‘image’ originally presented here cannot be made freely available via LJMU E-
Theses Collection because of 'copyright'. The image was sourced figure 1 from:
[Borecki, M. et al. (2009) ‘A method for testing the quality of milk using optical
capillaries’, Photonics Letters of Poland, 1(1), pp. 37–39. Available at:
http://photonics.pl/PLP/index.php/letters/article/view/1-13/13].

Chapter 2 • Milk Quality Control: Current State of the Art
Keyur H. Joshi 36
The classical optical test methods make the overall system expensive because
of the fact that fresh milk micelles have such sizes that scattering set-ups require
sources and detectors that operate at the value of wavelengths λ < 300 nm, which
is on the deep UV range boundary and covers the VIS range (Dress et al., 1998).
Figure 2.10, on the other hand, shows sensor configuration as used by Borecki
et al. (2009).
It used low-cost optical capillaries to test the quality of milk, which required an
optical sensor configuration with fibre optical set-up. This work, determined milk
quality by observing its behaviour under specific heating conditions using a simple
photonic system with optical capillaries. It was shown that the optical capillary is a
suitable medium for analysing liquids encompassing high scattering of light, e.g.
milk. Good and poor quality milk resulting from storage conditions was
distinguished by this method.
While this method has the potential to be a platform for real-time milk quality
classification, the overall set-up used in that is still more complex than the proposed
technique based on a microwave sensor in this thesis. Despite that work claiming
it to be cheaper than the other similar work involving high quality fibre, such
instrumentation is relatively costlier, compared with the proposed work here, as it
comprises of a light source, fibre optical link, sensing head, and two photo-
detection units, which are controlled by an intelligent detection-and-control system,
built based on the Atmel Co. AVR® microprocessor.
The focus of this work, primarily, is on the variation in quality resulting from defined
storage conditions. Notably, this process requires the heating of milk, as the test
takes into account the influence of temperature on the structure of milk, and hence
local heating to the capillary is introduced by Borecki et al. (2008), which results in
quite a large instrument set-up.
Table 2.1, on the following page, summarises the milk quality control techniques,
in industries and the research domain, as discussed in this chapter,
comparatively with their main characteristics. The table reflects back upon the
current state of the art, for the milk quality monitoring, with the last row showing
the position of the proposed microwave sensing technology.

Chapter 2 • Milk Quality Control: Current State of the Art
Keyur H. Joshi 37
Table 2.1 Comparison of Current State of the Art with Proposed Technique
* This will decrease with the advancement in Conducting Polymers in coming years
The microwave sensor design and its construction are cheaper compared to all
other types of sensing technology, discussed here, except for the magneto-elastic
sensors overall. With added support of portable or handheld VNAs, it has become
further possible to reduce the operational costs of the proposed microwave
sensing technology down to a lower minimum.
Sensing/Sensor Types
Detects Accuracy Advantage Cost Limitation
pH Indicators
Acidity Changes
Variable at different levels
of pH Instant 450-750 £
Unspoiled milk pH; still good for some bacteria
Magneto-elastic Sensors
Viscosity changes due to S. aureus
growth
R2 > 0.95 Disposable; Wireless; Low Cost
~ 0.25 £/m of Metglas®
Alloy Ribbon
≈ 18 hours Required
Gas-Sensor Arrays
Strains/Oxide Based Volatile
Compounds
Variable for each
Bacterium type Tested
Instant for given
Threshold
3800 – 75,300 £*
Costly and Difficult to Use
IR / NIR Spectroscopy
Metabolic By-products
R2 > 0.90 ≈ 4
Minutes Up to
35,000 £
Very Expensive
Set-up
Amperometric Sensing
Change in Direct
Current R2 > 0.90
Relatively Less
Complex
1150 - 3800 £
Up to 2 Hours; Supervision
Required
Optical Sensors
Scattered Light through
Optical Capillaries
R2 > 0.95; When Heating
Conditions Maintained
Time Consuming
> 3800 £ Heating
Condition Required
Protein Analysis Methods
Protein Levels
R2 > 0.95 ≈ 4
Minutes (Dumas)
Up to 3800 £
Technical Complexity
Fat Analysis Methods
Fat Levels
Rose-Gottlieb > Gerber Tests
Can Separate Fat Types
~ 3000 £ Steps with Reagents Required
Chromatography Techniques
Fat / Protein Extraction / Adulteration
R2 > 0.95 Few ms to
few minutes
Up to 60,000 £
High Expense
Microwave Spectroscopy
(Proposed Technology)
Composition Spoilage
Adulteration
R2 ≥ 0.95 < 1 minute 50 £ - 1250 £
Not tested for specific
bacterium

Chapter 2 • Milk Quality Control: Current State of the Art
Keyur H. Joshi 38
2.4 Techniques used to Determine Milk Adulteration
In this section, an analytical review of the current state of the art is made based
on methods used for detection of urea, as the main adulterant, in milk. Urea,
which is the predominant component of non-protein nitrogen (NPN) present in
milk, can be naturally available in milk up to 700 ppm (i.e. 70mg per 100ml). The
range of urea presence, in milk, is normally between 0.01 - 0.06 %. This,
combined with the protein concentration within milk, is considered an important
factor in regulation of livestock feeding. Hence, this is another important reason
why urea concentration should be monitored on a frequent regular basis.
Lars Nygaard, Torben Lapp and Börkur Arnvidarson (1993), secured a US patent
for their urea determination method, using infrared (IR) light measurements, with
a condition of milk samples having a minimum of 1% fat, dissolved lactose, and
protein respectively each.
Primarily used technologies, for the detection of urea in milk, can be categorised
into two types – direct, such as colorimetric, and indirect, such as degradative
procedures, besides point-of-care and other methods for urea determination
(Francis, Lewis and Lim, 2002); the authors conclude that urease-catalysed
hydrolysis primarily dominates the chemistry behind determination of urea within
clinical samples. Because the instrument is more likely to be used by non-
technically trained staff, the focus has shifted to simpler procedures and data
handling.
Muir and Sweetsur, (1976) have concluded that urea levels that naturally occur
in bulk milk play a vital role in heat stability while contributing largely towards its
fluctuations. This conventional method for urea estimation within milk uses
conversion from urea to ammonia by urease, which is then subjected to
colorimetric determination.
Despite the method being sensitive and precise, it requires specific urease purity
which is difficult to be procured for all laboratories or dairy plants (Bhavadasan,
Rajput and Ganguli, 1982); the researchers further summarised that the urea
level in cows’ milk was relatively higher than in buffalo milk. In addition, the
conventional methods being costly and tediously time consuming, they are not

Chapter 2 • Milk Quality Control: Current State of the Art
Keyur H. Joshi 39
effective for being implemented regularly for real-time farm management let alone
in determining urea due to deliberate forms of adulteration for commercial gain.
Another approach for urea determination in milk is the differential pH method
(Luzzana and Giardino, 1999). In this technique, measurements were based
upon single enzymatic reaction, in the form of urease driven hydrolysis of urea
that causes pH variation directly in proportion to the urea content present within
the milk sample. This method, because of using reagents and buffer solutions, is
an invasive method similar to the traditional spectrophotometric method that is
used as the gold standard in this project to benchmark results obtained through
the proposed novel technique using microwave spectroscopy, which is non-
invasive.
Paradkar, Singhal and Kulkarni (2000) developed a detection technique for
externally added urea under the malpractice of making ‘synthetic milk’ which is
made up using a mixture of easily available and low cost ingredients such as –
urea (CO(NH₂)₂), water (H₂O), sodium chloride (NaCl), sucrose (C12H22O11),
sodium bicarbonate (NaHCO3), detergent and vegetable oil. The protocols
suggested by the researchers were also similar to the conventional invasive
approach with neutralised pH 7.0 buffer milk reagents while using soybean
urease.
Each of these listed ingredients plays a specific role in order to make the product,
which looks, feels and tastes like milk; moreover, adulteration of original milk with
such synthetic milk up to 5% is not detected at all under tests like lactometer
reading or alkalinity due to the aforementioned similarity. Urea, in particular, plays
a role to contribute towards milk nitrogen.
Urea is also known to be externally added to improve milk’s heat stability. The
Potentiometric approach, has been adopted by researchers in the past, to enable
determination of a wider spectrum of ions and to allow for inexpensive and
portable equipment, using NH4+ ion sensitive electrode under Double Matrix
Membrane technology acting as the transducer with a layer of immobilised urease
(Trivedi et al., 2009).

Chapter 2 • Milk Quality Control: Current State of the Art
Keyur H. Joshi 40
The disposable biosensor was designed using thick film screen-printing with
Ag/AgCl reference electrode. Lima, Fernandes and Rangel, (2004) constructed
a versatile method that could simultaneously be used either as
spectrophotometric detection or conductometric detection of urea. A thermos-
reactor was used to hydrolyse urea enzymatically and convert it into ammonium
(NH4+), which eventually forms Ammonia (NH3) by merging with an alkaline
solution. In conductometric detection, Ammonia modifies conductance of Boric
acid (BH3O3) solution whereas in spectrophotometric detection it changes the
colour of the bromothymol blue (BTB) indicator. This sequential injection
technique, although it achieves full automation, is very technically complex to set-
up like the other conventional approaches listed above.
Renny et al. (2005) developed a piezo-electric sensor based on an enzyme that
measures gas pressure evolving within the sample under test, with liquid to gas
ratio value 1:2.5 giving optimum results. The most current state of the art from
conductometric, optical, thermometric and potentiometric methods are too delicate
for application without extensive pre-treatment, especially with raw milk (Nikoleli,
Nikolelis and Methenitis, 2010). On the other hand, the traditional methods of
analysis, though precise, are very time consuming and mainly laboratory bound.
Table 2.2, on the following page, summarises further attributes of the current state
of the art for the design considerations of this research work. It shows primary
characteristic features of the standard existing practices in industrial as well as
research domain besides that of the proposed technique. The last row in the table
shows the status of the proposed technique for each of the listed attributes.
The proposed technology is non-ionising, non-destructive, low profile, portable and
rapid measurement technique, the features that no other currently in use method
possess in a single system. In this research project the proposed microwave
sensing technique is tested for detection of spoilage of milk, milk type classification
based on its fat composition, i.e. skimmed-milk, semi-skimmed milk, and whole
milk, and urea adulteration of the milk besides detection of detergents in deionised
water.

Chapter 2 • Milk Quality Control: Current State of the Art
Keyur H. Joshi 41
Table 2.2 Milk Quality Testing Techniques with their Attributes and Applications
a Current State of the art b Portable devices being further researched
Technique a Portable Non-
Invasive Non-
Destructive Real Time
Application / Production
Stage
Further References
pH Level Sensing
Yes No Yes Yes
Spoilage Detection/ Dairy and End User
(Santos et al., 2003; Fromm
and Boor, 2004; Helland,
Wicklund and Narvhus, 2004)
Magnetoelastic Remote-Query
Sensing Yes No Yes Yes
Spoilage Detection
(Tested for S. aureus)/ End User
(Winquist et al., 1998; Di Natale
et al., 2000; Puckett et al.,
2003; Cai et al., 2004)
Gas-Sensing Arrays
Yes No No No Shelf-life
Detection/ End User
(Compagnone et al., 2015; Anand
and Sridhar, 2018)
IR/NIR Spectroscopy
No b Yes Yes Yes
Classification + Spoilage
Detection/ Processing at Dairy and End
User
(Ellis et al., 2002; Al-Holy et al.,
2006; Nicolaou, Xu and
Goodacre, 2010)
Amperometric Sensing
No No No No
Current Change (Electro-
chemical)/ End User
(Atherton and Newlander,
1977; Nascimento et
al., 2017)
Photonic Sensing
No No No No
Scattering of Light
(Spoilage)/ End User
(Romaniuk and Dorosz, 2006; Das, Goswami and Biswas,
2016)
Kjeldahl Method / Dumas Method
No No No
Dumas (Yes)
Kjeldahl (No)
Protein Composition
Analysis/ Processing at
Dairy
(Hantsis-Zacharov and Halpern, 2007;
Fox, 2011a)
Gerber Test / Babcock Test / Rose-Gottlieb
No No No No
Fat Composition
Analysis/ Processing at
Dairy
(Matheson and Otten, 1999)
Chromatography Techniques
No No No Yes Extraction and
Separation/ End User
(Dai et al., 2010; Nascimento et
al., 2017)
Spectro-Photometry
No No No No Urea
Adulteration/ End User
(Francis, Lewis and Lim, 2002;
Lima, Fernandes and Rangel,
2004)
Microwave Spectroscopy
Yes Yes Yes Yes
Composition Spoilage
Adulteration / Could be used at all stages
Proposed Technique

Chapter 2 • Milk Quality Control: Current State of the Art
Keyur H. Joshi 42
2.5 Summary
Based on the limitations of current techniques, there is a need for further
development. This research project, attempts to address these limitations by the
design and development of a novel sensory system that is able to distinguish
among given types of milk, based on composition, spoilage, and contamination
ensuring milk quality monitoring in a non-invasive, non-destructive, real-time and
reliable manner.
When it is hard to overcome all the limitations in all the characteristics as shown,
there is still a way to minimize the overall shortcomings of existing approaches.
From the above discussion, it is clear that there is scope and need for improvement
in milk quality testing methods.
Thus, this research work is an attempt to address the aforementioned limitations
of existing technologies in a less complex, non-invasive, non-destructive, real-time,
portable yet reliable manner by investigating the use of microwave sensor
technology.

Keyur H. Joshi 43
CHAPTER 3
EM WAVES AND MICROWAVE WAVE SENSORS
3.1 Background
Microwave spectroscopy was broadly defined as “the study of interaction
between matter and radio waves of wavelengths (λ) between a few metres to a
few tenths of a millimetre” (Townes, 1952). It was introduced, at large, first with
experiments related to dielectric properties of matter using Hertzian waves. The
use of microwave spectroscopy has become prominent since World War II with
radar and other technical developments in microwave generation of techniques.
Subsequently this technique has been used for a wide variety and broad range
of applications, e.g. food quality, health monitoring, drug detection, water
pollutants etc. (see section 3.5).
This technique is similar to IR spectroscopy at large with the main difference
being significantly lower operational frequencies, hence lower power, as
compared to IR spectrum and additional flexibility of low-profile planar sensors
besides other cavity sensors as discussed in this chapter. Figure 3.1 illustrates
the full EM wave spectrum with the frequency and wavelengths of all waves.
Figure 3.1 Full EM Wave Spectrum with wavelengths and frequencies
The ‘image’ originally presented here cannot be made freely available via LJMU E-
Theses Collection because of 'copyright'. The image was sourced from:
[mpoweruk.com. Available at:
http://www.mpoweruk.com/images/emspectrum.gif].

Chapter 3 • EM Waves and Microwave Sensors
Keyur H. Joshi 44
The EM wave spectrum covers the full span of non-visible as well as visible light
signals made up of Electric and Magnetic fields perpendicular to each other and
perpendicular to the direction of propagation.
3.2 Working Principle
The primary principle of these sensors that operate at microwave or radio
frequencies (RF) range is based on the interaction of signals with the medium of
the material sample being tested. This interaction between microwave signal and
the medium material can be in the form of amplitude attenuation or phase shift,
and it determines the relative permittivity and permeability (Alhajeri, 2010). Figure
3.2 illustrates the experimental setup involving microwave sensor in form of a
microwave resonator cavity connected with a vector network analyser to enable
and record sensing measurements.
Figure 3.2 Experimental setup for Microwave Sensing explaining its
Working Principle

Chapter 3 • EM Waves and Microwave Sensors
Keyur H. Joshi 45
Microwave sensing (EM wave sensors) operate based upon the fact that the
material under test condition, e.g. milk sample in this case, when placed into
proximity or in direct contact with a microwave sensor, interacts with the EM
waves that can be specifically correlated with the properties of the given material
(milk). Particularly, the sensing is based on the interaction of propagating or
resonating modes with the liquid under test.
3.3 Advantage of Microwave Sensors
The primary advantage of using microwave sensors is that they can be
implemented for a wide range of applications in a non-destructive, cheap yet
effective manner, while being able to measure non-invasively from a short
distance, due to penetrating waves without creating any health hazards
(Bjarnadottir et al., 2015).
These types of sensors are working on non-ionising radiation meaning that the
EM wave radiation that does not contain enough per photon energy to ionize
atoms (or molecules) to be able to completely remove an electron from that atom
(or molecule). This implies that these types of sensors cause no health hazards
to the human body or animals especially when used at lower frequencies up to
few tens of GHz. In addition, they can be easily retrofitted to an existing industrial
set-up.
3.4 The Wave Equations
The three basic material properties are described by conductivity (σ), permittivity
(ε), and permeability (μ). Here, dielectric permittivity (ε) measured in
Farads/meter (F/m), and magnetic permeability (μ) measured in Henries/meter
(H/m), are complex quantities.
Two of the total four Maxwell equations give the relationships between electric
field vector, , and magnetic field vector, :
∇ × = σ + 휀 𝜕
𝜕𝑡 (3.1)

Chapter 3 • EM Waves and Microwave Sensors
Keyur H. Joshi 46
∇ × = − 𝜇 𝜕
𝜕𝑡 (3.2)
The above two equations, eq. (3.1) and eq. (3.2), are Ampere’s law and Faraday’s
law, which relate time variations of one field to spatial variations of the other, i.e.,
they state that time-varying electric fields generate magnetic fields, and time-
varying magnetic fields generate electric fields, respectively (Mehdizadeh,
2015c).
Furthermore, these laws show that the ratio between the intensities of electric
field and magnetic field in time and space are set by surrounding material
properties. For example, a vacuum surrounding would have permittivity and
permeability, but not conductivity because there are no free charges in a vacuum
space.
Now if we consider the steady-state time-varying systems only then it further
simplifies (is reduced to) the relation between field and field, from
instantaneous values of fields, to only corresponding values of fields at a given
operating frequency. Then equations eq. (3.1) and (3.2) can be rewritten,
respectively, as:
∇ × = σ + 𝑗𝜔 휀 (3.3)
∇ × = − 𝑗𝜔 𝜇 (3.4)
Where 𝜔 = 2𝜋𝑓 is angular frequency in radians/second and 𝑓 is the frequency in
Hertz (Hz). The values of permittivity and permeability in free space are,
respectively, 휀0 = 8.85 × 10⁻¹² 𝐹/𝑚, and 𝜇0 = 4𝜋 × 10−7 𝐻/𝑚, and 𝑗 = √−1 is
complex operator.
Combining equations eq.(3.3) and (3.4) gives the following useful equation for
solving practical boundary value problems such as those in probes and sensors
because each of the following is a now a differential equation with only one of the
field type as a function of spatial dimensions.
∇2𝐸 + 𝑘2𝐸 = 0 (3.5)
∇2𝐻 + 𝑘2𝐻 = 0 (3.6)
Here, the operator (2ߜ) is called Laplacian and k is the wave number, 𝑘 = 𝜔√𝜇휀.

Chapter 3 • EM Waves and Microwave Sensors
Keyur H. Joshi 47
Solving these equations, combined with a given set of boundary conditions help
determining the propagation modes, which is nothing but a form of wave (and
hence one form of wave function) able to travel through a given microwave
device.
3.5 Existing Microwave Sensors
In Chapter 2, current techniques and recent advancements in milk quality testing
for spoilage detection and adulteration of milk were reviewed and critically
analysed. In this section, the current state of the art of microwave sensors is
briefly discussed.
Microwave sensors have been used for a wide variety of applications and based
on their application, they are mainly categorised into two groups. One group is for
applications related to distance, movement or shape measurement comprising of
radiometer, topographic or radar sensors (Alhajeri, 2010). The second and the
largest group of applications, which is also related to this research work, is of the
sensors like microwave resonance cavity, waveguides and transmission or
reflection sensors, aimed at the measurement of material properties, specifically
those of liquids and gases flowing through or held within them (Nyfors, 2000).
Figure 3.3 shows the frequency band particularly used for various applications of
microwave based studies. International Telecommunication Union (ITU) defines
the microwave band of frequencies that varies between 300 MHz to 300 GHz.
From this broad range of spectrum, the microwave sensing applications take
place between a few megahertz [MHz] to tens of gigahertz [GHz], in which part
of the electromagnetic wave spectrum, the most wireless telecommunication
devices are also accommodated (Mehdizadeh, 2015c).
These sensors are basically converters of electrical signals to electromagnetic
fields, or vice versa and the whole microwave sensing system comprises of the
sensor, the material being interrogated or processed with the field that is imposed
on it and the electrical signal or power. When the material is being interrogated,
the device is called a “probe” or a “sensor” and when significant energy is
imparted to the material, it is called an “applicator” (Mehdizadeh, 2015b).

Chapter 3 • EM Waves and Microwave Sensors
Keyur H. Joshi 48
Following are the various types of microwave sensors in sensing applications
currently. The microwave sensors discussed below are near-field, which means,
having the distances between the resonator and the material (under test) smaller
as compared with the wavelength of microwaves.
3.5.1 Waveguides
A waveguide is a hollow metallic structure that guides microwaves (or other wave
types such as sound), with the aim of minimal loss of energy by restricting wave
expansion to one to two dimensions. A waveguide has propagation modes which
is one solution of the wave equations, or, in other words, the form of the wave
(Emerson, 2002). Because of the constraints of the boundary conditions, there
are only limited frequencies and forms for the wave function, which can propagate
in the waveguide.
The lowest frequency in which a certain mode can propagate through the
waveguide is referred to as the cut-off frequency of that mode. In addition, the
mode with the lowest cut-off frequency is identified as the fundamental mode of
the given waveguide, and that lowest cut-off frequency becomes the waveguide
cut-off frequency.
Figure 3.3 Range of frequencies for Microwave Applications
(Source: Mehdizadeh, 2015c)

Chapter 3 • EM Waves and Microwave Sensors
Keyur H. Joshi 49
Figure 3.4 shows a standard small size rectangular shape microwave waveguide.
There are several other forms of waveguide being used and tested in various
fields too.
Propagation modes are calculated by solving a formula called Helmholtz equation
along with a set of boundary conditions based up on the geometrical shape and
wall materials bounding the region. Eq. (3.5) and Eq. (3.6) are the forms of the
Helmholtz equation where the operator (2ߜ), is called Laplacian.
These types of microwave devices are used for guided wave measurements of
dielectric property tests of material, which are normally placed inside the
waveguide and spectral signatures recorded for further analysis of the data.
3.5.2 Cavity Resonators
Microwave cavities are available in several shapes and forms. Generally, they
are nothing but voids mainly enclosed by high-conductivity metal walls. The
stimulus frequency when coupled into the microwave cavity will set up standing
waves only if the stimulus frequency matches one of the natural resonant
frequencies of the cavity as shown in Figure 3.5, (Mehdizadeh, 2015a).
This phenomenon is similar to the propagation modes as discussed in the case
of microwave waveguides in section 3.5.1.
Figure 3.4 A small Rectangular Waveguide
The ‘image’ originally presented here cannot be made freely available via LJMU E-
Theses Collection because of 'copyright'. The image was sourced from:
[flann.com. Available at:
https://flann.com/wp-content/uploads/2015/10/16441-WG-ST-2.jpg].
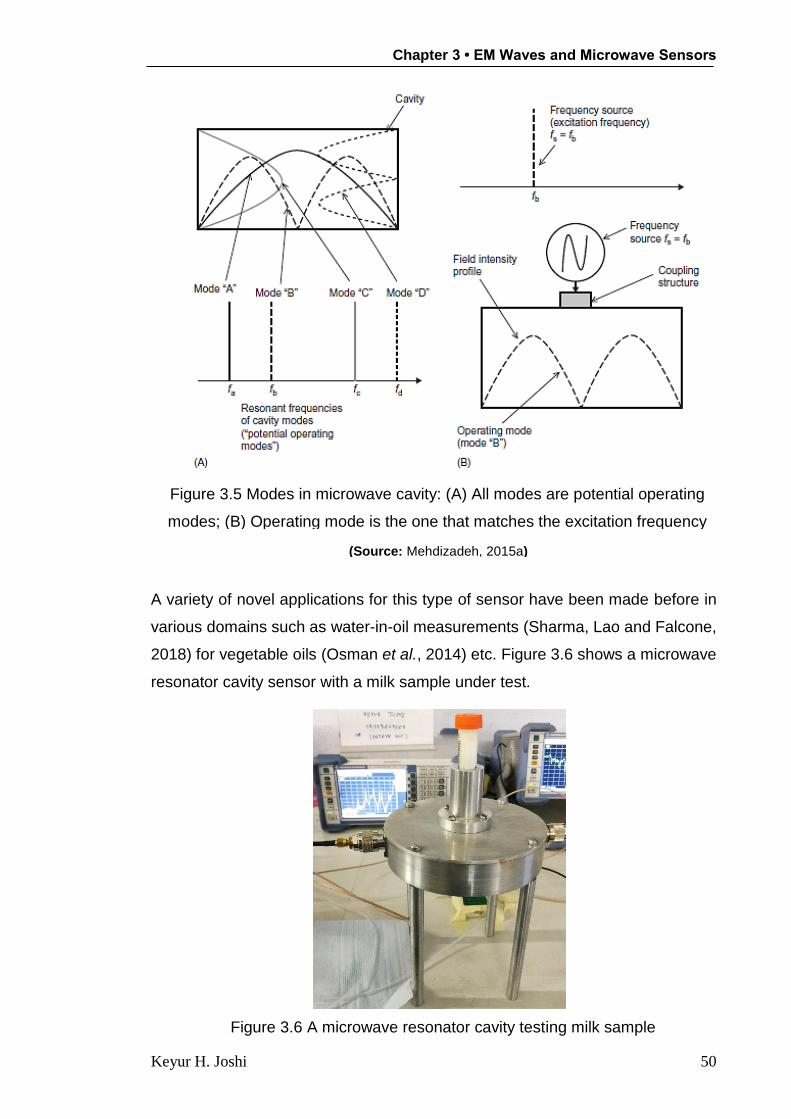
Chapter 3 • EM Waves and Microwave Sensors
Keyur H. Joshi 50
A variety of novel applications for this type of sensor have been made before in
various domains such as water-in-oil measurements (Sharma, Lao and Falcone,
2018) for vegetable oils (Osman et al., 2014) etc. Figure 3.6 shows a microwave
resonator cavity sensor with a milk sample under test.
Figure 3.6 A microwave resonator cavity testing milk sample
Figure 3.5 Modes in microwave cavity: (A) All modes are potential operating
modes; (B) Operating mode is the one that matches the excitation frequency
(Source: Mehdizadeh, 2015a)

Chapter 3 • EM Waves and Microwave Sensors
Keyur H. Joshi 51
3.5.3 Interdigitated Electrodes (IDEs)
These types of sensors offer several advantages, such as working with low
volumes of samples in an electrochemical sensing. The electrodes also known
as “fingers”, in this type of configuration, typically enhance sensitivity and
detection limits by allowing a small size planar sensor device effectively of up to
1 to 2 cm size in width and length and a few mm in thickness.
Interdigitated structures are typically used for capacitive transduction; the
interdigitated electrodes effectively improve the overall capacitance of the device.
When exposed to the sensing material under test such as milk, there is some
change expected in the capacitance of the planar IDE sensor, which is eventually
recorded in resonance frequency changes as the C of the IDE structure changes.
These types of sensor only allow access from one end, i.e., 1-port configuration,
which is particularly useful when the access to a material under test (MUT) is
limited or the other side should be open to the ambient (Rivadeneyra et al., 2016).
Figure 3.7 shows an IDE sensor with Gold coated electrodes (fingers) and fitted
“well” to contain samples of up to 500µl size for invasive sensing and detection.
It has several applications including surface notch-type damage detection in
metals (Li et al., 2018), and in healthcare monitoring for detection of specific
biomarkers in human cerebrospinal fluid (Fok et al., 2015) as further explained in
sub-section 4.4.2, under microwave sensor design.
Figure 3.7 An IDE Sensor with 9x9 interdigitated electrodes fitted with well

Chapter 3 • EM Waves and Microwave Sensors
Keyur H. Joshi 52
3.5.4 Planar Resonators
Planar resonators are widely used in applications where portability and low-profile
characteristics are a requirement for compact overall size in limited
space. Several applications of these types of sensors have been made in the past
in various domains and they are available in several forms such as split ring
resonators (Choi et al., 2015; Mohd Bahar et al., 2017), microstrip-resonator
(Zarifi, Thundat and Daneshmand, 2015), hairpin resonators (Huang, Liu and
Chen, 2017; Liu et al., 2018) and many other forms.
Figure 3.8 shows a Microwave Planar Sensor based on Bridge Multiple Split Ring
Resonator Topology (BMSRRT) based planar hairpin resonator, which behaves
as a fluidic sensor (Mohd Bahar et al., 2017).
3.5.5 Comparison of Microwave Measurement Methods
Table 3.1 A simple comparison for microwave measurement techniques
Figure 3.8 A 2-port Microstrip Planar Resonator Sensor
(© 2017 IEEE. Reprinted, with permission, from Mohd Bahar, A. A. et al., High-efficiency
microwave planar resonator sensor based on bridge split ring topology, IEEE Microwave and
Wireless Components Letters, June 2017)
The ‘table’ originally presented here cannot be made freely available via LJMU E-
Theses Collection because of 'copyright'. The table was sourced table 1.1 from:
[Li, X. and Jiang, Y. (2010) Design of a Cylindrical Cavity Resonator for
Measurements of Electrical Properties of Dielectric Materials, radio center Glave
university. Gavle University. Available at:
http://urn.kb.se/resolve?urn=urn:nbn:se:hig:diva-7687].

Chapter 3 • EM Waves and Microwave Sensors
Keyur H. Joshi 53
Table 3.1 is the brief comparison of standard dielectric and magnetic
measurement techniques based on microwave sensing, as given by Li and Jiang,
(2010). As the table depicts, the capacitor method obtains complex dielectric
permittivity by measuring the change of capacitance and of conductance due to
the device with and without specimen. Transmission line method is simpler due
to not requiring any specific devices for the measurements but its sample
preparation is complicated, as it needs to be in an annular geometry or slab.
The cavity resonator methods generally takes the form of a cylinder and hence
the sample contained for the measurements is held in test-tube of a predefined
size and shape depending upon the structure of cavity in use. The open
resonator methods are available in the form of hemispherical or spherical
resonators to test thin film materials. Whereas, the free space methods use two
antennas for transmission and reception when the material under test is left on a
fixed slab normally.
From the observations made above and the techniques reviewed, the design
considerations for this project are explained, in section 3.6. The considerations
are made based on the currently used sensor types to choose a suitable
microwave sensor design, to enable real-time milk quality testing attempting to
resolve the limitation of existing standards by highlighting the key areas where
further development can take place.
3.6 Sensor Design Considerations: For Milk Quality Monitoring
3.6.1 Primary Design Considerations
Before commencing the sensor designing part for microwave sensing application
in milk quality monitoring, it was essential that a specific set of design
considerations be laid out to address the requirement of the project as well as to
satisfy the need of industry. Here, in this section all the design parameters are
discussed to enable microwave sensor design. The sensor design constraints
included the criteria to eliminate the limitations of currently existing techniques as
previously discussed in Chapter 2.

Chapter 3 • EM Waves and Microwave Sensors
Keyur H. Joshi 54
The microwave sensor system should be low profile, i.e. portable and compact
with lightweight and dimensions no more than few cm sizes in length and width,
and hence not limited to industrial setup. Furthermore, it should be non-
destructive and non-invasive in application, eliminating the requirement of several
stages of preparing reagents and adding them to actual milk product under test,
unlike other traditional methods, making it resource-efficient technique.
Therefore, the microwave sensor technology can also be accessible outside the
laboratory premises by avoiding involvement of hazardous chemicals.
Additionally, the final sensor design should be low-cost as compared to other
existing techniques while enabling rapid measurements making it applicable for
a time-efficient quality monitoring system.
3.6.2 Identifying the Frequencies of Interest
Based on above primary considerations, as explained in section 3.5, from a broad
range of frequencies between a few megahertz [MHz] to tens of gigahertz [GHz]
where the microwave sensing applications are housed, frequencies of interest for
this project were narrowed down and identified between approximately 2 GHz up
to 8 GHz.
This consideration was made to eliminate lower end frequencies to minimise any
possible low frequency, low power noise signals considering several
telecommunication applications already taking place in lower frequencies than
this.
Moreover, it was important to accommodate two key Industrial, Scientific and
Medical (ISM) bands defined, at 2.400 - 2.500 GHz and 5.725 - 5.875 GHz, by
ITU as “Operation of equipment or appliances designed to generate and use local
radio frequency energy for industrial, scientific, medical, domestic or similar
purposes, excluding applications in the field of telecommunications” (International
Telecommunication Union, 2016).
This was chosen particularly due to the possibility of extending this scientific work
to an industry oriented sensor system. The ISM bands are defined by the ITU
Radio Regulations No. 5.138, 5.150, and 5.280, following world radio
conferences.

Chapter 3 • EM Waves and Microwave Sensors
Keyur H. Joshi 55
3.7 Summary
To develop an overall quality testing system for packaged milk types, working
principle and advantages of EM wave sensing techniques were investigated along
the study of various near-field microwave sensors. Based on the observations
made from literature and current state-of-the-art, design constraints for the
proposed microwave sensor system were established in this chapter.
The primary focus of milk quality monitoring was established on overall
comparative measures of composition, spoilage detection and contamination
check, which represent the qualitative measures of the milk and not specifically the
quantitative measurements; as there are rigorous procedures, already available,
for industrial use for exact quantifiable composition check for milk such as, for
example, Chromatography techniques.
The following chapter explains dielectric property of milk and addresses the
designing of available microwave sensors, namely resonator cavity and IDE
sensor, with their simulations, and further development of a fluidic planar
resonator sensor to suit the design considerations made in this chapter.
It should be noted that waveguide mainly suitable for solid material property tests,
was not considered for the design, simulation and actual test measurements, and
instead the single probe analysis, for milk samples, was preferred.
Keyur H. Joshi 56
CHAPTER 4
DIELECTRIC PROPERTY OF COW MILK AND SENSOR DESIGN
4.1 Dielectric properties of cow milk
From the discussions made ahead, it is clear that the development of a new
technique, which can assess quality of cow milk using microwave spectroscopy,
could benefit from having the required understanding of dielectric properties of
such milk types. In the literature reviewed, it was found that the dielectric constants
for raw milk (with 100 % concentration of milk) and diluted milk (with 70 % milk
concentration to deionized water), both, decrease with increasing frequency.
This phenomenon was identified to occur more at the lower frequency range of 10–
4500 MHz but this decrement in values for dielectric constant for raw milk was
more rapid than in the case of diluted milk, at room temperature of 22 °C (Guo et
al., 2010). For raw milk, these values of decrement were 97.7, 68.1, and 65.9,
whereas for 70%, diluted, milk solution the same were 93.3, 70.9 and 69.1, at 10
MHz, 915 MHz, and 2450 MHz of frequencies, respectively. Another potential
indicator for predicting milk concentration, and freshness, is its dielectric loss factor.
The researchers further observed that because the adulteration of milk with water
dilutes the overall milk concentration, ionically, the loss factor tends to decrease
with the increased amount of water content, i.e. decreasing milk concentration.
Researchers in another similar work concluded that, for cow’s milk, its protein
content as well as the temperature of milk affect both the values of dielectric
constant and the loss factor. The frequency of electric field also influences these
two values. Within the range of 10–4500 MHz, the dielectric constant decreased
with increasing frequency (Zhu et al., 2015).
The value of dielectric loss factor increased with increasing temperature below
frequency values of around 600 MHz and decreased above 1000 MHz of frequency
values. A poor correlation was observed between the amount of protein content
and dielectric constant in the region of 100–600 MHz frequency values. Based on
these dielectric constant values, it meant that this frequency range was insufficient

Chapter 4 • Dielectric Property of Cow Milk and Sensor Design
Keyur H. Joshi 57
for being used to develop a milk protein detector. The dielectric property of milk
was determined and analysed for all three milk types, in this work as explained in
the section 4.2.
4.2 Measurement of Dielectric Property of Cow Milk
Materials can be classified according to their complex-valued dielectric
permittivity (ε), upon comparison of their real (ε′) and imaginary (ε′′) components.
To understand the dielectric property characteristics of milk the milk type, i.e.,
with respect to their fat components, dielectric property single probe tests were
carried out.
We use Eq. (3.3) and the fact that current density J (A/m2) is related to the
magnetic field by:
𝐽 = (𝜎 + 𝑗𝜔휀) (4.1)
The Eq. (4.1) shows that the imposition of an electric field into a material will
produce electrical currents, the amplitude and direction of which are proportional
to the electric field intensity. Two components of these currents are conductivity
σ in Siemens/m, which is frequency independent, and the second type of currents
which are generated by the imposition of an electric field into a material are due
to permittivity, represented by ε in Eq. (4.1) (Mehdizadeh, 2015c).
Permittivity itself is composed of real and imaginary components and is
represented in complex algebraic format as:
휀 = 휀′ − 𝑗휀′′ (4.2)
The real part of the complex permittivity 휀′ is responsible for phase shift of the
electric field, and the imaginary part 휀′′ is responsible for energy losses into the
material. The permittivity of dielectric materials can be expressed with that of free
space as:
휀′ = 휀0휀𝑟′ (4.3)
And 휀′′ = 휀0휀𝑟′′ (4.4)

Chapter 4 • Dielectric Property of Cow Milk and Sensor Design
Keyur H. Joshi 58
Where 휀𝑟′ and 휀𝑟
′′ are called relative permittivity and loss factor (dissipation factor
Df), respectively. Relative permittivity 휀𝑟′ is also known as dielectric constant
(Mehdizadeh, 2015c). The loss tangent, also known as power factor,
characterizes dielectric loss properties as:
tan 𝛿 = 𝜀𝑟
′′
𝜀𝑟′ (4.5)
Table 4.1 shows how the ratio of these two values is used to determine the
dielectric property of the material under test (Chen, 2017).
Table 4.1 General Classification of Materials based on Permittivity
4.2.1 Sample Preparation
Three commercially purchased packaged milk comprised of cow milk in each
category – skimmed milk, semi-skimmed milk and whole milk were tested to
determine their dielectric parameters. Table 4.2 notes down the compositional
elements of each milk type that was considered for the test measurements using
coaxial probe analysis of dielectric property in terms of dielectric permittivity.
εr′′/εr′ Current
Conduction
Field
Propagation
0 - Perfect dielectric
lossless medium
≪ 1 Low-conductivity material;
Poor conductor
Low-loss medium;
Good dielectric
≈ 1 Lossy conducting material Lossy propagation
medium
≫ 1 High-conductivity material;
Good conductor
High-loss medium
poor dielectric
∞ Perfect conductor -

Chapter 4 • Dielectric Property of Cow Milk and Sensor Design
Keyur H. Joshi 59
Table 4.2 Milk compositional values for each milk type under test
Typical Values (per 100 ml)
Milk Categories
Skimmed milk
Semi-skimmed milk
Whole milk
Energy (kJ) 147 (35 kcal) 209 (50 kcal) 268 (64 kcal)
Fat (g) 0.1 1.8 3.6
Saturates (g) <0.1 1.1 2.3
Protein (g) 3.4 3.6 3.2
Carbohydrates (g) 5.0 4.8 4.7
Sugars (g) 5.0 4.8 4.7
Salt (g) 0.1 0.1 0.1
Calcium (mg) 124.0 124.0 120.0
The milk types were purchased from a high street supermarket for the longest
available expiry dates and were made into four samples each. The dielectric data
was measured every morning at approximately same time for Monday (Day-1),
Tuesday (Day-2), Wednesday (Day-3), Thursday (Day-4), Friday (Day-5) and
then the following Monday (Day-8), when the milk samples were spoiled.
4.2.2 Measurement Conditions
The dielectric permittivity was measured for each milk type between the
frequency values 2GHz to 8GHz. All milk types were measured.
Table 4.3 Measurement conditions for Dielectric Property test of Cow Milk types
Specifications Values
No. of Milk Types 3 Milk Types (Skim, Semi-skim, Whole) x 4 samples
Repetitions 4 times each (for 6 days)
Sample Size ≈ 250 ml (for coaxial probe)
Test Period 1 week (Day No.: 1, 2, 3, 4, 5, and 8)
Lab Temperature 13 °C ± 2 °C
Coaxial Probe SPEAG DAK 3.5
Frequency Sweep 2 GHz – 8 GHz
VNA / Step Size R&S® ZNB 20 100 kHz – 20 GHz / 5 MHz

Chapter 4 • Dielectric Property of Cow Milk and Sensor Design
Keyur H. Joshi 60
Table 4.3 lists measurement specifications and conditions observed during
dielectric property tests of milk. In the following sections, the experimental set-up
is shown followed by a discussion of results achieved.
4.2.3 Instrumentation and Procedure
Figure 4.1 shows the dielectric parameter, for three milk types, being tested using
Speag’s high precision single probe dielectric assessment kit (DAK) 3.5,
calibrated with deionised water, and by using R&S® ZVL Vector Network
Analyser.
4.2.4 Result and Discussion
Figure 4.2 illustrates the real component (ε′) plotted against the frequencies (f).
(a) (b)
Figure 4.1 (a) Dielectric Property Measurement DAK Kit,
(b) Dielectric Permittivity values for Skimmed, Semi-skimmed and Whole Milk
Samples

Chapter 4 • Dielectric Property of Cow Milk and Sensor Design
Keyur H. Joshi 61
We can see the clear distinction of permittivity values among all three types of
milk, due to varying fat contents. Skimmed milk with the least fat content has the
highest dielectric value whereas the whole milk samples show the least dielectric
value of the three types. The graphs here show the dielectric real component on
Day-1 of purchase for the three milk types. The test measurements were made
in a climate-controlled room with a minimum variation in temperature values.
The graph of relative permittivity vs. frequencies shows declining behaviour, i.e.
the relative permittivity values decrease with increase in frequencies. Moreover,
the results comply with the fact that the dielectric permittivity values are reducing
as we go along from skimmed milk through semi-skimmed milk to the whole milk,
with reductions in fat content; the deionised water has a higher dielectric constant
value than even skimmed milk, which equals to 80.10 at 20°C, indicating it is
polar.
Figure 4.3, shows the dielectric permittivity variations over an 8-day period for
skimmed milk. The figures on the right show temperatures in °C, which also affect
directly the results plotted in graphs. D1, D2 … D8 denote Day1, Day2 … Day8,
respectively. Note that the Day-8 graph result was a complete outlier, supporting
the fact that by eighth day of the tests milk samples had completely gone off, both
in visible inspection and by means of smelling odour.
Figure 4.2 Dielectric Permittivity vs. Frequency values for three Cow Milk types

Chapter 4 • Dielectric Property of Cow Milk and Sensor Design
Keyur H. Joshi 62
Figure 4.4 illustrates the similar graphs for semi-skimmed milk with the similar
trends of drop in the dielectric permittivity values with the rise in frequencies,
complimenting the results achieved in earlier research work as explained in section
4.1.
Figure 4.4 Dielectric Permittivity vs. Frequency values for Semi-skimmed milk
samples Day-1 to Day-8
Figure 4.3 Dielectric Permittivity vs. Frequency values for Skimmed milk
samples Day-1 to Day-8

Chapter 4 • Dielectric Property of Cow Milk and Sensor Design
Keyur H. Joshi 63
Numbers to the right of the graph show temperature in °C and D1 through D8
indicate days 1 through 8, respectively. Even in this case, Day-8 was an absolute
outlier as compared to other five days, for the same reason of milk samples having
gone off and completely spoiled at room temperature by the next week (i.e. Day-
8).
Figure 4.5 depicts the dielectric permittivity vs. frequency graph for third category
of milk product under test - the whole milk sample. Same depiction is made for
whole milk where numbers on the right show temperature in °C and D1 through D8
indicate Day1 through to Day8, respectively. Likewise other two milk types, the
trend looks similar and Day-8 is an obvious standing out measurement due to
spoilage at its peak of all eight days.
In all the cases, Day-8 was on the following Monday (Day-8) after starting the tests
on the previous Monday (Day-1) and clots were formed with separation of solids
from water.
Figure 4.5 Dielectric Permittivity vs. Frequency values for Whole milk samples
Day-1 to Day-8

Chapter 4 • Dielectric Property of Cow Milk and Sensor Design
Keyur H. Joshi 64
4.3 Resistance and Capacitance Analysis of Milk
Figure 4.6 and Figure 4.7 show the experimental set-up for Resistance and
Capacitance analysis of three types of milk samples using HAMEG instruments
LCR Bridge analysis circuit.
Figure 4.8, Figure 4.9 and Figure 4.10 show Resistance values for skimmed milk,
semi-skimmed milk and whole milk for 1-week period (5 days) in R (Ω) vs. f (Hz)
plots for days 1 to 5 respectively.
Figure 4.6 HAMEG instruments LCR bridge circuit setup
Figure 4.7 The probe inserted in the milk sample for LCR Analysis

Chapter 4 • Dielectric Property of Cow Milk and Sensor Design
Keyur H. Joshi 65
Observations made on the measurements results achieved shows that in all three
milk types, the values of corresponding electrical resistance of milk sample (size,
500µl) under test decreases with rise in the frequencies.
Figure 4.8 Resistance vs. Frequency values for Skimmed Milk (Day-1 to 5)
Figure 4.9 Resistance vs. Frequency Values for Semi-skimmed Milk
(Day-1 to 5)

Chapter 4 • Dielectric Property of Cow Milk and Sensor Design
Keyur H. Joshi 66
Figure 4.11 and Figure 4.12 on the other hand show direct comparison among
three milk types with respect to their Resistance and Capacitance values vs. the
frequency, respectively, on the Day-1 of observation period of the test week.
Figure 4.10 Resistance vs. Frequency values for Whole Milk (Day-1 to 5)
Figure 4.11 Resistance vs. Frequency for all three milk types (Day-1)

Chapter 4 • Dielectric Property of Cow Milk and Sensor Design
Keyur H. Joshi 67
The resistance values hold critical information more than that of the capacitance
values of milk. As can be seen, there is a clear separation of R-values with the
different milk types as well as the number of days passed.
4.4 Microwave Sensor Design
4.4.1 Microwave Resonator Cavity (Sensor A)
There are several parameters, which decide the accuracy of the results in
dielectric materials measurements. Q-factor is one of the most important factors
for estimating the quality of a resonator sensor, the higher the Q-factor means
the higher the accuracy and narrower the bandwidth. The Q-factor depends upon
many conditions such as the metal used for constructing the cavity resonator, the
filled material under examination (MUT), the coupling device (connectors and
impedance matching) and the transverse modes (Li and Jiang, 2010).
The resonance frequencies, in microwave cavity sensor, for TE mode and TM
mode equations for microwave cavity are given by Eq. (3.8) and Eq. (3.9),
respectively, (Wangler, Wangler and Wiley InterScience (Online service), 2008):
Figure 4.12 Capacitance vs. Frequency Values for all three Milk Types (Day-1)

Chapter 4 • Dielectric Property of Cow Milk and Sensor Design
Keyur H. Joshi 68
(3.8)
(3.9) Where, R and L are radius and length for a cylindrical cavity, respectively. Xmn
represents nth zero of mth Bessel function and X’mn represents nth zero of derivative
of mth Bessel function. µr and εr are relative permeability and relative permittivity
of the medium, respectively.
Figure 4.13 illustrates the HFSS simulation model for the microwave, resonator
cavity (sensor A) designed at LJMU (Goh et al., 2011), which can hold a test-tube
with sample, to employ for milk quality test.
Figure 4.13 HFSS Simulation Model for 2-port Microwave Resonator
Cavity Sensor

Chapter 4 • Dielectric Property of Cow Milk and Sensor Design
Keyur H. Joshi 69
Figure 4.14 demonstrates the simulation graph of S21 against frequency between
4 GHz to 8 GHz band, using HFSS, whereas Figure 4.15 illustrates the same
graph for the fabricated sensor hardware using the same values of runtime
frequencies, which is recorded by a vector network analyser and plotted
accordingly. The body of the sensor A is made up of aluminium metal, whereas
the radiating probes connected to two ports are manufactured using copper.
4.00 4.50 5.00 5.50 6.00 6.50 7.00 7.50 8.00Freq [GHz]
-100.00
-80.00
-60.00
-40.00
-20.00
0.00
dB
(S(p
2,p
1))
HFSSDesign1XY Plot 1
Curve Info
dB(S(p2,p1))Setup2 : Sw eep1
Figure 4.14 HFSS simulation: S21 vs. Frequency plot for the microwave
cavity sensor
Figure 4.15 S21 vs. Frequency plot for the fabricated microwave
Cavity Sensor

Chapter 4 • Dielectric Property of Cow Milk and Sensor Design
Keyur H. Joshi 70
The variation in the simulated results as compared to the manufactured sensor
result appear due to possibility of variations in manufactured dimensions
differences to that of simulated sensor A. Furthermore, the change in connector
types and/or dimensions could result in change of corresponding results with
measurement results in real-world microwave sensor.
4.4.2 Inter-Digitated Electrodes (Sensor B)
Interdigitated Electrodes (IDEs) are mainly designed as filters (Singh, Soni and
Nirmal, 2018) or antenna designs (Wahba, Abdalla and Allam, 2016) that are
compact in size and light in weight. Particularly due to extraordinary feature of the
IDEs; the microstrip-line-excited IDE exhibits band-stop characteristics,
essentially, working as a near-field, sensitive, sensor surface probes. Moreover,
the IDE probe has are simple in structure, easy to operate, and multifunctional
with a low fabrication cost (Li et al., 2018). In recent times, IDEs are also being
widely used as sensors to monitor changes in dielectric properties of materials
under test (MUT) (Bao et al., 2018) and gas sensors (Alcantara and Andrade,
2016), or even for the surface defect detection in metallic materials (Abdullah et
al., 2014).
The IDE sensors possess high enough sensitivity to distinguish the variation
within closed regions. The minimum transmission coefficient frequency is
dependent on the resonance frequency of the IDE design. Therefore, in an IDE
microstrip band-stop filter, the resulting shift in the minimum transmission
frequency shows that the IDE filter can be employed for dielectric characteristics
test of the MUT, i.e. milk sample in this case. This phenomenon is further
highlighted in milk type quality test results using IDE sensors in Chapter 6, using
three different milk categories, namely skimmed, semi-skimmed, and whole milk.
The frequency, bandwidth, and time response of the IDE are variables that can
be controlled by the number of finger electrode pairs in both the sensor probes
on surface, the distance between the generating and receiving sensor probes,
the overlap region of the fingers, and the width and spacing of adjacent fingers
(Hickernell, 1998). The velocity of these waves depends on the dielectric and
mechanical properties of the MUT. The phase shift (Φ) of the sensor signal is
given by Eq. (3.10) (Mamishev et al., 2004):

Chapter 4 • Dielectric Property of Cow Milk and Sensor Design
Keyur H. Joshi 71
Φ = ω𝐿
𝑣 (3.10)
Where 𝑣 is the wave speed, ω is the frequency of excitation, and 𝐿 is the length
of the transducer, when IDEs are used to build the Surface Acoustic Wave (SAW)
device. The main principle of sensing for IDE capacitive sensors is based on the
change of the dielectric constant of the interdigitated surface capacitor. Here, the
change of the capacitance occurs when the properties of the dielectric of the
material between the plates changes. The capacitance of the IDE sensor is stated
in Eq. (3.11) (Mazlan et al., 2017):
𝐶𝑆𝑒𝑛𝑠𝑜𝑟 = ηε 𝑙𝑡
𝑑 (3.11)
where η is the number of electrodes, ε is the dielectric permittivity of the sensitive
coating film, l is the length of IDEs, t is the thickness of IDEs and d is the distance
between the electrodes.
Figure 4.16 depicts the HFSS simulation model of the IDE (sensor B) designed
at LJMU (Blakey et al., 2012; Korostynska, Mason and Al-Shamma’A, 2012).
Figure 4.16 HFSS Simulation Model for 1-port Microwave IDE

Chapter 4 • Dielectric Property of Cow Milk and Sensor Design
Keyur H. Joshi 72
The sensor B used here carried 3 pairs of electrodes cross-coupled against each
other as can be seen from the figure above. The Gold plated electrodes were
particularly used to achieve higher conductivity as well as protection for the
probes against corrosive liquids under test, when they directly are exposed to
them due to being invasive technique of material property testing. Figure 4.17
illustrates the simulated results of the sensor B using HFSS modelling tool.
Figure 4.18 illustrates S11 vs. Frequencies plot for the fabricated sensor B, with
three distinctive resonant frequencies.
Figure 4.17 HFSS Model Simulation S11 vs. Frequency Plot for the IDE Sensor
Figure 4.18 S11 vs. Frequency Plot for the Fabricated Sensor B

Chapter 4 • Dielectric Property of Cow Milk and Sensor Design
Keyur H. Joshi 73
4.4.3 Microwave Fluidic Planar Resonator (Sensor C)
These types of planar resonator sensors behave as band-pass filters, which allow
a wideband of frequency to pass based on its design constraints. Rising demand
for mobile and radio tele-communication has caused a significant lack of
frequency resources lower than 1 GHz (Sagawa, Takahashi and Makimoto,
1989). This surge in wireless communication and mobile application paved a way
for higher frequency band applications. The cross-coupled filters, such as the
ones utilised in the hairpin resonator design, are particularly of interest as they
exhibit ripples in both passband and stopband, which has been reported to
improve both on frequency selectivity and in band-pass loss (Hong and
Lancaster, 1998).
In addition, the microwave spectroscopy allows for a non-invasive and non-
destructive way of sensing the material under test, meaning that the samples
need not be destroyed or spoiled with adding reagents from their normal use or
consumption. This sensing technology is relatively cheap compared with other
expensive techniques discussed in the previous chapter and planar sensors such
as this one can cost well under £400 overall.
Figure 4.19 HFSS Simulation of Fluidic Sensor (Hairpin Resonator)

Chapter 4 • Dielectric Property of Cow Milk and Sensor Design
Keyur H. Joshi 74
Figure 4.19 shows the HFSS simulation model screenshot of modified hairpin
resonator (sensor C, © 2017 IEEE. Reprinted, with permission, from Joshi, K. H. et al.,
Detection of Heparin Level in Blood Using Electromagnetic Wave Spectroscopy, Ninth
International Conference on Developments in eSystems Engineering, Sep 2016). Researchers
Liu et al. (2018) have used similar hairpin resonators for microfluidic sensing of
NaCl concentrations with Rogers as its dielectric substrate. In this research, the
substrate used for fabrication of the resonator sensor was made up of standard
Reinforced Fibre (FR4-epoxy) material, which is easily available and relatively
cheaper compared to other dielectric material types.
The primary advantage of these sensors is that they have universal applications
unlike dedicated sensors (e.g. not specific to bacteria/lipid/protein type but
instead aim to detect overall spoilage). These sensors also have better accuracy
and omit the tedious stage of reagents preparation, saving time and resources.
Figure 4.20 gives simulation results of the fluidic sensor for S21 vs. frequency plot.
and Figure 4.21 shows the same graph corresponding to actual fabricated
sensor. The variations in simulation results and actual fabricated sensor is due to
several factors like, type of ports used, differences between actual materials used
for fabrication vs. the materials used in simulation package etc.
These types of sensors behave mainly as large band-pass filters allowing broad
range of frequencies in sensing and detection tests.
Figure 4.20 Simulation Results of Hairpin Resonator Sensor

Chapter 4 • Dielectric Property of Cow Milk and Sensor Design
Keyur H. Joshi 75
The Printed Circuit Board (PCB) layout was prepared using EAGLE software from
Autodesk. The patch sensor was printed on the planar resonator surface, with
copper as conducting patch material and ground plane, whereas, reinforced fibre
epoxy (FR4) was used as the dielectric.
Figure 4.22 The Screen Printing EAGLE Board Layout of Hairpin
Resonator (all dimensions in mm)
Figure 4.21 S21 vs. Frequency plot for the fabricated planar Hairpin Resonator
Sensor

Chapter 4 • Dielectric Property of Cow Milk and Sensor Design
Keyur H. Joshi 76
The designing parameters in terms of Autodesk EAGLE board dimensions of the
fabricated resonator sensor are depicted in Figure 4.22 as screenshot of the
board design. Figure 4.23 shows the sensor C after fabrication with 2-ports planar
structure and applicable to fluidic sensing systems where samples can be carried
through a tube.
4.5 Methodology involving Microwave Sensors
The three major categories of milk, commercially sold, in the market whole, semi-
skimmed and skimmed milk were tested. The measurement set-up uses a Rhode
& Schwarz Vector Network Analyser (VNA), which was connected with the
microwave sensors to record the spectral signatures in terms of scattering
parameters.
For all these three categories, the spoilage process of milk was examined with
the help of a microwave sensor A and sensor B, as microwave sensing devices,
to establish generic characteristics of the system. Then a fluidic sensor (sensor
C) design was developed and optimised to examine milk when the sample is
carried through the planar resonator via a polyethylene tube using a peristaltic
pump (see Figure 4.24).
Figure 4.23 The Fabricated Planar Hairpin Resonator Fluidic Sensor

Chapter 4 • Dielectric Property of Cow Milk and Sensor Design
Keyur H. Joshi 77
This comprised the detection and analysis of spectral signatures for S11 and S21
parameters, connectively known as scattering parameters, which are the
measures of reflected back energy (power) towards the input Port-1 and
transferred energy (power) towards the input Port-2, respectively, in the EM wave
sensor assembly.
4.6 Summary
Here, the dielectric property of each milk type was achieved using the single coaxial
probe analysis method and the three milk types were clearly distinguished from
one another. Also, it was proven that the test results complimented the conclusions
derived by other researchers in the past by showcasing that the dielectric
parametric values were decreasing with respect to frequency values and with
regards to the fat content.
RC analysis of each milk type was also carried out and differences studied and
explained with respect to Resistance and Capacitance values of each milk type
under consideration, i.e. skimmed milk, semi-skimmed milk and whole milk.
Figure 4.24 Experimental set-up for milk quality analysis using fluidic sensor

Chapter 4 • Dielectric Property of Cow Milk and Sensor Design
Keyur H. Joshi 78
The three different sensor types were simulated and studied using simulation as
well as fabricated results. Chapter 5 explains the use of a novel methodology to
detect the spoilage in milk, over a period of time, using EM wave sensing of milk.

Keyur H. Joshi 79
CHAPTER 5
DETECTING SPOILAGE IN MILK SAMPLES
5.1 Background
Milk is a perishable product and spoils quicker than other food items if not stored
in favourable conditions such as ideal temperatures. All milk lasts 5-7 days past
its printed date if refrigerated, once opened (Eat By Date, 2018). Its nature of
having lower acidity and higher nutrients makes it a very suitable breeding
platform for bacterial microorganisms known as pathogens, which are
responsible for food poisoning. Bacteria contaminate the milk and milk processing
is mainly done to destroy them, which enables milk preservation. The milk
preservation is achieved by various procedures of heating, cooling, fermentation,
removal of water, and concentration or separation of various components from
milk to produce foods like cheese and butter (Fellows and Hampton, 1992).
Spoilage detection techniques play an important role in improving the milk
preservation methods. Milk spoilage could be defined in several ways with its
measure being different each time based on the context it is discussed in, e.g.,
for a common buyer, the simplest definition, of a quality product would be, a
product that smells as well as tastes good (Murphy, 2009). Adulteration check
has also been one of the sustained interests in the milk quality control process,
considering the ambiguity of “Use by Date” and its relevance to the actual
spoilage of the milk as this vagueness can trouble both the consumers and the
manufacturers. Buyers mostly avoid purchasing products that are close to their
dates of expiry. This eventually imposes a negative financial impact on the entire
dairy industry (Lu et al., 2013). Hence, there is an ongoing need for an accurate
spoilage detection technique in milk as much as there is a growing demand for
prevention of the wastage of milk and the illnesses occurring due to the
consumption of deteriorated milk.
Several criteria for the spoilage of milk were observed and discussed including
bacterial growth within the skimmed and whole milk types (Deeth et al., 2002) and
it was observed that the bacterial growth patterns in the skimmed milk did not
significantly differ from those of the whole milk.

Chapter 5 • Detecting Spoilage In Milk Samples
Keyur H. Joshi 80
Additionally, it was also confirmed by their study that the spoilage bacteria in milk
grow at similar rates, in skimmed milk as well as whole milk, but both types have
different metabolic behaviours. This complements the results achieved in this work
as explained in this chapter along with that of the other researchers who observed
similar rates of growth in skimmed and whole milk types (Janzen, Bishop and
Bodine, 1982)(Brown, Ranjith and Prentice, 1984)(Chandler, Ng and Hull, 1990).
These findings infer a common conclusion that the different shelf lives of skimmed
and whole milk types are not characterised by different bacterial growth rates within
them.
5.2 Methodology and Measurements
This section, explains the procedures adopted to carry out the milk quality
sensing, in terms of spoilage detection, using existing simple resonator cavity
(sensor A) and Inter-digitated Electrodes sensor (sensor B) designs, in order to
develop an idea of responses for each of them.
5.2.1 Sample Preparation
Table 5.1 The nutritional components of the three milk types under test
Typical Values
(per 100 ml)
Milk Categories
Skimmed milk
Semi-skimmed milk
Whole milk
Energy (kJ) 147 (35 kcal) 209 (50 kcal) 268 (64 kcal)
Fat (g) 0.1 1.8 3.6
Saturates (g) <0.1 1.1 2.3
Fibre (g) 0.0 0.0 0.0
Protein (g) 3.4 3.6 3.2
Carbohydrates (g) 5.0 4.8 4.7
Sugars (g) 5.0 4.8 4.7
Calcium (mg) 124.0 124.0 120.0
Table 5.1 lists the nutritional content of the three milk types used for making the
test samples. These three milk types were purchased from the market, at Tesco
superstore. Three milk-types; skimmed, semi-skimmed and whole milk were used

Chapter 5 • Detecting Spoilage In Milk Samples
Keyur H. Joshi 81
to make five samples from each using 15 ml size polypropylene plastic test-tubes
(Joshi et al., 2015). The sample making was done at room temperature and the
storage was governed by temperature controlled climate with minimum variations
as shown in Figure 5.1 and Table 5.2.
For the better reliability of the captured spectral data from EM wave sensor, 5
repetitions for each of the 5 samples for all 3 categories of milk, were made, giving
eventually 75 total iterations to be mathematically analysed. The test-tubes were
labelled as R-1, R-2, ... , R-5 for skimmed milk, G-1, G-2, … , G-5 for semi-
skimmed milk and B-1, B-2, ... , B-5 for whole-milk as they are colour-coded as
Red-Top, Green-Top and Blue-Top, respectively, in the commercial market
(Figure 5.1). One extra test-tube was dedicated to detect any variations with a
digital thermometer probe inside to ensure steady temperature conditions in the
lab. Test tubes with deionised water and air were also tested to see sensor
response.
5.2.2 Sensor A: Measurement conditions
For the spoilage detection tests using the microwave resonator cavity (sensor A),
a slot that can hold the 15 ml test-tube carrying milk samples, was provided as
shown in Figure 5.2. This 2-port resonator sensor A was calibrated with the
R&S®ZVA vector network analyser to enable accurate measurements of data in
terms of scattering parameters, to demonstrate the effectiveness of the proposed
method.
Figure 5.1 Sample preparation: milk spoilage detection using EM wave sensors

Chapter 5 • Detecting Spoilage In Milk Samples
Keyur H. Joshi 82
For the measurements a 2-port sensor A was used along with network analyser,
as shown in Figure 5.2a. A laser beam thermometer was also used with the digital
probe thermometer to ensure stable temperature conditions before, during and
after the measurements (see Figure 5.2b, © 2015 IEEE. Reprinted, with permission, from
Joshi, K. H. et al., Online monitoring of milk quality using electromagnetic wave sensors, Ninth
International Conference on Sensing Technology, Dec 2015). Through Open Short Match
(TOSM), 2-port calibration was used. Table 5.2 depicts the test measurement
conditions with sample storage specifications.
Table 5.2 Measurement specifications for resonator cavity (sensor A): Spoilage
Detection
Specifications Values
No. of Measurements
3 Types × 5 Samples × 5 Repetitions = 75 Iterations
Sample Size 15 ml (Polypropylene Test Tubes)
Supervision Period 1 week
Temperature Variations
22 °C ± 2 °C
Resonator cavity specifications
Diameter Φ = 130 mm (distance between ports) Height h = 20 mm (height of cavity)
Frequency Sweep
0.01 GHz – 15 GHz (10 KHz Measurement Bandwidth)
Channel Specifications
TOSM calibration / 0 dBm Base Power
(a) (b)
Figure 5.2 Spoilage detection using EM wave cavity sensor
(a) Milk sample under test, (b) Temperature controlled measurement room

Chapter 5 • Detecting Spoilage In Milk Samples
Keyur H. Joshi 83
Although the sensors are designed at a certain frequency, a wide range of
frequency sweep from 10 MHz – 15 GHz was applied in order to identify the
frequency region of interest giving best results. This also allowed more spectral
data to be captured for comparison before further data analysis within the ultra-
wide band of frequency, ultimately giving better results. The distinguishing
frequencies were identified for the detection of spoilage for all three types of milk,
and its comparison with the previous day’s measurements to the following days
over a one-week period.
The same procedure was carried out for all milk types, to enable their
classification based on composition when they are fresh as explained in Chapter
6 as well as in the case of determining adulteration as investigated in Chapter 7.
S11 and S21 both scattering parameters were plotted, with 0dBm channel base
power.
5.2.3 Sensor B: Measurement conditions
For these 1-port microwave devices, the only scattering parameter under
consideration is S11, which is recorded with the help of a network analyser. Here
also the climate control was maintained at room temperature. 1-port calibration
was made to calibrate the sensor with the channel.
(a) (b)
Figure 5.3 Spoilage detection of milk: (a) Measurement setup,
(b) Sensor B

Chapter 5 • Detecting Spoilage In Milk Samples
Keyur H. Joshi 84
Table 5.3 Measurement specifications for sensor B: Spoilage Detection
Specifications Values
No. of Measurements 3 Types × 5 Samples × 5 Repetitions =
75 Iterations
Sample Size 500 µl (using pipette; held into well)
Supervision Period 5 days
Temperature Variations 21 °C ± 2 °C
Sensor B Specifications
Height of Substrate h1 = 1.57 mm
Height of Substrate h2 = 1.57 mm
(Standard FR4 epoxy)
Materials Used Electrodes and Ground Plane – Gold plating
Dielectric Substrate – FR4 epoxy
Frequency Sweep 0.01 GHz – 15 GHz
(10 KHz Measurement Bandwidth)
Channel Specifications 1-port calibration / 10 dBm Base Power
Table 5.3 lists the test measurement specifications for sensor B employed. The
electrodes were given gold plating for protection against corrosion due to being
in direct contacts with fluids. The well boundaries were designed to hold the liquid
milk sample of up to 0.5 ml volume. For this case also, the samples were stored
under the same room temperature ensuring minimum variations for a week’s
period. Each following day, after the first starting day, the samples were agitated
(shaken) manually and also using a vertex vibrator for approximately one minute
to mix up any separated milk clots comprising proteins and other nutritional
constituents from the other water soluble contents, due to increasing bacteria
adulteration or spoilage, as shown in Figure 5.4.
It is important to note that the same approach was not followed, for the sensor A,
as the sample size was 15 ml test-tube itself being inserted into the resonator
cavity, rather than 0.5 ml of sample taken using pipette (see Figure 5.2a).
Whereas in the case of sensor B, if the bacteria adulterated, spoiled sample (over
the observation period) is not mixed then the measured value could
be as a result of separated water soluble content only, which is being able to

Chapter 5 • Detecting Spoilage In Milk Samples
Keyur H. Joshi 85
make its way to the small opening of the pipette tip. The formed clots would not
be able to penetrate through the same.
In addition, the observation period was kept to 5 days in these tests in place of 7
days due to even the vertex mixer and manual shaking not being able to fully
dissolve the separated milk solids with liquid content from the fifth day onwards.
Similar approach was taken for sensor type C later on as for sensors A and B.
5.3 Results and Discussion
5.3.1 Using Sensor A
As shown in Figure 5.5 for skimmed milk, there is a clearly visible distinction
between the curves for S21 plot against frequency values for Day-1 and Day-7.
The graph shows the aggregate values of the average of all five repetitions for
each of the five milk samples for a given category.
Figure 5.4 Milk samples being agitated with vertex mixer

Chapter 5 • Detecting Spoilage In Milk Samples
Keyur H. Joshi 86
Similarly, Figure 5.6 and Figure 5.7 show the graphs for semi-skimmed and
skimmed milk, respectively.
Figure 5.5 S21 for Day-1(Red) and Day-7(Grey) Skimmed milk using Cavity Sensor
Figure 5.6 S21 for Day-1(Green) and Day-7(Grey) Semi-skimmed milk using
Cavity Sensor

Chapter 5 • Detecting Spoilage In Milk Samples
Keyur H. Joshi 87
These plots are identical with minor shifts for all three given types of milk and give
effective results to distinguish between the aged and fresh milk samples. All milk
types gave the response centred at around 4.3 GHz frequency, as can be viewed
from the three figures.
5.3.2 Using Sensor B
Using the sensor B for spoilage detection gave a different response, for the same
frequency band, the spoilage was seen in terms of frequency shifts rather
than the amplitude shifts.
Figure 5.8 shows graph of reflection coefficient (S11) in dB vs. frequency in Hertz.
This sensor shows a characteristics frequency shift as the milk type changes
from, fresh to spoiled and due to the fact that spoiled milk has water separation
from milk solids.
Figure 5.7 S21 for Day-1(Blue) and Day-7(Grey) whole milk using cavity sensor

Chapter 5 • Detecting Spoilage In Milk Samples
Keyur H. Joshi 88
Similarly, Figure 5.9 and Figure 5.10 show graphs of reflected power (S11) vs.
frequency for semi-skimmed milk and whole milk using sensor B, respectively.
Figure 5.8 S11 for Day-1(Red) and Day-7(Grey) skimmed milk using IDE sensor
Figure 5.9 S11 for Day-1(Green) and Day-7(Grey) semi-skimmed milk using
Sensor B

Chapter 5 • Detecting Spoilage In Milk Samples
Keyur H. Joshi 89
In addition, with the increasing fat content the plots for the Day-7 spoiled milk can
be seen shifting towards the left of the centre frequency of about 5.5 GHz, as we
go from skimmed milk to whole milk, i.e. with increasing fat content. The visible
ripples in the Day-7spectra are present due to the separation of solids from water
liquids (clot formation) within the milk samples, despite the mixing stage added in
the lab procedure.
The sensor A is acting to detect bacteria adulteration and spoilage in terms of
amplitude shifts, whereas the sensor B does the detection by showing frequency
shifts, in each of the three categories of milk under test.
A wideband frequency sweep applied to the sensor A helped to identify the values
of frequency giving optimum results thereby allowing customization of the final
proposed design. Once having located the suitable frequency values, a dedicated
microwave sensor acting as a fluidic patch sensor, was designed to operate on
the same range of resonant frequencies for an optimized milk quality testing
system.
Figure 5.10 S11 for Day-1(Blue) and Day-7(Grey) whole milk using IDE sensor

Chapter 5 • Detecting Spoilage In Milk Samples
Keyur H. Joshi 90
5.3.3 Using Sensor C
Figure 5.11 and Figure 5.12 show Day-1 to Day-5 plots for S21 vs. Frequency
values for skimmed milk and semi-skimmed milk, respectively using the fluidic
sensor design.
Figure 5.11 S21 vs. Frequency Day-1 to Day-5 for Skimmed Milk
Figure 5.12 S21 vs. Frequency Day-1 to Day-5 for Semi-skimmed Milk

Chapter 5 • Detecting Spoilage In Milk Samples
Keyur H. Joshi 91
It should be noted that for each case of milk type the expected and optimum
results are seen at different frequency when we observe spoilage patterns
through these graphs. Figures 5.13 shows Day-1 to Day-5 plots for S21 vs.
Frequency values for whole milk. The optimum results are seen at around 4.65
GHz were there is decrease in the transmission coefficient values, this confirms
back to the fact that with spoilage there is water separation from milk solids and
hence the scattering parameter values tend to decrease towards the value of
deionised water scattering parameter values.
5.4 Summary
In this chapter experimental research work related to the spoilage of milk was
covered using all the three different types of microwave sensors that are included
in this project. Investigation was made for their individual responses and to check
their feasibility in design and development of a milk testing system that can
monitor and thereby help in maintenance of its quality in terms spoilage detection.
The biggest advantage of such microwave sensor system application is that the
measurement are not only rapid but also give reliable results complimenting with
Figure 5.13 S21 vs. Frequency Day-1 to Day-5 for Whole Milk

Chapter 5 • Detecting Spoilage In Milk Samples
Keyur H. Joshi 92
the expected trend and also confirming the fact that spoilage patterns in all milk
types is predominantly similar, regardless of the compositional changes such as
that in fat content.
Moreover, it should be noted that the IDE sensors are invasive in nature like most
other existing techniques of practice involved in milk quality determination
currently, whereas the hairpin resonator sensors do not require the sample
content to be contaminated by directly exposing them to the physical contact of
the sensor. Resonator cavities on the other hand takes a sample inside the test-
tube for test measurements.

Keyur H. Joshi 93
CHAPTER 6
CLASSIFYING MILK QUALITY BASED ON CONTENT
6.1 Introduction and Background
To design and develop a methodology with a system that can test the overall
quality of pasteurised and homogenised milk types, in terms of their nutritional
content values, it was important to understand the fundamental nature of the milk
categories under consideration. Therefore, the three commercially predominant
categories of milk, in the consumer market, namely — whole milk, skimmed milk
and semi-skimmed milk were reviewed along with their spoilage patterns.
The Dairy Council, UK, categorises these three milk types based on the amount
of fat content that they carry (The Dairy Council, 2016). Per 100 ml of given
volume, skimmed milk should not have fat content exceeding the 0.3 g, whereas,
whole milk should have a minimum of 3.5 g per 100 ml, and the semi-skimmed
milk, fat content within the range between 1.5 g and 1.8 g per 100 ml of product.
6.2 Methodology and Measurements
Keeping the above definition in mind as well as the fact that the milk products are
sold and labelled with reference to their fat content values, the primary goal of
this portion of the test measurements was to be able to distinguish and classify
each type of milk category on the basis of its fat component.
This section, explains the procedures adopted to carry out the milk quality
analysis, made in terms of content values, again with the use of the same
resonator cavity and Inter-digitated Electrode sensor designs, as in Chapter 5, to
develop an idea of responses for each of them.
6.2.1 Sample Preparation
The sample preparations for the sensor B were made using the same milk as the
previous measurements of spoilage (see Table 5.1); as there were no further data

Chapter 6 • Classifying Milk Quality Based on Content
Keyur H. Joshi 94
points needed due to evidently visible distinct results for all three categories of
milk samples based on their fat content.
However, in the case of the sensor A, the distinction was not quite evidently clear
over a large span of frequencies, and hence to ensure more accuracy in results,
it was necessary and equally important to have more data points for fat content
values than just three. Hence, for a reliable plot of fat contents versus frequency
value, another two categories were prepared by mixing two types of milk,
respectively, in ascending order of fat content values as shown in Table 6.1. That
is two more categories (total 5) of milk samples were derived by mixing 1:1 whole
milk with semi-skimmed milk and similarly, 1:1 sample of skimmed milk mixed
with the semi-skimmed milk.
Table 6.1 Two new milk categories derived by mixing milk types in ascending
order of their fat contents for sensor A measurements
a Content values for each additional category are ideally assumed to be average of the
corresponding values of both their constituents
Here the mixing of two categories of milk was done with volumetric sample
preparation, using pipettes to ensure 50% volumes of each milk type being added
together. The test-tubes were labelled as S1, S2,…, S5 for skimmed milk, SS1,
Typical Values
(per 100 ml)
Milk Categories a
Skimmed
Skimmed +
Semi-
skimmed
Semi-
skimmed
Semi-
skimmed +
Whole
Whole
Energy (kJ) 147
(35 kcal)
178
(42.5 kcal)
209
(50 kcal)
238.5
(57 kcal)
268
(64 kcal)
Fat (g) 0.1 0.95 1.8 2.7 3.6
Saturates (g) <0.1 <0.6 1.1 1.7 2.3
Fibre (g) 0.0 0.0 0.0 0.0 0.0
Protein (g) 3.4 3.5 3.6 3.4 3.2
Carbohydrates 5.0 4.9 4.8 4.75 4.7
Sugars 5.0 4.9 4.8 4.75 4.7
Calcium (mg) 124.0 124.0 124.0 122.0 120.0

Chapter 6 • Classifying Milk Quality Based on Content
Keyur H. Joshi 95
SS2,…, SS5 for semi-skimmed milk and W1, W2,…, W5 for whole milk, as
abbreviated, respectively. Similarly the extra two categories with (semi-skimmed
+ skimmed milk) solution and (semi-skimmed + whole milk) solutions were
labelled SSS1, SSS2, …, SSS5 and SSW1, SSW2, …, SSW5, respectively (see
Figure 6.1) (Joshi et al., 2017). Two more test tubes, one empty and one with
deionised water, were added for comparative analysis.
6.2.2 Measurement conditions
Measurement conditions for these tests incorporating both the sensors were the
same as cited in Table 5.2 and Table 5.3 for the sensor A and sensor B
respectively, due to the same conditions and sensors being used for this set of
test measurements. However, for the sensor A as explained in the previous
section, two more categories of milk were introduced to get reliably accurate
results as the spectral response in raw data was not showing clearly distinguished
results.
Hence, from Table 5.2 the following new Table 6.2 could be derived, for the
sensor A working to classify milk types based on their nutritional values, i.e. fat in
this case. The following section discusses the results achieved with both of these
sensors and gives gradation of milk samples based on their fat and protein
contents.
Figure 6.1 Sample preparation for milk quality measurement based on its
contents

Chapter 6 • Classifying Milk Quality Based on Content
Keyur H. Joshi 96
Table 6.2 Measurement specifications for resonator cavity (sensor A): Based on
contents
6.3 Results and Discussion
6.3.1 Using Sensor A
Figure 6.2, classifies among the 5 various types of milk made from 3 categories
of milk and labelled as S, SSS, SS, SSW and W, as explained earlier, based on
their fat content. The figure illustrates a scattering parameter graph for S21 versus
the fat content of the given milk sample. The linear regression with correlation
value, R2 = 98%, at the frequency value of 5.45986 GHz, was achieved. The
selection of this particular frequency was made based on the data analysis done,
and recorded spectral data looking for optimum results for correlation values as
well as good separation between each two successive data point.
Similarly, Figure 6.3 shows the scattering parameter S21 values plotted against
the protein content for the five milk categories. Here, unlike in the case of S21 vs.
fat content graph, the linear regression gives correlation of, R2 = 94.99% at
4.98968 GHz, which is due to relatively fewer variations in protein content as
compared to that of the fat content (Joshi et al., 2017). These results compliment
the previous findings by others as discussed in the dielectric properties of milk in
section 4.1, Chapter 4.
Specifications Values
No. of Measurements 5 Types × 5 Samples × 2 Repetitions =
50 Iterations
Sample Size 15 ml (Polypropylene Test Tubes)
Supervision Period 5 days
Temperature Variations 22 °C ± 2 °C
Resonator cavity
specifications
Diameter Φ = 130 mm
(distance between ports)
Height h = 20 mm (height of cavity)
Frequency Sweep 0.01 GHz – 15 GHz
(10 KHz Measurement Bandwidth)
Channel Specifications TOSM calibration / 0 dBm Base Power

Chapter 6 • Classifying Milk Quality Based on Content
Keyur H. Joshi 97
The numbers on the right, in Figure 6.2 and Figure 6.3 indicate the value of fat
content and protein content respectively per 100 ml of milk sample, respectively.
Figure 6.2 S21 vs. fat content graph using EM wave cavity sensor, at
f = 5.45986 GHz
Figure 6.3 S21 vs. protein content graph using EM wave cavity sensor, at
f = 4.98968 GHz

Chapter 6 • Classifying Milk Quality Based on Content
Keyur H. Joshi 98
6.3.2 Using sensor B
On the other hand, Figure 6.4(a) distinguishes among the three categories of milk
using S11 spectral graph against the fat content for each type, using sensor B.
We can see a clear frequency shift to the right as the fat amount increases.
Whereas Figure 6.4(b) shows the same graphs with an additional plot of
deionised water.
(b)
Figure 6.4 S11 vs. frequency graph using IDE sensor for: (a) three types of milk
(b) three milk types and deionised water
(a)

Chapter 6 • Classifying Milk Quality Based on Content
Keyur H. Joshi 99
When an MUT is placed close to an IDE, the sample proximity disturb the
electromagnetic field, resulting in various shifts in resonance frequency.
6.3.3 Using Sensor C
The sensor C was able to distinguish among all three milk types as seen from
Figure 6.5. Clear amplitude shifts and minor frequency shifts were seen in data
analysis and plotted graph.
6.4 Summary
The biggest benefit of this novel method is, it does not only detect spoilage but
also distinguishes well among the types of milk as can be seen from the results
achieved. This technique is less complex, and a more real-time result oriented
method than other methodologies previously explained in the literature review.
The primary characteristics of the 2-port sensor A was that it gave amplitude
shifts at certain frequency for variations in milk types, whereas the IDE sensors
primarily showed frequency shifts as the milk type under test changed from
skimmed milk to semi-skimmed milk and from semi-skimmed milk to whole milk.
Figure 6.5 S21 vs. Frequency plot with hairpin resonator fluidic sensor Day-1

Chapter 6 • Classifying Milk Quality Based on Content
Keyur H. Joshi 100
The sensor C gave minor frequency shift and amplitude shifts, both.
The following chapter discusses detection of adulteration in milk using the
proposed fluidic sensor design as compared with the gold standard
spectrophotometric methods in practice.

Keyur H. Joshi 101
CHAPTER 7
DETECTION OF ADULTERATION IN MILK
7.1 Background
This chapter covers the third and final objective of the project aim, which is to
determine the adulteration of milk, using EM wave spectroscopy. The adulterants
can be any foreign particles that are not inherent components of milk, some of
which can be harmless or ineffective when present under a certain threshold
value. However, many adulterants can cause severe consequences if their
presence is not identified within milk. As explained in section 1.4 of the thesis,
milk adulteration can cause a wide range of food borne diseases - ranging from
minor symptoms like abdominal cramps or fever to fatal diseases such as
Haemolytic Uraemic Syndrome (HUS).
HUS results from E. coli infection, potentially leading to renal failure, specifically,
in people with tempered immunity (Guntupalli et al., 2007; News Desk, 2012).
Hence, detecting such adulteration should be an integral part of the milk quality
monitoring and control process. A study by the Food and Agriculture Organisation
(FAO) of the United Nations shows that some contaminants can enter into the
dairy chain even through the stage of milk processing and packaging or via
deliberate means of adulteration, practised for the purpose of making commercial
gains (Kenny, 2013).
The existing standard method uses spectrophotometry (Azad and Ahmed, 2016),
as used primarily by many research labs worldwide including at the Department
of Analytical Research and Quality of Food, in Ukraine and explained in the
manual of methods of analysis of foods, Milk and Milk products, Food Safety and
Standards Authority of India (FSSAI, 2012). The spectrophotometric method was
used as a gold standard and replicated in the lab and the results achieved thereby
were used to compare and validate the results obtained by the proposed novel
methodology using microwave sensors in determination of Urea adulteration in
milk, highlighting the effectiveness of using microwave spectroscopy. The results
achieved here using a non-invasive, low profile and portable, electromagnetic

Chapter 7 • Detection of Adulteration in Milk
Keyur H. Joshi 102
wave resonator sensor are promising and discussed at the end of this chapter.
Here, in this chapter an application of a planar resonator, which acts as a fluidic
sensor carrying the milk sample in a tube for online determination the urea
content, is very successfully demonstrated, followed by detection of detergent
presence in water used as a cleaning agent for milk tankers have been tested,
determined and results discussed at the end.
7.2 Methodology and Measurements
In the first part, spectrophotometry with para-dimethyl amino benzaldehyde
(DMAB) was used for estimation of urea in milk after precipitation of milk proteins
with the help of trichloroacetic acid (TCA), was used as a gold standard. In the
second part of the experiments, the proposed novel method was used to
determine the presence of urea in milk samples using microwave spectroscopy
using a planar resonator sensor.
Eight milk samples were prepared, for both parts of the tests, with varying urea
concentrations. The manual spiking was done to enable testing of the sensor’s
ability to detect urea in the milk samples. Volumetric sample making, was
achieved using the standard and following equation (6.1):
𝐶1𝑉1 = 𝐶2𝑉2 (7.1)
where, C1 = 14 mg/10 ml, the concentration of urea in milk stock solution starting
from the highest concentration of 1400 ppm of urea in skim milk. All the other
varying concentrations (C2) of spiked urea were then achieved as shown in Table
7.1. For all sample preparations precision balance KERN® PCB100-3 was used.
Table 7.1 Milk samples spiked with 8-fold urea concentration
Test-Tube Sample Number
Spiked Urea C2 (mg/10ml)
Skim milk solution, V2 ml
Urea in skim milk stock solution1, V1 ml
1 0 10 0
2 2 8.5715 1.4285
3 4 7.1430 2.8570
4 6 5.7145 4.2855
5 8 4.2855 5.7145
6 10 2.8570 7.1430
7 12 1.4285 8.5715
8 14 0 10 1 C1 = 1400 ppm (14 mg/10 ml)

Chapter 7 • Detection of Adulteration in Milk
Keyur H. Joshi 103
7.2.1 Spectrophotometry (Gold-standard)
7.2.1.1 Sample Preparation
To prepare p-Dimethyl Amino Benzaldehyde (DMAB) solution, 1.6 g DMAB
(Sigma Aldrich, 109762) was dissolved in 100 ml ethyl alcohol (Ethanol – Sigma
Aldrich, 02860) and then 10 ml concentrate Hydrochloric (HCl) acid was added.
This reagent is stable for one month. A new standard curve was prepared with
each new batch of reagent as required.
A Phosphate buffer with pH 7.0 was prepared by dissolving 3.403 g anhydrous
potassium dihydrogen orthophosphate - KH2PO4 (BDH AnalR, 10203) and 4.355
g anhydrous dipotassium monohydrogen orthophosphate - K2HPO4 (Sigma
Aldrich, 795496) separately in 100 ml of deionised water. These solutions were,
then combined and, diluted to 1 litre with deionised water. The pH of the solution
can be adjusted to 7.0 by adding more K2HPO4 (if the pH were lower than 7) or
by adding KH2PO4 (if the pH were higher than 7) - adding either of the two by
small parts and mixing the entire volume before testing pH, as required.
Trichloroacetic Acid (TCA), 24% w/v solution was freshly prepared by dissolving
24.0 g TCA in deionised water and total volume made up to 100 ml.
Urea standard stock solution (5 mg/ml) was prepared with 5±0.001 g urea (Sigma
Aldrich, U5378) was dissolved and diluted with 1 litre of deionised water. This can
be adjusted as per required volume.
7.2.1.2 Instrumentation
In the first part of measurements, spectrophotometry was implemented using a
Jenway Spectrophotometer Model 7315. The pH values were determined using
a Hanna pH 213 Microprocessor pH Meter. Centrifugation, for the precipitation of
proteins, was achieved using a Sigma 3-16PK Laboratory Centrifuge. Filtration
was carried out using a Welch® 2511 Dry Vacuum Pump/Compressor.
7.2.1.3 Procedure Standard conventional procedure, was replicated in the first part of the
experiments, which uses spectrophotometry, as used at the Department of
Analytical Research and Quality of Foods, in Ukraine, and many other research

Chapter 7 • Detection of Adulteration in Milk
Keyur H. Joshi 104
organisations as presented in FSSAI (2012). To prepare standard curve
calibration, solutions were made by adding necessary volumes of phosphate
buffer and of urea solution. 10% w/v skimmed milk standard solution (Sigma
Aldrich, 70166) was prepared, as per the product data sheet. Hence, 10g of
skimmed milk powder was dissolved in deionised water (solvent), making the final
volume of solution up to 100ml.
Each of the eight milk samples of 10 ml in total was weighed (in grams), and
added with 10 ml of 24% TCA solution, to precipitate the proteins, and weighed
again (in grams). These samples then were subjected to centrifugation at 4,500
rpm for 40 minutes. Each obtained sample was then filtered out using Whatman™
grade 42 filter papers (Ashless - without nitrogen) and funnels. 5 ml of filtrate of
each sample was then added in eight separate test tubes.
When tubes with filtrate of spiked urea milk samples were ready, 5 ml of DMAB
solution was added in each of the eight test tubes. Test tubes were thoroughly
shaken and left to stand for 10 minutes at room temperature. First, the cuvette
(cell) for the blank sample, made of 5 ml buffer and 5 ml DMAB, was measured
as a reference (zero) point in the spectrophotometer, at 420 nm wavelength, and
then one by one, the cuvettes for each calibration solution and then for each milk
filtrate sample were measured. For minimising errors resulting from reuse of
cuvettes, each measurement in the spectrophotometer was carried out using
one-time use disposable cuvettes.
Table 7.2 Calculation of masses to determine dilution factors in spiked milk
M1 = mass of empty centrifugation tube; M2 = mass of centrifugation tube with 10 ml of the milk sample; M3 = mass of centrifugation tube with 10 ml of the milk sample and with 10 ml of 24% TCA; M4 = mass of 10 ml of the milk sample; M5 = mass of 10 ml of the milk sample with 10 ml of 24% TCA; M6 = mass of centrifugation tube with precipitated protein (after centrifugation and filtering); M7 = mass of precipitated protein; and M8 = mass of supernatant;
Sample No.
M1 (g)
M2 (g)
M3 (g)
[M2-M1] M4 (g)
[M3-M1] M5 (g)
M6 (g)
[M6-M1] M7 (g)
[M5-M7] M8 (g)
Dilution Factor
(M5/M8)
1 13.813 23.726 34.912 9.913 21.099 14.836 1.023 20.076 1.051
2 13.889 23.773 34.852 9.884 20.963 14.885 0.996 19.967 1.050
3 13.709 23.475 34.560 9.766 20.851 14.701 0.992 19.859 1.050
4 13.163 22.624 34.717 9.461 21.554 14.050 0.887 20.667 1.043
5 13.784 23.491 34.651 9.707 20.867 14.712 0.928 19.939 1.047
6 13.828 23.597 34.496 9.769 20.668 14.667 0.839 19.829 1.042
7 13.721 23.556 34.670 9.835 20.949 14.681 0.96 19.989 1.048
8 13.586 23.149 34.270 9.563 20.684 14.648 1.062 19.622 1.054

Chapter 7 • Detection of Adulteration in Milk
Keyur H. Joshi 105
Table 7.2 gives calculation of masses to determine the dilution factor. Based on
these values, the milk samples were grouped into two sets of equal masses for
centrifugation as shown in Figure 7.1.
The milk samples after centrifugation stage with precipitated proteins are shown
in Figure 7.2.
Figure 7.2 Milk samples with precipitated protein after centrifugation
Figure 7.1 8-milk samples in the centrifuge grouped in two sets of equal
masses

Chapter 7 • Detection of Adulteration in Milk
Keyur H. Joshi 106
The filtration setup, to separate milk proteins from remaining milk sample is
demonstrated in Figure 7.3.
The samples added with colour reagent (DMAB) ready for spectrophotometry are
illustrated in Figure 7.4.
7.2.2 Microwave Spectroscopy
In this proposed method, use of a planar resonator, acting as a fluidic sensor,
was made to determine the urea adulteration in milk. The experimental set-up is
illustrated in Figure 7.6.
Figure 7.4 Samples added with colour reagent for spectrophotometry
Figure 7.3 Filtration of precipitated protein from milk samples

Chapter 7 • Detection of Adulteration in Milk
Keyur H. Joshi 107
Whereas, the EM wave sensor carrying the fluid sample under test is shown in
Figure 7.6.
7.2.2.1 Instrumentation
For the second part where the proposed microwave spectroscopy technique was
implemented, a fluidic sensor design was optimised using ANSYS High
Frequency Structure Simulator (HFSS) software followed by its fabrication.
Figure 7.6 The coated planar resonator sensor with tube carrying fluid sample
Figure 7.5 Experimental setup of determining urea detection in milk using
Microwave sensor

Chapter 7 • Detection of Adulteration in Milk
Keyur H. Joshi 108
The spectral signatures, in terms of scattering parameters were recorded by
R&S® ZVA vector network analyser at 10 MHz to 15 GHz frequency range, with
0 dBm base channel power and 10 KHz bandwidth. To carry the milk sample
through the fluidic sensor, a peristaltic pump Verderflex® operating on 12 V DC
supply was used.
7.2.2.2 Procedure
The sensor design was optimised so that a tube carrying the sample under test
can be used for non-invasive application of microwave spectroscopy. Five
repetitions for each of the 8-points of urea spiked milk samples were made to
achieve good robustness of obtained measurement data. All data were then
aggregated and data analysed to identify the optimum frequency out of the full
sweep of the spectrum. Room temperature was maintained during the time
measurements were carried out.
7.3 Results and Discussion
7.3.1 Using Spectrophotometry (Gold-standard)
Figure 7.7 Skimmed milk samples spiked with urea as detected in
spectrophotometer

Chapter 7 • Detection of Adulteration in Milk
Keyur H. Joshi 109
Figure 7.7 identifies 8-point milk samples with varying concentrations of spiked
urea within skimmed milk samples, with spectrophotometry. The gold standard
as can be seen from the graph shows a very good linear regression with 99.76%
of correlation among the 8-milk samples spiked with urea content in ascending
order of concentrations.
7.3.2 Using Proposed Methodology (EM Wave Spectroscopy)
Figure 7.8 demonstrates the scattering parameter S21 (dB) vs. urea content
(mg/ml) graph, over the span of 8.3 GHz to 9.1 GHz. From further data analysis
the best response, using EM wave spectroscopy, giving distinctive results for
varying urea concentrations was achieved at 8.5678 GHz frequency with a linear
correlation of up to 96.18%, as further illustrated in Figure 7.9.
It should be noted that the results shown here are exclusive to spiked urea added
manually to check the feasibility of the proposed model and therefore do not
reflect any endogenous urea inherent to the prepared milk samples using
skimmed milk powder. Although this method and all tests were done using
Figure 7.8 S21 vs. frequency plot for all spiked milk samples with urea between
8.3 GHz to 9.1 GHz

Chapter 7 • Detection of Adulteration in Milk
Keyur H. Joshi 110
skimmed milk samples prepared from a standard batch of milk powder (Sigma
Aldrich, 70166), it is evident that the same protocols are applicable to any milk
type provided a standard protocol is followed.
Figure 7.10 shows the results achieved with direct urea spiked milk samples.
Here, it is important to note that the data points are reduced to 7-points as the
sensor undergoes limit of detection (LOD) and shows saturation beyond 1200
ppm.
However, this proposed technique eliminates tedious and cumbersome
procedural steps and reagent preparation and time-restricted methodology as
achieved in the gold standard with 99.22% linear correlation offering a real-time
solution to the urea adulteration problem as faced by the dairy industry. The
following section explains methodology involving detergents detection as
cleaning agents.
Figure 7.9 Precipitated milk samples spiked with urea adulteration, graded at
8.5678 GHz frequency using EM wave spectroscopy

Chapter 7 • Detection of Adulteration in Milk
Keyur H. Joshi 111
7.4 Detection of Detergents Present as Cleaning Agents
To check and distinguish among the residual concentrations of various Alkali
(Liquid Gold) and Acidic (Acid Descaler) Solutions used as detergents in the dairy
industry to clean up the milk storage vessels such as tankers, the following test
conditions were observed for measurements as shown in Table 7.3. Table 7.4
shows 8-fold sample preparation values for both the detergents, acidic and alkali.
Table 7.3 Measurement Conditions for Detection of Detergent Presence in Milk
Sample Making 8-point Calibration
Methodology Electromagnetic Wave Sensing
Liquid Detergents (8-samples each)
A.) Acid Descaler (acidic) B.) Liquid Gold (alkali)
Sensors i.) Sensor A (2-ports) ii.) Sensor B (1-port) iii.) Sensor C (2-ports)
Frequency Sweep 10MHz to 15GHz
Base Power 10 dBm
Temperature 20⁰ C
Repetitions 3 times
Control Medium Deionized Water (DW)
Figure 7.10 Urea spiked milk samples directly measured with hairpin resonator
sensor

Chapter 7 • Detection of Adulteration in Milk
Keyur H. Joshi 112
Table 7.4 8-fold samples of Acid Descaler and Liquid Gold
7.4.1 Using Sensor A
In this case, 15ml test tubes were used as the sample size for measurements.
Figure 7.11 and Figure 7.12 show two major distinctive curves within the S21 Vs.
frequency plot of 8-point calibrated samples for Acid Descaler liquid solution
separately magnified for the further detailing, respectively. Notice that the
characteristics is reversed from one to the other.
Sample Label
Acid Descaler Concentration (%) Liquid Gold
AD1 10 LG1
AD2 8 LG2
AD3 6 LG3
AD4 4 LG4
AD5 2 LG5
AD6 1 LG6
AD7 0.5 LG7
AD8 0.1 LG8
DW 0 D
Figure 7.11 S21 Plot centred at 1.5 GHz for Acid Descaler 8-fold samples.

Chapter 7 • Detection of Adulteration in Milk
Keyur H. Joshi 113
Similarly, Figure 7.13 and Figure 7.14 show two major distinctive curves for 8-
point calibrated samples of Liquid Gold solution, located at around 1.5 GHz and
2.8 GHz, respectively.
Figure 7.12 S21 Plot centred at 2.8 GHz for Acid Descaler 8-fold samples.
Figure 7.13 S21 Plot centred at 1.5 GHz for Liquid Gold 8-fold samples.

Chapter 7 • Detection of Adulteration in Milk
Keyur H. Joshi 114
Note that the same inverting of characteristics is seen in the Liquid Gold as it was
seen in Acid Descaler, with the only difference being the centre radiation
frequencies, the reason being the former is Acidic in nature and the latter is an
Alkali.
Both the plots for S21 of Acid Descaler and Liquid Gold, if compared together, are
quite similar in terms of characteristics with each other. In both cases, frequencies
of interest remain 1.5GHz and 2.8GHz.
7.4.2 Using Sensor B
In the case of the sensor B, the sample size used was 500µl held within the well
boundary around the sensor electrodes. Figure 7.15 and Figure 7.16 show clear
classification of varying concentrations of each detergent active ingredient
effectively in S11 Vs. frequency graphs, respectively, for Acid Descaler (AD) and
Liquid Gold (LG), within the given range of frequency 0 to 1.5 GHz.
Figure 7.14 S21 Plot centred at 2.8 GHz for Liquid Gold 8-fold
samples.

Chapter 7 • Detection of Adulteration in Milk
Keyur H. Joshi 115
Figure 7.15 S11 vs. Frequency Acid Descaler 8-fold samples
Figure 7.16 S11 vs. Frequency Liquid Gold 8-fold samples

Chapter 7 • Detection of Adulteration in Milk
Keyur H. Joshi 116
7.4.3 Using Sensor C
Figure 7.17 shows raw data from recorded spectral signatures for Acid Descaler
via sensor C, whereas, Figure 7.18 distinguishes these varying concentrations at
frequency 986 MHz using planar resonator with 94.47 % polynomial correlation.
Whereas on the other hand Figure 7.19 and Figure 7.20 show similar plots for
Liquid Gold (LG) respectively. The optimum polynomial correlation achieved for
LG was rather at the very low end of frequency as compared to AD at around
10.5 MHz with 96.65 % R2 value.
These were the best R2 values achieved, for polynomial fit, from data analysis of
recorded spectral signatures over full sweep of frequencies ranging from 10 MHz
to 15 GHz.
Figure 7.17 S21 vs. Frequency Acid Descaler 8-fold samples

Chapter 7 • Detection of Adulteration in Milk
Keyur H. Joshi 117
Figure 7.18 S21 vs. Concentrations for AD at around 986MHz frequency
Figure 7.19 S21 vs. Frequency Liquid Gold 8-fold samples

Chapter 7 • Detection of Adulteration in Milk
Keyur H. Joshi 118
7.5 Summary
Urea adulteration up to 1400 ppm, which is double the range of the naturally
found limit of urea in milk, was identified and samples were graded based on
concentration of urea. The results achieved here demonstrate that the proposed
novel technique, using an electromagnetic wave sensor has shown promising
results with 96.18% of linear correlation and has the potential to replace the
robust existing methodologies, which are tedious due to requirement of reagents
preparation, complex as well as time sensitive as well as being costlier than the
proposed technique overall.
This method can aid as a non-invasive and real-time inspection method to
determine the urea adulteration in milk as it measures the milk samples directly,
eliminating several redundant stages of the conventional methods that cost time
and resources. It can also be easily incorporated in the existing set-up of milk
quality testing and control to overcome the limitation of currently existing
technology.
Figure 7.20 S21 vs. Concentrations for LG at around 10.5 MHz frequency

Chapter 7 • Detection of Adulteration in Milk
Keyur H. Joshi 119
The detergents used as cleansing agents for milk containers were also tested
and their varying concentrations detected for both alkali as well as acidic
detergent. All three types of sensor were used to understand the detection
patterns and behavioural changes of recorded spectra.

Keyur H. Joshi 120
CHAPTER 8
COMPARATIVE REVIEW, FINDINGS AND RECOMMENDATIONS
This chapter reviews the entire research project on a comparative analytical
basis. The findings made during this research are discussed concerning the
current state of the art, in industry as well as in research domains, and relative
position of the proposed research is outlined. A thorough discussion is presented
to recommend suitable sensing platform based on the comparison of all three
types of microwave sensor used in the project, and tested with commercially
purchased cow milk (skimmed milk, semi-skimmed milk and whole milk). The
following sections reflect on the bespoke milk quality control paradigm for
processed (i.e. pasteurised, homogenised and standardised) cow milk sold in
commercial markets.
8.1 Review of the Research Project
Figure 8.1 illustrates the revised milk processing and production flow-chart,
outlying the current procedural sequence (see Figure 2.1) of the dairy industry,
from farms to the consumer with the addition of microwave sensing technology.
It is important to note that the inclusion of the proposed microwave sensing
technology allows for a testing mechanism that can be performed outside of the
laboratory and can be retrofitted to the current industrial process.
The microwave sensors allow the flexibility of a sensing system that is portable,
low profile, non-destructive, non-invasive, rapid and reliable. These
characteristics allow it to operate in a less restricted environment, such as
industrial setup, without the explicit need of technically skilled staff, as in many
cases of the existing technologies discussed earlier in this thesis. The biggest
advantage of such a system is that there is no need to execute the operations
like preparing stock solutions, the addition of reagents to samples under test,
mixing and centrifuging and hence the destruction of the samples due to the
invasive approach, as in most other standard practices.

Chapter 8 • Comparative Review, Findings and Recommendations
Keyur H. Joshi 121
Figure 8.1 Flow-chart of Milk Processing with retrofitted
Microwave Sensor System

Chapter 8 • Comparative Review, Findings and Recommendations
Keyur H. Joshi 122
The experimental results, using microwave spectroscopy, could effectively
distinguish between the spoiled milk samples and fresh milk samples, although
the spoilage resulting from specific bacteria and detection of presence of
particular bacterium was beyond the scope of this project.
Similarly, the composition check was mainly focused at the milk type classification
based on the fat content values, and a proof-of concept set of experiments were
also carried out for determining protein levels. For the adulteration tests, the use
of primarily reported adulterants were used – with urea in milk and detergent in
deionised water. The application of these microwave sensors can be further
extended to accommodate more adulterants as well as for the detection of a
specific bacterium type in the future.
Figure 8.2 depicts all three sensor types used in this research project. Although
these three sensor types seem to be radically different in their design, the
common factor associating these microwave devices is the near-field sensing, as
discussed earlier in Chapter 3.
The next section discusses the findings of the research project and
recommendations based on the interpretations made.
(a) (b) (c)
Figure 8.2 Microwave sensors used in this research: (a) Sensor A,
(b) Sensor B, and (c) Sensor C

Chapter 8 • Comparative Review, Findings and Recommendations
Keyur H. Joshi 123
8.2 Findings and Recommendations
The following is the comparison and discussion for each of these three sensor
types based on the results from the milk quality testing in a simulated
environment, and the actual milk data from experimental measurements. The
discussion is made in terms of how the simulation results transpire into real-time
experimental data and the affecting factors. The research findings with the help
of result analysis are explained on a comparative basis to interpret the outcome
in each case.
Figure 8.3 compares the milk test results using sensor A under a simulated
environment (HFSS) and in real-world experiments. The reflection coefficient is
measured in dB using a Rohde & Schwarz ZVA24 vector network analyser and
plotted against frequency. In both the cases, a separation of graphs is seen at
around 5 GHz, 5.85 GHz to 6 GHz, and near 6.65 GHz. The results show
amplitude shifts at various frequencies, giving the microwave sensing system
ability to classify milk types.
Figure 8.3 Graph of S21 vs. frequencies for Skimmed, Semi-skimmed and Whole
milk using Sensor A under Simulation and Real-life

Chapter 8 • Comparative Review, Findings and Recommendations
Keyur H. Joshi 124
Figure 8.4 compares the milk test results using sensor B for simulated and in real-
world experiment. This type of sensor primarily gives frequency shifts rather than
just the amplitude shifts, between 5.45 GHz and 5.55 GHz in reflection coefficient
measurements at the single port-1, which was the case in sensor A as discussed
earlier. The sensing system therefore clearly classifies the three milk types
through both frequency and amplitude shifts.
Other minor shifts were seen at the frequency 2.45 GHz .
Figure 8.5, compares the milk test results for simulated and real experiments
using sensor C for skimmed, semi-skimmed, and whole milk. This sensor also
shows primarily amplitude shifts with some minor frequency shifts enabling the
sensing system to distinguish between the milk samples based on their fat
content, at around 1.8 GHz and 6.8 GHz.
The variation between the two results are due to several factors, including the
application of mask layer, to protect the sensor, at the time of its fabrication.
Figure 8.4 Graph of S21 vs. frequencies for Skimmed, Semi-skimmed and Whole
milk using Sensor B under Simulation and Real-life

Chapter 8 • Comparative Review, Findings and Recommendations
Keyur H. Joshi 125
All three sensors show expected results at the resonance frequencies they are
designed for, as well as at certain other harmonics; the scattering parameter
increases from skimmed, through semi-skimmed to whole milk. The choice of
sensor is determined based on the application environment, the size requirement
and portability, as well as the size of the sample and the nature of the tests, i.e.
invasive or non-invasive.
Table 8.1 compares the three different microwave sensor types used in this
research with their primary characteristics. This shows how the sensor
parameters evolved, in this project, from one requirement to another. The
relationship between response from the individual sensors and the milk
parameters were compared to determine the most suitable sensor for each
application namely, classification, adulteration and spoilage. Sensor A
demonstrates the strongest linear relationship for classification and spoilage
whereas Sensor B presents the strongest polynomial fit for adulteration.
Figure 8.5 Graph of S21 vs. frequencies for Skimmed, Semi-skimmed and
Whole milk using Sensor C under Simulation and Real-life

Chapter 8 • Comparative Review, Findings and Recommendations
Keyur H. Joshi 126
All three sensors demonstrate strong correlation and confirm that
electromagnetic waves can be used as a potential method to determine milk
quality.
Table 8.1 The three microwave sensor types
Sensor A allows for a larger sample volume compared to other two types of
sensors, and it can be retrofitted into industrial configuration for real-time
continuous monitoring of milk quality.
Sensor
Overall
Sensor
Dimensions
Type
of
Material
No. of
Ports
Sampling
Method
Classifi-
cation
Adulte-
ration Spoilage
Sensor
A
≈ 130mm x
60mm Aluminium 2
Test Tube
(15 ml)
R2= 0.98
(Linear Fit)
R2= 0.97
(Polynomial
Fit)
R2= 0.96
Skimmed
R2= 0.99
Semi-
Skimmed
R2= 0.99
Whole
(Linear Fit)
Sensor
B
≈ 40mm x
20mm
FR4 epoxy
+Brass
+Gold
1 Pipette
(0.5 ml)
R2= 0.93
(Linear Fit)
R2= 0.99
(Polynomial
Fit)
R2= 0.92
Skimmed
R2= 0.95
Semi-
Skimmed
R2= 0.67
Whole
(Linear Fit)
Sensor
C
≈ 35mm x
25mm
FR4 epoxy
+ Copper 2
Fluidic Tube
(~ 0.25 ml)
R2= 0.97
(Linear Fit)
R2= 0.97
(Polynomial
Fit)
R2= 0.86
Skimmed
R2= 0.89
Semi-
Skimmed
R2= 0.79
Whole
(Linear Fit)

Chapter 8 • Comparative Review, Findings and Recommendations
Keyur H. Joshi 127
Sensor B is the smallest of the three but it is invasive in nature, as the milk sample
is required to be placed on its surface to enable quality measurements.
Sensor C allowed a fluidic sensor system where milk samples were passed
through a polyethylene tube using a peristatic pump. This could be particularly
useful in the applications where portable, rapid and non-invasive measurements
are primary requirements, e.g. for food inspectors on a routine visit to a milk
production and/or storage facility.
8.3 Summary
In this chapter, the proposed sensing technology was mapped with the existing
industrial domain as well as research domain practices. It was compared with the
existing standards in terms of advantages and limitations including important
design constraints such as portability, non-invasive, non-destructive application.
It was understood upon experimental results and analysis that the proposed
methodology is also non-ionising and less expensive compared to existing
standard IR/NIR spectroscopy because of lower frequency range.
In this research work, it was effectively shown that the microwave sensing
technology eliminates, or minimises, the limitations of the current state of the art
in research as well as in the industrial domain. The biggest advantage of this
technology is its low-cost of operation, simple installation with a provision of
portability and most importantly, real-time measurements. The proposed
technology is employed to detect spoilage of milk over the period of time,
determine the type of milk based on its fat contents and is also successfully
applied to detect the presence of adulteration.
The following chapter provides concluding remarks and a discussion on further
work on the proposed technique.

Keyur H. Joshi 128
CHAPTER 9
CONCLUSIONS AND FURTHER WORK
This chapter gives concluding remarks with a brief discussion on the scope for
further work for this research project.
9.1 Concluding Remarks
The research project started with a thorough literature study and reviewing
current methods in dairy industry as well as research domain for milk quality
monitoring and control, with their ongoing challenges. From the study of
limitations of current state of the art, it was derived that it has a scope for further
improvement where no easy-to-use yet effective technique exists which is also
time as well as resource saving after being incorporated.
As explained earlier in Chapter 1 and Chapter 2 followed by review in Chapter 8,
it is evident that the industrial setup for the processing of raw milk is robust
enough to address the need of milk quality control. This allows the existing
mechanism in place to ensure that the acceptable standards of quality are
maintained while packaging, of processed milk products, is carried out at dairy
plants. Therefore, the aim of this research was particularly targeted towards
developing a new milk sensing technology that is suitable beyond the existing
industrial robust setup and usable outside the laboratory environment enabling
real-time measurements, and at the same time the one that is easily amendable
to the setup currently in place.
The preliminary work started with the investigation of the EM wave theory and
understanding various types of microwave sensors used in different applications.
This investigation lead to selection of three types of microwave sensors namely,
cavity resonator, Interdigitated Electrodes (IDE) sensor and Hairpin Sensor as a
potential sensing platform for determination of milk quality.
The dielectric property experiments were carried out to evaluate the dielectric
characteristics of the three widely sold commercial milk types in the consumer
market namely, skimmed milk, semi-skimmed milk, and whole milk using open

Chapter 9 • Conclusions and Further Work
Keyur H. Joshi 129
ended coaxial technique. Using the obtained results, the theoretical model of
three sensors were designed and simulated using High Frequency Structure
Simulator (HFSS) for classification, adulteration and spoilage detection.
The 2-port Sensor A, designed and developed at LJMU, was first applied for
preliminary tests, as a microwave sensor to classify among different milk types
based on their fat content and to determine the spoilage in milk samples occurring
over time. For all the tests, the milk bottles were freshly purchased with the
longest available span before the expiry date labelled on their packaging, which
gave about 7 days of time period by the time best before date were due. The
results of these tests were then plotted, data analysed and compared to the
theoretical simulation model results as well as the expected outcome.
The primary feature of the resonator sensor A was its characteristics of giving
amplitude shifts as the type of milk changes. The deionised water had the lowest
value of scattering parameter (i.e. the highest in negative values) and it increased
as we go along from lower fat to higher fat content milk types, e.g. from skimmed
milk, to the whole milk through semi-skimmed milk. In addition, the milk samples
that were spoiled also gave decremented result in scattering parameter vs.
frequency plots as compared to the fresh ones, due to the separation of milk
solids from water content as the milk spoils. This enables available specifically
for liquid samples, both in near-field material sensing applications, namely
microwave resonator sensor A and sensor B, were identified and employed in
simulations and then in real-world measurements.
Following the proof of concept using both sensors for spoilage detection and milk
type classification, a sensor C design based on planar resonator technology,
known as hairpin resonator, was designed, simulated, and fabricated for real-
world measurements. The results achieved by fabricated sensor were compared
with simulation results and also for the case of adulteration of urea in milk, the
gold standard methodology involving spectrophotometry was replicated in the
laboratories and results with proposed microwave spectroscopy technique were
compared and benchmarked followed by measurements of detergents in water
as cleaning agents.

Chapter 9 • Conclusions and Further Work
Keyur H. Joshi 130
Application of a microwave cavity, acting as a resonating sensor device to detect
spoilage and the type of milk. A wideband source applied to the cavity helped
locate the values of frequency thereby allowing customization of the design that
gives optimum results. Once having located the responding frequency values,
planar microwave sensors - Interdigitated Electrodes (IDE) were employed to
study the invasive milk quality testing and effect of small sample values as low
as 0.5ml. Although the IDE sensors are invasive in nature, the characteristics
were studied to understand the scope of a non-invasive fluidic sensor that can
test milk samples non-destructively and non-invasively.
Finally, the sensor C was designed and developed as a fluidic sensor to achieve
more compactness, portability, and non-invasive automation in the testing
system. The three objectives of the main aim of project were effectively
demonstrated with the optimised design to operate on the same corresponding
resonant frequencies for a rapid milk quality testing and monitoring system.
Data analysis was carried out among development of proposed sensor platform.
It has been found that developed sensors have a good linear agreement with milk
parameters under investigation. The strongest linear relationship was shown by
sensor A for classification and spoilage of milk. Whereas Sensor B presented the
strongest polynomial fit for adulteration. Sensor C has also demonstrated high
linear and polynomial agreement with the classification, adulteration and spoilage
of milk.
This technique indeed shows a promising future for design and development of
a milk quality testing and control system, for processed and packaged milk types,
as it has several advantages over the other already existing standard practices.
These advantages include less complexity, higher accuracy, time, cost-
effectiveness, and a universal approach to milk types and quality detection. This
work presents a very good prototype model for a novel, rapid microwave sensing
based quality testing system.

Chapter 9 • Conclusions and Further Work
Keyur H. Joshi 131
9.2 Further Work
In spite of the acknowledged advantages of the proposed microwave sensor to
determine milk quality, it still has a scope for further improvement, which include:
Expanding research by undertaking experimental work on different
animal’s milk namely, goat, buffalo, camel
Undertaking real case study in developing countries such as India
Improving sensitivity of the design sensor prototype
Optimising sensor platform by developing RF Circuitry to avoid use of high
cost and bench top Vector Network Analyser
Applying further data analysis and implement machine learning algorithms
to enable instant verification of the milk quality
Further optimisation, can help the large-scale or medium-scale retailers, who
receive the milk from dairies for selling in packaged form after long stages of
transport, to help allow the quality assurance and also to ensure that the
customers are getting what they are paying for. This work not only will establish
a strong base for the laboratory based research, but also must help towards the
problem solving that the dairy industries and end consumers face due to either
complexity or costliness of existing standard practices for milk quality control.
Keyur H. Joshi 132
REFERENCES
Abdullah, B. M. et al. (2014) ‘A Novel Method for Monitoring Structural Metallic
Materials Using Microwave NDT’, in Sensing Technology: Current Status and
Future Trends I. Springer International Publishing. doi:
https://doi.org/10.1007/978-3-319-02318-2_9.
Afzal, A. et al. (2011) ‘Adulteration and microbiological quality of milk (A
review)’, Pakistan Journal of Nutrition, 10(12), pp. 1195–1202. doi:
10.3923/pjn.2011.1195.1202.
Al-Holy, M. A. et al. (2006) ‘The use of Fourier transform infrared spectroscopy
to differentiate Escherichia coli O157:H7 from other bacteria inoculated into
apple juice’, Food Microbiology, 23(2), pp. 162–168. doi:
10.1016/j.fm.2005.01.017.
Al-Qadiri, H. M. et al. (2008) ‘Monitoring quality loss of pasteurized skim milk
using visible and short wavelength near-infrared spectroscopy and multivariate
analysis.’, Journal of dairy science. Elsevier, 91(3), pp. 950–958. doi:
10.3168/jds.2007-0618.
Alcantara, G. P. and Andrade, C. G. M. (2016) ‘A short review of gas sensors
based on interdigital electrode’, 2015 IEEE 12th International Conference on
Electronic Measurement and Instruments, ICEMI 2015, 3, pp. 1616–1621. doi:
10.1109/ICEMI.2015.7494489.
Alhajeri, S. H. H. (2010) Online Electromagnetic Wave Monitoring System for
Petroleum Industry Applications. Liverpool John Moores University.
Anand, M. J. and Sridhar, V. (2018) ‘Characterisation of Gas Sensor Array for
Milk Spoilage and Diseases Detection’, 7(2), pp. 48–52.
Atherton, H. V. and Newlander, J. A. (1977) ‘Chemistry and testing of dairy
products.’, Chemistry and testing of dairy products. AVI Publishing Co. Inc., (Ed.
4). Available at: https://www.cabdirect.org/cabdirect/abstract/19780443856
(Accessed: 2 June 2018).

References
Keyur H. Joshi 133
Azad, T. and Ahmed, S. (2016) ‘Common milk adulteration and their detection
techniques’, International Journal of Food Contamination. International Journal
of Food Contamination, 3(1), p. 22. doi: 10.1186/s40550-016-0045-3.
Bao, X. et al. (2018) ‘A Planar One-Port Microwave Microfluidic Sensor for
Microliter Liquids Characterization’, IEEE Journal of Electromagnetics, RF and
Microwaves in Medicine and Biology, 2(1), pp. 1–1. doi:
10.1109/JERM.2018.2807984.
Barbano, D. M. and Lynch, J. M. (2006) ‘Major advances in testing of dairy
products: milk component and dairy product attribute testing.’, Journal of dairy
science. Elsevier, 89(4), pp. 1189–1194. doi: 10.3168/jds.S0022-
0302(06)72188-9.
Bhandare, S. G. and Waskar, V. S. (2010) ‘Food safety management for Indian
Dairy Industry’, Indian Dairyman, 62(6), pp. 42–46. Available at:
https://www.cabdirect.org/cabdirect/abstract/20103206895.
Bhandari, V. and Singh, H. (2002) ‘Physical Methods’, Encyclopedia of Dairy
Sciences. Second. Elsevier Ltd. Available at:
https://archive.org/details/EncyclopediaOfDairySciences.
Bhatt, S. R., Singh, A. and Bhatt, S. M. (2008) ‘Assessment of synthetic milk
exposure to children of selected population in Uttar Pradesh , India’, Ind. J. Res.
Anvikshiti, 7, pp. 22–34. Available at:
https://www.researchgate.net/publication/266502328.
Bhavadasan, M. K., Rajput, Y. S. and Ganguli, N. G. (1982) ‘A simple
colorimetric method for the determination of urea in milk’, Indian J. Dairy
Science, 33(3), pp. 263–266. Available at:
http://krishikosh.egranth.ac.in/bitstream/1/47831/1/dc10.pdf.
Blakey, R. et al. (2012) ‘Real-time microwave based sensing method for
vegetable oil type verification’, Procedia Engineering. Elsevier B.V.,
47(December), pp. 623–626. doi: 10.1016/j.proeng.2012.09.224.
Borecki, M. et al. (2008) ‘Capillaries as the components of photonic sensor
micro-systems’, Measurement Science and Technology, 19(6), p. 065202. doi:

References
Keyur H. Joshi 134
10.1088/0957-0233/19/6/065202.
Borecki, M. et al. (2009) ‘A method for testing the quality of milk using optical
capillaries’, Photonics Letters of Poland, 1(1), pp. 37–39. Available at:
http://photonics.pl/PLP/index.php/letters/article/view/1-13/13.
Brown, J. V, Ranjith, H. M. P. and Prentice, G. A. (1984) ‘Comparative shelf-
lives of skimmed, semi-skimmed and whole milks’, International Journal of Dairy
Technology, 37(4), pp. 2–5. doi: 10.1111/j.1471-0307.1984.tb00519.x.
Cai, Q. et al. (2004) ‘A wireless, remote query glucose biosensor based on a
pH-sensitive polymer’, Analytical Chemistry, 76(14), pp. 4038–4043. doi:
10.1021/ac0498516.
Chandler, R. E., Ng, S. Y. and Hull, R. R. (1990) ‘Bacterial spoilage of specialty
pasteurised milk products.’, CSIRO Food Research Quarterly, 50, pp. 11–14.
Available at: http://www.cabdirect.org/abstracts/19920449976.html.
Chen, Z. N. (2017) ‘Metamaterials-based Antennas : Translation from Physical
Concepts to Engineering Technology’, Forum for Electromagnetic Research
Methods and Application Technologies (FERMAT), pp. 1–4. Available at:
https://www.e-fermat.org/files/forums/153447fde08810.pdf.
Chiacchierini, E. et al. (2003) ‘Milk Soluble Whey Proteins: Fast and Precise
Determination with Dumas Method’, Analytical Letters, 36(11), p. 2473.
Choi, H. et al. (2015) ‘Design and In Vitro Interference Test of Microwave
Noninvasive Blood Glucose Monitoring Sensor’, IEEE Transactions on
Microwave Theory and Techniques, 63(10), pp. 3016–3025. doi:
10.1109/TMTT.2015.2472019.
Cifelli, C. J., German, J. B. and O’Donnell, J. A. (2011) ‘Nutritional and Health-
Promoting Properties of Dairy Products: Contribution of Dairy Foods to Nutrient
Intake’, Encyclopedia of Dairy Sciences. Elsevier Ltd. Available at:
https://archive.org/details/EncyclopediaOfDairySciences.
Compagnone, D. et al. (2015) ‘Quartz crystal microbalance gas sensor arrays
for the quality control of chocolate’, Sensors and Actuators, B: Chemical.
Elsevier B.V., 207(PB), pp. 1114–1120. doi: 10.1016/j.snb.2014.10.049.

References
Keyur H. Joshi 135
Dai, X. et al. (2010) ‘Accurate analysis of urea in milk and milk powder by
isotope dilution gas chromatography-mass spectrometry’, Journal of
Chromatography B: Analytical Technologies in the Biomedical and Life
Sciences. Elsevier B.V., 878(19), pp. 1634–1638. doi:
10.1016/j.jchromb.2010.04.005.
Das, S., Goswami, B. and Biswas, K. (2016) ‘Milk Adulteration and Detection: A
Review’, Sensor Letters, 14(1), pp. 4–18. doi: 10.1166/sl.2016.3580.
Deeth, H. C. et al. (2002) ‘Spoilage patterns of skim and whole milks.’, The
Journal of dairy research, 69(2), pp. 227–241. doi:
10.1017/S0022029901005301.
Dress, P. et al. (1998) ‘Water-core waveguide for pollution measurements in the
deep ultraviolet’, Applied Optics, 37(21), pp. 4991–4997.
Dunsmore, D. G. (1983) ‘The incidence and implications of residues of
detergents and sanitizers in dairy products’, in Gunther, F. A. (ed.) RESIDUE
REVIEWS: Residues of Pesticides and Other Contaminants in the Total
Enviromnent. doi: 10.1007/978-1-4612-5473-7.
Eat By Date (2018) The Shelf Life of Milk: How Long Does Milk Last?,
EatByDate LLC.
Ellis, D. I. et al. (2002) ‘Rapid and quantitative detection of the microbial
spoilage of meat by fourier transform infrared spectroscopy and machine
learning.’, Applied and environmental microbiology, 68(6), pp. 2822–8. Available
at: http://www.ncbi.nlm.nih.gov/pubmed/12039738 (Accessed: 2 June 2018).
Emerson, D. T. (2002) ‘The work of Jagadis Chandra Bose: 100 years of mm-
wave research’, in 1997 IEEE MTT-S International Microwave Symposium
Digest. Denver: IEEE, pp. 553–556. doi: 10.1109/MWSYM.1997.602853.
FAO (2015a) Milk and milk products, FAO Publications. Available at:
http://www.fao.org/agriculture/dairy-gateway/milk-and-milk-
products/en/#.Vc_BJpXH_mQ (Accessed: 1 April 2016).
FAO (2015b) Milk processing, FAO Publications. Available at:
http://www.fao.org/agriculture/dairy-gateway/milk-processing/en/#.Vc-

References
Keyur H. Joshi 136
_vpXH_mQ (Accessed: 1 April 2016).
FAO (2015c) Milk production, FAO Publications. Available at:
http://www.fao.org/agriculture/dairy-gateway/milk-
production/en/#.VWvSw89Vikp (Accessed: 1 April 2016).
Fellows, P. and Hampton, A. (1992) Small-scale food processing - A guide for
appropriate equipment. London: FAO, Intermediate Technology Publications.
Available at: http://www.fao.org/wairdocs/x5434e/x5434e00.htm#Contents.
Fok, M. et al. (2015) ‘A Novel Microwave Sensor to Detect Specific Biomarkers
in Human Cerebrospinal Fluid and Their Relationship to Cellular Ischemia
During Thoracoabdominal Aortic Aneurysm Repair’, Journal of Medical
Systems, 39(4). doi: 10.1007/s10916-015-0208-4.
Food Safety and Standards Authority of India (2014) Adulteration in Milk and
Milk Products, FSSAI. Available at:
http://www.fssai.gov.in/Portals/0/Pdf/Adulteration(26.02.14).pdf (Accessed: 3
April 2016).
Food Standards Agency (2016) MILK Hygiene on the Dairy Farm A Practical
Guide for Milk Producers. England and Wales. Available at:
https://www.food.gov.uk/sites/default/files/multimedia/pdfs/milk-hygiene-guide-
for-milk-producers.pdf (Accessed: 10 March 2018).
Fox, P. F. (2011a) ‘Introduction | History of Dairy Chemistry’, Encyclopedia of
Dairy Sciences. Second. Elsevier. doi: 10.1016/B978-0-12-374407-4.00542-2.
Fox, P. F. (2011b) ‘MILK | Introduction’, Encyclopedia of Dairy Sciences.
Second. Edited by J. W. Fuquay, P. F. Fox, and P. L. H. McSweeney. Elsevier.
doi: 10.1016/B978-0-12-374407-4.00310-1.
Francis, P. S., Lewis, S. W. and Lim, K. F. (2002) ‘Analytical methodology for
the determination of urea: Current practice and future trends’, TrAC - Trends in
Analytical Chemistry, 21(5), pp. 389–400. doi: 10.1016/S0165-9936(02)00507-
1.
Fromm, H. I. and Boor, K. J. (2004) ‘Characterization of Pasteurized Fluid Milk
Shelf-life Attributes’, JOURNAL OF FOOD SCIENCE. 29th septe, 69(8), pp.

References
Keyur H. Joshi 137
207–214. doi: 10.1111/j.1365-2621.2004.tb09889.x.
FSSAI (2012) ‘Manual of methods of analysis of food: milk and milk products’.
Food Safety and Standards Authority of India, Ministry of Health and Family
Welfare, Government of India. Available at:
http://old.fssai.gov.in/Portals/0/Pdf/Draft_Manuals/MILK_AND_MILK_PRODUC
TS.pdf.
Gerosa, S. and Skoet, J. (2013) ‘Milk availability: Current production and
demand and medium-term outlook’, in Muehlhoff, E., Bennett, A., and
McMahon, D. (eds) Milk and dairy products in human nutrition. Rome: FAO
Publications, pp. 11–40. Available at:
http://www.fao.org/docrep/018/i3396e/i3396e.pdf.
Goh, J. H. et al. (2011) ‘Lactate detection using a microwave cavity sensor for
biomedical applications’, 2011 Fifth International Conference on Sensing
Technology, pp. 436–441. doi: 10.1109/ICSensT.2011.6137016.
Golding, N. S. (1952) ‘RESAZURN TEST FOR MILK’. United States: United
States Patent Office.
Guntupalli, R. et al. (2007) ‘Rapid and sensitive magnetoelastic biosensors for
the detection of Salmonella typhimurium in a mixed microbial population’,
Journal of Microbiological Methods, 70(1), pp. 112–118. doi:
10.1016/j.mimet.2007.04.001.
Guo, W. et al. (2010) ‘Effects of milk concentration and freshness on microwave
dielectric properties’, Journal of Food Engineering, 99(3), pp. 344–350. doi:
10.1016/j.jfoodeng.2010.03.015.
Handford, C. E., Campbell, K. and Elliott, C. T. (2016) ‘Impacts of Milk Fraud on
Food Safety and Nutrition with Special Emphasis on Developing Countries’,
Comprehensive Reviews in Food Science and Food Safety, 15(1), pp. 130–142.
doi: 10.1111/1541-4337.12181.
Hantsis-Zacharov, E. and Halpern, M. (2007) ‘Culturable psychrotrophic
bacterial communities in raw milk and their proteolytic and lipolytic traits’,
Applied and Environmental Microbiology, 73(22), pp. 7162–7168. doi:

References
Keyur H. Joshi 138
10.1128/AEM.00866-07.
Haugen, J. E. et al. (2006) ‘Application of gas-sensor array technology for
detection and monitoring of growth of spoilage bacteria in milk: A model study’,
Analytica Chimica Acta, 565(1), pp. 10–16. doi: 10.1016/j.aca.2006.02.016.
Helland, M. H., Wicklund, T. and Narvhus, J. a. (2004) ‘Growth and metabolism
of selected strains of probiotic bacteria in milk- and water-based cereal
puddings’, International Dairy Journal, 14(11), pp. 957–965. doi:
10.1016/j.idairyj.2004.03.008.
Hickernell, F. S. (1998) ‘Surface acoustic wave devices: a rewarding past, a
significant present, and a promising future’, Microwaves and Radar, 1998.
MIKON ’98., 12th International Conference on, 4, pp. 159–168 vol.4. doi:
10.1109/MIKON.1998.738468.
Hong, J. S. and Lancaster, M. J. (1998) ‘Cross-coupled microstrip hairpin-
resonator filters’, IEEE Transactions on Microwave Theory and Techniques,
46(1), pp. 118–122. doi: 10.1109/22.654931.
Houston, J. (1955) ‘A New Method of Butterfat Testing’, International Journal of
Dairy Technology. Wiley/Blackwell (10.1111), 8(1), pp. 47–51. doi:
10.1111/j.1471-0307.1955.tb02694.x.
Huang, P.-C., Liu, C.-F. and Chen, R.-Q. (2017) ‘A microwave resonator
biosensors for biological cell trapping in portable biomedical application’, in
2017 IEEE International Conference on Consumer Electronics - Taiwan (ICCE-
TW). IEEE, pp. 159–160. doi: 10.1109/ICCE-China.2017.7991044.
Huang, S. et al. (2008) ‘A remote-query sensor for predictive indication of milk
spoilage’, Biosensors and Bioelectronics, 23(11), pp. 1745–1748. doi:
10.1016/j.bios.2008.01.036.
International Telecommunication Union (2016) Radio Regulations. Edition of,
ITU. Edition of. Geneva, Switzerland: International Telecommunication Union.
doi: 10.1016/B978-0-12-394583-9.00020-X.
Janzen, J. J., Bishop, J. R. and Bodine, a. B. (1982) ‘Relationship of Protease
Activity to Shelf-Life of Skim and Whole Milk’, Journal of Dairy Science, 65(12),

References
Keyur H. Joshi 139
pp. 2237–2240. doi: 10.3168/jds.S0022-0302(82)82492-2.
Joshi, K. H. et al. (2015) ‘Online monitoring of milk quality using electromagnetic
wave sensors’, in 2015 9th International Conference on Sensing Technology
(ICST). Auckland: IEEE, pp. 700–705. doi: 10.1109/ICSensT.2015.7438487.
Joshi, K. H. et al. (2017) ‘Milk Quality Monitoring Using Electromagnetic Wave
Sensors’, in Mukhopadhyay, S. C. et al. (eds) Sensors for Everyday Life:
Environmental and Food Engineering. Smart Sens. Springer International
Publishing AG, pp. 121–134. doi: 10.1007/978-3-319-47322-2_10.
Kenny, M. (2013) ‘Safety and quality’, in Muehlhoff, E., Bennett, A., and
McMahon, D. (eds) Milk and dairy products in human nutrition. Rome: FAO
Publications, pp. 243–274. Available at:
http://www.fao.org/docrep/018/i3396e/i3396e.pdf.
Klaenhammer, T. R. (1988) ‘Bacteriocins of lactic acid bacteria.’, Biochimie,
70(3), pp. 337–349. doi: 10.1016/0300-9084(88)90206-4.
Kleyn, D. H. et al. (2001) ‘Determination of Fat in Raw and Processed Milks by
the Gerber Method: Collaborative Study’, Journal of AOAC International, 84(5),
pp. 1499–1508.
Kohlmann, K. L. et al. (1991) ‘Production of proteases by psychrotrophic
microorganisms.’, Journal of dairy science, 74(10), pp. 3275–3283. doi:
10.3168/jds.S0022-0302(91)78513-5.
Korostynska, O., Mason, A. and Al-Shamma’A, A. I. (2012) ‘Proof-of-concept
microwave sensor on flexible substrate for real-time water composition
analysis’, Proceedings of the International Conference on Sensing Technology,
ICST, pp. 547–550. doi: 10.1109/ICSensT.2012.6461739.
Lars Nygaard, G., Torben Lapp, B. and Börkur Arnvidarson, N. (1993) ‘Method
of determining urea in milk’. Denmark. Available at:
https://patents.justia.com/patent/5252829.
Lee, Y. G. et al. (2009) ‘A rapid and selective method for monitoring the growth
of coliforms in milk using the combination of amperometric sensor and reducing
of methylene blue’, Sensors and Actuators, B: Chemical, 141(2), pp. 575–580.

References
Keyur H. Joshi 140
doi: 10.1016/j.snb.2009.06.028.
Li, L. L. et al. (2018) ‘An Interdigital Electrode Probe for Detection, Localization
and Evaluation of Surface Notch-Type Damage in Metals’, Sensors.
Multidisciplinary Digital Publishing Institute, 18(2), p. 371. doi:
10.3390/s18020371.
Li, X. and Jiang, Y. (2010) Design of a Cylindrical Cavity Resonator for
Measurements of Electrical Properties of Dielectric Materials, radio center
Glave university. Gavle University. Available at:
http://urn.kb.se/resolve?urn=urn:nbn:se:hig:diva-7687.
Lima, M. J. R., Fernandes, S. M. V. and Rangel, A. O. S. S. (2004) ‘Enzymatic
determination of urea in milk by sequential injection with spectrophotometric
and conductometric detection’, Journal of Agricultural and Food Chemistry,
52(23), pp. 6887–6890. doi: 10.1021/jf0488312.
Liu, C.-F. et al. (2018) ‘Improved hairpin resonator for microfluidic sensing’,
Sensors and Materials, 30(5), pp. 979–990. doi: 10.18494/SAM.2018.1801.
Lu, M. et al. (2013) ‘Milk Spoilage: Methods and Practices of Detecting Milk
Quality’, Food and Nutrition Sciences, 04(07), pp. 113–123. doi:
10.4236/fns.2013.47A014.
Luzzana, M. and Giardino, R. (1999) ‘Urea determination in milk by a differential
pH technique’, Lait, 79(2), pp. 261–267. Available at: https://hal.archives-
ouvertes.fr/hal-00929648/document.
Mamishev, A. V. et al. (2004) ‘Interdigital sensors and transducers’,
Proceedings of the IEEE, 92(5), pp. 808–844. doi:
10.1109/JPROC.2004.826603.
Matheson, A. R. and Otten, P. (1999) Automation of the Rose Gottlieb method
for fat determination in dairy products using an expert system, American
laboratory.
Mazlan, N. S. et al. (2017) ‘Interdigitated electrodes as impedance and
capacitance biosensors: A review’, AIP Conference Proceedings,
1885(October). doi: 10.1063/1.5002470.

References
Keyur H. Joshi 141
Mee Sim, M. Y. et al. (2003) ‘Monitoring of Milk Quality With Disposable Taste
Sensor’, Sensors. 11th Septe, 3(9), pp. 340–349. doi: 10.3390/s30900340.
Mehdizadeh, M. (2015a) ‘Fundamentals of field applicators and probes at
radiofrequencies and microwave frequencies’, in Microwave/RF Applicators and
Probes for Material Heating, Sensing, and Plasma Generation. Second. Denver:
Elsevier Inc., pp. 34–67. doi: http://dx.doi.org/10.1016/B978-0-323-32256-
0.00002-6.
Mehdizadeh, M. (2015b) ‘Introduction’, in Microwave/RF Applicators and Probes
for Material Heating, Sensing, and Plasma Generation. Second. Elsevier Inc.,
pp. xvii–xix. doi: 10.1016/B978-0-323-32256-0.00014-2.
Mehdizadeh, M. (2015c) ‘The impact of fields on materials at microwave and
radio frequencies’, in Microwave/RF Applicators and Probes for Material
Heating, Sensing, and Plasma Generation. Second. Elsevier Inc., pp. 1–33. doi:
10.1016/B978-0-323-32256-0.00001-4.
Ministry of Agriculture - Republic of Kenya (2011) ‘Milk testing and Quality
Control’. Naivasha: FAO/TCP/KEN/6611 Project, p. 28. Available at:
http://www.fao.org/AG/AGAInfo/resources/documents/MPGuide/mpguide2.htm.
Mohd Bahar, A. A. et al. (2017) ‘High-efficiency microwave planar resonator
sensor based on bridge split ring topology’, IEEE Microwave and Wireless
Components Letters, 27(6), pp. 545–547. doi: 10.1109/LMWC.2017.2701338.
Moore, H. C. and Morse, P. A. (1926) ‘A Babcock-Gerber Method for
Determining the Percentage of Fat in Ice Cream*’, Journal of Dairy Science.
Elsevier, 9(3), pp. 276–285. doi: 10.3168/jds.S0022-0302(26)93898-8.
Motarjemi, Y. et al. (2014) ‘Milk and Dairy Products’, in Food Safety
Management: A Practical Guide for the Food Industry, pp. 83–117. doi:
10.1016/B978-0-12-381504-0.00005-6.
Muehlhoff, E., Bennett, A. and McMahon, D. (2013) ‘Introduction’, in Muehlhoff,
E., Bennett, A., and McMahon, D. (eds) Milk and dairy products in human
nutrition. Rome: FAO Publications.
Muir, D. D. and Sweetsur, A. W. M. (1976) ‘The influence of naturally occurring

References
Keyur H. Joshi 142
levels of urea on the heat stability of bulk milk’, Journal of Dairy Research, 43,
pp. 495–499. doi: 10.1017/S0022029900016083.
Murphy, S. C. (2009) SHELF-LIFE OF MILK PRODUCTS - MICROBIAL
SPOILAGE - The Evaluation of Shelf-Life. Ithaca, New York.
My Agriculture Information Bank (2015) Milk Testing - Clot on Boiling Test
(COB), Practicals on Technology of Milk & Milk Products. Available at:
http://www.agriinfo.in/default.aspx?page=topic&superid=9&topicid=711
(Accessed: 11 March 2018).
Nascimento, C. F. et al. (2017) ‘Recent advances on determination of milk
adulterants’, Food Chemistry. Elsevier Ltd, 221, pp. 1232–1244. doi:
10.1016/j.foodchem.2016.11.034.
Di Natale, C. et al. (2000) ‘Electronic nose and electronic tongue integration for
improved classification of clinical and food samples’, Sensors and Actuators B:
Chemical, 64(1), pp. 15–21. doi: 10.1016/S0925-4005(99)00477-3.
News Desk (2012) ‘Raw Milk Still Suspect in 14 Missouri E. Coli Cases’, Food
Safety News. Available at: http://www.foodsafetynews.com/2012/05/missouri-
says-14-e-coli-cases-may-be-from-raw-milk/#.WnRXb7p2u70 (Accessed: 21
February 2018).
News Desk (2015) ‘Raw Milk Recalled in California for Campylobacter
Contamination’, Food Safety News. Available at:
http://www.foodsafetynews.com/2015/10/raw-milk-recalled-in-california-for-
campylobacter-contamination/#.VnJ4MFduTOs (Accessed: 21 February 2018).
Nicolaou-Markide, N. (2011) The use of analytical techniques for the rapid
detection of microbial spoilage and adulteration in milk, Faculty of Engineering
and Physical Sciences, School of Chemistry. The University of Manchester.
Available at:
https://www.escholar.manchester.ac.uk/api/datastream?publicationPid=uk-ac-
man-scw:122017&datastreamId=FULL-TEXT.PDF.
Nicolaou, N., Xu, Y. and Goodacre, R. (2010) ‘Fourier transform infrared
spectroscopy and multivariate analysis for the detection and quantification of

References
Keyur H. Joshi 143
different milk species.’, Journal of dairy science, 93(12), pp. 5651–5660. doi:
10.3168/jds.2010-3619.
Nikoleli, G. P., Nikolelis, D. P. and Methenitis, C. (2010) ‘Construction of a
simple optical sensor based on air stable lipid film with incorporated urease for
the rapid detection of urea in milk’, Analytica Chimica Acta. Elsevier B.V.,
675(1), pp. 58–63. doi: 10.1016/j.aca.2010.07.014.
NPCS Team (2014) Market Research Report on Milk Processing & Dairy
Products in India (Butter, Yogurt, UHT Milk, Cheese, Ice Cream, Ghee & Other
Products). NIIR Project Consultancy Services. Available at:
http://www.niir.org/books/book/market-research-report-on-milk-processing-
dairy-products-in-india-butter-yogurt-uht-milk-cheese-ice-cream-ghee-other-
products-npcs-team/isbn-9789381039496/zb,,18b7c,a,72,0,a/index.html.
Nyfors, E. (2000) ‘Industrial Microwave Sensors - A Review’, Subsurface
Sensing Technologies and Applications, 1(1), pp. 23–43.
OECD and FAO (eds) (2015) OECD-FAO Agricultural Outlook 2015-2024.
Paris: OECD Publishing. doi: 10.1787/agr_outlook-2015-en.
Osman, S. B. et al. (2014) ‘Application of Microwave Spectroscopy Analysis on
Determining Quality of Vegetable Oil’, in Proceedings of the 8th International
Conference on Sensing Technology. Liverpool, pp. 556–559. Available at:
http://s2is.org/ICST-2014/papers/1569978577.pdf.
Paradkar, M. M., Singhal, R. S. and Kulkarni, P. R. (2000) ‘An approach to the
detection of synthetic milk in dairy milk : 1. Detection of urea’, International
Journal of Dairy Technology, 53(3), pp. 87–91. doi: 10.1111/j.1471-
0307.2000.tb02666.x.
Povolo, M. and Contarini, G. (2009) ‘Fast gas chromatography: Applications in
milk fat analysis’, Lipid Technology, 21(4), pp. 88–90. doi:
10.1002/lite.200900018.
Puckett, L. G. et al. (2003) ‘Monitoring blood coagulation with magnetoelastic
sensors’, Biosensors and Bioelectronics, 18(5–6), pp. 675–681. doi:
10.1016/S0956-5663(03)00033-2.

References
Keyur H. Joshi 144
Reinemann, D. J. and Helgren, J. M. (2004) ‘Online Milk Sensing Issues for
Automatic Milking’, 0300(04).
Renny, E. F. et al. (2005) ‘Enzyme based sensor for detection of urea in milk’,
Biotechnology and Biotechnological Equipment, 19(2), pp. 198–201. doi:
10.1080/13102818.2005.10817216.
Rivadeneyra, A. et al. (2016) ‘Printed electrodes structures as capacitive
humidity sensors: A comparison’, Sensors and Actuators A: Physical. Elsevier,
244, pp. 56–65. doi: 10.1016/J.SNA.2016.03.023.
Romaniuk, R. S. and Dorosz, J. (2006) ‘Technology of soft-glass optical fiber
capillaries’, Photonics Applications in Astronomy, Communications, Industry,
and High-Energy Physics Experiments 2006, (October), p. 634710.1--634710.9.
doi: 10.1117/12.714619.
Ruan, C., Zeng, K. and Grimes, C. a. (2003) ‘A mass-sensitive pH sensor
based on a stimuli-responsive polymer’, Analytica Chimica Acta, 497(1–2), pp.
123–131. doi: 10.1016/j.aca.2003.08.051.
Sagawa, M., Takahashi, K. and Makimoto, M. (1989) ‘Miniaturized Hairpin
Resonator Filters And Their Application To Receiver Front-End Mic’S’, IEEE
Transactions on Microwave Theory and Techniques, 37(12), pp. 1991–1997.
doi: 10.1109/22.44113.
Santos, M. V et al. (2003) ‘Sensory threshold of off-flavors caused by
proteolysis and lipolysis in milk.’, Journal of dairy science. Elsevier, 86(5), pp.
1601–1607. doi: 10.3168/jds.S0022-0302(03)73745-X.
Saxena, S. (2016) ‘Is the Milk You’re Drinking safe? 4 Easy Ways to Spot
Adulteration’, NDTV FOOD, 18 March. Available at: http://food.ndtv.com/food-
drinks/is-the-milk-youre-drinking-safe-easy-ways-to-spot-adulteration-1288174.
Sharma, P., Lao, L. and Falcone, G. (2018) ‘A Microwave Cavity Resonator
Sensor for Water-In-Oil Measurements’, Sensors and Actuators B: Chemical.
Elsevier B.V., 262, pp. 200–210. doi: 10.1016/j.snb.2018.01.211.
Siirtola, T. V. A. (2000) ‘Quality Control Manual: Raw Milk and Milk Products’.
Apia: FAO: Establishment of Regional Reference Centre for Milk Processing

References
Keyur H. Joshi 145
and Marketing. Available at:
http://www.fao.org/ag/againfo/themes/documents/lps/dairy/dap/qcm1.htm
(Accessed: 11 March 2018).
Singh, K., Soni, B. K. and Nirmal, A. V. (2018) ‘Wideband microstrip band stop
filters realization with interdigital topologies’, International Journal of Information
Technology. Springer Singapore. doi: 10.1007/s41870-018-0151-y.
Singuluri, H. and Sukumaran, M. (2014) ‘Milk Adulteration in Hyderabad, India –
A Comparative Study on the Levels of Different Adulterants Present in Milk’,
Journal of Chromatography & Separation Techniques, 05(01), pp. 1–3. doi:
10.4172/2157-7064.1000212.
Subramanian, A., Prabhakar, V. and Rodriguez-Saona, L. (2011) ‘Analytical
Methods | Infrared Spectroscopy in Dairy Analysis’, Encyclopedia of Dairy
Sciences. Second. Elsevier. doi: 10.1016/B978-0-12-374407-4.00011-X.
The Dairy Council (2016) ‘Milk Factsheet’, The Dairy Council. London: The
Dairy Council. Available at:
http://www.milk.co.uk/resources/resource.aspx?intResourceID=153.
The Hans India (2017) ‘Milk adulteration racket busted; 11 held’, 15 February.
Available at: http://www.thehansindia.com/posts/index/Crime/2017-02-15/Milk-
adulteration-racket-busted-11-held/280780.
Townes, C. (1952) ‘The present status of microwave spectroscopy’, Annals of
the New York Academy of Sciences, 55, pp. 745–750. doi: 10.1111/j.1749-
6632.1952.tb26592.x.
Trivedi, U. B. et al. (2009) ‘Potentiometric biosensor for urea determination in
milk’, Sensors and Actuators, B: Chemical, 140(1), pp. 260–266. doi:
10.1016/j.snb.2009.04.022.
Wahba, W., Abdalla, M. A. and Allam, A. M. M. (2016) ‘Experimental verification
of a compact zeroth order metamaterial substrate integrated waveguide
antenna’, Progress In Electromagnetics Research C, 67(May), pp. 193–201.
doi: 10.2528/PIERC16052906.
Wangler, T. P., Wangler, T. P. and Wiley InterScience (Online service) (2008)

References
Keyur H. Joshi 146
RF Linear Accelerators. 2nd, Compl edn. Wiley. Available at:
https://www.wiley.com/en-
gb/RF+Linear+Accelerators,+2nd,+Completely+Revised+and+Enlarged+Edition
-p-9783527406807 (Accessed: 5 June 2018).
WHO (2009) Toxicological and Health Aspects of Melamine and Cyanuric Acid.
Ottawa. Available at:
http://www.who.int/foodsafety/publications/chem/Melamine_report09.pdf.
WHO (2017) Food Safety, World Health Organisation. Available at:
http://www.who.int/news-room/fact-sheets/detail/food-safety (Accessed: 7
August 2018).
Winquist, F. et al. (1998) ‘Monitoring of freshness of milk by an electronic
tongue on the basis of voltammetry’, Measurement Science and Technology.
17th Septe, 9(12), pp. 1937–1946. doi: 10.1088/0957-0233/9/12/002.
Yagoub, S. O., Bellow, F. A. and El Zubeir, I. E. M. (2008) ‘Effect of
Temperature and Storage Period on the Constituents of Milk Inoculated with
Pseudomonas aeruginosa’, Research Journal of Microbiology, 3(1), pp. 30–34.
Zarifi, M. H., Thundat, T. and Daneshmand, M. (2015) ‘High resolution
microwave microstrip resonator for sensing applications’, Sensors and
Actuators A, 233, pp. 224–230. doi: 10.1016/j.sna.2015.06.031.
Zhu, X. et al. (2015) ‘Dielectric Properties of Raw Milk as Functions of Protein
Content and Temperature’, pp. 670–680. doi: 10.1007/s11947-014-1440-5.

Keyur H. Joshi 147
APPENDIX A
ABBREVIATIONS AND ACRONYMS
ADSA American Dairy Science Association
API Analytical Profile Index
BMSRT Bridge Multiple Split Ring Resonator Topology
BTB Bromothymol Blue
C. burnetii Coxiella burnetii
COB Clot On Boiling
COSHH Control of Substances Hazardous to Health (Regulations)
DT Detection Time
EM Electromagnetic
FAO Food and Agriculture Organisation
HUS Hemolytic Uremic Syndrome
E. coli Escherichia coli
EU European Union
FR-4 Reinforced epoxy laminate (Fibre)
FSA Food Standards Agency
FSSAI Food Safety and Standards Authority of India
FT-IR Fourier Transform-Infra Red
GC Gas Chromatography
GC/IDMS Gas Chromatography/Isotope Dilution Mass Spectrometry
HTST High Temperature-Short Time
IDE Interdigitated Electrodes
IR Infra-Red
ISM Industrial, Scientific and Medical
ITU International Telecommunication Union
L. monocytogenes Listeria monocytogenes
LASER Light Amplification by Stimulated Emission of Radiation
LJMU Liverpool John Moores University
LOD Limit of Detection
LTLT Low Temperature-Long Time
M. tuberculosis Mycobacterium tuberculosis

Abbreviations and Acronyms
Keyur H. Joshi 148
MOS Metal Oxide Semiconductor
MOSFET Metal Oxide Semiconductor Field Effect Transistor
MUT Material Under Test
NIR Near Infra-Red
NPCS NIIR Project Consultancy Services
NPN Non-Protein Nitrogen
OECD Organisation for Economic Cooperation and Development
PCA Principal Component Analysis
PLS Partial Least Squares
RADAR Radio Detection And Ranging
RC Resistance Capacitance
RFM Radio Frequency and Microwave
S. aureus Staphylococcus aureus
S. marcescens Serratia marcescens
SAW Surface Acoustic Wave
SIMCA Soft Independent Modelling of Class Analogy
SNF Solid Non-Fat
SPEAG Schmid & Partner Engineering AG
SPSS Statistical Programme for Social Scientist
Ssp. anaerobius Subspecies anaerobius
SW NIR Short Wavelength Near Infra-Red
TOSM Through Open Short Match
TVC Total Viable Count
UHT Ultra-High Temperature
US United States
UV Ultra Violet
VIS Visible spectrum
VNA Vector Network Analyser
WHO World Health Organisation

Keyur H. Joshi 149
APPENDIX B
NOMENCLATURE
Ag Argentum (Silver)
AgCl Argentum (Silver) chloride
BH3O3 Boric acid
°C Degree Celsius
Cal Calorie (unit of energy)
CO(NH₂)₂ Urea
dB Decibel; the ratio of one value of a physical property to another on
a logarithmic scale (Power Ratio: 10 ^ 1 ⁄10)
dBm Decibel-milliwatt; the power ratio in decibels (dB) of the measured
power referenced to one milliwatt (mW)
∇ Curl operator (vector operator that describes the infinitesimal
rotation of a vector field in three-dimensional Euclidean space)
[called: Del or Nabla Symbol]
∇2
Laplace operator or Laplacian (differential operator given by the
divergence of the gradient of a function on Euclidean space)
Electric Field Vector
ε Complex-valued dielectric permittivity
휀0 Permittivity in free space (8.85 × 10⁻¹² 𝐹/𝑚)
ε′ Real component of complex-valued dielectric permittivity
(Relative permittivity)
ε′′ Imaginary component of complex-valued dielectric permittivity
(Dielectric loss factor)
F Farad (SI unit of capacitance: 1 Farad = 1 Coulomb / 1 Volt)
f frequency (of signal waves)
g gram (unit of mass)
GHz Giga Hertz (109 Hz)
H Henry (SI unit of inductance: 1 Henry = 1 Weber / 1 Ampere)
Magnetic Field Vector (H: magnetic field strength; Ampere / metre)
H2O Water
H2O2 Hydrogen Peroxide
Hz Hertz (unit of frequency)
J Joule (unit of energy)
𝐽 Current density (Ampere / metre2)

Nomenclature
Keyur H. Joshi 150
j Complex operator (√−1)
𝑘 Wave number (𝑘 = 𝜔√𝜇휀)
kcal Kilo calorie (103 Cal)
KHz Kilo Hertz (103 Hz)
kJ Kilo Joule (103 J); 1 kJ = 0.239006 Calorie
m Metre (unit of length)
mg Milligram
MHz Mega Hertz (106 Hz)
ml Millilitre
mm Millimetre
ms millisecond
NaCl Sodium Chloride (Salt)
NH3 Ammonia
NH4+ Ammonium
pH Hydrogen ion concentration
r / R Correlation Coefficient
r2 / R2 Coefficient of Determination
S11 Scattering Parameter (input port-1 reflection coefficient)
S21 Scattering Parameter (input port-1 to output port-2 transmission
coefficient)
tan 𝛿 Loss Tangent (
𝜀𝑟′′
𝜀𝑟′ )
σ Sigma (Conductance)
μ Mu (Permeability)
𝜇0 Permeability in free space (4𝜋 × 10−7 𝐻/𝑚)
λ Lambda (Wavelength)
𝜔 Angular frequency (2𝜋𝑓)
Wb Weber (SI unit of magnetic flux)

Keyur H. Joshi 151
APPENDIX C
COSHH
COSHH Risk Assessment Form Name of Faculty Faculty of Engineering and Technology
Name of School/Dept. School of Built Environment / BEST Research Institute
Date of Assessment 10th February 2017
Site/Location/Room No. Industrial Chemistry Lab, Laboratory 4
Description of Activity/Procedure/Process (include SOPs as a Control) Adulteration of milk with Urea, Use of DMAB, HCL, TCA, Phosphate pH 7.0 Buffer
Name of Techniques to be Used Sample preparation, Centrifugation, Spectrophotometry
Name of Assessor/Supervising Assessor Keyur Joshi / Prof. Andy Shaw
Signature K. H. Joshi / A. Shaw
Tel No. 01512314252 E-mail [email protected]
Persons at Risk (Staff/Students/Others?) Low risk to student
Total number of people in lab Maximum 5 people
Is Health Surveillance Required? No Health Surveillance is required if the procedure involves substances which are respiratory sensitisers or skin sensitisers (risk phrases R42, R43 or R42/43). If other substances with potential health effects are used and if any health effects are observed that is believed to have resulted from its use then Occupational Health should be contacted. Consideration should be made of the existing health status of the user of hazardous substances. Are special arrangements required? E.g. for types of PPE, Is a pregnancy risk assessment required?(refer to SCP 33 this should be undertaken by the H&S Unit)
Duration of Exposure: mins/hrs 3 hours
Are there any Ethical Issues? None (Attach Consents)
Emergency Contact Names Dr Montse Ortoneda
Tel No: 01512312244
Description of Waste Disposal Methods: Wash it with copious water.
Emergency Action Procedures (spillages/ leaks, first aid, fire & explosion) Any spillages should be diluted and washed away with large amount of water taking care to avoid splashing.

COSHH
Keyur H. Joshi 152
Does the experiment run overnight or at weekends unattended? Has the appropriate form been completed? No
Training/Direct Supervision Requirements Only trained students should handle the chemicals.
Business Interruption (e.g. power shutdown, fire, flood) What are the Contingency Procedures for work and waste? Electricity to the fume extraction cabinet should never be cut off.
Risk Evaluation, Handling and Storage Comments Ensure good ventilation/exhaustion at the workplace. Avoid contact with skin, eyes and clothing. Avoid breathing dust. Use personal protection equipment. Wash hands.
COSHH MATERIAL SAFETY DATA TECHNIQUE/METHOD TITLE:
Hazardous Substance
(Including Organisms)
Hazard Type
State e.g. solid,
liquid, gas
Quantity
used
Route of entry & Target Organs
WEL
Controls and Precautions
Disposal route, Spillage procedure
Emergency procedures
p-
Dimethylaminobenzaldehyde (DMAB)
Harmful if swallowed
Solid 100g (Max)
Eyes, mouth (swallowing), respiratory system and skin
Do not breathe dust. Use personal protective equipment as required. Do not get in eyes, on skin, or on clothing. Wash thoroughly after handling. Do not eat, drink or smoke when using this product. If swallowed, Call a poison centre/doctor if you feel unwell. Rinse mouth. Do NOT induce vomiting. Protect from sunlight.
Do not allow product to reach sewage system. This product may be mixed with a combustible solvent and burned in a chemical incinerator equipped with an After-burner and scrubber. This product can also be sent to an EPA approved waste disposal facility. Dilute with plenty of water. Do not allow to enter sewers/ surface or ground water. Use cleansing agent if required along with water.
Hazard Statement · Not a hazardous substance or mixture according to Regulation (EC) No. 1272/2008. · This substance is not classified as dangerous according to Directive 67/548/EEC.

COSHH
Keyur H. Joshi 153
Description of first aid measures
· General information: Symptoms of poisoning may even occur after several hours; therefore medical observation for at least 48 hours after the
accident. · After inhalation: Remove affected person to fresh air. Seek medical attention if symptoms persist. · After skin contact: Immediately flush with plenty of water for at least 15 minutes. Remove contaminated clothing and shoes.
Seek medical assistance. · After eye contact: Hold eyelids apart and flush eyes with plenty of water for at least 15 minutes. Get medical attention. · After swallowing: Immediately call a doctor. Do not induce vomiting. If conscious, rinse mouth with water ensuring that the
rinse is not swallowed
Accidental Release Measures
· Personal precautions, protective equipment and emergency procedures
Wear protective equipment. Keep unprotected persons away. Avoid formation of dust. Avoid breathing dust. · Environmental precautions:
Dilute with plenty of water. Do not allow to enter sewers/ surface or ground water. · Methods and material for containment and cleaning up:
Use the appropriate tools to collect the material and dispose of it in an approved waste disposal container.
Fire-fighting Measures Use water spray, alcohol-resistant foam, dry chemical or carbon dioxide.
Urea Not
Hazardous Solid
100g (Max)
Eyes, mouth (swallowing), respiratory system and
skin
Avoid dispersal of spilt material and runoff and contact with soil, waterways, drains and sewers. Inform the relevant authorities if the product has caused environmental pollution (sewers, waterways, soil or air). Eating, drinking and smoking should be prohibited in areas where this material is handled, stored and processed. Workers should wash hands and face before eating, drinking and smoking. Remove contaminated clothing and protective equipment before entering eating areas.
Put on appropriate personal protective equipment. Avoid the creation of dust when handling and avoid all possible sources of ignition (spark or flame). Prevent dust accumulation. Use only with adequate ventilation. Electrical Equipment and lighting should be protected to appropriate standards to prevent dust being exposed to hot surfaces, sparks or other ignition sources. Take precautionary measures against electrostatic discharges. To avoid fire or explosion, dissipate static electricity during transfer by earthing and bonding containers and equipment before transferring material.
Hazard Statement No known significant effects or critical hazards
Description of first aid measures
· Contact with Skin
Wash the affected area thoroughly with clean water and soap. · Contact with Eyes
Rinse with plenty of clean water for a minimum of 15 minutes; if irritation of eyes persists, obtain medical attention. · Ingestion
Do not induce vomiting. Give patient water to drink. Obtain medical attention if more than 30ml swallowed. · Inhalation
Remove patient from contaminated area to an area with a source of fresh air.
Fire-fighting Measures · Use dry chemical powder.
Do not use water jet

COSHH
Keyur H. Joshi 154
HCl Dangerous Liquid 100ml (Max)
Eyes, mouth (swallowing), respiratory system and
skin
1 ppm (8-hr) 5 ppm (15-min)
Avoid breathing dust/ fume/ mist/ vapours/ spray. Wash skin thoroughly after handling. Use only outdoors or in a well-ventilated area. Wear protective gloves/ protective clothing/ eye protection/ face protection. Wash contaminated clothing before reuse.
Keep only in original container. Absorb spillage to prevent material damage. Store in a well-ventilated place. Keep container with a resistant inner liner. Store locked up. Store in corrosive resistant stainless steel container with a resistant inner liner. Dispose of contents/ container to an approved waste disposal plant.
Hazard Statement · May be corrosive to metals. · Causes severe skin burns and eye damage.
Description of first aid measures
· If swallowed: Rinse mouth. Do NOT induce vomiting. · If on skin (or hair): Remove/Take off immediately all contaminated clothing. Rinse skin with water. Shower · If inhaled: Remove victim to fresh air and keep at rest in a position comfortable for breathing. Immediately call a POISON CENTER or doctor /
physician. · If in eyes: Rinse cautiously with water for several minutes. Remove contact lenses, if present and easy to do. Continue rinsing. Immediately call a
POISON CENTER or doctor / physician.
Fire-fighting Measures · Use water spray, alcohol-resistant foam, dry chemical or carbon dioxide.
TCA Dangerous Solid 250g (Max)
Eyes, mouth (swallowing), respiratory system and
skin
Avoid release to the environment. Wear protective gloves/ protective clothing/ eye protection / face protection. Use personal protective equipment. Avoid dust formation. Avoid breathing vapours, mist or gas. Ensure adequate ventilation. Evacuate personnel to safe areas. Avoid breathing dust
Collect spillage. Pick up and arrange disposal without creating dust. Sweep up and shovel. Keep in suitable, closed containers for disposal. Prevent further leakage or spillage if safe to do so. Do not let product enter drains. Discharge into the environment must be avoided.
Hazard Statement · Causes severe skin burns and eye damage. · Very toxic to aquatic life with long lasting effects.
Description of first aid measures
· General advice
Consult a physician. Show this safety data sheet to the doctor in attendance. · If on skin (or hair): Take off immediately all contaminated clothing. Rinse skin with water/shower. Take off contaminated clothing and shoes
immediately. Wash off with soap and plenty of water. Consult a physician. · If inhaled: If breathed in, move person into fresh air. If not breathing, give artificial respiration. Consult a physician. Remove person to fresh air and
keep comfortable for breathing. Immediately call a POISON CENTER or doctor/ physician. · If in eyes: Rinse cautiously with water for several minutes. Remove contact lenses, if present and easy to do. Continue rinsing. Rinse thoroughly with
plenty of water for at least 15 minutes and consult a physician. · If Swallowed: Do NOT induce vomiting. Never give anything by mouth to an unconscious person. Rinse mouth with water. Consult a physician.
Fire-fighting Measures Use water spray, alcohol-resistant foam, dry chemical or carbon dioxide.

COSHH
Keyur H. Joshi 155
Phosphate pH 7 Buffer Slightly
Hazardous Liquid
1L (Max)
Eyes, mouth (swallowing), respiratory system and
skin
Provide exhaust ventilation or other engineering controls to keep the airborne concentrations of vapours below their respective threshold limit value. Personal Protection: Safety glasses. Lab coat. (In Case of a Large Spill: Splash goggles. Full suit. Boots. Gloves.) Suggested protective clothing might not be sufficient; consult a specialist BEFORE handling this product.
Keep locked up. Do not ingest. Do not breathe gas/fumes/ vapour/spray. Wear suitable protective clothing. If ingested, seek medical advice immediately and show the container or the label. Keep container tightly closed. Keep container in a cool, well-ventilated area. Do not store above 25°C (77°F).
Accidental Release Measures
· Small Spill: Dilute with water and mop up, or absorb with an inert dry material and place in an appropriate waste disposal container. If necessary:
Neutralize the residue with a dilute solution of acetic acid. Finish cleaning by spreading water on the contaminated surface and dispose of according to local and regional authority requirements. · Large Spill: Poisonous liquid. Stop leak if without risk. Do not get water inside container. Do not touch spilled material. Use water spray to reduce
vapours. Prevent entry into sewers, basements or confined areas; dike if needed. Call for assistance on disposal. Neutralize the residue with a dilute solution of acetic acid. Finish cleaning by spreading water on the contaminated surface and allow evacuating through the sanitary system.
Description of first aid measures
· Eye Contact: Check for and remove any contact lenses. In case of contact, immediately flush eyes with plenty of water for at
least 15 minutes. Cold water may be used. Get medical attention if irritation occurs. · Skin Contact: Wash with soap and water. Cover the irritated skin with an emollient. Get medical attention if irritation develops.
Cold water may be used. · Inhalation: If inhaled, remove to fresh air. If not breathing, give artificial respiration. If breathing is difficult, give oxygen. Get
medical attention. · Ingestion: If swallowed, do not induce vomiting unless directed to do so by medical personnel. Never give anything by mouth
to an unconscious person. Loosen tight clothing such as a collar, tie, belt or waistband. Get medical attention immediately.
COMMENTS: Attach any additional hazard data, consider any substance with an allocated WEL. Use EH40 Guidance HSE
OVERALL RISK RATING
HIGH MEDIUM LOW
Medium

Keyur H. Joshi 156
APPENDIX D
PUBLICATIONS
K H Joshi, A Mason, O Korostynska, A Al-Shamma'a. Milk Quality Monitoring
Using Electromagnetic Wave Sensors. Sensors for Everyday Life: Environmental
and Food Engineering. S. C. Mukhopadhyay, O. A. Postolache, K. P.
Jayasundera and A. K. Swain. Cham, Springer International Publishing, 2017,
pp. 205-227. doi:10.1007/978-3-319-47322-2_10.
K H Joshi, M Al-Mansara, A Mason, O Korostynska, A Powell, M Ortoneda-
Pedrola, and A Al-Shamma'a, "Detection of Heparin Level in Blood Using
Electromagnetic Wave Spectroscopy," 9th International Conference on
Developments in eSystems Engineering (DeSE), Liverpool, 2016, pp. 329-334.
doi:10.1109/DeSE.2016.51.
K H Joshi, A Mason, A Shaw, O Korostynska, J D Cullen and A Al-Shamma'a,
"Online monitoring of milk quality using electromagnetic wave sensors," 9th
International Conference on Sensing Technology (ICST), Auckland, 2015, pp.
700-705. doi: 10.1109/ICSensT.2015.7438487. K H Joshi, P Kot, A Shaw, and S Wylie, " Determining the Dielectric Property of
Milk Products for Online Quality Monitoring using Microwave Spectroscopy," 4th
Faculty of Engineering and Technology Research Week, Liverpool John Moores
University, Liverpool, 2018.
K H Joshi, A Shaw, A Mason, O Korostynska, and A Al-Shamma'a, "Detection of
adulteration in milk products using electromagnetic wave sensors,” 3rd Faculty of
Engineering and Technology Research Week, Liverpool John Moores University,
2017, Liverpool, 2017, pp. 99-103. Available:
https://www.ljmu.ac.uk/~/media/files/ljmu/research/centres-and-institutes/
engineering-and-tech/fet_frw_proceedings_2017.pdf.

Publications
Keyur H. Joshi 157
K H Joshi, A Mason, O Korostynska, A Shaw, J D Cullen and A Al-Shamma’a,
“Determining overall quality of milk products using microwave spectroscopy,” 2nd
Faculty of Engineering and Technology Research Week, Liverpool John Moores
University, Liverpool, 2016, pp. 308-314. Available:
https://www.ljmu.ac.uk/~/media/files/ljmu/research/centres-and-institutes/
engineering-and-tech/fet_frw_proceedings_2016.pdf.
K H Joshi, A Mason, A Shaw, O Korostynska, J D Cullen, and A Al-Shamma'a,
"Design and development of electromagnetic wave testing of milk quality: A novel
approach to detect spoilage and milk types," 1st Faculty of Technology and
Environment Research Week, Liverpool John Moores University, Liverpool,
2015.

![[0.95]Convolution of Barker and Golay Codes for Low ...](https://static.fdocuments.in/doc/165x107/6180716e4548e56ee55ac765/095convolution-of-barker-and-golay-codes-for-low-.jpg)
![Geomagnetic observatory GAN [width=0.95]foto/P1110555.jpg *-0.5cm](https://static.fdocuments.in/doc/165x107/58679f091a28abe83f8bdc1b/geomagnetic-observatory-gan-width095fotop1110555jpg-05cm.jpg)


![Simulation Based Optimization Strategy for Balancing ... · The layer thickness of the casting powder can be described by the equation according Hiraki [4] d 0.95 *v 0.95 [mm] cf](https://static.fdocuments.in/doc/165x107/5f37158eb28df25be42f9b43/simulation-based-optimization-strategy-for-balancing-the-layer-thickness-of.jpg)