
Determining the Impact of Alpha- Particle-Emitting ... · the Fukushima-Daiichi Disaster on...
15
2011 Robert Baumann Slide 1/15 Determining the Impact of Alpha- Particle-Emitting Contamination from the Fukushima-Daiichi Disaster on Japanese Semiconductor Manufacturing Sites Dr. Robert C. Baumann Texas Instruments Fellow / IEEE Fellow
Transcript of Determining the Impact of Alpha- Particle-Emitting ... · the Fukushima-Daiichi Disaster on...
2011
Robert Baumann
Slide 1/15
Determining the Impact of Alpha-
Particle-Emitting Contamination from
the Fukushima-Daiichi Disaster on
Japanese Semiconductor
Manufacturing Sites
Dr. Robert C. Baumann
Texas Instruments Fellow / IEEE Fellow

2011
Robert Baumann
Slide 2/15
What happened at Fukushima-Daiichi?
Are beta and gamma emitters a concern for Silicon devices?
Did any alpha-emitters get out?
Did they disperse? If so, how far and in what concentrations?
What is the size distribution of particulates? Can they breach clean
room filters?
Can we detect any activity on wafers exposed during the disaster?
Summary of analysis – Did the nuclear incident impact
manufacturing in Japan from an SER risk point-of-view?
Questions to be Addressed
2011
Robert Baumann
Slide 3/15
From http://cryptome.org/eyeball/daiichi-npp/daiichi-photos.htm
Tokyo
Mihomura
Aizuwakamatsu
FukushimaDaiichi
~ 100km
~ 160km
JAPAN
Tokyo
Mihomura
Aizuwakamatsu
FukushimaDaiichi
~ 100km
~ 160km
JAPAN
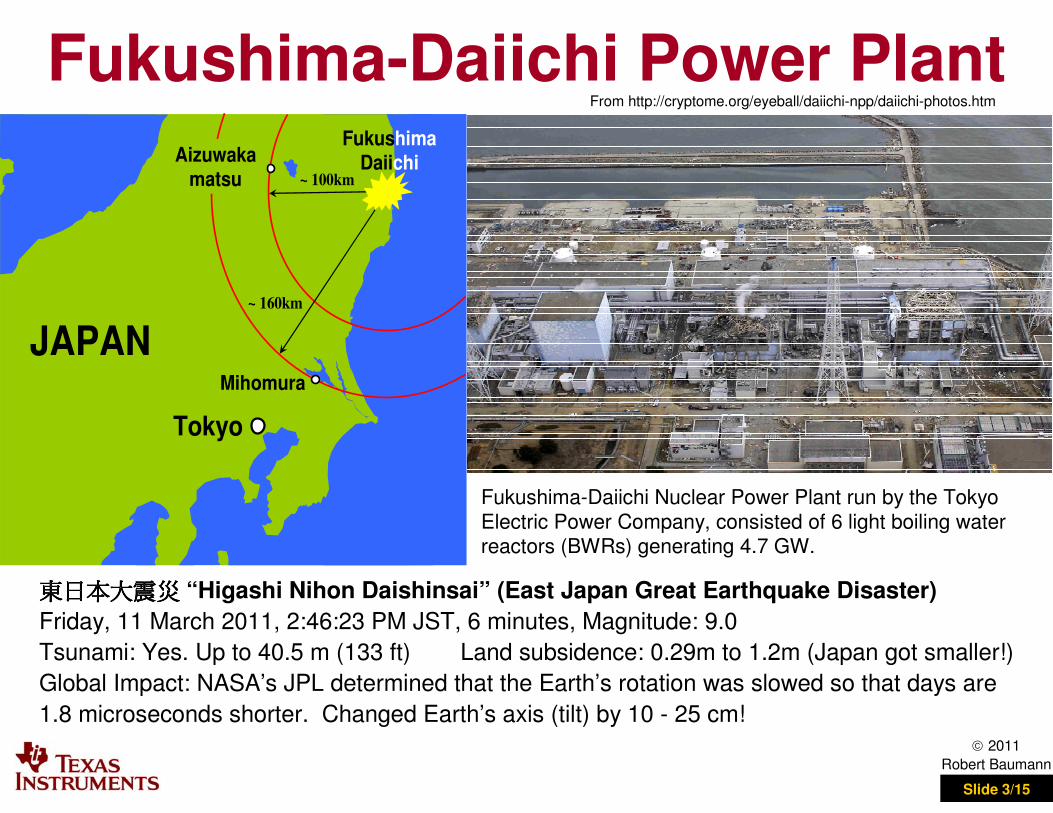
Fukushima-Daiichi Power Plant
東日本大震災東日本大震災東日本大震災東日本大震災 “Higashi Nihon Daishinsai” (East Japan Great Earthquake Disaster)
Friday, 11 March 2011, 2:46:23 PM JST, 6 minutes, Magnitude: 9.0
Tsunami: Yes. Up to 40.5 m (133 ft) Land subsidence: 0.29m to 1.2m (Japan got smaller!)
Global Impact: NASA’s JPL determined that the Earth’s rotation was slowed so that days are
1.8 microseconds shorter. Changed Earth’s axis (tilt) by 10 - 25 cm!
Fukushima-Daiichi Nuclear Power Plant run by the Tokyo
Electric Power Company, consisted of 6 light boiling water reactors (BWRs) generating 4.7 GW.

2011
Robert Baumann
Slide 4/15
What Exactly Happened?
From:http://en.wikipedia.org/wiki/File:Fukushima_I_nuclear_accidents_diagram.svg
The loss of offsite power (earthquake) and onsite AC
power (tsunami), combined with the rapid discharge of the DC batteries led to a complete station blackout.
Blackout disabled the Emergency Core Cooling System
which led to fuel and containment overheating and
damage.
Rapid oxidation at high temperatures (usual core temp 250C, w/o cooling > 2000C) and generation of large
amounts of H2 led to the explosion/destruction of the outer building structures at Units 1 and 3.
Venting of hydrogen into buildings 2 and 4 is assumed
to be the cause of the subsequent fires and explosions in those structures. Units 5 & 6 were undamaged and
were off line prior to the disaster.
Apparently explosions destroyed outer building only
and core and containment structures were fairly well maintained.
Spent fuel pools appear to have remained underwater
despite earlier fears of air exposure. But several of the cores appear to have partially melted.
http://mitnse.com/2011/08/07/updated-mit-faculty-report-on-fukushima/fukushima-lessons-learned-mit-nsp-025_rev1/
2011
Robert Baumann
Slide 5/15
235U
nucleus
neutron Fission
Fragment
Fission
Fragment
neutron
neutron
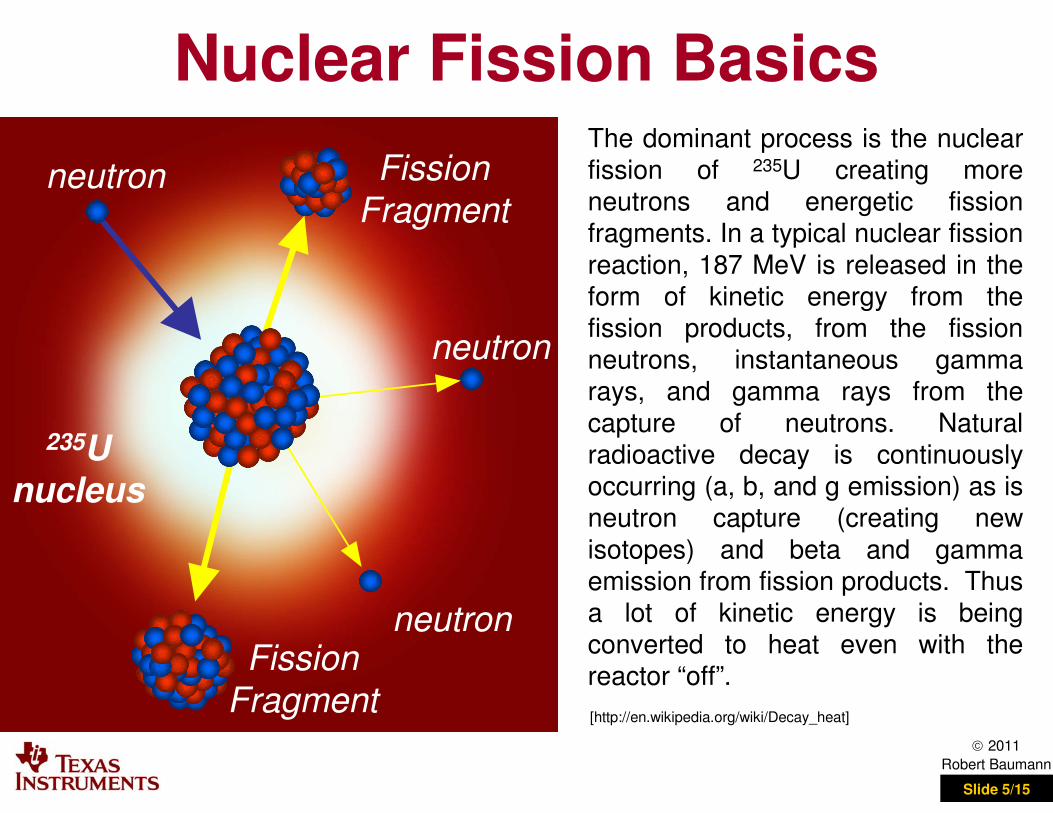
The dominant process is the nuclear
fission of 235U creating more
neutrons and energetic fission
fragments. In a typical nuclear fission
reaction, 187 MeV is released in the
form of kinetic energy from the
fission products, from the fission
neutrons, instantaneous gamma
rays, and gamma rays from the
capture of neutrons. Natural
radioactive decay is continuously
occurring (a, b, and g emission) as is
neutron capture (creating new
isotopes) and beta and gamma
emission from fission products. Thus
a lot of kinetic energy is being
converted to heat even with the
reactor “off”.
[http://en.wikipedia.org/wiki/Decay_heat]
Nuclear Fission Basics

2011
Robert Baumann
Slide 6/15
From http://en.wikipedia.org/wiki/File:Reaktor.svg
The removal of the decay heat is a significant reactor safety concern. Failure to remove
decay heat may cause the reactor core temperature to rise to dangerous levels.
(typical spent nuclear fuel generates about 10 kW of decay heat per ton of fuel)
http://en.wikipedia.org/wiki/Decay_heat
Problems with losing your cool

2011
Robert Baumann
Slide 7/15
0.01
0.1
1
10
0 5 10
Incident Particle Energy (MeV)
dE
/dx
(fC
/µm
) in
Sili
co
n
electrons (-β particles and from γphoton interactions)
α particles
16 fC/µm
0.18 fC/µm
Which radiations matter?
For silicon devices, alpha-particle emitting
contamination is the biggest concern.
90 110 15013070 170
0.02
0.04
0.06
0.08
137Cs
134Cs
Yie
ld F
raction
Mass Number of Fission Fragment
134I
131I
For humans, the β− and γ− emitting fission fragments are a major concern.

2011
Robert Baumann
Slide 8/15
1.3E-063.8E-021.8E+01α0.004%244Cm
1.5E-102.8E-062.46E+05α0.006%234U
1.8E-071.6E-034.4E+02α0.012%241Am
1.6E-103.2E-072.1E+06α0.049%237Np
1.0E-091.8E-063.8E+05α0.056%242Pu
1.6E-061.6E-034.3E+02β, α∗0.102%241Pu
2.2E-071.0E-046.7E+03α0.212%240Pu
1.5E-072.9E-052.4E+04α0.520%239Pu
1.4E-103.0E-082.3E+07α0.460%236U
7.9E-129.8E-107.0E+08α0.800%235U
β3.481%Fiss. frag.
1.5E-101.6E-104.5E+09α94.300%238U
% Specific Activity
Activity (year
-1)
Half-life (years)
Type%
AbundanceIsotope
What makes up “spent” fuel?
2011
Robert Baumann
Slide 9/15
1 2 3 4 5 6 7 8
Measurement Location
10-8
10-6
10-4
10-2
10 0
10 2
Activity (
Bq
/m3)
Sum Detected
Activity
238Pu activity
239Pu activity
234U activity
235U activity
238U activity
Natural Outdoor Radon Background
1 2 3 4 5 6 7 8
Measurement Location
10-8
10-6
10-4
10-2
10 0
10 2
Activity (
Bq
/m3)
Sum Detected
Activity
238Pu activity
239Pu activity
234U activity
235U activity
238U activity
Natural Outdoor Radon Background
Riverside, CA86798
Anaheim, CA86497
San Fran., CA80636
Seattle, WA74735
Hawaii, HI58994
Alaska, AK45773
Guam, GU27202
Saipan, CNMI25451
Location Distance (km)* Num.
Riverside, CA86798
Anaheim, CA86497
San Fran., CA80636
Seattle, WA74735
Hawaii, HI58994
Alaska, AK45773
Guam, GU27202
Saipan, CNMI25451
Location Distance (km)* Num.
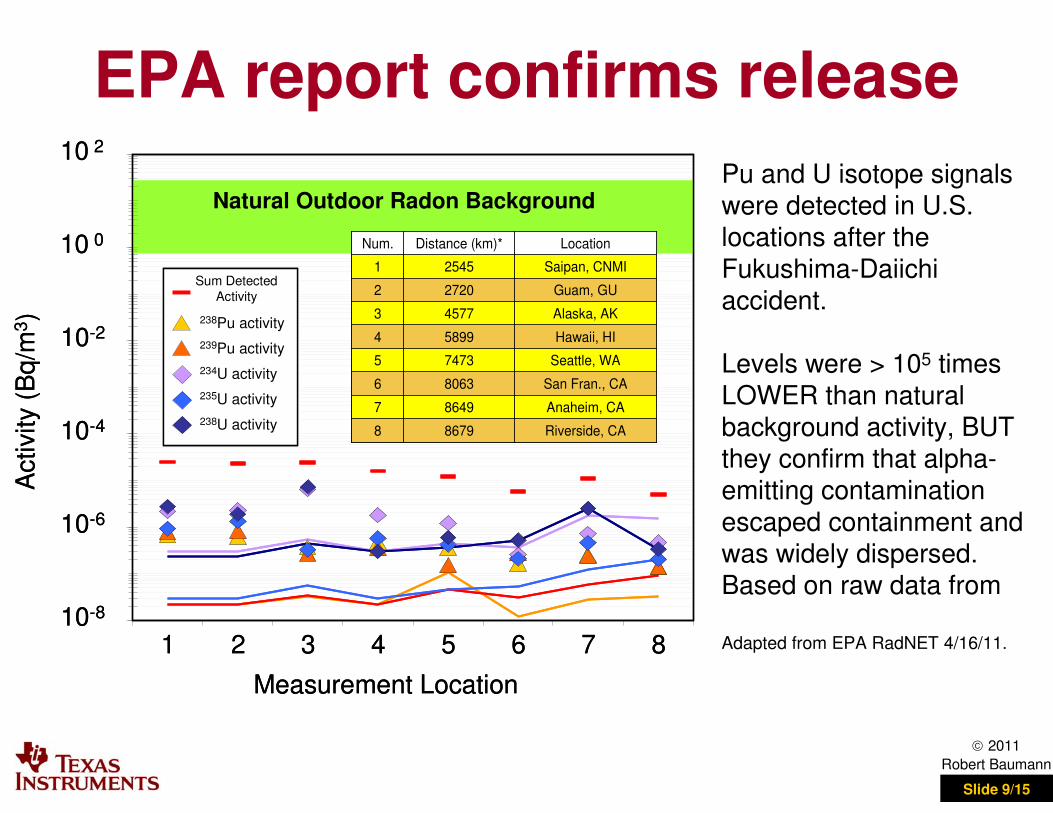
Pu and U isotope signals
were detected in U.S.
locations after the
Fukushima-Daiichi
accident.
Levels were > 105 times
LOWER than natural
background activity, BUT
they confirm that alpha-
emitting contamination
escaped containment and
was widely dispersed.
Based on raw data from
Adapted from EPA RadNET 4/16/11.
EPA report confirms release

2011
Robert Baumann
Slide 10/15
From TEPCO press release (May 3, 2011)
238Pu
239Pu
240Pu
234U
235U
238U
241Am
242Cm
243Cm
244Cm
0.21 0.063 0.063 7.2 0.32 8.2 0.027 2.4 0.19 0.19
ND - 0.15 ND - 0.15
Detected Soil Activity 500m from Reactors (Bq/kg dry soil)
Ratio of nuclides same as spent fuel
in reactors 1 and 3
Soil background
levels in Japan
Early TEPCO press releases claimed no actinide isotopes above background
levels. Later soil activity measurements reveal non-background U/Pu/Am/Cm
contamination from nuclear fuel - confirming release of contamination from the
incident.
Higher concentrations of contamination are possible further away from plant
due to wind action but Gaussian plume models cannot accurately predict
distribution due to lack of timely air measurements for actinide contamination.
TEPCO report confirms release

2011
Robert Baumann
Slide 11/15
EXPLOSIVE & BUOYANT RISE
WIND Wet
deposition
Dry
deposition resuspension
POWER
PLANT
PLUME
IMPACTION
TURBULENT MIXING
Absorption by soil, vegetation, bodies of water
MOUNTAIN
CLOUD
Dissolved volatiles and non volatiles
WASTE HEAT
EXPLOSIVE & BUOYANT RISE
WIND Wet
deposition
Dry
deposition resuspension
POWER
PLANT
PLUME
IMPACTION
TURBULENT MIXING
Absorption by soil, vegetation, bodies of water
MOUNTAIN
CLOUD
Dissolved volatiles and non volatiles
WASTE HEAT
Based the complexity of the dispersion process and the
lack of ground-level data, it is impossible to model realistic
dispersion of alpha-emitting particulates.
[ ]
−−
−=
)(2
h
)(2
y exp
)()(
/exp),(
2
2
2
2
xxxyv
vxSyxc
zyzywx
wxo
σσσσπ
λ
Can we model the dispersion?

2011
Robert Baumann
Slide 12/15
After G. Kaurov, et al., “Physiochemical Characteristics of Uranium Microparticles Collected at Nuclear Fuel Cycle Plants”, International Atomic Energy Agency-SM-367/10/05/P
The morphologies and sizes of uranium
micro-particles collected from reactors spent fuel assemblies.
Particles down to 0.2 µm have been documented,
With the bulk being in the 1-2 µm range
What about the U/Pu dust?
After C.W. Fort, R. Douglas, R. Gauntt, and A.R. McFarland, “Particle Size Distribution of Yellowcake Emissions at the United Nuclear Churchrock Uranium Mill”, EPA, ORP/LV-80-1, Jan. 1980, p.20.
HEPA Filter (High Efficiency Particulate Air) -
Remove particles 0.3 micron or larger with a 99.97 to 99.9995% particle-collective efficiency.
ULPA Filter (Ultra-Low Penetration Air ) - Remove particles 0.12 micron or larger at 99.9995% particle-
collective efficiency.

2011
Robert Baumann
Slide 13/15
Alpha Counting Detailspositive high
voltageIonization detector
Discriminator
& Counter
wafer sample
emittedalpha flux
++++++++++++++ Amp
62.74%0.000180.000720.000134950Full process 8LM Cu wafer 2
96.78%0.000280.000370.000134950Full process 8LM Cu wafer
-0.000040.000340.000124950Bare silicon wafers (C027)
-0.000070.000340.000124950diborane based W process
-0.000110.000340.000124950C021 Alternate dielectric
96.41%0.000270.000360.000134950C021 Interlevel dielectric
99.96%0.000390.000350.000124950C027 Interlevel Dielectric
-0.000000.000330.000124950C027 Barrier Layer
91.47%0.000360.000540.000194950ECD Cu 10um
conf. averageMDA95CDL95DetectorSample Description
P10 gas
Mylar
window
Two sets of 8” wafer samples
were obtained from each
Of the two sites:
8 exposed wafers from Miho
8 sealed wafers from Miho
8 exposed wafers from Aizu
8 sealed wafers from Aizu
Counts α events
ignores β events
2011
Robert Baumann
Slide 14/15
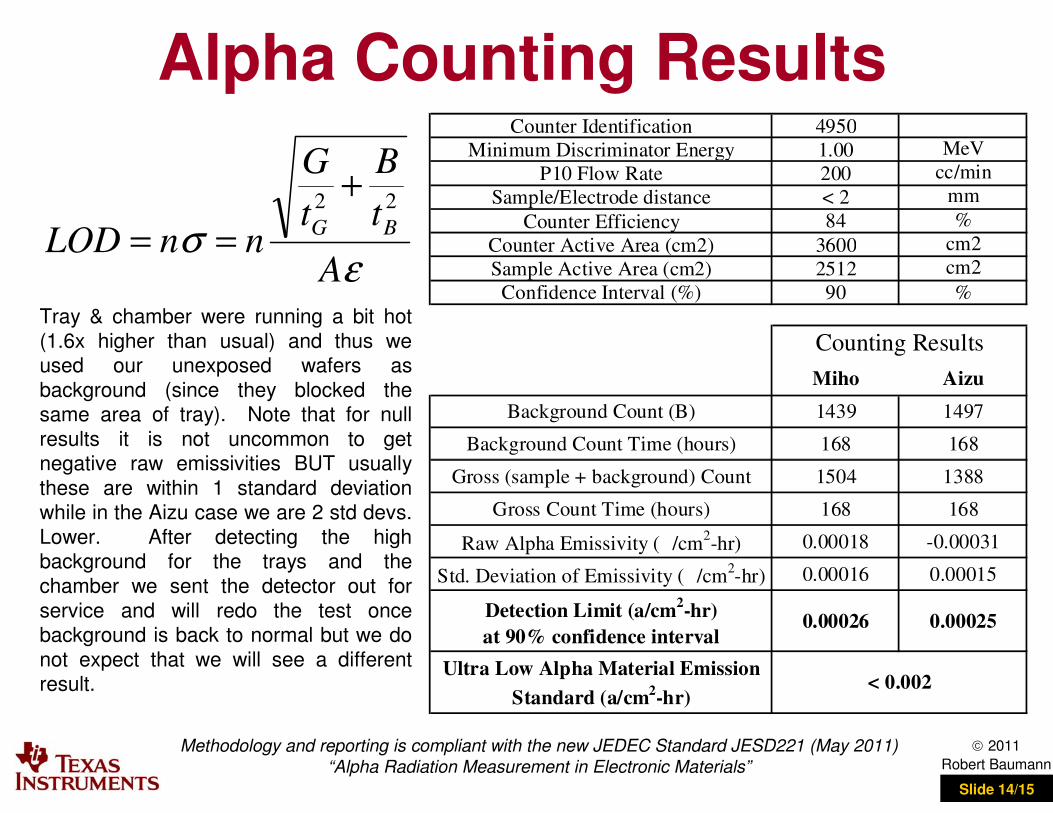
Alpha Counting Results
εσ
A
t
B
t
G
nnLODBG
22+
==
Methodology and reporting is compliant with the new JEDEC Standard JESD221 (May 2011)
“Alpha Radiation Measurement in Electronic Materials”
Counter Identification 4950
Minimum Discriminator Energy 1.00 MeV
P10 Flow Rate 200 cc/min
Sample/Electrode distance < 2 mm
Counter Efficiency 84 %
Counter Active Area (cm2) 3600 cm2
Sample Active Area (cm2) 2512 cm2
Confidence Interval (%) 90 %
Miho Aizu
Background Count (B) 1439 1497
Background Count Time (hours) 168 168
Gross (sample + background) Count 1504 1388
Gross Count Time (hours) 168 168
Raw Alpha Emissivity (� /cm2-hr) 0.00018 -0.00031
Std. Deviation of Emissivity (� /cm2-hr) 0.00016 0.00015
Detection Limit (a/cm2-hr)
at 90% confidence interval 0.00026 0.00025
Ultra Low Alpha Material Emission
Standard (a/cm2-hr)
Counting Results
< 0.002
Tray & chamber were running a bit hot
(1.6x higher than usual) and thus we used our unexposed wafers as
background (since they blocked the same area of tray). Note that for null
results it is not uncommon to get negative raw emissivities BUT usually
these are within 1 standard deviation while in the Aizu case we are 2 std devs.
Lower. After detecting the high background for the trays and the
chamber we sent the detector out for
service and will redo the test once background is back to normal but we do
not expect that we will see a different result.
2011
Robert Baumann
Slide 15/15
Conclusions• The first report of alpha-particle counting from wafers exposed to atmosphere
(AF > 100x) during and after the disaster confirm that no alpha emission was
observed in any of the samples.
• All wafer samples were below the limit of detection (LOD) and LOD was ten
times below the emission level of ULA materials specified for minimizing
alpha-particle soft errors. Background was about 1.6x higher than previous
runs done a few years ago – detector needs servicing.
• These results prove that semiconductor manufacturing, at least at these two
sites, was NOT impacted by contamination released from the Fukushima
Daiichi plant. Products manufactured at these facilities will NOT exhibit any
increase in alpha-induced SER.
• The SER reliability performance of semiconductor devices manufactured in
Japan is not impacted in any measurable way.


