Determination of Vitamin C (Ascorbic Acid) Contents in ...
13
769 International Journal of Progressive Sciences and Technologies (IJPSAT) ISSN: 2509-0119. © 2019 International Journals of Sciences and High Technologies http://ijpsat.ijsht-journals.org Vol. 15 No. 2 July 2019, pp. 281-293 Corresponding Author: Samira Ben Mussa 281 Determination of Vitamin C (Ascorbic Acid) Contents in Vegetable Samples by UV-Spectrophotometry and Redox Titration Methods and Estimation the Effect of Time, Cooking and Frozen on Ascorbic Acid Contents Intisar El Sharaa and Samira Ben Mussa * Department of Chemistry, Faculty of Science, Benghazi University-Libya Abstract - The concentrations of Vitamin C, also known as L-ascorbic acid, in twenty two different types of fresh vegetables were determined by spectrophotometric and Back Redox Titration methods. The effects of some conditions such as time, cooking and frozen on the Vitamin C contents were studied. The samples were collected from different markets in Benghazi city from different places. Each sample or a part of it was weighed, squeezed in a juicer machine and centrifuged; the volume and the weight of the supernatant liquid were taken. The supernatant liquid was homogenized with 5% metaphosphoric acid-10% acetic acid solution. The ascorbic acid was oxidized to dehydroascorbic acid by bromine water in presence of acetic acid and the excess of bromine was removed by a few drops of 10% thiourea . A coupling was done with 2,4-dinitrophenyl hydrazine by putting the solution in a water bath at 37°C temperature for three hours, it was cooled in an ice bath and was treated with chilled 85% H 2 SO 4 . A red colour complex was produced and the absorbance was measured spectrophotometrically at 521 nm. Beer’s law was obeyed. Another method for the determination of ascorbic acid was done by an iodimetric back-titration in which an excess measured amount of iodine was generated in the sample and then the unreacted iodine was titrated with a standard solution of sodium thiosulfate. The estimation of ascorbic acid contents was done for fresh, after 4 and 7 days, cooking and frozen samples. Key words - Vitamin C, vegetables, spectrophotometry, an iodimetric back-titration I. INTRODUCTION Vitamin C or L-ascorbic acid has the chemical formula C 6 H 8 O 6 . It consists of two inter-convertible compounds: L- ascorbic acid, which is a strong reducing agent, and its oxidized derivative, L-dehydroascorbic acid C 6 H 6 O 6 Vitamin C is a water-soluble vitamin that is naturally present in some foods, added to others, and available as a dietary supplement. Humans, unlike most animals, are unable to synthesize vitamin C endogenously, so it is an essential dietary component [1]. Vitamin C is required for the biosynthesis of collagen, L-carnitine, and certain neurotransmitters; vitamin C is also involved in protein metabolism [1,2]. Collagen is an essential component of connective tissue, which plays a vital role in wound healing. Vitamin C is also an important physiological antioxidant [3] and has been shown to regenerate other antioxidants within the body, including alpha-tocopherol (vitamin E) [4]. Ongoing research is examining whether vitamin C, by limiting the damaging effects of free radicals through its antioxidant activity, might help prevent or delay the development of certain cancers, cardiovascular disease, and other diseases in which oxidative stress plays a causal role. In addition to its biosynthetic and antioxidant functions, vitamin C plays an important role in immune function [4] and improves the absorption of nonheme iron [5], the form of iron present in plant-based foods. Insufficient vitamin C intake causes scurvy, which is characterized by fatigue or lassitude, widespread connective tissue weakness, and capillary fragility [1,2,4,6]. Most fruits and vegetables especially leafy ones rich in ascorbic acid [7]. Animal sources of this vitamin such as meat, fish, poultry, eggs and dairy products contain smaller
Transcript of Determination of Vitamin C (Ascorbic Acid) Contents in ...

769 International Journal of Progressive Sciences and Technologies (IJPSAT)
ISSN: 2509-0119.
© 2019 International Journals of Sciences and High Technologies
http://ijpsat.ijsht-journals.org Vol. 15 No. 2 July 2019, pp. 281-293
Corresponding Author: Samira Ben Mussa 281
Determination of Vitamin C (Ascorbic Acid) Contents in
Vegetable Samples by UV-Spectrophotometry and Redox
Titration Methods and Estimation the Effect of Time, Cooking
and Frozen on Ascorbic Acid Contents
Intisar El Sharaa and Samira Ben Mussa*
Department of Chemistry, Faculty of Science, Benghazi University-Libya
Abstract - The concentrations of Vitamin C, also known as L-ascorbic acid, in twenty two different types of fresh vegetables were
determined by spectrophotometric and Back Redox Titration methods. The effects of some conditions such as time, cooking and frozen
on the Vitamin C contents were studied. The samples were collected from different markets in Benghazi city from different places. Each
sample or a part of it was weighed, squeezed in a juicer machine and centrifuged; the volume and the weight of the supernatant liquid
were taken. The supernatant liquid was homogenized with 5% metaphosphoric acid-10% acetic acid solution. The ascorbic acid was
oxidized to dehydroascorbic acid by bromine water in presence of acetic acid and the excess of bromine was removed by a few drops of
10% thiourea . A coupling was done with 2,4-dinitrophenyl hydrazine by putting the solution in a water bath at 37°C temperature for
three hours, it was cooled in an ice bath and was treated with chilled 85% H2SO4 . A red colour complex was produced and the
absorbance was measured spectrophotometrically at 521 nm. Beer’s law was obeyed. Another method for the determination of ascorbic
acid was done by an iodimetric back-titration in which an excess measured amount of iodine was generated in the sample and then the
unreacted iodine was titrated with a standard solution of sodium thiosulfate. The estimation of ascorbic acid contents was done for
fresh, after 4 and 7 days, cooking and frozen samples.
Key words - Vitamin C, vegetables, spectrophotometry, an iodimetric back-titration
I. INTRODUCTION
Vitamin C or L-ascorbic acid has the chemical formula
C6H8O6. It consists of two inter-convertible compounds: L-
ascorbic acid, which is a strong reducing agent, and its
oxidized derivative, L-dehydroascorbic acid C6H6O6
Vitamin C is a water-soluble vitamin that is naturally
present in some foods, added to others, and available as a
dietary supplement. Humans, unlike most animals, are
unable to synthesize vitamin C endogenously, so it is an
essential dietary component [1].
Vitamin C is required for the biosynthesis of collagen,
L-carnitine, and certain neurotransmitters; vitamin C is also
involved in protein metabolism [1,2]. Collagen is an
essential component of connective tissue, which plays a
vital role in wound healing. Vitamin C is also an important
physiological antioxidant [3] and has been shown to
regenerate other antioxidants within the body, including
alpha-tocopherol (vitamin E) [4]. Ongoing research is
examining whether vitamin C, by limiting the damaging
effects of free radicals through its antioxidant activity, might
help prevent or delay the development of certain cancers,
cardiovascular disease, and other diseases in which
oxidative stress plays a causal role. In addition to its
biosynthetic and antioxidant functions, vitamin C plays an
important role in immune function [4] and improves the
absorption of nonheme iron [5], the form of iron present in
plant-based foods. Insufficient vitamin C intake causes
scurvy, which is characterized by fatigue or lassitude,
widespread connective tissue weakness, and capillary
fragility [1,2,4,6].
Most fruits and vegetables especially leafy ones rich in
ascorbic acid [7]. Animal sources of this vitamin such as
meat, fish, poultry, eggs and dairy products contain smaller

Determination of Vitamin C (Ascorbic Acid) Contents in Vegetable Samples by UV-Spectrophotometry and Redox Titration Methods and
Estimation the Effect of Time, Cooking and Frozen on Ascorbic Acid Contents
Vol. 15 No. 2 July 019 ISSN: 2509-0119 282
amounts and are not significant sources. Most food–based
dietary guidelines are similar in that all recommend
consumption of 5 servings of fruits and vegetables daily. If
this recommendation is followed, daily intake of ascorbic
acid will be 210 to 280 mg, depending on food content
factors [8]. Ascorbic acid is the least stable of all vitamins
and is easily destroyed during processing and storage.
Exposure to oxygen, prolonged heating in the presence of
oxygen, contact with minerals (iron and copper) and
exposure to light are destructive to the ascorbic acid content
of foods.
Many analytical techniques are mentioning in the
literature for the determination of vitamin C in different
matrices, such as: titrimetric [9], fluorimetric [10],
spectrophotometric [11], high-performance liquid
chromatography [12], and enzymatic [13] techniques.
In this work, vitamin C was determined by two methods:
Redox Back Titration and UV- Visible Spectrophotometry.
1. Redox Back Titration
This method determines the vitamin C concentration in a
solution by a redox titration with potassium iodate in the
presence of potassium iodide.
When iodate ions (IO3−) are added to an acidic solution
containing iodide ions (I−), an oxidation-reduction
reaction occurs; - the iodate ions are reduced to form
iodine as illustrated in the following two equations:
IO3− + 5 I
− + 6 H
+ → 3 I2 + 3 H2O (1)
The iodine that is formed by this reaction oxidises the
ascorbic acid to dehydroascorbic acid as the iodine is
reduced to iodide ions.
C6H8O6(aq)+ I2 → 2 I− + C6H6O6(aq) . (2)
Due to this reaction the iodine formed is immediately
reduced to iodide as long as there is any ascorbic acid
present. Once all the ascorbic acid has been oxidised, the
excess iodine is free to react with the starch indicator,
forming the blue-black starch-iodine complex. This is
the endpoint of the titration. The method is suitable for
use with Vitamin C tablets, fresh or packaged fruit juices
and solid fruits and vegetables
2. UV- Visible Spectrophotometery.
We used spectrophotometric determination of total
ascorbic acid (ascorbic acid and dehydroascorbic acid)
based on oxidation of ascorbic acid to dehydroascorbic
acid by Bromine water in presence of acetic acid. After
coupling with 2,4-dinitrophenyl hydrazine at 37°C
temperature for three hours, the solution was treated with
85% H2SO4 to produce a red color complex and the
absorbance was spectrophotometrically measured at 521
nm. DNPH procedure is one of the most simple, accurate
and applicable method for determination of total
ascorbic acid in fresh food, such as fruits and vegetables.
II. MATERIALS AND METHOD
Reagents:
All reagents were of analytical grade:
1. For Redox Back Titration:
0.04 N KIO3, 10% KI, 0.2M H2SO4, 0.03N Na2S2O3,
Na2CO3 solid, 5% Starch
2. For UV- visible spectrophotometer:
• 500 ppm Ascorbic acid standard solution (dissolve
0.0500 g of ascorbic acid in 100 ml distilled water),
• 3% Meta phosphoric acid (dissolve 15 g meta
phosphoric acid in warm distilled water, add 40 ml
of glacial acetic acid (BDH) then transfer the
solution to 500 ml volumetric flask and dilute the
solution to the mark with distilled water).
• Bromine water (dissolve 55 ml of bromine water in
500 ml distilled water).
• 2,4-dinitrophenylhydrazine (dissolve of 1.0 g 2,4-
dinitrophenylhydrazine in 2 ml conc. sulfuric acid
after cooling, add 20 ml methanol).
• Thiourea (dissolve 50 g of Thiourea in 500 ml
distilled water).
Instrument
A Double beam UV-Visible spectrophotometer (Model
GESEYS 10uv) with 1 cm cell was used.
Twenty two kind of vegetables were studied
individually. Vegetables were Pumpkin, Carrots, Tomatoes,
Paprika, Hot Red Pepper, Hot Green Pepper, Cucumber,
Radishes, Onion, Broccoli, Cabbage, Squash, Potato,
Parsley, Cauliflower and Coriander. Also some leafy
vegetables were Coriander, Dill, Parsley, Spinach, Celery,
Mint, Arugula and Green onions. They were collected from
different markets in Benghazi city. The analysis was done in
the same day of the purchase except that for studying the
effect of time, cooking and frozen of the vegetables.
Procedures:
1. Preparation of Samples:
Each vegetable sample or a part of it was weighed, squeezed
in a juicer machine and centrifuged. Then the volume
and weight of the supernatant liquid were taken.
Determination of Vitamin C (Ascorbic Acid) Contents in Vegetable Samples by UV-Spectrophotometry and Redox Titration Methods and
Estimation the Effect of Time, Cooking and Frozen on Ascorbic Acid Contents
Vol. 15 No. 2 July 019 ISSN: 2509-0119 283
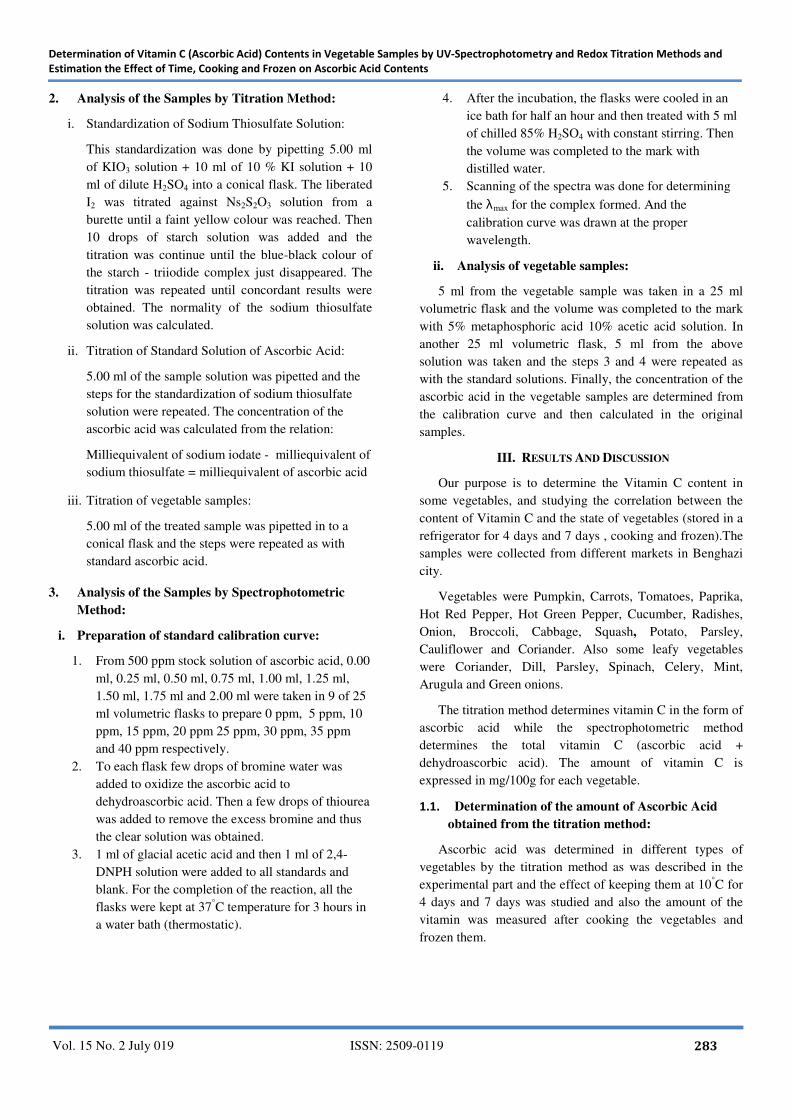
2. Analysis of the Samples by Titration Method:
i. Standardization of Sodium Thiosulfate Solution:
This standardization was done by pipetting 5.00 ml
of KIO3 solution + 10 ml of 10 % KI solution + 10
ml of dilute H2SO4 into a conical flask. The liberated
I2 was titrated against Ns2S2O3 solution from a
burette until a faint yellow colour was reached. Then
10 drops of starch solution was added and the
titration was continue until the blue-black colour of
the starch - triiodide complex just disappeared. The
titration was repeated until concordant results were
obtained. The normality of the sodium thiosulfate
solution was calculated.
ii. Titration of Standard Solution of Ascorbic Acid:
5.00 ml of the sample solution was pipetted and the
steps for the standardization of sodium thiosulfate
solution were repeated. The concentration of the
ascorbic acid was calculated from the relation:
Milliequivalent of sodium iodate - milliequivalent of
sodium thiosulfate = milliequivalent of ascorbic acid
iii. Titration of vegetable samples:
5.00 ml of the treated sample was pipetted in to a
conical flask and the steps were repeated as with
standard ascorbic acid.
3. Analysis of the Samples by Spectrophotometric
Method:
i. Preparation of standard calibration curve:
1. From 500 ppm stock solution of ascorbic acid, 0.00
ml, 0.25 ml, 0.50 ml, 0.75 ml, 1.00 ml, 1.25 ml,
1.50 ml, 1.75 ml and 2.00 ml were taken in 9 of 25
ml volumetric flasks to prepare 0 ppm, 5 ppm, 10
ppm, 15 ppm, 20 ppm 25 ppm, 30 ppm, 35 ppm
and 40 ppm respectively.
2. To each flask few drops of bromine water was
added to oxidize the ascorbic acid to
dehydroascorbic acid. Then a few drops of thiourea
was added to remove the excess bromine and thus
the clear solution was obtained.
3. 1 ml of glacial acetic acid and then 1 ml of 2,4-
DNPH solution were added to all standards and
blank. For the completion of the reaction, all the
flasks were kept at 37°C temperature for 3 hours in
a water bath (thermostatic).
4. After the incubation, the flasks were cooled in an
ice bath for half an hour and then treated with 5 ml
of chilled 85% H2SO4 with constant stirring. Then
the volume was completed to the mark with
distilled water.
5. Scanning of the spectra was done for determining
the λmax for the complex formed. And the
calibration curve was drawn at the proper
wavelength.
ii. Analysis of vegetable samples:
5 ml from the vegetable sample was taken in a 25 ml
volumetric flask and the volume was completed to the mark
with 5% metaphosphoric acid 10% acetic acid solution. In
another 25 ml volumetric flask, 5 ml from the above
solution was taken and the steps 3 and 4 were repeated as
with the standard solutions. Finally, the concentration of the
ascorbic acid in the vegetable samples are determined from
the calibration curve and then calculated in the original
samples.
III. RESULTS AND DISCUSSION
Our purpose is to determine the Vitamin C content in
some vegetables, and studying the correlation between the
content of Vitamin C and the state of vegetables (stored in a
refrigerator for 4 days and 7 days , cooking and frozen).The
samples were collected from different markets in Benghazi
city.
Vegetables were Pumpkin, Carrots, Tomatoes, Paprika,
Hot Red Pepper, Hot Green Pepper, Cucumber, Radishes,
Onion, Broccoli, Cabbage, Squash, Potato, Parsley,
Cauliflower and Coriander. Also some leafy vegetables
were Coriander, Dill, Parsley, Spinach, Celery, Mint,
Arugula and Green onions.
The titration method determines vitamin C in the form of
ascorbic acid while the spectrophotometric method
determines the total vitamin C (ascorbic acid +
dehydroascorbic acid). The amount of vitamin C is
expressed in mg/100g for each vegetable.
1.1. Determination of the amount of Ascorbic Acid
obtained from the titration method:
Ascorbic acid was determined in different types of
vegetables by the titration method as was described in the
experimental part and the effect of keeping them at 10°C for
4 days and 7 days was studied and also the amount of the
vitamin was measured after cooking the vegetables and
frozen them.

Determination of Vitamin C (Ascorbic Acid) Contents in Vegetable Samples by UV-Spectrophotometry and Redox Titration Methods and
Estimation the Effect of Time, Cooking and Frozen on Ascorbic Acid Contents
Vol. 15 No. 2 July 019 ISSN: 2509-0119 284
3.1.1 Effect of Time
Table 3.1. : Amount Of vitamin C of some vegetables and effect of time on them
Kind of vegetable Fresh
mg/100g 4 days mg/100g 7 days mg/100g
12 days
mg/100g
Broccoli 120.85±0.25 80.85±0.11 28.47±0.22
Paprika 85.53±0.08 44.99±0.11 23.89±0.04
Coriander 80.69±0.46 15.96±0.08
Cauliflower 73.78±0.40 10.29±0.52
Cabbage 64.25±0.25
Radishes 61.54±0.06 50.45±0.08
Squash 60.82±0.42 20.31±0.08
Potato 51.77±0.34 30.27±0.00 13.20±0.10
Hot Red Pepper 47.84±0.32
Parsley 38.42±0.52 12.58±0.32
Pumpkin 38.23±0.27 19.80±0.00 18.23±0.23
Carrots 28.93±0.05
Cucumber 27.90±0.41
Spinach 25.64±0.05
Onion 24.89±0.30
Tomatoes 15.05±0.07 10.32±0.00
Figure 3.1. : Amount Of vitamin C of some vegetables and effect of time on them
0
20
40
60
80
100
120
140
Vit
am
in C
mg
/10
0g
Kind of vegetable
Fresh 4 day 7 days 12 days

Determination of Vitamin C (Ascorbic Acid) Contents in Vegetable Samples by UV-Spectrophotometry and Redox Titration Methods and
Estimation the Effect of Time, Cooking and Frozen on Ascorbic Acid Contents
Vol. 15 No. 2 July 019 ISSN: 2509-0119 285
From the table and figure above, the broccoli has the
highest value and the tomato has the least one; the effect of
time is clear in the destroying of vit. C especially for the
broccoli.
Effect of time on leafy vegetables
Table 3.2. : Amount Of vitamin C of some leafy vegetables and effect of time on them
Kind of vegetable Fresh
mg/100g
4 day
mg/100g
7 days
mg/100g
Spinach 51.57 44.64 22.53
Celery 49.07 27.75 24.12
Mint 39.47 15.46 10.48
Arugula 28.4 20.33 12.11
Green onions 25.38 18.8 10.16
Table 3.2. and figure 3.2. show the amount of vitamin C
in some leafy vegetables and the effect of leaving them in s
refrigerator for 4 and 7 days . It is clear that vitamin C is
destroyed with the time and about 50% of it was destroyed
after 7 days.
Figure 3.2. : Amount Of vitamin C of some vegetables and effect of time on them
3.1.2 Effect of Cooking
The effect of cooking the fresh and the stored vegetables for 15 min at 100°C on the amount of vitamin C present was studied
as shown in table 3.2.
0
10
20
30
40
50
60
SPINACH CELERY MINT ARUGULA GREEN
ONIONS
Vit
am
in C
mg
/10
0g
Kind of vegetable
Fresh 4 day 7 days

Determination of Vitamin C (Ascorbic Acid) Contents in Vegetable Samples by UV-Spectrophotometry and Redox Titration Methods and
Estimation the Effect of Time, Cooking and Frozen on Ascorbic Acid Contents
Vol. 15 No. 2 July 019 ISSN: 2509-0119 286
Table 3.3: Effect of cooking the vegetables for 15 min at 100°C on the amount of vitamin C
Kind of vegetable Fresh
mg/100g
4days
mg/100g
7 days
mg/100g
Broccoli 63.55 ±0.25
Paprika 50.52 ±0.18
Cabbage 47.14 ±0.23
Parsley 38.42 ±0.52 15.96 ±0.72
Cauliflower 32.00 ±0.33
Coriander 25.33 ±0.67 12.58 ±0.08
Pumpkin 15.64 ±0.25
Potato 14.62 ±0.10 5.30 ±0.11
Carrots 13.61 ±0.16
Tomato 12.50 ±0.07 9.13 ±0.35 2.64 ±0.30
Onion 8.36 ±0.20
Figure 3.3: Effect of cooking the vegetables for 15 min at 100°C on the amount of vitamin C
From tables 3.3 and figure 3.3, it is clear that the
cooking destroys vitamin c even cooking in a short time. For
example broccoli lost about 50% of its vit. C content and
this lost increases with the time.
3.2. Determination of amount of Ascorbic Acid
obtained from Spectrophotometric Method
3..2.1 Estimation of λmax and construction of Standard
Curve
0
10
20
30
40
50
60
70
Vit
am
in C
mg
/10
0g
Vegetable Kind
Effect of cooking the vegetables for 15 min at 100°C on
the amount of vitamin C
Fresh
4days
7 days
Determination of Vitamin C (Ascorbic Acid) Contents in Vegetable Samples by UV-Spectrophotometry and Redox Titration Methods and
Estimation the Effect of Time, Cooking and Frozen on Ascorbic Acid Contents
Vol. 15 No. 2 July 019 ISSN: 2509-0119 287
0
0,1
0,2
0,3
0,4
0,5
0,6
0 10 20 30 40
Ab
sorb
en
ce
Concentration ppm
A
Linear (A)
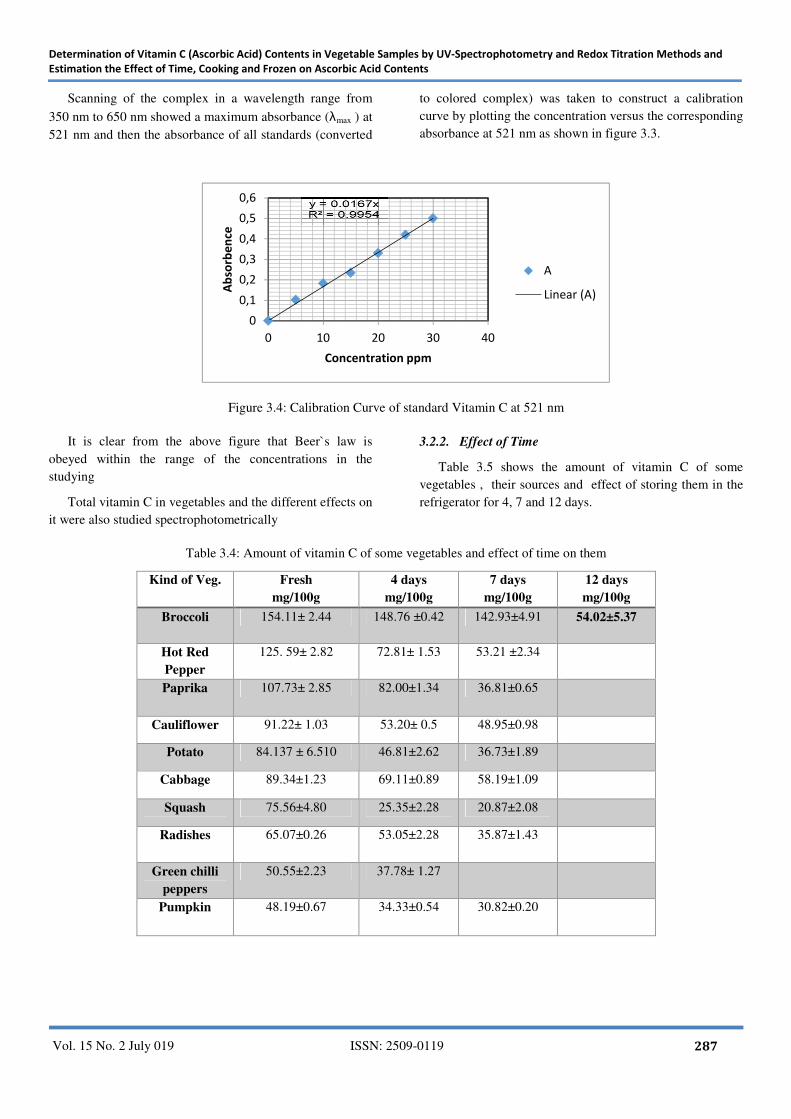
Scanning of the complex in a wavelength range from
350 nm to 650 nm showed a maximum absorbance (λmax ) at
521 nm and then the absorbance of all standards (converted
to colored complex) was taken to construct a calibration
curve by plotting the concentration versus the corresponding
absorbance at 521 nm as shown in figure 3.3.
Figure 3.4: Calibration Curve of standard Vitamin C at 521 nm
It is clear from the above figure that Beer`s law is
obeyed within the range of the concentrations in the
studying
Total vitamin C in vegetables and the different effects on
it were also studied spectrophotometrically
3.2.2. Effect of Time
Table 3.5 shows the amount of vitamin C of some
vegetables , their sources and effect of storing them in the
refrigerator for 4, 7 and 12 days.
Table 3.4: Amount of vitamin C of some vegetables and effect of time on them
12 days
mg/100g
7 days
mg/100g
4 days
mg/100g
Fresh
mg/100g
Kind of Veg.
54.02±5.37 142.93±4.91 148.76 ±0.42 154.11± 2.44 Broccoli
53.21 ±2.34 72.81± 1.53 125. 59± 2.82 Hot Red
Pepper
36.81±0.65 82.00±1.34 107.73± 2.85 Paprika
48.95±0.98 53.20± 0.5 91.22± 1.03 Cauliflower
36.73±1.89 46.81±2.62 84.137 ± 6.510 Potato
58.19±1.09 69.11±0.89 89.34±1.23 Cabbage
20.87±2.08 25.35±2.28 75.56±4.80 Squash
35.87±1.43 53.05±2.28 65.07±0.26 Radishes
37.78± 1.27 50.55±2.23 Green chilli
peppers
30.82±0.20 34.33±0.54 48.19±0.67 Pumpkin

Determination of Vitamin C (Ascorbic Acid) Contents in Vegetable Samples by UV-Spectrophotometry and Redox Titration Methods and
Estimation the Effect of Time, Cooking and Frozen on Ascorbic Acid Contents
Vol. 15 No. 2 July 019 ISSN: 2509-0119 288
19.34±0.58 23.08±2.40 45.98±0.98 Cucumber
19.84±1.06 34.93±0.99 43.72±0.52 Carrots
10.47±0.55 30.76± 0.45 34.83±1.11 Onions
10.0.69±0.16 12.45±0.47 16.46±0.48 Tomatoes
Figure 3.5: Amount of vitamin C of some vegetables and effect of time on them
It is clear from Table 3.4 and Figure 3.5 that vitamin C is
destroyed with time.
Table 3.5 shows the amount of vitamin C in leafy
vegetables for the fresh and after 4 and 7 days in mg/100g
Table 3.5: Amount of vitamin C in leafy vegetable sand effect of time on it
7 days
mg/100g
4 days
mg/100g
Fresh
mg/100g
Kind of Veg.
28.77±2.41 87.53±2.26 159.39±6.31 Coriander
20.32±1.37 25.33±0.78 79.37±0.73 Dill
19.25±0.85 23.46±1.53 67.43±4.72 Parsley
22.53±1.22 44.64±4.18 51.57±4.29 Spinach
24.12±1.32 27.75±3.20 49.07±1.83 Celery
10.48±1.16 15.46± 0.91 39.47±1.24 Mint
12.11± 0.86 20.33±2.11 28.40±1.16 Arugula
10.16±0.71 18.80±0.56 25.38± 2.21 Green onions
0
50
100
150
200
Vit
am
in C
mg
/1
00
g
Kind of vegetable
Fresh
4 days
7 days
12 days

Determination of Vitamin C (Ascorbic Acid) Contents in Vegetable Samples by UV-Spectrophotometry and Redox Titration Methods and
Estimation the Effect of Time, Cooking and Frozen on Ascorbic Acid Contents
Vol. 15 No. 2 July 019 ISSN: 2509-0119 289
Figure 3.6: Effect of time for some leafy vegetables
It is clear from table 3.5 and figure 3.6 that the amount of vitamin C decreased strongly with time especially in coriander
3.2.3: Effect of Cooking
The effect of cooking of the vegetables at 100°C for 15 min on the amount of vitamin C was studied for the fresh and the
stored samples for 4,7 and 12 days as shown in tables 3.6 and 3.7 and figures 3.7 and 3.8 .
Table 3.6: Effect of cooking vegetables on the amount of vitamin C
12 days
mg/100g
7 days
mg/100g
4 days
mg/100g
Fresh
mg/100g
Kind of Veg.
14.24±0.44 50.44±0.87 87.65±1.33 Paprika
28.25±3.29 31.99±4.24 43.69±0.49 86.40±2.54 Broccoli
15.87±0.80 21.23±0.91 38.48±1.21 Squash
25.76±0.77 28.56±0.54 35.20±0.39 Cauliflower
9.50±0.43 28.22±0.61 30.41±0.84 Pumpkin
25.33 ± 0.67 Coriander
6.23±1.96 8.98 ±1.96 21.94 ± 2.11 Potato
8.92±0.31 10.62±1.85 20.79±0.31 Carrots
5.62±0.82 7.55± 0.72 9.683 ± 0.81 Onions
4.46±0.41 5.40±0.21 6.26±0.56 Tomatoes
0
20
40
60
80
100
120
140
160
Vit
am
in C
mg
/10
0g
Vegetable kind
Fresh
4 days
7 days

Determination of Vitamin C (Ascorbic Acid) Contents in Vegetable Samples by UV-Spectrophotometry and Redox Titration Methods and
Estimation the Effect of Time, Cooking and Frozen on Ascorbic Acid Contents
Vol. 15 No. 2 July 019 ISSN: 2509-0119 290
Figure 3.7: Effect of cooking vegetables on the amount of vitamin C
Table 3.7: Effect of cooking leafy vegetables on the amount of vitamin C
7 days mg/100g
4 days mg/100g
Fresh mg/100g
Kind of Veg.
5.47± 0.98 8.4± 0.54 21±0.90 Green onions
8.15±1.43 17.08±0.45 29.77±0.55 Coriander
15.23 ±0.72 17.50±1.76 26.05±0.80 Parsley
14.86±2.71 19.38±1.16 26.41±1.29 Celery
14.76±0.95 20.94±2.72 28.80±0.23 Spinach
10.73±2.20 11.79±0.66 15.44±0.53 Dill
0
10
20
30
40
50
60
70
80
90
Vit
am
in C
mg
/10
0g
Kind of vegetable
Fresh
4 days
7 days
12 days

Determination of Vitamin C (Ascorbic Acid) Contents in Vegetable Samples by UV-Spectrophotometry and Redox Titration Methods and
Estimation the Effect of Time, Cooking and Frozen on Ascorbic Acid Contents
Vol. 15 No. 2 July 019 ISSN: 2509-0119 291
0
5
10
15
20
25
30
Vit
am
in C
mg
/10
0g
Kind of vegetable
Fresh
4 days
7 days
Figure 3.8: Effect of cooking leafy vegetables on the amount of vitamin C
It is clear that vitamin C is destroyed by cooking
especially paprika, broccoli and green onions
3.2.4. Effect of Frozen
Effect of frozen vegetables at -5°C for one, two, and
three weeks and cooking them at 100oC for 15 min. were
studied. Tomato as an example was used to measure the
amount of vitamin C in many cases as illustrated in table 3.8
and figure 3.9
Table 3.8: Effect of cooked and frozen the tomatoes on the amount of vitamin C
State of Tomatoes Fresh
mg/100g
4 days
mg/100g
7 days
mg/100g
1 week
mg/100g
2 weeks
mg/100g
3 weeks
mg/100g
Uncooked &
Unfrozen
16.46 12.45 10.69 - - -
Cooked 6.26 5.4 4.46 - - -
Frozen - - - 8.68 7.54 5.19
Frozen & Cooked - - - 2.3 1.65 0.95

Determination of Vitamin C (Ascorbic Acid) Contents in Vegetable Samples by UV-Spectrophotometry and Redox Titration Methods and
Estimation the Effect of Time, Cooking and Frozen on Ascorbic Acid Contents
Vol. 15 No. 2 July 019 ISSN: 2509-0119 292
0
2
4
6
8
10
12
14
16
18
UNCOOKED &
UNFROZEN
COOKED FROZEN FROZEN &
COOKED
Vit
am
in C
mg
/10
0g
State of Tomatoes
Fresh
After 4 days
After 7 days
For 1 week
For 2 weeks
For 3 weeks
Figure 3.9: Effect of cooked and frozen the tomatoes on the amount of vitamin C
From table 3.7 and figure 3.8, it is clear that the highest
amount of vitamin C is present in the fresh state (16.46
mg/100g) and the least amount (or almost no) is present in
the frozen and cooked after 3 weeks state (0.95 mg/100g).
Also it is clear that vitamin C is destroyed by cooking more
than frozen but as we know that the frozen tomatoes should
be cooking before eating, so there is almost no vitamin C in
such cases.
IV. CONCLUSION
The results showed that amount of vitamin C which
determined by Redox Titration was always less than by
spectrophotometric method (e.g. in broccoli by titration the
result was121mg/100g while by spectrophotometry was
154.11 mg/100g). This is because by titration only L-
ascorbic acid, is determined but by spectrophotometer the
total of L-ascorbic and, L-dehydroascorbic are determined.
In vegetables, the results showed that the highest
concentration of vitamin C is in broccoli (154.11 mg/100g)
and the lowest concentration of vitamin C is in tomatoes
(16.46 mg/g).
In herbs, the highest concentration of vitamin C is in
coriander (159.39 mg/100g) and the lowest concentration is
in green onion (25.38 mg/100g) and the concentration of
vitamin C decreases with time, it is lost by boiling and
frozen also lost most of it by frozen. then cooking
REFERENCES
[1] Li Y, Schellhorn HE. New developments and novel
therapeutic perspectives for vitamin C. J Nutr
2007;137:2171-84Carr AC, Frei B. Toward a new
recommended dietary allowance for vitamin C based
on antioxidant and health effects in humans. Am J Clin
Nutr 1999;69:1086-107.
[2] Frei B, England L, Ames BN. Ascorbate is an
outstanding antioxidant in human blood plasma. Proc
Natl Acad Sci U S A 1989;86:6377-81. Jacob RA,
Sotoudeh G. Vitamin C function and status in chronic
disease. Nutr Clin Care 2002;5:66-74.
[3] Gershoff SN. Vitamin C (ascorbic acid): new roles,
new requirements? Nutr Rev 1993;51:313-
26Weinstein M, Babyn P, Zlotkin S. An orange a day
keeps the doctor away: scurvy in the year 2000.
Pediatrics 2001;108:E55
[4] Tee ES, Mohd Ismail N, MohdNasir A &Kahtijah I
(1997). Nutrient composition of Malayisan foods, 4th
Edition, Malaysian Food Composition Database
Programme, Institute for Medical Research, Kuala
Lumpur; 310 p.
[5] Levine M, Rumsey SC, Dhariwal KR, Park J & Wang
Y (1999) Criteria and recommendation for ascorbic
acid intake. J Amer Med Assoc 281: 1415-1423.
[6] Verma, K. K., Jain, A., Sahasrabuddhey, B., Gupta, K.,
Mishra, S. (1996). Solid-phase extraction clean-up for
determining ascorbic acid and dehydroascorbic acid by

Determination of Vitamin C (Ascorbic Acid) Contents in Vegetable Samples by UV-Spectrophotometry and Redox Titration Methods and
Estimation the Effect of Time, Cooking and Frozen on Ascorbic Acid Contents
Vol. 15 No. 2 July 019 ISSN: 2509-0119 293
titration with 2,6-dichlorophenolindophenol. Journal of
AOAC International,79, 1236.
[7] Xia, W., Yuxia, D., Changxia, S., Jinghe, Y., Yuebo,
W., Shuna, S. (2003). Fluorimetric determination of
ascorbic acid with o-phenylenediamine. Talanta59, 95-
99.
[8] Rahman Khan M.M., Rahman M.M., Islam M.S.,
Begum S.A. (2006). A simple UV-spectrophotometric
method for the determination of vitamin C content in
various fruits and vegetables at Sylhet area in
Bangladesh. Journal of Biological Sciences, 6, 388-
392.
[9] Nyyssönen, K., Salonen, J. T., Parviainen, M. T.
(2000). Ascorbic acid, in modern chromatographic
analysis of vitamins (3rd Ed.)
[10] Casella, L., Gullotti, M., Marchesini, M., Petrarulo, M.
(2006). Rapid enzymatic method for vitamin C assay
in fruits and vegetables using peroxidase, Journal of
Food Science,54, 374