Determination of Transport Parameters in Liquid Binary ...Determination of Transport Parameters in...
11
A826 Journal of The Electrochemical Society, 164 (4) A826-A836 (2017) Determination of Transport Parameters in Liquid Binary Lithium Ion Battery Electrolytes I. Diffusion Coefficient Andreas Ehrl, a, =,c Johannes Landesfeind, b, =, ∗, z Wolfgang A. Wall, a and Hubert A. Gasteiger b, ∗∗ a Institute for Computational Mechanics, Department of Mechanical Engineering, Technical University of Munich, Munich, Germany b Chair of Technical Electrochemistry, Department of Chemistry and Catalysis Research Center, Technical University of Munich, Munich, Germany Various numerical methods for the simulation of ion-transport in concentrated binary electrolyte solutions can be found in the literature, whereas the corresponding transport parameters are rarely discussed. In this contribution, a polarization cell consisting of two electrodes separated by a porous separator is proposed to determine the concentration dependent binary diffusion coefficient of non-aqueous electrolyte solutions. Therefore, two different electrochemical methods are extended so that they can be applied to electrolyte solutions in a porous medium. Additionally, the different methods are compared with each other by means of numerical simulations. The proposed experimental setup is used to determine the concentration dependent binary diffusion coefficient of an exemplary electrolyte, lithium perchlorate dissolved in a mixture of ethylene carbonate and diethyl carbonate, and the data are compared to those available in the literature. It will be shown that the most reliable method to determine concentration dependent binary diffusion coefficients are long-term relaxation experiments in a two-electrode cell using a porous separator. © The Author(s) 2017. Published by ECS. This is an open access article distributed under the terms of the Creative Commons Attribution Non-Commercial No Derivatives 4.0 License (CC BY-NC-ND, http://creativecommons.org/licenses/by-nc-nd/4.0/), which permits non-commercial reuse, distribution, and reproduction in any medium, provided the original work is not changed in any way and is properly cited. For permission for commercial reuse, please email: [email protected]. [DOI: 10.1149/2.1131704jes] All rights reserved. Manuscript submitted December 22, 2016; revised manuscript received February 2, 2017. Published February 22, 2017. Advanced numerical simulation tools are important for the under- standing of existing battery systems as well as the development and the optimization of future battery systems. For such numerical simu- lations, accuracy and reliability are key issues and depend on appro- priate physical models, boundary conditions, and, most importantly, accurately determined physico-chemical parameters. For instance, the mathematical model for binary electrolyte solutions presented by Newman and Thomas-Alyea 1 is based on four different concentra- tion dependent transport parameters, namely the conductivity κ(c), the binary diffusion coefficient D ± (c), the transference number t + (c), and the thermodynamic factor or the mean molar activity coefficient f ± (c); in addition, for modeling porous battery electrodes, the con- centration independent so-called tortuosity factor τ to describe the effective ionic conductivity in porous electrodes with a given mor- phology is required. 2 While the conductivity κ(c) can be measured using turn-key conductivity sensors, the determination of the other three concentration dependent parameters is more elaborate. Experi- mental methods for the determination of the transference number and the thermodynamic factor are discussed, e.g., in Ehrl et al. 3 and Lan- desfeind et al., 4 while the determination of a complete set of transport parameters can also be found in the literature. 5,6 An overview of the most popular experimental techniques for the determination of bi- nary diffusion coefficients in lithium based electrolytes is given in the following. In Castiglione et al., 7 Sethurajan et al. 8 and Capiglia et al., 9 pulsed- field gradient Nuclear Magnetic Resonance (NMR) is used to deter- mine the self-diffusion coefficients of ions in an electrolyte solution, which describes the mobility of ionic species in the absence of an electrochemical potential gradient. 10 In Castiglione et al., 7 the self- diffusion coefficients of all ions in an electrolyte composed of LiTFSI (lithium bis(trifluoromethanesulfonyl)imide) dissolved in the ionic liquid PYR 14 TFSI (N,N-dimethyl pyrrolidinium) at a molar ratio of 1:9 were determined, whereas Capiglia et al. 9 investigated LiPF 6 , = These authors contributed equally to this work. ∗ Electrochemical Society Student Member. ∗∗ Electrochemical Society Fellow. c Present address: Velling 4, 94374 Schwarzach, Germany. z E-mail: [email protected] LiBF 4 , and LiN(C 2 F 5 SO 2 ) 2 in ethylene carbonate (EC) ethyl-methyl carbonate (EMC) solvent mixture (EC:EMC at 2:8 v:v). A theoretical discussion of the experimental method is given in Price. 11 For this method, the major difficulty is to relate the ionic self-diffusion coeffi- cients determined by NMR to the binary diffusion coefficients which are generally required for numerical simulations. Another method, based on Moir´ e patterns, was used to determine the binary diffu- sion coefficient D ± (c) of LiClO 4 in PC (propylene carbonate). 12 This technique is based on the optical observation of the time-dependent relaxation of the concentration profile after two electrolyte solutions with different concentrations are brought into contact. Nishida et al. used the same technique to determine D ± (c) for LiPF 6 , LITFSI, and LiBF 4 in PC. 13 The binary diffusion coefficient can also be determined from limiting current measurements with a micro disc electrode, as was shown by Xu and Farrington 14 for 0.1 M LiClO 4 in PC, but this method does not allow to measure the concentration dependence of D ± (c) and can only provide an average value between the chosen salt concentration and zero (the concentration at the surface of the electrode at the limiting current). The most popular method for the determination of the concen- tration dependent binary diffusion coefficient D ± (c) is the so-called restricted diffusion method introduced by Harned and French, which is based on the observation of the long-term relaxation behavior fol- lowing an initially induced concentration profile. 15 The applicability of the method for concentrated electrolyte solutions was demonstrated by Newman and Chapman for potassium chloride in water. 16 The re- laxation process can be observed by different methods. In Stewart and Newman, an optical device was used to record the relaxation of the LiPF 6 concentration profile in an EC diethylcarbonate (DEC) solvent mixture (EC:DEC at 1:1 w:w). 17 Limiting factors of this method are the spatial resolution of the optical measurement and the complexity of the required analysis equipment. Alternatively, the relaxation of an initially induced concentration profile can be observed indirectly via the measured potential. 6,18–23 In Hiller et al., 18 the concentration and temperature dependent binary diffusion coefficients of LiTFSI and Li- BOB (lithium bis(oxalato) borate) in polyethylene oxide (PEO) based polymer electrolytes were determined by analyzing the long-term potential relaxation following an initial current pulse in a restricted diffusion experiment. In addition, the binary diffusion coefficients ) unless CC License in place (see abstract). ecsdl.org/site/terms_use address. Redistribution subject to ECS terms of use (see 129.187.254.46 Downloaded on 2018-06-18 to IP
Transcript of Determination of Transport Parameters in Liquid Binary ...Determination of Transport Parameters in...
A826 Journal of The Electrochemical Society, 164 (4) A826-A836 (2017)
Determination of Transport Parameters in Liquid Binary LithiumIon Battery ElectrolytesI. Diffusion Coefficient
Andreas Ehrl,a,=,c Johannes Landesfeind,b,=,∗,z Wolfgang A. Wall,aand Hubert A. Gasteigerb,∗∗
aInstitute for Computational Mechanics, Department of Mechanical Engineering, Technical University of Munich,Munich, GermanybChair of Technical Electrochemistry, Department of Chemistry and Catalysis Research Center, Technical University ofMunich, Munich, Germany
Various numerical methods for the simulation of ion-transport in concentrated binary electrolyte solutions can be found in theliterature, whereas the corresponding transport parameters are rarely discussed. In this contribution, a polarization cell consistingof two electrodes separated by a porous separator is proposed to determine the concentration dependent binary diffusion coefficientof non-aqueous electrolyte solutions. Therefore, two different electrochemical methods are extended so that they can be applied toelectrolyte solutions in a porous medium. Additionally, the different methods are compared with each other by means of numericalsimulations. The proposed experimental setup is used to determine the concentration dependent binary diffusion coefficient of anexemplary electrolyte, lithium perchlorate dissolved in a mixture of ethylene carbonate and diethyl carbonate, and the data arecompared to those available in the literature. It will be shown that the most reliable method to determine concentration dependentbinary diffusion coefficients are long-term relaxation experiments in a two-electrode cell using a porous separator.© The Author(s) 2017. Published by ECS. This is an open access article distributed under the terms of the Creative CommonsAttribution Non-Commercial No Derivatives 4.0 License (CC BY-NC-ND, http://creativecommons.org/licenses/by-nc-nd/4.0/),which permits non-commercial reuse, distribution, and reproduction in any medium, provided the original work is not changed in anyway and is properly cited. For permission for commercial reuse, please email: [email protected]. [DOI: 10.1149/2.1131704jes]All rights reserved.
Manuscript submitted December 22, 2016; revised manuscript received February 2, 2017. Published February 22, 2017.
Advanced numerical simulation tools are important for the under-standing of existing battery systems as well as the development andthe optimization of future battery systems. For such numerical simu-lations, accuracy and reliability are key issues and depend on appro-priate physical models, boundary conditions, and, most importantly,accurately determined physico-chemical parameters. For instance, themathematical model for binary electrolyte solutions presented byNewman and Thomas-Alyea1 is based on four different concentra-tion dependent transport parameters, namely the conductivity κ(c),the binary diffusion coefficient D±(c), the transference number t+(c),and the thermodynamic factor or the mean molar activity coefficientf±(c); in addition, for modeling porous battery electrodes, the con-centration independent so-called tortuosity factor τ to describe theeffective ionic conductivity in porous electrodes with a given mor-phology is required.2 While the conductivity κ(c) can be measuredusing turn-key conductivity sensors, the determination of the otherthree concentration dependent parameters is more elaborate. Experi-mental methods for the determination of the transference number andthe thermodynamic factor are discussed, e.g., in Ehrl et al.3 and Lan-desfeind et al.,4 while the determination of a complete set of transportparameters can also be found in the literature.5,6 An overview of themost popular experimental techniques for the determination of bi-nary diffusion coefficients in lithium based electrolytes is given in thefollowing.
In Castiglione et al.,7 Sethurajan et al.8 and Capiglia et al.,9 pulsed-field gradient Nuclear Magnetic Resonance (NMR) is used to deter-mine the self-diffusion coefficients of ions in an electrolyte solution,which describes the mobility of ionic species in the absence of anelectrochemical potential gradient.10 In Castiglione et al.,7 the self-diffusion coefficients of all ions in an electrolyte composed of LiTFSI(lithium bis(trifluoromethanesulfonyl)imide) dissolved in the ionicliquid PYR14TFSI (N,N-dimethyl pyrrolidinium) at a molar ratio of1:9 were determined, whereas Capiglia et al.9 investigated LiPF6,
=These authors contributed equally to this work.∗Electrochemical Society Student Member.
∗∗Electrochemical Society Fellow.cPresent address: Velling 4, 94374 Schwarzach, Germany.zE-mail: [email protected]
LiBF4, and LiN(C2F5SO2)2 in ethylene carbonate (EC) ethyl-methylcarbonate (EMC) solvent mixture (EC:EMC at 2:8 v:v). A theoreticaldiscussion of the experimental method is given in Price.11 For thismethod, the major difficulty is to relate the ionic self-diffusion coeffi-cients determined by NMR to the binary diffusion coefficients whichare generally required for numerical simulations. Another method,based on Moire patterns, was used to determine the binary diffu-sion coefficient D±(c) of LiClO4 in PC (propylene carbonate).12 Thistechnique is based on the optical observation of the time-dependentrelaxation of the concentration profile after two electrolyte solutionswith different concentrations are brought into contact. Nishida et al.used the same technique to determine D±(c) for LiPF6, LITFSI, andLiBF4 in PC.13 The binary diffusion coefficient can also be determinedfrom limiting current measurements with a micro disc electrode, aswas shown by Xu and Farrington14 for 0.1 M LiClO4 in PC, but thismethod does not allow to measure the concentration dependence ofD±(c) and can only provide an average value between the chosensalt concentration and zero (the concentration at the surface of theelectrode at the limiting current).
The most popular method for the determination of the concen-tration dependent binary diffusion coefficient D±(c) is the so-calledrestricted diffusion method introduced by Harned and French, whichis based on the observation of the long-term relaxation behavior fol-lowing an initially induced concentration profile.15 The applicabilityof the method for concentrated electrolyte solutions was demonstratedby Newman and Chapman for potassium chloride in water.16 The re-laxation process can be observed by different methods. In Stewart andNewman, an optical device was used to record the relaxation of theLiPF6 concentration profile in an EC diethylcarbonate (DEC) solventmixture (EC:DEC at 1:1 w:w).17 Limiting factors of this method arethe spatial resolution of the optical measurement and the complexityof the required analysis equipment. Alternatively, the relaxation of aninitially induced concentration profile can be observed indirectly viathe measured potential.6,18–23 In Hiller et al.,18 the concentration andtemperature dependent binary diffusion coefficients of LiTFSI and Li-BOB (lithium bis(oxalato) borate) in polyethylene oxide (PEO) basedpolymer electrolytes were determined by analyzing the long-termpotential relaxation following an initial current pulse in a restricteddiffusion experiment. In addition, the binary diffusion coefficients
) unless CC License in place (see abstract). ecsdl.org/site/terms_use address. Redistribution subject to ECS terms of use (see 129.187.254.46Downloaded on 2018-06-18 to IP
Journal of The Electrochemical Society, 164 (4) A826-A836 (2017) A827
were also calculated based on the short-term relaxation behavior ofsteady-state concentration profiles. Unfortunately, the binary diffusioncoefficients determined by the two methods differed significantly (byup to a factor of 6). Based on different relaxation experiments, the bi-nary diffusion coefficient of LiClO4 in PC electrolyte solution soakedinto a glass wool filter was determined by a numerical optimizationmethod by Georen and Lindbergh.24 Their approach was based ona physical model including solvent effects, as introduced by Georenand Lindbergh24 and Doyle,25 whereby convective effects were ne-glected and the tortuosity of the glass wool filter was determinedusing the Bruggeman relation (the latter may introduce significant er-rors, as was demonstrated recently by Landesfeind et al.2). A similarapproach based on a more elaborate optimization framework was usedby Nyman et al.19 and Lundgren et al.26 for LiPF6 in EC:EMC (3:7w:w) and in EC:DEC (1:1 w:w), respectively. In both publications,solvent effects and convective transport due to the motion of ions areincluded in the physical model used for the numerical optimizationand, in addition, the effective ionic conductivity of the used glassmicrofiber filters was determined experimentally. Recently, the influ-ence of solvent effects on the determination of transport parameterswas investigated numerically by Liu and Monroe.27 Note that the ex-perimental studies listed in this paragraph6,19,24,26 obtained the binarydiffusion coefficients by fitting the complete set of transport parame-ters to their numerical model (i.e., D±(c), t+(c), and f±(c)) or rely onother transport parameters, which undoubtedly will compromise theaccuracy achievable for each one of the parameters.
Although, as discussed above, there are various experimental meth-ods for the determination of binary diffusion coefficients already avail-able in the literature, these methods require either a conversion of self-diffusion coefficients into binary diffusion coefficients, an additionalspectroscopic technique to independently monitor concentration vs.time, or a global fit involving all concentration dependent physico-chemical transport parameters. For this reason, we believe, the sim-plicity of the here proposed experimental setup to determine D±(c) asa function of salt concentration, requiring no optimization frameworkand/or provision of additional parameters other than the tortuosity,which can be measured accurately in independent experiments,2 con-stitutes a valuable alternative method, particularly in view of its heredemonstrated accuracy and reproducibility. In the Theoretical back-ground section, a comprehensive introduction to the volume averagedion-transport equations for porous media is given, which is the theoret-ical basis for the determination of the concentration dependent binarydiffusion coefficient. In the Experimental section, the experimentalprocedures as well as the used materials and devices are introduced.The analytical framework for the determination of binary diffusioncoefficients are summarized in the section Mathematical derivation.In the latter two sections, the experimental and the theoretical dif-ferences between a cell setup with and without porous materials arehighlighted. Validity and accuracy of the introduced techniques areanalyzed and compared in the section Numerical validation. Becausetheoretically expected transients are more obvious in simulated ex-periments, this section aids the interpretation of experimental data.Finally, in the Results and discussion section, the concentration de-pendent binary diffusion coefficient of LiClO4 in EC:DEC (1:1 w:w)obtained from our measurements is given and compared with data inthe literature.
Theoretical Background
Many experimental methods for the determination of ion-transportparameters are based on analytical solutions of the component massconservation law. For a cell consisting of a porous medium filled withan electrolyte solution, the more general case of the volume averagedmass conservation law has to be considered
ε∂c
∂t− ∇ ·
( ε
τD± (c) ∇c
)+ ∇ ·
(t+ (c)
z+ν+Fi)
= 0 [1]
as introduced, e.g., in Newman and Thomas-Alyea.1 Here, the volu-metric intrinsic phase average of the concentration is denoted by c,
the charge number of the positive ionic species by z+, the stoichiomet-ric coefficient of the cation by ν+, and the volumetric phase averageof the current density by i (as usual, time is denoted by t and Fdenotes the faraday constant (96485 As/mol)). The terms volumetricintrinsic phase average and volumetric phase average result from thevolume averaging approach used for the mathematical description ofthe porous medium. In this approach, the microscopic relations are av-eraged over a representative element volume to yield the macroscopictransport equations. In case of the volumetric intrinsic phase average,the averaging is performed only over the electrolyte phase within therepresentative element volume, whereas both the volume of the elec-trolyte and the solid phase within the representative element volumehave to be considered in case of the volumetric phase average. Thevolumetric intrinsic phase average multiplied by the porosity thus cor-responds to the volumetric phase average. The interested reader is re-ferred to Bear and Bachmat28 or Landstorfer and Jacob29 for a detailedderivation of these macroscopic equations. The transport parametersused in the mass conservation law are the concentration dependentbinary diffusion coefficient D±(c) and the transference number t+(c).The porosity ε and the tortuosity τ are parameters related to the mor-phology of the porous medium and are frequently used to obtain theso-called effective binary diffusion coefficient D±,eff = ε τ−1 D±.
The conservation of current is given by
∇ · i = 0 [2]
with
i = − ε
τκ (c) ∇� + ν
z+ν+
RT
F
ε
τκ (c)
×[
1 + ∂ ln f± (c)
∂ ln c
](1 − t+ (c))
1
c∇c [3]
Here, � stands for the volumetric intrinsic phase average of the electricpotential with respect to a lithium reference electrode. In addition, theconcentration dependent conductivity κ(c) and the thermodynamicfactor [1 + ∂ ln f±(c)/∂ ln c] are necessary to describe the currentflow. The coefficient ν = ν+ + ν− is based on the stoichiometrycoefficients ν+ and ν− resulting from the dissociation of a binary saltin its components (e.g., ν = 2 for the typical 1:1 salts used in lithiumion batteries). The gas constant is denoted by R (8.314 J/(mol K)) andthe temperature by T (in units of Kelvin).
In combination with Eq. 2, Eq. 1 can be simplified to a one-dimensional scalar transport equation
∂c
∂t− 1
τD± (c0)
∂2c
∂x2= 0 [4]
with the volumetric phase average of the flux density N as the corre-sponding boundary condition
N = − ε
τD± (c0)
∂c
∂x+ t+ (c0)
z+ν+Fi [5]
if the following assumptions are valid:
1. The experimental setup resembles an ideal geometrical configu-ration, as is for example satisfied for a setup consisting of two par-allel and aligned flat electrodes separated by an electrolyte layerand completely enclosed by insulators. In this case, concentrationand potential gradients are exclusively orientated in x-direction(i.e., normal to the electrodes). As a result, ion-transport in theelectrolyte solution can be described by a one-dimensional par-tial differential equation. In reality, this ideal configuration canbe approximated by a two electrode cell with a large radius todistance ratio.
2. The assumption of a zero order approximation for the concentra-tion dependent binary diffusion coefficient D±(c)|co±δc = D±(c0)and the transference number t+(c)|co±δc = t+(c0) has to be valid.This assumption is fulfilled if the binary diffusion coefficientand the transference number are concentration independent orif the concentration variations δc around an initial concentration
) unless CC License in place (see abstract). ecsdl.org/site/terms_use address. Redistribution subject to ECS terms of use (see 129.187.254.46Downloaded on 2018-06-18 to IP

A828 Journal of The Electrochemical Society, 164 (4) A826-A836 (2017)
c0 are small. The same condition is required for the remain-ing ion-transport parameters, namely the conductivity and thethermodynamic factor. Typical concentration dependent transportparameters of various binary electrolyte solutions usually fulfillthis assumption, as is demonstrated in the section Numerical val-idation.
3. The porosity ε and the tortuosity τ are constant with respect totime and space.
At the boundaries, the relation between the current density and theflux density i = z+ ν+ F N can be used to reformulate Eq. 5.
i = −z+ν+Fε
τD± (c0)
1 − t+ (c0)
∂c
∂x[6]
A more detailed derivation of these equations is given, e.g., byNewman and Thomas-Alyea1 or by Ehrl.30
The partial differential equation given in Eq. 4 can be solved ana-lytically for different types of Boundary Conditions (BCs) and InitialConditions (ICs). As a result, an expression for the concentration dif-ference �c = cA − cC between the Anode (A) and the Cathode (C)can be obtained, which for a given set of BCs/ICs correlates �c withthe concentration dependent binary diffusion coefficient and transfer-ence number, with the chosen salt bulk concentration, and the elec-trode morphology related porosity and tortuosity, in the general formRef. 1
�c = cA − cC = f (D± (c0) , t+ (c0) , ε, τ, c0) [7]
If the concentration difference �c for a specific set of BCs/ICs andthe corresponding functional description of Eq. 7 with the remainingparameters are known, it is possible to calculate the binary diffusioncoefficient D±(c). The functional description to calculate the binarydiffusion coefficient from Eq. 7 with different experimental proce-dures is presented in the following. For polarization experiments, wefurther define the x-axis of the one-dimensional coordinate system topoint from the electrochemical cathode with xC = 0 toward the elec-trochemical anode with xA = l, as a result of which, the concentrationgradient will always be positive during the polarization experimentand the subsequent relaxation phase if Li+ ions are the only reactingspecies in the system (i.e., the anode concentration cA ≥ the cathodeconcentration cC).
In this study, the concentration difference �c is determined in-directly by utilizing its correlation with the measured cell potentialU = �� + η, where the potential difference between anode andcathode �� = �A −�C is the volumetric intrinsic phase average ofthe electric potential and η is the kinetic overpotential of the anodicand cathodic charge transfer reactions. To do so, Eq. 3 has to be re-duced to its one-dimensional form as was demonstrated above for theion-transport equation. This dimensional reduction is also only validif the same conditions as for the ion-transport equation are fulfilled,especially the small concentration variation �c between anode andcathode. In the absence of current flow (i.e., i = 0) across the elec-trodes, the kinetic overpotential η term is zero and the integration ofEq. 3 along a one-dimensional path directed from the cathode to theanode gives
U = �� = ν
z+ν+
RT
F
[1 + ∂ ln f± (c0)
∂ ln c
](1 − t+ (c0)) ln
cA
cC[8]
where the thermodynamic factor (TDF) is assumed to be constant forsmall concentration variations around the bulk concentration c0, aswas already assumed above for the binary diffusion coefficient andthe transference number. In order to use the cell potential as a measurefor the concentration difference �c, it is necessary to introduce anadditional linearization for the term ln cA/cC . If the concentrationdifference �c = cA −cC is small compared to the initial concentrationc0 (�c << c0), the logarithmic term in Eq. 8 can be approximated by
lncA
cC≈ �c
c0[9]
Figure 1. Schematic of two-electrode cell with symmetrical lithium elec-trodes and larger diameter, aligned separators, which was used for pulse ex-periments in the determination of binary diffusion coefficients.
as was shown, e.g., by Bruce and Vincent.31 Under these conditions,the cell potential in the absence of current flow (s. Eq. 7) will be di-rectly proportional to the concentration difference �c between anodeand cathode
U = �� ∝ �c [10]
This is one of the central aspects for the electrochemically baseddetermination of transport parameters. The same method was alsoapplied in, e.g., Ma et al.,23 Zugmann et al.,32 or Valøen et al.6
Experimental
Mixtures of ethylene carbonate (EC, 50% by weight, SigmaAldrich, anhydrous, 99%) and diethyl carbonate (DEC, 50% byweight, Sigma Aldrich, anhydrous, >99%) were used as solventsfor self-prepared electrolytes containing lithium perchlorate (LiClO4,Sigma Aldrich, 99.99%) salt, mixed in an argon filled and tempera-ture controlled glove box (MBraun, 25◦C ± 1◦C, water content <0.1ppm, Ar 5.0, Westfalen, 99.999% Vol). LiClO4 concentrations rangedfrom 0.01 to 2 M. Metallic lithium (Rockwood Lithium, 0.45 mmthickness, high purity) was used as counter electrode (CE) and work-ing electrode (WE). The binary diffusion coefficient was determinedby polarization experiments in a two electrode setup as shown inFigure 1.
All cell parts were cleaned by boiling them in a mixture of ethanoland water (Millipore, Elix, 15 M �), thoroughly rinsing them withwater, followed by overnight drying at 70◦C in a heating oven beforebringing them into the glove box. Twenty circular layers of Celgard2500 separator (porosity 55%, thickness 25 μm) with a diameter of20 mm were placed between the two lithium electrodes with a diam-eter of 17 mm. A larger separator size ensured that no stray currentscould flow around the porous separators through the bulk of the elec-trolyte. The electrode distance is determined by the thickness of theseparators, which are incompressible in the pressure range inducedby the mechanical spring (≈0.1 MPa). Due to the chosen setup, thegeometrical distance between the electrodes (l) can be adjusted accu-rately to small values such as l = 20 · 25 μm = 0.5 mm. As a result,a large radius to distance ratio was obtained, minimizing the influenceof the edge effects of the electric field and thereby fulfilling the re-quirement of a one-dimensional concentration and potential gradient.It is emphasized that convective effects are also suppressed using thissetup with a porous separator, which is supported by experimentaldata: after positive and negative polarizations of the two electrodes(aligned perpendicularly to the gravitational field), identical potentialrelaxation transients were observed, proving that convective trans-port can be neglected. After the cells were sealed with PTFE gaskets,measurements were conducted in a climate chamber outside the glovebox. A Biologic VMP3 potentiostat/galvanostat was used for the elec-trochemical measurements and cell impedances were measured in afrequency range from 200 kHz to 1 Hz.
Experimental procedure used in polarization cells.—Potentio-static steady-state and galvanostatic pulse polarization experimentswere conducted using the two electrode symmetrical lithium cellshown in Figure 1. While after a long potentiostatic steady-state po-larization a linear concentration profile is established between theelectrodes (lower panels in Figure 2), the short galvanic pulse po-larization procedure is designed such that the concentrations change
) unless CC License in place (see abstract). ecsdl.org/site/terms_use address. Redistribution subject to ECS terms of use (see 129.187.254.46Downloaded on 2018-06-18 to IP

Journal of The Electrochemical Society, 164 (4) A826-A836 (2017) A829
Figure 2. Schematic of the current/voltage profiles during the galvanostaticpulse polarization experiments (GPP; s. upper left panel) and of the poten-tiostatic steady-state polarization (SSPP; s. lower panel), together with therespective concentration profiles present at the current interruption time TI.
only in the vicinity of the electrodes (s. upper panel in Figure 2).Measurements for each salt concentration were repeated at least twotimes in order to check for reproducibility.
In each cell, a 6 h rest period was followed by several galvanos-tatic pulse polarization (GPP) experiments with various polarizationcurrents Ip and times TI, whereby a pulse with a positive current flowwas always followed by an identical pulse with a reversed currentflow. After each individual polarization, an OCV (open circuit volt-age) phase of at least 3 h was applied in order to ensure a completerelaxation of the concentration profile. In theory, the polarization timein a galvanostatic pulse experiment has no impact on the long-termrelaxation behavior of the concentration profile. Due to the relax-ation process, the requirement for small concentration differencesbetween anode and cathode are automatically fulfilled for long times.However, due to the finite accuracy of the measurement equipment(100–200 μV noise with the VMP3 potentiostat/galvanostat), too shortpolarization times with correspondingly small logarithmic cell po-tential variations make a determination impractical. Following thesegalvanostatic pulse experiments, a steady state potentiostatic polar-ization (SSPP) experiment was conducted. For these experiments, thepolarization phase was terminated manually for each cell once thecurrent I (t) remained stable for at least 2 minutes, resulting in poten-tiostatic polarization times on the order of 15 to 60 minutes. The highfrequency resistance of the cell was measured before and at the end ofeach pulse experiment to evaluate the stability of the electrolyte andwas found to vary less than 3% over the course of the experimentsfor the nominal electrolyte concentrations of 0.5 M to 2 M. Only forthe smallest electrolyte concentration of 0.01 M, the high frequencyresistance was found to decrease by 10% from the beginning to theend of the experiment (∼24 h). This decrease in the high frequencyresistance implies an increase of the electrolyte conductivity, whichmust be due to an increase in ion concentration caused by SEI forma-tion. Since the conductivity scales linearly with concentration at suchlow concentrations, the effective electrolyte concentration should beca. 11 mM compared to the nominal concentration of 10 mM, whichis a reasonably small error, particularly since the equations for thedetermination of the binary diffusion coefficient are not a functionof the salt concentration (shown later on by Eq. 14 and Eq. 17).Table I summarizes the applied galvanostatic pulse and steady-statepotentiostatic polarization parameters. The polarization currents ingalvanostatic experiments and the potentials in potentiostatic exper-iments were selected such that the current density would always be
Table I. Summary of the applied galvanostatic pulse polarization(GPP) steps and the subsequent steady-state potentiostaticpolarization (SSPP) for different LiClO4 concentrations inEC:DEC (1:1 w:w), used to determine the binary diffusioncoefficient in the two-electrode cell setup shown in Figure 1.
Salt Concentration GPP SSPP
2 min, ± 50 μA0.01 M 4 min, ± 50 μA 20 mV, ∼ 60 min
3 min, ± 75 μA
6 min, ± 500 μA16 min, ± 500 μA 50 mV, ∼ 15 min12 min, ± 750 μA
0.5 M, 1 M1.5 M, 2 M
below 0.3 mA/cm2, as this assures the absence of lithium dendriteformation.33
Mathematical Derivation
In this contribution, two different methods for the electrochemicaldetermination of the binary diffusion coefficient from the potentialrelaxation after polarization are considered. In the first method, theobserved long-term relaxation behavior of the cell potential after agalvanostatic pulse (GPP) or a steady-state potentiostatic polariza-tion experiment (SSPP) is analyzed. The second method is basedon the analysis of the short-term relaxation behavior of the cell po-tential following a steady-state potentiostatic polarization. The firstmethod is frequently used in the literature to determine the binarydiffusion coefficient of polymer electrolytes and non-aqueous elec-trolyte solutions.6,18–23 However, when this method is applied to theevaluation of liquid electrolytes, most of the used experimental setupsdo not fulfill the ideal geometrical configuration which is required forsimplification of Eq. 4. Additionally, convective effects influencingthe ion transport equations in the polarization cell are not suppressedat all by these experimental setups, especially on long time scales.With regards to eliminating convective contributions to ion transport,the here proposed cell setup using porous separators is clearly superior(s. explanation in the Experimental section), but when using porousseparators, the classical equations have to be adapted according tothe volume averaged ion-transport equations, as will be shown in thefollowing.
Analysis of the long-term relaxation behavior.—When using thelong-term relaxation behavior for the determination of the diffusioncoefficient, the two-electrode cell can be polarized by galvanostaticpulses or by potentiostatic steady-state polarization. For this method,the concentration profile c(TI) established at the interruption time TI
is considered as the initial concentration profile. The relaxation of theconcentration profile (i.e., for I = 0) can be observed via the relaxationof the cell potential U (t). Originally, the method was developed fordilute electrolytes by Harned and French.15 The theoretical verifica-tion for concentrated solutions is given in Newman and Chapman.16 Itis important to realize that in both publications only bulk electrolytesolutions, i.e., without a porous separator are considered, so that theyare not valid for experiments with porous separators. However, Eq. 4can be simply rescaled to have the same form as Eq. 1 used by New-man and Chapman,16 if we define a partial effective binary diffusioncoefficient D∗
±,eff (c0) ≡ τ−1 · D±(c0):
∂c
∂t− D∗
±, eff (c0)∂2c
∂x2= 0 [11]
With this modification, the time dependent concentration at eachelectrode can now be determined by Eq. 2 in Newman and Chapman,16
from which �c(t) can be obtained by taking the difference betweencA(t) and cC(t) (i.e., evaluating Eq. 2 in Newman and Chapman16 forcathode location xC = 0 and the anode location xA = l; note that
) unless CC License in place (see abstract). ecsdl.org/site/terms_use address. Redistribution subject to ECS terms of use (see 129.187.254.46Downloaded on 2018-06-18 to IP

A830 Journal of The Electrochemical Society, 164 (4) A826-A836 (2017)
x ≡ y and l ≡ a in Reference 16):
�c (t) = cA (t) − cC (t) = 2C1 exp
(−π2 D∗
±,eff (c0)
l2t
)+ 2C3
× exp
(−9π2 D∗
±,eff
l2t
)+ 2
∞∑n=3
C(2n−1)
× exp
(− (2n − 1)2π2 D∗
±,eff (c0)
l2t
)[12]
It is important to note that the here used partial effective binarydiffusion coefficient (D∗
±,eff (c0) ≡ τ−1 · D±(c0) ) must be distin-guished from the commonly used effective binary diffusion coeffi-cient (D±,eff (c0) ≡ ε · τ−1 · D± (c0) = ε · D∗
±,eff (c0)), which wasdefined in the Theoretical background section. In the derivation ofNewman and Chapman,16 a variable binary diffusion coefficient andconvective effects as a result of a varying solution volume were alsoconsidered, resulting in a similar relationship as that of Eq. 12. Basedon these results, the authors conclude that the variation in solutionvolume does not play a major role for small concentration variations.Convective effects as a result of natural or forced convection arenot investigated in the latter publication, although the experimentalsetup uses a liquid electrolyte without porous separator, so that theabsence of natural convection cannot necessarily be assumed. Thedifferent initial conditions resulting from the galvanostatic pulse andthe steady-state potentiostatic polarization experiments do only havean influence on the prefactor Cn , but not on the exponential terms. Adetailed derivation of this formula is given in Ehrl.30
For large times, i.e., t → ∞, the first term of the analytical solution(Eq. 12) is dominating, yielding a linear relationship of the logarithmicconcentration difference ln �c(t) with respect to time t
ln �c (t) = ln (2C1) − π2 D∗±,eff (c0)
l2· t ∝ ln U (t) [13]
Since the concentration difference �c and the measured cell po-tential U are directly proportional (Eq. 10), the linear behavior canalso be observed for the cell potential U (indicated at the right-hand-side of Eq. 13). Thus, when plotting ln U (t) vs. t, the slope of theline as t → ∞ (denoted as m ln) corresponds to π2 · D∗
±,eff (c0)/l2 (s.Eq. 13), so that the partial effective binary diffusion coefficient can becalculated from the linear slope m ln:
D∗±,eff (c0) = l2
π2· m ln [14]
Advantageous in this approach is the fact that the initially im-posed concentration difference by the galvanostatic pulse or the po-tentiostatic hold decreases with increasing time, which supports therequirement for small concentration variations introduced in the The-oretical background section.
Analysis of the short-term relaxation behavior.—In this secondmethod, a linear concentration profile c(TI) from a preceding poten-tiostatic steady-state polarization is considered as an initial concentra-tion profile established at the time TI when the current is interrupted,which can be approximated by a linear function for small concentra-tion variations. It should be noted, however, that whether the linearconcentration profile is obtained galvanostatically or potentiostaticallyis irrelevant. For the short-term relaxation from a steady-state concen-tration profile, the time dependent concentration difference �c(t) isgiven by the relation
�c (t) = �c (TI) ·(
1 −√
16 · D∗±,eff (c0)
π · l2· t
)[15]
showing that the short-term relaxation process is linear with respectto
√t . Eq. 15 is derived by solving the partial differential equation
given by Eq. 4, using a linear concentration profile as initial conditionand no-flux conditions at both electrodes, which can be done by a
Laplace transformation as shown, e.g., by Ehrl.30 The same equationwas presented by Hiller et al.18 for a polymer electrolyte, the onlydifference being that in their equation D∗
±,eff (c0) in Eq. 15 is replacedby D±,eff (c0), as there is no porous matrix/separator. For small con-centration variations, Eq. 15 can also be expressed with Eq. 8 and Eq.9 in terms of the cell potential
U (t) = U (TI) − U (TI)
√16D∗
±,eff (c0)
l√
π
√t = U (TI) − msqrt
√t
[16]where msqrt denotes the slope of a plot of cell potential U versus
√t .
As a result, the partial effective binary diffusion coefficient D∗±,eff can
be determined by
D∗±,eff (c0) = π · l2
16·(
msqrt
U (TI)
)2
[17]
Here, the cell potential U (TI) denotes the potential measured di-rectly after current interruption.
For both methods, the tortuosity τ of the porous separatoris required to determine the ultimately desired binary diffusioncoefficient D±(c0), which can be determined, e.g., by the methodproposed in Landesfeind et al.2 Alternatively, the effective binary dif-fusion coefficient D±,eff (c0) = ε · τ−1 · D±(c0) = ε · D∗
±,eff for aspecific porous medium/separator can be calculated from the deter-mined value of D∗
±,eff , if its porosity is known. In general, carefulobservation of the voltage versus time behavior always gives a goodindication with regards to the quality of the experimental data, also iftransport parameters are determined by a numerical fitting approach.
Numerical Validation
In the following, the analytical expressions for the determination ofthe binary diffusion coefficient D±(c0) introduced in the Mathemati-cal derivation section are analyzed by means of numerical simulationsusing typical transport parameters for lithium ion battery electrolytesand typical kinetic parameters for metallic lithium in order to eval-uate their applicability for the experimental determination of binarydiffusion coefficients, i.e., in order to verify the assumptions made inthe Theoretical background section. All simulations are based on theEquations 1–3 and were performed with an in-house finite elementresearch code. A detailed derivation of the used numerical methods isgiven in Ehrl.30
All numerical simulations are based on a one-dimensional domainrepresenting a virtual electrode area A = 227 mm2 (correspondingto the 17 mm diameter lithium electrodes used in this work). Thesimulation and transport parameters are summarized in Table II. Thechosen parameters do not represent a specific material or electrolytebut should be somehow realistic. The values given for the porosityand the tortuosity are of the same order as for the Celgard 2500separator characterized in Landesfeind et al.,2 whereas the functionaldescription of the transport parameters is guided by the transportparameter of an electrolyte solution consisting of lithium perchlorateLiClO4 dissolved in EC:DEC (1:1 w:w).3,4 In contrast to Landesfeindet al.,4 the theoretically expected Debye-Huckel behavior is includedin the description of the thermodynamic factor to demonstrate thateven such a strong non-linearity at small concentrations does notinfluence the proposed measurement method. The exchange currentdensity i0 in the Butler-Volmer equation is chosen to correspond toa realistic value for the kinetic resistance of a porous electrode. Theremaining parameters of the Butler-Volmer equation are assumed.
Numerical analysis of the polarization experiments.—Using aquasi-1D two-electrode cell (s. Figure 1), the binary diffusion coeffi-cient D±(c0) in this study will be determined by three different meth-ods, which were summarized in the Mathematical derivation section.The binary diffusion coefficients D±|pulse
long−term and D±|steady−statelong−term refer
to the values calculated from the long-term relaxation behavior after apulse and a steady-state polarization experiment, respectively (in this
) unless CC License in place (see abstract). ecsdl.org/site/terms_use address. Redistribution subject to ECS terms of use (see 129.187.254.46Downloaded on 2018-06-18 to IP

Journal of The Electrochemical Society, 164 (4) A826-A836 (2017) A831
Table II. Simulation parameters for the quasi one-dimensionalsimulation using the finite element research code developed at theInstitute for Computational Mechanics at the Technical Universityof Munich. The concentrations in the below given correlations aregiven in units of mol/L.
Computational domain [mm]cathode at xC = 0 and
anode at xA = 0.5
Virtual electrode area A [mm2] 227Porosity ε [-] 0.55
Tortuosity τ [-] 2.6
Initial concentration c0 [M] 0.01 / 1.0 / 2.0
Binary diffusion coefficient D± [ mm2
s ] 2.84 · 10−4 exp(−0.45 · c)
Transference number t+ [-] 0.4 + 0.2 · c − 0.125 · c2
Thermodynamic factor [-] 1 − 12 · 3.95·√c
(1+63.05·√c)2 + 0.907 · c
Conductivity κ [ μSmm ] 3400 ·c−4700·c 3
2 +2000 ·c2
1.0 + 0.2 ·c4
i = i0 ·(
cc0
)γ ·[exp
(αA FRT η
)−exp
(αC FRT η
)]i0 = 3 μA
mm2 , γ = 0, αA = αC = 0.5Butler-Volmer equation/parameters
Table III. Analytical methods for the determination of the binarydiffusion coefficient D±(c0) from the three different types ofexperiments.
D±|pulselong−term, D±|steady−state
long−terml2
π2 · τ · mln Eq. 14
D±|steady−stateshort−term
π ·l2
16 · τ ·(
msqrtU (TI)
)2Eq. 17
work, pulse polarization experiments were done galvanostatically andsteady-state polarization experiments were done potentiostatically).In addition, the binary diffusion coefficient D±|steady−state
short−term refers tovalues calculated from the short term relaxation behavior of a steady-state polarization experiment (done potentiostatically in this work).The relevant equations for determining these diffusion coefficients aregiven in Table III.
Figure 3 and Figure 4 depict exemplarily simulated potential re-laxations after a simulated galvanostatic pulse (GPP) and steady-state
Figure 3. Simulation of a galvanostatic pulse polarization experiment (GPP)based on the parameters given in Table II and applying a polarization timeof 30 s, a polarization current density of ip = 0.8 mA/cm2 (correspondingto a current of Ip = 1.82 mA ), and an initial electrolyte concentration ofc0 = 1 M.
Figure 4. Plot of the relaxation phase of a simulated steady-state potentiostaticpolarization experiment (SSPP) based on the parameters given in Table II, witha polarization time of TI = 3300 s, a polarization potential of Up = 50 mV,and an initial electrolyte concentration of c0 = 1 M.
potentiostatic polarization (SSPP), respectively. The black and the redlines represent the numerical simulation results for the cell poten-tial U and the current I , respectively. The green lines stand for thesimplified analytical solution presented in the section Mathematicalderivation and summarized in Table III. The insets in both figuresshow the linear long-term relaxation of the logarithm of the cell po-tential vs. time with the corresponding analytical solution (Eq. 13) andthe linear short-term relaxation of the cell potential with respect to thesquare root of time with the corresponding analytical solution (Eq.16). In both cases, the expected time behavior predicted by Eq. 13 andEq. 16 can be observed. The slope m ln obtained from the long-termrelaxation behavior is proportional to the partial effective binary dif-fusion coefficient D∗
±,eff (c0) as shown in Eq. 14. Similarly, the slopemsqrt obtained from the short-term relaxation of the cell potential al-lows to determine the partial effective binary diffusion coefficient asshown in Eq. 17. In this case, however, in addition to the knownseparator thickness l, the cell potential U (TI) immediately after cur-rent interruption is necessary to calculate the partial effective binarydiffusion coefficient from Eq. 17. In theory, U (TI) is equal to the con-centration overpotential resulting from the concentration difference�c between anode and cathode. However, in actual experiments, thecell potential U (TI) immediately after current interruption is usuallyaffected by additional parasitic contributions as a result of the currentinterruption (SEI formation currents, capacitive currents), as shownlater in Figure 9 in the Results and discussion section. To overcomethis commonly encountered experimental problem, the linear relationof the concentration difference �c (and thus of U) with respect to
√t
(s. Eq. 15) can be used to extrapolate to the cell potential U (TI), whichwould be solely due to the concentration overpotential immediatelyafter current interruption (i.e., at TI + δt). This is valid, if the relax-ation process of the concentration difference �c (diffusion process)proceeds on a slower time scale than the relaxation of potential para-sitic processes as, e.g., capacitive effects. The extrapolation approachfor determination of the cell potential U (TI) at TI + δt is also demon-strated in Figure 4, but as the numerical simulations do not includeparasitic effects, the extrapolated and the simulated value of U (TI) areof course identical.
Validation of determination methods.—In Figure 5, the binarydiffusion coefficients determined by the different approximation equa-tions (s. Table III) are depicted with respect to the concentration dif-ference �c(TI) at the current interruption time, which is determinedfrom the simulation for a bulk salt concentration of c0 = 1 M. In caseof a pulse experiment, the concentration difference �c(TI) depends onthe polarization time and the applied polarization current Ip while in
) unless CC License in place (see abstract). ecsdl.org/site/terms_use address. Redistribution subject to ECS terms of use (see 129.187.254.46Downloaded on 2018-06-18 to IP
A832 Journal of The Electrochemical Society, 164 (4) A826-A836 (2017)
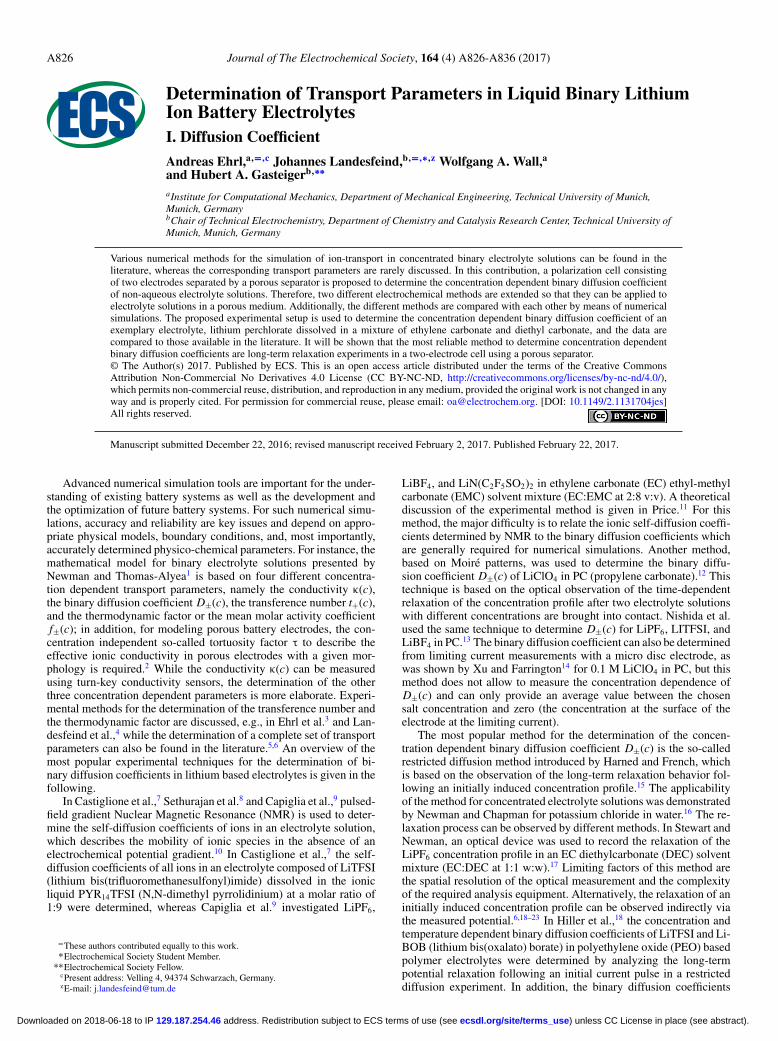
Figure 5. Binary diffusion coefficient D± with respect to the concentrationdifference �c(TI) between anode and cathode obtained from the simulation atthe current interruption time for c0 = 1 M (TI = 300 s for pulse experiments,see Table II for other simulation parameters).
case of a steady-state experiment it depends only on the polarizationpotential Up.
The results presented in Figure 5 confirm that all three evalua-tion methods listed in Table III are reasonably accurate up to relativeconcentration differences �c/c0 of ≈ 20% at the current interruptiontime. For the long-term relaxation behavior, the concentration differ-ence �c(TI) at the current interruption time does not influence thequality of the obtained binary diffusion coefficient, since at the evalu-ated long times after the current interrupt, the concentration difference�c is small enough to fulfil the requirement of small concentrationvariations, even though this is not satisfied for short times after thecurrent interrupt. As already mentioned earlier, this is an obvious ad-vantage of the analysis of the long-time relaxation behavior over thatof the short-time relaxation behavior. These findings are also valid forall the other bulk concentrations c0 investigated in this study, as shownin Table IV. It may be noted here, that evaluation of the long-termrelaxation behavior requires the suppression of convective effects,which is generally valid for polymer electrolytes, but in case of liq-uid electrolytes is only really possible when using a porous matrix(separator) containing the electrolyte rather than a pure electrolytephase.
Compared to the long-term relaxation behavior, the results of theshort-term relaxation are clearly influenced by the concentration dif-ference �c(TI) at the current interruption time, since high valuesof �c(TI) violate the requirement of small concentration variations(s. Theoretical background section). Additionally, the error for the
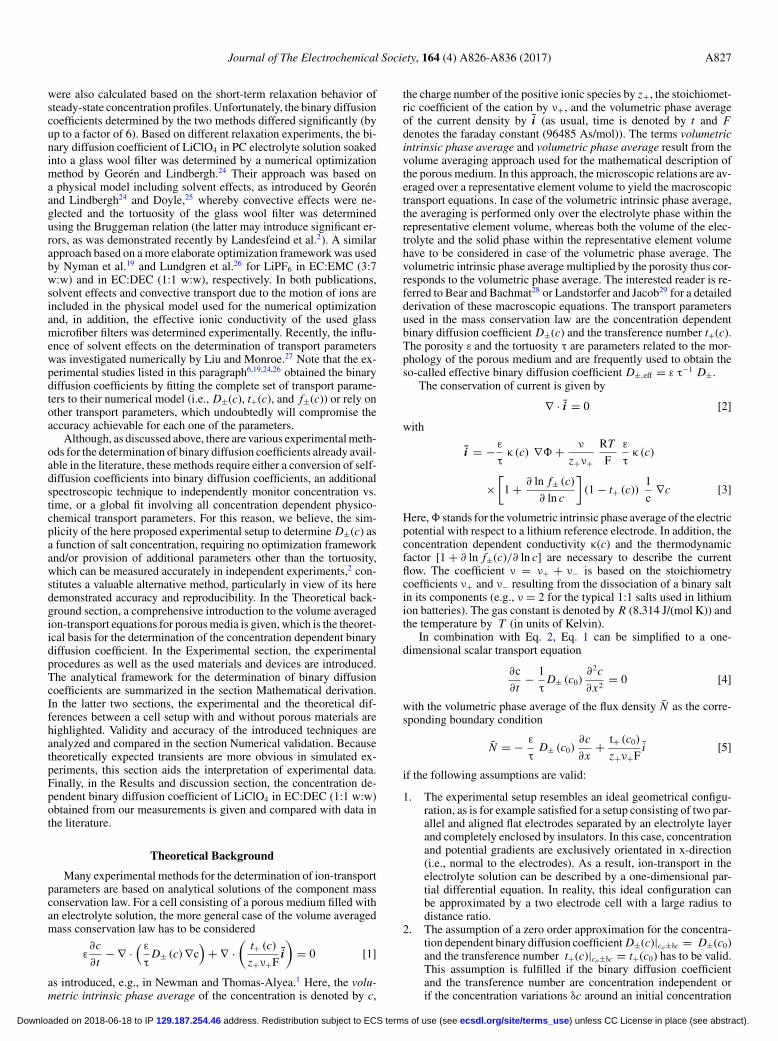
Figure 6. Relaxation behavior of the relative cell potential U (t)/U (TI) withrespect to
√t for different polarization potentials U0 and for c0 = 1 M. The
data are fitted in the range from t = 1 s to t = 10 s (see Table II for simulationparameters).
determined binary diffusion coefficient D±|steady−stateshort−term increases for
increasing bulk concentration c0, since the absolute concentrationdifference �c(TI ) at current interruption is larger for a high salt con-centration. The effect of the concentration difference �c(TI) on thelinearity of the cell potential U (t) vs.
√t is shown in Figure 6 for
c0 = 1 M.As already indicated in Figure 5, a concentration variation of up
to 20% with respect to the salt concentration c0 does not significantlyinfluence the linearity of the cell potential U (t) vs.
√t behavior. For a
higher relative concentration difference, a deviation of the linear be-havior can be observed in Figure 6 (s. blue dash-dotted line). However,the differences between the linear and a non-linear behavior of the rel-ative potential with time is quite small, which may make it difficultto distinguish between high and low quality results, especially in realexperiments with limited signal to noise ratio. Two different effectsare the reason for this deviation. First, the concentration dependenceof the thermodynamic factor and the transference number t+(c) aswell as the linearization of the natural logarithm in Eq. 9 violate theassumed proportionality between the concentrations difference �c(t)and the cell potential U (t). Additionally, the concentration dependentbinary diffusion coefficient D±(c) and transference number t+(c) inthe ion transport equation violate the condition of constant transportparameters. This would be the only theoretical inaccuracy in case of aspectroscopic evaluation of the concentrations at cathode and anode.In case of the numerical simulation, the binary diffusion coefficient
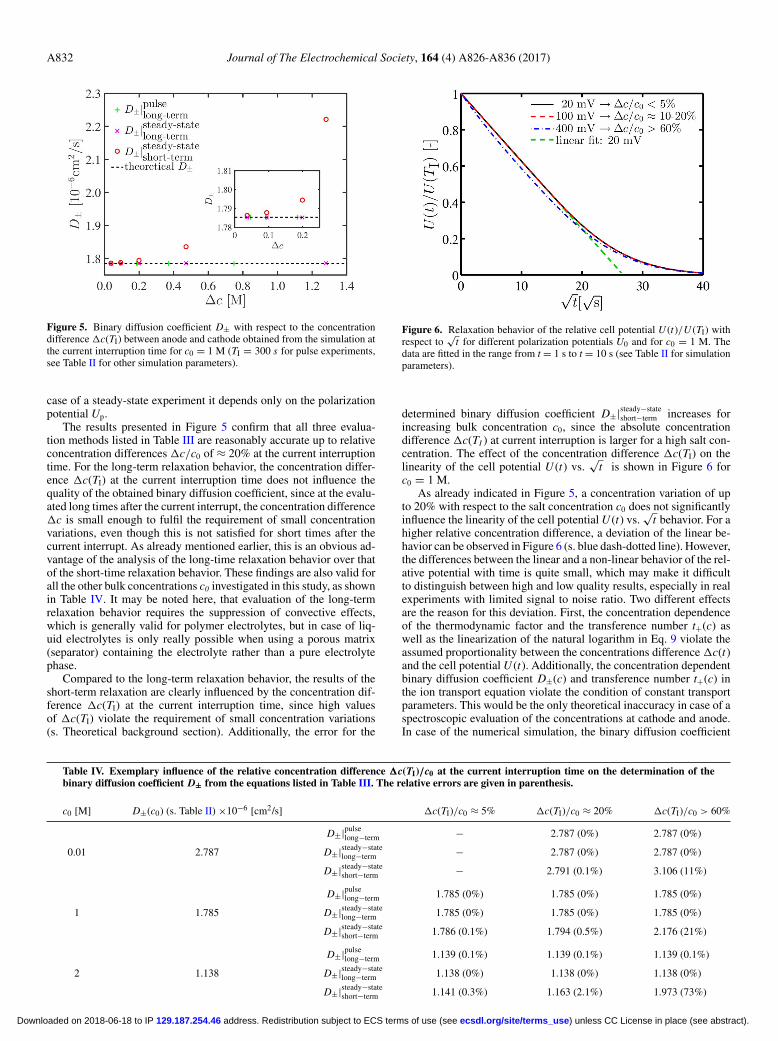
Table IV. Exemplary influence of the relative concentration difference �c(TI)/c0 at the current interruption time on the determination of thebinary diffusion coefficient D± from the equations listed in Table III. The relative errors are given in parenthesis.
c0 [M] D±(c0) (s. Table II) ×10−6 [cm2/s] �c(TI)/c0 ≈ 5% �c(TI)/c0 ≈ 20% �c(TI)/c0 > 60%
D±|pulselong−term − 2.787 (0%) 2.787 (0%)
0.01 2.787 D±|steady−statelong−term − 2.787 (0%) 2.787 (0%)
D±|steady−stateshort−term − 2.791 (0.1%) 3.106 (11%)
D±|pulselong−term 1.785 (0%) 1.785 (0%) 1.785 (0%)
1 1.785 D±|steady−statelong−term 1.785 (0%) 1.785 (0%) 1.785 (0%)
D±|steady−stateshort−term 1.786 (0.1%) 1.794 (0.5%) 2.176 (21%)
D±|pulselong−term 1.139 (0.1%) 1.139 (0.1%) 1.139 (0.1%)
2 1.138 D±|steady−statelong−term 1.138 (0%) 1.138 (0%) 1.138 (0%)
D±|steady−stateshort−term 1.141 (0.3%) 1.163 (2.1%) 1.973 (73%)
) unless CC License in place (see abstract). ecsdl.org/site/terms_use address. Redistribution subject to ECS terms of use (see 129.187.254.46Downloaded on 2018-06-18 to IP

Journal of The Electrochemical Society, 164 (4) A826-A836 (2017) A833
D±|steady−stateshort−term can also be determined directly from the relaxing con-
centration difference �c(t) rather than from the cell potential U (t).The advantage of this approach is that potential non-linearities in-troduced by the concentration dependent thermodynamic factor andtransference number as well as by the linearization of the naturallogarithm are not included. As a result, the error in the binary diffu-sion coefficient D±|steady−state
short−term reduces, e.g., from 21% (s. Table IV)to 7% for a simulation of a 1 M electrolyte solution and for the high-est polarization potential Up = 400 mV. These values are a goodindication of the errors introduced by the indirect observation of theconcentration difference �c(t) by the cell potential U (t). Besides thisexemplarily estimation, a more elaborate quantification of the errorsis quite complex, since the error is strongly influenced by the concen-tration dependence of the transport parameters which are not knowna priori.
In addition to choosing a polarization potential in SSPP experi-ments, the polarization time is an additional experimental parameter,since a steady-state concentration profile is strictly required. If therelaxation process starts from a non-linear concentration profile, asimilar non-linear behavior of the relative cell potential with respectto the square root of time as shown in Figure 6 can also be observed. Inconsequence, the method based on the short-term relaxation behaviorrequires a true linear concentration profile at the current interruptiontime.
As a result of these considerations, the methods based on the long-term relaxation behavior of the potential are more reliable (reflectedby the smaller errors shown in Table IV), since the results are not at allinfluenced by the initially established concentration profile. Addition-ally, the requirement of small concentration variations is automaticallyfulfilled for the methods based on the long-term relaxation behavior.Besides, both methods observing the long-term relaxation behaviordepend only on a single parameter (viz., mln in Eq. 14), whereas itis necessary to determine the slope and the cell potential at currentinterruption time for the method based on the short-term relaxationbehavior (viz., msqrt and U(T1) in Eq. 17). The effect of experimen-tal uncertainties in these two parameters is furthermore magnified,since they appear in quadratic form in Eq. 17. Last but not least, thelong-term linearity of the logarithmic potential is more distinct thanthe short-term linearity of the potential with respect to the squareroot of time, whereby it is critical to suppress convective effects atlong times (s. above). This is of particular importance for experimen-tally determined data, which include experimental noise (the latter, ofcourse, does not affect the numerical simulation of the experiments).Potential influences of experimental artefacts on the quality of thedetermination methods are discussed in detail in the next section.
Results and Discussion
In the following, the proposed methods are used to determine thepartial effective binary diffusion coefficient D∗
±,eff of an exemplaryelectrolyte (LiClO4 in EC:DEC, 1:1 w:w). The tortuosity of the hereused Celgard 2500 separator (τ = 2.5) which is necessary for thecalculation of the binary diffusion coefficient D±(c0), is taken fromLandesfeind et al.,2 where it was determined from single separatorlayers. Because the experimental setup utilizes twenty layers of sep-arators, it is necessary to prove the independence of the tortuosityfrom the number of separator layers, i.e., that the separator/separatorinterface does not alter the overall tortuosity of a stack of separators.Calculation of the tortuosity from the high frequency resistance mea-sured before each pulse experiment (20 Ohm) of a cell filled with20 layers of the Celgard 2500 separator (porosity 55%, active area2.27 cm2) and the 0.5 M electrolyte (conductivity 5.3 mS/cm) yieldsa tortuosity of 2.65, which is in good agreement with the value foran individual layer of the separator of 2.5. Because also contact resis-tances caused by, e.g., the spring in the experimental setup contributeto the high frequency resistance, we use the single layer tortuosityof 2.5 in the following analysis. As introduced in the Mathematicalderivation section, the binary diffusion coefficient can be determined
Figure 7. Experimental SSPP data (corrected for the long time offset poten-tial) of the time relaxation of the natural logarithm of the potential (U in mV)after steady-state polarization (for polarization potentials and times see Table I),showing data for 0.01 M, 0.5 M, 1.5 M and 2.0 M LiClO4 in EC:DEC (1:1w:w) obtained in the two-electrode cell described in Figure 1. The binary dif-fusion coefficient is determined by the linear line fits (dashed black lines) viaD±|steady−state
long−term (see Eq. 14).
based on the long-term relaxation of the cell potential U (t) after apulse (D±|pulse
long−term, s. Table III) or after a steady-state polarization
experiment (D±|steady−statelong−term , s. Table III) as well as based on the short-
term relaxation of U (t) after a steady-state polarization experiment(D±|steady−state
short−term , s. Table III). Figure 7 exemplarily shows the relaxationof the logarithm of the potential ln U (t) versus time t after a steady-state polarization experiment in a 0.01 M, 0.5 M, 1.5 M, and 2.0 MLiClO4 electrolyte. While the cell potential U (t) relaxes to a constantvalue at long times, it never relaxes exactly to zero, ending at a sta-ble open circuit potential between −0.5 mV and +0.5 mV. This finalvalue was found to be random in magnitude and sign and is attributedto changes of the lithium metal electrode surface state due to SEI for-mation (initiated during lithium deposition on one of the electrodesin each pulse) and roughness variation. In consequence, all relaxationcurves are fitted with a free offset potential UOffset, since the linearbehavior of the open circuit potential ln U (t) with respect to time tcan be only observed if the open circuit potential U (t) approacheszero for long times. After offset correction, the linear behavior ofln(U) vs. t can be observed consistently over times ranging from 5 to25 minutes (marked by vertical dashed lines in Fig. 7), which allowsfor a quantification of the binary diffusion coefficient according toEq. 14.
The apparent increase in noise for long times is due to the logarith-mic scale, ultimately showing the digital resolution of the potentiostat.In this study, the noise level of the potential measurement was ±100μV. Applying the same analysis method, the binary diffusion co-efficient can also be obtained from the long-term relaxation of thecell potential U (t) after a pulse experiment (D±|pulse
long−term method, s.Eq. 14) which is not shown explicitly.
The short-term relaxation of the cell potential U (t) with respect to√t after a steady-state polarization is the basis for the determination
of the binary diffusion coefficient according to Eq. 17 (D±|steady−stateshort−term
method). Exemplary current transients during steady-state polariza-tion experiments with an applied potential of 50 mV, i.e., the currentnormalized by its initial value (I/I0) vs. time are shown in Figure 8.In case of a 0.01 M, 0.5 M, and 2.0 M electrolyte (blue, red, and cyanlines in Figure 8), a reasonably stable current plateau was reachedat the time when the current was interrupted (i.e., when switching toOCV). On the other hand, in the measurement with the 1.5 M elec-trolyte (green line in Figure 8), the current starts to increase after itsinitial decay, which is caused by the formation of high surface arealithium and an associated decrease in the charge transfer resistance for
) unless CC License in place (see abstract). ecsdl.org/site/terms_use address. Redistribution subject to ECS terms of use (see 129.187.254.46Downloaded on 2018-06-18 to IP

A834 Journal of The Electrochemical Society, 164 (4) A826-A836 (2017)
Figure 8. Exemplary steady state polarization current transients for 0.01 M,0.5 M, 1.5 M, and 2.0 M LiClO4 in EC:DEC (1:1 w:w) at constant polariza-tion of 50 mV in the two-electrode cell shown in Figure 1. The gaps in thecurves toward the end of the potentiostatic polarization procedure are due toimpedance measurements which were conducted during that time.
lithium dissolution/plating. In this case, a linear concentration profileat current interruption cannot be guaranteed anymore as discussed inthe following.
Figure 9 depicts the corresponding OCV decays after the poten-tiostatic polarization phases shown in Figure 8. For the experimentswith 0.5 M and 2 M LiClO4 (red and light blue curves) which exhib-ited a steady-state current (s. Figure 8), a potential relaxation phasewhere U (t) is linear vs.
√t can be clearly discerned (between 25
and 225 s/400 s, i.e., between ca. 5/√
s and 15/√
s / 20/√
s) and isindicated by the dashed black lines in Figure 9. While the U (t) vs.√
t behavior depicted in Figure 9 resembles its theoretically predictedresponse for
√t-values exceeding ≈ 3 s−0.5 (compare Figure 9 with
Figure 6), the experimental data deviate dramatically at√
t-valuesbelow ≈ 3 /
√s, where the potential does not follow the predicted
proportionality between U(T1) and√
t . This behavior is commonlyobserved32 and introduces two uncertainties in the evaluation of thediffusion coefficient based on Eq. 17: i) an ambiguity in defining thetime frame over which the linear fit should be applied, which wouldbe very straightforward if the response were to follow its theoreticallypredicted behavior (s. Figure 6); ii) the determination of the required
Figure 9. Short-term potential relaxation after the potentiostatic polarizationexperiments (SSPP) shown in Fig. 8. (0.01 M, 0.5 M, 1.5 M and 2.0 M LiClO4in EC:DEC (1:1 w:w)). The black dashed lines are a linear fit according to Eq.16 in order to determine D±|steady−state
short−term .
Figure 10. Concentration dependent binary diffusion coefficient D± ofLiClO4 in EC:DEC (1:1 w:w) measured in the two-electrode Li-Li cellshown in Figure 1. The error bars represent the standard deviations fromat least two different cells; the relationships to determine D± are summarizedin Table III.
initial potential just after current interruption (U(T1) in Eq. 17) is byno means straightforward and the value of U(T1) must be estimatedby back-extrapolation of the linear segment to
√t= 0, which would
be the expected voltage response in the absences of parasitic currents(s. Figure 6). This deviation of the experimental short-time responsefrom the theoretical short-term response (i.e., below
√t-values of ≈
3 /√
s) is likely due to parasitic currents caused by the reformation ofthe SEI, particularly on the lithium electrode on which lithium platingoccurred during potentiostatic polarization. Similar transients havebeen recorded by Odziemkowski when metallic lithium was cut whileemerged in an electrolyte solution.34 In summary, determination ofthe binary diffusion coefficient D± from short-term relaxation exper-iments is clearly more difficult and error prone than from long-termrelaxation experiments.
In the case where no steady-state current is obtained during po-tentiostatic polarization (s. data for 1.5 M LiClO4; green line inFigure 8), the conditions for an analysis of the short-term relaxationbehavior are actually not fulfilled (i.e., it cannot be assumed that asteady-state linear concentration profile has been obtained). Never-theless, the observed potential relaxation still displays a fairly linearsegment (s. green line in Figure 9), so that one might be tempted toapply Eq. 17 to extract a binary diffusion coefficient. This would beclearly invalid, so that binary diffusion coefficients should only be de-termined from short-term relaxation experiments after having assuredthat a steady-state current was indeed obtained during polarization.In consequence, as the latter requirement is not met for the 1.5 MLiClO4 experiment, our below summary of the concentration depen-dent binary diffusion coefficients of LiClO4 in EC:DEC (1:1 w:w)obtained by the three different analysis methods used in this study (s.Table III) does not include any values for the short-term relaxationexperiment for the 1.5 M LiClO4 electrolyte. The same argumentationholds for the 0.01 M concentration due to ambiguous linear regionsduring polarization in Figure 8 (s. blue line) and relaxation (s. blueline in Figure 9).
Binary diffusion coefficients determined for a LiClO4 in EC:DEC(1:1 w:w) electrolyte at five concentrations using the methodssummarized in Table III and plotted in Figure 10 show a good
) unless CC License in place (see abstract). ecsdl.org/site/terms_use address. Redistribution subject to ECS terms of use (see 129.187.254.46Downloaded on 2018-06-18 to IP
Journal of The Electrochemical Society, 164 (4) A826-A836 (2017) A835
correlation between the three methods. The shown values are themean values obtained from all pulses for all cells at a given con-centration, and the error bars indicate their corresponding standarddeviation. As already discussed in the Numerical validation section,the most reliable approach for determining the binary diffusion co-efficient are the long-term relaxation methods (s. Eq. 14). Amongstthese, the pulse polarization experiments (D±|pulse
long−term) have some
advantage over steady-state polarization experiments (D±|steady−statelong−term ):
the much shorter polarization time for pulse experiments allows forhigher polarization currents which result in larger potentials duringrelaxation, thus leading to a better signal to noise ratio and allow-ing for a longer time range over which Eq. 14 can be fitted. For themethodology based on the short-term relaxation after a steady-statepolarization (D±|steady−state
short−term ), the generally observed parasitic currentsfrom SEI formation and the formation of high surface area lithium canlead to a non-constant concentration profile and render the methodless reliable, in addition to the risk of analyzing data from con-ditions where the imposed concentration gradients were too large(s. Table IV).
Figure 10 also includes an exponential fit for the concentration de-pendence of the binary diffusion coefficient based on the D±|pulse
long−termvalues, yielding
D± (c) = 2.36 · 10−6 exp (−0.375 c)
[cm2
s
][18]
where the LiClO4 salt concentration c is given in units of mol/l. A de-crease in the binary diffusion coefficient D±(c) as observed in Figure10 is expected theoretically. Upon increasing the salt concentration,ion-ion interactions become more prominent, leading to an increaseof the viscosity of the electrolyte and thereby reducing the ionic mo-bilities. In addition, the binary diffusion coefficient D± determinedby the described experimental method also includes additional fac-tors such as the ratio between the total salt concentration and thesolvent concentration, the thermodynamic factor, and potential vol-umetric effects as discussed, e.g., by Nyman et al.19 or Georen andLindbergh.24 However, it is not necessary to separate these differenteffects from each other in order to use the determined binary diffu-sion coefficient in numerical simulations with a consistent physicalmodel.
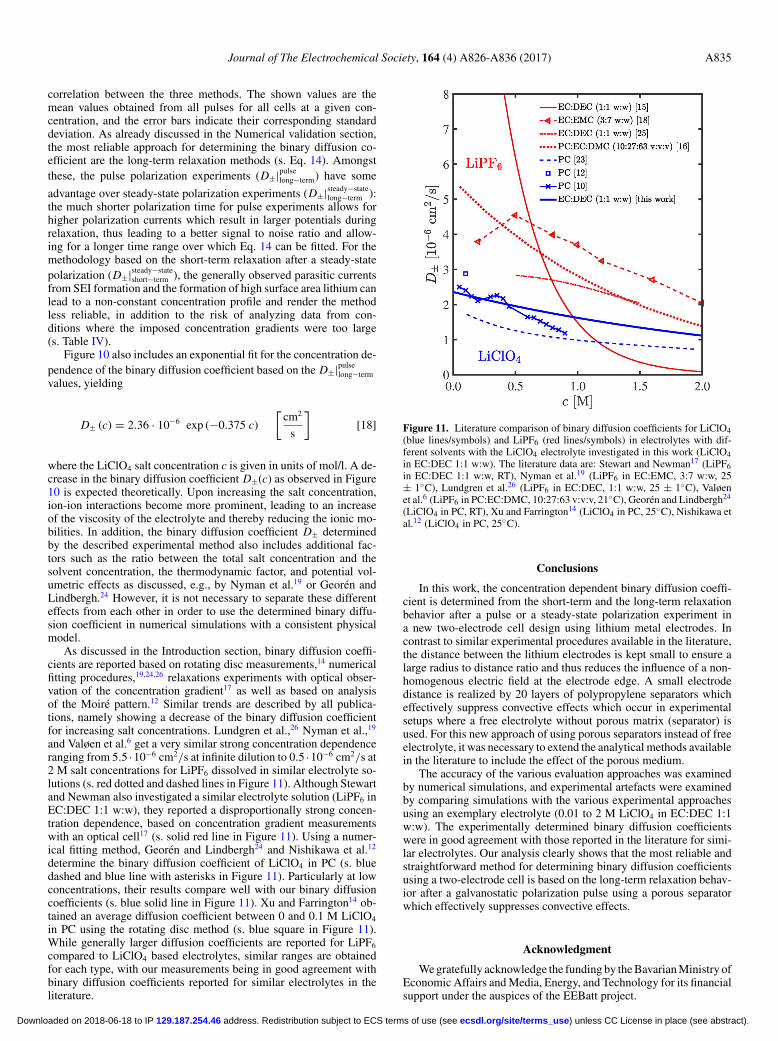
As discussed in the Introduction section, binary diffusion coeffi-cients are reported based on rotating disc measurements,14 numericalfitting procedures,19,24,26 relaxations experiments with optical obser-vation of the concentration gradient17 as well as based on analysisof the Moire pattern.12 Similar trends are described by all publica-tions, namely showing a decrease of the binary diffusion coefficientfor increasing salt concentrations. Lundgren et al.,26 Nyman et al.,19
and Valøen et al.6 get a very similar strong concentration dependenceranging from 5.5 ·10−6 cm2/s at infinite dilution to 0.5 ·10−6 cm2/s at2 M salt concentrations for LiPF6 dissolved in similar electrolyte so-lutions (s. red dotted and dashed lines in Figure 11). Although Stewartand Newman also investigated a similar electrolyte solution (LiPF6 inEC:DEC 1:1 w:w), they reported a disproportionally strong concen-tration dependence, based on concentration gradient measurementswith an optical cell17 (s. solid red line in Figure 11). Using a numer-ical fitting method, Georen and Lindbergh24 and Nishikawa et al.12
determine the binary diffusion coefficient of LiClO4 in PC (s. bluedashed and blue line with asterisks in Figure 11). Particularly at lowconcentrations, their results compare well with our binary diffusioncoefficients (s. blue solid line in Figure 11). Xu and Farrington14 ob-tained an average diffusion coefficient between 0 and 0.1 M LiClO4
in PC using the rotating disc method (s. blue square in Figure 11).While generally larger diffusion coefficients are reported for LiPF6
compared to LiClO4 based electrolytes, similar ranges are obtainedfor each type, with our measurements being in good agreement withbinary diffusion coefficients reported for similar electrolytes in theliterature.
Figure 11. Literature comparison of binary diffusion coefficients for LiClO4(blue lines/symbols) and LiPF6 (red lines/symbols) in electrolytes with dif-ferent solvents with the LiClO4 electrolyte investigated in this work (LiClO4in EC:DEC 1:1 w:w). The literature data are: Stewart and Newman17 (LiPF6in EC:DEC 1:1 w:w, RT), Nyman et al.19 (LiPF6 in EC:EMC, 3:7 w:w, 25± 1◦C), Lundgren et al.26 (LiPF6 in EC:DEC, 1:1 w:w, 25 ± 1◦C), Valøenet al.6 (LiPF6 in PC:EC:DMC, 10:27:63 v:v:v, 21◦C), Georen and Lindbergh24
(LiClO4 in PC, RT), Xu and Farrington14 (LiClO4 in PC, 25◦C), Nishikawa etal.12 (LiClO4 in PC, 25◦C).
Conclusions
In this work, the concentration dependent binary diffusion coeffi-cient is determined from the short-term and the long-term relaxationbehavior after a pulse or a steady-state polarization experiment ina new two-electrode cell design using lithium metal electrodes. Incontrast to similar experimental procedures available in the literature,the distance between the lithium electrodes is kept small to ensure alarge radius to distance ratio and thus reduces the influence of a non-homogenous electric field at the electrode edge. A small electrodedistance is realized by 20 layers of polypropylene separators whicheffectively suppress convective effects which occur in experimentalsetups where a free electrolyte without porous matrix (separator) isused. For this new approach of using porous separators instead of freeelectrolyte, it was necessary to extend the analytical methods availablein the literature to include the effect of the porous medium.
The accuracy of the various evaluation approaches was examinedby numerical simulations, and experimental artefacts were examinedby comparing simulations with the various experimental approachesusing an exemplary electrolyte (0.01 to 2 M LiClO4 in EC:DEC 1:1w:w). The experimentally determined binary diffusion coefficientswere in good agreement with those reported in the literature for simi-lar electrolytes. Our analysis clearly shows that the most reliable andstraightforward method for determining binary diffusion coefficientsusing a two-electrode cell is based on the long-term relaxation behav-ior after a galvanostatic polarization pulse using a porous separatorwhich effectively suppresses convective effects.
Acknowledgment
We gratefully acknowledge the funding by the Bavarian Ministry ofEconomic Affairs and Media, Energy, and Technology for its financialsupport under the auspices of the EEBatt project.
) unless CC License in place (see abstract). ecsdl.org/site/terms_use address. Redistribution subject to ECS terms of use (see 129.187.254.46Downloaded on 2018-06-18 to IP

A836 Journal of The Electrochemical Society, 164 (4) A826-A836 (2017)
Symbol Name Unit
κ conductivity mS/cm
D± binary diffusion coefficient cm2/s
t+ transference number of lithium ion -
f± mean molar activity coefficient -
volumetric intrinsic phase average of theconcentrationc mmol/cm3
l distance between electrodes μm
ε porosity -
t time s
τ tortuosity -
zi ionic charge (neg./pos. for anions/cations) -
νi stoichiometry factor -
spatial vector of the volumetric phase average ofthe current densityi A/cm2
i volumetric phase average of the current density A/cm2
D±,eff effective binary diffusion coefficient cm2/s
volumetric intrinsic phase average of the electricpotential wrt. to a lithium electrodeφ V
U cell potential V
D∗±,eff partial effective binary diffusion coefficient cm2/s
mi slopes of linear trends various
A electrode area cm2
Ii current mA
Ri resistance �
τ∗ artificial time -
List of Symbols
References
1. J. Newman and K. Thomas-Alyea, Electrochemical Systems, 3rd ed., Wiley Inter-science, Hoboken, (2004).
2. J. Landesfeind, J. Hattendorff, A. Ehrl, W. A. Wall, and H. A. Gasteiger, J. Elec-trochem. Soc., 163, A1373 (2016).
3. A. Ehrl, J. Landesfeind, H. A. Gasteiger, and W. A. Wall, in prep. (2016).4. J. Landesfeind, A. Ehrl, M. Graf, W. A. Wall, and H. A. Gasteiger, J. Electrochem.
Soc., 163, A1254 (2016).5. A. Nyman, M. Behm, and G. Lindbergh, Electrochim. Acta, 53, 6356
(2008).6. L. O. Valøen and J. N. Reimers, J. Electrochem. Soc., 152, A882 (2005).7. F. Castiglione, E. Ragg, A. Mele, G. B. Appetecchi, M. Montanino, and S. Passerini,
J. Phys. Chem. Lett., 2, 153 (2011).8. A. K. Sethurajan, S. Krachkovskiy, I. C. Halalay, G. R. Goward, and B. Protas, J.
Phys. Chem. B, 119, 12238 (2015).9. C. Capiglia, Y. Saito, and H. Kageyama, J. Power Sources, 81, 859 (1999).
10. A. D. McNaught and A. Wilkinson, IUPAC. Compendium of Chemical Terminology,Blackwell Scientific Publications, Oxford, (1997).
11. W. S. Price, Concepts Magn. Reson., 9, 299 (1997).12. K. Nishikawa, Y. Fukunaka, T. Sakka, Y. H. Ogata, and J. R. Selman, J. Electrochem.
Soc., 153, A830 (2006).13. T. Nishida, K. Nishikawa, and Y. Fukunaka, ECS Trans., 6, 1 (2008).14. J. Xu and G. C. Farrington, J. Electrochem. Soc., 143, L44 (1996).15. H. S. Harned and D. M. French, Ann. N. Y. Acad. Sci., 46, 267 (1945).16. J. Newman and T. W. Chapman, AIChE J., 19, 343 (1973).17. S. G. Stewart and J. Newman, J. Electrochem. Soc., 155, F13 (2008).18. M. M. Hiller, M. Joost, H. J. Gores, S. Passerini, and H.-D. Wiemhofer, Electrochim.
Acta, 114, 21 (2013).19. A. Nyman, M. Behm, and G. Lindbergh, Electrochim. Acta, 53, 6356 (2008).20. I. V. Thorat, D. E. Stephenson, N. a. Zacharias, K. Zaghib, J. N. Harb, and
D. R. Wheeler, J. Power Sources, 188, 592 (2009).21. M. M. Doeff, L. Edman, S. E. Sloop, J. Kerr, and L. C. De Jonghe, J. Power Sources,
89, 227 (2000).22. A. Ferry, M. Doeff, and L. DeJonghe, Electrochim. Acta, 43, 1387 (1998).23. Y. Ma, M. Doyle, T. F. Fuller, M. M. Doeff, L. C. Jonghe, and J. Newman, J. Elec-
trochem. Soc., 142, 1859 (1995).24. P. Georen and G. Lindbergh, Electrochim. Acta, 47, 577 (2001).25. C. M. Doyle, PhD Thesis, Berkeley (1996).26. H. Lundgren, M. Behm, and G. Lindbergh, J. Electrochem. Soc., 162, 3 (2014).27. J. Liu and C. W. Monroe, Electrochim. Acta, 167, 357 (2015).28. J. Bear and Y. Bachmat, Introduction to Modeling of Transport Phenomena in Porous
Media, Springer Netherlands, Dordrecht, (1990).29. M. Landstorfer and T. Jacob, Chem. Soc. Rev., 42, 3234 (2013).30. A. Ehrl, PhD Thesis, Munchen (2016).31. P. Bruce and C. Vincent, J. Electroanal. Chem., 225, 1 (1987).32. S. Zugmann, M. Fleischmann, M. Amereller, R. M. Gschwind, H. D. Wiemhofer,
and H. J. Gores, Electrochim. Acta, 56, 3926 (2011).33. D. Aurbach, E. Zinigrad, Y. Cohen, and H. Teller, Solid State Ionics, 148, 405
(2002).34. M. Odziemkowski and D. E. Irish, J. Electrochem. Soc., 140, 1546 (1993).
) unless CC License in place (see abstract). ecsdl.org/site/terms_use address. Redistribution subject to ECS terms of use (see 129.187.254.46Downloaded on 2018-06-18 to IP