Determination of trace uranyl ions in aquatic medium by a useful and simple method
8
Determination of trace uranyl ions in aquatic medium by a useful and simple method Halil I ˙ brahim Ulusoy Received: 14 March 2014 Ó Akade ´miai Kiado ´, Budapest, Hungary 2014 Abstract Determination of trace uranyl ions was per- formed by using mixed micellar system and spectropho- tometric determination. The method is based on cloud point extraction of uranyl ions after formation of an ion- association complex in the presence of Celestine Blue and sodium dodecyl sulfate. Then, the formed complex was extracted to non-ionic surfactant phase of Triton X-114 at pH 8.0. The optimal extraction and reaction conditions (e.g. concentrations and types of surfactants, concentration of complex forming agent, incubation conditions) were studied and analytical characteristics of the method (e.g. limit of detection, linear range, pre-concentration factor) were obtained by experimental studies. Linearity was obeyed in the range of 50–1,500 ng mL -1 for uranium(VI) ion and the detection limit of is 14.20 ng mL -1 . The interference effects of common ions were also tested and validation studies were performed by using recovery test. The method was applied to the determination of ura- nium(VI) in several real samples. Keywords Uranyl ions Cloud point extraction Celestine blue Spectrophotometry Introduction Uranium is the longest-lived radio nuclides and its pure form is chemically active. It is one of well-known radio- active element and the news about uranium related with radioactive leaking, poising, and carcinogenic effect draw attention in every country. There is always a potential risk, although precautions have taken in nuclear reactors and uranium enrichment plants. Uranium is one of the rarer elements, but it is actually present in the earth’s crust in greater amounts than such ‘‘common’’ elements as cad- mium, bismuth, mercury, and iodine. Most of studies about uranium are focus on its radioactive and toxicological properties. It possesses health risks to humans, particularly relatively high concentrations. The most stable form of uranium in water is hexavalent uranyl ion (UO 2þ 2 ) which can be bonded with chelating agents such as citrate, bicarbonate anions and plasma proteins in blood. It can be held on organs such as lung, bone, kidneys and liver and caused several health problems such as renal damage and cancer. The tolerable daily intake of uranium is established as 0.6 lg kg -1 of body weight per day [1, 2]. Therefore, determination of uranium at trace levels and removal of uranium from aqueous solutions are always an important research area in view of environmental and health risks. On the other hand, uranium alloys are useful in diluting enri- ched uranium liquid fuel meant for nuclear reactors and pure uranium coated with silicon and canned in aluminum tubes are used in production reactors [3, 4]. Large quantities of radioactive wastes in solid or liquid forms are produced in mining and milling operations. Many countries have been concern about these problems such as groundwater contamination, proximity of communication to populated areas, and emission of radioactive isotopes [5]. Most natural waters (especially sea water) contain detectable amounts of uranium. The average concentration in the ocean is about 3 lgL -1 [6]. The uranium concen- tration of ground and surface waters varies greatly, from a low of less than 0.1 ng L -1 to several mg per liter. In the great majority of surface and ground waters the H. I ˙ . Ulusoy (&) Department of Analytical Chemistry, Faculty of Pharmacy, Cumhuriyet University, 58140 Sivas, Turkey e-mail: [email protected] 123 J Radioanal Nucl Chem DOI 10.1007/s10967-014-3229-4
-
Upload
halil-ibrahim -
Category
Documents
-
view
213 -
download
0
Transcript of Determination of trace uranyl ions in aquatic medium by a useful and simple method

Determination of trace uranyl ions in aquatic mediumby a useful and simple method
Halil Ibrahim Ulusoy
Received: 14 March 2014
� Akademiai Kiado, Budapest, Hungary 2014
Abstract Determination of trace uranyl ions was per-
formed by using mixed micellar system and spectropho-
tometric determination. The method is based on cloud
point extraction of uranyl ions after formation of an ion-
association complex in the presence of Celestine Blue and
sodium dodecyl sulfate. Then, the formed complex was
extracted to non-ionic surfactant phase of Triton X-114 at
pH 8.0. The optimal extraction and reaction conditions
(e.g. concentrations and types of surfactants, concentration
of complex forming agent, incubation conditions) were
studied and analytical characteristics of the method (e.g.
limit of detection, linear range, pre-concentration factor)
were obtained by experimental studies. Linearity was
obeyed in the range of 50–1,500 ng mL-1 for uranium(VI)
ion and the detection limit of is 14.20 ng mL-1. The
interference effects of common ions were also tested and
validation studies were performed by using recovery test.
The method was applied to the determination of ura-
nium(VI) in several real samples.
Keywords Uranyl ions � Cloud point extraction �Celestine blue � Spectrophotometry
Introduction
Uranium is the longest-lived radio nuclides and its pure
form is chemically active. It is one of well-known radio-
active element and the news about uranium related with
radioactive leaking, poising, and carcinogenic effect draw
attention in every country. There is always a potential risk,
although precautions have taken in nuclear reactors and
uranium enrichment plants. Uranium is one of the rarer
elements, but it is actually present in the earth’s crust in
greater amounts than such ‘‘common’’ elements as cad-
mium, bismuth, mercury, and iodine. Most of studies about
uranium are focus on its radioactive and toxicological
properties. It possesses health risks to humans, particularly
relatively high concentrations. The most stable form of
uranium in water is hexavalent uranyl ion (UO2þ2 ) which
can be bonded with chelating agents such as citrate,
bicarbonate anions and plasma proteins in blood. It can be
held on organs such as lung, bone, kidneys and liver and
caused several health problems such as renal damage and
cancer. The tolerable daily intake of uranium is established
as 0.6 lg kg-1 of body weight per day [1, 2]. Therefore,
determination of uranium at trace levels and removal of
uranium from aqueous solutions are always an important
research area in view of environmental and health risks. On
the other hand, uranium alloys are useful in diluting enri-
ched uranium liquid fuel meant for nuclear reactors and
pure uranium coated with silicon and canned in aluminum
tubes are used in production reactors [3, 4].
Large quantities of radioactive wastes in solid or liquid
forms are produced in mining and milling operations. Many
countries have been concern about these problems such as
groundwater contamination, proximity of communication to
populated areas, and emission of radioactive isotopes [5].
Most natural waters (especially sea water) contain
detectable amounts of uranium. The average concentration
in the ocean is about 3 lg L-1 [6]. The uranium concen-
tration of ground and surface waters varies greatly, from a
low of less than 0.1 ng L-1 to several mg per liter. In the
great majority of surface and ground waters the
H. I. Ulusoy (&)
Department of Analytical Chemistry, Faculty of Pharmacy,
Cumhuriyet University, 58140 Sivas, Turkey
e-mail: [email protected]
123
J Radioanal Nucl Chem
DOI 10.1007/s10967-014-3229-4

concentration is less than 10 lg L-1. The contamination of
groundwater by uranium increases its contagion rate to
other sources and people.
The determination of uranium in aqueous systems is often
required for environmental control and geochemical pros-
pecting [7–11]. However, conventional spectrometric ana-
lytical techniques such as flame atomic absorption
spectrometry (FAAS), graphite furnace atomic absorption
spectrometry (GFAAS) and inductively coupled plasma
optical emission spectrometry (ICP OES) cannot be used for
determination of trace amounts of uranium. Determination
using FAAS requires nitrous oxide acetylene flame and the
desired sensitivity cannot be obtained by conventional
approaches (about 50 mg L-1) [12]. Application of GFAAS
is also limited for determination of low concentrations of
uranium owing to problems related with the pyrolysis tem-
perature, which must not be higher than 1,000 �C, and ura-
nium forms carbides in a graphite furnace [13]. The
sensitivity of ICP OES has an inadequate detection limit like
over 100 mg L-1 [14]. Considering this, inductively cou-
pled plasma mass spectrometry (ICP-MS) can be evaluated
as a good alternative for the determination of uranium at low
concentrations. However, this technique is very expensive
for a lot of research laboratory. Molecular absorption
(UV–VIS) spectrometry is still a good and accessible option
for most laboratories. Very sensitive determinations can be
directly performed or following a simple pre-concentration
procedure. Most researcher have been developed various
analytical methods for trace uranyl ions by considering this
approaches [15–19].
The extraction method using surfactants, termed ‘‘cloud
point (CP) extraction or micelle mediated extraction’’
provides an alternative to the conventional extraction sys-
tems due to its easy steps and lack of requirement for
organic solvents. The concentration at which surfactants
begin to form micelle is known as the critical micelle
concentration (CMC). The CMC of a surfactant depends on
several factors, such as its molecular structure, and
experimental conditions such as ionic strength, counter
ions, temperature, etc. Upon appropriate alteration of the
conditions such as temperature or pressure, addition of salt
or other additives, the solution becomes turbid at a tem-
perature known as CP due to the diminished solubility of
the surfactant in water [20–24]. The determination of
uranyl ions in different samples by means of surfactant
mediums were presented in literature [25–31]. The use of
surfactant molecules not only increases sensitivity of
determination method and also eliminates most of inter-
ference effects with selectivity reactions.
This paper proposes a method for pre-concentration and
determination of uranium by spectrophotometry based on
cloud point extraction (CPE) of the complex of ura-
nium(VI) with Celestine Blue (CB) in mixed surfactant
media. Method variables were optimized in detail. The
validation of developed methods was performed by
recovery tests in spiked samples. Finally, method was
applied to real samples in order to determine uranyl levels.
Experimental
Instrumentation
Spectrophotometric measurements were performed on a
UV–VIS spectrophotometer (Shimadzu, UV–Visible 1800,
Japan) equipped with a 1 cm quartz cell. This spectropho-
tometer has a wavelength accuracy of ±0.2 nm and a
bandwidth of 2 nm in the wavelength range of
190–1,100 nm. A pH meter with a glass–calomel electrode
(Selecta, Spain) was used to measure the pH values. A
thermostatic water bath (Microtest, Turkey) was used to keep
constant the temperature. A centrifuge (Hettich, Universal
120, England) was used for complete phase separation. A
microwave digestion system (CEM Mars X6, USA) was used
to dissolve and prepare the samples to analysis.
Reagents
All reagents used were of analytical grade. Ultra-pure
water with a resistivity of 18.2 MX cm was used in all
experiments provided by ELGA (Flex III, UK) water
purification system. All containers (glassware, PTFE bot-
tles) were treated with diluted HNO3 solution and finally
rinsed with deionized water prior to experiments. Stock
solution of UO22? (1,000 lg mL-1) were prepared by
dissolving appropriate amounts of nitrate salt (Merck) in
water. 3.0 9 10-3 mol L-1 of CB (Sigma, St. Louis, MO,
USA) solution was prepared by dissolving 50 mg reagent
in methanol (Merck, Darmstadt, Germany) and diluting
with water. The buffer solution of pH 8.0 ± 0.1 was pre-
pared with sodium citrate and sodium mono hydrogen
phosphate. The solutions of all surfactant [TritonX-114,
Triton X-100, sodium dodecyl sulfate (SDS), cetyl pyrid-
inium chloride (CPC) and cetyl tri methyl ammonium
bromide (CTAB)] (Sigma, St. Louis, MO, USA) were used
without further purification. Solutions of 5 % (w/v) non-
ionic surfactants (Triton X-114 and PONPE 7.5) were
prepared by dissolving 5.0 g of surfactant in 100 mL of
deionized water.
The CPE procedure
In a typical CPE procedure, 10 mL of sample containing
uranium in the range of 50–1.500 ng mL-1, 2.0 mL of pH
8.0 buffer, 0.5 mL of 3 9 10-3 mol L-1 CB, 0.5 mL of
3 9 10-3 mol L-1 SDS and 0.5 mL of 5 % (w/v) Triton
J Radioanal Nucl Chem
123
X-114 were added to a Falcon tube and dilute to the mark
(50 mL) with ultra-pure water. This solution is allowed to
stand for about 5 min before it placed into a thermostatic
controlled water bath at 45 �C for 15 min. Separation of
the two phases was achieved by centrifugation for 5 min at
3,500 rpm. On cooling in an ice-bath for 15 min, the sur-
factant-rich phase (SRP) became viscous. Then the aque-
ous phase was separated by inverting the tubes. 1 mL of
methanol was later added before measurements in order to
reduce viscosity of SRP and facilitate determination. The
final volume of sample was about 1.2 mL. The analytical
signal (absorbance) of this solution was monitored at
630 nm in a micro quartz cell against pure methanol.
Analysis of water and rock samples
The proposed method was applied to different real samples.
Three different water samples (river, tap and drinking
water) and a rock sample including radioactive elements
were selected for application of new developed method.
River water was collected from Kızılırmak River (Sivas,
Turkey) in cleaned PTFE container and kept in dark until
analysis. Tap water was taken allowing to run for 20 min
and approximately 2.0 L of tap water was collected directly
from laboratory at Cumhuriyet University. Drinking waters
with different origin were bought from a local market. The
ground rock sample including radioactive elements was
obtained from a research group in our university.
Then, the proposed methods were applied to all samples
after a microwave digestion process. The microwave
parameters were given in Table 1. The samples were
neutralized by a few drop of ammonia until its acidity
eliminated and filtrated by 0.45 lm filter paper. Then the
proposed method was applied to samples.
Results and discussion
Figure 1 shows the absorption spectra of U(VI)–CB–SDS
ion-pair complex in SRP against methanol for five different
uranyl levels. As can be seen in Fig. 1, the absorbance of
complex gradually increases by increasing uranyl
concentration at 519 and 630 nm. The formed complex can
be monitored by both wavelengths. 630 nm was used
throughout experiments due to its higher sensitivity. In
addition, the spectrum of blank solution shows that
absorbance of CB without uranyl ions is very low.
After all parameters (pH, concentration of surfactants,
ionic strength, incubation conditions, etc.) were optimized
as explained in following sections, concentration of uranyl
ions in samples can be measured by using calibration
equation given in Fig. 2. As can be seen in Fig. 2, DA
values meaning difference between absorbance of blank
and sample are proportional with uranyl concentration.
Table 1 Microwave parameters for real samples
Amount of
sample
0.5 g of rock sample 20 mL of water
sample
Digestion reagent ?10 mL of 50 %
HNO3
?10 mL of 1 M
HNO3
Time programme 0–5 min 50 �C
5–10 min 100 �C
10–20 min 150 �C
Wavelenght, nm400 450 500 550 600 650 700
Abs
orba
nce
0,000
0,500
1,000
1,500
2,000
2,500
3,000630 nm
519 nm
ab
c
d
e
f
Uranyl Concentrations;a: 0 ng mL-1
b: 100 ng mL-1
c: 300 ng mL-1
d: 500 ng mL-1
e: 900 ng mL-1
f: 1000 ng mL-1
Fig. 1 Absorption spectra of ion-associated complex for five differ-
ent U(VI) concentrations. Absorption spectra of a 3.0 9
10-5 mol L-1 of Celestine Blue with increasing U(VI) concentration
at levels of 100, 300, 500, 900 and 1.000 lg L-1 at pH 8.0 against
methanol after pre-concentration with CPE under the optimized
reaction conditions
Concentration of uranyl, ng mL-10 200 400 600 800 1000 1200 1400 1600
Δ A
0,0
0,2
0,4
0,6
0,8
1,0
1,2
1,4
Abs = 6,7x10⁻⁴ [U(VI)] + 0,1918r² = 0,9942
Fig. 2 Calibration curve obtained in optimized conditions
J Radioanal Nucl Chem
123

Effect of pH
The pH effect on CPE depends on the characteristics of
both surfactants and analytes. If target species (uranyl ions)
have different acidic equilibriums changing by pH, even a
little change in pH can cause important effects on CPE
efficiency. For organic molecules, especially including
ionizable species, maximum extraction efficiency is
achieved at pH values where the uncharged form of the
analyte prevails, and therefore, target analyte is favored to
be partitioned into the micellar phase. The ionic form of a
neutral molecule formed upon deprotonating of a weak
acid or protonation of a weak base normally does not
interact with and bind the micellar aggregate as strongly as
its neutral form does. However, changing the pH will
change the ionization form of certain analytes and will
thereby affect their water solubility and extractability [32].
As a cationic dye CB is an organic ampholyte which a
proton can attract its pyridine nitrogen atom in acidic
medium while o-hydroxy group can dissociate in basic
medium with acidity constants of pKa1: 0.50 and pKa2:
8.00. It is generally used as a redox reagent in determina-
tion of organic and inorganic species by means of catalytic/
kinetic reactions [33, 34]. In another study, we used a
polymeric material including CB in order to remove uranyl
ions from aquatic mediums [35].
The different buffer systems such as NH3/NH4Cl,
H2PO4-/HPO4
2-, citrate and universal Britton–Robinson
(BR) were used independently in order to determine the
best extraction conditions. The best analytical signal was
obtained by HPO2�4 /citrate buffer system. The selected
buffer system (citrate/HPO2�4 ) only doesn’t keep to con-
stant the pH, also citrate ions in buffer eliminate possible
interfering ions owing to its chelating property.
The optimization of pH was performed by a buffer series
in the range of 4.0–11.0. As can be seen in Fig. 3, the max-
imum signal was obtained at pH 8.0. After pH 8.0, signal is
decreasing because of second dissociation constant of
ligand. So, pH 8.0 was selected as an optimal value.
The effect of buffer concentration on the analytical
signal was also studied in the range of 0–5 mL (in final
volume of 50.0 mL) and the best analytical signal was
obtained by 2.0 mL.
Effect of complexing agent concentration
In this study, CB was selected as a chromogenic and cationic
agent with an oxidizing character and positive charge. The
positive charge of CB is facilitated formation of ion-asso-
ciated complex with charged species. And, its chromogenic
properties are helped to follow the complex formation by
spectrophotometrically. When Fig. 1 was re-examined, it
can be understood better formation of complex. The first
curve in the Figure is spectrum of CB before complex for-
mation. The signals at both wavelength is increased with
uranyl concentration. The increase in absorbance is related
with the increase in uranyl concentration. And, this rela-
tionship is linear in the range of 50–1.500 ng mL-1 for
uranyl ions. After system was optimized for every param-
eter, uranyl concentration can be calculated by monitoring
increase in absorbance and using linear regression
equation.
The effect of CB concentration on analytical response was
shown in Fig. 4. As it can be seen, absorbance of U(VI)–CB–
SDS complex increases in the range of 0.5–73.0 9
10-5 mol L-1, where the reaction is quantitatively com-
pleted. So, a concentration of 3.0 9 10-5 mol L-1 of CB was
chosen as the optimal value.
pH3,00 4,00 5,00 6,00 7,00 8,00 9,00 10,00 11,00
Abs
orba
nce
0,600
0,800
1,000
1,200
1,400
1,600
1,800
2,000
2,200
2,400
Fig. 3 Effect of pH on analytical signal. Conditions: 2 mL of pH
buffer, 250 lg L-1 of U(VI), 0.5 mL of 3.0 9 10-3 M CB, 0.4 mL
of % 5 (w/v) Triton X-114
Concentration of Celestine Blue, mol L-1
0 10-5 2,0x10⁻⁵ 3,0x10⁻⁵ 4,0x10⁻⁵ 5,0x10⁻⁵ 6,0x10⁻⁵
Abs
orba
nce
0,400
0,600
0,800
1,000
1,200
1,400
1,600
1,800
2,000
Fig. 4 Effect of CB concentration on analytical signal. Conditions:
2 mL of pH 8.0 buffer, 250 lg L-1 of U(VI), 0.4 mL of % 5 (w/v)
Triton X-114
J Radioanal Nucl Chem
123
Effect of surfactant concentration
The concentration of surfactant could affect the perfor-
mance of CPE process significantly. A successful CPE
should be able to maximize the extraction efficiency
through increasing phase volume ratio (Vsurfactant-rich phase/
Vaqueous phase), so as to improve the pre-concentration factor
(PF). Depending on the nature of the hydrophilic group,
surfactantsare classified as non-ionic, zwitterionic, cat-
ionic, and anionic. In CPE experiments, non-ionic, zwit-
terionic and anionic surfactants are most widely used for
pre-concentration of inorganic metal ions, drugs, bioma-
terials, and organic compounds. However, ionic surfactants
are needed generally in the presence of charged species
(ligand or analyte) in the solution [36]. It is very important
to select the most appropriate surfactant or mixture of
surfactants for a successful CPE analysis since it can
directly affect success of pre-concentration procedure, and
accuracy of analytical results.
The enrichment factor depends on volume of SRP (Vs)
which varies with the surfactant concentration. Researches
show that the smaller the surfactant concentration, the
higher the PF. In addition, when the Vs too small, the
extraction process becomes difficult, and accuracy and
reproducibility will probably suffer [37]. Therefore a bal-
ance between the surfactant concentration required for a
maximum PF and an adequate volume Vs for subsequent
volume manipulation is critical. The efficiency of extrac-
tion/pre-concentration relies on the magnitude of analyte
solubilization into the micelle (non-polar core and polar
micelle–water interface), analyte polarity and solution
composition [38]. Therefore, any experimental approach
should focus on these parameters to ensure maximum
extraction efficiency.
The Triton X-114 and PONPE 7.5 were chosen as
nonionic surfactants because of their commercial avail-
ability in a high-purified homogenous form, low toxico-
logical properties and cost. The variation of absorbance the
formed complex was shown as a function of concentrations
of two nonionic surfactants in Fig. 5. According to this
investigation, Triton X-114 was more suitable than PONPE
7.5 and the optimum signal was obtained at a concentration
of 0.05 % (v/v) Triton X-114. At lower concentrations, the
extraction efficiency of complexes is low probably because
of the inadequacy of the assemblies to entrap the hydro-
phobic complex quantitatively. Above these concentra-
tions, the analytical signal gradually decreases because of
decreasing at PF as mentioned above.
The charge of uranyl ions and used ligand CB are positive
in aquatic medium. The formed complex between uranyl ions
and CB can be entrapped into nonionic surfactant phase, but
ionic surfactants should be improved this transfer by
increasing electrostatically interactions. So, the experiments
were repeated by using three different ionic surfactants like
cetyl pyridinium chloride (CPC), cetyl tri methyl ammonium
bromide (CTAB), and SDS. As can be seen in Fig. 6, cationic
surfactants such as CPC, CTAB increase the analytical signal
a little or not. But the signal increased considerable amount in
the presence of SDS. The maximum signal was obtained by
using 3 9 10-5 mol L-1 of SDS. The addition of SDS as a
negative charged surfactant is increased the extraction effi-
ciency by providing electrostatic balance in the solution. The
formed ion-association complex ðUOþ2 CBþ ððSDSÞ2Þ�Þ can
be easily transferred as a uncharged complex.
Effect of the incubation temperature and time
The incubation time and equilibration temperature are two
important parameters in CPE. It is desired the shortest
Concentration of Nonionic Surfactants, (w/v) %0,00 0,02 0,04 0,06 0,08 0,10 0,12
Abs
orba
nce
0,000
0,200
0,400
0,600
0,800
1,000
1,200
1,400
1,600
1,800
2,000
TRITON X-114PONPE 7.5
Fig. 5 Effect of nonionic surfactant concentration on analytical
signal. Conditions: 2 mL of pH 8.0 buffer, 250 lg L-1 of U(VI),
0.5 mL of 3.0 9 10-3 M CB
Concentrations of Ionic Surfactants, x 10-5 mol L-1
0,00 2,00 4,00 6,00 8,00 10,00
Abs
orba
nce
0,600
0,800
1,000
1,200
1,400
1,600
1,800
2,000
2,200
CPCCTABSDS
Fig. 6 Effect of ionic surfactant concentration on analytical signal.
Conditions: 2 mL of pH 8.0 buffer, 250 lg L-1 of U(VI), 0.5 mL of
3.0 9 10-3 M CB, 0.5 mL of % 5 (w/v) Triton X-114
J Radioanal Nucl Chem
123
equilibration time and the lowest possible equilibration
temperature for efficiently separation of phases. The
dependence of extraction efficiency upon equilibrium
temperature and time was studied in the range of 20–60 �C
and 5–50 min, respectively. The results showed that an
equilibrium temperature of 45 �C is appropriate for CPE
experiments. The formed complex can be decomposed at
high temperatures and it is not formed CP at low temper-
atures. The other important parameter is incubation time
which can affect by complex stability. As a result of
experimental studies, it was understood that 15 min incu-
bation at 45 �C was enough for quantitate extraction.
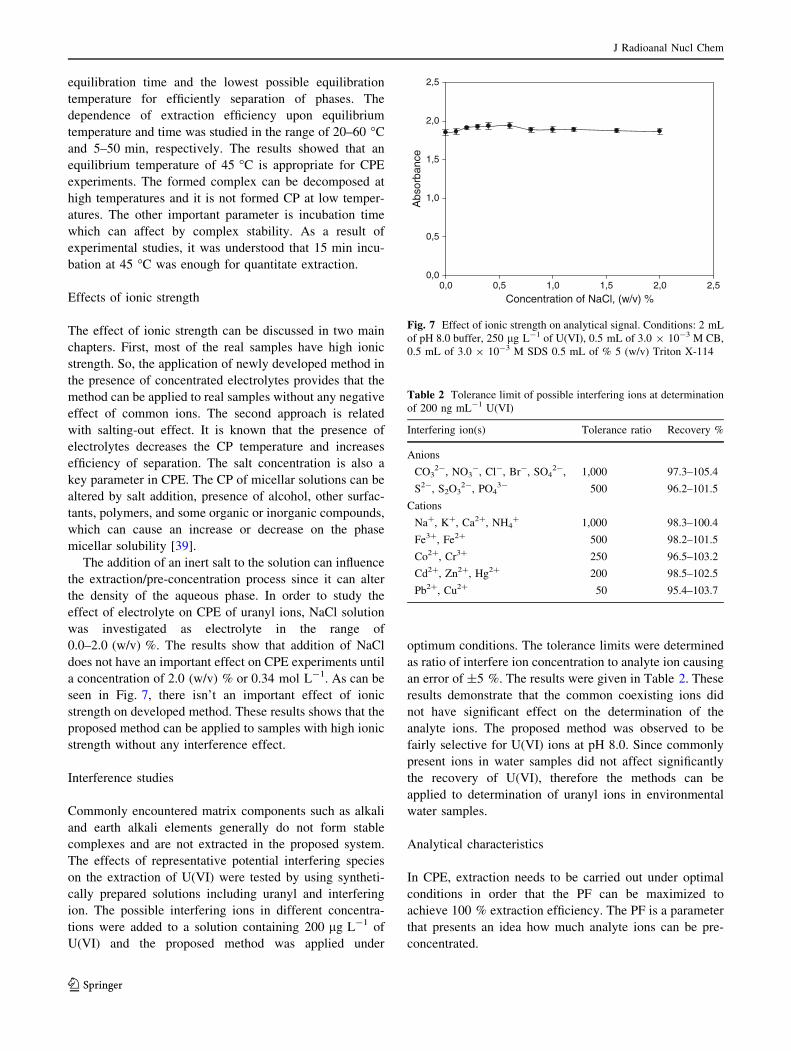
Effects of ionic strength
The effect of ionic strength can be discussed in two main
chapters. First, most of the real samples have high ionic
strength. So, the application of newly developed method in
the presence of concentrated electrolytes provides that the
method can be applied to real samples without any negative
effect of common ions. The second approach is related
with salting-out effect. It is known that the presence of
electrolytes decreases the CP temperature and increases
efficiency of separation. The salt concentration is also a
key parameter in CPE. The CP of micellar solutions can be
altered by salt addition, presence of alcohol, other surfac-
tants, polymers, and some organic or inorganic compounds,
which can cause an increase or decrease on the phase
micellar solubility [39].
The addition of an inert salt to the solution can influence
the extraction/pre-concentration process since it can alter
the density of the aqueous phase. In order to study the
effect of electrolyte on CPE of uranyl ions, NaCl solution
was investigated as electrolyte in the range of
0.0–2.0 (w/v) %. The results show that addition of NaCl
does not have an important effect on CPE experiments until
a concentration of 2.0 (w/v) % or 0.34 mol L-1. As can be
seen in Fig. 7, there isn’t an important effect of ionic
strength on developed method. These results shows that the
proposed method can be applied to samples with high ionic
strength without any interference effect.
Interference studies
Commonly encountered matrix components such as alkali
and earth alkali elements generally do not form stable
complexes and are not extracted in the proposed system.
The effects of representative potential interfering species
on the extraction of U(VI) were tested by using syntheti-
cally prepared solutions including uranyl and interfering
ion. The possible interfering ions in different concentra-
tions were added to a solution containing 200 lg L-1 of
U(VI) and the proposed method was applied under
optimum conditions. The tolerance limits were determined
as ratio of interfere ion concentration to analyte ion causing
an error of ±5 %. The results were given in Table 2. These
results demonstrate that the common coexisting ions did
not have significant effect on the determination of the
analyte ions. The proposed method was observed to be
fairly selective for U(VI) ions at pH 8.0. Since commonly
present ions in water samples did not affect significantly
the recovery of U(VI), therefore the methods can be
applied to determination of uranyl ions in environmental
water samples.
Analytical characteristics
In CPE, extraction needs to be carried out under optimal
conditions in order that the PF can be maximized to
achieve 100 % extraction efficiency. The PF is a parameter
that presents an idea how much analyte ions can be pre-
concentrated.
Concentration of NaCl, (w/v) %0,0 0,5 1,0 1,5 2,0 2,5
Abs
orba
nce
0,0
0,5
1,0
1,5
2,0
2,5
Fig. 7 Effect of ionic strength on analytical signal. Conditions: 2 mL
of pH 8.0 buffer, 250 lg L-1 of U(VI), 0.5 mL of 3.0 9 10-3 M CB,
0.5 mL of 3.0 9 10-3 M SDS 0.5 mL of % 5 (w/v) Triton X-114
Table 2 Tolerance limit of possible interfering ions at determination
of 200 ng mL-1 U(VI)
Interfering ion(s) Tolerance ratio Recovery %
Anions
CO32-, NO3
-, Cl-, Br-, SO42-, 1,000 97.3–105.4
S2-, S2O32-, PO4
3- 500 96.2–101.5
Cations
Na?, K?, Ca2?, NH4? 1,000 98.3–100.4
Fe3?, Fe2? 500 98.2–101.5
Co2?, Cr3? 250 96.5–103.2
Cd2?, Zn2?, Hg2? 200 98.5–102.5
Pb2?, Cu2? 50 95.4–103.7
J Radioanal Nucl Chem
123

The calibration graphs of U(VI) ions in Fig. 2 was
obtained by using 50 mL of standard solutions containing
known amounts of the analytes in the presence of CB, SDS,
and Triton X-114. The analytical characteristics of pro-
posed method was summarized in Table 2 such as regres-
sion equation, linear range, and limits of detection and
quantification, reproducibility and PFs. The limits of
detection and quantification were 14.28 and
42.81 ng mL-1, respectively. The linear range of proposed
method is appropriate in order to follow uranyl concen-
trations in water samples according to USEPA standards.
The volume of the solution was 50 mL before CPE and its
final volume was 1.2 mL before determination step. So, the
PF can be calculated about 42 by using ratios of phases.
Determination of uranyl in real samples
The accuracy and validity of the proposed method were
checked by applying the determination of uranyl ions in
various samples. The collected samples were prepared to
analysis according to procedure the mentioned in ‘‘Ana-
lysis of water and rock samples’’ Section and determined
uranyl concentration by using proposed method.
The results were shown in Table 3. Recovery studies
were also carried out after it was spiked to samples known
concentrations of uranyl ions at levels of 100 and
300 ng mL-1. The recoveries are close to 100 % and
indicate that the proposed method was helpful for the
determination of uranium in the real samples. The accuracy
of the method was statistically (Table 4) tested by evalu-
ating the obtained results with the proposed method based
on pre-concentration with CPE.
Conclusions
In this work, the usage of new micellar system was pre-
sented as an alternative method for pre-concentration and
determination of trace uranyl ions before detection by
UV–VIS spectrophotometry. The proposed method offers
several important advantages including inexpensive, rapid,
safe, lower-toxicity, high sensitivity, high recovery, low
LOD and good precision.
The mixed surfactant medium (Triton X-114 and SDS)
have been used for pre-concentration of uranium in several
water samples and rock sample. The limit of detection of
the presented method seems to be satisfactory in contrast to
some familiar pre-concentration techniques. Furthermore,
in contrast to some familiar pre-concentration techniques
like solvent extraction methods, it is much safer, because
only a small amount of the surfactant, which has a low
toxicity, is used. In addition, the linear range of proposed
method is highly suitable for determination of trace uranyl
ions in real samples. The proposed method is a combina-
tion of CPE and UV–VIS spectrophotometry as a detection
tool for uranyl ions. The method is very versatile and
economic because it exclusively used a conventional
spectrophotometry which is available in almost every lab-
oratory. It may be a useful analytical approach as an
Table 3 Analytical characteristics of the proposed method
Parameters The obtained values
Linear range 50–1.500 ng mL-1
Slope 0.00067
Intercept 0.0192
Correlation coefficient (r2) 0.9912
Recovery % (n 5) 98.7–103.5
RSD (%) (25 and 250 lg L-1, n 5) 4.16 and 3.25
LOD (lg L-1)a 14.28
LOQ (lg L-1)b 42.81
Preconcentration factorc 42
a Based on statistical 3Sblank/m-criterion for ten replicate blank
absorbance measurementsb Based on statistical 10Sblank/m-criterion for ten replicate blank
absorbance measurementsc Preconcentration factor is defined as the ratio of the initial solution
volume to the volume of surfactant rich phase
Table 4 Determination of uranyl ions in several samples
Sample Added
U(VI)
ng mL-1
Founda
U(VI)
ng mL-1Recovery
%
RSD %
River water – 32.18 ± 1.35 – 4.19
100 129.24 ± 3.58 97.8 2.77
300 325.17 ± 8.52 97.9 2.62
Tap water – Non detected – –
100 103.57 ± 2.11 104.4 2.04
300 308.25 ± 8.48 102.8 2.75
Drinking waterb – Non detected – –
100 96.51 ± 3.25 96.5 3.37
300 303.24 ± 7.24 101.1 2.39
Drinking waterb – Non detected – –
100 104.64 ± 3.54 104.6 3.38
300 315.04 ± 9.01 105.0 2.86
Drinking waterb – Non detected – –
100 95.38 ± 2.72 95.4 2.86
300 287.25 ± 7.87 95.8 2.74
Rock including
radioactive
elements
– 88.44 ± 3.84 – 4.34
100 194.12 ± 8.07 100.9 4.16
300 400.61 ± 9.95 103.1 2.48
a Average of five replicate determinations ±sb Three different drinking water samples were bought from a local
market
J Radioanal Nucl Chem
123

alternative to expensive and time consuming techniques
such as ICP-MS, ICP-OES.
Acknowledgments The present study was performed with partly
contributions obtained from other projects supported by Cumhuriyet
University Scientific Research Projects Commission. The author also
wishes to express his gratitude to Asst. Prof. Dr. Selcuk Simsek for all
expert discussions; his suggestions contributed enormously to the
preparation of the manuscript.
References
1. Venkatesh K, Maiti B (2004) Sep Sci Technol 39:1779–1789
2. Teixeira LSG, Costa ACS, Ferreira SLC, Freitas ML, Carvalho
MS (1999) J Braz Chem Soc 10:519–522
3. http://web.ead.anl.gov/uranium/guide/ucompound/health/index.
cfm
4. Sahin CA, Satıroglu N, Bektas S (2009) Hacet J Biol Chem
37:241–247
5. Rao TP, Metilda P, Gladis JM (2006) Talanta 68:1047–1064
6. Madrakian T, Afkhami A, Mousavi A (2007) Talanta
71(2):610–614
7. Nuccetlli C, Grandolfo M, Risica S (2005) Microchem J
79:331–335
8. Gholivand MB, Nassab HR, Fazeli H (2005) Talanta 65:62–69
9. Pashalidis I, Sertos HT (2004) J Radioanal Nucl Chem
260:439–446
10. Ferreira HS, Bezerra MA, Ferreira SLC (2006) Microchim Acta
154:163–167
11. Tamborini G (2004) Microchim Acta 145:237–245
12. Welz B, Sperling M (1994) Atomic absorption spectrometry.
Wiley, New York
13. Goltz DM, Gregoire DC, Byme JP, Chakrabarti JP (1995)
Spectrochim Acta 50:803–812
14. Montaser A, Golightly DW (1992) Inductively coupled plasmas
in analytical atomic spectrometry, 2nd edn. Wiley, New York
15. Gladis JM, Prasada RT (2002) Anal Lett 35:501–509
16. Metilda P, Sanghamitra K, Gladis JM, Naidu GRK, Rao TP
(2005) Talanta 65:192–200
17. StJohn AM, Cattrall RW, Kolev SD (2010) J Membr Sci
364:354–361
18. Liu ZF, Liu SP (1991) Analyst 116:95–98
19. Merdivan M, Seyhan S, Gok C (2006) Microchim Acta
154:109–114
20. Tani H, Kamidate K, Watanabe H (1997) J Chromatogr A
780:229–241
21. Paleologos EK, Giokas DL, Karayannis MI (2005) Trends Anal
Chem 24:426–436
22. Bezerra MA (2005) Appl Spectrosc Rev 40:269–299
23. Ulusoy HI, Aksoy U, Akcay M (2013) Eur Food Res Technol
236:725–733
24. Ulusoy HI, Gurkan R, Ulusoy S (2012) Talanta 88:516–523
25. Sanaa NT, Didi MA, Villemin D (2012) J Radioananal Nucl
Chem 293(3):789–795
26. Gao S, Sun T, Chen Q, Shen X (2013) J Hazard Mater
263:562–568
27. Davarani SSH, Moazami HR, Keshtkar AR, Banitabaa MH,
Nojavan S (2013) Anal Chim Acta 783:74–79
28. Prevost S, Coulombeau H, Baczko K, Berthon L, Zorz N,
Desvaux H, Testard F, Zemb T, Larpent C (2009) Detergents
46(2):100–104
29. Larpent C, Prevost S, Berthon L, Zemb T, Testard F (2007) N J
Chem 31(8):1424–1428
30. Gao S, Sun T, Chen Q, Shen X (2013) J Hazard Mater
263:562–568
31. Favre-Reguillon A, Murat D, Cote G, Draye M (2012) J Chem
Technol Biotechnol 87(10):1497–1501
32. Filik H, Demirci S (2011) Trends Pestic Anal 11:242–279
33. Ulusoy HI, Gurkan R, Alcay M, Bulut P (2011) Rare Met
30:477–487
34. Chilukuri SPS, Sankuratripati GR, Petla YN, Srinivas K (1998)
Anal Lett 31:263–273
35. Ulusoy HI, Simsek S (2013) J Hazard Mater 254:397–405
36. Man BKW, Lam MHW, Lam PKS, Wu RSS, Shaw G (2002)
Environ Sci Technol 36:3985–3990
37. Pino V, Ayala JH, Afonso AM, Gonzalez V (2001) Fresenius J
Anal Chem 371:526–531
38. Ferreira HS, Bezerra MA, Ferreira SLC (2006) Microchim Acta
154:163–167
39. Favre-Reguillon A, Murat D, Cote G, Draye M (2012) J Chem
Technol Biotechnol 87:1497–1501
J Radioanal Nucl Chem
123