Determination of total petroleum hydrocarbons in soil from different locations using infrared...
11
Chemical Papers 66 (8) 711–721 (2012) DOI: 10.2478/s11696-012-0193-8 ORIGINAL PAPER Determination of total petroleum hydrocarbons in soil from different locations using infrared spectrophotometry and gas chromatography a Paula Paíga, b Lurdes Mendes, a José T. Albergaria*, a Cristina M. Delerue-Matos a REQUIMTE, b Instituto Superior de Engenharia do Porto, Rua Dr. António Bernardino de Almeida, 431, 4200-072 Porto, Portugal Received 19 December 2011; Revised 22 March 2012; Accepted 23 March 2012 Total petroleum hydrocarbons (TPH) are important environmental contaminants which are toxic to human and environmental receptors. Several analytical methods have been used to quantify TPH levels in contaminated soils, specifically through infrared spectrometry (IR) and gas chromatogra- phy (GC). Despite being two of the most used techniques, some issues remain that have been inadequately studied: a) applicability of both techniques to soils contaminated with two distinct types of fuel (petrol and diesel), b) influence of the soil natural organic matter content on the results achieved by various analytical methods, and c) evaluation of the performance of both techniques in analyses of soils with different levels of contamination (presumably non-contaminated and po- tentially contaminated). The main objectives of this work were to answer these questions and to provide more complete information about the potentials and limitations of GC and IR techniques. The results led us to the following conclusions: a) IR analysis of soils contaminated with petrol is not suitable due to volatilisation losses, b) there is a significant influence of organic matter in IR analysis, and c) both techniques demonstrated the capacity to accurately quantify TPH in soils, irrespective of their contamination levels. c 2012 Institute of Chemistry, Slovak Academy of Sciences Keywords: total petroleum hydrocarbons, soil, infrared spectrophotometry, gas chromatography Introduction Soils contaminated with petroleum products create widespread environmental problems due to their ad- verse effects (Wang et al., 1999). It is becoming urgent to assess contamination in some sites in question, to remediate and monitor these cleaning processes and to evaluate final quality of the soil. TPH are an important group of environmental con- taminants that are toxic to human and environmental receptors (Park & Park, 2011). In 1999 the United States Environmental Protection Agency (USEPA) Site Program began its evaluation of field methods for the determination of TPH in soils. This was an ambitious project that involved the establishment of a TPH definition and the development of a reference method for its quantification. One of the methods se- lected for this evaluation was SW-846 Method 9074 (Lynn et al., 2002; USEPA, 1996a). At present, a wide variety of specific and non- specific methods are used for analysis of TPH. The conventional non-specific methods include: i) field- screening gas chromatography with flame ionisation (GC-FID) or photo-ionisation detection (GC-PID) (API, 1992, 1994; USEPA, 1996b), ii) gravimetric determination and infrared spectrophotometry (IR), such as USEPA methods 418.1, 8440, and 9071B, and American Society for Testing and Materials (ASTM) methods 3414 and 3921 (USEPA, 1978, 1996c, 1998; ASTM, 1997a, 1997b), iii) turbidimetry (USEPA, 1996a), iv) ultraviolet and fluorescence spectroscopy (Burns, 1993; ASTM 1997c), v) thin-layer chromatog- *Corresponding author, e-mail: [email protected]
-
Upload
cristina-m -
Category
Documents
-
view
216 -
download
1
Transcript of Determination of total petroleum hydrocarbons in soil from different locations using infrared...

Chemical Papers 66 (8) 711–721 (2012)DOI: 10.2478/s11696-012-0193-8
ORIGINAL PAPER
Determination of total petroleum hydrocarbons in soilfrom different locations using infrared spectrophotometry
and gas chromatography
aPaula Paíga, bLurdes Mendes, aJosé T. Albergaria*, aCristina M. Delerue-Matos
aREQUIMTE, bInstituto Superior de Engenharia do Porto,
Rua Dr. António Bernardino de Almeida, 431, 4200-072 Porto, Portugal
Received 19 December 2011; Revised 22 March 2012; Accepted 23 March 2012
Total petroleum hydrocarbons (TPH) are important environmental contaminants which are toxicto human and environmental receptors. Several analytical methods have been used to quantify TPHlevels in contaminated soils, specifically through infrared spectrometry (IR) and gas chromatogra-phy (GC). Despite being two of the most used techniques, some issues remain that have beeninadequately studied: a) applicability of both techniques to soils contaminated with two distincttypes of fuel (petrol and diesel), b) influence of the soil natural organic matter content on the resultsachieved by various analytical methods, and c) evaluation of the performance of both techniquesin analyses of soils with different levels of contamination (presumably non-contaminated and po-tentially contaminated). The main objectives of this work were to answer these questions and toprovide more complete information about the potentials and limitations of GC and IR techniques.The results led us to the following conclusions: a) IR analysis of soils contaminated with petrol isnot suitable due to volatilisation losses, b) there is a significant influence of organic matter in IRanalysis, and c) both techniques demonstrated the capacity to accurately quantify TPH in soils,irrespective of their contamination levels.c© 2012 Institute of Chemistry, Slovak Academy of Sciences
Keywords: total petroleum hydrocarbons, soil, infrared spectrophotometry, gas chromatography
Introduction
Soils contaminated with petroleum products createwidespread environmental problems due to their ad-verse effects (Wang et al., 1999). It is becoming urgentto assess contamination in some sites in question, toremediate and monitor these cleaning processes andto evaluate final quality of the soil.TPH are an important group of environmental con-
taminants that are toxic to human and environmentalreceptors (Park & Park, 2011). In 1999 the UnitedStates Environmental Protection Agency (USEPA)Site Program began its evaluation of field methodsfor the determination of TPH in soils. This was anambitious project that involved the establishment ofa TPH definition and the development of a reference
method for its quantification. One of the methods se-lected for this evaluation was SW-846 Method 9074(Lynn et al., 2002; USEPA, 1996a).At present, a wide variety of specific and non-
specific methods are used for analysis of TPH. Theconventional non-specific methods include: i) field-screening gas chromatography with flame ionisation(GC-FID) or photo-ionisation detection (GC-PID)(API, 1992, 1994; USEPA, 1996b), ii) gravimetricdetermination and infrared spectrophotometry (IR),such as USEPA methods 418.1, 8440, and 9071B, andAmerican Society for Testing and Materials (ASTM)methods 3414 and 3921 (USEPA, 1978, 1996c, 1998;ASTM, 1997a, 1997b), iii) turbidimetry (USEPA,1996a), iv) ultraviolet and fluorescence spectroscopy(Burns, 1993; ASTM 1997c), v) thin-layer chromatog-
*Corresponding author, e-mail: [email protected]

712 P. Paíga et al./Chemical Papers 66 (8) 711–721 (2012)
raphy (TLC) (which has been extensively used in thecomponent class characterisation of various oils andrespective fractions) (Wang et al., 2010), vi) high per-formance liquid chromatography (HPLC) (Krahn etal., 1993), vii) size-exclusion chromatography (Krahn& Stein, 1998), viii) supercritical fluid chromatogra-phy (SFC) (ASTM, 1997d), ix) total organic carbon(Schreier et al., 1999), x) isotope ratio mass spectrom-etry (Wang et al., 1999), and xi) fibre optic IR sensorfor identification of various petroleum samples (Ge etal., 1995). The non-specific techniques have been usedto screen TPH and petroleum saturated and aromaticcompounds in sediments, to assess site contamination,to identify and quantify petroleum products that mayexist in soil or water, and to qualitatively analyse andcompare oil degradation due to weathering (Wang etal., 1999).Fingerprint analysis has been developed using
specific and advanced techniques such as: i) gaschromatography–mass spectrometry (GC-MS),ii) high performance liquid chromatography–massspectrometry (HPLC-MS), iii) isotope dilution massspectrometry (IDMS), iv) nuclear magnetic resonance(NMR), and v) electrospray ionisation–mass spec-trometry (ESI-MS) (Wang & Fingas, 1997, 2003; Eide& Zahlsen, 2005; Daling et al., 2002). Many USEPAand ASTM methods have been modified to improveselectivity and sensitivity for measuring spilled oil andpetroleum products in soils and water (ASTM, 1997a,1997b, 1997e, 1997f, 1997g; Sink & Hardy, 1994).Wright (1995) reported that using field measure-
ment methods instead of laboratory analyses it waspossible to analyse more soil samples, faster and atlower cost. Lambert et al. (2001) used two test kitsfor soil analyses: the immunoassay-based EnviroG-ard petroleum fuel in soil test kit and a colorimet-ric test procedure (DR/2000). Lynn et al. (2002)analysed performance of the PetroFLAG hydrocar-bon analyser system (commercial version of SW-846 Method 90747). Using co-elution in a single-stepchromatographic separation, it is impossible to iden-tify and quantify the target compounds. Combinedmethods such as: HPLC-GC, GC-GC, GC×GC (two-dimensional GC), or supercritical fluid chromatogra-phy (SFC) are commonly used to improve the qualityof analysis. Pál et al. (1998) used SFC-GC/MS for de-tailed analysis of different hydrocarbon groups in therange of petroleum fractions and Mao et al. (2009)estimated eco-toxicity of petroleum hydrocarbon mix-tures in soil using HPLC-GC×GC. All these analyticalmethods have been modified in order to eliminate ma-trix interferences, reduce the amount of solvent used,find alternative and less toxic solvents, simplify ana-lytical procedures amongst other requirements.Methods of GC and IR techniques are commonly
used to determine levels of TPH in contaminated soils;however, some issues remain that have not been suffi-ciently studied. These issues are studied in this work
and focus on: a) applicability of both techniques to theanalysis of soils contaminated with two distinct typesof fuel (petrol and diesel), b) influence of soil naturalorganic matter on TPH determination, and c) eval-uation of the performance of both techniques on theanalysis of soils with different levels of contamination(presumably non-contaminated and potentially con-taminated). The work sought to provide a response tothese questions and to supply more complete informa-tion on the potentials and limitations of GC and IRtechniques applied to TPH determination.
Experimental
Materials and methods
The ASTM D5307 (ASTM, 1997h) Crude oil quan-titative STD analytical standard was obtained fromSupelco (Bellefonte, PA, USA), and diesel and petrolwere acquired from a Portuguese oil refinery (Petrogal,S.A., Porto). Iso-octane, pentane, potassium dichro-mate, and ortho-phosphoric acid of 85 mass % wereobtained from Merck (Darmstadt, Germany), 1,1,2-trichloro-1,2,2-trifluoroethane and hexadecane wereobtained from Sigma–Aldrich (Bellefonte, PA, USA).Sodium sulphate, ammonium iron(II) sulphate hex-ahydrate, and benzene were obtained from Riedel–de Haen (Seelze, Germany), and sulphuric acid 95–97 mass % was obtained from Fluka (Bellefonte, PA,USA). All reagents were of analytical grade or higherpurity.Deionised water (15.0 MΩ cm−1) was produced us-
ing an Elix3 Advantage system (Millipore, Molsheim,France). High-purity grade silica gel (Davisil Grade635), pore size: 60 A, 60–100 mesh was purchased fromSigma–Aldrich (Bellefonte, PA, USA).Following the EPA Method 8440 (USEPA, 1996c),
the standard solution for IR was prepared by mix-ing hexadecane, isooctane, and benzene as the “ref-erence oil” in a 50-mL glass-stoppered bottle. Theintegrity of the mixture was maintained by keepingthe bottle duly stoppered except when withdrawingaliquots. The stock solution was prepared by dilut-ing the reference oil 200-fold with 1,1,2-trichloro-1,2,2-trifluoroethane. A stock solution for GC determina-tion was prepared by a 100-fold dilution of dieselwith pentane. Working standards were prepared byaccurate dilution of the stock solutions using 1,1,2-trichloro-1,2,2-trifluoroethane for IR and pentane forGC-FID on the day of use. All solutions were storedat 4C. The ASTM D5307 reference oil was preparedin 1,1,2-trichloro-1,2,2-trifluoroethane for IR determi-nation and in pentane for GC analysis.For determination of the organic matter content,
three solutions were prepared: a) 0.40 mol L−1 am-monium iron(II) sulphate hexahydrate (SFA) in 0.40mol L−1 sulphuric acid; ii) oxidant mixture of 0.068mol L−1 potassium dichromate in 7.50 mol L−1 sul-

P. Paíga et al./Chemical Papers 66 (8) 711–721 (2012) 713
phuric acid and 3.85 mol L−1 ortho-phosphoric acid,and iii) potassium dichromate 0.033 mol L−1 in de-ionised water.An IR Spectrolab Interspec 200X, Fourier trans-
form infrared spectrometer (FTIR, Garforth, Leeds,UK) and a quartz cell with a 30-mL capacity and a10-cm light path (for TPH concentration range from0.5 mg L−1 to 50 mg L−1) were used.GC-FID analyses were performed using a Chrom-
pack CP 9000 gas chromatograph (Apeldoorn, theNetherlands) with an FID detector using splitless in-jection. A WCOT Fused Silica, stationary phase: CP-SIL-8 CB (25 m× 0.25 mm i.d. with 0.4-µm film thick-ness) column was used. Nitrogen was used as carriergas and hydrogen and oxygen were used as FID gases.Maestro software was used for data acquisition andprocessing. Volumes of 1 µL were injected using a 10-µL microsyringe (Hamilton, IL, USA).Determination of the organic matter content was
performed with a TecatorTM Digestion System (Hil-lerod, Denmark) and water content was determinedwith a Lenton Furnaces oven (London, UK).The wavenumbers used in the IR scans ranged
from 3200 cm−1 to 2700 cm−1, but absorbance wasmeasured at the maximum peak of 2930 cm−1 (sub-tracting the baseline). Calibration curves were con-structed using six standard solutions with concentra-tions ranging from 4.91 mg L−1 to 39.78 mg L−1.To reduce the detection and quantification limits ofthe GC-FID method, a pre-concentration step was in-cluded in the procedure where 10 mL of the extractwas transferred into a vial and evaporated to drynesswith a gentle stream of nitrogen and recovered with1 mL of pentane. The temperature of the oven wasprogrammed with an initial temperature of 40C (for2 min) and a temperature rise of 6C min−1 up to290C. Detector and injector temperatures were setat 325C and 285C, respectively. Calibration curvesfor GC-FID were based on measurements of nine stan-dard solutions with concentrations in the range from500 mg L−1 to 4000 mg L−1.
Samples and their treatment
In total, fifteen samples were collected (three fromfive different sites: a farm, road, beach, commercialgas station, and vicinity of Portuguese oil refinery) inthe north of Portugal. These groups of three sampleswere collected in distinct localities sufficiently distantto avoid soil similarities (minimum distance betweensampling sites of the same type was 1.2 km). The fivedifferent types of locations chosen to study aimed atthe collection of samples from sites that were presum-ably uncontaminated (farm and beach) and proba-bly contaminated (roads, commercial gas stations, andvicinity of oil refinery). Approximately 1 kg of a sam-ple was collected at each sampling point from the up-per layer of soil of 0–20 cm using a spade. All samples
were thoroughly mixed to ensure homogeneity and, af-ter air-drying and sieving through a 2-mm sieve, werestored at 4C (USEPA, 1996c).For the extraction, approximately 3 g of soil was
used and thoroughly mixed with 150 mL of extrac-tion solvent and extracted over 4 h. The extractionwas performed in triplicate in 1,1,2-trichloro-1,2,2-trifluoroethane for IR and pentane for GC-FID analy-ses, respectively (Current & Tilotta, 1997). After theextraction, 0.3 g of silica gel was added to adsorbthe polar material, such as vegetable oils and animalfats. The USEPA method 8440 (USEPA, 1996c) re-gards all “oil and grease” materials that are not elim-inated by silica gel adsorption as “petroleum hydro-carbons”. The extracts were filtered through What-man GF/C filters (UK) using a DINKO D-95 vacuumpump (Barcelona, Spain). Sodium sulphate was addedto the sample during the extraction procedure and inthe filtration process to eliminate residual water. Theextracts thus obtained were analysed by IR and GC-FID. Other procedures are described in the literaturethat use different solvents, such as tetrachloroethylene(Dumitran et al., 2009) or hexane (Rauckyte et al.,2010), or sonication methods to enhance extraction(Shin & Kwon, 2000; Miclean et al., 2010).
Recovery studies
Recovery studies were performed using soils withdifferent physical-chemical properties to verify whe-ther the TPH content could be extracted from severaltypes of soil. Hence, two soils samples, both from thenorth of Portugal, were collected: soil A (collected ona farm) and soil B (collected on a beach). After apreliminary analysis, it was observed that both soilsdid not contain detectable amounts of TPH.These samples were fortified with reference oil
and diesel standards for IR and GC-FID analyses,respectively at three levels: (I) 5000 mg kg−1, (II)1000 mg kg−1, and (III) 500 mg kg−1. Pure 1,1,2-trichloro-1,2,2-trifluoroethane or pentane was addedto both soils and samples were allowed to standfor 30 min before extraction, in order to obtainblanks. For fortification level I, and using IR, analiquot of the extract (1 mL) was transferred intoa 10-mL volumetric flask and diluted with 1,1,2-trichloro-1,2,2-trifluoroethane (final TPH concentra-tion of 10 mg L−1). Level II and III samples could beanalysed directly, because the final concentration waswithin the linear range of the calibration curve. Forthe GC analysis, an aliquot of the extract (10 mL)was transferred into a vial and evaporated to drynesswith a gentle stream of nitrogen and re-dissolved with1000 µL, 200 µL, and 100 µL of pentane for fortifica-tion levels I, II, and III, respectively (final TPH con-centration of 1000 mg L−1 for all fortification levels).A vortex mixer was used for homogenisation. The re-covery was calculated by determining the percentage
714 P. Paíga et al./Chemical Papers 66 (8) 711–721 (2012)
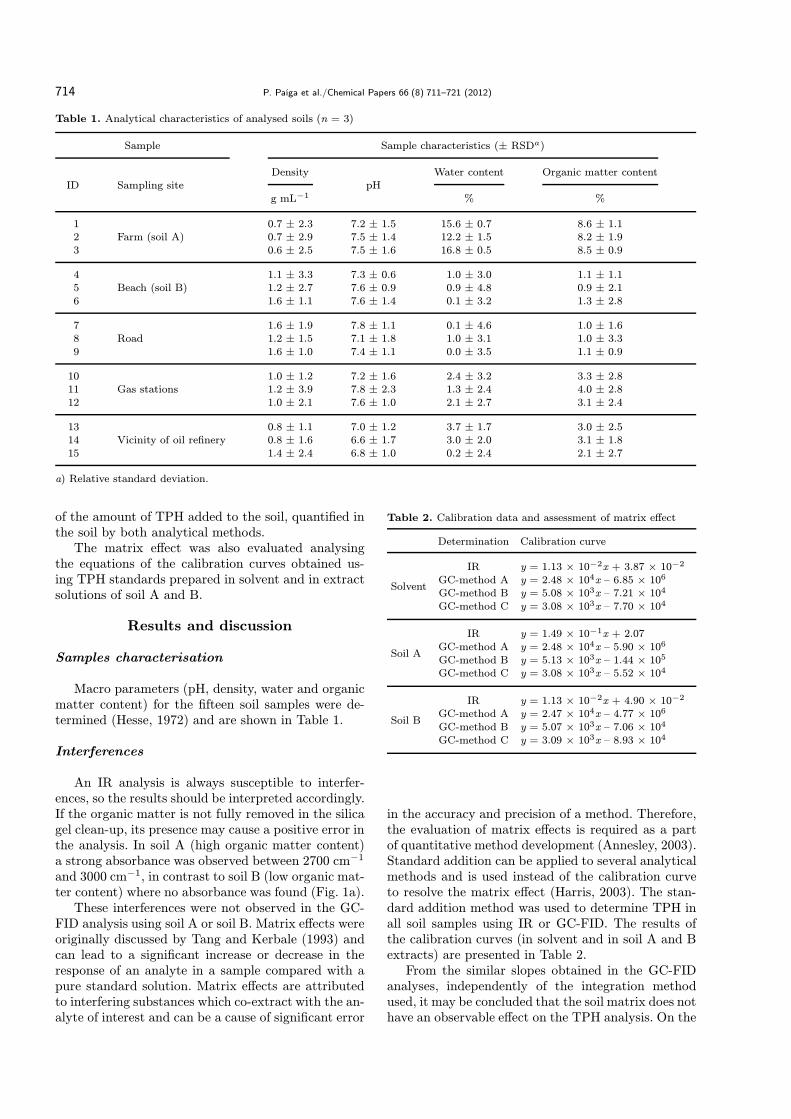
Table 1. Analytical characteristics of analysed soils (n = 3)
Sample Sample characteristics (± RSDa)
Density Water content Organic matter contentID Sampling site pH
g mL−1 % %
1 0.7 ± 2.3 7.2 ± 1.5 15.6 ± 0.7 8.6 ± 1.12 Farm (soil A) 0.7 ± 2.9 7.5 ± 1.4 12.2 ± 1.5 8.2 ± 1.93 0.6 ± 2.5 7.5 ± 1.6 16.8 ± 0.5 8.5 ± 0.9
4 1.1 ± 3.3 7.3 ± 0.6 1.0 ± 3.0 1.1 ± 1.15 Beach (soil B) 1.2 ± 2.7 7.6 ± 0.9 0.9 ± 4.8 0.9 ± 2.16 1.6 ± 1.1 7.6 ± 1.4 0.1 ± 3.2 1.3 ± 2.8
7 1.6 ± 1.9 7.8 ± 1.1 0.1 ± 4.6 1.0 ± 1.68 Road 1.2 ± 1.5 7.1 ± 1.8 1.0 ± 3.1 1.0 ± 3.39 1.6 ± 1.0 7.4 ± 1.1 0.0 ± 3.5 1.1 ± 0.9
10 1.0 ± 1.2 7.2 ± 1.6 2.4 ± 3.2 3.3 ± 2.811 Gas stations 1.2 ± 3.9 7.8 ± 2.3 1.3 ± 2.4 4.0 ± 2.812 1.0 ± 2.1 7.6 ± 1.0 2.1 ± 2.7 3.1 ± 2.4
13 0.8 ± 1.1 7.0 ± 1.2 3.7 ± 1.7 3.0 ± 2.514 Vicinity of oil refinery 0.8 ± 1.6 6.6 ± 1.7 3.0 ± 2.0 3.1 ± 1.815 1.4 ± 2.4 6.8 ± 1.0 0.2 ± 2.4 2.1 ± 2.7
a) Relative standard deviation.
of the amount of TPH added to the soil, quantified inthe soil by both analytical methods.The matrix effect was also evaluated analysing
the equations of the calibration curves obtained us-ing TPH standards prepared in solvent and in extractsolutions of soil A and B.
Results and discussion
Samples characterisation
Macro parameters (pH, density, water and organicmatter content) for the fifteen soil samples were de-termined (Hesse, 1972) and are shown in Table 1.
Interferences
An IR analysis is always susceptible to interfer-ences, so the results should be interpreted accordingly.If the organic matter is not fully removed in the silicagel clean-up, its presence may cause a positive error inthe analysis. In soil A (high organic matter content)a strong absorbance was observed between 2700 cm−1
and 3000 cm−1, in contrast to soil B (low organic mat-ter content) where no absorbance was found (Fig. 1a).These interferences were not observed in the GC-
FID analysis using soil A or soil B. Matrix effects wereoriginally discussed by Tang and Kerbale (1993) andcan lead to a significant increase or decrease in theresponse of an analyte in a sample compared with apure standard solution. Matrix effects are attributedto interfering substances which co-extract with the an-alyte of interest and can be a cause of significant error
Table 2. Calibration data and assessment of matrix effect
Determination Calibration curve
IR y = 1.13 × 10⁻²x + 3.87 × 10⁻²
SolventGC-method A y = 2.48 × 10⁴x – 6.85 × 10⁶GC-method B y = 5.08 × 10³x – 7.21 × 10⁴GC-method C y = 3.08 × 10³x – 7.70 × 10⁴
IR y = 1.49 × 10⁻¹x + 2.07Soil A
GC-method A y = 2.48 × 10⁴x – 5.90 × 10⁶GC-method B y = 5.13 × 10³x – 1.44 × 10⁵GC-method C y = 3.08 × 10³x – 5.52 × 10⁴
IR y = 1.13 × 10⁻²x + 4.90 × 10⁻²
Soil BGC-method A y = 2.47 × 10⁴x – 4.77 × 10⁶GC-method B y = 5.07 × 10³x – 7.06 × 10⁴GC-method C y = 3.09 × 10³x – 8.93 × 10⁴
in the accuracy and precision of a method. Therefore,the evaluation of matrix effects is required as a partof quantitative method development (Annesley, 2003).Standard addition can be applied to several analyticalmethods and is used instead of the calibration curveto resolve the matrix effect (Harris, 2003). The stan-dard addition method was used to determine TPH inall soil samples using IR or GC-FID. The results ofthe calibration curves (in solvent and in soil A and Bextracts) are presented in Table 2.From the similar slopes obtained in the GC-FID
analyses, independently of the integration methodused, it may be concluded that the soil matrix does nothave an observable effect on the TPH analysis. On the

P. Paíga et al./Chemical Papers 66 (8) 711–721 (2012) 715
Fig. 1. Overlapped IR spectra of soil samples A and B (a), overlapped IR spectra of soil B and standard additions (concentrationsof 4.91 mg L−1, 16.20 mg L−1, 21.25 mg L−1, 27.49 mg L−1, 33.84 mg L−1, and 39.78 mg L−1) (b), GC-FID chromatogramof standard solution (4000 mg L−1) in soil B (c).
other hand, a significant matrix effect was observed insoil A using IR method, resulting in the higher slope ofthe respective calibration curve. These results for soilswith lower and higher organic matter justify the useof the standard addition method for all the samplesanalysed in order to reduce the matrix effects.
Linearity, detection, and quantification limitsof infrared and chromatographic methods
Fig. 1b shows the spectra obtained in the analysisof the six standard solutions ranging from 4.91 mg L−1
to 39.78 mg L−1. A linear response was obtained witha correlation coefficient of 0.9999. Under these condi-tions, the detection (LOD) and quantification limits(LOQ) were 2.62 mg kg−1 (mg of TPH per kg of soil)and 8.73 mg kg−1, respectively. LOD and LOQ werecalculated by multiplying the standard deviations of
the obtained linear regressions by 3 and 10, respec-tively, and dividing both by the slope of the respectivelinear regression equation, as described in Miller andMiller (2000). These results show that IR can be usedfor monitoring purposes.A typical GC-FID chromatogram of a standard so-
lution is shown in Fig. 1c. Integration of the peaks ofthe chromatograms was performed using three differ-ent methods (Fig. 2). In method A, denoted as “base-line to baseline”, the area considered represents theentire area of the chromatogram within the reten-tion time-range for the fuel type, including the unre-solved complex mixture. For the concentration rangefrom 500 mg L−1 to 4000 mg L−1 (Fig. 2a), a lin-ear response was obtained with a correlation coeffi-cient of 0.9999. The total area was integrated from14.1 min to 51.0 min (referring to decane and octa-cosane peaks, respectively). The LOD and LOQ were

716 P. Paíga et al./Chemical Papers 66 (8) 711–721 (2012)
Fig. 2. GC-FID integration methods: “baseline to baseline” (a), “peak to peak” (b), and addition of ASTM standard solution (c).ASTM standard solution components: decane (1), undecane (2), dodecane (3), tridecane (4), tetradecane (5), pentadecane(6), hexadecane (7), heptadecane (8), octadecane (9), eicosane (10), tetracosane (11), and octacosane (12).
Table 3. TPHs recoveries (mean ± relative standard deviation, n = 3) from homogenised soil sample type A and B, at threefortification levels (I, II, and III)
Recovery/% (± RSD)
Fortification level GC-FID integration methodSoil IR
mg kg−1 A B C
I 5000 96 ± 1 98 ± 2 99 ± 2 98 ± 1A II 1000 95 ± 1 98 ± 2 98 ± 1 98 ± 1
III 500 94 ± 3 98 ± 2 98 ± 1 98 ± 2
I 5000 98 ± 1 98 ± 2 98 ± 2 98 ± 2B II 1000 98 ± 2 98 ± 2 98 ± 2 98 ± 3
III 500 98 ± 2 98 ± 1 97 ± 2 98 ± 2
127.07 mg kg−1 and 423.57 mg kg−1, respectively. Us-ing method B, denoted as “peak to peak”, only thetwenty-seven most representative peaks in the chro-matograms (Fig. 2b) were considered and integrated.In the range from 500 mg L−1 to 4000 mg L−1, alinear response with a correlation coefficient of 0.9999was obtained. The LOD and LOQ were 96.16 mg kg−1
and 320.52 mg kg−1, respectively. The last integratedpeak had a retention time of 51.0 min. Finally, inmethod C, the integration considered the retentiontimes of the compounds included in the ASTM D5307Crude oil quantitative STD analytical standard. Us-ing the same conditions, an ASTM D5307 Crude oilquantitative analytical standard with a concentrationof 960 mg L−1 was injected. The mixture consistedof sixteen hydrocarbons, all of 6.25 mass %. TheASTM standard solution was injected in order to ob-tain the retention times for each hydrocarbon; then,diesel standard solutions (concentration range from
500 mg L−1 to 4000 mg L−1) were injected and twelvepeaks with the same retention time as the peaks ofASTM D5307 (Fig. 2c) were integrated. The last inte-grated peak had a retention time of 51.0 min. A linearresponse was obtained with a correlation coefficient of0.9999. The LOD and LOQ were 118.54 mg kg−1 and395.13 mg kg−1, respectively.Using GC-FID, methods A and B presented the
lowest and highest LOD, respectively. IR provided amuch lower LOQ than GC-FID but both methods en-abled the quantification of lower amounts of TPH thanthe established alert and intervention values (Hesse,1972).
Fortification levels
The extraction efficiency was consistent across thewhole fortification range and for both soils (with dif-ferent organic matter contents). No significant vari-

P. Paíga et al./Chemical Papers 66 (8) 711–721 (2012) 717
Table 4. Certified and measured concentrations of TPH in the ASTM D5307 (ASTM, 1997h) Crude oil quantitative standard(n = 3)
GC-FID (method C)e
RetentionPurity Content time Concentration/(mg L−1) Concentration ± SD Recovery ± RSD
Componenta
% mass % min ASTM Extraction Concentration mg L−1 %standardb stepc stepd
Decane 99.7 6.235 14.396 188.093 1.254 31.349 30.9 ± 0.4 98.5 ± 1.3Undecane 99.2 6.235 17.296 187.149 1.248 31.192 30.9 ± 0.3 98.9 ± 0.9Dodecane 99.6 6.235 20.044 187.904 1.253 31.317 30.6 ± 0.5 97.7 ± 1.6Tridecane 99.3 6.235 22.632 187.338 1.249 31.223 30.7 ± 0.1 98.4 ± 0.4Tetradecane 99.5 6.235 25.068 187.715 1.251 31.286 30.9 ± 0.4 98.8 ± 1.4Pentadecane 99.8 6.235 27.372 188.281 1.255 31.380 31.0 ± 0.3 98.7 ± 0.9Hexadecane 99.0 6.235 29.552 186.772 1.245 31.129 30.4 ± 0.2 97.7 ± 0.6Heptadecane 99.0 6.235 31.620 186.772 1.245 31.129 30.9 ± 0.2 99.1 ± 0.6Octadecane 98.7 6.235 33.584 186.206 1.241 31.034 30.3 ± 0.0 97.7 ± 0.1Eicosane 99.0 6.241 37.240 186.952 1.246 31.159 30.6 ± 0.4 98.3 ± 1.2Tetracosane 97.4 6.397 43.648 188.528 1.257 31.421 30.9 ± 0.3 98.3 ± 1.1Octacosane 99.6 6.235 50.940 187.904 1.253 31.317 30.3 ± 0.2 96.6 ± 0.5Dotriacontenef 99.3 6.235 – 187.338 1.249 31.223 – –Hexatriacontenef 99.6 6.235 – 187.904 1.253 31.317 – –Tetracontenef 99.2 6.235 – 187.149 1.248 31.192 – –Tetratetracontenef 99.7 6.235 – 188.093 1.254 31.349 – –For the 12 hydrocarbons – – – 2249.614g 14.997g 374.936g 368.3g 98.2 ± 0.7hFor the 16 hydrocarbons – – – 3000.098g 20.001g 500.016f – –
a) See chromatogram in Fig. 2c; b) certified values, soil type B was contaminated with 1 mL of 3000 mg L−1 ASTM standardsolution; c) extraction of ASTM standard from 3 g of contaminated soil type B using 150 mL of pentane; d) value after pre-concentration (10 mL of the extract was evaporated with nitrogen and re-dissolved in 400 µL of pentane); e) values estimatedexperimentally; f ) the last integrated peak was with retention time of 50.94 min; peaks not considered; g) total concentrationmeasured for the twelve peaks; h) mean value for the twelve peaks.
ation in the results (Table 3) was observed and therecovery did not differ substantially at the lowest andthe highest concentrations for the two types of soils.Three fortification levels were chosen in order to testthe recovery values over a certain concentration range.
Analysis of ASTM D5307 Crude oil quantita-tive STD analytical standard
Validation of the extraction procedure for deter-mination of TPH in soil samples was carried outby analysing a certified reference material. StandardASTM D5307 solution (3000 mg L−1) was preparedin 1,1,2-trichloro-1,2,2-trifluoroethane and in pentane.Soil sample B (3 g) was contaminated with 1 mL ofthe standard ASTM solution and allowed to standfor 30 min before extraction. Using IR, determina-tion of the concentration and recovery of individ-ual hydrocarbons was not possible. The absorbancewas measured and the concentration obtained was(19.6 ± 0.2) mg L−1 (n = 3) with the recovery of97.8 % (RSD = 0.86 %, n = 3). Using GC-FID, itwas possible to calculate the concentration and re-covery of each hydrocarbon present in the certifiedreference material. A pre-concentration step had tobe performed (twenty-five times). Concentration andrecoveries for each hydrocarbon are presented in Ta-ble 4.
The ASTM standard was successfully extractedfrom the soil sample with good recoveries in IR andGC-FID analyses. Referring to the similar slopes ofthe calibration curves obtained with soils A and B,the values of which are presented in Table 2, it canbe deduced that if soil A were used, similar recover-ies could have been achieved within the range of TPHconcentrations studied.
Source of spilled oil
Each crude oil or petroleum product has its uniquechemical “fingerprint”, providing a basis for identify-ing the source(s) of the spilled oil. Method 8440 cannotbe applied to the analysis of petrol and other volatilepetroleum fractions, because these fractions evapo-rate during sample preparation (USEPA, 1996c). Toidentify the specific fuel present in the soil sam-ples analysed: a) diesel (1000 mg L−1) and b) petrol(1000 mg L−1) fuels were injected into a chromato-graph with FID. The fuel chromatograms are pre-sented in Fig. 3.The chromatograms obtained for both samples are
very specific and enabled the identification of the fuelin a specific sample. Therefore, all soil samples wereanalysed first by GC-FID and only the samples con-taminated with diesel fuel were analysed by IR.

718 P. Paíga et al./Chemical Papers 66 (8) 711–721 (2012)
Fig. 3. GC-FID chromatograms of 1000 mg L−1 diesel (a) and 1000 mg L−1 petrol (b) fuels.
Table 5. Concentration of TPH in samples analysed (n = 3)
TPH concentration/(mg kg−1) (± SDa)Sampling site
GC-FID integrationIR
method A method B method C
n.d. n.d. n.d. n.d.Farm (soil A) n.d. n.d. n.d. n.d.
n.d. n.d. n.d. n.d.
n.d. n.d. n.d. n.d.Beach (soil B) n.d. n.d. n.d. n.d.
n.d. n.d. n.d. n.d.
45 ± 2b < LOQc < LOQc < LOQc
Road 64 ± 2b < LOQc < LOQc < LOQc
55 ± 4b < LOQc < LOQc < LOQc
532 ± 25d 561 ± 13 561 ± 30 567 ± 37Gas stations 649 ± 20d 640 ± 11 628 ± 34 639 ± 10
620 ± 21d 650 ± 19 632 ± 19 608 ± 21
8640 ± 149e 8875 ± 152f 8840 ± 209f 9230 ± 322fRefinery neighbourhood 8029 ± 183e 8326 ± 239f 7973 ± 255f 8235 ± 291f
3423 ± 213e 3525 ± 309f 3505 ± 225f 3495 ± 253f
a) SD – standard deviation; b) two times sample dilution (25 mL of extract in a 50 mL volumetric flask diluted with 1,1,2-trichloro-1,2,2-trifluoroethane to the volume); c) fifty times sample pre-concentration (10 mL of extract evaporated to dryness with nitrogenand re-dissolved with 200 µL of pentane); d) twenty-five times sample dilution (2 mL of extract in a 50 mL volumetric flask dilutedwith 1,1,2-trichloro-1,2,2-trifluoroethane to the volume); e) two hundred and fifty times sample dilution (200 µL of extract in a50 mL volumetric flask diluted with 1,1,2-trichloro-1,2,2-trifluoroethane to the volume); f ) five times sample dilution (1 mL ofextract in a 5 mL volumetric flask diluted with pentane to the volume).
Application to soil samples
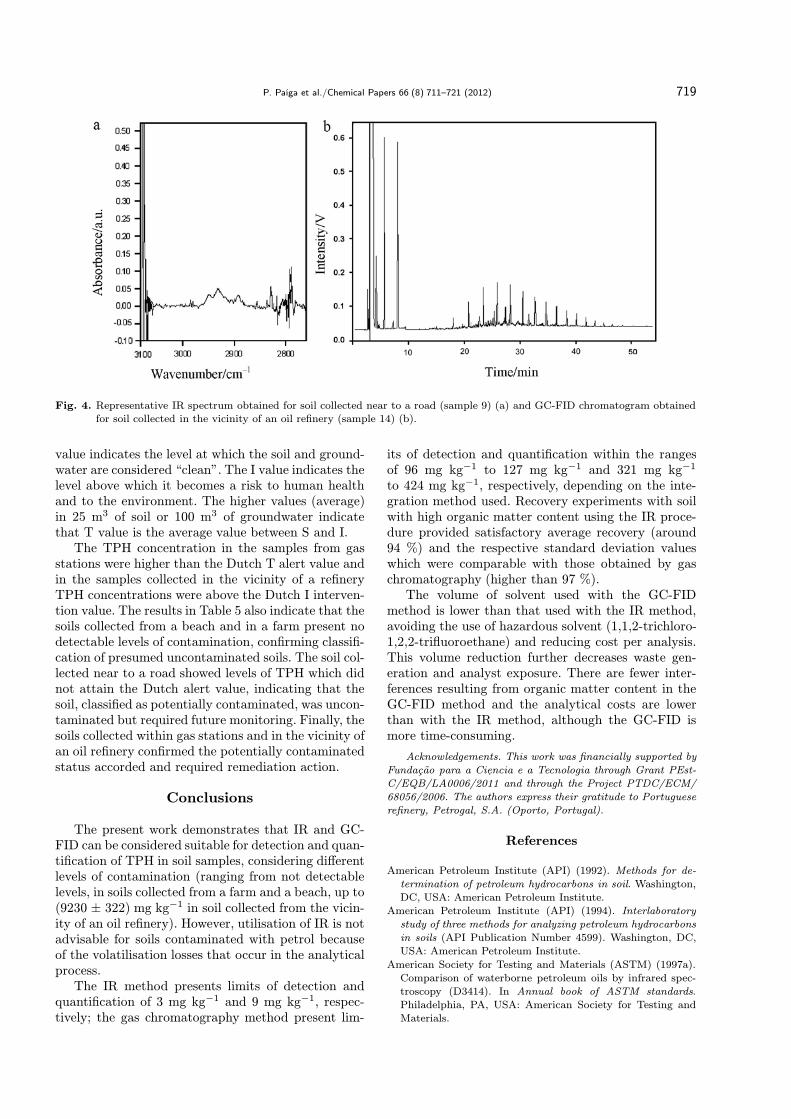
The results obtained for each soil sample are pre-sented in Table 5. IR and GC-FID determinations (in-tegration methods A, B, and C) showed similar re-sults. As an example, Fig. 4 presents the spectrum ob-tained by IR analysis of a soil collected near to a road
(sample 9) and a chromatogram obtained by GC-FIDanalysis of a soil collected in the vicinity of a refinery(sample 14).In accordance with Dutch legislation (VROM,
1987), there are three limit values of TPH mass permass of soil: reference (S, 10 mg kg−1), intervention(I, 1000 mg kg−1), and alert (T, 505 mg kg−1). The S
P. Paíga et al./Chemical Papers 66 (8) 711–721 (2012) 719
Fig. 4. Representative IR spectrum obtained for soil collected near to a road (sample 9) (a) and GC-FID chromatogram obtainedfor soil collected in the vicinity of an oil refinery (sample 14) (b).
value indicates the level at which the soil and ground-water are considered “clean”. The I value indicates thelevel above which it becomes a risk to human healthand to the environment. The higher values (average)in 25 m3 of soil or 100 m3 of groundwater indicatethat T value is the average value between S and I.The TPH concentration in the samples from gas
stations were higher than the Dutch T alert value andin the samples collected in the vicinity of a refineryTPH concentrations were above the Dutch I interven-tion value. The results in Table 5 also indicate that thesoils collected from a beach and in a farm present nodetectable levels of contamination, confirming classifi-cation of presumed uncontaminated soils. The soil col-lected near to a road showed levels of TPH which didnot attain the Dutch alert value, indicating that thesoil, classified as potentially contaminated, was uncon-taminated but required future monitoring. Finally, thesoils collected within gas stations and in the vicinity ofan oil refinery confirmed the potentially contaminatedstatus accorded and required remediation action.
Conclusions
The present work demonstrates that IR and GC-FID can be considered suitable for detection and quan-tification of TPH in soil samples, considering differentlevels of contamination (ranging from not detectablelevels, in soils collected from a farm and a beach, up to(9230 ± 322) mg kg−1 in soil collected from the vicin-ity of an oil refinery). However, utilisation of IR is notadvisable for soils contaminated with petrol becauseof the volatilisation losses that occur in the analyticalprocess.The IR method presents limits of detection and
quantification of 3 mg kg−1 and 9 mg kg−1, respec-tively; the gas chromatography method present lim-
its of detection and quantification within the rangesof 96 mg kg−1 to 127 mg kg−1 and 321 mg kg−1
to 424 mg kg−1, respectively, depending on the inte-gration method used. Recovery experiments with soilwith high organic matter content using the IR proce-dure provided satisfactory average recovery (around94 %) and the respective standard deviation valueswhich were comparable with those obtained by gaschromatography (higher than 97 %).The volume of solvent used with the GC-FID
method is lower than that used with the IR method,avoiding the use of hazardous solvent (1,1,2-trichloro-1,2,2-trifluoroethane) and reducing cost per analysis.This volume reduction further decreases waste gen-eration and analyst exposure. There are fewer inter-ferences resulting from organic matter content in theGC-FID method and the analytical costs are lowerthan with the IR method, although the GC-FID ismore time-consuming.
Acknowledgements. This work was financially supported byFundacao para a Ciencia e a Tecnologia through Grant PEst-C/EQB/LA0006/2011 and through the Project PTDC/ECM/68056/2006. The authors express their gratitude to Portugueserefinery, Petrogal, S.A. (Oporto, Portugal).
References
American Petroleum Institute (API) (1992). Methods for de-termination of petroleum hydrocarbons in soil. Washington,DC, USA: American Petroleum Institute.
American Petroleum Institute (API) (1994). Interlaboratorystudy of three methods for analyzing petroleum hydrocarbonsin soils (API Publication Number 4599). Washington, DC,USA: American Petroleum Institute.
American Society for Testing and Materials (ASTM) (1997a).Comparison of waterborne petroleum oils by infrared spec-troscopy (D3414). In Annual book of ASTM standards.Philadelphia, PA, USA: American Society for Testing andMaterials.

720 P. Paíga et al./Chemical Papers 66 (8) 711–721 (2012)
American Society for Testing and Materials (ASTM) (1997b).Oil and grease and petroleum hydrocarbons in water(D3921). In Annual book of ASTM standards. Philadelphia,PA, USA: American Society for Testing and Materials.
American Society for Testing and Materials (ASTM) (1997c).Comparison of waterborne petroleum oils by fluorescenceanalysis (D3650). In Annual book of ASTM standards.Philadelphia, PA, USA: American Society for Testing andMaterials.
American Society for Testing and Materials (ASTM) (1997d).Determination of the aromatic content and polynuclear aro-matic content of diesel fuels and aviation turbine fuels by su-percritical fluid chromatography (D5186-96). In Annual bookof ASTM standards. Philadelphia, PA, USA: American So-ciety for Testing and Materials.
American Society for Testing and Materials (ASTM) (1997e).Oil spill identification by gas chromatography and posi-tive ion electron impact low resolution mass spectrometry(D5739–95). In Annual book of ASTM standards. Philadel-phia, PA, USA: American Society for Testing and Materials.
American Society for Testing and Materials (ASTM) (1997f).Comparison of waterborne petroleum oils by gas chromatog-raphy (D3328–90). In Annual book of ASTM standards.Philadelphia, PA, USA: American Society for Testing andMaterials.
American Society for Testing and Materials (ASTM) (1997g).Comparison of waterborne petroleum oils by high perfor-mance liquid chromatography (D5037–90). In Annual bookof ASTM standards. Philadelphia, PA, USA: American So-ciety for Testing and Materials.
American Society for Testing and Materials (ASTM) (1997h).Determination of boiling range distribution of crude petro-leum by gas chromatography D5307-97. In Annual book ofASTM standards. Philadelphia, PA, USA: American Societyfor Testing and Materials.
Annesley, T. M. (2003). Ion suppression in mass spectrometry.Clinical Chemistry, 49, 1041–1044. DOI: 10.1373/49.7.1041.
Burns, K. A. (1993). Analytical methods used in oil spill studies.Marine Pollution Bulletin, 26, 68–72. DOI: 10.1016/0025-326x(93)90093-y.
Current, R. W., & Tilotta, D. C. (1997). Determination oftotal petroleum hydrocarbons in soil by on-line supercriti-cal fluid extraction-infrared spectroscopy using a fiber optictransmission cell and a simple filter spectrometer. Journalof Chromatography A, 785, 269–277. DOI: 10.1016/s0021-9673(97)00466-4.
Daling, P. S., Faksness, L. G., Hansen, A. B., & Stout, S. A.(2002). Improved and standardized methodology for oil spillfingerprinting. Environmental Forensics, 3, 263–278. DOI:10.1080/713848389.
Dumitran, C., Ion, O., & Florinel, D. (2009). Spectroscopy andgas chromatographic measurements of TPH in soil samplescontaminated with crude oil. Revista de Chimie, 60, 1335–1337.
Eide, I., & Zahlsen, K. (2005). A novel method for chemical fin-gerprinting of oil and petroleum products based on electro-spray mass spectrometry and chemometrics. Energy & Fuels,19, 964–967. DOI: 10.1021/ef049743m.
Ge, Z. F., Brown, C. W., & Alberts, J. J. (1995). Infrared fiberoptic sensor for petroleum. Environmental Science & Tech-nology, 29, 878–882. DOI: 10.1021/es00004a007.
Harris, D. C. (2003). Quantitative chemical analysis (6th ed.).New York, NY, USA: Freeman.
Hesse, P. R. (1972). A textbook of soil chemical analysis. NewYork, NY, USA: Chemical Publishing Co.
Krahn, M. M., & Stein, J. E. (1998). Peer reviewed: Assess-ing exposure of marine biota and habitats to petroleum
compounds. Analytical Chemistry, 70, 186A–192A. DOI:10.1021/ac981748r.
Krahn, M. M., Ylitalo, G. M., Buzitis, J., Chan, S. L., &Varanasi, U. (1993). Rapid high-performance liquid chro-matographic methods that screen for aromatic compounds inenvironmental samples. Journal of Chromatography A, 642,15–32. DOI: 10.1016/0021-9673(93)80073-h.
Lambert, P., Fingas, M., & Goldthorp, M. (2001). An eval-uation of field total petroleum hydrocarbon (TPH) sys-tems. Journal of Hazardous Materials, 83, 65–81. DOI:10.1016/s0304-3894(00)00328-9.
Lynn, T. B., Lynn, A. C., & Balog, D. (2002). Analysis of SITEprogram TPH field trial data for SW-846 method 9074 –The PetroFLAG hydrocarbon analyzer. In Proceedings of the10th International On-Site 2002 Conference, January 22–25,2002. San Diego, CA, USA.
Mao, D., Lookman, R., Van De Weghe, H., Weltens, R., Van-ermen, G., De Brucker, N., & Diels, L. (2009). Estimation ofecotoxicity of petroleum hydrocarbon mixtures in soil basedon HPLC–GCXGC analysis. Chemosphere, 77, 1508–1513.DOI: 10.1016/j.chemosphere.2009.10.004.
Miclean, M., Levei, E., Gog, A., Ferenczi, L., Majdik, C., Puia,C., & Roman, C. (2010). Determination of total petroleumhydrocarbons in contaminated soil by FTIR and GC-FIDmethods. Studia Universitatis Babes-Bolyai, Chemia, 55(3),83–91.
Miller, J. C. & Miller, J. N. (2000). Statistics for analyticalchemistry (3rd ed.). Harlow, UK: Pearson Education.
Ministry of Housing, Physical Planning and Environment(VROM) (1987). Soil protection act. Den Haag, The Nether-lands.
Pál, R., Juhász, M., & Stumpf, Á. (1998). Detailed analysisof hydrocarbon groups in diesel range petroleum fractionswith on-line coupled supercritical fluid chromatography–gaschromatography–mass spectrometry. Journal of Chromatog-raphy A, 819, 249–257. DOI: 10.1016/s0021-9673(98)00505-6.
Park, I. S., & Park, J. W. (2011). Determination of a risk man-agement primer at petroleum-contaminated sites: Developingnew human health risk assessment strategy. Journal of Haz-ardous Materials, 185, 1374–1380. DOI:10.1016/j.jhazmat.2010.10.058.
Rauckyte, T., Zak, S., Pawlak, Z., & Oloyede, A. (2010). De-termination of oil and grease, total petroleum hydrocarbonsand volatile aromatic compounds in soil and sediment sam-ples. Journal of Environmental Engineering and LandscapeManagement, 18(3), 163–169. DOI: 10.3846/jeelm.2010.19.
Schreier, C. G., Walker, W. J., Burns, J., & Wilkenfeld, R.(1999). Total organic carbon as a screening method forpetroleum hydrocarbons. Chemosphere, 39, 503–510. DOI:10.1016/s0045-6535(98)00598-0.
Shin, H. S., & Kwon, O. S. (2000). The simultaneous analy-sis of benzene, toluene, ethylbenzene, o, m, p-xylenes andtotal petroleum hydrocarbons in soil by GC-FID after ultra-sonication. Bulletin of Korean Chemical Society, 21, 1101–1105.
Sink, C. W., & Hardy, D. R. (1994). Quantification of compoundclasses in complex mixtures and fuels using HPLC with dif-ferential refractive index detection. Analytical Chemistry, 66,1334–1338. DOI: 10.1021/ac00080a020.
Tang, L., & Kerbarle, P. (1993). Dependence of ion intensityin electrospray mass spectrometry on the concentration ofthe analytes in the electrosprayed solution. Analytical Chem-istry, 65, 3654–3668. DOI: 10.1021/ac00072a020.
United States Environmental Protection Agency (USEPA)(1978). Test method for evaluating total recoverable petro-leum hydrocarbons (Spectrophotometric, Infrared) (Method418.1). Washington, DC, USA: U.S. Government PrintingOffice.

P. Paíga et al./Chemical Papers 66 (8) 711–721 (2012) 721
United States Environmental Protection Agency (USEPA)(1996a). Turbidimetric screening method for total recover-able petroleum hydrocarbons in soil (Method 9074). Wash-ington, DC, USA: U.S. Government Printing Office.
United States Environmental Protection Agency (USEPA)(1996b). Total petroleum hydrocarbons (TPH) as gasolineand diesel (Method 8015B). Washington, DC, USA: U.S.Government Printing Office.
United States Environmental Protection Agency (USEPA)(1996c). Total recoverable petroleum hydrocarbon by infraredspectrophotometry (Method 8440). Washington, DC, USA:U.S. Government Printing Office.
United States Environmental Protection Agency (USEPA)(1998). n-Hexane extractable material (HEM) for sludge,sediment, and solid samples (Method 9071B). Washington,DC, USA: U.S. Government Printing Office.
Wang, Z. D., & Fingas, M. (1997). Developments in the anal-ysis of petroleum hydrocarbons in oils, petroleum prod-ucts and oil-spill-related environmental samples by gas chro-matography. Journal of Chromatography A, 774, 51–78. DOI:10.1016/s0021-9673(97)00270-7.
Wang, Z. D., & Fingas, M. F. (2003). Development of oil hy-drocarbon fingerprinting and identification techniques. Ma-rine Pollution Bulletin, 47, 423–452. DOI: 10.1016/s0025-326x(03)00215-7.
Wang, Z. D., Fingas, M., & Page, D. S. (1999). Oil spill identi-fication. Journal of Chromatography A, 843, 369–411. DOI:10.1016/s0021-9673(99)00120-x.
Wang, S. J., Guo, G. L., Yan, Z. G., Lu, G. L., Wang, Q. H.,& Li, F. S. (2010). The development of a method for thequalitative and quantitative determination of petroleum hy-drocarbon components using thin-layer chromatography withflame ionization detection. Journal of Chromatography A,1217, 368–374. DOI: 10.1016/j.chroma.2009.11.022.
Wright, K. A. (1995). Evaluation of a new field test kit fordetermining total petroleum hydrocarbon concentrations insoil at a site contaminated by diesel fuel. In Proceedings ofthe AEHS Conference on Hydrocarbon Contaminated Soils,January 11–13, 1995. New Orleans, LA, USA.
![Novel Strategy for Electroanalytical Detection of ... · injection potentiometry [14], spectrophotometry [15, 16], HPLC [17-20], gas chromatography [21, 22], ... produced by Sigma-Aldrich](https://static.fdocuments.in/doc/165x107/6060726f48a60d5a4b60920d/novel-strategy-for-electroanalytical-detection-of-injection-potentiometry-14.jpg)