
Determination of the Solid-liquid-Vapor Triple Point...
47
SAN 076-0074 Unlimited Release Determination of the Solid-liquid-Vapor Triple Point Pressure of Carbon David M. Haaland SF 2900 0(7 -73) When printing a copy of any digitized SAND Report, you are required to update the markings to current standards.
Transcript of Determination of the Solid-liquid-Vapor Triple Point...

SAN 076-0074 Unlimited Release
Determination of the Solid-liquid-Vapor Triple Point Pressure of Carbon
David M. Haaland
SF 2900 0(7 -73)
When printing a copy of any digitized SAND Report, you are required to update the
markings to current standards.

Issued by Sandia Laboratories, operated for the United States Energy Research and Development Administration by Sandia Corporation.
NOTICE This report was prepared as an account of work sponsored by the United States Government. Neither the United States nor the United States Energy Research and Development Administration, nor any of their employees, nor any of their contractors, subcontractors, or their employees, makes any warranty, express or implied, or assumes any legal liability or responsibility for the accuracy, completeness or usefulness of any information, apparatus, product or process disclosed, or represents that its use would not infringe privately owned rights.
Printed in the United States of America Available from
National Technical Information Service U. S. Department of Commerce 5285 Port Royal Road Springfield, VA 22151 Price: Printed Copy $5.00
Microfiche $2.25
· ,

SAND 76-0074 Unlimited Release
DETERMINATION OF THE SOLID-LIQUID-VAPOR TRIPLE POINT PRESSURE OF CARBON*t
January 1976
David M. Haaland Division 5825
Sandia Laboratories Albuquerque, NM 87115
ABSTRACT
A detailed expe'1'imental study of the triple point p'1'eSSU'l'e of carbon
using laser heating techniques has been completed. uncertainties and con
flicts in previous investigations have been add'1'essed and substantial data
presented which p laces the so lid-liquid-vapo'1' carbon trip le point at 10? ± 2
atmosphe'1'es (10.8 ± 0.2 MPa). This is in agreement with most investigations
which have located the triple point preSSU'l'e between 100 and 120 atmospheres
(10 to 12 MPa), but is in disag'1'eement with recent low pressure ca'1'bon
experiments. The absence of any significant polymorphs of carbon other than
g'1'aphite suggests that the g'1'aphite-liquid-vapor triple point has been mea
sU'l'ed.
G'1'aphite samples were melted in a preSSU'l'e vessel using a 400 W Nd:YAG
continuous-UJave laser focused to a maximwn powe'1' density of - 80 KW / cm2 .
Melt was confi'1'med by detailed micros.t'l'UctU'l'e analysis and x-roy diffraction
of the '1'ecrystallized g'1'aphite. Experiments to dete'1'mine the minimwn melt
p'1'eSSU'l'e of carbon were completed as a function of sample size, type of inert
gas, and laser powe'1' density to aSSU'l'e that: 1) laser power densities we'1'e
sufficient to p'1'oduce melt at the triple point p'1'eSSU'l'e of carbon and 2) the
p'1'eSSU'l'e of ca'1'bon at the sU'l'face of the sample was identical to the measU'l'ed
preSSU'l'e of the ine'1't gas in the p'1'essU'l'e vessel.
High-speed colo'1' cinematog'1'aphy of the ca!'bon heating '1'evealed the pre
sence of a lase'1'-generoted vapO'1' 0'1' pa'1'ticle plume in f'1'ont of the sample.
The existence of this bright plume p'1'evented the meaSU'1'ement of the carbon
triple point tempe'1'atU'l'e.
*This work was supported by the U.S. Energy Research & Development Admin.
tPortions of this work were presented at the 12th Biennial Conf. on Carbon, U.of Pittsburgh,PA, 28 Jul-l Aug, 1975 and appeared in the 12th Biennial Conference on Carbon, Extended Abstracts and Program, p. 51.
3-4
CONTENTS
I. Introduction
II. Experimental Apparatus and Procedures
III. Results and Discussion
Confirmation of Melt
Laser Irradiation and Temperature Measurements
Triple Point Pressure
Polymorphs of Carbon
IV. Conclusions
Appendix A
Appendix B
Appendix C
References
Acknowledgments
Page
9
14
20
20
23
27
33
34
35
39
42
44
.48
5

Figure
1
2
3
4
5
6
7
6
FIGURES
Diagram of pressure vessel used in carbon melting experiments.
Schematic diagram of experimental apparatus.
Laser cratered rod of pyro1ytic graphite showing droplet of recrystallized melt at the bottom of the crater (147 atm Ar).
Microstructure of recrystallized melt at the bottom of the crater. The growth cones of the original pyro1ytic graphite are evident underneath the droplet (147 atm Ar).
Microstructure of pyrolytic graphite heated with the laser at maximum power density but below the carbon triple point (105 atm Ar).
X-ray powder diffraction patterns of the original pyrolytic graphite samples (top), vapor deposits of carbon surrounding the crater of a laser heated sample (middle), and recrystallized melt from the bottom of the crater (bottom).
Representative pyrometer output as a function of time. Note that pyrometer output is non-linear with temperature and is not sensitive to temperatures below 2500K. Temperatures are brightness temperatures corrected for fused silica windows. Sample was 1.5 mm d:Lameter pyrolytic graphite in 147 atm argon irradiated at - 35 KW/cm2•
15
16
21
21
22
24
26

Table
I
II
III
IV
TABLES
Triple Point Data For Carbon
Impurities Present in HPG Pyro1ytic Graphite
Results of Carbon Melting Experiments
Results of Carbon Melting Experiments
Page
10
17
28
29
7-8
I. Introduction
The triple point of carbon has received considerable attention
throughout this century with controversy often surrounding the subject.
Before the work of Bassettl ,2 in 1939, the debate focused on whether
carbon melted or sublimed at atmospheric pressure. Bassett made the
first effort to quantitatively determine the triple point pressure
of carbon. His data led him to conclude that a pressure of ~ 102 atm
(~ 10.3MBa) was required before carbon would melt. After the publica
tion of these results, more than half a dozen additional investiga
tions3-12 have also resulted in the conclusion that the triple point
pressure of carbon was between 100 and 120 atm (10 and 12 MPa) with the
triple point temperature determinations ranging between 3670 K and
* 4300 K. (These results and others are given in detail in Appendix A
and summarized in Table I.) However, theoretical calculations based
on extrapolated carbon vapor pressures and thermodynamic functions
have indicated that the vapor pressure of carbon does not reach 100 atm
(10 MBa) until temperatures of 4570-5200 K are achieved. 13- 15 The
most recent estimate is 4765 K.14 Clearly, the theoretical predictions
and experimental values are not in agreement. Recently, Whittaker
et al. 16 ,17 offered a possible resolution of this conflict by presenting
controversial evidence that the carbon triple point pressure was less
than one atmosphere.
In addition to the general lack of experimental precision and the
conflicts between experiment and theory, a number of difficulties and
uncertainties persist with the previous data. A major assumption
that has been made in the past carbon triple point work is that the
vapor pressure of carbon is equal to the pressure of the gas used to
pressurize the system. This is required since it is the pressure of
carbon vapor at the surface that defines the triple point pressure,
not the pressure of the inert gas in the chamber. Thus it has generally
*Fateeva et al. 7 originally reported a carbon triple point temperature of 4650 K. Later they corrected their value to 4040 K,~ stating that the earlier temperature was in error due to improper pyrometer filter correction.
9

10
TABLE I. TRIPLE POINT DATA FOR CARBON
Pressure Investigator (Year)
Heating Method
Pressurizing Gas (atm) Temp (K)
1 2 Bassett '
Stein1e3
Jones 4
Noda5 ,6
Fateeva 7 et a1.
Fateeva 9 et a1.
10 Schoessow
Diaconis11 et al.
12 Gokcen
1939
1940
1958
1959
1971
1976
Resistive
Resistive
Resistive
Resistive
Resistive
Ar
Ar, N2
Ar
Ar
Ar
Resistive Ar
Resistive He
Resistive & Arc Image Ar, N2
HF Laser Ar, Ne, Kr
102
100
100
110-120
100 ± 10
4000
3670
3840
4020
4650
100 4040
103 4180-4300
102 4100-4300
120 ± 10 4130
Whittaker 17 & Kintner 1975 CO 2 Laser Ar 0.19 3870
Haaland (this work)
Theoretical
Palmer &13 Shelef
Leider 14 et al.
1975 Nd:YAG Laser Ar, He 107 ± 2
Assumed Calculated Method Pressure
(atm)
1961 Extrapolated Total Vapor Pressure 100
1968 Vapor Pressure Data Analysis 100
1973 New Thermal Furnctions, Heats of Formation, New Vapor Pressure Analysis
103
Temperature (K)
5200
4570

been assumed, but not previously confirmed, that the minimum melt
pressure determined from the inert gas pressure is identical to the
triple point pressure of carbon. For the carbon vapor pressure to be
equal to the gas pressure, the rate of vaporization must exceed the
transport of carbon away from the sample surface. If this is not the
case, then the measured minimum pressure for melt is only an upper
limit for the triple point pressure. Considerable effort was made in
this work to confirm that the carbon vapor pressure was identical to
the pressure of the inert gas.
Another point of concern with some of the previous investigations
is the method of determining whether melting had occurred. All inves
tigators have used. the observation of the sample after it had cooled
to prove the presence of melt. Most of these involved only a visual
observation of the sample surface. However, Steinle3 has shown that
vapor deposited carbon can exhibit flow patterns and external appear
ances that are generally characteristic of resolidified melt. There
fore, surface examination of the samples can lead to ambiguous results.
SchoessowlO did section his samples and view them with optical micros
copy but gives no information about the microstructure observed nor
did he use the microstructure as a criterion for confirming recrystal
lized melt. Dianconis et al. ll present the only details regarding
the detailed microstructure of the recrystallized melt. Using polarized
light microscopy to achieve greater structural detail and contrast in
sectioned and polished samples, Diaconis et al. were able to easily
distinguish between recrystallized melt and vapor deposited carbon.
The recrystallized material was a low density structure of large,
randomly oriented graphite crystallites. The vapor deposited mater-
ial was distinguished as a very fine crystalline material character
istic of nucleation and condensation from a vapor. Several investi
gators3,5,6,l8 have also completed x-ray analysis of the recrystal-
lized melt and observe a sharpening of the diffraction lines and a
reduction in d-spacing implying larger and more ordered crystallites
than present in the original carbon or the vapor deposited material.
Although the narrowing of the diffraction lines appears to be a
11

12
necessary condition for confirming melt, apIRrently it is not a suffi
cient condition since stress-annealed pyrolytic graphite exhibits the same
sharp diffraction without being taken through the liquid phase.19
Other uncertainties may arise from the use of resistance heating to 20
achieve carbon melt. Margrave points out that the heats of SUblimation
of carbon ions (C-) are smaller in absolute magnitude than those of the n
corresponding neutral carbon species (C). Thus resistive heating, which n
supplies a large number of electrons, could result in C - (rather than n
C ) becoming significant equilibrium vapor species at high temperatures. n
Margrave suggests that laser heating be used to resolve this problem.
Laser heating also has the advantage that energy is supplied to the sur
face of the sample. steady-state resistive heating tends to heat carbon
internally with the possibility of producing additional pressure grad
ients because of the greater thermal expansion within the interior of the
sample.
Further uncertainties in previous triple point work arise from the
absence of detail presented concerning the pressure measurement methods
or their accuracy. It appears that there has been a general lack of
attention paid to accurately determining carbon triple point pressure.
Naturally, after the work of Bassett, most efforts were centered on
temperature rather than pressure. To facilitate temperature measurements,
large samples and small pressure vessel volumes were used. Thus large 4
pressure excursions were experienced during the heating cycle. Jones
reports a factor of two increase in pressure during his carbon melting
experiments whereas no mention of the magnitude of pressure increase
is made by other investigators. Even in the few cases where pressure
was continuously monitored, the accuracy of determining minimum melt
pressure with this situation is greatly decreased if pressure increases
are significant. B.v keeping the pressure rise small, the triple point
pressure error range can be narrowed considerably.
The previous triple point pressure measurements also suffer in
that there has been no effort made to confirm that sufficient power
is deposited in the sample to assure that the minimum melt pressure
is not power limited. Because the vaporization rate of carbon increases

as the external gas pressure decreases, significant additional vapor
ization heat loses can occur if the applied pressure is decreased. If
sufficient power is not supplied to the sample, abnormally high pres
sures may be required to melt the carbon. Under these conditions, the
experimentally determined minimum melt pressure would only be an upper
limit to the triple point pressure and would be a fUnction of power
deposition.
Finally, a number of errors or uncertainties can and do arise in
experimentally measuring the temperature. Emissivity corrections in
this temperature range are in dispute for carbon. 2l- 24 It has been
suggested24
that particle emission from hot graphite can influence
emissivity as well as obscure the surface of the heated sample. Using
a simulated black-body cavity, SchoessowlO eliminated some, but not all
of these problems as discussed in Appendix A. Carbon vapor and dense
convection currents can also effect temperatures by preventing a clear
optical path. The above problems have tended to put a lower limit on
the measured temperatures.
The research presented in this paper was initiated to resolve these
problems and uncertainties and to better define the triple point of
carbon.

14
II. Experimental Apparatus and Procedures
The pressure vessel used (Fig. 1) was a modified one-liter Autoclave
Engineers' vessel with 3 fused silica windows placed along a horizontal
circumference of the vessel body at the level of the sample and spaced
at 45° intervals. This arrangement pennitted simultaneous normal laser
heating, optical pyrometry at 45°, and high-speed color cinematography
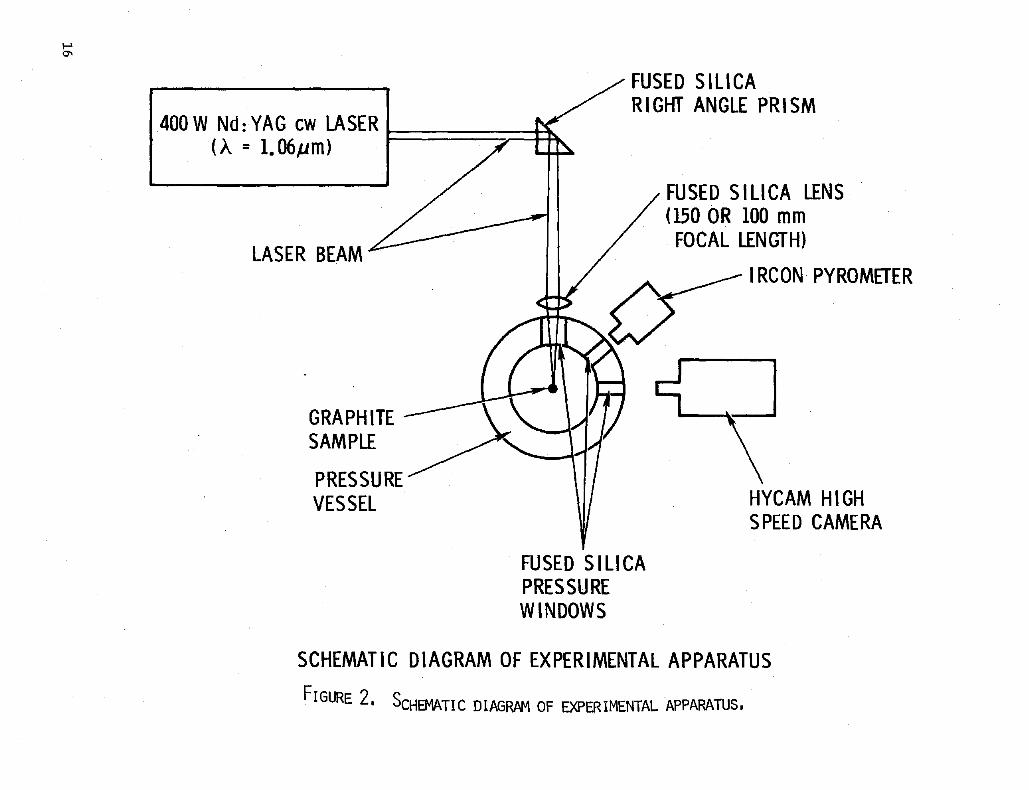
at 90°. Fig. 2 presents a schematic diagram of the apparatus. The
silica pressure windows were shielded from carbon deposition by fused
silica slides placed between the sample and windows. These slides
prevented damage to the laser window and facilitated window cleaning
and maintenance. Matheson prepurified grade argon (99.998% min.) or
Matheson ultrahigh purity helium (99.999% min.) were used to pressurize
the vessel in all melt experiments.
The carbon samples were rods of graphite 12 mm long and 0.75 mm
to 2.5 mm in diameter. Each rod was suspended vertically in the pressure
vessel with the laser beam irradiating the rod perpendicular to its
axis. Samples of Union Carbide HPG pyrolytic graphite, Union Carbide
SPK spectroscopic graphite electrodes, and Poco grade AXF-Ql graphite
were used. The vessel was constructed so that the samples could be
raised, lowered or rotated while in place. The pyrolytic graphite rods
were machined such that the axis of the rods was the c-axis of the
pyrolytic graphite. B,y irradiating only the edges of the basal planes
with the laser, heating was confined to a narrow disc on the rod due to
the low thermal conductivity along the c-axis. Thus radiative and
conductive heat losses were held to a minimum for these samples. The
impurity levels for the HPG material as determined by emission spec
troscopy are given in Table II.
Heating of the carbon samples was accomplished with a Holobeam
(model 2500-4 R) 400 watt Nd:YAG continuous-wave laser (1.06 pm wave
length) focused by means of 100 mm or 150 mm focal length lenses onto
the lower portion of the graphite rod. Power densities were approxi
mated by assuming that the crater dimension along the c-axis was
representative of the laser spot diameter. It was also assumed that
the power distribution across the spot was uniform rather than gausian

I-' VI
GRAPH ITE SAMPLE
SAMPLE HOLDER ROD
LASER BEAM STOP
PRESSURE VESSEL COVER
FUSED SILICA SLI DES FOR HIGH PRESSURE WINDOW PROTECTION
FUSED SILICA PRESSURE WINDOW
PRESSURE VESSEL BASE
FIGURE I. DIAGRAM OF PRESSURE VESSEL USED IN CARBON MELTING EXPERIMENTS.
f-' a-
FUSED SILICA RIGHT ANGLE PRISM
400 W N d : Y A G cw LA SE R I I ' (A = 1.06,um) -' A
LASER BEAM
GRAPHITE SAMPLE
PRESSURE VESSEL
FUSED SIll CA PRESSURE WINDOWS
FUSED SIll CA LENS (150 OR 100 mm
FOCAL LENGTH)
I RCON PYROMETER
HYCAM HIGH SPEED CAMERA
SCHEMATIC DIAGRAM OF EXPERIMENTAL APPARATUS
FIGURE 2. SCHEMATIC DIAGRAM OF EXPERIMENTAL APPARATUS.

TABLE II
IMPURITIES PRESENT IN HPG PYROLYTIC GRAPHITE
Impuritz EEm-wt
B .02
Fe .2-2
Si 3
Cu I
Ca I
Al I
H <5
17

18
since the laser was operated in a multi-mode configuration. Both
these assumptions tend to minimize the maximum laser power density cal
culated. Operating at the maximum laser power of 400 W, the calculated
maximum power densities achieved were ~ 80 KW/cm2
and ~ 35 Kw/cm2
with
the 100 and 150 mm lenses respectively. Lasing time was controlled
automatically with an Industrial Timer Corp. t~e A tandem recycling
timer. Laser power was monitored with a Coherence model no. 213
calorimeter with a ± 5% accuracy. The laser power could be decreased
without changing beam divergence with the introduction of an Isomet
Te02
acoustic-optic beam modulator. 25
The temperature was continuously measured during the heating cycle
with an Ircon Modline 2000 series pyrometer with a 0.01 second response
time and a wavelength sensitivity range of 0.7-0.9 iJIl. A special
0.98 ~m cut-off filter was used to prevent interference from reflected
laser radiation. Because of the small ~ inch (0.65 cm) diameter aper
ture of the fused silica window, the pyrometer was fitted with an inter
nal aperture to prevent the small window from limiting the field of
view. Calibration of the pyrometer was made with and without the
aperture USing a Thermogauge double entry graphite tube furnace as a
black-body source and calibrating the Ircon against a model 8640 Leeds
and Northrup automatic optical pyrometer. The effective emissivity
(A-factor) of the aperture was determined and found to be constant within
experimental error. The pyrometer was focused at the level of laser
irradiation to a spot size which was _ 1/3 to 1/2 the rod diameter. Its
output was then recorded on a fast response Hewlett-Packard 7402 A
strip-chart recorder.
High-speed motion pictures of the heating event were taken with a
Hycam camera operated at ~ 1000 frames (with a f'rame exposure time of
0.4 ms). The film used was Kodak 16 mm Ectachrome EF in 100 ft. rolls.
Oriel neutral density filters were often used to obtain proper exposure
intensity.
Pressure was continually monitored to within 0.3% with a Teledyne
Taber 2101 pressure transducer. Because the volume of the pressure
vessel was large and the sample size small, the pressure rise during

the carbon heating was only 0.2 - 1.0 atro (0.02 - 0.1 MFa) depending
upon laser heating time. The output of the transducer was also
recorded on the Hewlett-Packard 7402A strip chart recorder.
After placing the sample in the pressure vessel and aligning it
in the focal spot of the focused laser beam, the vessel was evacuated
and backfilled to several atmospheres with inert gas. To eliminate
traces of residual air, this gas was then pumped out to a chamber
pressure of <10 U and the vessel filled with inert gas to the desired
pressure. The laser was fired for the time required to crater 60-90%
through the sample so that the measured temperature either reached a
maximum or constant value. The laser was focused _ 1 rom from the
bottom of the sample to minimize the conduction of heat down the rod.
The chamber pressure and sample temperature were continuously monitored
during each experiment.
Frequently the heating event was recorded with high-speed cine
matography at 45° or 90° to the incident laser beam. After irradiation,
the sample was removed and viewed under an optical microscope for
evidence of melt. To confirm melt, the samples were often potted,
sectioned, polished and viewed under polarized light to obtain the
detailed microstructure of the material. In addition, samples were
selected for x-r~ and electron diffraction to monitor changes in
structure and to search for the presence of carbon polymorphs.
Because pressure excursions during heating were as great as
1.0 atm (0.1 MFa), the minimum melt pressures were determined by
lowering the pressure in 2 atro steps. This would place the accuracy
of these determinations at ± 2 atro (± 0.2 MFa) even though the pres
sures were measured and reproduced accurately to 0.3 atro (0.03 MFa).
19
20
III. Results and Discussion
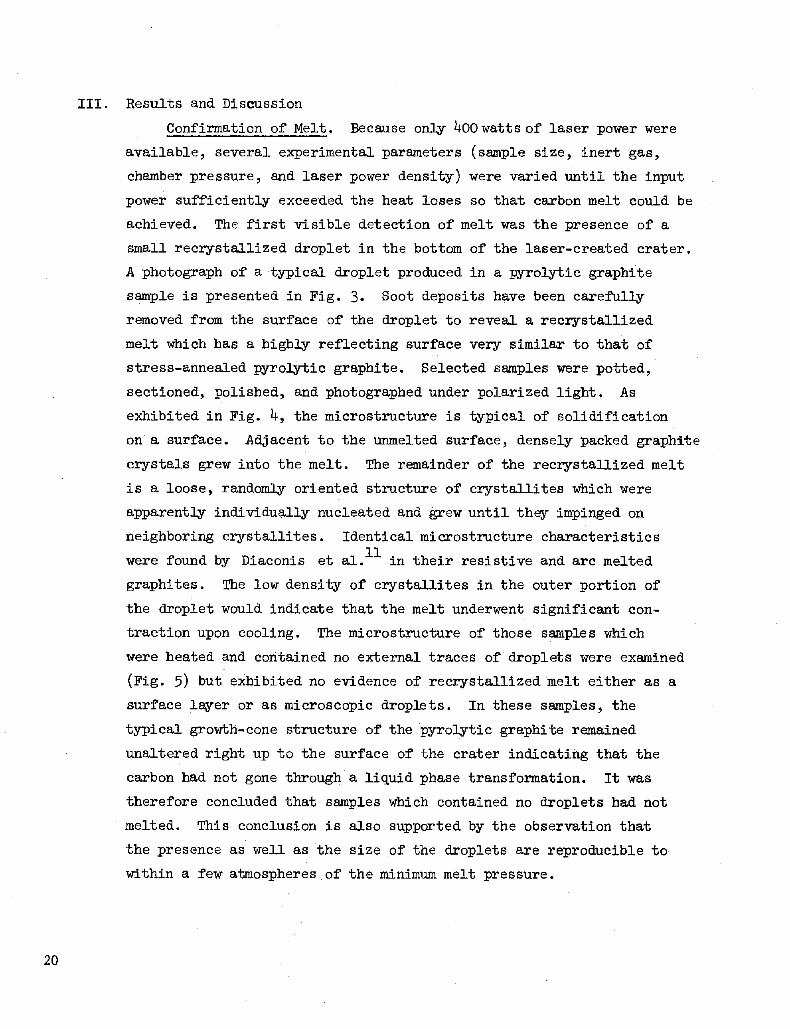
Confirmation of Melt. Because only 400 watts of laser power were
available, several experimental parameters (sample size, inert gas,
chamber pressure, and laser power density) were varied until the input
power sufficiently exceeded the heat loses so that carbon melt could be
achieved. The first visible detection of melt was the presence of a
small recrystallized droplet in the bottom of the laser-created crater.
A photograph of a typical droplet produced in a pyrolytic graphite
sample is presented in Fig. 3. Soot deposits have been carefully
removed from the surface of the droplet to reveal a recrystallized
melt which has a highly reflecting surface very similar to that of
stress-annealed pyrolytic graphite. Selected samples were potted,
sectioned, polished, and photographed under polarized light. As
exhibited in Fig. 4, the microstructure is typical of solidification
on a surface. Adjacent to the unmelted surface, densely packed graphite
crystals grew into the melt. The remainder of the recrystallized melt
is a loose, randomly oriented structure of crystallites which were
apparently individually nucleated and grew until they impinged on
neighboring crystallites. Identical microstructure characteristics
were found by Diaconis et al. ll in their resi sti ve and arc mel ted
graphites. The low density of crystallites in the outer portion of
the droplet would indicate that the melt underwent Significant con
traction upon cooling. The microstructure of those samples which
were heated and contained no external traces of droplets were examined
(Fig. 5) but exhibited no evidence of recrystallized melt either as a
surface l~er or as microscopic droplets. In these samples, the
typical growth-cone structure of the pyrolytic graphite remained
unaltered right up to the surface of the crater indicating that the
carbon had not gone through a liquid phase transformation. It was
therefore concluded that samples which contained no droplets had not
melted. This conclusion is also supported by the observation that
the presence as well as the size of the droplets are reproducible to
within a few atmospheres of the minimum melt pressure.

Figure 3. Laser cratered rod of pyrolytic graphite showing droplet of recrystallized melt at the bottom of the crater (147 atm Ar).
I.Omm
O.lmm
Figure 4. Microstructure of recrystallized melt at the bottom of the crater. The growth cones of the original pyrolytic graphite are evident underneath the droplet (147 atm Ar).
21

0 .1 mm
Figure 5. Microstructure of pyrolytic graphite heated with the laser at ma ximum power density but below the carbon triple poi nt (105 atm Ar) . Note the unaltered growth- cone structure continuing to the surface of the crater.

Additional con~irmation that the droplets are recrystallized melt
rather than vapor deposited material is supplied by the x-ray powder
dif~action patterns obtained from the droplets. The recrystallized
melt showed considerable sharpening of the dif~action lines as com
pared to both the original material and the vapor deposits demonstra
ting that the melt recrystallized into large, ordered crystallites.
Representative dif~action patterns of the original carbon, vapor
deposit around the crater, and recrystallized melt are given in
Fig. 6. The powder dif~action patterns of natural graphite and
stress-annealed pyrolytic graphite were also obtained. These two
powder patterns and those of recrystallized melt were identical with
respect to d-spacings. With eu K radiation, indexed lines were a
subjected to a least-squares routine in which the lattice constants
a = 2.46 A and c = 6.72 A were obtained. Because of the methods o 0
employed here, the difference between these values and those found
by Noda6 ~or recrystallized melt and natural graphite (a = 2.461 A o 0
and c = 6.708 A) should not be construed as being significant. o Laser Irradiation and Temperature Measurements. Several hundred
carbon melting experiments were performed under a variety of experi
mental conditions. Initially each sample received several separate
laser.heatings along its length by raising or lowering the sample
within the pressurized vessel. However, laser heating subsequent
to the first irradiation resulted in lower measured temperatures
o~en accompanied by larger than normal pressure excursions. It is
possible that soot particles or outgassed impurities initiated a gas
breakdown within the intense electric field of the focused laser
beam. The resultant ionized gas in front of the sample could then
absorb a portion of the laser energy and limit the amount of power
delivered to the sample. This gas breakdown phenomenon has been 26-30
observed often in the past, but has generally been shown to
require greater laser power densities than available here. However,
high pressures,27,28 small particles,30 impurities26 and hot sur
faces29 are all known to decrease the required initiation power
densities. In any case, this difficulty was alleviated by limiting
23

·'-'> .,.. , .'
Original sample
Vapor Deposited Carbon
Recrystallized :1elt .' II} ,. . : . .-.
-- ',,,-- .. _.: .,~" .' •
~ -"n", 'JI "f.!' 'IE ~ .• ~ '/fr~,'::
~ II", :,~;"ltlf 1:3: 1."'--.,' \, ,;:u ~ '01,> .. ,< ,...~"
Figure 6. X-ray powder diffraction patterns of the original pyrolytic graphite samples (top), vapor deposits of carbon surrounding the crater of a laser heated sample (middle), and recrystallized melt from the bottom of the crater (bottom).

each sample to only one laser heating and implementing an efficient gas
purging system before and after each experiment.
However, the pyrometrically determined temperatures still showed
considerable variation (_ 4000 K to ~ 5500 K), and it was concluded
that the temperature~ were not those strictly representative of the
sample surface but rather were dominated by the dense plume in front
of the graphite rod at the high pressures. This conclusion is supported
by several observations. High-speed motion photography of the heating
event showed that, over the wavelength sensitivity of the film, the
plume obscured the surface of the samples •. BY photographing the event
with neutral density filters spanning a thousand-fold intensity var
iation, it was assured that the observations were not a result of film
saturation. (Films taken during laser heating at one atmosphere do,
however, show that the sample surface is visible with less interference
from the diffuse plume.) It was also observed that the temperatures
measured in argon were consistently higher than those in helium. This
would be expected of a vapor or particle plume cooled to a greater
extent in helium because of the higher thermal conductivity of helium.
Finally, at the instant the laser beam was turned off, the temperature
often showed a very rapid decrease followed by a slow rise before
finally cooling to room temperature (Fig. 7). This is most readily
explained in terms of a vapor plume rapidly cooling and condensing to
form a soot which effectively blocks the pyrometer's view of the sample.
This soot is quickly carried out of the field of view by convection
exposing the hot sample to the pyrometer. BY extrapolating the slow
temperature decay curve to time = 0, it was hoped that the interfering
effects of the plume could be eliminated and the actual temperature
of the sample estimated at the instant the laser was shut off. How
ever, the temperature extrapolations were quite large (~ 1000 K) and
exhibited significant variability. Extrapolations were very sensitive
to the method of extrapolation as well. Because the dominant heat loss
mechanisms and the thermal properties of carbon vary with temperature,
no simple and unified functional form of the cooling curves could be
relied upon as providing a basis for the extrapolations. The varia
bility encountered and the large extrapolations required made any
further analysis of the cooling curves unwarranted.
25

N
'"
-~ I.J.J e::: :::::> ~ e::: I.J.J a..
LASER OFF
:E I I !~ ~ 24850 L O. 2 O~ 4 O~ 6 0.8 1. 0
TIME (seconds)
Figure 7. Representative pyrometer output as a function of time. Note that pyrometer output is non-linear with temperature and is not sensitive to temperatures much below 2500K. Temperatures are brightness temperatures corrected for fused silica windows. Sample was 1.5 ~ diameter pyrolytic graphite in 147 atm argon irradiated at - 35 KW/cm .
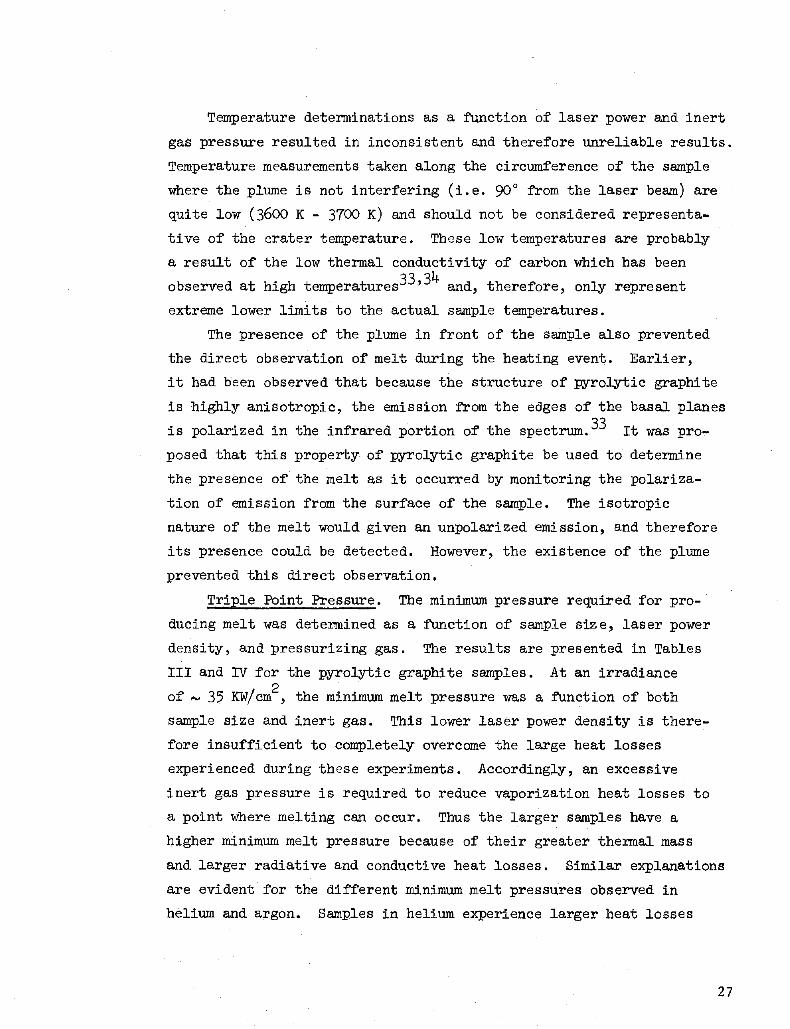
Temperature determinations as a function of laser power and inert
gas pressure resulted in inconsistent and therefore unreliable results.
Temperature measurements taken along the circumference of the sample
where the plume is not interfering (i.e. 90° from the laser beam) are
quite low (3600 K - 3700 K) and should not be considered representa
tive of the crater temperature. These low temperatures are probably
a result of the low thermal conductivity of carbon which has been
observed at high temperatures33 ,34 and, therefore, only represent
extreme lower limits to the actual sample temperatures.
The presence of the plume in front of the sample also prevented
the direct observation of melt during the heating event. Earlier,
it had been observed that because the structure of pyrolytic graphite
is highly anisotropic, the emission from the eoges of the basal planes
is polarized in the infrared portion of the spectrum. 33 It was pro
posed that this property of pyrolytic graphite be used to determine
the presence of the melt as it occurred by monitoring the polariza
tion of emission from the surface of the sample. The isotropic
nature of the melt would given an unpolarized emission, and therefore
its presence could be detected. However, the existence of the plume
prevented this direct observation.
Triple Point Pressure. The minimum pressure required for pro
duCing melt was determined as a function of sample size, laser power
density, and pressurizing gas. The results are presented in Tables
III and IV for the pyrolytic graphite samples. At an irradiance
of ~ 35 KW/cm2, the minimum melt pressure was a function of both
sample size and inert gas. This lower laser power density is there
fore insufficient to completely overcome the large heat losses
experienced during these experiments. Accordingly, an excessive
inert gas pressure is required to reduce vaporization heat losses to
a point where melting can occur. Thus the larger samples have a
higher minimum melt pressure because of their greater thermal mass
and larger radiative and conductive heat losses. Similar explanations
are evident for the different minimum melt pressures observed in
helium and argon. Samples in helium experience larger heat losses
27

28
TA B L E III
RESULTS OF CARBON MELTING EXPERIMENTS
I nert Gas
Argon
Helium
---- ---- --- - - 2 laser Power Density-35 KW!cm
Minimum Melt Pressure
l. 0 mm sample diameter
109 atm
130 atm
l. 5 mm sample diameter
111 atm

TAB L E IV
RESUL TS OF CARBON MELT I NG EXPER I MENTS
I nert Gas
Argon
Helium
laser Power Density "-' 80 KW/c~'r ..... -
Mi ni mu m Melt Pressure
1. 0 mm sample diameter
107 atm
107 atm
1.5 mm sample diameter
107 atm
111 atm
29

30
due to the greater thermal conductivity of helium (see Appendix B
for calculations of the relative convective heat losses in helium
and argon). Samples in helium can also suffer higher vaporization
heat losses due to the greater diffusion of carbon vapor through
helium (see Appendix C for relative diffusion coefficients of carbon
vapor in helium and argon). It is to be emphasized that these results 2
at 35 KW/cm are a direct result of insufficient laser power density.
This was confirmed by increasing the power density to
-80K}l/cm2
(100 mm focal length lens) and observing that the minimum
melt pressure of the two sample sizes (1.0 and 1.5 mm diameter) con
verge to 107 atmospheres (10.8 MFa). Thus, at 80 KW/cm2 sufficient
power density is delivered to overcome heat losses in each sample.
In the previous literature, the inert gas pressure associated
with the minimum melt pressure has been assumed to be the carbon
triple point pressure. However, for this to be the case, the pres
sure of carbon vapor at the surface of the sample must be identical
(within experimental error) to that of the inert gas. As mentioned
earlier this will be true only if the rate of vaporization exceeds
the rate of transport of carbon away from the surface. Under these
conditions, the partial pressure of the inert gas at the sample sur
face is negligible. However, if vapori zation does indeed exceed
the transport of carbon vapor away from the sample, then the carbon
transport may be domi~ted by the bulk motion of carbon vapor rather
than by diffusion. If this is the case, the possibility of local
non-equilibrium pressure excursions exists. An estimate of these
pressure excursions can be obtained from the modified Knudsen-Lang
muir equation derived by Lundell and DiCkey.34 This equation relates
the mass loss rate to the maximum pressure excursions.
i.e. p - p = npl2rrRT/M I v p e
(1)
where p is the equilibrium vapor pressure of all carbon vapor species v
at temperature T, Pp is the partial pressure of the carbon vapor species
at the sample surface, m is the mass loss rate of carbon per unit area,
and M is the effective molecular weight of the carbon vapor species. e

Since we are considering the case where bulk motion of the carbon
vapor is sweeping all ambient inert gas species aWSlf from the carbon
surface, the partial pressure of carbon vapor,
* simply the static pressure of the inert gas.
p , at the surface is p
Therefore p - p v p represents the maximum pressure above ambient that can be achieved.
In deriving the Eq. (1), Lundell and Dickey have assumed unit vapor-
ization coefficients for all carbon vapor species. This should be
a good approximation only if p -p is small relative to p. If this v P v
is the case, the high-pressure inert gas will act as a slightly porous
container for the carbon vapor. Knudsen cell conditions are then
approximated and vaporization coefficients should approach unity. At
the maximum vaporization rates of ~ 0.65 g/cm2sec encountered in these
experiments, the pressure excursion calculated from Eq. (1) is
< 0.18 atm « 0.018 MFa). Even ~th the vaporization coefficients
reported in Ref. 13 for free vaporization conditions, the calculated
pressure excursion is still only 1.4 atm (0.14 MPa) which is less
than the ± 2 atm (0.2 MFa) experimental uncertainty reported here.
It is therefore concluded that the overpressures encountered are not
experimentally significant.
However, additional experimental data is required to ascertain the
validity of the assumption that the rate of carbon vaporization exceeds
the rate of vapor transport. It was accomplished by measuring the
carbon minimum melt pressure in both helium and argon. As discussed
earlier, the heat losses in helium are greater than in argon. In
addition, the diffusion coefficient for carbon diffusing in helium
is ~ 3.5 times greater than that in argon (see Appendix C) while
convective gas velocities are comparable in the two gases (Appendix
B). Therefore the transport of carbon vapor in helium greatly
exceeds that in argon. Clearly then, when laser power density is
sufficient (i.e. 80 KW/cm2
), confirmation that the carbon vapor
* Strickly speaking p should be the stagnation pressure as cal-culated from BernoU£li'sequation. However, at the low mass flow rates encountered in these experiments, the stagnation pressure is equal to the static pressure.
31

32
pressure is identical to the measured inert gas pressure can be made
only if the minimum melt pressure of carbon is the same in both of
these gases. Under these conditions, the triple point pressure of
carbon can be equated with the minimum melt pressure. If the observed
minimum melt pressure were not the triple point pressure, then a
higher pressure would be expected in helium since its high mass
diffusivity would reduce the actual partial pressure of carbon at the
surface. -- ----~ Experimentally it is found that the 1.0 mm diameter pyrolytic
graphite sample has an identical minimum melt pressure in both helium
and argon when the laser power density is adequate (80 KW/cm2). Thus,
it has been shown that the lOT ± 2 atmosphere (10.8 ± 0.2 MPa) minimum
melt pressure is the triple point pressure of carbon.
It is observed that melt for the 1.5 mm diameter sample in helium
is laser power limited, and the heat loses are too great to achieve
melt at 107 atmospheres. A pressure of 111 atmospheres is required
to melt the sample. At this higher pressure, the heat losses by
vaporization have decreased suffiCiently to overcame the greater
heat losses. of the larger sample.
The experimental data is not as clearly defined for Poco AXF-Ql
and Union Carbide SPK spectroscopic graphites. Both these poly
crystalline graphiteshave a considerably higher thermal conductivity
along the . sample rod axis and a higher emissivity then the pyrolytic
graphite samples used in this work. 35 Therefore the heat losses in
these samples are very large and greater laser power densities are
required to melt these samples at the triple point pressure. Higher
laser power was not available. At the maximum power denSity of
_ 80 KW/cm2, a 1.0 mm diameter sample of Poco AXF-Ql graphite required
130 (13.2 MBa) atmospheres of argon before melt could be achieved
and could not be melted at all in helium to pressures as high as
165 atmospheres (16.7 MFa). Union Carbide SPK Spectroscopic grade
graphite could not be melted in argon or helium to 165 atmospheres
(16.7 MFa). Thus at these laser powers, there is a delicate balance
of power input and output; and only with the proper thermal properties

of pyrolytic graphite could triple point data be obtained in these
experiments.
POlymorphs of Carbon. In the past several years, reports of a
number of new allotropes of carbon, produced by a variety of heating 36-43 techniques, have appeared in the literature. In order to assess
the role of these polymorphs of carbon in the present work, samples
of the recrystallized melt, vapor deposits, and graphite adjacent to
the melt were examined by both x-r~ and electron diffraction. No
evidence of carbon polymorphs were ever seen in the x-r~ diffraction
patterns of any of the samples regardless of origin or temperature
history. Extensive electron diffraction of the recrystallized melt
did, on three isolated occasions, reveal a partial pattern corres
ponding to the d-spacings of previously published polymorphs. How
ever, the d-spacings correlated only to mixtures of polymorphs and not
all spots were directly identifiable as belonging to any known poly
morph of carbon. Although a number of samples were extensively
examined, no other evidence of these new carbon polymorphs was obtained.
The limited non-graphite diffraction obtained makes it difficult to
identity the few extra patterns as polymorphs of carbon or as isolated
impurities. The lack of non-graphitic x-r~ diffraction and· limited
spurious electron diffraction indicates that polymorph formation in
these experiments, if present, is minor. There is no evidence, there
fore, that such polymorphs pl~ an important role in the melting of
carbon under the experimental conditions described in this paper.
33

34
VI. Conclusions
The results presented in this report place the triple point pressure
of carbon at 107 ± 2 atm (10.8 ± 0.2 MFa). This is in agreement with
previous high pressure investigations which located the triple point of
carbon between 100 and 120 atm (10 and 12 MFa). The precision of these
experiments and the attention paid to detail and previous uncertainties
have yielded results which tend to confirm that the preliminary low pres
sure carbon melt results of Whittaker et al. have been incorrectly inter-16 17 preted. '
The presence of an intense vapor plume prevented accurate and direct
temperature measurements at the carbon triple pOint. Extrapolations
of cooling curves to the instant the laser was turned off eliminated
the effects of this plume, but because the extrapolations were large
and the data variable , no reliable temperature measurements could be
obtained. The interfering effects of the plume encountered in these
experiments should serve as a caution to those attempting temperature
measurements in any laser heating experiments involving high vapori
zation rates.
The experiments presented in this report were performed to accurately
define the carbon triple point pressure and to address a number of uncer
tainties in the previous carbon melting investigations. For the first
time, accurate pressure measurements have been completed while at the
same time minimizing the pressure excursions experienced during heat-
ing. Laser heating was employed rather than the traditional resistive
heating, and these experiments represent the only time that data were
obtained to assure that the melt pressure was not limited by power input.
Finally, a set of systematic carbon melt experiments were completed in
both helium and argon and maximum mass loss rates were measured to con
firm the validity of the previously held assumption that the vapor
pressure of carbon at the sample surface was identical to the inert
gas pressure. The conclusion that must be drawn is that under equilib
rium conditions pressures equalling or exceeding 107 ± 2 atm must be
applied before carbon will melt.
Appendix A.
Previous Principle Investigations
Before 1939, a number of investigators44- 50 claimed to have produced
liquid carbon at atmospheric pressure. In particular, Lummer's observations44
of carbon arc electrodes in air led him to believe that he was seeing a
boiling melt at the surface of the carbon anode. Later experiments con
ducted by Steinle5l showed that this observation was characteristic of oxi
dation processes and was not present if the arc were operated in an inert
atmosphere. Flow patterns and droplet appearance in deposits of resistively
heated graphites also led several investigators to conclude that melt had
occurred at one atmosphere. Again, Steinle3 ,5l presented evidence to indi
cate that these observations were a result of vapor deposition and not car
bon melting.
Between 1934 and 1939, Bassettl ,2 was conducting carbon melting experi
ments at elevated inert gas pressures using resistive heating. B,y 1939
he had concluded from post-heating observations of the samples that the
triple point of carbon was 102 atmospheres (10.3 MPa) with a temperature
'" 200 K above the carbon arc temperature (Le. triple point temperature
'" 4000 K). One year later (1940) Steinle3 presented the results of a num
ber of experiments up to 180 atm (18 MPa) in both argon and nitrogen.
Post-heating visual examination of resistively heated samples argued that
a pressure of 100 atm (10 MFa) was required before carbon could be melted.
Using optical p,vrometric techniques at 0.65 ~m, the temperature of the melt
at 100 atm was found to be 3670 K. No increase in temperature with pressure
was observed. Both Bassett and Steinle found a definite sharpening of the
x-r~ diffraction pattern of the recrystallized melt over the original
material.
In 1958, Jones4 repeated the experiments of Bassett and Steinle and
found similar results. Again post-heating observations of the samples
showed a marked difference at '" 100 atm of argon pressure, and Jones
assigned this pressure to the triple point of carbon. Optical pyrometry
measurements at 0.65 ~m indicated that his unshielded carbon rod specimens
35.
36
melted at a brightness temperature of 3620 K with no detectable change in
temperature between 1 and 100 atm. Results from a carbon-shielded graphite
rod, drilled part way through to simulate black-body conditions, yielded a
temperature rise of 220 K when the pressure was raised from 1 to 100 atm.
The triple point temperature reported by Jones was 3840 K.
Noda studied the triple point of carbon initially using graphite
(1959)5 and later glassy carbon (1964).6 The triple point pressure was
found to be 110 atm (11 MBa) in both cases with the corresponding temper
atures being 4020 K (graphite) and 4000 K (glassy carbon). Very few details
of the experiments were presented, but it was reported that samples were
heated resistively in argon and that the x-ray diffraction pattern of the
resolidified melt was very similar to that of natural graphite crystals.
Between 1963 and 1968, Fateeva et al. 7- 9 conducted carbon melting
experiments to 60,000 atm (6000 MFa). In an argon atmosphere, resistively
melted carbon samples were monitored with 2 and 3 color pyrometers. Initial
results placed the melting temperature at 4650 K with no information about
triple point pressure being given. Later results placed the triple point
pressure at 100 atm (10 MFa) with a corresponding temperature of 4040 K.9
The earlier temperature measurements were labeled incorrect due to errors
in filter corrections.
In 1968, G. J. Schoesso~O conducted carbon melting experiments at
elevated helium pressures using resistive heating techniques. By applying
very high dc currents, Schoessow was able to heat samples large enough
for a black-body cavity to be drilled in the carbon rod perpendicular to
its axis. A disappearing filament pyrometer focused into this cavity was
used for temperature measurement. Because gas convection currents and
carbon vapor interfered with the measurements near the melt temperature,
Schoessow monitored power input at temperatures below where interference
was observed. By fitting power (p) and temperature to the equation
P = al
T4 + a2 T + a3
where T is the temperature in kelvins and al
, a2
,
and a3
are constants, Schoessow was able to estimate the temperature of the
melt from the measured power to each sample. This temperature measure
ment technique eliminates some but not all of the uncertainties. Although
the hole drilled in the carbon samples will increase emissivity, it is not

strictly a black-body cavity due to the presence of axial temperature
gradients. Also the form of the equation P = al
T4 + a2
T+a3
does not
specifically account for heat losses due to vaporization which are sig-
nificant at the high temperatures involved. Post-heating examination of
the samples was again used to confirm melt, and Schoessow reports a triple
point pressure of 103 atm (10.4 MBa). The corresponding temperatures
ranged from 4180 to 4300 K depending on the type of graphite melted. 11 In 1971, Diaconis et al. reported results of both radiant arc and
resistive heating of carbon samples in argon and nitrogen atmospheres.
The emission from the sample was rapidly scanned from 1.4 to 3.0 pm
and 2.5 - 4.4 ~m, and temperatures were calculated using the results at
8 to 21 separate wavelengths. Post-heating analysis of the samples was
the most extensive to data. Scanning electron micrographs and detailed
microstructure of the recrystallized melt were obtained for a large number
of samples. A loose, random orientation of graphite crystallites was
observed whenever melt was achieved. The triple point temperature was
found to range between 4100-4300 K depending on method of heating and
sample type (palycrystalline ATJ-S graphite or pyrolytic graphite).
These temperatures have been corrected for emissivity (e: = 0.7 for pyrolytic
graphite and e: = 0.89 for ATJ-S). However, there is some evidence that
polycrystalline graphite emissivities may be close to unity at the carbon
arc temperature (3806 K).21-22 The temperatures reported earlier in this
Appendix have been brightness temperatures not corrected for emissivity.
Diaconis et al. could not determine the triple point pressure with
the radiant arc heater because the plasma arc could not be operated with
sufficient power below 135 atm (137 MBa). From the results of experiments
using resistive heating techniques, they assign 102 atm (10.3 MPa) to the
triple point pressure, but no information is given about pressure measure
ment techniques nor the pressure rise experienced during their ~ to 3 min.
heating times. 12 In a very recent report, Gocken et al. present results of the melt-
ing of carbon with an HF chemical laser. Neon, argon, and krypton gases were
used to pressurize the system and carbon triple point values obtained were
120 atm (12 MPa) and 4130 K. Visual examination of the sample and micro-
37

38
structure analysis after heating were used to decide if melting had occurred
and a disappearing filament pyrometer used for temperature measurement.
Recently Whittaker and Nelson.lb reported the results of CO2 laser heated
graphite using spinning graphite rods. Temperatures were measured with a
fast response Irconpyrameter and sample heating monitored with high-speed
color photography. The collection of dimpled carbon spheres as well as the
observations of high-speed color films led these authors to conclude that
the triple point pressure of carbon was less than 0.25 atm (0.025 MFa). Later
work17 revealed a small cusp in the vapor pressure curve of carbon at 0.19 atm
(0.019 MFa) and 3780 K. Whittaker and Kintner17 attributed the presence of
this discontinuity to the triple point of carbon. These results, however,
are subject to alternate interpretation and conclusions. The results pre
sented in this report should dispel any fUrther belief that carbon melts
below 100 atm under equilibrium conditions.

Appendix B.
Relative Convective Heat Losses in Argon and Helium
The heat losses by free convection can be compared for both helium
and argon gases by standard methods. 52 The heat losses can be approximated
and compared in the two gases by approximating the vertical rod as a verti
cal plate and using the properties of the gases at a temperature intermediate
to ambient and the graphite normal sUblimation temperature. ,-- -.~- ---------- .
The Grashof number Grx for an ideal gas is then given as~2
Gr x Ii R2 T2
The Prandtl number Pr is52
Pr = \.I. Cp --' k
and the Nusselt number Nu is given by x
l 1 1 Nu
x 0.508 Pr2 (0.952 + Pr)'+ (Gr )4 x
where P is 8 the pressure (taken here to be 100 atm or 1.01 x 10 dyne/em)
g is the force of gravity
R is the ideal gas constant
MW is the molecular weight of the gas
To Too is the difference between ambient and maximum temperature (~ 4000 K)
T is the average temperature
k is the thermal conducitivity of the gases
\.I. is tre gas viscosity
Cp is the heat capacity at constant pressure
and x is the vertical distance from the heated portion of the sample.
39

40
Convective heat losses are then calculated from the film heat transfer
coefficient (h) which is given as
h = Nu k
x x
The specific heat flow (q) from the surface in each gas is then calculated
from
q = h (T - T ) o '"
If the properties of the gases at 2000 K are used, then the following
values are calculated for argon and helium:
Pr (Ar) = 0.610
Gr (Ar) 1.76 x 10⁶ (x3) x
Nu (Ar) 12.9 (x3/4) x
Pr (He) = 0.535
Gr (He) x
Nu (He) x
2.36 x 10⁴
(x3)
4.17 (x3/4)
For any vertical distance up the sample, the relative heat losses in
helium and argon are:
q fHej = q Ar
Nu x (He) k (He)
Nux (He) k (Ar)
= 2.91
Th · t· l' t .. by52 e max~mum convec ~ve ve oc~ y u ~s g~ven max
u max 0.766 (0.952 + Pr) 1 1
(T - T ~"X' ? o 00
T
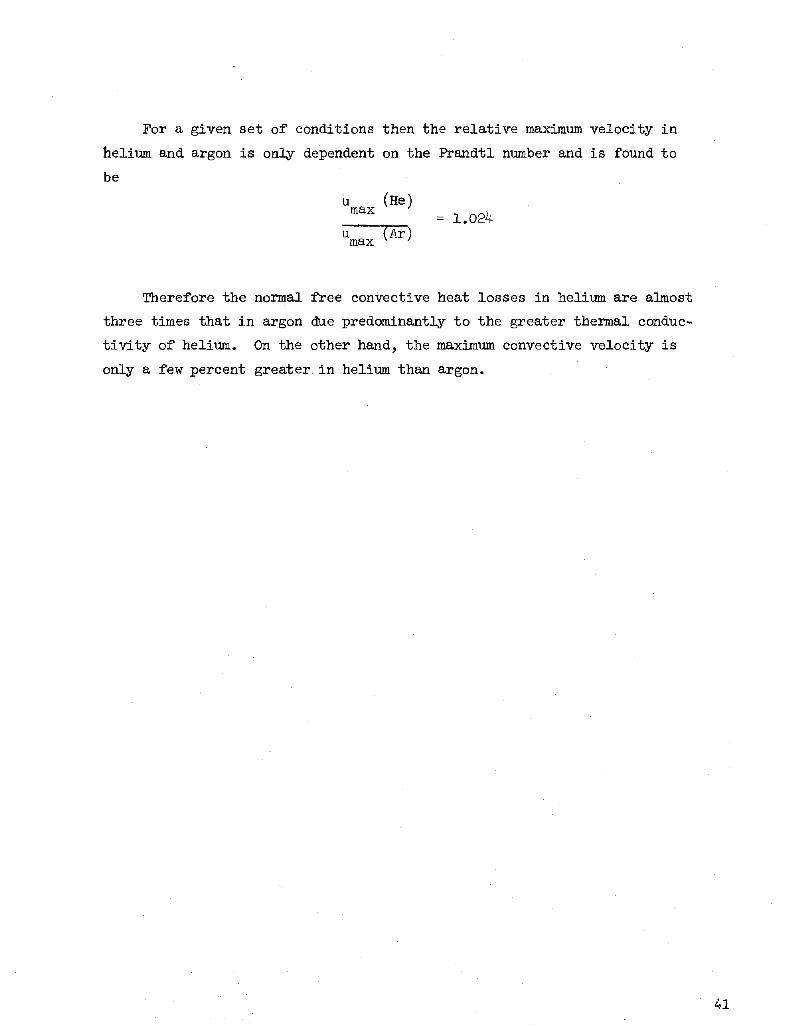
For a given set of conditions then the relative maximum velocity in
helium and argon is only dependent on the Prandtl number and is found to
be
u (He) max = 1.024 u (Ar) max
Therefore the normal free convective heat losses in helium are almost
three times that in argon due predominantly to the greater thermal conduc
tivity of helium. On the other hand, the maximum convective velocity is
only a few percent greater in helium than argon.
41
42
Appendix C.
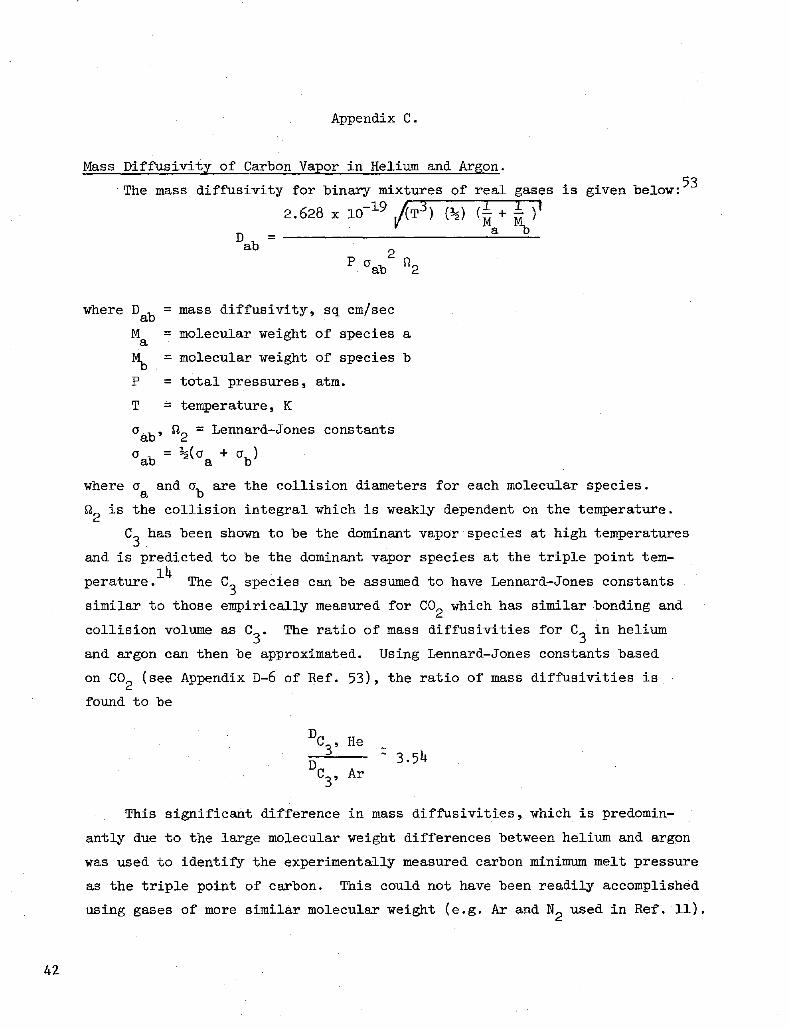
Mass Diffusivity of Carbon Vapor in Helium and Argon.
where
The mass diffusivity for binary mixtures of
2.628 x 10⁻¹⁹ ';T3) (~) real gases (1 + 1 )1
Ma ~ Dab = ------------------------~--~
2 p oab Q2
Dab = mass diffusivity, sq cm/sec
M = molecular weight of species a
~ = molecular weight of species
p = total pressures, atm.
T = temperature, K
oab' Q2 = Lennard-Jones constants
°ab = ~(oa + ob)
a
b
is given below: 53
where oa and ob are the collision diameters for each molecular species.
Q2
is the collision integral which is weakly dependent on the temperature.
C3
has been shown to be the dominant vapcr·species at high temperatures
and is predicted to be the dominant vapor species at the triple point tem-14 perature. The C
3 species can be assumed to have Lennard-Jones constants
similar to those empirically measured for CO2 which has similar bonding and
collision volume as C3
• The ratio of mass diffusivities for C3
in helium
and argon can then be approximated. Using Lennard-Jones constants based
on CO2 (see Appendix D-6 of Ref. 53), the ratio of mass diffusivities is
found to be
This significant difference in mass diffusivities, which is predomin
antly due to the large molecular weight differences between helium and argon
was used to identifY the experimentally measured carbon minimum melt pressure
as the triple point of carbon. This could not have been readily accomplished
using gases of more similar molecular weight (e.g. Ar and N2 used in Ref. 11).
For example, the mass diffusivity ratio of C3
in Ar and N2 is close to
unity:
43

44
(1)
(4)
(6)
( 8)
(10)
(11)
References
J. Basset, "The Fusion of Graphite Under a Very High Pressure of Argon up to 4000 Kg/cm2 ," Comptes Rendus 208, 267 (1939).
J. Basset, "Fusion of Graphite Under Argon Pressure of from 1-11,500 Kg/cm2 : Determination of the Triple Point and Construction of a Provisional ECluilibrium Diagram of Carbon. Part 1," J. Phys. Radium 10, 217 (1939).
H. Steinle, "Melting Experiments on Carbon," Z. Angenandte Mineralogie £, 344 (1940).
M. T. Jones, "The Phase Diagram of Carbon," Report PRC-3, National Carbon Research Laboratories, Jan. 28, 1958.
T. Noda, "Melting of Carbon and Crystallinity of Molten Carbon," referred to in article by Hi Mii in "High Temperature Research in Japan," Proc. of the International Symposium on High Temperature Technology, Asilomar, California 1959, p. 431.
T. Noda and M. Inagaki, "The Melting of Glassy Carbon," Bull. Chem. Soc. Japan 37, 1710 (1964).
N. S. Fateeva, L. F. Vereshchagin, and V. S. Kolotygin, "Optical Method for Determining the Melting Point of Graphite as a Function of Pressure to 3000 Atmospheres," Society Physics-Doklady 8, 893 (1964).
N. S. Fateeva, L. F. Vereshchagin, and V. S. Kolotygin, "Optical Method for Determining Melting Points of Graphite as a Function of Pressure up to 40,000 Atmospheres," Soviety Physics-Dok1ady ,§., 904 (1964).
L. F. Vershchagin and N. S. Fateeva, "Melting Curves of Graphite, Tungsten, and Platinum up to 60 Kilobars," Soviety Physics JETP 28, 597 (1969). -
G. J. Schoessow, "Graphite Triple Point and Solidus-Liguidus Interface Experimentally Determined uJ? to 1000 Atmospheres," NASA Contractor Report, NASA CR-1148 (1968)t a ); and Phys. Rev. Lett. 21, 738 (1968)(b).
N. S. Dianconis, E. R. Stover, J. Hook, and G. J. Catalano, "Graphite Melting Behavior," AFML-TR-71-119, July 1971.
(12) N. A. Gokcen, E. T. Chang, T. M. Poston, and D. J. Spencer, "Determination of Graphi te-LiCluid-Vapor Triple Point by Laser Heating," Interim Report, SAMSO-TR-76-29, January 30, 1976.
(13) H. Palmer and M. Shelef, "Vaporization of Carbon," in Chemistry and Physics of Carbon, Vol. ~, P. L. Walker, Editor, Dekker, New York (1968).
(14) H. R. Leider, O. H. Krikorian, and D. A. Young, "Thermodynamic Properties of Carbon up to the Critical Point," Carbon 11, 555 (1973).
(15) JANAF Thermochemical Tables, Thermal Research Laboratory, Dow Chemical Co., Midland, Mich. 1960-1961, and JANAF Thermochemical Tables First Addendum, Clearinghouse for Federal Scientific and Technical Information, Washington, D.C., Aug. 1966.
(16) A. G. Whittaker and L. S. Nelson, "Measurement of Carbon Vapor Pressure and Formation of Liquid Carbon at Low Pressure by Laser Heating," Presented at the 11th Biennial Conf. on Carbon, Gatlinburg, TN, June 4-8, 1973.
(17) A. G. Whittaker and P. L. Kintner, "Carbon Solid-Liquid-Vapor Triple Point and the Behavior of Superheated Liquid Carbon," Presented at the 12th Biennial Conf. on Carbon, Pittsburgh, PA, July 28-Aug. 1, 1975.
(18) F. P. Bundy, "Melting of Graphite at Very High Pressure," J. Chern. Phys. 38, 618 (1963).
(19) Stress-annealed pyrolytic graphite was obtained from R. Bacon of Union Carbide, Parma, Ohio. X-ray powder diffraction patterns were obtained on this material at Sandia Laboratories by G. T. Gay.
(20) J . L. Margrave, "Graphite Thermodynamics," unpublished work.
(21) K. Schurer, "The Spectral Emissivity of the Anode of a Carbon Arc," Appl. Opt. ~, 461 (1968).
(22) M. R. Null and W. W. Lazier, "Measurement of Reflectance and Emissivity of Graphite at Arc Temperature with a Carbon Arc Image Furnace," J. Appl. Phys. 29, 1605 (1958).
(23) J. Euler, Ann. Physik Ser. 6 11, 203 (1953).
(24) J. Abrahamson, "Graphite Sublimation Temperatures, Carbon Arcs and Crystallite Erosion," Carbon 12, 111 (1974).
(25) R. C. Lincoln and R. C. Heckman, "Negative Pulse Thermal Diffusivity Measurements of ATJ-S Graphite to 3500 K," High Temp-High Press. 1, 71 (1975) .
(26) J. F. Ready, Effects of High-Power Laser Radiation, Academic Press, New York (1971).
(27) D. L. Franzen, "Continuous Laser-Sustained Plasmas, "J. Appl. Phys. 44, 1727 (1973).
(28) D. L. Franzen, "cw Gas Breakdown in Argon Using 10.6 ).1m Laser Radiation," Appl. Phys. Lett. 21, 62 (1972).
45

46
(29) D. C. Smith and M. C. Fowler, "Ignition and Maintenance of a cw Plasma in Atmospheric Pressure Air with CO
2 Laser Radiation," Appl. Phys. Lett.
22, 500 (1973).
(30) D. C. Smith andR. T. Brown, "Aerosol-Induced Air Breakdown with CO2 Laser Radiation," J. Appl. Phys. 46, 1146 (1975).
(31) N. S. Razor andJ. D. McClelland, "Thermal Properties of Graphite, Molybdenum and Tantalum to Their Destructive Temperatures," J. Phys. Chem. Solids 15, 17 (1960).
(32) A. E. Sheindlin, 1. S. Belevich, and 1. G. Kozhevikov, "Entha1phy and Specific Heat of Graphite in the Temperature Range 273-3650 K," Teplofiz. Vys. Temp. 10, 997 (1972).
(33) D. M. Haaland, "Anistropy of Emittance of' Pyrolytic Graphite at 10.6 pm," Carbon 12, 633 (1974).
(34) J. H. Lundell and R. R. Dickey, "Vaporization of Graphite in the Temperature Range of' 40000 to 4500oK," AIM Paper 76-166, Jan. 1976.
(35) Y. S. Touloukian and D. P. DeWitt, Thermophysica1 Properties of Matter, Vol. 8, p. 31, IFI/Plenium New York, N.Y. 1972.
(36) A. El Goresy and G. Donnay, "A New Allotropic Form of Carbon from the Ries Crater," Science 161, 363 (1968).
(37) A. G. Whittaker and P. L. Kintner, "Carbon: Observations on the New Allotropic Form, "Science 165, 589 (1969).
(38) G. P. Vdovykin, "A New Hexagonal Modification of Carbon in Meteorites," Geokhimiya~, 1146 (1969).
(39) A. G. Whittaker and G. M. Wo1ten, "Carbon: A Suggested New Hexagonal Crystal Form," Science 178, 54 (1972).
(40) L. S. Nelson, A. G. Whittaker, B. Tooper, "The Formation of' New Polymorphs . of Carbon and Fluid Flow Patterns by Irradiating Solid Carbons wi th a CO
2 Laser," High Temp. Sci. .!±.' 445 (1972).
(41) v. I. Kasatochkin, M. E. Kazakov, V. V. Savranskii, A. P. Nabatnikov, and N. P. Radimov, "Synthesis of a New Allotropic Form of Carbon from Graphite," Dokl. Akad. Nauk SSSR 201, 1104 (1971).
(42) V. I. Kasatochkin, V. V. Korshak, Y. P. Kudryavtsev, A. M. Sladkov, and I. E. Sterenberg, "On Crystalline Structure of' Carbyne," Carbon 11, 70 (1973).
(43) V. I. Kasatochkin, V. V. Savranskiy, B. N. Smirnov, V. M. Mel' nichenko , "Study of the Carbyne Condensed from Carbon Vapors," Dokl. Akad, Nauk SSSR 217, 796 (1974).

(44)
(45)
(46)
(47)
(48)
(49 )
O. LUllIIIler , "Melting Carbon and Production of Solar Temperatures," Viewey and Sohn, Braunschweig, p. 6, 1914.
" S. Munch, "Liquefaction of Carbon," Z. Elektrochem. 27, 367 (1921).
E. Ryschkewitsch, "The Liquefaction of Carbon," Z. Elektrochem. 27, 445 (1921).
A. Thiel and F. Ritter, "Does Carbon Melt in the Heat of an Electric Arc," Z. Anorg. Chem. 132,153 (1923).
A. Hagenbach and W. P. LuthY, "Experiments to Determine the Melting Point of Carbon," Naturwissenschaften 12, 1183 (1924).
H. Alterthuni, "New Investigations of Carbon Melting and Vaporization," Z. Tech. Phys. ~, 540 (1925).
H. Altherthum, W. Fehse, and M. Pirani, "Determination of the Melting Point of Carbon," Z. Elektrochem. 31, 313 (1925).
H. Steinle, "LUllIIIler Phenomena at Carbon Arc and Anode Crater Temperature," Z. Angew., Mineralogie £, 28 (1939).
E. R. G. Eckert and R. M. Drake, Jr., Heat and Mass Transfer, McGrawHill Book Co., Inc. New York, N.Y. 1959.
A. S. Faust, L. A. Wenzel, C. W. Clump, L. Mans, L. B. Andersen, Principles of Unit Operations, John Wiley & Sons, Inc., New York, 1960.
47

48
ACKNOWLEDGMENTS
The author would like to acknowledge the very
valuable assistance of J. M. Freese in the construction
of the apparatus, the acquisition of experimental data,
and for completing post-heating sample analyses. The
design of the pressure vessel by L. P. Baudoin and C. J.
Greenholt was vital to the success of these experiments.
In addition, the following Sandia personnel gave analytical
support to this project: R. B. Foster provided several
Ircon pyrometer calibrations; G. T. Gay obtained all
x-ray diffraction patterns; C. R. Hills conducted the
electron diffraction of the samples; and J. F. Wolcott
completed the emission spectroscopy for determining
impurity levels in the pyrolytic graphite samples used.

DISTRIBUTION:
Pref. Jehn Abrahamsen Chemical Engineering Dept. University ef Canterbury Christchurch, New Zealand
Dr. Nev Gecken Chemistry and Physics Laberatory The Aerespace Carp. El Segundo., CA 90345
Praf. Haward Palmer Department af Fuel Science Pennsylvania State University University Park, PA 16802
1333 S. McAlees, Jr. Attn: I. Auerbach
D. D. McBride 5000 A. Narath
Attn: J. K. Galt - 5100 E. H. Beckner - 5200 A. W. Snyder - 5400 J. H. Scatt - 5700
5443 L. S. Nelsan 5800 R. S. Claassen
Attn: R. G. Kepler - 5810 M. J. Davis - 5830
R. L. R. W. A. W. J. M. D. M. C. A. E. A.
D. M. Schuster - 5840 Schwaebel Lynch Mullendore Freese Haaland (10) Pepmue11er (Actg.) Aas (2)
Dr. Reger Bacen Unien Carbide Cerp. Parma Technical Center Cleveland, Ohio. 44130
Pref. John L. Margrave Department of Chemistry Rice University Haustan, TX 77001
Dr. A. Greenville Whittaker Aeraspace Carp. El Segundo., CA 90245
5820 5824 5825 5825 5825 3141 8266 3151 W. L. Garner far ERDA/TIC (Unlimited Release) (3)
ERDA/TIC (25) (R. P. Campbell, 3171-1)
49


